Abstract
This study focuses on the numerical modeling of one-dimensional consolidation of filtered copper tailings under saturated and unsaturated conditions using Plaxis2D®. The modeling is based on 1D consolidation curves under saturated conditions and controlled matric suction. The Soft Soil and Hardening Soil constitutive models were employed, incorporating the soil–water characteristic curve (SWCC) to capture hydro-mechanical behavior and volumetric strain. The modeling strategy replicates the loading and drainage conditions of the experimental tests, using a single set of soil parameters to represent the transition from unsaturated to saturated conditions. Axisymmetric simulations were conducted to replicate the geometry of the experimental specimen, considering initial saturation degrees of 60%, 80%, and 99%, followed by the application of vertical stresses ranging from 10 to 3200 kPa. The results demonstrate that the proposed modeling approach accurately represents the compressibility curve for both constitutive models across different saturation levels. This provides flexibility for conducting numerical analyses tailored to specific soil conditions and geotechnical design requirements. Furthermore, modeling allowed for the evaluation of excess pore pressures and their dissipation time under both saturated and unsaturated conditions.
1. Introduction
The evaluation of one-dimensional (1D) consolidation is a common process in geotechnical engineering, especially in the design of foundations and structures on soft and highly compressible soils. One-dimensional consolidation involves the dissipation of excess pore pressures under sustained loads and, consequently, the compressibility of the soil over time [1]. In saturated conditions, excess pore pressures in soil voids respond directly to the increase in load. In contrast, in unsaturated soils, the reduction in matric suction and water retention in the soil pores play a significant role [2]. This has been widely demonstrated experimentally through 1D consolidation tests and isotropic consolidations [3,4,5,6], as well as in numerical modeling to represent the transition from the unsaturated to the saturated condition [7].
In this context, constitutive models are crucial for accurately representing soil’s stress–strain relationship and hydromechanical behavior under different saturation conditions and loading types [8,9]. The Soft Soil and Hardening Soil models are widely used in numerical analyses because they represent soil plasticity and stiffness, enabling the study of settlements and deformations in soft soils [10,11,12]. This research evaluates both models and uses them to replicate the experimental behavior of a filtered copper tailings material subjected to one-dimensional consolidation under saturated and unsaturated conditions using Plaxis2D® software, 2024 version.
The experimental data used to calibrate the models in this study were derived from an experimental oedometer test conducted under saturated and unsaturated conditions by Gallardo et al. [13]. They tested tailings extracted from a copper sulfide processing plant in northern Chile, classified as low-plasticity silt according to the Unified Soil Classification System (USCS) [14], with a specific gravity of 2.97 and an initial degree of saturation of 60%. This study revealed significant changes in the solid skeleton and pore water pressure, which allowed us, through modeling, the analysis of pore pressure, deformation, and water flow under saturated and unsaturated conditions.
We calibrated both constitutive models for saturated and unsaturated conditions using a single set of parameters. This evaluated the transition from the unsaturated to the saturated condition, considering the soil–water characteristic curve (SWCC). The consolidation test was simulated by applying vertical stresses ranging from 10 to 3200 kPa, including unloading phases. For each applied stress, pore pressure dissipation was considered until it reached a value of 0.1 kPa. For the unsaturated condition, initial degrees of saturation of 60% (water content of 16% according the material recovered from the filtration plant), 80%, and 99% were considered, replicating laboratory conditions using an axisymmetric model. The SWCC was used to analyze the hydromechanical behavior of the unsaturated condition, relating water content to matric suction. Additionally, the applicability of both models was validated for different saturation degrees, and initial suctions ranged from 0 to 50 kPa.
This research demonstrated that the Soft Soil and Hardening Soil numerical constitutive models accurately represented soil behavior under various conditions. A higher degree of saturation in unsaturated soils increased compressibility and pore pressure, approaching saturated behavior and generating more significant deformations. It was shown that higher initial suction reduces the soil’s water retention capacity, affecting its mechanical and hydraulic behavior. In saturated soils, the void ratio decreased by up to 52% compared to its initial value under a load of 3200 kPa. In unsaturated soils, a higher initial saturation resulted in more significant deformations, with differences of up to 11% between soils with 60% and 80% saturation. Pore pressure dissipation was faster in the Hardening Soil models, particularly under stresses exceeding 400 kPa. In unsaturated soils, the level of matric suction caused less uniform water pore pressure dissipation, with differences of up to 21% in the Soft Soil models compared to experimental values. As vertical stress increased, effective saturation rose, and suction decreased, achieving full saturation in soils with initial saturation of 80% and 99% earlier than in those with 60%. Saturated soils exhibited uniform dissipation behavior, while unsaturated soils showed different behavior due to matric suction.
In summary, the Soft Soil and Hardening Soil constitutive models, in both saturated and unsaturated conditions, effectively simulate the reduction in the void ratio under a given load magnitude. However, discrepancies arise in the recovery of the void ratio between the experimental and numerical models during the unloading phase. These differences are due to the Soft Soil model prioritizing plastic compression, which limits expansion after unloading, whereas the Hardening Soil model adjusts stiffness with the load, allowing for greater volumetric recovery [10,15,16].
The importance of the results lies in providing a basis for understanding and modeling the hydromechanical behavior of compressible soils under variable saturation conditions. However, there are limitations due to the variability in pore pressure dissipation, which is influenced by the boundary conditions imposed in the numerical model. In real scenarios, the variability of soil permeability and drainage conditions can lead to responses that are different from those simulated. Additionally, the high variability in the soil–water characteristic curve (SWCC) adjustment and its dependence on loading history can introduce uncertainty in predicting soil behavior.
While this study represents a useful first step for 2D simulations, transitioning to 3D models may require additional parameter adjustments to better capture three-dimensional effects, especially under complex loading conditions.
Finally, is important to highlight that the methodology proposed in this study allows for a better understanding of the effects of saturation on soil consolidation, providing a foundation for selecting an appropriate constitutive model based on soil characteristics and saturation degree.
2. Methodology
In the case of unsaturated conditions, the soil’s porous spaces contain both water and air, which is normal for soils above the water table. In this situation, capillarity and matric suction play a crucial role. Capillarity allows water to rise through the soil pores, while matric suction retains water within the pores [17].
The experimental foundation of this research was based on the results of Gallardo et al. [13], who conducted oedometer tests under saturated and unsaturated conditions. In the experimental test, the one-dimensional deformation of the soil under constant vertical stress increments provided essential data on compressibility and consolidation rate in both conditions. The load was applied to record the corresponding deformations at each increment, allowing maximum detail with the settlement data obtained over time.
The constitutive models used aim to replicate the actual behavior of the material under different conditions to match the experimental response [15]. Maintaining a single set of constant parameters reduces errors or biases, increasing the model’s credibility and prediction confidence. It is well known that discrepancies between experimental and modeling results are more often attributed to model assumptions or boundary conditions than parametric inconsistencies [18].
Table 1 presents the soil sample parameters used in numerical modeling with Plaxis2® for both models. These parameters are the same as those used in the work of Gallardo et al. [13].

Table 1.
Soil parameters used in both constitutive models.
According to the Plaxis2D® manuals [12,15], the Soft Soil model is suitable for simulating primary compressibility and long-term consolidation effects, capturing high plasticity and time-dependent deformation. In contrast, the Hardening Soil model provides a more detailed representation of nonlinear stiffness and soil hardening, providing a more comprehensive analysis under different loading and drainage conditions. These models effectively represent the experimental results observed in the oedometer test under saturated and unsaturated conditions. Figure 1 shows the number of executed models (6) and their saturation conditions to analyze the simulation results of a one-dimensional consolidation test.
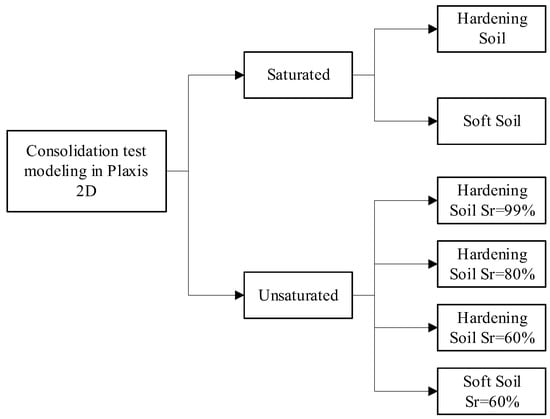
Figure 1.
Modeling diagram.
Two models were created for the saturated condition and four for the unsaturated condition. For the latter, two models were set with an initial saturation of 60% and two more with initial saturation of 80% and 99% to compare the behavior and variation in results based on the degree of saturation. The modeling in Plaxis2D® was performed using an axisymmetric representation of the soil to simulate the specimen with a vertical symmetric axis. This two-dimensional representation, shown in Figure 2, was transformed into a three-dimensional model by rotating the section around its symmetry axis. This approach allows for an efficient soil and structural behavior analysis, avoiding needing a full three-dimensional model, which could be more computationally demanding [19,20].
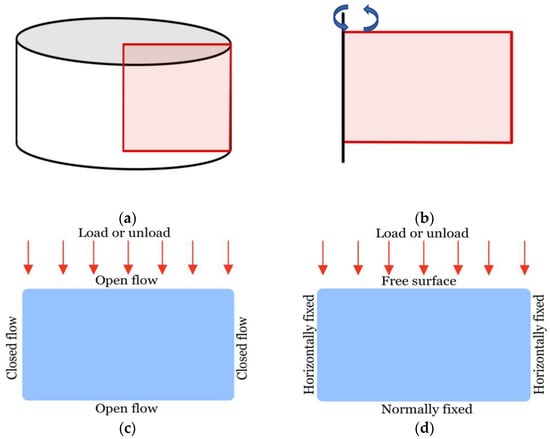
Figure 2.
(a) Cylindrical laboratory specimen. (b) Applied asymmetry. (c) Hydraulic boundary conditions. (d) Displacement boundary conditions.
It is well known that the displacement boundary conditions established during the oedometer test cause the soil to experience deformations only along its vertical axis (one-dimensional consolidation) when a load is applied. This occurs because pore water can only drain through the top and bottom faces of the sample, facilitated by the porous stones used in the test, which promote flow in these directions [1]. These porous stones were modeled using an “OPEN” flow boundary condition on the upper and lower surfaces of the numerical model. These experimental test conditions were replicated in Plaxis2D®, as shown in Figure 2c,d, for both saturated and unsaturated conditions. This ensures that the numerical simulation accurately reflects the hydraulic and mechanical behavior observed in the experimental tests, ensuring precision in the analysis of controlled consolidation scenarios.
For the soil representation in Plaxis2D®, a soil sample with dimensions of 35 cm in height and 50 cm in diameter was modeled, subjected to gradual loading. These dimensions were chosen due to the same D/H ratio as the laboratory specimen, which has a diameter of 6.3 cm and a height of 2.2 cm.
On the other hand, Figure 3 and Table 2 illustrate the logical process to identify each curve analyzed to represent excess and dissipation of pore pressures. The pore pressure dissipation behavior was examined at four height ratios of the soil. As mentioned earlier, this is soil that drains water through its upper and lower boundaries (double drainage), so the drainage distance from the middle of the soil is equal in both upward and downward directions [1].
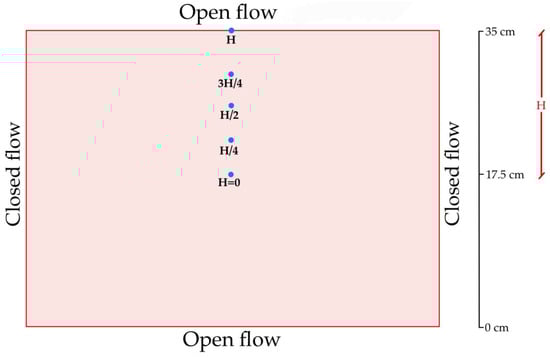
Figure 3.
Analysis control points.
Table 2.
Curve matrix for height ratios.
Figure 3 shows how the model’s upper half was analyzed, with H representing the surface and H = 0 indicating the deepest point analyzed.
For unsaturated soils, key concepts were used to understand the mechanical and hydraulic behavior of the soil, such as matric suction and effective saturation. Matric suction is the difference between air pressure and water pressure within the soil pores. This property is linked to the degree of saturation through the soil–water characteristic curve (SWCC). Effective saturation represents the fraction of water retained in the soil that influences effective stress [21,22], as shown below:
Seff is the effective saturation, Sr (ψ) is the degree of saturation as a suction function, Sres is the residual saturation, and Ssat is the total saturation. Calculating effective water pressure using effective saturation and the total water pressure is possible.
where pactive is the pore pressure acting on the soil skeleton, and pw is the water pore pressure. Plaxis2® calculates the soil’s effective stress through the contribution of water pressure and suction based on the degree of saturation.
To analyze the flow behavior in terms of the SWCC, Plaxis® describes the evolution of water pressure as a function of the suction level using the adjustment parameters and present in Equation (4). This allows representing the evolution of water pressure under the following equation:
On the other hand, soil permeability decreases as the level of matric suction increases. In other words, it affects the soil’s ability to allow water flow. The equation that models this condition is as follows:
It is well known that relative permeability decreases as water content or effective saturation decreases since suction increases and retains more water in the soil pores [23].
2.1. Constitutive Models Used
2.1.1. Soft Soil
The Soft Soil constitutive model in Plaxis2D® was designed to describe the mechanical behavior of soft and highly compressible soils, such as clays and silts. This model is widely used in geotechnical engineering because it can accurately reproduce consolidation effects, time-dependent deformation, and plasticity in cohesive soils subjected to long-term loading [10]. It utilizes the compressibility slopes (λ) and recompression slopes (κ) in the following equation:
where εv is the volumetric strain, and p’ is the mean effective stress. This relationship can be obtained from an isotropic compression test, as shown in Figure 4 (adapted from [15]). The parameter λ* determines the soil’s compressibility during primary loading, while κ∗ determines the compressibility during unloading and subsequent reloading.
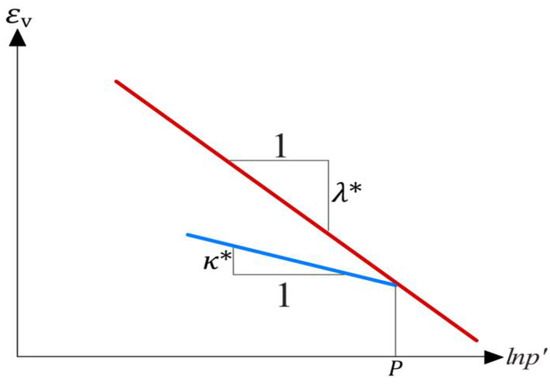
Figure 4.
Relationship between volumetric strain and principal stress.
These parameters can also be calculated using the one-dimensional compression and swelling parameters, Cc and Cs, obtained from the one-dimensional consolidation test by relating to the void ratio and the applied principal stress. The relationships are shown in Equations (7) and (8).
2.1.2. Hardening Soil
The Hardening Soil constitutive model represents stiff and soft soils’ nonlinear and elastoplastic behavior under complex loading conditions, such as time-varying loads, non-uniform loads, and soil-structure interactions [10]. This model incorporated stress and strain hardening concepts, providing a more realistic description of soil behavior than simpler models like Mohr–Coulomb.
The parameters governing the modeling are as follows:
- (i)
- Stress-dependent stiffness, parameter m;
- (ii)
- Plastic strain due to primary deviatoric loading, parameter ;
- (iii)
- Plastic strain due to primary compression, parameter ;
- (iv)
- Elastic loading/unloading, parameter
These parameters can be measured from triaxial and oedometer tests. Figure 5a defines the modules Eurref and E50ref for an effective principal stress of σ’3 = −pref. The latter corresponds to the secant stiffness at 50% of the maximum deviatoric stress at a cell pressure equal to the reference stress pref. Figure 5b (adapted from [15]) defines Eoedref as the tangent stiffness at a vertical stress of −ε1 = pref.
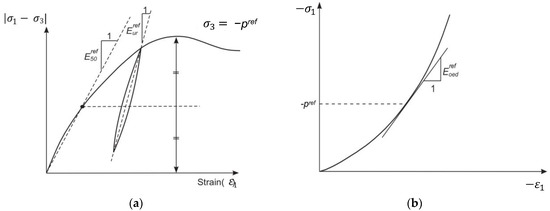
Figure 5.
(a) Definition of Eurref and E50ref for triaxial test results. (b) Definition of Eoedref for oedometer test results.
For the special case of soft soils, there are simplified equations between the modified compression and swelling indices and the moduli , , and as shown in Equations (9)–(11).
Finally, the input parameters for the Hardening Soil model are as follows:
- Secant stiffness ();
- Tangent stiffness ();
- Loading/unloading stiffness ();
- Power for stress-level dependency of stiffness (m);
- Poisson’s ratio for loading/unloading (v’ur);
- Reference stress for stiffnesses (pref);
- Lateral earth pressure coefficient for normally consolidated soils (K0nc);
- Failure ratio (Rf).
On the other hand, Table 3 shows the parameters obtained that allow for a better fit to represent the experimental results for both saturated and unsaturated conditions. Calibration using a single set of parameters for both models ensures consistency. It simplifies the simulation process by avoiding discrepancies when using different parameters set under similar conditions. For the unsaturated condition, the soil–water characteristic curve (SWCC) plays a crucial role in determining the matric suction level based on the degree of saturation, facilitating a more accurate characterization of the material’s hydromechanical behavior.
Table 3.
Input parameters for Soft Soil and Hardening Soil models.
Table 4 represents the matrix of the executed models, identifying all the curves extracted from Plaxis2D®. The format used for identification includes the corresponding constitutive model (SS or HS), saturated or unsaturated condition, and the applied stress. For example, it is used as follows: SS/HS_Sat/Sr%_Applied Stress.
Table 4.
Model matrix.
To validate and initialize the numerical model in terms of matric suction, the following iterative procedure was used:
- i.
- The experimental SWCC was calibrated based on the nomenclature proposed in Plaxis® for Van Genuchten.
- ii.
- Using the initial degree of saturation for each model in the unsaturated condition, the SWCC was intersected to determine the matric suction level.
- iii.
- The soil was defined in Plaxis® as unsaturated, and the same degree of saturation defined in step (i) was incorporated.
- iv.
- The model was initialized in Plaxis® in terms of effective saturation, to verify whether it matches the matric suction magnitude obtained from the Van Genuchten model in Plaxis® in step (ii).
- v.
- If the matric suction level determined in step (iv) corresponds to the one obtained in step (ii), the model is correctly set in terms of degree of saturation and matric suction level. Otherwise, the SWCC adjustment parameters proposed in Plaxis® must be recalibrated.
This validation and initialization approach was the same as that used by [24].
3. Results and Discussion
3.1. Soil–Water Characteristic Curve (SWCC)
The partially saturated condition is represented based on the SWCC. This curve describes the relationship between the soil’s water content and matric suction, which is the energy required to extract water from the soil [25,26]. Figure 6 shows the experimental curve used in this research, which enabled the analysis of unsaturated soils. This curve was taken from the work of Gallardo et al. [13,27] (blue squares) and the Van Genuchten model [28], used by Plaxis2D®, and it was fitted according to the following equation:
where Sr is the degree of saturation, Sres is the residual saturation, Ssat represents the degree of saturation at which the pores remain filled with water, and ga and gn are fitting parameters that relate to the air entry value and the rate at which water is being extracted from the soil [29,30].
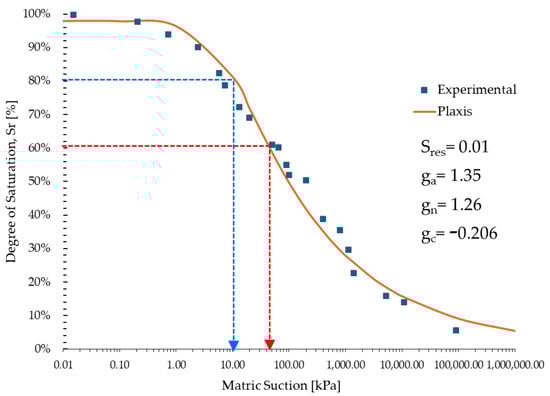
Figure 6.
Experimental and fitted SWCC with suction obtained for each degree of saturation.
This equation describes the variation in the degree of saturation as a function of suction, modeling the soil’s behavior in terms of water retention under different moisture levels. However, in partially saturated soils, not all suction directly impacts effective stress [21]. To address this difference, the concept of effective saturation is incorporated, representing the portion of water retained in the soil that affects effective stress [22].
The calibration process of the SWCC for its use in the numerical model was as follows:
- i.
- The Van Genuchten Equation (9) was plotted by varying the fitting parameters (ga, gn, and gc) until achieving the best possible match with the experimental curve.
- ii.
- Using the initial degrees of saturation for each unsaturated model, the corresponding matric suction was extracted based on the experimental curve and Plaxis®.
- iii.
- Matric suction values from the experimental model and the program were compared to achieve the smallest possible variation.
- iv.
- The fitting parameters were input into each numerical model before execution.
- v.
- The modeling results in terms of initial saturation and matric suction were consistent and within the ranges of the experimental method.
Table 5 shows how the degree of saturation increases due to volumetric deformations as the applied stress varies.
Table 5.
Evolution of saturation and effective suction in relation to the applied stress.
3.2. Compressibility Curve
The results will be presented in two stages. The first stage will cover the models under saturated conditions, including the HS_99% model. The second stage will analyze the unsaturated models, corresponding to HS_60% and HS_80%.
It is observed that the suction obtained from Plaxis2D® shows a good fit with the curve in Figure 7, which was constructed based on the experimental model. This indicates that the numerical models can accurately represent the soil’s ability to retain water. For the HS_99% model, expected values for fully saturated soil [31] are obtained, reaching full saturation at 10 kPa and remaining so up to 3200 kPa, implying a value of 0 kPa throughout the entire effective suction load range.
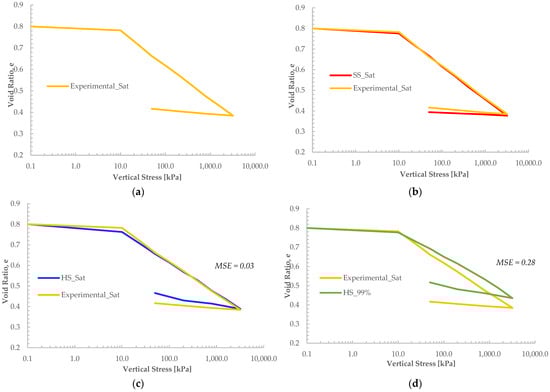
Figure 7.
Compressibility curve for saturated models: (a) Experimental model. (b) Experimental and Soft Soil. (c) Experimental and Hardening Soil. (d) Experimental and HS = 99%.
For all other cases shown in Table 5, the effective saturation remains similar to its initial degree of saturation when the first stress of 10 kPa is applied. As the vertical load increases, the effective saturation progressively rises, reaching 100% at 400, 800, and 1000 kPa for the HS_60%, SS_60%, and HS_80% cases, respectively. From these points onward, saturation remains constant.
This behavior reflects the reduction in suction due to the compaction effect. At these moments, suction approaches values close to zero matric suction, indicating that the negative pore pressure decreases due to the reduction in air-filled voids and their replacement by water [32,33,34].
3.2.1. Saturated Condition
Figure 7a shows the compressibility curve of the tailings sample subjected to an oedometer test. It reveals a progressive decrease in the void ratio as the vertical load increases, indicating that the soil compresses under load.
Up to 10 kPa, the void ratio reduction reaches e = 0.78, corresponding to a 2% decrease relative to its initial void ratio. From 10 kPa onward, a significant change in the curve’s slope is observed, reflecting increased soil compressibility. At the end of the final load application (3200 kPa), the void ratio reaches e = 0.38, corresponding to a 52% decrease from e0. During the unloading phase, the void ratio recovers to a maximum of e = 0.41 at 50 kPa.
Figure 7b,c illustrate how both constitutive models behave similarly throughout most of the load range, suggesting that the models may be suitable for representing the actual behavior of the soil under the specified conditions [35]. The SS_Sat model shows a void ratio reduction similar to the experimental model across the load range, with only an average deviation of 0.01%. The most significant discrepancies occur at the beginning and end of the virgin compression phase, where the Soft Soil model shows a 1% reduction compared to the experimental model.
On the other hand, the Hardening Soil model exhibits a noticeable void ratio reduction at the end of its recompression phase compared to the experimental curve (Figure 7c), corresponding to a 3% difference. Among the saturated models, Soft Soil and Hardening Soil align at only one point in their void ratio within the load range, occurring at 200 kPa. The greatest divergences are at the beginning and end of the virgin compression phase, differing by 3%.
Figure 7d shows the volumetric strain of the saturated models and the Sr = 99% model. The three models display similar behavior (up to 50 kPa); however, beyond this point, significant variations occur between the curves, with the most notable difference observed at 400 kPa. At this load, the HS_99% model increases by 9% compared to the HS_Sat and SS_Sat models.
The Soft Soil model exhibits lower recovery because it assumes dominant plastic compression with a relatively low elastic response [15]. This implies that, after being subjected to a range of loads (10–3200 kPa), the soil modeled by Soft Soil does not recover as much volume as other models.
On the other hand, the Hardening Soil model has a more advanced and robust formulation that accounts for compression hardening, allowing it to capture a nonlinear and load-dependent response [10,36]. This model may exhibit more significant expansion during unloading because it incorporates more detailed elastoplastic components, enabling the soil to recover more of the deformation experienced [16].
These two behaviors can be seen in Figure 8, which shows that, during the unloading phase, the SS_Sat model displays an almost horizontal slope, maintaining a volumetric strain of εv = −24%, whereas the HS_Sat model shows greater recovery in this phase, reaching εv = −21%.
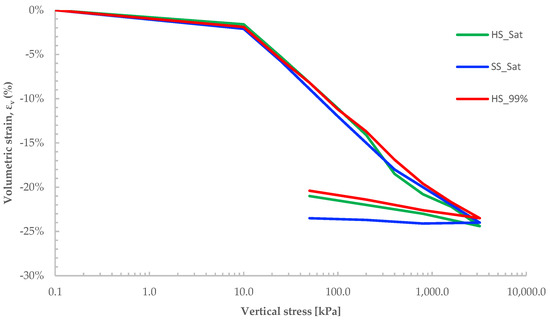
Figure 8.
Volumetric deformation (εv) at each vertical stress for saturated models and Sr = 99%.
As the load increases, the HS_99% model reaches a maximum difference of 13% during loading and 24% during unloading, implying greater volume recovery, as shown in Figure 8.
3.2.2. Unsaturated Condition
In unsaturated soils, various factors significantly influence their behavior, such as matric suction, capillary tension, water content, and the degree of saturation, among others, which notably alter the soil’s basic structure [37,38,39]. Consequently, the results presented in this section and later may vary, especially due to differences in initial saturation.
In Figure 9a, the models show behavior like saturated conditions, with a progressive decrease in the void ratio as the load increases, though to a lesser extent, consistent with the experimental response recorded by Gallardo et al. (2023) [13]. The curves overlap throughout the loading range and diverge during the unloading phase. The Soft Soil model shows a 5% decrease in the final void ratio compared to the experimental model, while the Hardening Soil model shows a 6% increase compared to the experimental model.
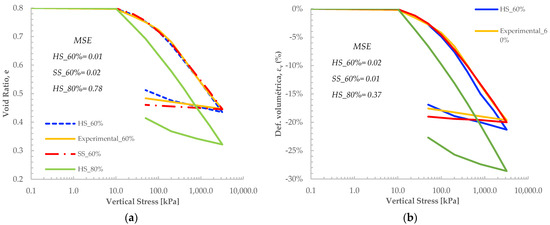
Figure 9.
(a) Compressibility curve under unsaturated condition. (b) Volumetric deformation (εv) under unsaturated condition.
This translates to volumetric recoveries of εv = −19% for Soft Soil and εv = −17% for Hardening Soil, as shown in Figure 9b.
In the curve with an 80% degree of saturation, a reduction in volumetric deformation can be observed as the vertical load increases compared to the HS_60% models. This demonstrates that an increase in the initial saturation leads to a higher degree of deformation and, therefore, tends to be more compressible [1].
This implies that the numerical model of copper filtered tailings under study, with an initial saturation degree of 80% and subjected to one-dimensional consolidation, experiences an 11% variation in its void ratio compared to the models with 60% saturation. Additionally, it exhibits greater volumetric deformation under lower stress levels, as shown in Figure 9b.
3.3. Excess Pore Pressure (Δu)
Excess pore pressure occurs when the applied stress on the soil is transferred to the pore water rather than to the soil structure. This is common in saturated or partially saturated soils under rapid and undrained loading [40]. This section shows that excess pore pressure is not evenly distributed within the soil and varies in depth due to the soil’s boundary conditions from the beginning to the end of the applied load duration for each vertical stress [41]. The pressure concentration tends to be higher in deeper areas where pore water has less opportunity to flow due to the confinement effect, which traps and compresses the water. Since the soil was modeled to allow drainage through the top and bottom boundaries, this “deeper” zone corresponds to the middle height of the soil. As the applied stress increases, this middle zone decreases size [1,40].
A vertical cross-section was taken through the middle of the model to observe the excess pore pressure within the soil. Additionally, to evaluate the behavior under all applied loads (10–3200 kPa), excess pore pressure was plotted against the model’s height immediately after the load was applied. In Figure 10, only the loads of 800, 1600, and 3200 kPa are shown to demonstrate that the excess pore pressure at the boundary is zero. Lower loads exhibit the same behavior as those plotted, so they were omitted for better visualization of the graph, assuming that all analyses also apply to these smaller loads.
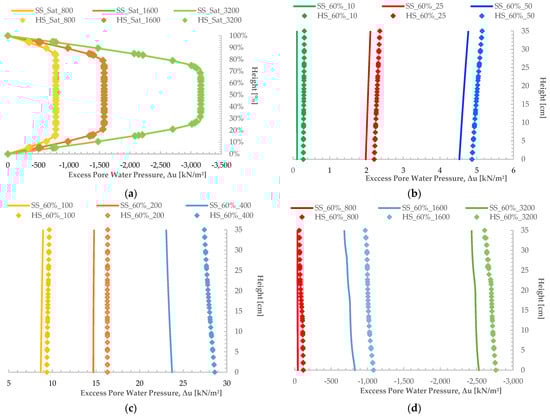
Figure 10.
Δu immediately after each vertical stress is applied: (a) Δu for SS y HS in saturated condition; (b) Δu for SS and HS Sr = 60% [10–50 kPa]; (c) Δu for SS y HS Sr = 60% [100–400 kPa]; and (d) Δu for SS and HS Sr = 60% [800–3200 kPa].
Figure 10a shows that the difference between the Soft Soil and Hardening Soil models under saturated conditions is minimal. In all cases, excess pore pressure increases with progressively applied loads, reaching maximum values equal to the applied load in the middle zone of the soil. This is consistent with Terzaghi’s consolidation principle [1,42], where pore pressure directly depends on the magnitude of the applied load.
From the same Figure 10a, it is demonstrated that, with each increment in applied stress, there is a reduction in the constant range of excess pore pressure along the height. For instance, the constant range of excess pore pressure at 10 kPa occupies 70% of the modeled specimen height, and this percentage decreases to 37% at 3200 kPa (see Figure 10a).
Figure 10b–d show the excess pore pressure under unsaturated conditions (HS_60%). It can be observed that the excess pore pressure values are significantly lower than those in saturated soils, specifically in the range of 10 to 400 kPa. According to Table 5, relevant effective suction values are present during this range of applied stress, indicating the reduction in hydrostatic pressure generated by the interstitial water [2].
As the vertical stress increases, the excess pore pressure also increases, while the effective suction decreases due to the rise in the degree of effective saturation. However, this pore pressure distribution is less uniform than saturated soils. Unlike the saturated condition, with a 60% degree of saturation, the excess pore pressure does not reach the value of the applied load. Compared to the saturated condition, this excess pore pressure is 14% lower for HS_60%_3200 and 21% lower for SS_60%_3200.
Under the same initial degree of saturation, at stress levels of 3200 kPa, effective saturation reaches 100% in the models (see Table 5). However, for stress levels below 3200 kPa, where effective saturation decreases and approaches its initial value, a reduction of 14% or more is anticipated in the Hardening Soil model and 21% in the Soft Soil model.
Figure 11 shows the excess pore pressure for the HS_80% model (solid line) and the HS_60% model (diamonds). Figure 10a shows the applied stress curves from 10 to 25 kPa. For both models, pore pressure values are low compared to applied stress; however, the HS_80% model shows higher values than HS_60%. In Figure 10b, HS_80% exhibits significantly higher excess pore pressure values than the 60% model, with the smallest difference of 16%.
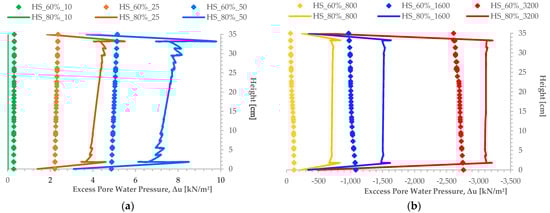
Figure 11.
Δu immediately after each vertical stress is applied for HS_60% and HS_80%: (a) Stresses from 10 to 25 kPa; (b) 800–3200 kPa.
The results shown by HS_80% are similar to those of the saturated condition, displaying pore water pressure values that tend toward zero at the boundaries as if it were saturated soil. Table 4 shows that HS_80% reaches 100% effective saturation at an applied stress of 100 kPa.
In the soil with 60% saturation, the Δu profile shows a shallower slope, indicating lower pressure accumulation throughout the model’s height. In contrast, in the soil with 80% saturation, the Δu profiles are steeper.
3.4. Dissipation of Pore Water Pressure
For the saturated condition, the pore pressure at H is zero throughout the entire duration of the applied load. According to the one-dimensional consolidation theory, pore pressure is initially highest in areas where water cannot escape and gradually decreases toward the drainage zones [1,43]. In the case of saturated soil with surface drainage, the pore pressure will be zero due to the immediate release of water. This behavior is defined by the boundary condition in consolidation theory [1,44].
Figure 12 shows the pore pressure dissipation at the selected control points under different vertical stresses. In this study of copper-filtered tailings, the pore water pressure supports the applied load for approximately 10 min, except after the 800 kPa load is applied. This indicates that the pore water dissipates more quickly as the applied stress increases. Moreover, there is a difference between the models used and the height ratios analyzed for the same load.
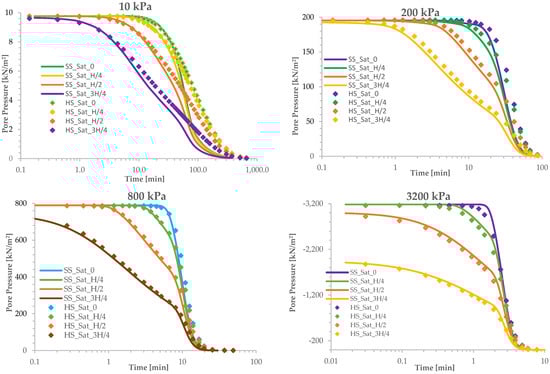
Figure 12.
Pore pressure dissipation at different height ratios with applied loads in saturated models.
In Figure 12, it is observed that, at t = 0, the pore pressure equals the applied load in saturated soils, in accordance with Terzaghi’s theory [1]. This behavior is more evident in the height ratios analyzed in the deeper zones (H = 0), as these take longer to drain due to their distance from the soil’s hydraulic boundary conditions. This phenomenon is consistent across all cases studied. However, as the load increases, the height ratios closer to the surface tend to deviate from the theory at the initial moment (t = 0).
In summary, as the applied stress increases, the Soft Soil model generates higher initial pressures and dissipates pore pressure more slowly, reflecting the typical behavior of soft and compressible saturated soils. Conversely, the Hardening Soil model generates lower initial pressures and dissipates more rapidly, better capturing the stiffness of more resistant soils. The lowest points exhibit the slowest dissipation, while the highest points dissipate much faster due to their proximity to the drainage boundaries.
Figure 13 compares the HS_99% model with the saturated models. Due to its similarity to the saturated condition, it follows that, at t = 0, the pore pressure equals the applied load and can dissipate completely over time. It also holds true that, at greater depths, dissipation takes longer to begin, allowing the soil to bear more load [45].
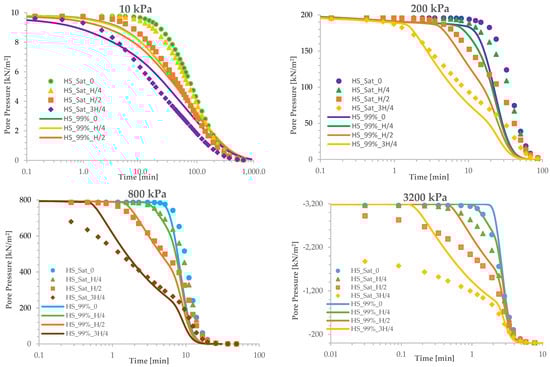
Figure 13.
Pore dissipation at different height ratios with applied loads in saturated and partially saturated HS_99% mode.
In unsaturated soils, both water and air in the pores participate in dissipation [45]. Air pressure dissipates faster than water pressure, leading to differences in settlement times and magnitudes [44,46]. Higher initial saturation results in slower water dissipation and greater long-term settlements. In contrast, in soils with low saturation, air acts as a regulator, influencing both the time and magnitude of consolidation [47].
Figure 14 shows how the HS_80% model significantly differs from SS_60% in the magnitude of pore pressure obtained under any applied load. For lower loads (10–400 kPa), the pore pressure dissipation in SS_60% remains constant at very low values, so small that it is barely noticeable in the graphs. It is only from 800 kPa onward that a more defined behavior begins to appear, with more noticeable pore pressure values. This demonstrates that the degree of saturation significantly affects water dissipation.
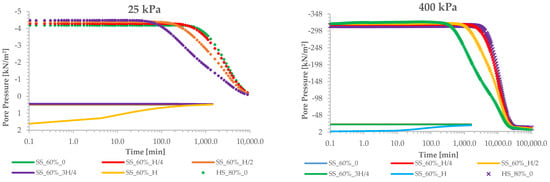
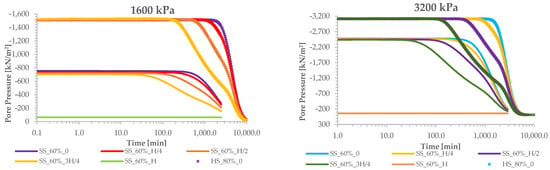
Figure 14.
Pore dissipation at different height ratios with applied loads in the unsaturated HS_60% and HS_80% models.
For applied stresses equal to or less than 400 kPa, the curves with lower saturation (HS_60%) show positive pore pressure values. This indicates that it is not the water bearing the load but rather the air in the soil pores [46,47]. Additionally, these curves demonstrate almost static behavior in initial pressures, indicating minimal dissipation within this time range.
In the HS_80% model, the pore pressure values at point H (soil surface) were zero throughout the application of all loads, implying that, at least from this degree of saturation, the behavior begins to resemble that of a saturated condition. Conversely, in the SS_60% model, there were varying values at this point depending on the applied load, consistently bearing the least load in all analyzed cases [48]. Similarly, at t = 0, the pore pressure value increasingly resembles the applied load as stress increases due to the rise in the degree of saturation.
In contrast, in the SS_60% model, pore pressure values do increase with increasing stress but never approach the expected limit completely. Thus, when applying the 3200 kPa stress, the SS_60% model shows a 22% difference from the expected value at t = 0, whereas the HS_80% model shows only a 3% variation compared to the same value. This implies that the variation in pore pressure at t = 0 will only increase from these percentages for smaller stresses. The dissipation of pore pressures was faster in the Hardening Soil models for higher loads. In saturated soils, the complete dissipation of pore pressures for lower stresses (10–400 kPa) occurred within 100 to 1000 min, while higher stresses (800–3200 kPa) occurred within 10 to 100 min. In unsaturated soils, the interaction between air and water in the pores led to more complex behavior and less uniform dissipation.
4. Conclusions
This research demonstrated that a single set of parameters can effectively capture the experimental response of oedometer tests under both saturated and unsaturated conditions using the Soft Soil and Hardening Soil constitutive models in Plaxis 2D. This approach offers a practical first step for obtaining reliable results before transitioning to more complex 3D models [49,50].
The Soft Soil model proved effective in representing dominant plastic compression but exhibited lower elastic recovery during unloading phases. In unsaturated soils, the results highlighted that the degree of saturation significantly influences load-bearing capacity and mechanical response. Specifically, a higher initial degree of saturation increased soil compressibility, leading to greater deformation and reduced pore pressure dissipation [51].
The soil–water characteristic curve (SWCC) accurately modeled the hydraulic and mechanical behavior of unsaturated soils, demonstrating that higher initial suction reduces water retention as the applied load increases. Both constitutive models effectively simulated soils with varying degrees of saturation, providing flexibility for numerical analyses based on specific geotechnical conditions and design requirements. Additionally, both models aligned with Terzaghi’s theory in modeling saturated conditions.
Finally, the Soft Soil model exhibited higher initial pore pressures and slower dissipation, making it well suited for simulating soft, highly compressible soils. In contrast, the Hardening Soil model produced lower initial pressures with faster dissipation, representing stiffer soils more effectively. Pore pressure dissipation was observed to be faster near drainage boundaries and slower in deeper zones. These findings confirm the applicability of the selected constitutive models and provide practical insights for optimizing foundation design and geotechnical analyses in low-strength soils.
Author Contributions
Conceptualization, W.C., R.G.-S., R.M. and O.N.; Methodology, R.G.-S.; Software, W.C.; Validation, R.G.-S., R.M. and O.N.; Formal analysis, W.C.; Investigation, R.G.-S.; Resources, E.A.; Data curation, W.C.; Writing—original draft, W.C.; Writing—review & editing, R.G.-S., E.A. and O.N.; Visualization, E.A.; Supervision, R.G.-S., R.M. and O.N.; Project administration, E.A. All authors have read and agreed to the published version of the manuscript.
Funding
This research was supported by the Vice-Rectorate for Research, Creation and Innovation (VINCI-DI) at Pontificia Universidad Católica de Valparaíso, Project 039.489/2024.
Institutional Review Board Statement
Not applicable.
Informed Consent Statement
Not applicable.
Data Availability Statement
The original contributions presented in this study are included in the article. Further inquiries can be directed to the corresponding author.
Acknowledgments
The authors acknowledge One Geotecnia SPA for its methodological support of this research and PUCV for providing financial support for the publication fees.
Conflicts of Interest
Author Omar Núñez was employed by One Geotecnia SPA. The remaining authors declare that the research was conducted in the absence of any commercial or financial relationships that could be construed as a potential conflict of interest.
References
- Terzaghi, K. Theoretical Soil Mechanics; John Wiley & Sons: New York, NY, USA, 1943. [Google Scholar]
- Fredlund, D.G.; Rahardjo, H. Soil Mechanics for Unsaturated Soils; John Wiley & Sons: New York, NY, USA, 1993. [Google Scholar]
- Fredlund, D.G. Unsaturated Soil Mechanics in Engineering Practice Unsaturated Soil Mech. Eng. Pract. 2006, 132, 286–321. [Google Scholar]
- Thu, T.M.; Rahardjo, H.; Leong, E.-C. Soil-water characteristic curve and consolidation behavior for a compacted silt. Can. Geotech. J. 2007, 44, 266–275. [Google Scholar] [CrossRef]
- Burton, G.; Pineda, J.; Sheng, D.; Airey, D.; Zhang, F. Exploring one-dimensional compression of compacted clay under constant degree of saturation paths. Geotechnique 2016, 66, 435–440. [Google Scholar] [CrossRef]
- Zou, W.-L.; Han, Z.; Vanapalli, S.K.; Zhang, J.-F.; Zhao, G.-T. Predicting volumetric behavior of compacted clays during compression. Appl. Clay Sci. 2018, 156, 116–125. [Google Scholar] [CrossRef]
- Lloret-Cabot, M.; Wheeler, S.J.; Pineda, J.A.; Romero, E.; Sheng, D. From saturated to unsaturated conditions and vice versa. Acta Geotech. 2018, 13, 15–37. [Google Scholar] [CrossRef]
- Nuth, M. Constitutive Modelling of Unsaturated Soils with Hydro-Geomechanical Couplings; EPFL: Lausanne, Switzerland, 2009. [Google Scholar] [CrossRef]
- Liu, Y.; Cai, G.; Zhou, A.; Han, B.; Li, J.; Zhao, C. A fully coupled constitutive model for thermo-hydro-mechanical behaviour of unsaturated soils. Comput. Geotech. 2021, 133, 104032. [Google Scholar] [CrossRef]
- Schanz, T.; Vermeer, P.A.; Bonnier, P.G. The Hardening Soil Model: Formulation and Verification. In Beyond 2000 in Computational Geotechnics; Routledge: Oxfordshire, UK, 2019. [Google Scholar]
- Brinkgreve, R.B.J.; Vermeer, P.A. PLAXIS 8.2: Finite Element Code for Soil and Rock Analysis, version 8.2; Balkema: Rotterdam, The Netherland, 1998.
- Brinkgreve, R.B.J.; Brasile, S. Automatic Finite Element Modelling and Parameter Determination for Geotechnical Design. In Workshop Numerische Methoden in der Geotechnik; Grabe, J., Ed.; The Institute of Geotechnical Engineering and Construction Management: Hamburg, Germany, 2022; Volume 53, pp. 83–97. [Google Scholar]
- Sepúlveda, R.G.; Robert, E.S.; Camacho-Tauta, J. Assessment of the Self-Compaction Effect in Filtered Tailings Disposal under Unsaturated Condition. Minerals 2022, 12, 422. [Google Scholar] [CrossRef]
- ASTM International. Standard Practice for Classification of Soils for Engineering Purposes (Unified Soil Classification System); ASTM International: West Conshohocken, PA, USA, 2011. [Google Scholar] [CrossRef]
- Bentley Systems. PLAXIS 2D 2024.1: Reference Manual; Bentley Systems: Tokyo, Japan, 2023. [Google Scholar]
- Benz, T. Small-Strain Stiffness of Soils and Its Numerical Consequences; Universität Stuttgart: Stuttgart, Germany, 2007; Volume 5. [Google Scholar]
- Fredlund, D.G. State of practice for use of the soil-water characteristic curve (SWCC) in geotechnical engineering. Can. Geotech. J. 2019, 56, 1059–1069. [Google Scholar] [CrossRef]
- Tafili, M.; Fuentes, W.; Triantafyllidis, T. A comparative study of different model families for the constitutive simulation of viscous clays. Int. J. Numer. Anal. Methods Géoméch. 2020, 44, 633–667. [Google Scholar] [CrossRef]
- Gaber, M.; Kasa, A.; Abdul-Rahman, N.; Alsharef, J. Simulation of Stone Column Ground Improvement (Comparison between Axisymmetric and Plane Strain). Am. J. Eng. Appl. Sci. 2018, 11, 129–137. [Google Scholar] [CrossRef]
- Zakaria, M.H.; Basha, A.M. Two-Dimensional Numerical Approaches of Excavation Support Systems: A Comprehensive Review of Key Considerations and Modelling Techniques. J. Contemp. Technol. Appl. Eng. 2024, 3, 64–74. [Google Scholar] [CrossRef]
- Alonso, E.E.; Pereira, J.-M.; Vaunat, J.; Olivella, S. A microstructurally based effective stress for unsaturated soils. Géotechnique 2010, 60, 913–925. [Google Scholar] [CrossRef]
- Gallipoli, D.; Gens, A.; Sharma, R.; Vaunat, J. An elasto-plastic model for unsaturated soil incorporating the effects of suction and degree of saturation on mechanical behaviour. Géotechnique 2003, 53, 123–135. [Google Scholar] [CrossRef]
- Fredlund, D.G.; Rahardjo, H.; Fredlund, M.D. Unsaturated Soil Mechanics in Engineering Practice; John Wiley & Sons: New York, NY, USA, 2012. [Google Scholar]
- Gallardo, R.; Sáez, E.; Lopez-Caballero, F. Modeling self-compaction and static stability of a copper filtered tailings pile under unsaturated conditions. Acta Geotech. 2024, 19, 4297–4312. [Google Scholar] [CrossRef]
- Azmi, M.; Ramli, M.H.; Hezmi, M.A.; Mohd Yusoff, S.A.N.; Alel, M.N.A. Estimation of Soil Water Characteristic Curves (SWCC) of mining sand using soil suction modelling. IOP Conf. Series: Mater. Sci. Eng. 2019, 527, 012016. [Google Scholar] [CrossRef]
- Tripathy, S.; Tadza, M.Y.M.; Thomas, H.R. Soil-water characteristic curves of clays. Can. Geotech. J. 2014, 51, 869–883. [Google Scholar] [CrossRef]
- Hamid, T.B.; Miller, G.A. A constitutive model for unsaturated soil interfaces. Int. J. Numer. Anal. Methods Géoméch. 2008, 32, 1693–1714. [Google Scholar] [CrossRef]
- van Genuchten, M.T. A Closed-form Equation for Predicting the Hydraulic Conductivity of Unsaturated Soils. Soil Sci. Soc. Am. J. 1980, 44, 892–898. [Google Scholar] [CrossRef]
- Zhai, Q.; Rahardjo, H. Determination of soil–water characteristic curve variables. Comput. Geotech. 2012, 42, 37–43. [Google Scholar] [CrossRef]
- Leong, E.-C. Soil-water characteristic curves—Determination, estimation and application. Jpn. Geotech. Soc. Spéc. Publ. 2019, 7, 21–30. [Google Scholar] [CrossRef]
- Georgiadis, K.; Potts, D.M.; Zdravkovic, L. Three-Dimensional Constitutive Model for Partially and Fully Saturated Soils. Int. J. Geomech. 2005, 5, 244–255. [Google Scholar] [CrossRef]
- Miller, C.J.; Yesiller, N.; Yaldo, K.; Merayyan, S. Impact of Soil Type and Compaction Conditions on Soil Water Characteristic. J. Geotech. Geoenvironmental Eng. 2002, 128, 733–742. [Google Scholar] [CrossRef]
- Costa, Y.; Cintra, J.; Zornberg, J. Influence of Matric Suction on the Results of Plate Load Tests Performed on a Lateritic Soil Deposit. Geotech. Test. J. 2003, 26, 219–227. [Google Scholar] [CrossRef]
- Yang, Y.; Liao, H.; Wu, C. Three-dimensional stability of triple-step slopes considering diverse hydraulic hysteresis paths. Alex. Eng. J. 2024, 99, 363–376. [Google Scholar] [CrossRef]
- Raheem, A.M. Experimental Testing and Mathematical Modeling of Grout Treated Kirkuk Soft Clay Soil. IOP Conf. Series Earth Environ. Sci. 2021, 856, 012019. [Google Scholar] [CrossRef]
- Vermeer, P.A.; Neher, H.P. Beyond 2000 in Computational Geotechnics, 1st ed.; Routledge: Oxfordshire, UK, 2019. [Google Scholar] [CrossRef]
- Vaziri, H.H.; Christian, H.A. Application of Terzaghi’s consolidation theory to nearly saturated soils. Can. Geotech. J. 1994, 31, 311–317. [Google Scholar] [CrossRef]
- Wheeler, S.J. A conceptual model for soils containing large gas bubbles. Géotechnique 1988, 38, 389–397. [Google Scholar] [CrossRef]
- Xu, H.F.; Xie, K.H. Simplified Computation of 1D Consolidation for Unsaturated Soil when Air Phase Neglected. Adv. Mater. Res. 2010, 168–170, 298–302. [Google Scholar] [CrossRef]
- Murakami, Y. Excess Pore Water Pressure Due to Undrained Strip Loading on a Cross-Anisotropic Elastic Soil Deposit. Soils Found. 1984, 24, 95–100. [Google Scholar] [CrossRef][Green Version]
- Abdrabbo, F.M.; Ali, N.A. Behaviour of single pile in consolidating soil. Alex. Eng. J. 2015, 54, 481–495. [Google Scholar] [CrossRef]
- Terzaghi, K.; Peck, R.B.; Mesri, G. Soil Mechanics in Engineering Practice, 3rd ed.; John Wiley & Sons: New York, NY, USA, 1996. [Google Scholar]
- Lovisa, J.; Read, W.; Sivakugan, N. Consolidation Behavior of Soils Subjected to Asymmetric Initial Excess Pore Pressure Distributions. Int. J. Geomech. 2010, 10, 181–189. [Google Scholar] [CrossRef]
- Fredlund, D.G.; Hasan, J.U. One-dimensional consolidation theory: Unsaturated soils. Can. Geotech. J. 1979, 16, 521–531. [Google Scholar] [CrossRef]
- Ho, L.; Fatahi, B.; Khabbaz, H. A closed form analytical solution for two-dimensional plane strain consolidation of unsaturated soil stratum. Int. J. Numer. Anal. Methods Géoméch. 2015, 39, 1665–1692. [Google Scholar] [CrossRef]
- Xu, H.F.; Wang, W.J.; Zha, Z.X. Consolidation of Unsaturated Soils due to Dissipation of Pore-Air Pressure. Appl. Mech. Mater. 2014, 580–583, 160–164. [Google Scholar] [CrossRef]
- Lo, W.-C.; Lee, J.-W. Effect of water content and soil texture on consolidation in unsaturated soils. Adv. Water Resour. 2015, 82, 51–69. [Google Scholar] [CrossRef]
- Gao, Y.; Sun, D.; Wu, Y. Volume change behaviour of unsaturated compacted weakly expansive soils. Bull. Eng. Geol. Environ. 2018, 77, 837–848. [Google Scholar] [CrossRef]
- Nguyen, T.D.; Hoang, D.P.; Nguyen, D.D. Experimental and numerical studies on vertical stress induced in single head-enlarged CDM columns under static load test. Alex. Eng. J. 2024, 100, 82–91. [Google Scholar] [CrossRef]
- Zhou, K.; Wang, H.; Liao, J.; Zhang, Y.; Chen, F.; Yang, Z. Deformation and failure mechanism of colluvial landslide under sustained rainfall-a case study of Xinzhan landslide in Tongzi County, China. Alex. Eng. J. 2023, 71, 89–103. [Google Scholar] [CrossRef]
- Gaaver, K.E. Geotechnical properties of Egyptian collapsible soils. Alex. Eng. J. 2012, 51, 205–210. [Google Scholar] [CrossRef]


Disclaimer/Publisher’s Note: The statements, opinions and data contained in all publications are solely those of the individual author(s) and contributor(s) and not of MDPI and/or the editor(s). MDPI and/or the editor(s) disclaim responsibility for any injury to people or property resulting from any ideas, methods, instructions or products referred to in the content. |
© 2025 by the authors. Licensee MDPI, Basel, Switzerland. This article is an open access article distributed under the terms and conditions of the Creative Commons Attribution (CC BY) license (https://creativecommons.org/licenses/by/4.0/).