Article

Three-Dimensional Microstructure and Structural Representative Volume Element of the Intact and Remolded Loess

1
State Key Laboratory of Lithospheric and Environmental Coevolution, Institute of Geology and Geophysics, Chinese Academy of Sciences, Beijing 100029, China
2
University of Chinese Academy of Sciences, Beijing 101408, China
*
Author to whom correspondence should be addressed.
Appl. Sci. 2025, 15(6), 3120; https://doi.org/10.3390/app15063120
Submission received: 18 February 2025 / Revised: 9 March 2025 / Accepted: 11 March 2025 / Published: 13 March 2025

Abstract

:
On the Loess Plateau of China, the number of projects involving the excavation of mountains and the filling of valleys to create new land is rising. The loess excavated from the mountain is directly used as building material. After being filled into the valley and remolded, it serves as the foundation for overlying structures. However, significant differences in mechanical behavior exist between intact and remolded loess, leading to various issues such as differential settlement. Understanding the microstructure of loess is essential for improving our comprehension of its macro-level hydrological and mechanical behavior. Due to the inherent limitation of the conventional methods (e.g., scanning electron microscopy and mercury intrusion porosimetry) for microstructure investigation, an in-depth understanding of the three-dimensional (3D) microstructural differences between intact and remolded loess remains elusive. To address this gap, this study employs advanced X-ray micro-computed tomography (micro-CT) to investigate the 3D microstructure of both intact and remolded loess from two typical man-made new land creation projects. The three-dimensional microstructures are segmented into a series of cubes of varying dimensions to identify the structure’s representative volume element (RVE) and assess the uniformity of both loess types. The pore network of the RVE is quantitatively analyzed to characterize the microstructure. The results reveal significant disparities between the microstructure of intact and remolded loess, particularly in terms of uniformity, pore size distribution, and pore connectivity. Remolded loess exhibits a denser structure with poorer pore connectivity and greater heterogeneity compared to intact loess. These microstructural differences are attributed to the distinct formation processes of the two types of loess.

1. Introduction

In the Loess Plateau of China, the loess primarily consists of silt-sized sediments with a highly porous and unstable structure, formed from the accumulation of wind-blown dust [1,2,3]. The region is characterized by intricate valleys and scarce land resources with severe soil erosion [4]. Nowadays, land demand for accommodating the increasing population and for agriculture has been rising, exacerbating conflicts over limited land availability in gullies and ravines. To achieve sustainable socioeconomic and agricultural development on the Loess Plateau, projects such as the mountain excavation and city construction (MECC) project, and the gully management and land reclamation (GMLR) project, have emerged [5,6,7,8]. MECC involves cutting down mountains, filling in gullies, and creating new land to expand urban areas, during which the soil filling in the gully is carefully compacted (Figure 1a). GMLR involves new methods for slope management and soil conservation in the hilly gully, primarily using modern machinery for slope cutting, gully filling to make new arable land, complemented by drainage channels and slope protection measures (Figure 1b). The aforementioned measures are significant initiatives to increase urban/arable land resources, alleviating the pressure on urban/arable land use [9]. However, these projects have disrupted the hydrogeological and engineering geological balance, leading to a series of geotechnical issues such as differential settlement [10,11,12], highlighting the necessity to investigate the macro-level hydraulic and mechanical behavior of the remolded loess [8,13,14,15,16,17,18]. The remolded loess of backfilled area which is excavated from intact loess of excavation area in the MECC project and GMLR project is a special type of remolded soil. In the construction process, the remolded loess underwent operations of layered excavation and mechanical compaction. At the same time, natural intact loess from different locations and different age strata were mixed together and then directly compacted into new remolded soil layers. Since the newly compacted loess layer has not undergone long-term geological evolution after artificial filling, the characteristics of remolded loess have significant heterogeneity compared with natural intact loess. Recently, numerous studies have investigated the hydraulic and mechanical properties of both intact and compacted loess, revealing significant differences between them [19,20,21,22,23,24,25]. Laboratory experiments have demonstrated that, despite compaction efforts, compacted loess often exhibits collapsibility that can surpass that of the intact loess [26,27,28]. Additionally, for the hydraulic behavior, intact loess shows higher hydraulic conductivity [20] and higher water retention behavior in the low suction ranges [19]. It is widely acknowledged that the macro-level hydraulic and mechanical behavior of soils, either in the compacted or intact state, is governed by their microstructure [14,16,19,21]. Quantitative characterization of the soil microstructure is increasingly crucial for interpreting the micro-level hydraulic and mechanical behavior and developing constitutive models that consider the structural effects [10,17,29,30,31].
Numerous studies have been conducted to investigate soil fabric using techniques such as scanning electron microscopy (SEM) and mercury intrusion porosimetry (MIP) [2,23,32,33,34]. Several studies have compared the microstructures of intact and compacted loess using MIP and SEM techniques [19,22,25,35]. Naturally deposited loess typically exhibits a loose arrangement of particles and inter-particle bonding, such as clay particles, soluble salts, and calcium carbonate [1,14,28,36]. In contrast, the microstructure of compacted loess can differ significantly from intact loess, despite having the same grain-size distribution (GSD) and mineral composition [18,19,22,37]. This difference arises because the inter-particle carbonate cementations are disrupted during the remolding process [14,19,35]. However, the scanning electron microscopy (SEM) technique only provides two-dimensional (2D) images, leading to the results obtained from SEM being highly dependent on the chosen observation direction and section, resulting in significant errors in the statistical analysis of pores [38]. Meanwhile, MIP is a destructive method that forces non-wetting mercury into the soil under high pressure, making it impossible to detect isolated pores and accurately assess pore morphologies [34]. Additionally, MIP may underestimate pore sizes due to the “ink-bottle” effect, where smaller necks between larger pores skew the results [39]. Due to the inherent limitations of the MIP and SEM methods, a full understanding of the three-dimensional microstructural similarities and differences between intact and compacted loess remains incomplete.
In recent years, high-resolution, non-destructive micro-computed tomography (micro-CT) has emerged as a promising alternative for studying soil microstructure [40,41,42,43,44,45]. This technique uses a series of high-resolution CT images to build a 3D microstructure model of the soil. With the aid of image processing programs, micro-CT can provide detailed information about the soil’s pore size, connectivity, grain size, grain shape, grain sphericity, and orientation. Previous research has highlighted the shortcomings of 2D SEM images, particularly in capturing the 3D characteristics of pores and their connectivity, underscoring the superior capability of micro-CT in these areas [38]. Nevertheless, researchers can only obtain 3D reconstructed pore structures on the scale of hundreds of micrometers when the CT scan resolution reaches 1 μm [18,41,42]. Given the inherent heterogeneity of loess, it is necessary to assess whether these small-scale 3D pore structures are representative.
The Representative Volume Element (RVE) is a crucial concept in the mechanics and physics of random heterogeneous materials [30,46,47]. It is defined as the smallest volume of a heterogeneous material that is large enough to statistically represent the microstructural heterogeneities [47]. If the volume is too small, even a slight increase in size can lead to significant changes in its characteristics. Once the volume exceeds a certain critical value, these characteristics stabilize and no longer change with further size increments. This critical value is known as the RVE size [30,46]. The determination of RVE size is widely applied in the precise analysis of three-dimensional fracture networks within jointed rock masses [48,49,50]. However, its application in accurately analyzing soil microstructure based on CT scans remains limited.
In this study, 3D pore microstructures of intact and remolded loess from the two typical engineering projects (i.e., GMLR and MECC) in the Loess Plateau of China were reconstructed using serial CT images with a voxel size of 1 μm3. A workflow for determining the geometrical RVE is introduced. The three-dimensional microstructures are segmented into a series of cubes of varying dimensions to identify the structure’s representative volume element (RVE) and assess the uniformity of both loess types. The pore network of the RVE is quantitatively analyzed to characterize the microstructure. In addition, a detailed quantitative assessment and comparison of 3D structural parameters across different volume sizes is conducted, which aids in the evaluation of the uniformity between intact and remolded specimens. The research is expected to offer an in-depth understanding of the 3D geometrical characteristics of the intact and remolded loess and further provide insights into the study of the micro-mechanism of loess behavior.

2. Methodology

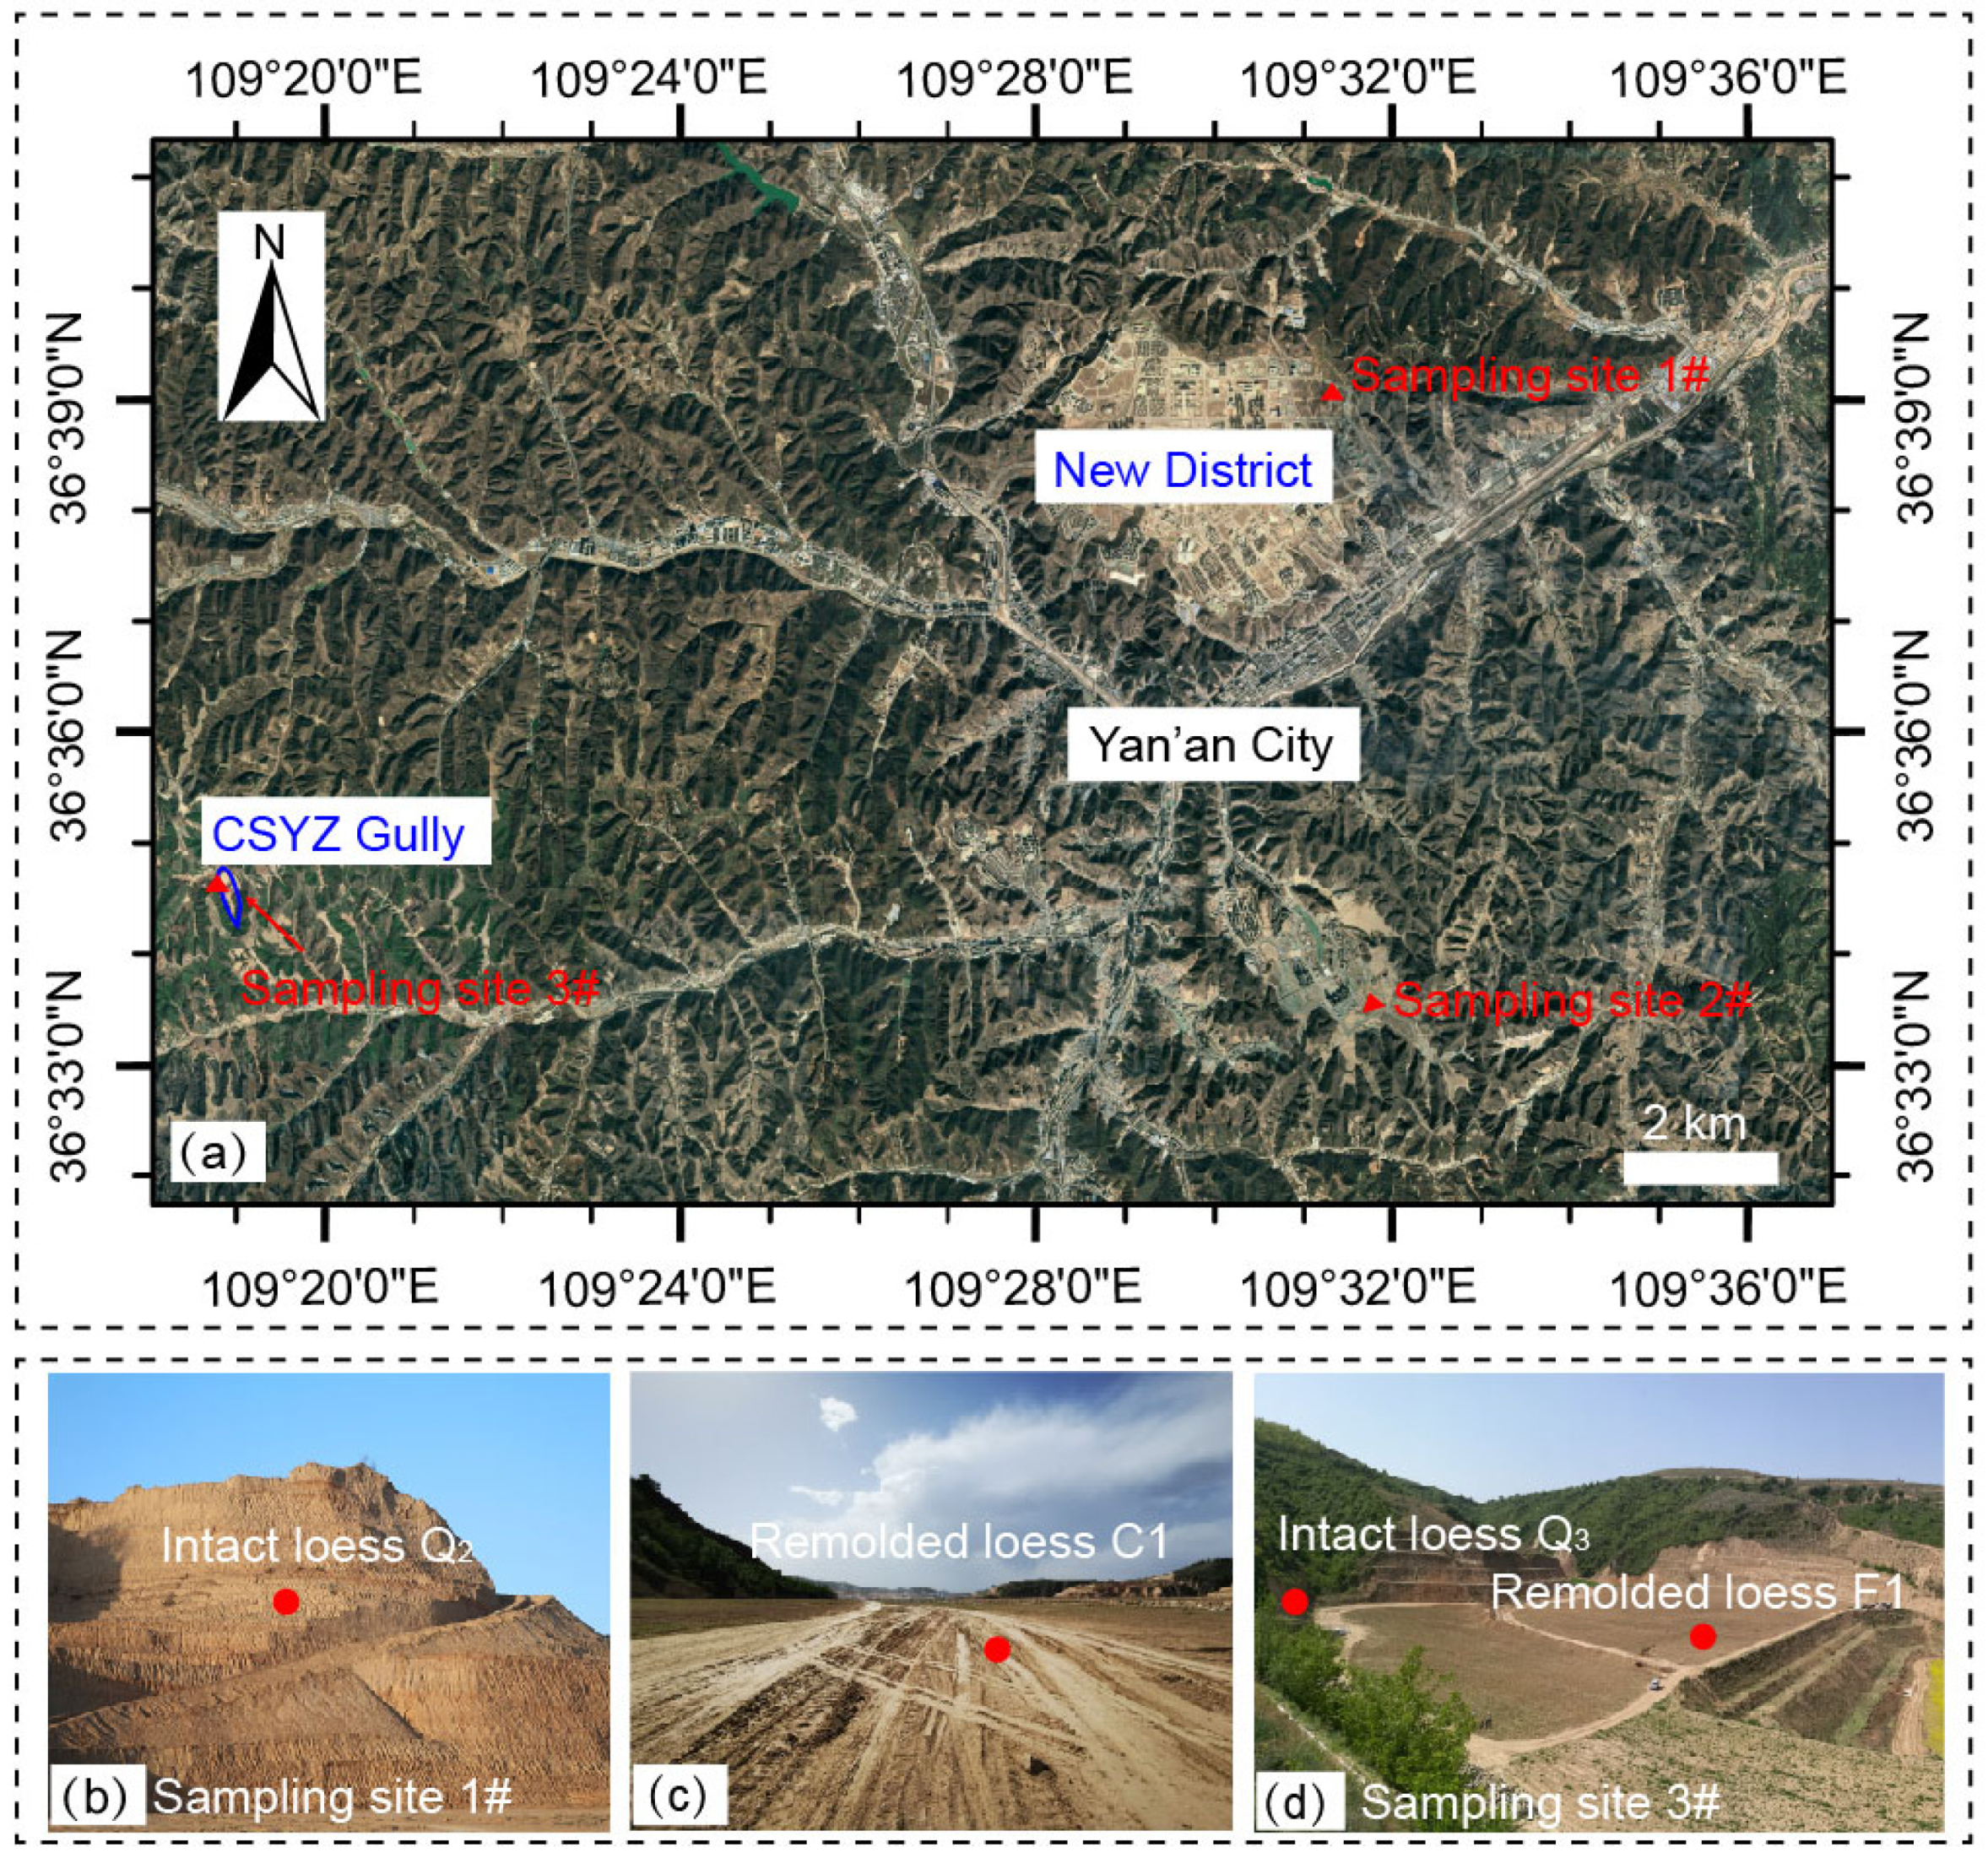
2.1. Sample Preparation

The sampling site is located in Yan’an City, Shaanxi Province, China, which features two typical engineering projects, namely GMRL and MECC. Four types of loess samples were collected (Figure 2), namely, intact loess from the late Pleistocene (Q3 loess), intact loess from the middle Pleistocene (Q2 loess), remolded loess from the GMRL site (F1) and remolded loess from the MECC site (C1). The experimental soil samples in this study were all undisturbed soil samples obtained in the field. Since these four sets of soil samples are located in the excavation area and filling area of two typical engineering projects of GMRL and MECC, the sampling points are located at four locations. The intact Q2 was collected from a cut slope of the MECC project (Figure 2b), while the C1 loess was obtained from a well dug in the filling area of the MECC project (Figure 2c) at a depth of 23 m. The intact Q3 was collected from an excavation slope at the GMRL site (Figure 2d), and the F1 loess was taken from the filling area of the same site (Figure 2d).
For the sampling process, an undisturbed soil block measuring approximately 250 × 200 × 200 mm was obtained first. Then we pressed the PVC tube onto the top of the soil block while trimming the soil sample to fit inside. The PVC tubes were pre-cut to appropriate dimensions (160 mm in height and 110 mm in diameter). Afterward, we wrapped the prepared soil sample in the PVC tube with multiple layers of plastic wrap, followed by sealing with adhesive tape to prevent moisture loss. We pre-cut circular covers with a diameter of 11 cm from discarded cardboard and placed them on both ends of the soil sample tube to prevent deformation under pressure. We sealed the entire tube with adhesive tape, labeled it, and then placed the soil sample in a designated box for transport back to the laboratory.
The basic physical properties of the loess specimens were measured in the laboratory, including dry density, natural water content, void ratio, saturated water content, Atterberg limits (plastic limit, liquid limit, and plasticity index), and grain size distribution, following the relevant ASTM standards. According to the regulations of the test standard, each group should have two specimens, and if the difference between the two values is within the error range, the average of the two is taken as the result. The results are presented in Table 1 and Figure 3. The C1 specimen has the highest dry density of 1.66 g/cm3 and the lowest void ratio of 0.63, followed by the F1 specimen, with a dry density of 1.61 g/cm3 and a void ratio of 0.58. The intact Q3 possesses a loose structure, with a dry density of 1.37 g/cm3 and a void ratio of 0.97. In comparison, the Q2 loess has a denser structure, with a higher dry density of 1.54 g/cm3 and a lower void ratio of 0.75. The natural water contents of the Q3, Q2, F1, and C1 specimens are 9.7%, 13.9%, 16.5%, and 13.9%, respectively. The Atterberg limits (plastic limit, liquid limit, and plasticity index) (Table 1) and the grain size distribution of the specimens (Figure 3) are similar.

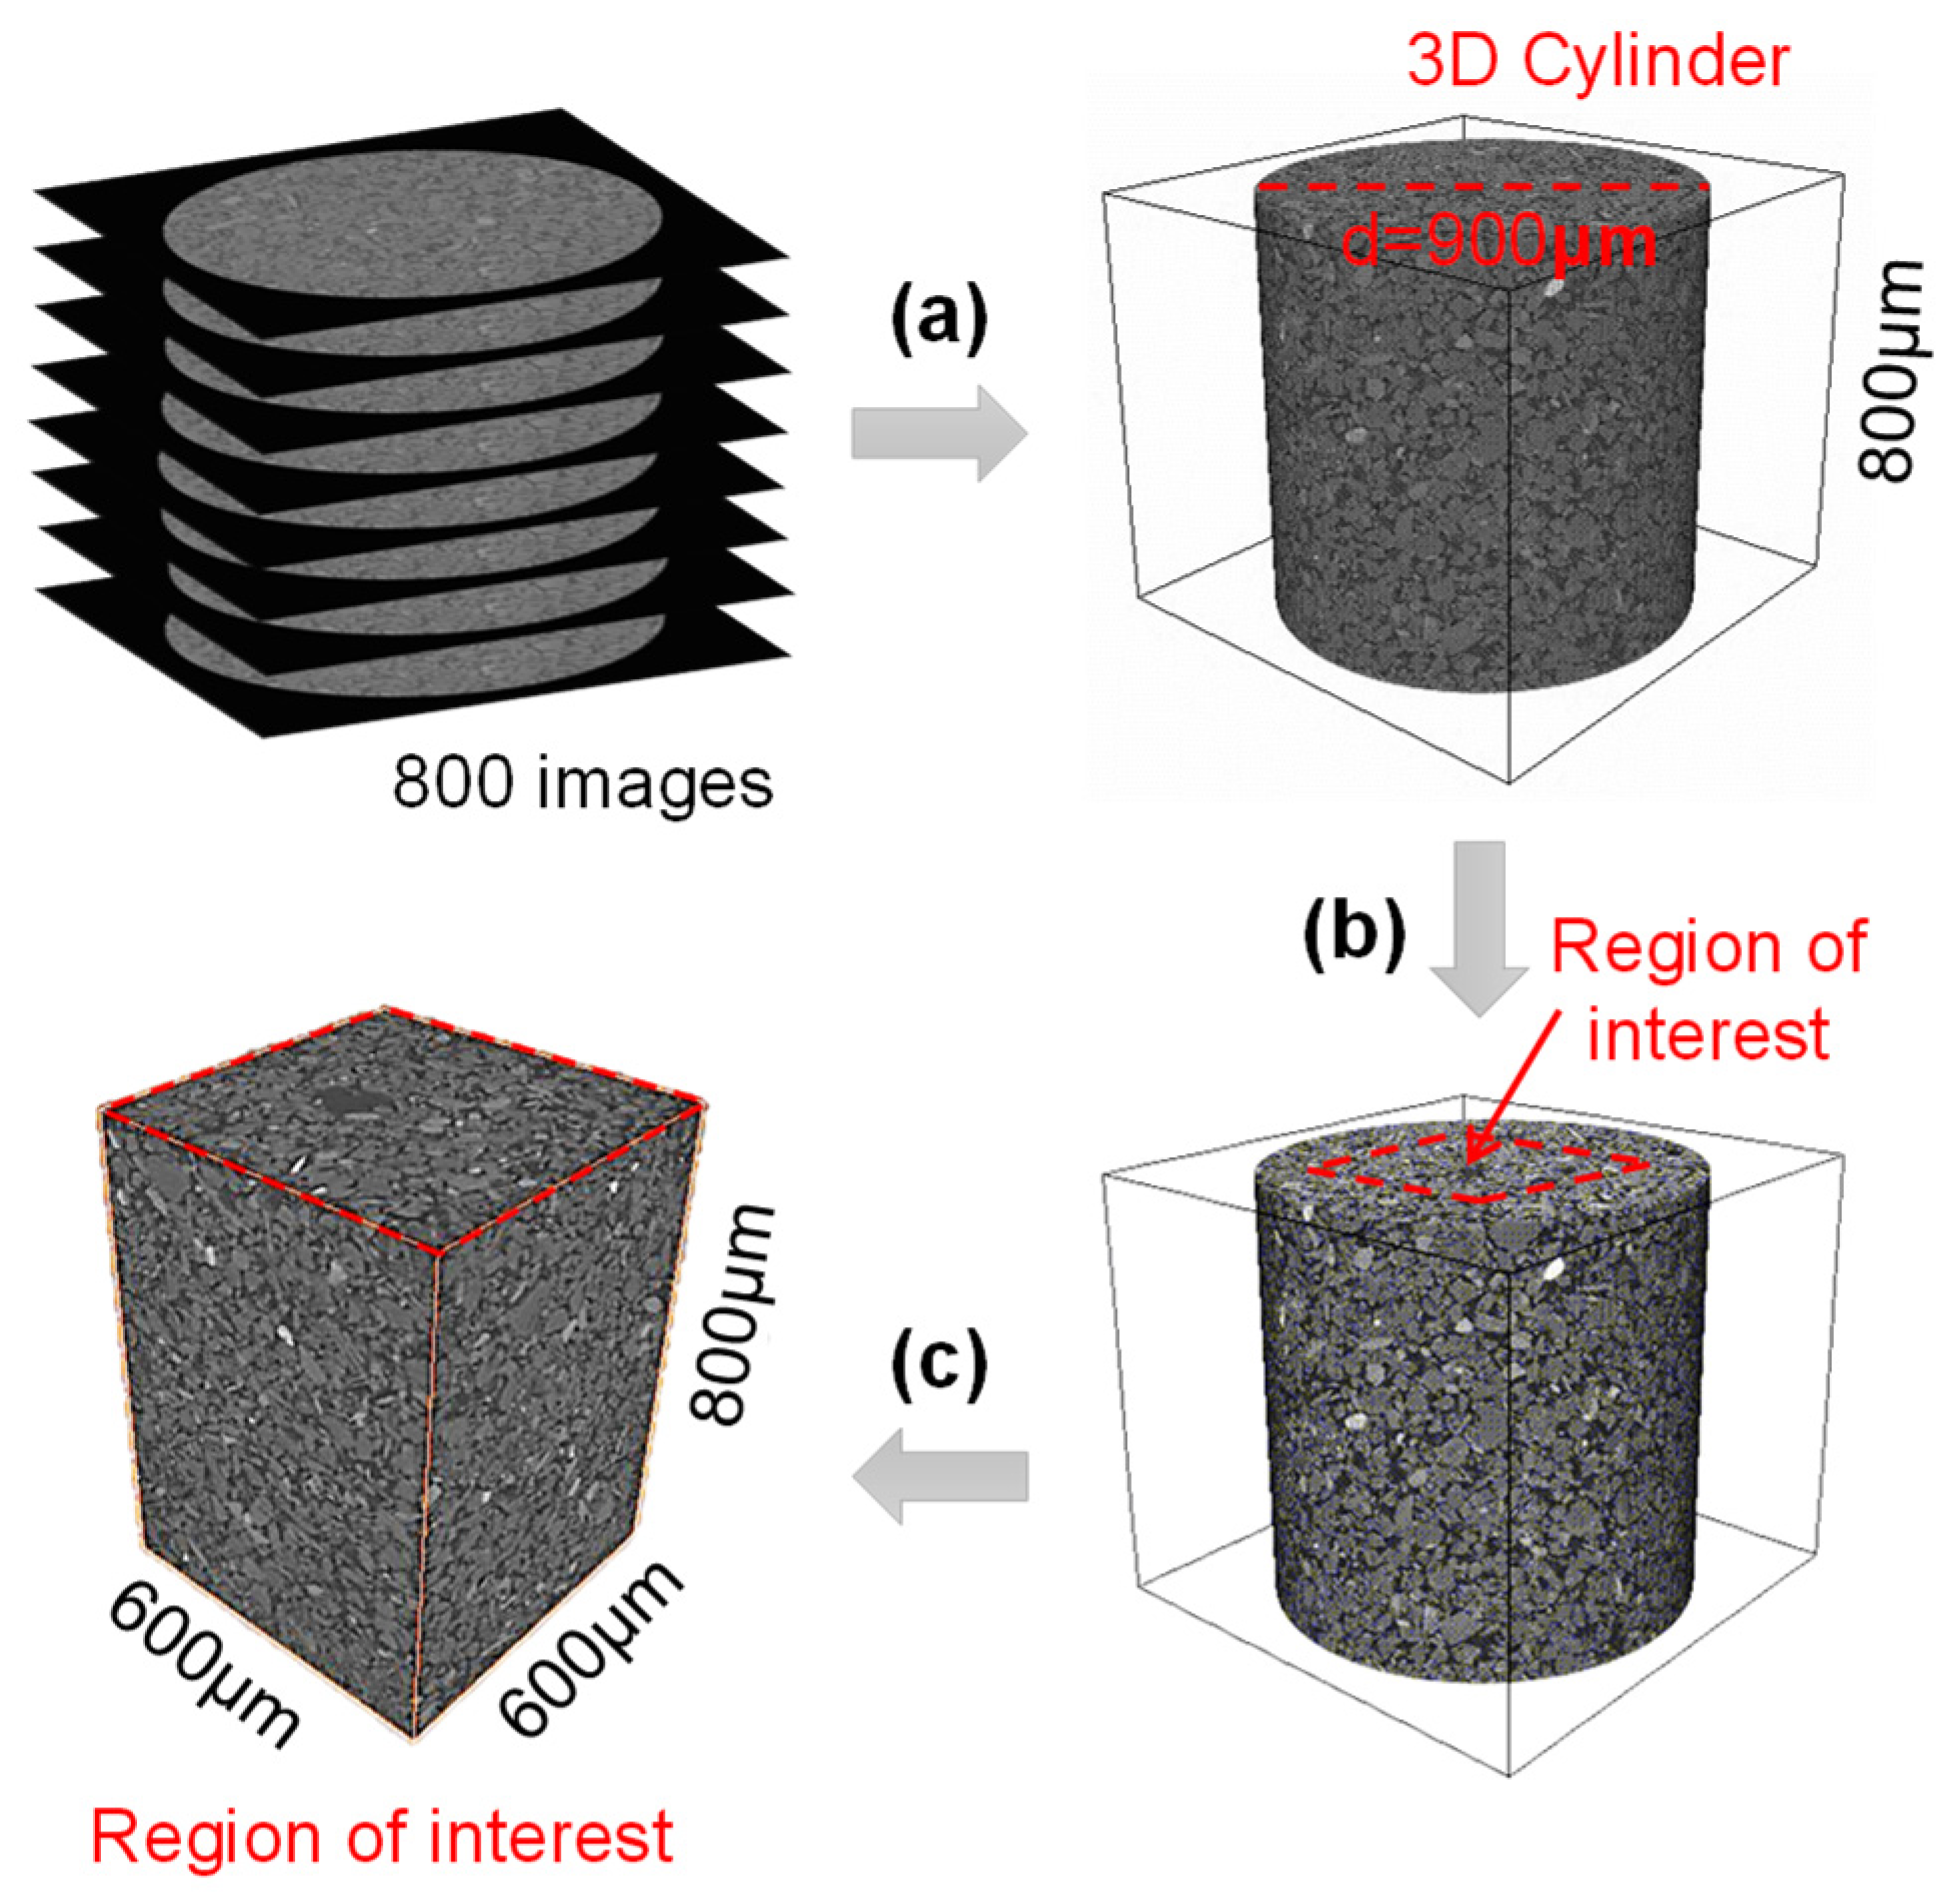
2.2. CT Scanning and 3D Reconstruction
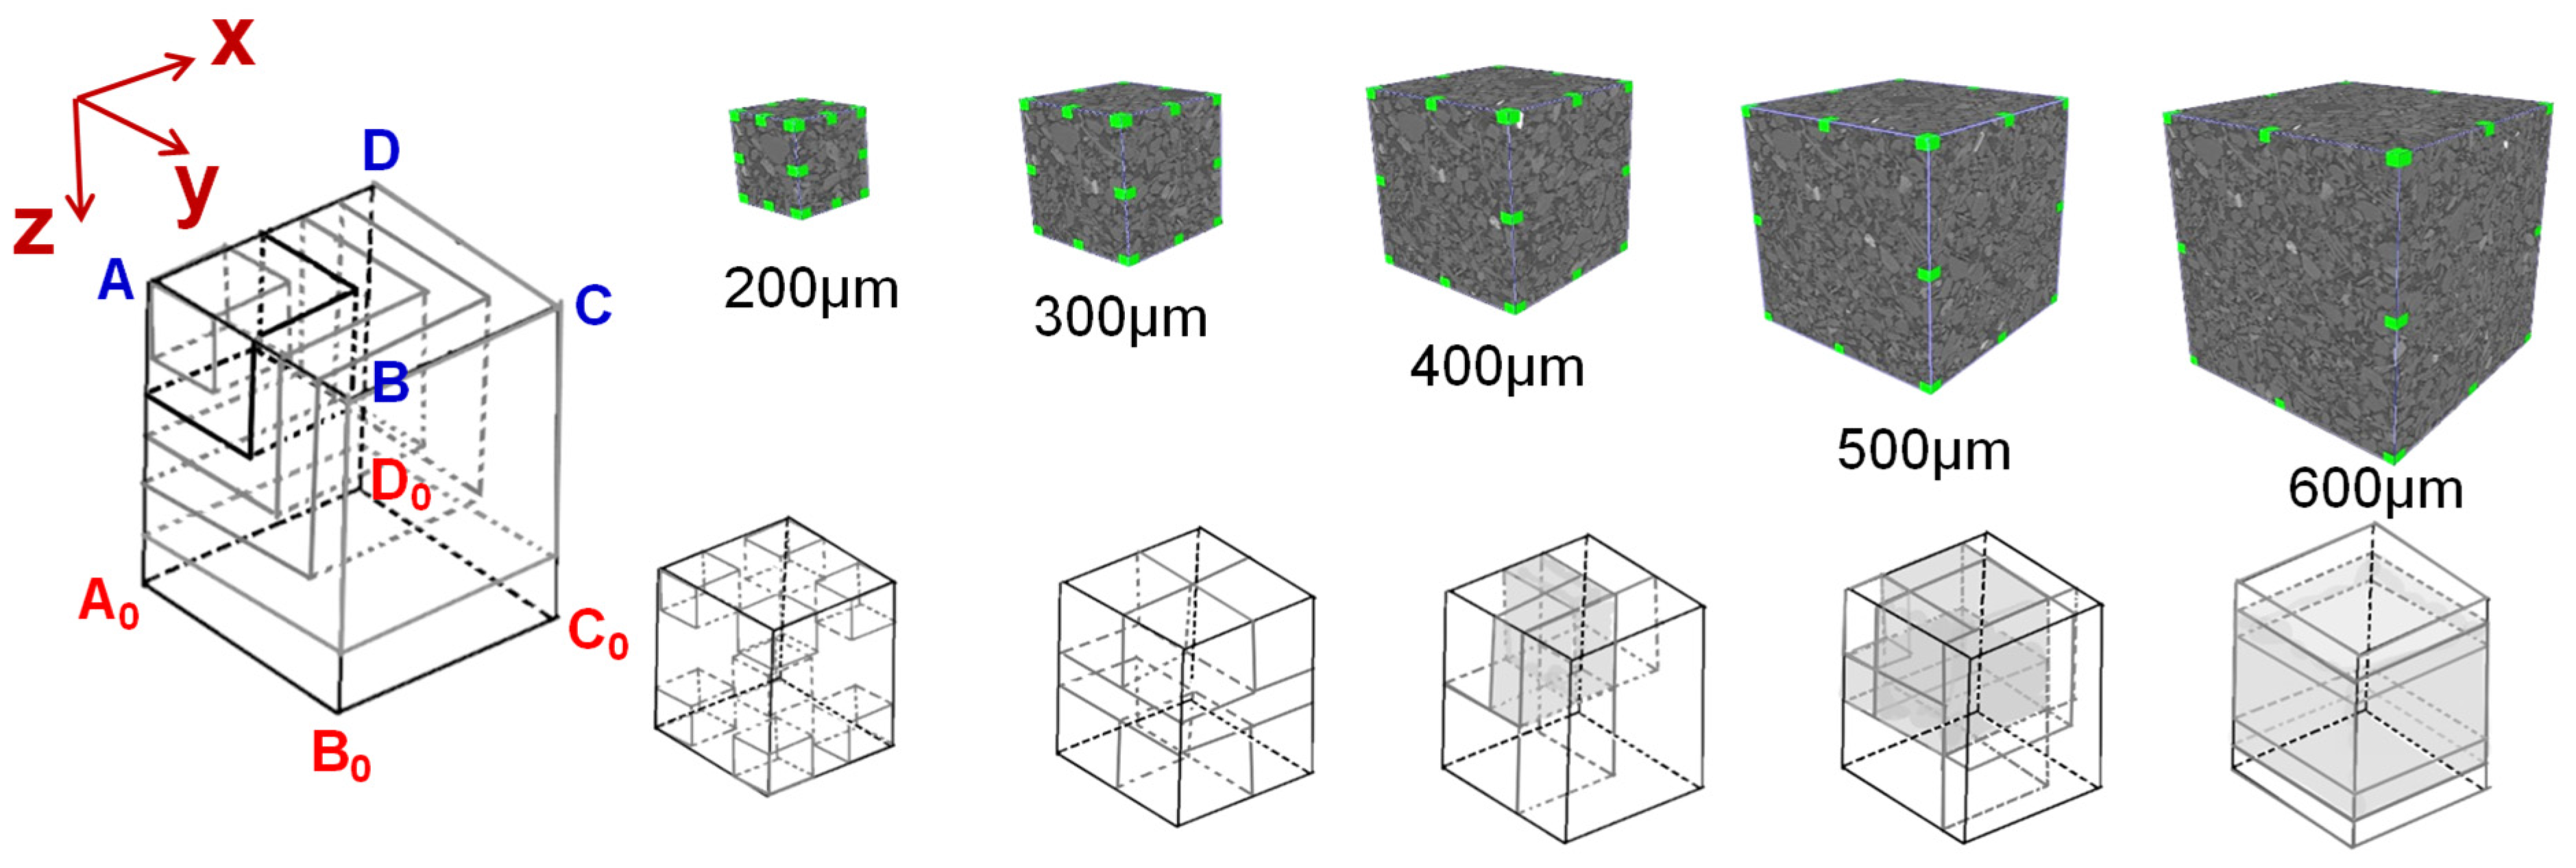
In this research, a high-resolution micro-CT scanner (ZEISS Xradia520 Versa, Institute of Geology and Geophysics, Chinese Academy of Sciences, Beijing, China) was employed to scan the specimens. This instrument offers a maximum resolution (volume pixel) of 0.35 μm. In this study, a scanning resolution of 1 μm was utilized and each specimen yielded 800 grayscale images, each containing 1,002,820 pixels (1015 × 988) with gray values ranging from 0 to 255. Following the combination of these grayscale images, 3D cylindrical micro-samples were reconstructed using the software Avizo 2020 (Figure 4a). Afterward, the 3D cylinder model was preprocessed using a Gaussian filter to enhance particle boundaries (Figure 4b), aiding in the subsequent threshold selection. To enable the following quantitative analysis of the 3D microstructure, a region-of-interest (ROI) was selected from the central portion of the 3D cylindrical micro-sample, consisting of a 600 μm × 600 μm × 800 μm cube (Figure 4c), which is the largest cubic region that could be extracted from the original 3D cylinder model.

2.3. Cube Partition

To determine the RVE of the 3D microstructure, the ROI cube was systematically cropped into different smaller cubes from 8 different positions, namely points A, B, C, D, A0, B0, C0, D0 in Figure 5. In each position, a new larger cube was generated along a specified direction with the side length increasing every 100 voxels until it reached the size of the ROI cube. This sub-volume selection scheme can be conceptualized as eight different growth regimes or self-similar regimes, wherein a small cube evolves into the original larger cube [48,49]. For each specimen, there are 42 cubes in total for the following quantitative analysis.

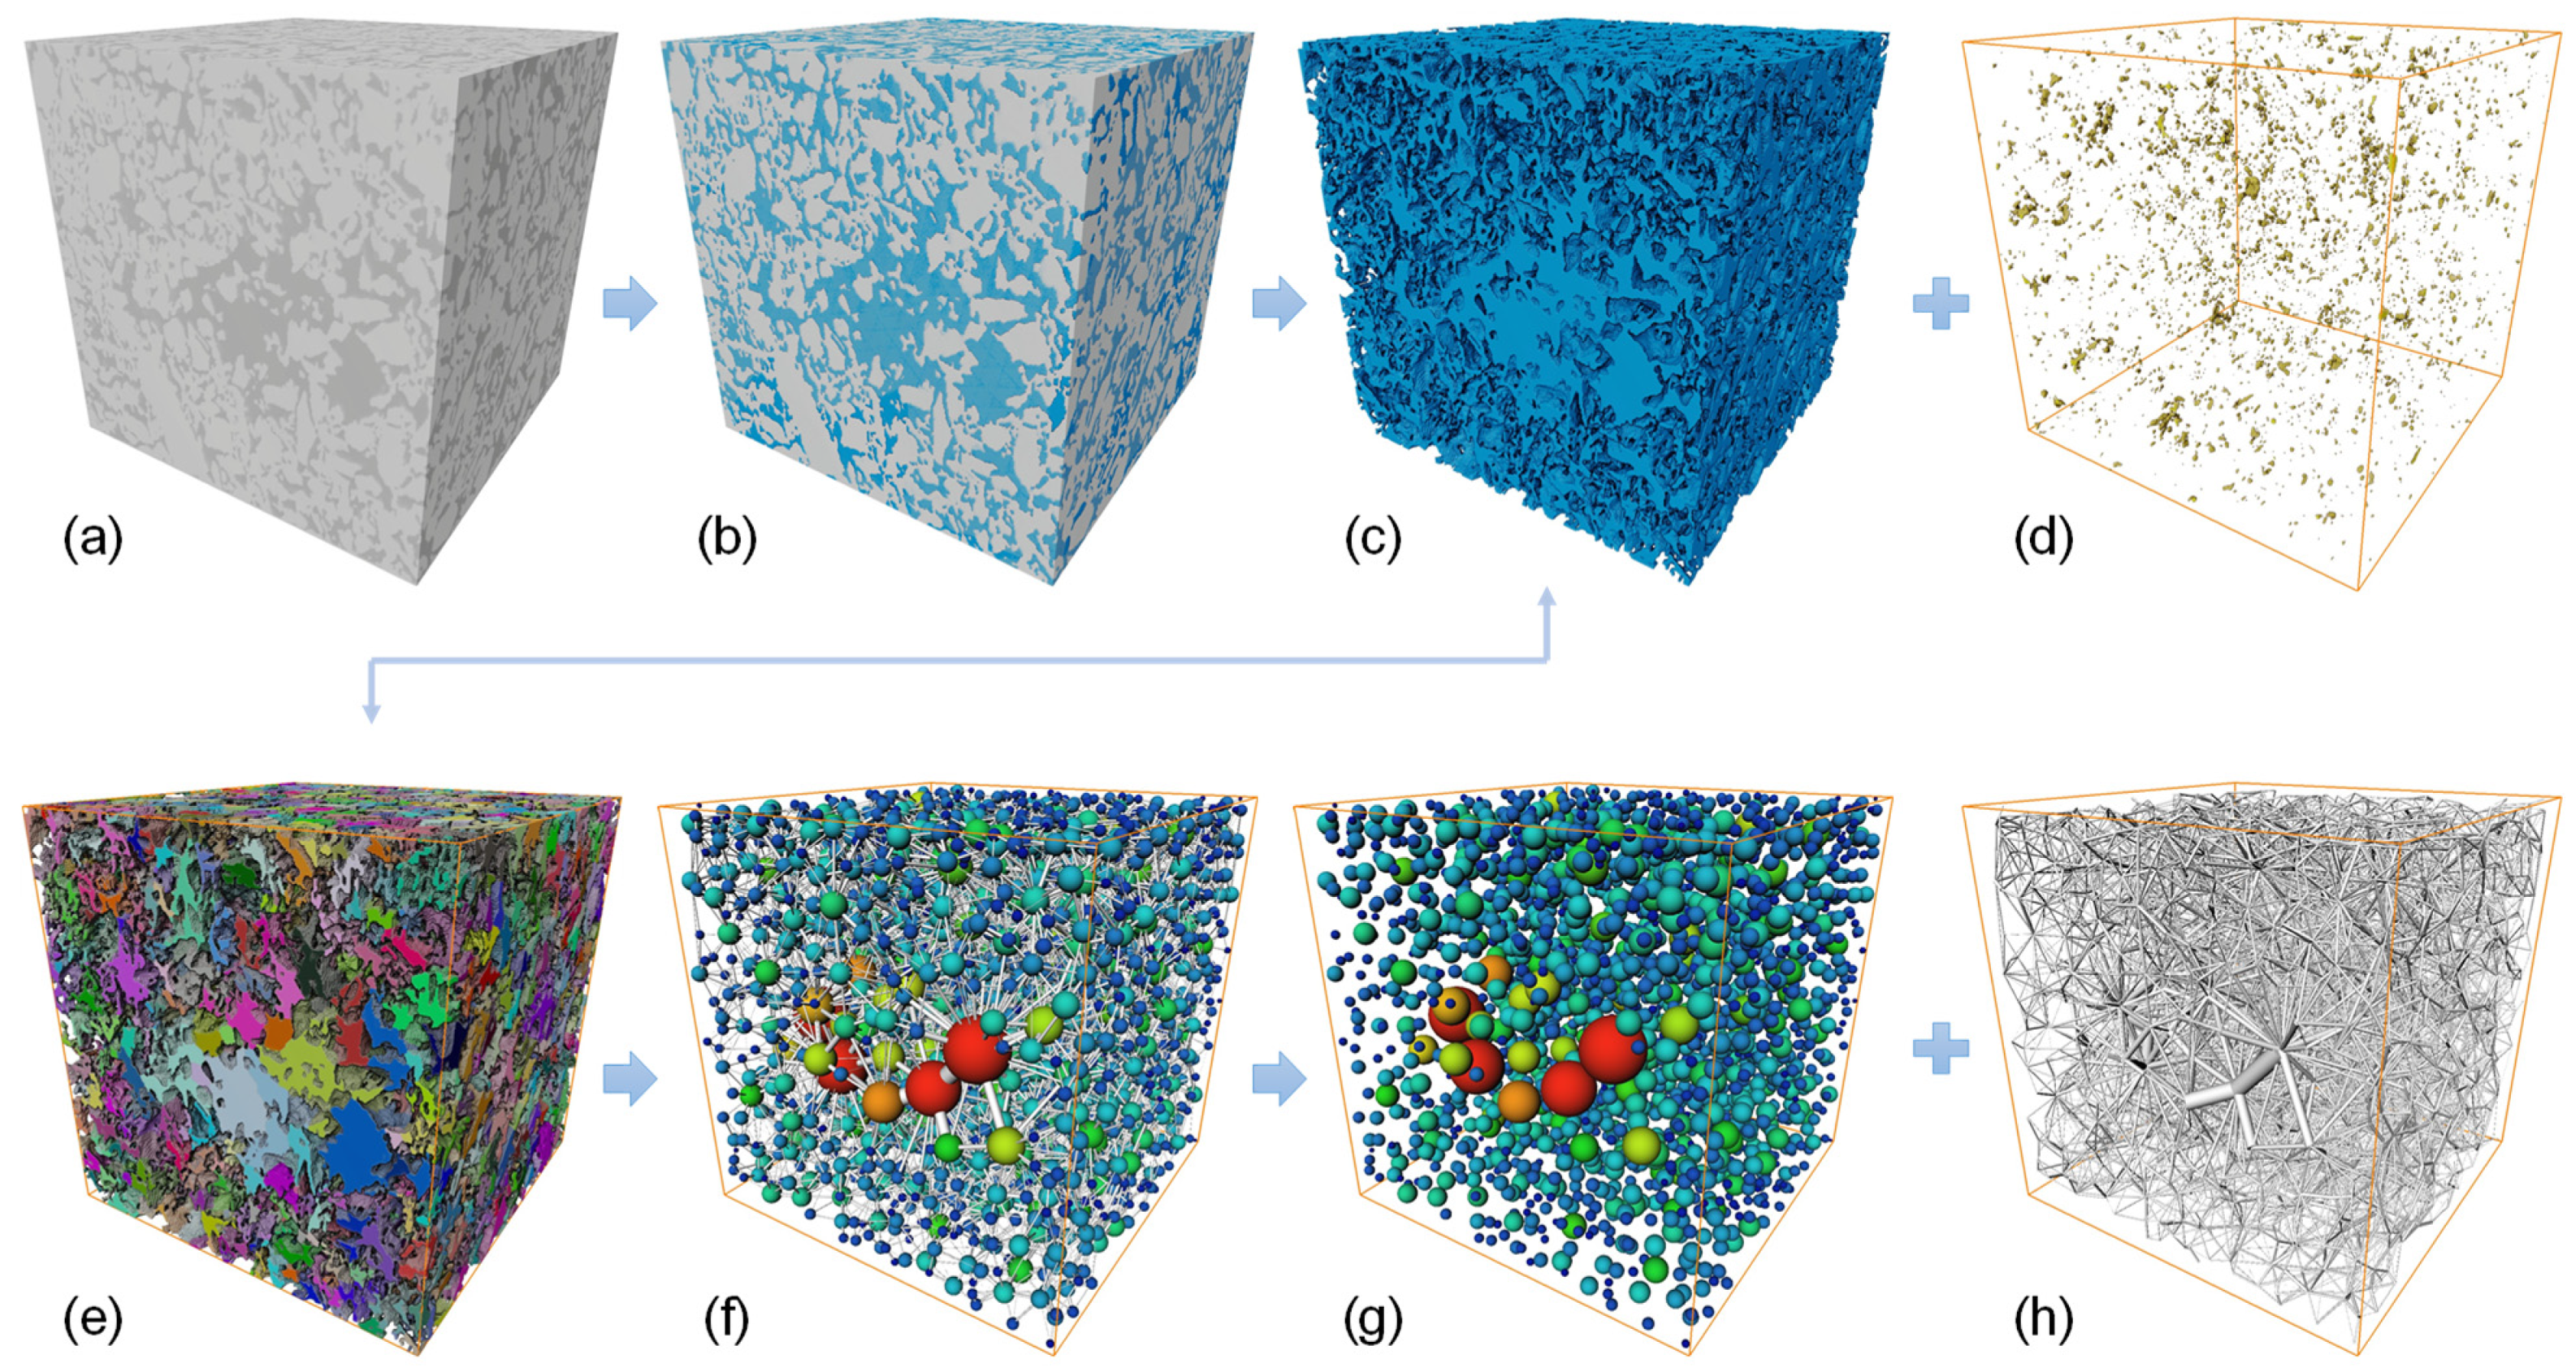
2.4. Data Processing

For each cube, grayscale images were semi-automatically binarized using an interactive watershed tool in combination with manual selection (Figure 6a). This human-involved approach provides more accurate differentiation of soil pores and particles compared to conventional segmentation methods. The binarized 3D microstructure was then processed to extract the pore structure (Figure 6b), which was further classified into connected pores (Figure 6c) and isolated pores (Figure 6d). The porosity (Po) refers to the ratio of pore voxels to all voxels. The connected porosity (Pc) is the ratio of connected pore voxels to all voxels, and the isolated porosity (Pi) is defined as the ratio of isolated pore voxels to all voxels.
Afterward, the connected pore space was segmented into individual pores using pore throats identified through the watershed algorithm in the Avizo software (Figure 6e). The pore throat is defined as the minimum contact area between two adjacent pores. Based on this segmentation, a pore network model was generated using the “pore network” command in Avizo (Figure 6f). In this model, the radius of each sphere corresponds to the radius of a sphere with the same pore volume, and the throats are modeled as cylinders connecting the pore centers. The cylinder radius matches the actual radius of the contact area (pore throat) between adjacent pores, and its length represents the linear distance between the centers of the two-pore spheres. Figure 6g illustrates the spherical pores in the pore network model, while Figure 6h depicts the pore throats. Rich information characterizing the 3D pore microstructure can be obtained from the pore network model, including the pore volume (Vp), pore equivalent radius (Rp), the coordination number (CN), throat equivalent radius (Rt), throat channel length (Lt) and so on. Vp refers to the number of voxels in a single pore. Rp is the radius of a sphere that corresponds to the pore volume. CN is the number of throats that are connected to a given pore, reflecting the connectivity of the specimen. The throat equivalent radius (Rt) refers to the radius of the smallest contact area between two connected pores. The throat channel length (Lt) is the distance between the centers of these two connected pores.
For subsequent analyses aimed at determining the representative volume element, the following parameters are considered: total porosity (Po), connected porosity (Pc), isolated porosity (Pi), average coordination number (CN), median of pore volume (MV), median of pore area (MA), median of pore equivalent radius (MR) and median of throat channel length (ML). The use of medians ensures robustness to extreme values and enhances the representativeness of the parameters in the distribution sequence.

3. Results

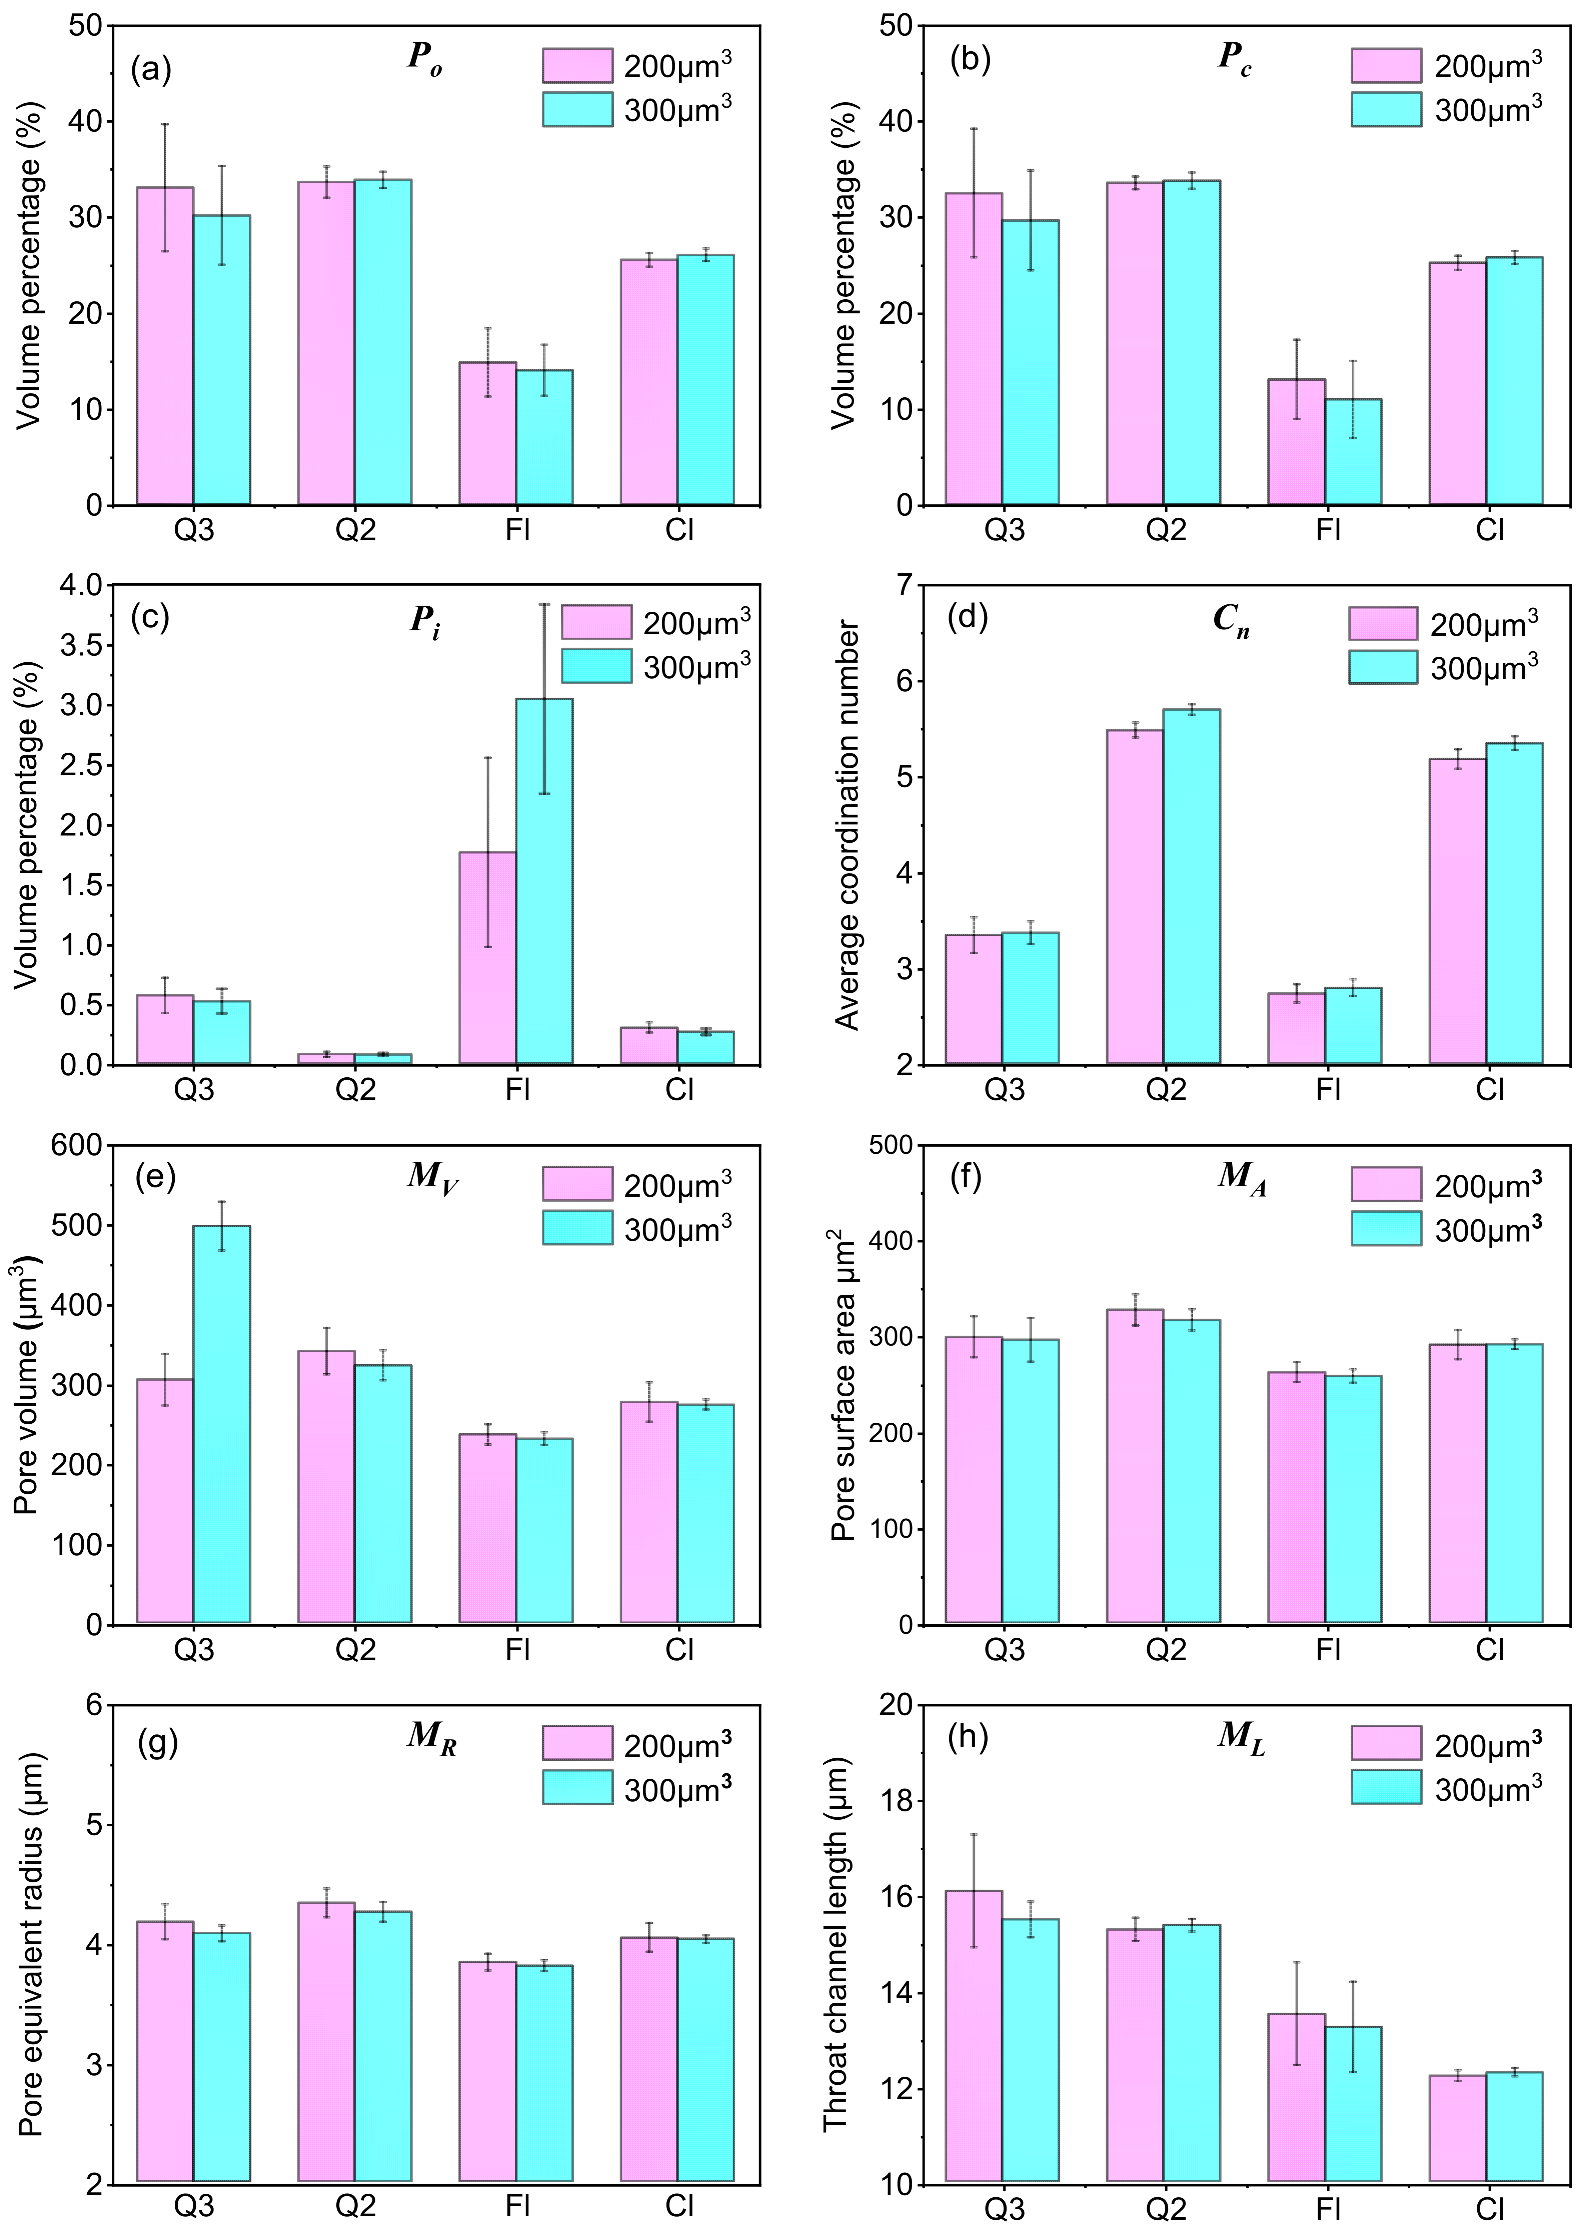
3.1. Pore Parameters’ Statistical Features of Cubes with Different Sizes

The statistical features of pore parameters (mean and standard deviation) for cubes with a specific size (e.g., 200, 300, 400, 500, 600 μm) were investigated to discern the variability in pore parameters at different positions. To avoid repetition, Figure 7 only presents the results of two cube sizes of 200 μm and 300 μm.
In Figure 7, the length of the error bar represents standard deviation and a shorter error bar means a more uniform pore structure. It is obvious that the length of the error bar decreases with an increase in the cube size, indicating reduced data dispersion for larger cubes. In addition, the Q2 and C1 specimens consistently exhibit shorter error bars compared to the Q3 and F1 specimens. These results suggest that the Q2 loess is more uniform than the Q3 loess even though they are both naturally formed soil. On the other hand, for the remolded loess, the C1 specimen typically has a more uniform structure than the F1. These differences may arise from their formation process and the dry density, which will be discussed later.
Interestingly, it is the Q2 specimen that exhibits the highest total porosity and connective porosity, rather than the Q3 loess, which has the largest void ratio (Figure 7a,b). This discrepancy may be attributed to differences in the presence of large pores whose diameters exceed the cubic size of the analysis and small pores with diameters less than 1 μm. For isolated porosity, the F1 specimen shows the highest value, followed in order by the Q3, C1, and Q2 specimens. Conversely, the coordination number (CN) exhibits an opposite trend, with the Q2 specimen having the highest value, followed by the C1, Q3, and F1 specimens. These results indicate that, despite its looser structure compared to the C1 specimen, the F1 loess has the poorest pore connectivity.
For the other pore parameters, i.e., the median of pore volume (MV), the median of pore area (MA), and the median of pore equivalent radius (MR), there is no apparent difference among these samples. The throat channel length (ML) typically decreases with the increase in dry density.

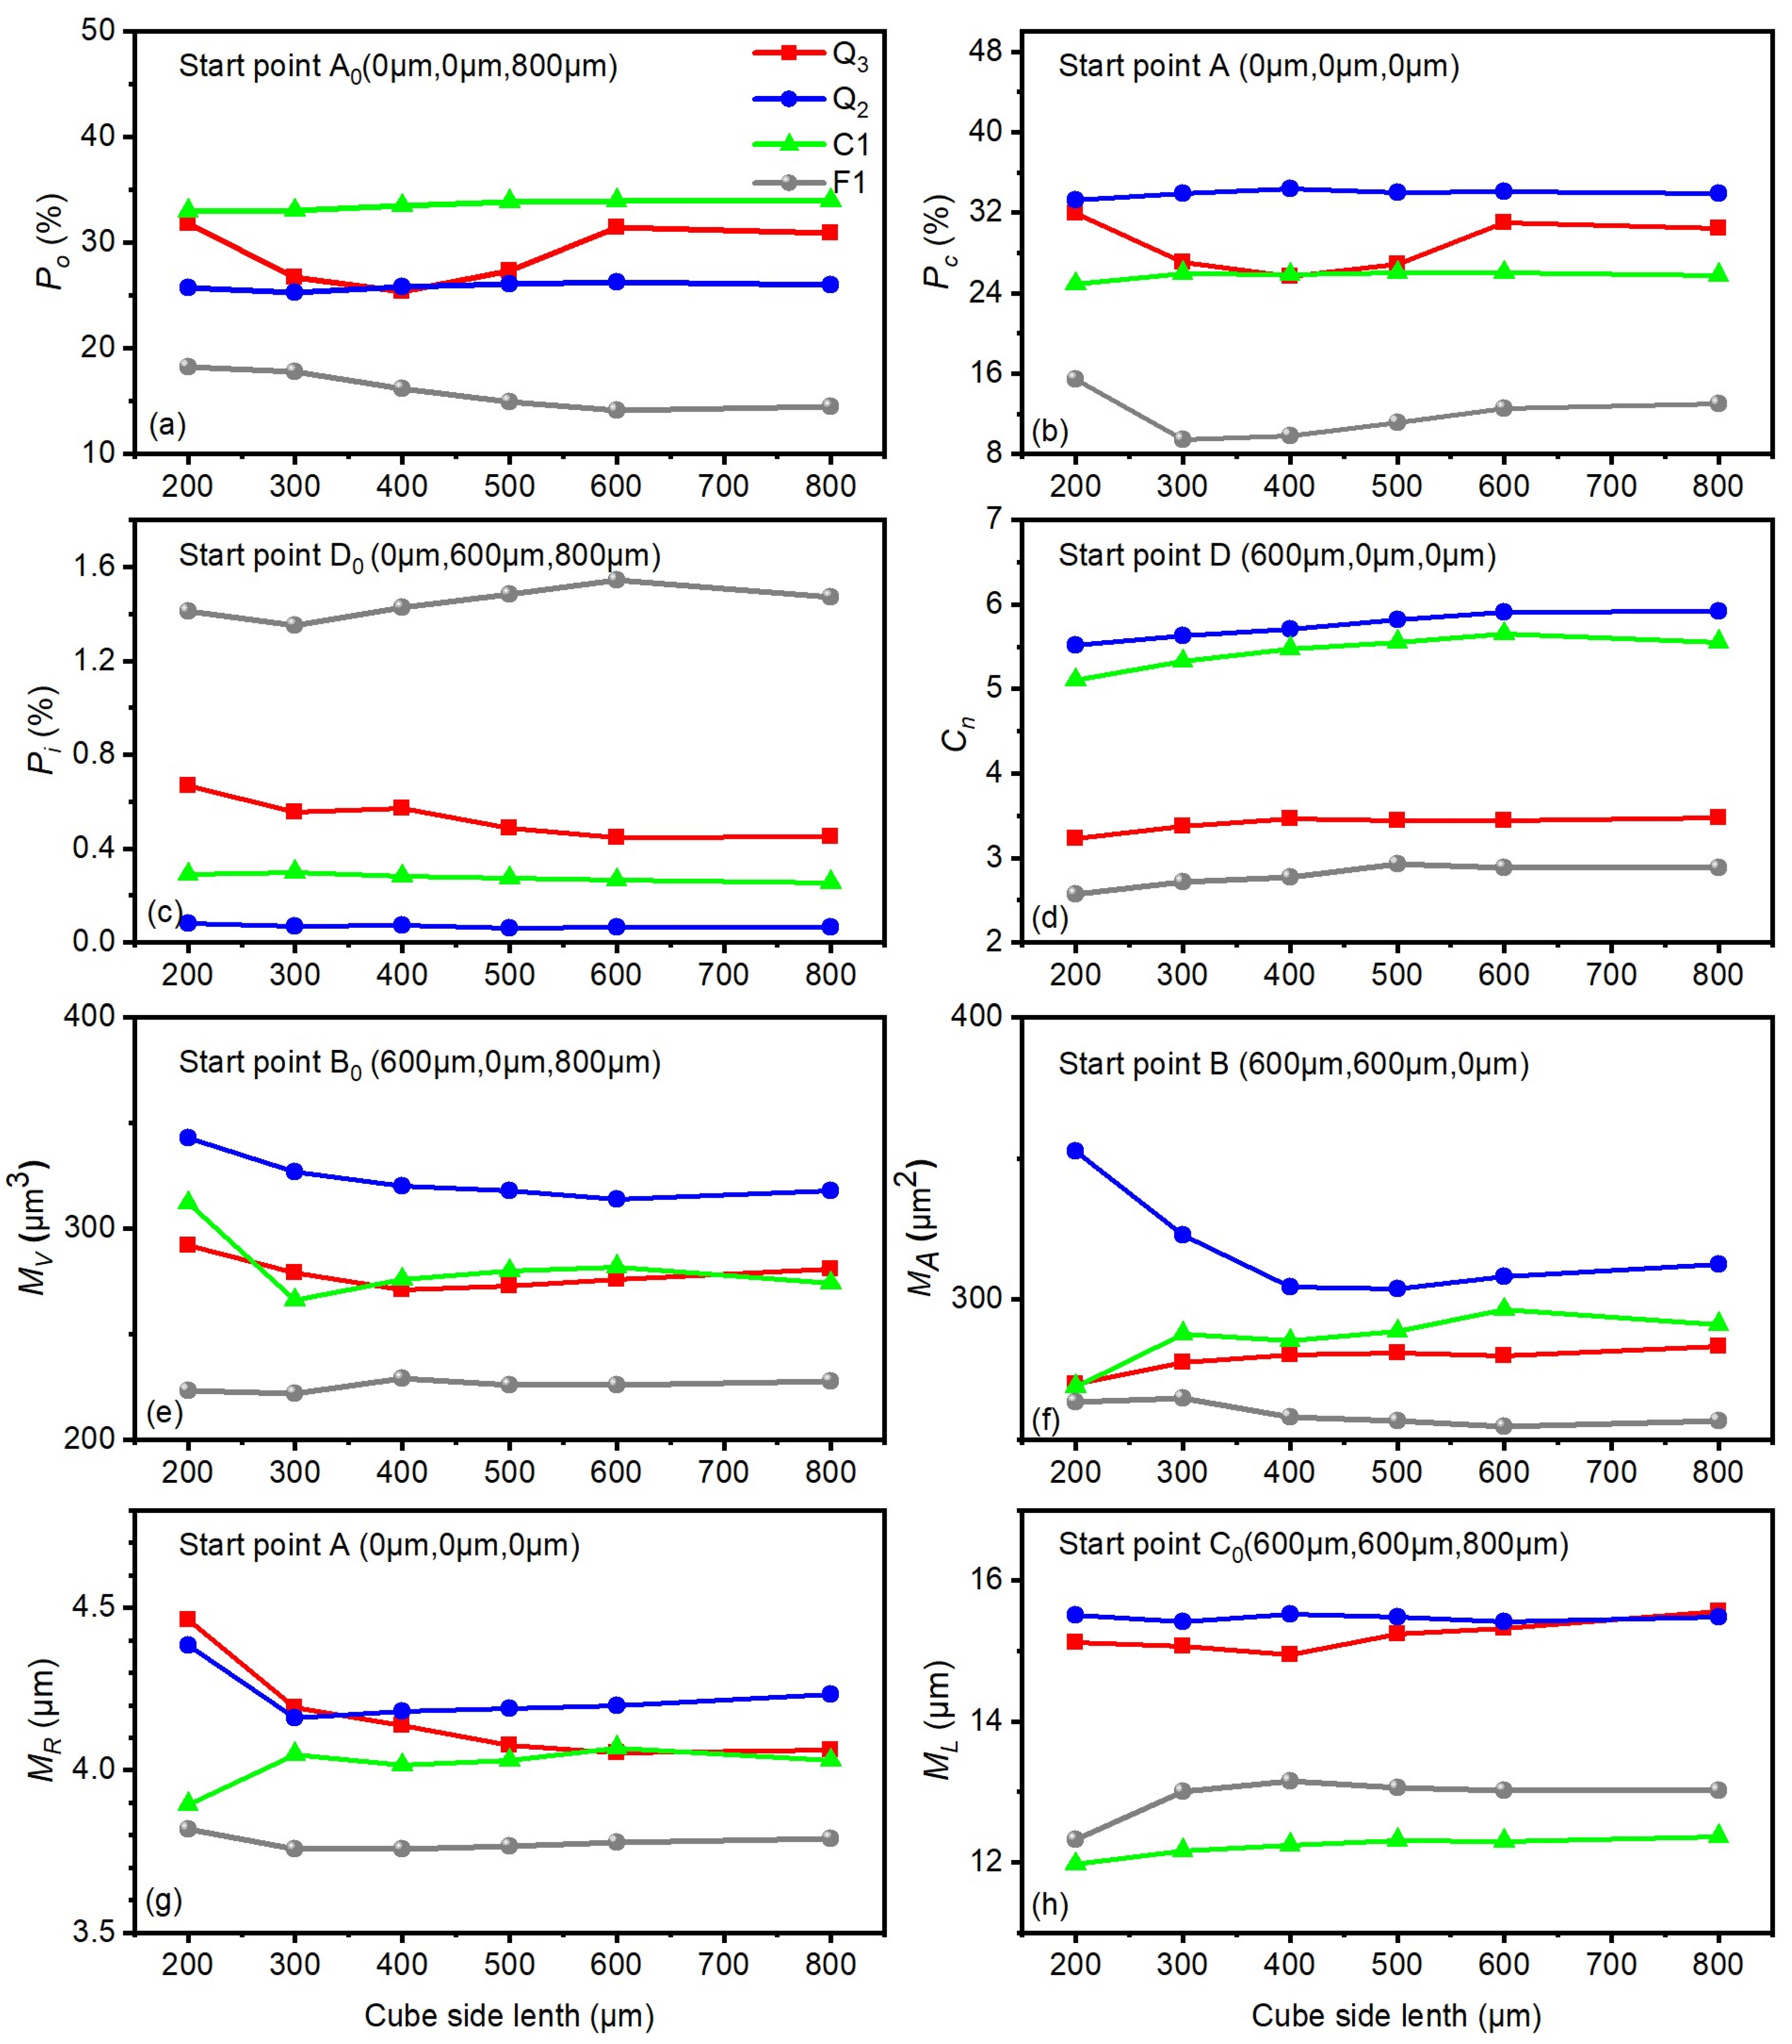
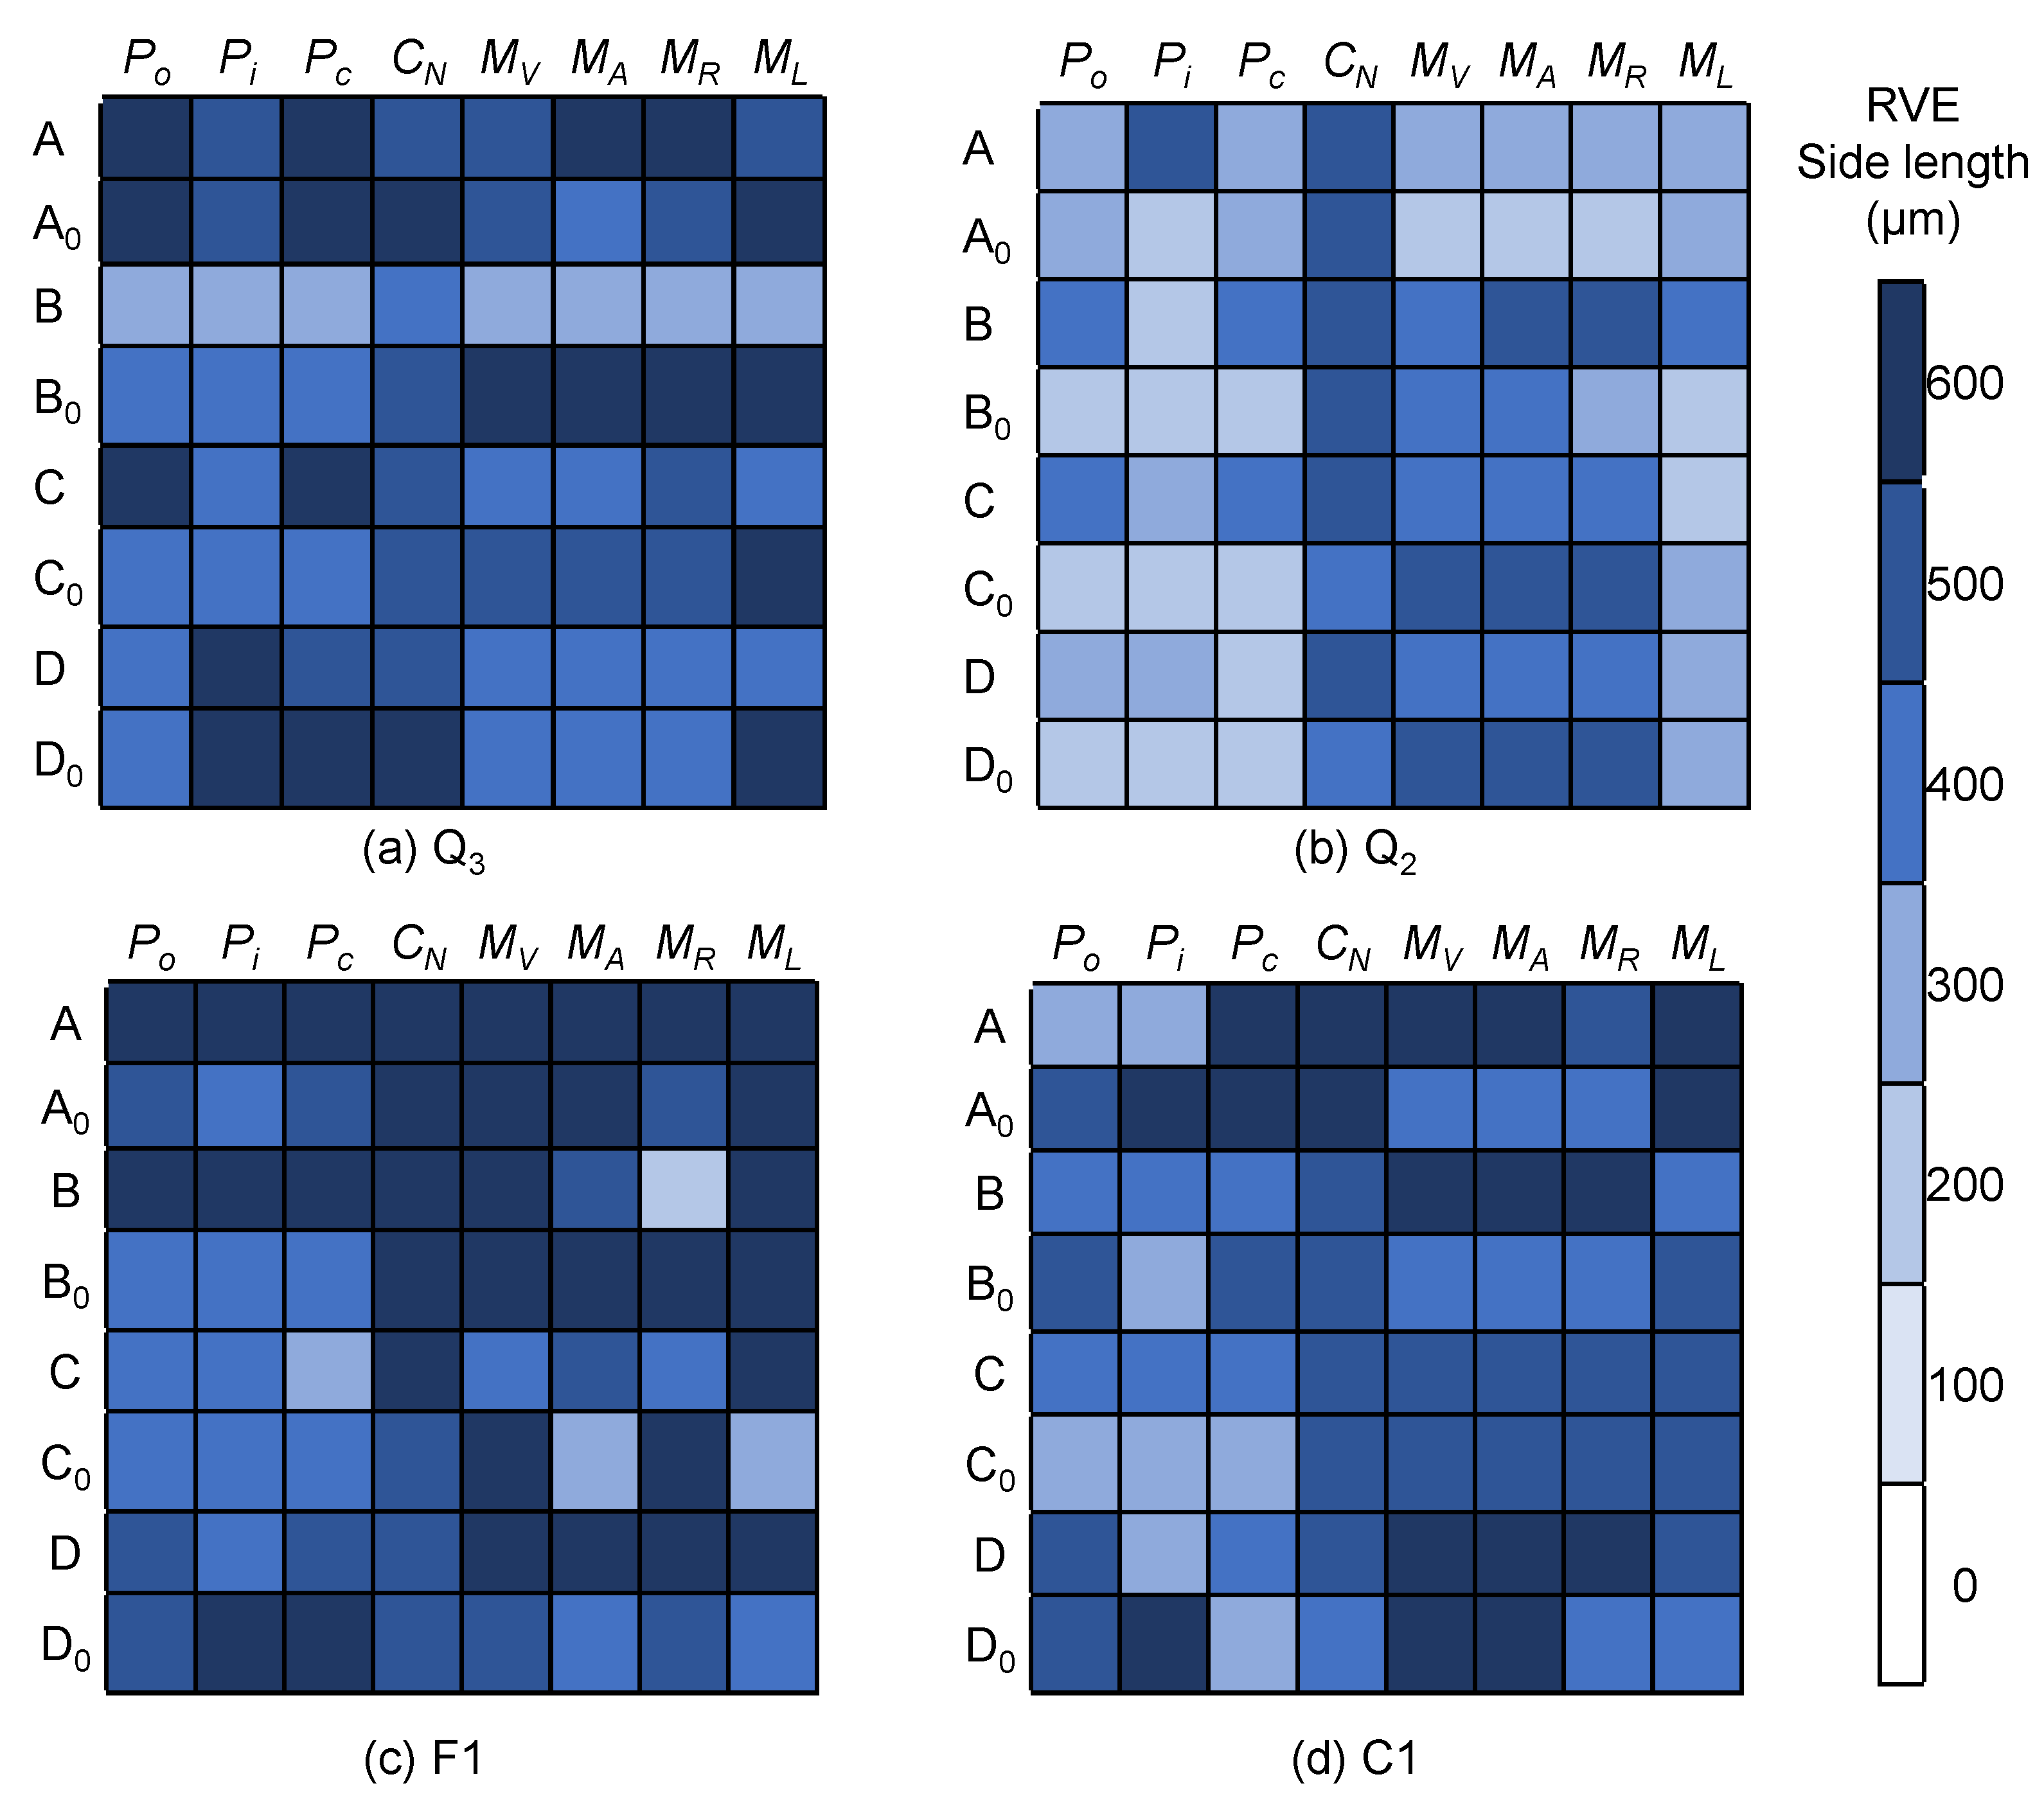
3.2. Determination of the REV Size

Figure 8 elucidates the variation characteristics of pore parameters versus cube sizes, with the x-axis denoting the side length of cubes and the y-axis representing the 3D pore parameters. Notably, erratic fluctuations manifest in the 3D parameters when the cube size is small (e.g., 200 μm). The fluctuations weaken with the increase in cube size and the pore parameters tend to reach a stable value. The minimum size in the x-coordinate in the stable state is defined at the RVE size.
Analysis of Figure 8 reveals the contributions of different pore parameters to distinct RVE sizes. For the Q2 specimen, the geometrical RVE size is determined as 400, 200, 500, 500, 500, 300, 300, and 500 μm, respectively based on the pore parameters of Po, Pc, Pi, CN, MV, MA, MR, and ML. For Q3 loess, the corresponding RVE size is 600, 600, 600, 500, 600, 400, 600, and 600 μm, respectively. Relying on a single pore parameter, such as total porosity or connected porosity, may lead to errors, primarily an underestimation of the RVE size.
Figure 9 shows all the results of the geometrical REV sizes based on different pore parameters. It can be observed that the REV size varies with both the pore parameters and the starting point of the extracted cubes. Generally, the prevalence of smaller RVEs (e.g., light blue in Figure 9) is pronounced in Q2, signifying a more uniform microstructure. In contrast, the frequency of small RVEs or light blue elements amplifies for the specimens of Q3, C1, and F1, indicating a more uniform structure of intact loess than the remolded ones. The RVE size for Q2 specimen is 500 μm, whereas for other specimens, it is 600 μm.
To validate the reliability of the REV size, we compared the pore size distribution (PSD) curves of the ROI cube and the initial 3D cylinder with those of the geometric RVE cubes. As shown in Figure 10, the PSD curves for the different geometric RVE cubes align closely with those of the ROI cubes and the 3D cylinder model. Thereby, the current geometric RVE sizes can be considered reliable.

3.3. Pore Characteristics of the Intact and Remolded Loess

For a more in-depth analysis of the 3D microstructural disparities between intact and remolded loess, the RVE cube with a size of 600 μm was selected to conduct quantitative comparative statistics of pore equivalent diameter distribution and throat equivalent diameter distribution. To ensure data consistency, the cube size of the Q2 specimen used here shares the same size of 600 μm as the other specimens.

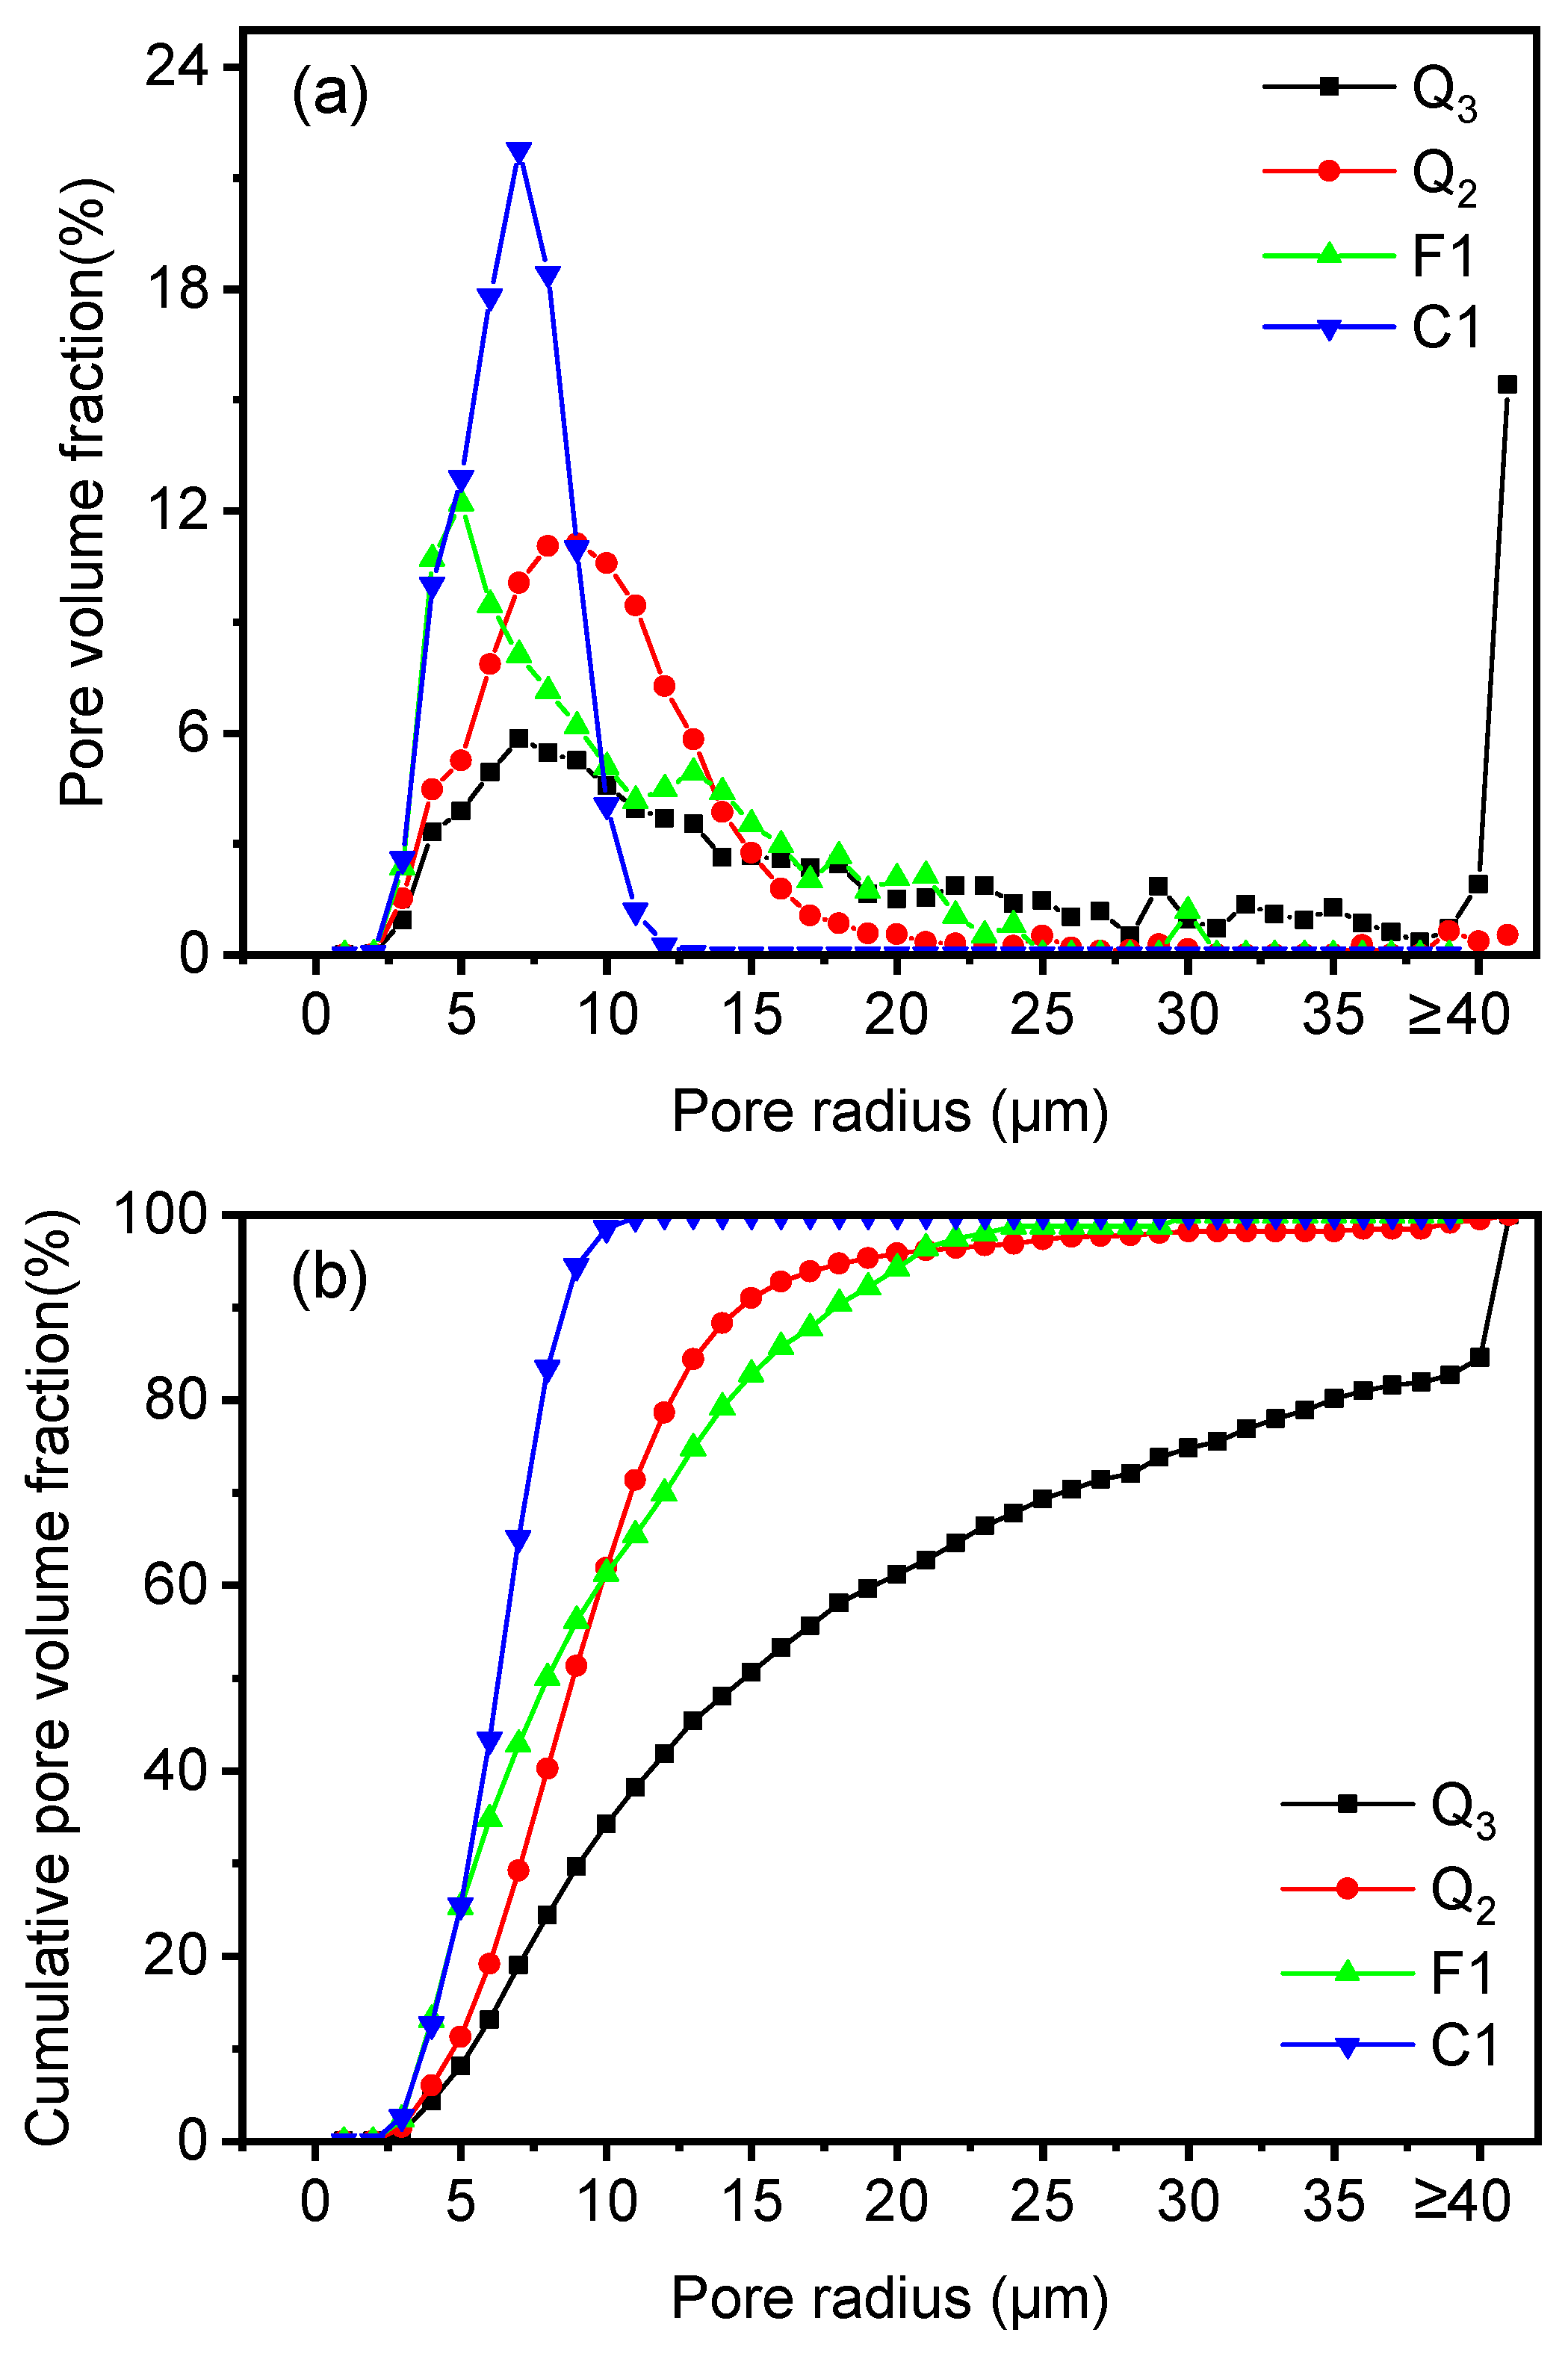
3.3.1. Pore Size Distribution

Figure 11 illustrates the pore size distribution characteristics of the intact and remolded specimens. In this figure, the volume percentage represents the ratio of the total volume of pores with a specific equivalent pore radius to the total volume of pores across all diameters. The pore size distribution of the C1 specimen is the most concentrated, primarily ranging between 3 and 12 μm, with the pores having the highest volume content at the radius of 6 μm (Figure 11a). The F1 specimen’s pores are mainly distributed between 3 and 24 μm, with a significant proportion between 3 and 10 μm. The pores in the Q2 specimen are also concentrated, ranging from 3 to 19 μm, with the most volume fraction at the radius of 10 μm. In contrast, the Q3 specimen exhibits a more uniform pore distribution. Its small pores (3–10 μm) are significantly fewer than those in the other specimens, while its large pores (>25 μm) are much more prevalent. Notably, pores with radius greater than 40 μm account for an astonishing 20% of the total pore volume (Figure 11b), highlighting the extremely loose structure of the Q3 loess.

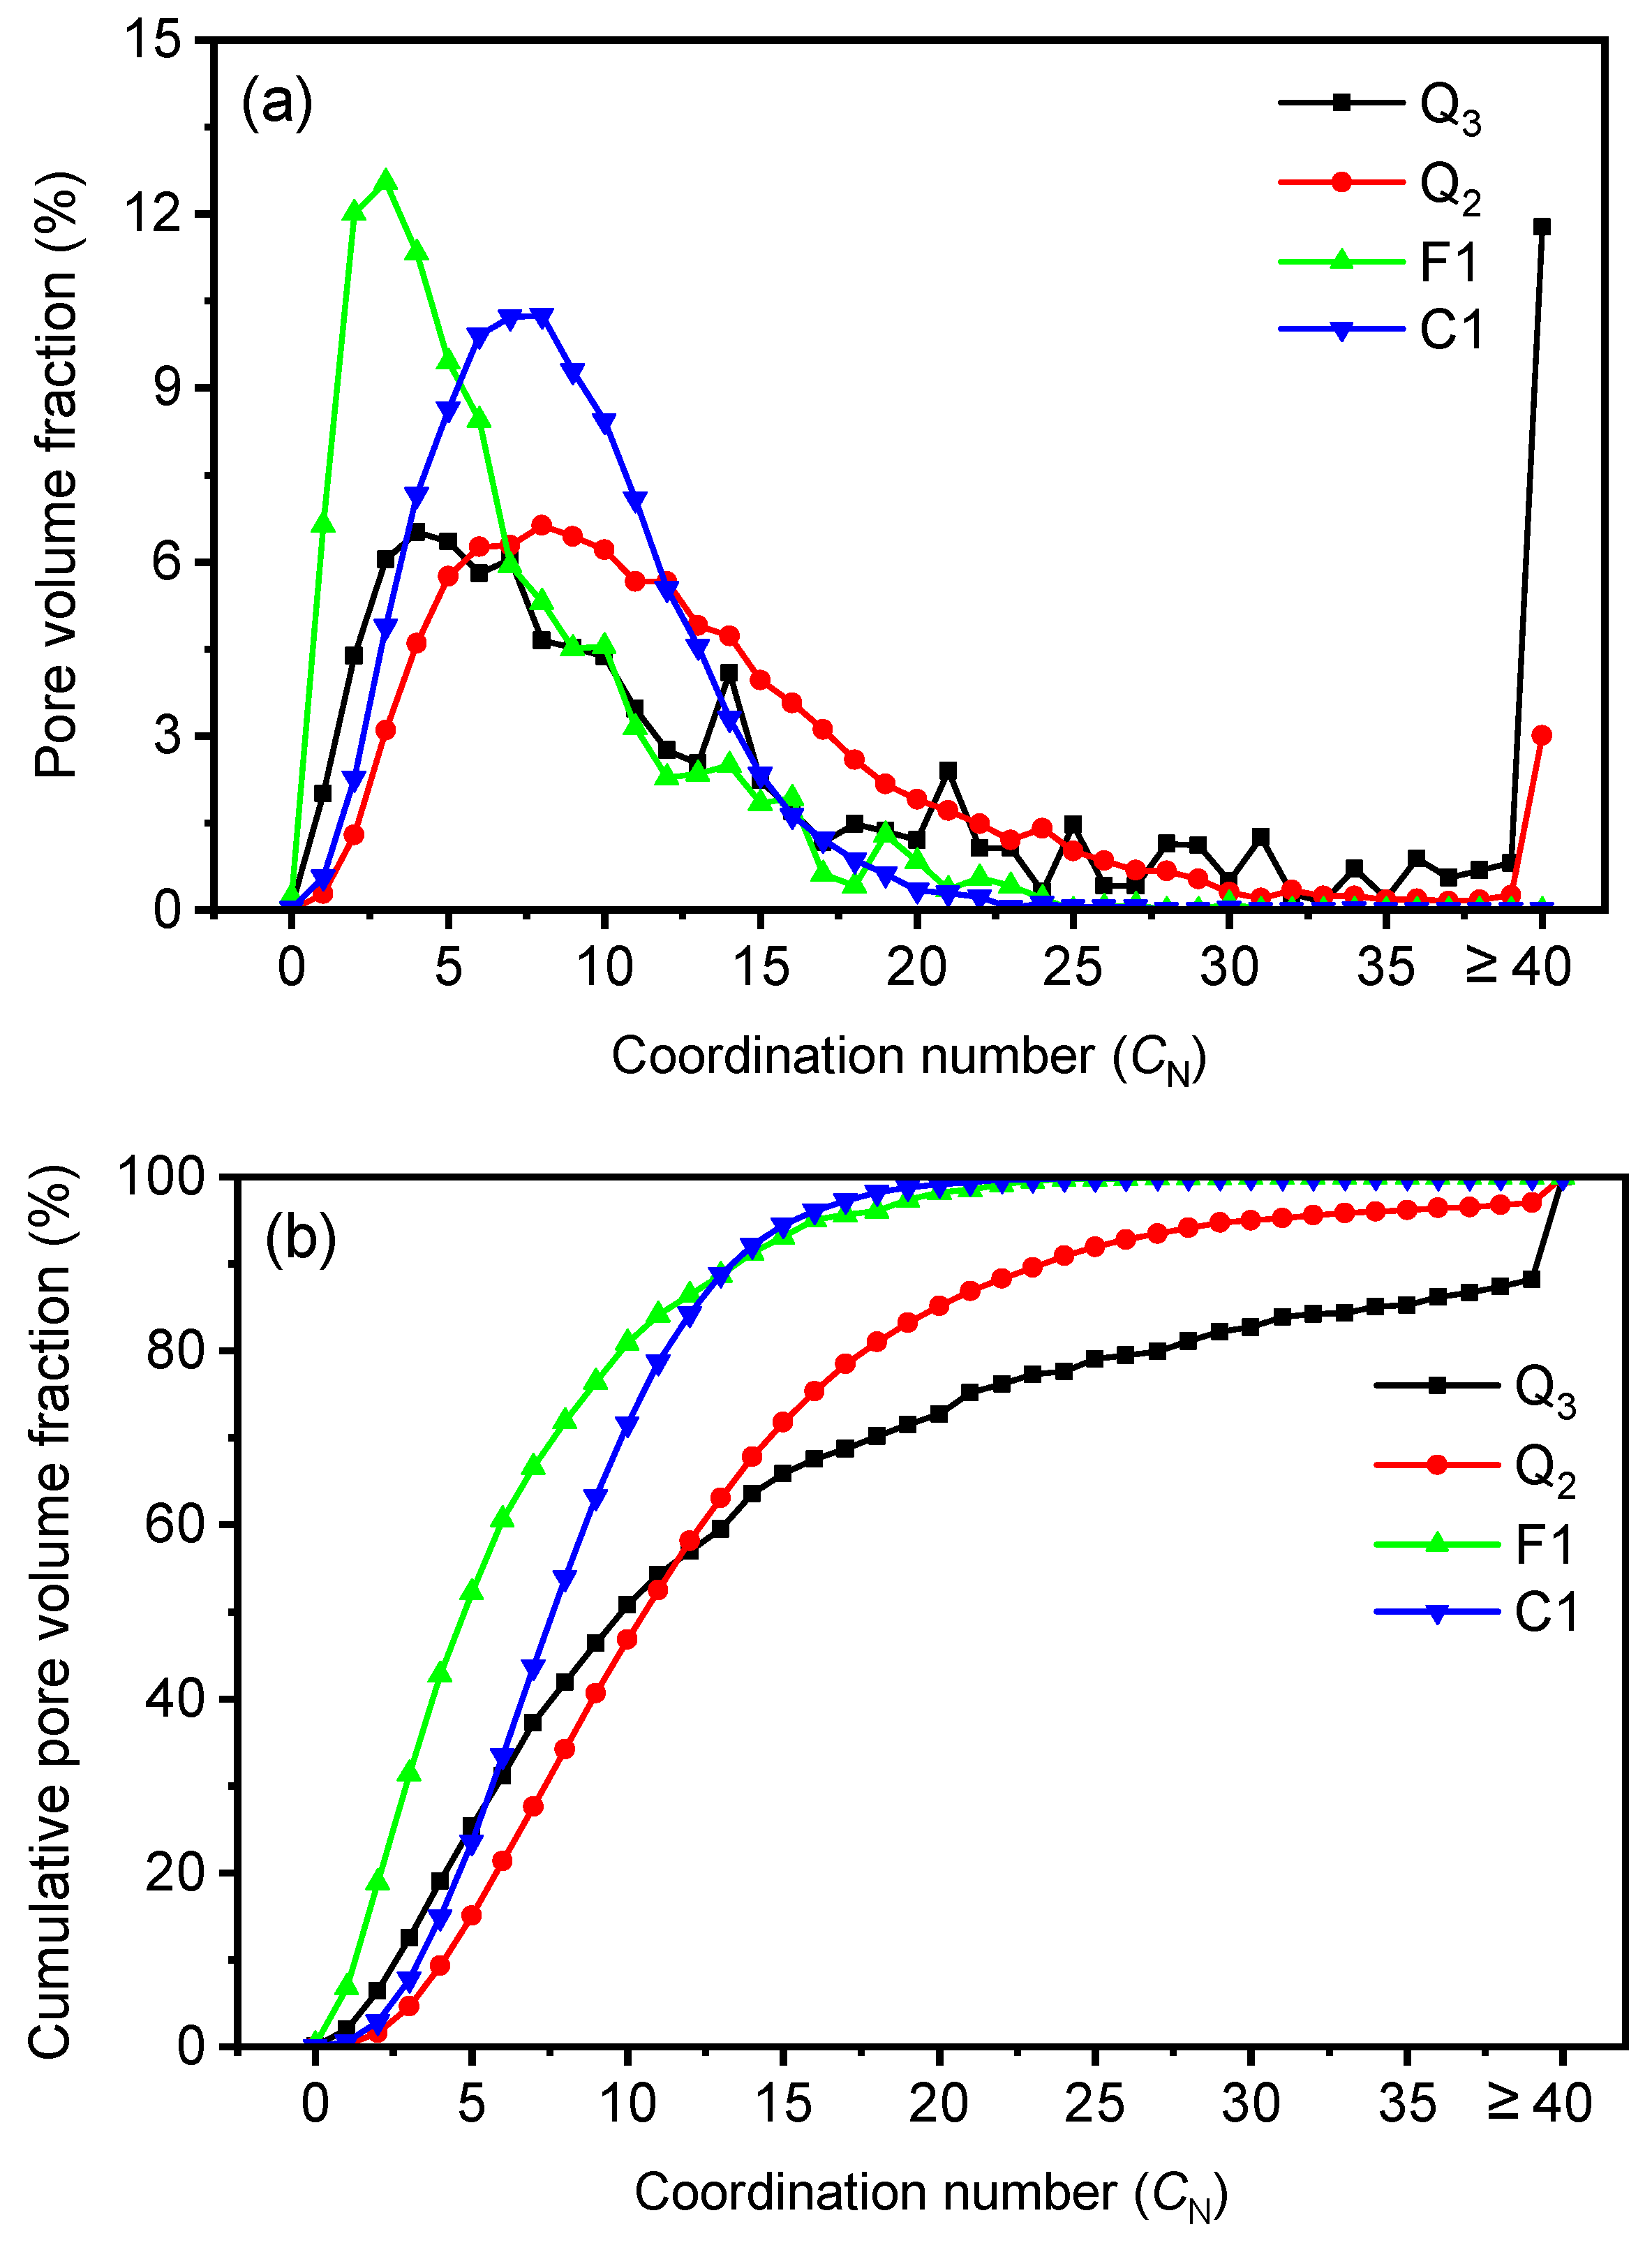
3.3.2. Pore Connectivity
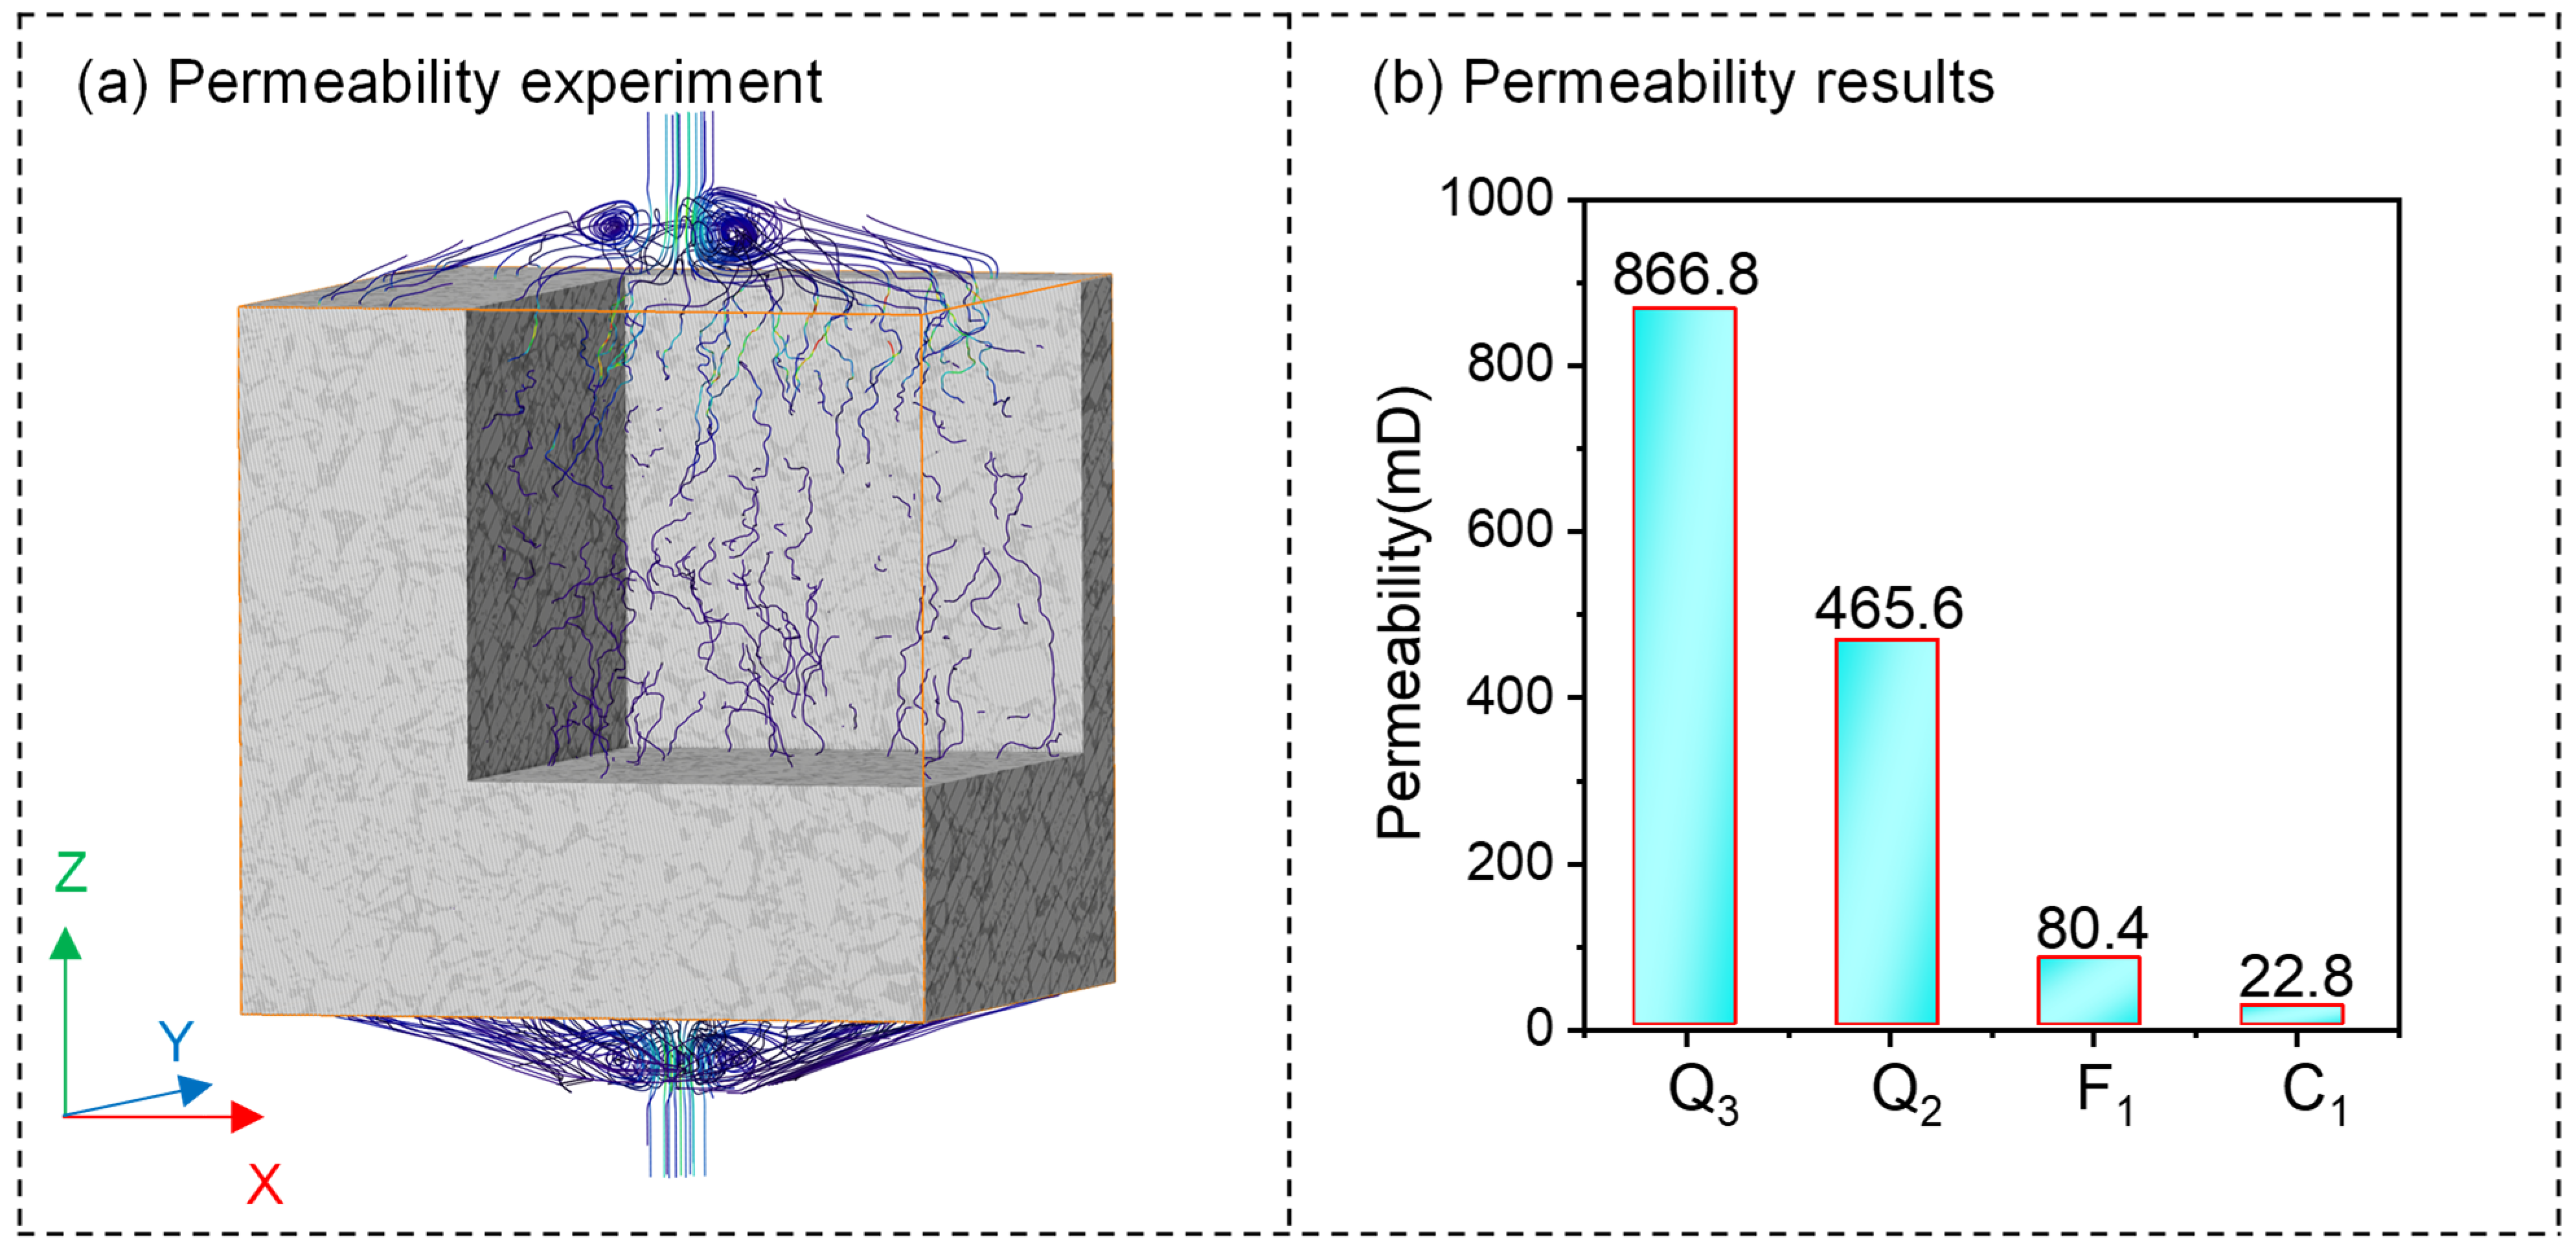
The permeability of a specimen is significantly influenced by pore connectivity, which is quantified locally by the coordination number (CN), indicating the degree to which a pore is connected to its neighboring pores. Figure 12 presents the distribution characteristics of CN for the intact and remolded specimens. In this figure, the y-axis represents the pore volume fraction (Figure 12a) and cumulative pore volume fraction (Figure 12b) corresponding to each specific coordination number.
It is observed that the F1 specimen exhibits a higher pore volume percentage when the CN ranges from 0 to 5, suggesting that most of the soil pores have low CN values and further poor connectivity. The C1 loess shows the largest pore volume when the CN ranges from 5 to 10. The Q2 loess has a greater pore volume when the CN ranges from 10 to 30. Conversely, when CN exceeds 30, the Q3 loess has a higher pore volume. These findings indicate that the pore connectivity of the Q3 loess is the highest, followed in order by the Q2, C1, and F1 specimens.

3.3.3. Permeability

Using the permeability module in the Avizo software, permeability tests were conducted. By applying water head pressures of 110 kPa and 10 kPa to the top and bottom surfaces of the RVE (Figure 13a), the permeability was calculated through steady-state analysis. The findings (Figure 13b) reveal that the Q3 loess exhibits the highest permeability, followed by Q2, F1, and C1 specimens. Notably, the permeability of the F1 specimen is approximately four times higher than that of C1, despite its lower pore connectivity (Figure 12). This discrepancy is attributed to the significantly smaller overall pore size in C1 compared to F1 (Figure 11). For saturated soils, connected large pores have a substantial impact on overall permeability [51]. In other words, the macro-level hydraulic permeability is highly related to the connection of large pores. This result is consistent with the Hagen-Poiseuille law where the flow rate in a cylindrical channel is proportional to the square of the channel diameter [20].

4. Discussion

Comparison of the pore parameters reveals significant differences in the pore structure of the intact and remolded specimens formed through different processes. Overall, intact loess generally exhibits a more uniform structure with better pore connectivity compared to remolded loess. The Q3 loess shows higher connectivity and greater heterogeneity than Q2. Additionally, the heterogeneity of the F1 remolded loess is more pronounced with the poorest connectivity. These characteristics are visually illustrated in Figure 14.
For the Q3 loess, large pores exhibit a heterogeneous distribution across all three directions (XY, XZ, and YZ projections) (Figure 14a), which enhances pore connectivity. For the F1 specimen, the heterogeneity is particularly pronounced, with grain-concentrated regions observable in the XY, YZ, and XZ directions. In contrast, the pores in the Q2 loess are evenly distributed, contributing to a more uniform microstructure. The C1 specimen, due to its higher dry density, is more compacted.
It is observed that there exists a “space pore” or “overhead pore” both in the Q3 and Q2 loess, which has a diameter larger than the surrounding particles [36,52]. These voids are created by the loose accumulation of particles. It can sustain stability under natural dry conditions. However, the structure may lose stability under pressure and water infiltration conditions, which weakens the bonding or connection strength between particles, causing particles around the pores to collapse into the voids, and leading to collapse deformation [36,39,52]. The prevalence of the overhead pore in the Q3 loess implies an under-compacted state with low strength and stiffness. In comparison, the Q2 has a more dense and uniform structure with fewer space pores. The Q2 loess experiences long-term evolution under the influence of climate factors (i.e., precipitation, evaporation), biological activity, etc. The infiltrating water can dissolve soluble salts, causing transportation and reprecipitation of calcium carbonates and reinforcing existing pores through cementation [53,54]. The prolonged period of water seepage promotes the formation of connected pores [55], contributing to a more uniform and connective structure.
On the other hand, the remolded loess is more compacted with smaller pores. The F1 specimen from the GMRL site has more isolated pores, more heterogeneous structure, and poorer connectivity than the C1 specimen from the MECC project. For the remolded loess in the GMRL project, the soil was not uniformly and systematically compacted before utilization (e.g., planting [9,13]). The soil underwent complex wet-dry cycles and was influenced by plant root systems, leading to numerous particle aggregates, isolated pores, and poor pore connectivity. In contrast, at the MECC site, the remolded loess underwent standardized compaction treatments, and external force was applied to achieve the desired state.

5. Conclusions

In this paper, 3D microstructures of intact Q3, Q2 loess, and remolded loess (i.e., F1, C1) from the GMRL project and MECC project in the Loess Plateau were established using micron-scale computed tomography. Through quantitative analysis and comparison of the 3D microstructure volumes of different sizes, several key conclusions were drawn:
  • A robust workflow for determining the representative volume elements (RVE) of intact and remolded loess is introduced. In general, the intact loess has the smallest RVE size. 600 μm × 600 μm × 600 μm cube is the smallest size to analyze the 3D microstructure;
  • Intact loess has more overhead pores, contributing to the formation of pore channels. Additionally, intact loess displays a more uniform microstructure and superior connectivity compared to remolded specimens;
  • Remolded loess is much more compacted than intact loess, with the loess from the MBCC project showing greater uniformity than that from the GMRL project;
  • The significant difference in the microstructure of intact and remolded loess is attributed to the substantial variations in their formation processes.
These results are of urgent practical and scientific significance to understand the difference between compacted loess and natural loess or remolded loess from macro and micro multi-scale, to systematically study the evolution mechanism of the three-dimensional microstructure of compacted loess under the action of water and force, and to reveal the micromechanical behavior and deformation mechanism of compacted loess, which helps to provide a scientific and reasonable theoretical basis for the foundation stability evaluation of GMRL and MECC project in loess area.

Author Contributions

L.M.: Investigation, Data curation, Formal analysis, Writing—original draft, Writing—review and editing. L.Z.: Investigation, Methodology, Project administration, Writing—review and editing. X.H.: Project administration, Writing—review and editing. S.G.: Investigation, Writing—review and editing. S.Q.: Conceptualization, Funding acquisition, Supervision, Investigation, Review and editing. All authors have read and agreed to the published version of the manuscript.

Funding

This research was funded by National Natural Science Foundations of China, grant numbers 42141009 and 42107188.

Institutional Review Board Statement

Not applicable.

Informed Consent Statement

Not applicable.

Data Availability Statement

The raw data supporting the conclusions of this article will be made available by the authors on request.

Acknowledgments

The authors wish to offer their great gratitude and regards to senior engineer Guoliang Li from Institute of Geology and Geophysics, Chinese Academy of Sciences for his technical support, and the reviewers and the editors for their valuable comments.

Conflicts of Interest

The authors declare no conflicts of interest.

References

  1. Derbyshire, E. Geological hazards in loess terrain, with particular reference to the loess regions of China. Earth Sci. Rev. 2001, 54, 231–260. [Google Scholar] [CrossRef]
  2. Li, Y. A review of shear and tensile strengths of the Malan Loess in China. Eng. Geol. 2018, 236, 4–10. [Google Scholar] [CrossRef]
  3. Ma, P.H.; Peng, J.B.; Wang, Q.Y.; Zhuang, J.Q.; Zhang, F.Y. The mechanisms of a loess landslide triggered by diversion-based irrigation: A case study of the South Jingyang Platform, China. Bull. Eng. Geol. Environ. 2019, 78, 4945–4963. [Google Scholar] [CrossRef]
  4. Liu, D.S. Loess and Environment; Science Press: Beijing, China, 1985. [Google Scholar]
  5. He, C.X. How to develop modern agriculture on the basis of Gully management and land reclamation in Yan’an City. J. Yan’an Univ. (Soc. Sci. Ed.) 2013, 35, 60–63. (In Chinese) [Google Scholar]
  6. Li, P.; Qian, H.; Wu, J. Environment: Accelerate research on land creation. Nature 2013, 510, 29–31. [Google Scholar] [CrossRef]
  7. Ma, L.; Qi, S.; Guo, S.; Huang, Q.; Hou, X.; Zhang, L. Investigation on the Deformation and Failure Patterns of Loess Cut Slope Based on the Unsaturated Triaxial Test in Yan’an, China. J. Earth Sci. 2024, 35, 235–247. [Google Scholar] [CrossRef]
  8. Qi, S.W.; Hou, X.K.; Yu, Y.T.; Zhang, Y.G.; Hu, X.; Zhang, L.X.; Li, Z.Q.; Guo, S.F.; Zhang, F.Y.; Li, T.L.; et al. Collapse and subsidence mechanism of compacted loess and suitability of mountain bulldozing and city creation projects in the Loess Plateau of China. Chin. Sci. Bull. 2023, 68, 1844–1860. [Google Scholar] [CrossRef]
  9. Liu, Y.S.; Li, Y.R. Engineering philosophy and design scheme of gully land consolidation in Loess Plateau. Trans. Chin. Soc. Agric. Eng. 2017, 33, 1–9. [Google Scholar]
  10. Hou, X.K.; Qi, S.W.; Yu, Y.T.; Zheng, J.G. Long-Term Settlement Characterization of High-Filling Foundation in the Mountain Excavation and City Construction Area of the Yan’an New District, China. J. Earth Sci. 2023, 34, 1908–1915. [Google Scholar] [CrossRef]
  11. Juang, C.H.; Dijkstra, T.; Wasowski, J.; Meng, X. Loess geohazards research in China: Advances and challenges for mega engineering projects. Eng. Geol. 2019, 251, 1–10. [Google Scholar] [CrossRef]
  12. Zhang, L.; Qi, S.; Yu, Y.; Zhang, Y.; Li, Z.; Hou, X.; Ma, L.; Zou, Y.; Guo, S.; Peng, J. A comparative study on the physical properties of natural sedimentary loess and manual filling compacted loess. Environ. Earth Sci. 2021, 80, 721. [Google Scholar] [CrossRef]
  13. Ma, L.N.; Qi, S.W.; Zheng, B.W.; Guo, S.; Huang, Q.; Yu, X. Farming Influence on Physical-Mechanical Properties and Microstructural Characteristics of Backfilled Loess Farmland in Yan’an, China. Sustainability 2020, 12, 5516. [Google Scholar] [CrossRef]
  14. Ng CW, W.; Kaewsong, R.; Zhou, C.; Alonso, E.E. Small strain shear moduli of unsaturated natural and compacted loess. Géotechnique 2017, 67, 646–651. [Google Scholar]
  15. Ng CW, W.; Mu, Q.Y.; Zhou, C. Effects of specimen preparation method on the volume change of clay under cyclic thermal loads. Géotechnique 2018, 69, 146–150. [Google Scholar]
  16. Ng CW, W.; Sadeghi, H.; Jafarzadeh, F.; Sadeghi, M.; Zhou, C.; Baghbanrezvan, S. Effect of microstructure on shear strength and dilatancy of unsaturated loess at high suctions. Can. Geotech. J. 2019, 57, 221–235. [Google Scholar]
  17. Wang, Y.; Li, T.; Zhao, C.; Hou, X.; Li, P.; Zhang, Y. A study on the effect of pore and particle distributions on the soil water characteristic curve of compacted loess soil. Environ. Earth Sci. 2021, 80, 1–12. [Google Scholar] [CrossRef]
  18. Zhang, L.; Qi, S.; Ma, L.; Guo, S.; Li, Z.; Li, G. Three-dimensional pore characterization of intact loess and compacted loess with micro-scale computed tomography and mercury intrusion porosimetry. Sci. Rep. 2020, 10, 1–15. [Google Scholar]
  19. Hou, X.; Qi, S.; Li, T.; Guo, S.; Wang, Y.; Li, Y.; Zhang, L. Microstructure and soil-water retention behavior of compacted and intact silt loess. Eng. Geol. 2020, 277, 105814. [Google Scholar] [CrossRef]
  20. Hou, X.K.; Qi, S.W.; Li, Y.; Liu, F.C.; Li, T.L.; Li, H. Hydraulic conductivity over a wide suction range of loess with different dry densities. J. Rock Mech. Geotech. Eng. 2024, 17, 481–492. [Google Scholar] [CrossRef]
  21. Jiang, M.J.; Zhang, F.; Hu, H.; Cui, Y.; Peng, J. Structural characterization of natural loess and compacted loess under triaxial tests. Eng. Geol. 2014, 181, 249–260. [Google Scholar] [CrossRef]
  22. Li, P.; Pan, Z.; Xiao, T.; Wang, J. Effects of molding water content and compaction degree on the microstructure and permeability of compacted loess. Acta Geotech. 2023, 18, 921–936. [Google Scholar] [CrossRef]
  23. Muñoz-Castelblanco, J.A.; Pereira, J.M.; Delage, P.; Cui, Y.J. The water retention properties of natural unsaturated loess from northern France. Géotechnique 2012, 62, 95. [Google Scholar] [CrossRef]
  24. Shao, X.; Zhang, H.; Tan, Y. Collapse behavior and microstructural alteration of remolded loess under graded wetting tests. Eng. Geol. 2018, 233, 11–22. [Google Scholar] [CrossRef]
  25. Xiao, T.; Li, P.; Pan, Z.; Hou, Y.; Wang, J. Relationship between water retention capacity and pore-size distribution of compacted loess. J. Soils Sediments 2022, 22, 3151–3165. [Google Scholar] [CrossRef]
  26. Chen, C.L.; Zhang, D.F.; Zhang, J.; Zhang, W.B. Compression and wetting deformation behavior of intact loess under isotropic stresses. Chin. J. Rock Mech. Eng. 2017, 36, 1736–1747. [Google Scholar]
  27. Zhang, G. Experimental study on collapsibility of compacted loess. Water Resour. Hydropower Eng. 1986, 06, 39–43. (In Chinese) [Google Scholar]
  28. Rogers CD, F.; Dijkstra, T.A.; Smalley, I.J. Hydroconsolidation and subsidence of loess: Studies from China, Russia, North America, and Europe: In memory of Jan Sajgalik. Eng. Geol. 1994, 37, 83–113. [Google Scholar] [CrossRef]
  29. Alonso, E.E.; Pinyol, N.M.; Gens, A. Compacted soil behavior: Initial state, structure, and constitutive modeling. Géotechnique 2013, 63, 463–478. [Google Scholar] [CrossRef]
  30. Kanit, T.; Forest, S.; Galliet, I.; Mounoury, V.; Jeulin, D. Determination of the size of the representative volume element for random composites: Statistical and numerical approach. Int. J. Solids Struct. 2003, 40, 3647–3679. [Google Scholar] [CrossRef]
  31. Romero, E. A microstructural insight into compacted clayey soils and their hydraulic properties. Eng. Geol. 2013, 165, 3–19. [Google Scholar] [CrossRef]
  32. Delage, P.; Audiguier, M.; Cui YJ Howat, M.D. Microstructure of compacted silt. Can. Geotech. J. 1996, 33, 150–158. [Google Scholar] [CrossRef]
  33. Koliji, A.; Vulliet, L.; Laloui, L. Structural characterization of unsaturated aggregated soil. Can. Geotech. J. 2010, 47, 297–311. [Google Scholar] [CrossRef]
  34. Romero, E.; Simms, P.H. Microstructure investigation in unsaturated soils: A review with special attention to the contribution of mercury intrusion porosimetry and environmental scanning electron microscopy. Geotech. Geol. Eng. 2008, 26, 705–727. [Google Scholar] [CrossRef]
  35. Wen, B.P.; Yan, Y.J. Influence of structure on shear characteristics of the unsaturated loess in Lanzhou, China. Eng. Geol. 2014, 168, 46–58. [Google Scholar] [CrossRef]
  36. Assallay, A.M.; Rogers CD, F.; Smalley, I.J. Formation and collapse of metastable particle packings and open structures in loess deposits. Eng. Geol. 1997, 48, 101–115. [Google Scholar] [CrossRef]
  37. Wang, J.D.; Li, P.; Ma, Y.; Vanapalli, S.K. Evolution of pore-size distribution of intact loess and remolded loess due to consolidation. J. Soils Sediments 2019, 19, 1226–1238. [Google Scholar] [CrossRef]
  38. Wei, T.T.; Fan, W.; Yuan, W.; Wei, Y.N.; Yu, B. Three-dimensional pore network characterization of loess and paleosol stratigraphy from South Jingyang Plateau, China. Environ. Earth Sci. 2019, 78, 1–15. [Google Scholar] [CrossRef]
  39. Li, P.; Shao, S. Can X-ray computed tomography (CT) be used to determine the pore-size distribution of intact loess? Environ. Earth Sci. 2020, 79, 29. [Google Scholar] [CrossRef]
  40. Li, Y.; He, S.; Deng, X.; Xu, Y. Characterization of macropore structure of Malan loess in NW China based on 3D pipe models constructed by using computed tomography technology. J. Asian Earth Sci. 2018, 154, 271–279. [Google Scholar] [CrossRef]
  41. Wei, Y.N.; Fan, W.; Yu, B.; Deng LS Wei, T. Characterization and evolution of three-dimensional microstructure of Malan loess. Catena 2020, 192, 104585. [Google Scholar] [CrossRef]
  42. Wei, Y.N.; Fan, W.; Yu, N.; Deng, L.S.; Wei, T. Permeability of loess from the South Jingyang Plateau under different consolidation pressures in terms of the three-dimensional microstructure. Bull. Eng. Geol. Environ. 2020, 79, 4841–4857. [Google Scholar] [CrossRef]
  43. Yu, B.; Fan, W.; Fan, J.H.; Dijkstra, T.A.; Wei, Y.N.; Wei, T.T. X-ray micro-computed tomography (μ-CT) for 3D characterization of particle kinematics representing water-induced loess micro-fabric collapse. Eng. Geol. 2020, 279, 105895. [Google Scholar] [CrossRef]
  44. Yu, B.; Fan, W.; Dijkstra, T.A.; Wei, Y.N.; Deng, L.S. Heterogeneous evolution of pore structure during loess collapse: Insights from X-ray micro-computed tomography. Catena 2021, 201, 105206. [Google Scholar] [CrossRef]
  45. Zhao, B.; Wang, J. 3D quantitative shape analysis on form, roundness, and compactness with μCT. Powder Technol. 2016, 291, 262–275. [Google Scholar] [CrossRef]
  46. Bargmann, S.; Klusemann, B.; Markmann, J.; Schnabel, J.E.; Schneider, K.; Soyarslan, C.; Wilmers, J. Generation of 3D representative volume elements for heterogeneous materials: A review. Prog. Mater. Sci. 2018, 96, 322–384. [Google Scholar] [CrossRef]
  47. Zhang, W.; Chen, J.P.; Liu, C.; Huang, R.; Li, M.; Zhang, Y. Determination of geometrical and structural representative volume elements at the Baihetan dam site. Rock Mech. Rock Eng. 2012, 45, 409–419. [Google Scholar] [CrossRef]
  48. Wu, H.; Zhou, Y.; Yao, Y.; Wu, K. Imaged-based fractal characterization of micro-fracture structure in coal. Fuel 2019, 239, 53–62. [Google Scholar] [CrossRef]
  49. Wu, H.; Yao, Y.; Zhou, Y.; Qiu, F. Analyses of representative elementary volume for coal using X-ray μ-CT and FIB-SEM and its application in permeability prediction model. Fuel 2019, 254, 115563. [Google Scholar] [CrossRef]
  50. Xu, W.; Sun, X.; Li, D.; Ryu, S.; Khaleel, M.A. Mechanism-based representative volume elements (RVEs) for predicting property degradations in multiphase materials. Comput. Mater. Sci. 2013, 68, 152–159. [Google Scholar] [CrossRef]
  51. Peters, A.; Hohenbrink, T.L.; Iden, S.C.; van Genuchten, M.T.; Durner, W. Prediction of the absolute hydraulic conductivity function from soil water retention data. Hydrol. Earth Syst. Sci. 2023, 27, 1565–1582. [Google Scholar] [CrossRef]
  52. Li, P.; Vanapalli, S.; Li, T. Review of collapse triggering mechanism of collapsible soils due to wetting. J. Rock Mech. Geotech. Eng. 2016, 8, 256–274. [Google Scholar] [CrossRef]
  53. Cilek, V. The loess deposits of the Bohemian Massif: Silt provenance, palaeometeorology, and loessification processes. Quat. Int. 2001, 76, 123–128. [Google Scholar] [CrossRef]
  54. Li, Y.; Zhang, W.; He, S.; Aydin, A. Wetting-driven formation of present-day loess structure. Geoderma 2020, 377, 114564. [Google Scholar] [CrossRef]
  55. Zuo, L.; Xu, L.; Baudet, B.A.; Gao, C.; Huang, C. The structure degradation of silty loess induced by long-term water seepage. Eng. Geol. 2020, 272, 105634. [Google Scholar] [CrossRef]
Figure 1. Two typical engineering projects in the Loess Plateau of China: (a) Mountain excavation and city creation (MECC) project; (b) Gully management and land reclamation (GMLR) project.
Applsci 15 03120 g001
Figure 2. Location of the sampling site: (a) satellite image from Google Earth of the study area; (b) the excavated slope profile; (c,d) the newly created land.
Applsci 15 03120 g002
Figure 3. Cumulative grain size distribution curves of the tested specimens.
Applsci 15 03120 g003
Figure 4. Workflow to generate the cubes to be analyzed: (a) 3D reconstruction; (b) noise reduction; (c) region-of-interest (ROI) selection.
Applsci 15 03120 g004
Figure 5. Cube partition scheme.
Applsci 15 03120 g005
Figure 6. Main steps to get the quantitative parameters: (a) a selected cube; (b) segmentation of the pore from the cube; (c) connected pores; (d) isolated pores; (e) pore separation and labeling; (f) pore network model; (g) pores in the pore network model; (h) throats in the pore network model.
Applsci 15 03120 g006
Figure 7. The mean values and standard deviations of parameters of different size cubes of the specimens: (a) total porosity Po; (b) connected porosity Pc; (c) isolated porosity Pi; (d) average coordination number CN; (e) the median of pore volume MV; (f) the median of pore area MA; (g) the median of pore equivalent radius MR; (h) the median of throat channel length ML. Note: The length of the error bar indicates the standard deviation.
Applsci 15 03120 g007
Figure 8. Variation of the pore parameters with the increase in cube side length. (ah) represents different pore parameters, and the start point represents different sub-volume selection schemes. (a) total porosity Po; (b) connected porosity Pc; (c) isolated porosity Pi; (d) average coordination number CN; (e) the median of pore volume MV; (f) the median of pore area MA; (g) the median of pore equivalent radius MR; (h) the median of throat channel length ML.
Applsci 15 03120 g008
Figure 9. REV sizes based on different pore parameters of the specimens. (a) the Q3 specimen; (b) the Q2 specimen; (c) the F1 specimen; (d) the C1 specimen; A-D0 represents the start point of the selected cube.
Applsci 15 03120 g009
Figure 10. Correlation pore size distribution curves of the geometrical RVE cubes, the ROI region, and the 3D cylinder: (a) the Q3 specimen; (b) the Q2 specimen; (c) the F1 specimen; (d) the C1 specimen.
Applsci 15 03120 g010
Figure 11. Pore size distribution characteristics of the intact and remolded loess specimens (a) pore size distribution curves (b) cumulative pore volume fraction curves.
Applsci 15 03120 g011
Figure 12. Coordination number distribution characteristics of intact and compacted loess (a) pore volume percentage versus CN (b) cumulative pore volume percentage versus CN.
Applsci 15 03120 g012
Figure 13. Absolute permeability of the tested specimens (a) Diagram of the numerical permeability experiment; (b) Permeability results.
Applsci 15 03120 g013
Figure 14. Images of the tested specimens (a) the Q3 specimen; (b) the Q2 specimen; (c) the F1 specimen; (d) the C1 specimen.
Applsci 15 03120 g014
Table 1. Basic physical properties of the specimens.
SpecimensDry Density (g/cm3)In-Situ Water Content (%)Void RatioAtterberg Limits
Plastic LimitLiquid LimitPlastic Index
Q31.379.7%0.9717.827.69.8
Q21.5413.9%0.7518.528.510.0
F11.6116.5%0.6817.426.89.4
C11.6613.9%0.6318.528.510.0
Note: “Q3” represents the intact Q3 loess, “Q2” represents the intact Q2 loess, “F1” represents the remolded loess obtained from the GMRL project, and “C1” represents the remolded loess obtained from the MBCC project.
Disclaimer/Publisher’s Note: The statements, opinions and data contained in all publications are solely those of the individual author(s) and contributor(s) and not of MDPI and/or the editor(s). MDPI and/or the editor(s) disclaim responsibility for any injury to people or property resulting from any ideas, methods, instructions or products referred to in the content.

