Article

A Multi-Optimization Method for Capacity Configuration of Hybrid Electrolyzer in a Stand-Alone Wind-Photovoltaic-Battery System

1
School of Electrical and Control Engineering, North China University of Technology, Shijingshan District, Beijing 100144, China
2
China Three Gorges Technology Co., Ltd., Xicheng District, Beijing 100032, China
3
School of Automation and Electrical Engineering, University of Science and Technology Beijing, Haidian District, Beijing 100083, China
*
Author to whom correspondence should be addressed.
Appl. Sci. 2025, 15(6), 3135; https://doi.org/10.3390/app15063135
Submission received: 20 February 2025 / Revised: 12 March 2025 / Accepted: 13 March 2025 / Published: 13 March 2025
(This article belongs to the Special Issue Hydrogen Energy and Hydrogen Safety)

Abstract

:
The coupling of renewable energy sources with electrolyzers under stand-alone conditions significantly enhances the operational efficiency and improves the cost-effectiveness of electrolyzers as a technologically viable and sustainable solution for green hydrogen production. To address the configuration optimization challenge in hybrid electrolyzer systems integrating alkaline water electrolysis (AWE) and proton exchange membrane electrolysis (PEME), this study proposes an innovative methodology leveraging the morphological analysis of Pareto frontiers to determine the optimal solutions under multi-objective functions including the hydrogen production cost and efficiency. Then, the complementary advantages of AWE and PEME are explored. The proposed methodology demonstrated significant performance improvements compared with the single-objective optimization function. When contrasted with the economic optimization function, the hybrid system achieved a 1.00% reduction in hydrogen production costs while enhancing the utilization efficiency by 21.71%. Conversely, relative to the efficiency-focused optimization function, the proposed method maintained a marginal 5.22% reduction in utilization efficiency while achieving a 6.46% improvement in economic performance. These comparative results empirically validate that the proposed hybrid electrolyzer configuration, through the implementation of the novel optimization framework, successfully establishes an optimal balance between the economy and efficiency of hydrogen production. Additionally, a discussion on the key factors affecting the rated power and mixing ratio of the hybrid electrolyzer in this research topic is provided.

1. Introduction

Hydrogen derived from renewable sources has gained recognition as a strategically important energy carrier in the context of global climate change mitigation efforts [1]. As the capacity of wind turbines and solar power plants continues to grow, under the on-grid and stand-alone condition, the technology for producing green hydrogen through water electrolysis using renewable energy sources has advanced significantly and has shown a trend of replacing traditional chemical hydrogen production [2]. Under the stand-alone condition, the direct coupling of photovoltaics or a wind turbine with the electrolysis system has a positive impact on system efficiency [3]. The autonomous operation capability of electrolyzers, coupled with progressively enhanced cost-effectiveness in energy supply, render stand-alone photovoltaic systems as a highly promising solution for sustainable green hydrogen production [4]. Compared with anion exchange membrane electrolyzers (AEMEs) and solid oxide electrolyzers (SOEs), which are still in the laboratory research stage, alkaline electrolyzers (AWEs) and proton exchange membrane electrolyzers (PEMEs) have gained wide application due to their low cost, high efficiency, and loose application condition, respectively [3,5]. Therefore, the investigation of optimal integration strategies for alkaline water electrolysis (AWE) and proton exchange membrane electrolysis (PEME) in stand-alone wind-photovoltaic-battery hybrid systems, in order to leverage their complementary advantages to enhance both economic viability and energy conversion efficiency in green hydrogen production, represents a critical research direction warranting further systematic exploration.
Experts and scholars have conducted extensive research on off-grid application [6], optimizing control [7] and capacity allocation [8] to improve the economy and energy efficiency of hydrogen-containing energy systems [9]. A comprehensive evaluation of round-trip efficiency was performed for different electrolyzer types, focusing on hydrogen production energy losses in power-to-power storage applications. The analysis demonstrated peak efficiencies of 29% for solid oxide, 22.2% for AWE, and 21.8% for PEME. The results underscore substantial opportunities for technological advancement, with potential efficiency gains projected to reach 40–42% in the next decade [10]. The optimization of hybrid renewable energy systems was studied in three small communities on the island of Manoka in Douala, Cameroon, under off-grid conditions including solar panels, wind turbines, batteries, fuel cell generators, biogas, and electrolyzers [11]. By designing an integrated photovoltaic-hydrogen renewable energy system, the feasibility of integrating electrolyzers, fuel cells, and hydrogen storage tanks with renewable energy systems was demonstrated in the Saudi Arabia region [12]. A significant body of research has shown some challenges faced by energy management and the optimal allocation of hybrid energy systems. New energy sources, including hydrogen-producing electrolyzers and battery energy storage systems, are applicable in both on-grid and off-grid conditions. However, there are generally varying degrees of complex trade-offs among multiple optimization objective functions [13].
Three distinct approaches can be employed to resolve optimization problems that involve multiple objective functions. The multi-objective optimization challenge can be addressed through scalarization techniques, specifically via weighted linear combination, as proposed in [14]. The methodological framework was successfully demonstrated in reference [15], wherein multiple optimization objectives—encompassing battery discharge power characteristics, charge/discharge cycle parameters, and hydrogen production capacity metrics—were systematically consolidated into an integrated cost function formulation. This optimization process was specifically designed to facilitate enhanced energy management strategies for standalone renewable energy systems. Reference [16] proposed a methodological framework for the scalarization of multiple optimization objective functions, wherein five distinct objective functions—comprising electricity procurement costs, natural gas acquisition expenses, battery operational parameters, and hydrogen production expenditures—were systematically consolidated into a unified cost function formulation. An optimal scheduling method of an integrated wind-photovoltaic-hydrogen system was proposed, incorporating an improved discrete step-size transformation. In reference [17], the net present cost (NPC) and cost of energy (COE) of a hybrid renewable system comprising photovoltaic, wind turbine, fuel cell, and electrolyzer components were calculated. The system configuration was optimized through the implementation of three distinct swarm intelligence algorithms. Prior research documented in references [18,19] established methodological frameworks employing hierarchical analysis and intuitionistic fuzzy number approaches to ascertain the relative weights among multiple optimization objective functions. This approach converts the multi-objective optimization problem into a single optimization model by summation.
Another option is to utilize swarm intelligence optimization techniques to identify a non-dominated solution set under multiple objectives, which can be assessed and merged with the initial solution to reach the final recommended outcome [20]. For instance, an enhanced sea squirt swarm intelligence algorithm has been proposed to effectively improve the economy and energy utilization of a wind-hydrogen storage system [21]. The non-dominated sorting genetic algorithm II (NSGA II) was used to optimize and determine the best energy management strategy and capacity allocation scheme for a grid-connected wind power green hydrogen system. The two objective functions were to enhance the economic efficiency and improve energy utilization [22,23]. To determine the optimal configuration of the capacity of the hydrogen production system in an off-grid state, references [24,25,26] employed the NSGA II method to solve several different perspectives including those relating to the economy of hydrogen production, the probability of power supply loss, and the potential for excess energy. The NSGA II method is employed to identify the optimal capacity configuration for off-grid hydrogen production systems, taking into account several key factors such as the economic viability of hydrogen production, the risk of power supply disruptions, and the possibility of excess energy generation [24,25,26]. The resulting Pareto frontier is more uniform and covers a broader range compared with those produced by previous methodologies. To enhance the design of a novel PV-pumped storage system for hydrogen storage, both the NSGA-II and MOPSO methods were utilized to improve the system cost and efficiency [27].
Finally, it is also possible to implement a multi-stage or multi-layer structure to address a multi-objective optimization problem [28]. In a multi-objective optimization of wind-hydrogen production systems, an iterative procedure approach was proposed to find Pareto-optimal solutions [29]. In an off-grid hydrogen generation system, a methodology for day-ahead scheduling was proposed to optimize the capacity allocation based on the multi-state transitions of alkaline electrolyzers that utilized a particle swarm optimization (PSO) algorithm [30].
The existing literature has not addressed the complementary characteristics of different types of electrolyzers, particularly the complementarity between AWE and PEME regarding hydrogen production cost and efficiency. A multi-objective planning problem of a hybrid electrolyzer is discussed in a stand-alone wind-photovoltaic-battery system. Two key issues urgently need to be addressed in this optimization problem. A mathematical model that describes a hybrid electrolyzer’s optimal composition and proportions and a reasonable recommendation method for a non-dominated solution set in a multi-objective optimization problem. To solve the above issues, our recommended method is proposed based on the characteristics of Pareto front morphology. The innovations of this study can be summarized from three aspects.
(1)
A hybrid electrolyzer scheme for hydrogen production, which combines the complementary advantages of AWE and PEME, was proposed and analyzed in depth. This analysis focused on the economic efficiency and production potential of hydrogen. The optimal ratio between the two types of electrolyzers within the hybrid system was also discussed.
(2)
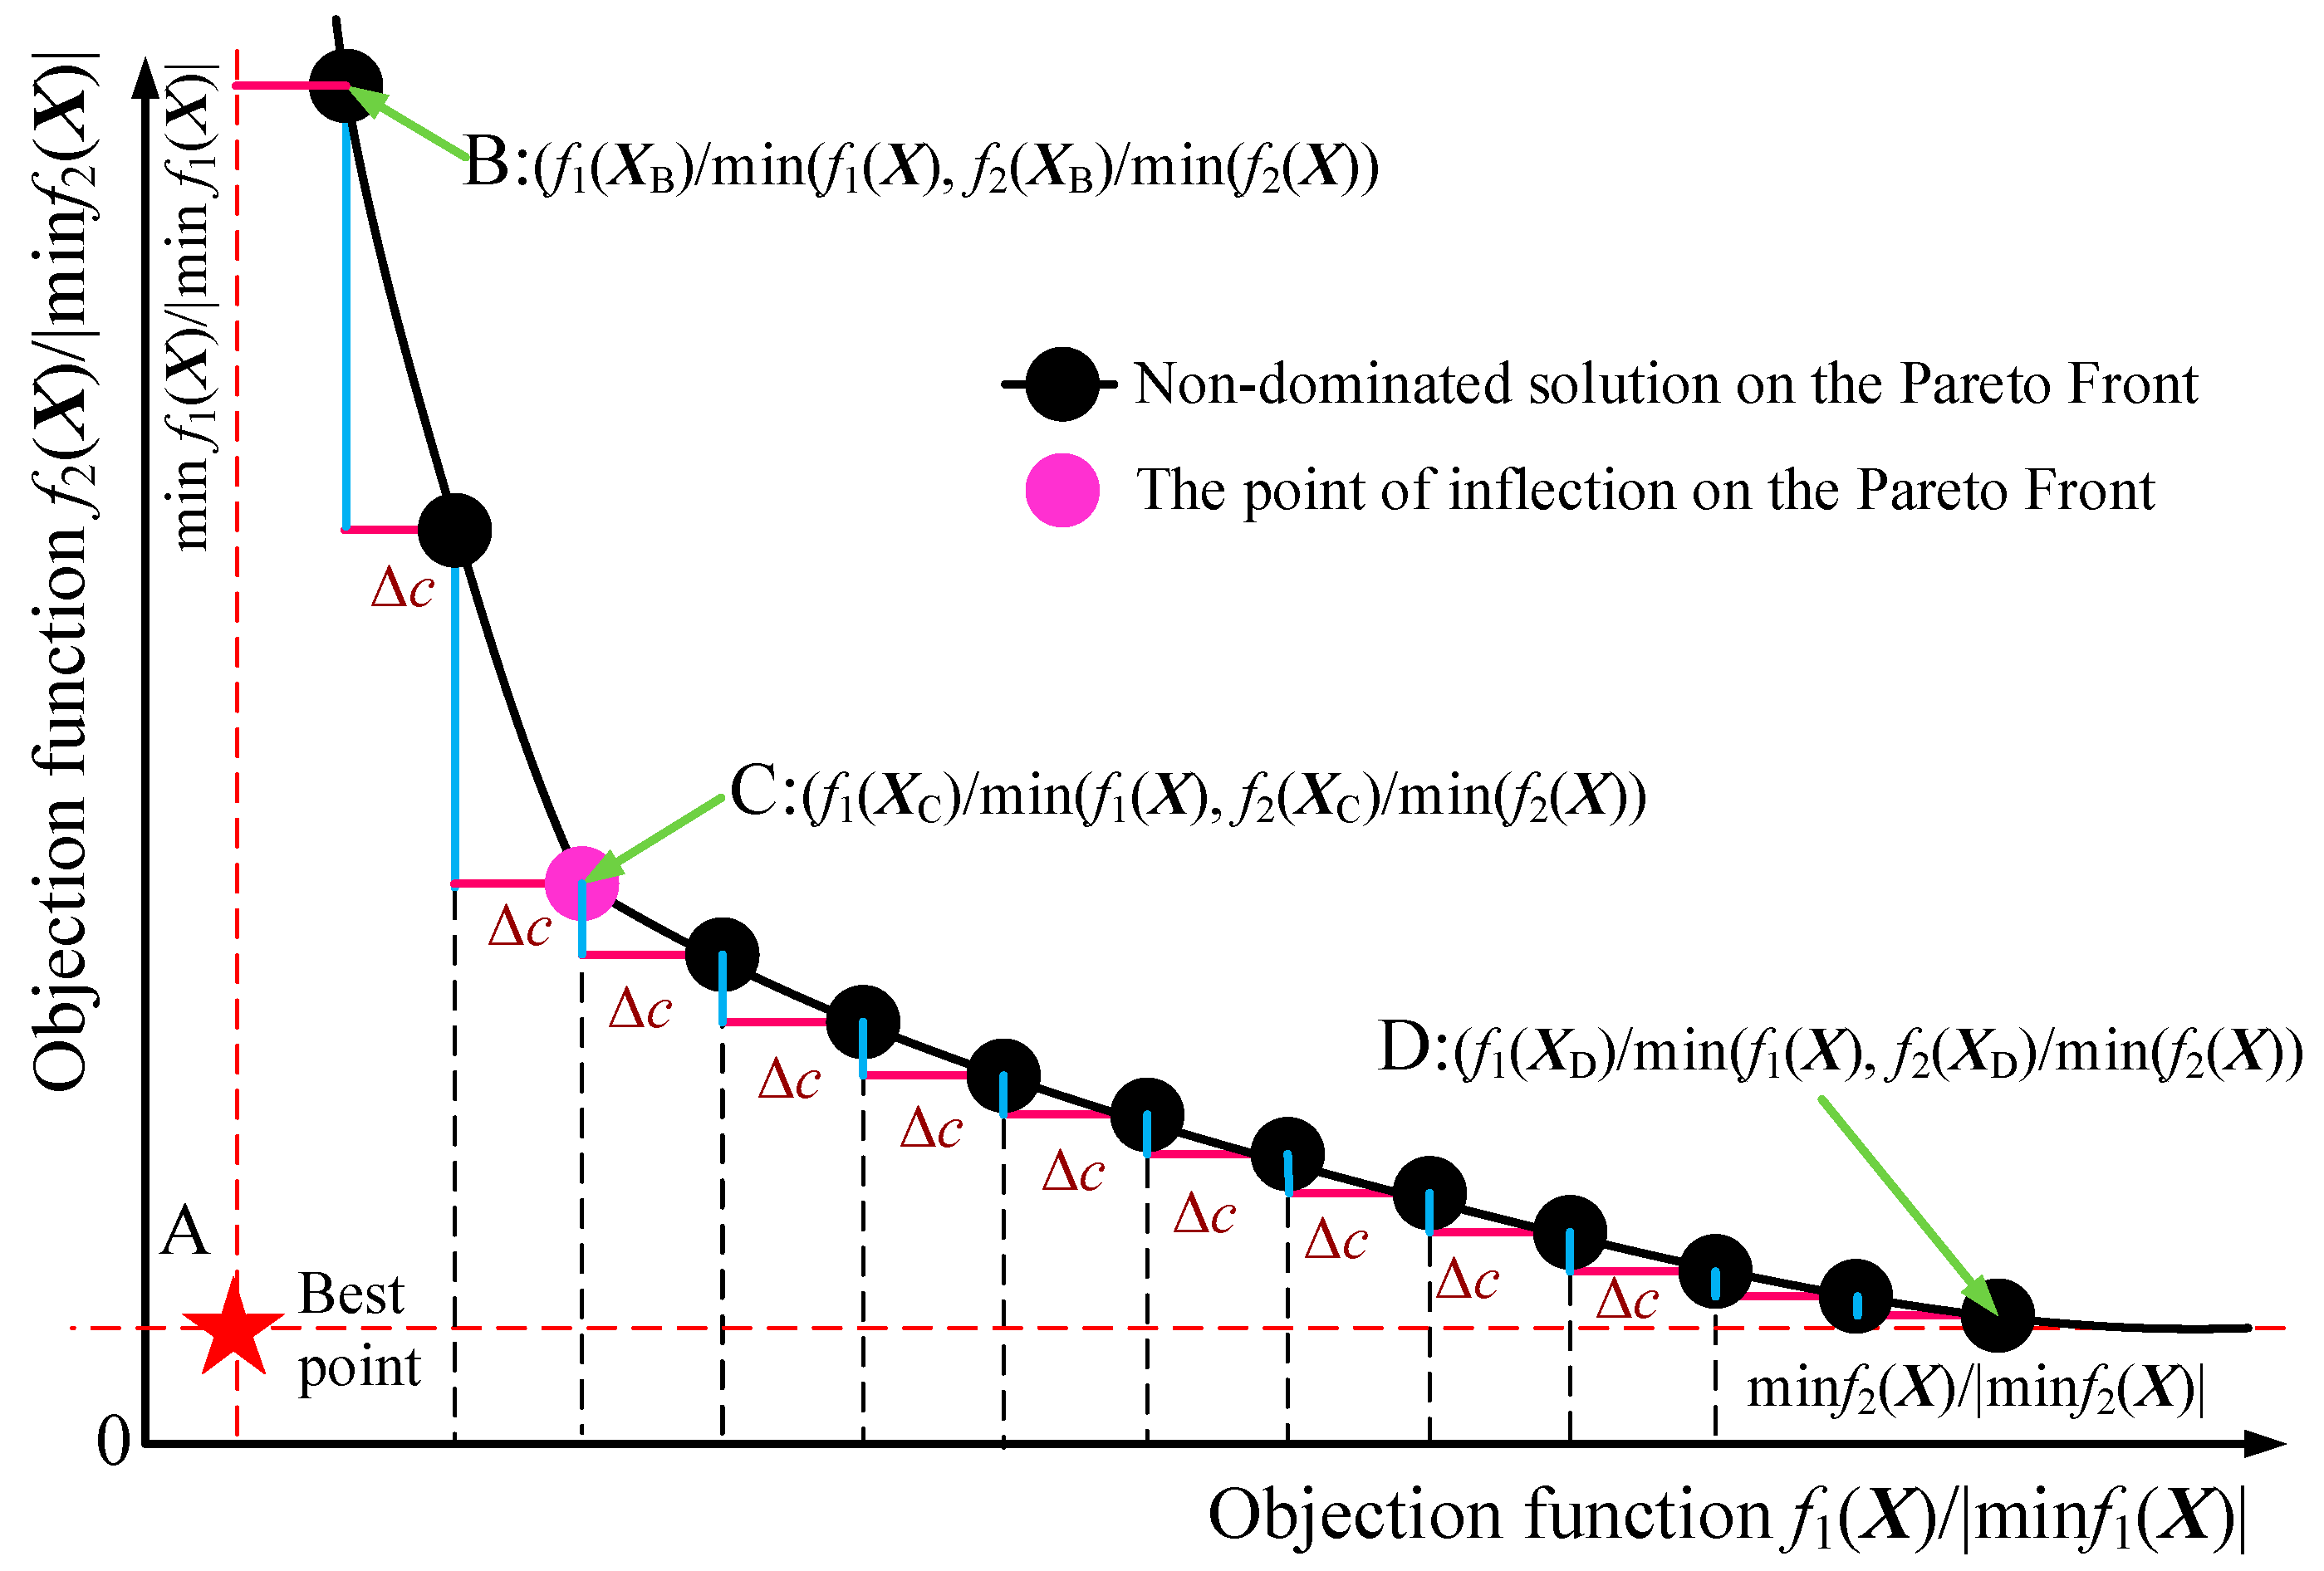
A multi-objective optimization method based on the slope change of the Pareto front was presented, offering a new approach for selecting recommended solutions for multi-objective optimization problems.
(3)
Analysis of the relative values of AWE and PEME in hydrogen efficiency, unit cost, and unit investment price cost highlighted key factors affecting the hybrid electrolyzer’s rated power and mixing ratio. This will further enhance the hybrid electrolyzer’s application and development.
The rest of this study is structured as follows. Section 2 establishes the optimization model for a wind-photovoltaic-battery system combined with a hybrid electrolyzer under stand-alone conditions. Section 3 details the proposed method’s analysis and implementation processes. Section 4 discusses the simulation results, while Section 5 summarizes the conclusions and outlines future research directions for this study.

2. The Stand-Alone Wind-Photovoltaic-Battery System with the Hybrid Electrolyzer

2.1. Structure of Wind-Photovoltaic-Battery System with the Hybrid Electrolyzer

Under the stand-alone condition, the wind-photovoltaic-battery system with the hydrogen production is illustrated in Figure 1. The hydrogen production infrastructure was designed with three schemes: (A) a single AWE, (B) a single PEME, and (C) a hybrid electrolyzer. The system consists of two primary energy flows: electrical and hydrogen. In terms of electricity energy, the components include wind turbine power generation systems (WTGs), photovoltaic power generation systems (PVGs), battery energy storage systems (BESSs), power loads, and the hybrid electrolyzer. The WTGs and PVGs supply green energy for load demands and hydrogen production. The BESS balances the power discrepancy between the energy supplied by the new energy sources and the electricity consumed by the loads. For hydrogen energy, the system comprises a hydrogen production unit, a hydrogen storage unit, and a hydrogen sales unit. The hydrogen production unit operates as a hybrid electrolyzer, incorporating AWE and PEME. The hydrogen sales unit represents the hydrogen load. This study considered the advantages of both AWE and PEME in terms of hydrogen production cost and efficiency. A hydrogen production mode for a hybrid electrolyzer was designed to enhance the energy utilization and economy of hydrogen production systems. To further discuss and analyze the optimal combination ratio of the hybrid electrolyzer, a mathematical modeling of the wind-photovoltaic-battery system with a hybrid electrolyzer under stand-alone conditions was established. This mathematical model consists of system operation constraints and optimization objective functions.

2.2. Mathematical Model of the Stand-Alone Wind-Photovoltaic-Battery System with the Hybrid Electrolyzer

Section 2.1 presents the structure of the wind-photovoltaic-battery system combined with a hybrid electrolyzer, specifically under stand-alone conditions. A mathematical model of a stand-alone wind-photovoltaic-battery system with the hybrid electrolyzer was established. Many operation constraints and two optimization objective functions focused on enhancing both the efficiency and the economic feasibility of the system.
(1) The operation constraints
In the operation of a stand-alone wind-photovoltaic-battery system with a hybrid electrolyzer, several equations and inequalities govern the system’s performance. The operational framework incorporates several crucial elements: real-time power and energy equilibrium, the PVG and WTG outputs, and BESS dynamics (including power output and state of energy) along with the hydrogen production, storage, and distribution constraints. This includes the power from AWE and PEME, the state of hydrogen (SOH) in the hydrogen storage tank (HST), and the rate of hydrogen sales.
(1)
The constraints of the real-time power balance of the system are expressed in Formula (1) and indicates the current balance of the system’s operating power in real-time. The system variables are defined as follows [31]: PPV(t)—photovoltaic generation output; PWIND(t)—wind turbine generation output; P BESS d (t)—battery energy storage system discharge power; P BESS c (t)—battery energy storage system charge power; PLoad(t)—active load demand; PAWE(t)—alkaline water electrolyzer hydrogen production power; PPEME(t)—proton exchange membrane electrolyzer power. P BESS c (t) is negative, and the others are positive.
P PV t + P WIND t + P BESS d t + P BESS c t = P Load t + P PEME t + P AWE t
(2)
Formula (2) outlines the operation constraints of the PVGs and WTGs [25]. The power generation capacity of the renewable energy system is subject to operational constraints, where PPV(t) and P PV max (t) indicate the instantaneous output power and maximum available power from the PVGs, respectively, and PWIND(t) and P WIND max (t) correspondingly represent these parameters for the WTGs. P PV N and P WIND N refer to the rated power of the PVGs and WTGs, respectively. Additionally, δ1 represents the abandonment rate of the new energy source.
0 P PV t P PV max t P PV N 0 P WIND t P WIND max t P WIND N t = 0 T P PV max t P PV t / P PV max t + P WIND max t P WIND t / P WIND max t δ 1
(3)
In the operation constraints of the BESS, there are specific relationships between the charging/discharging power and SOE of the BESS [31,32]. It outlines potential limitations regarding the BESS’s operating power and stored energy capacity. Formula (3) shows the initial, minimum, and maximum values of the SOE. Then, Formula (4) describes the BESS’s charging and discharging power range.
C SOE t + Δ t = C SOE t P BESS d t / η d + P BESS c t × η c × Δ t × 100 / S BESS N C SOE 0 = C SOE T = C SOE init C SOE D C SOE t C SOE U
0 P BESS d t u BESS d t × P BESS N u BESS c t × P BESS N P BESS c t 0 u BESS c t + u BESS d t 1
where CSOE(t) represents the SOE of the BESS at time t. S BESS N denotes the rated capacity of the BESS, while ηd and ηc are the discharge and charge efficiency of the BESS, respectively. The variables u BESS d (t) and u BESS c (t) are the binary optimization variables. If u BESS d (t) = 1, it indicates that the BESS is discharging. Conversely, if u BESS c (t) = 1, it indicates that the BESS is charging. The initial state of energy is specified as C SOE init , with the minimum and maximum capacity limits defined as the CD SOE and C SOE U , respectively. Additionally, Δt represents the sampling time, and T indicates the ending time.
(4)
The operation constraints of the production, storage, and sale of hydrogen units are defined as Formulas (5)~(8). The equation relationship between hydrogen production power and volume is Formula (5) [29]. Then, Formula (6) outlines the production, storage, and sale relationships among AWE, PEME, and HST [31,32]. The operation power range and climbing rate for AWE and PEME are illustrated in Formula (7) [28]. Finally, Formula (8) represents the range of hydrogen sales volume [32].
V AWE t = 1000 P AWE t η AWE ρ H 2 λ H 2 AWE V PEME t = 1000 P PEME t η PEME ρ H 2 λ H 2 PEME
C SOH t + Δ t = C SOH t + V AWE t + V PEME t V SELL t × Δ t × 100 / V HESS N C SOH 0 = C SOH T = C SOH init C SOH D C SOH t C SOH U
P PEME min P PEME t P PEME max P PEME N P AWE min P AWE t P AWE max P AWE N | P PEME t + Δ t P PEME t | α PEME × P PEME N | P AWE t + Δ t P AWE t | α AWE × P AWE N
0 V SELL t V SELL max
where CSOH(t), VSELL(t), VAWE(t), and VPEME(t) represent the SOH of the HST, the volume of hydrogen sold, and the volume of hydrogen produced by AWE and PEME at time t, respectively. The hydrogen density (ρH2) is 0.9 kg/m3; V HESS N is the rated capacity of the HST, and V SELL max is the maximum volume of hydrogen sold. The parameters ηAWE, λ H 2 AWE , αAWE, P AWE min , P AWE max , and P AWE N represent the hydrogen production efficiency, electric hydrogen ratio, climbing rate, minimum power, maximum power, and rated power of AWE, respectively. Similarly, ηPEME, λ H 2 PEME , αPEME, P PEME min , P PEME max , and P PEME N reflect the corresponding properties for PEME. The initial, minimum, and maximum capacity values of the HST are represented by C SOH init , C SOH D , and C SOH U , respectively.
(5)
The operation constraints of the load unit are presented in Formula (9). PLoad(t) and P Load ref (t) refer to the load’s actual power and demand power, respectively. δ2 is the cut-off rate of the load.
0 P Load t P Load ref t t = 0 T P Load ref t P Load t / P Load ref t δ 2
(2) The optimization objective function
This study aimed to analyze the characteristics of a hybrid electrolyzer that combined AWE and PEME. To achieve this, two objective functions for optimization were established, focusing on the economic aspects and the utilization of AWE and PEME. This resulted in a multi-objective optimization problem structured as follows.
(1)
This study examined the economic aspects of hydrogen production by analyzing the initial investment cost, hydrogen production cost, and sales revenue associated with AWE and PEME. The costs per kilowatt-hour (kWh) of the BESS, PVGs, and WTGs were considered. Subsequently, an objective function J1 was established to represent the economic viability of hydrogen production using a hybrid electrolyzer, as detailed in Formula (10) [25]. The investment cost is directly related to the rated power of the hybrid electrolyzer. In contrast, the hydrogen production cost and sales revenue depend on the actual output power of the electrolyzer, which is constrained by its rated capacity.
min J 1 = c PV t = 0 T P PV t + c WIND t = 0 T P WIND t + c BESS t = 0 T P BESS d t P BESS c t + i { AWE , PEME } t = 0 T c i inv 1000 P i N γ 1 + γ N i 365 1 + γ N i 1 + c i pro 1000 P i t η i λ H 2 i t = 1 T V SELL t ρ H 2 c SELL
(2)
This study analyzed the energy loss and idle conditions associated with hydrogen production in a hybrid electrolyzer, focusing on its utilization efficiency. Then, another objective function, J2, was designed, as detailed in Formula (11), where Pi(t) (1 − ηi) and ( P i N Pi(t)) represent the energy loss and the idle power of hydrogen production using AWE or PEME at time t, respectively.
min J 2 = i t = 0 T P i t 1 η i + P i N P i t i { AWE , PEME }
where Pi(t) and VSELL(t) represent the hydrogen production power of AWE or PEME and the volume of hydrogen sold at time t; P i N , Ni, λ H 2 i , and ηi are the rated power, operation life, electric hydrogen ratio, and hydrogen production efficiency of AWE or PEME, respectively; c PV , cWIND, and cBESS are the cost per kW/h of the PVGs, WTGs, and BESS; c i inv , c i Pro , and c SELL are the investment cost coefficient, hydrogen production cost of AWE or PEME, and the hydrogen sales revenue, respectively; γ is the discount rate.

3. A Multi-Objective Optimization Problem and Solution for Hydrogen Production

The mathematical model of a stand-alone wind-photovoltaic-battery system with a hybrid electrolyzer presents a typical programming problem challenge characterized by two optimization objective functions and numerous constraints. This optimization problem can be uniformly expressed as shown in Formulas (12) and (13) [33], where X encompasses a variety of optimization variables that include the actual output power of the PVGs, WTGs, BESS, load and the hybrid electrolyzer, hydrogen production and sales volume, SOE of the BESS, and SOH of the hydrogen storage tank, the rated power of AWE and PEME, and binary identification variables for the charging/discharging state of the BESS. The functions f1(X) and f2(X) represent the two optimization objective functions as defined in Formulas (10) and (11), respectively. gk(X) and hl(X) correspond to the equality and inequality constraints described in Formulas (1)~(9), respectively. Furthermore, [ x i lb , x i ub ] indicates the permissible range for each optimization variable.
min X F X = f 1 X , f 2 X
s . t . g k X = 0 , k = 1 , 2 , , K h l X 0 , l = 1 , 2 , , L x i lb x i x i ub , i = 1 , 2 , , m
In addressing the multi-objective problems mentioned earlier, many researchers have discovered a certain level of conflict among the various objective functions. Currently, it is not possible to achieve a globally optimal solution that ensures each optimization function is satisfied. The global optimal value simply results from optimizing each objective function independently, as illustrated by point A in Figure 2. However, this global optimum is unattainable in multi-objective optimization problems. Instead, a multi-objective problem could have a series of sub-optimal solutions that offer clear advantages over one another. This results in a non-dominated solution set known as the Pareto solution set. In the function space formed by all optimization objective functions, the solutions in this set create a convex surface referred to as the Pareto front, represented by points B to F in Figure 2. Consequently, in a multi-objective optimization problem, selecting the most appropriate solution on the Pareto front is challenging.
In Figure 2, it can be observed that along the f1(X)/|min f1(X)| direction, the ranking of points was B < C < D, indicating that point B was optimal. Conversely, in the f2(X)/|min f2(X)| direction, the ranking was B > C > D, which means that point D was optimal, while point B was the least favorable. This implies that there is no absolute advantage among these points on the Pareto front; therefore, they represent non-dominated solutions in this multi-objective optimization problem. Moreover, if an equivalent relaxation is applied in the f1(X)/|min f1(X)| direction, variations will arise in the f2(X)/|min f2(X)| direction. For example, when selecting non-dominated solutions on the Pareto front using a Δc step in the f1(X)/|min f1(X)| direction, the deviation during the BC stage is notably more significant than that during the CD stage, resulting in a substantial difference in slope. This suggests that the loss associated with the two optimization objective functions is not equivalent. Additionally, point C emerged as the non-dominated solution with the most significant slope change of the optimization objective function. As the non-dominated solutions grew equivalently in the f1(X)/|min f1(X)| direction, there was a gradual loss in the performance of f1(X)/|min f1(X)|. Conversely, the value of this non-dominated solution in the f2(X)/|min f2(X)| direction continuously decreased, while the performance of f2(X)/|min f2(X)| improved. Therefore, point C holds a critical position and is more appropriately defined as the recommended solution for a multi-objective optimization problem. Based on the characteristics of the Pareto front, this study proposes a method to calculate the optimal recommended value for the multi-objective function. However, there are several challenges associated with using this method. First, continuously generating a fixed change in the optimization direction is challenging. As illustrated in Figure 2, developing a consistent step Δc in the f1(X)/|min f1(X)| direction can be complex. Next, measuring the corresponding change in the other optimization direction presents additional difficulties. In this research, the optimization objective f1(X) was transformed into a constraint condition, while f2(X) was retained as a singular optimization objective function, as shown in Formula (14).
min J X = f 2 X | c s . t . g k X 0 , k = 1 , 2 , , K h l X 0 , l = 1 , 2 , , L x i lb x i x i ub , i = 1 , 2 , , m f 1 X c | min f 1 X | + min f 1 X
In Formula (14), a variable parameter c is introduced to control the feasibility range of the optimization problem in the direction f1(X). The objective is to minimize f2(X) under the parameter c, expressed as minimize f2(X)|c. When parameter c approaches zero or ∞, the optimization results of Formula (14) will converge to min(J1(X)) or min(J2(X)), respectively. Therefore, when parameter c changes from 0 to ∞, the Pareto front of the multi-optimization objective described in Formulas (12) and (13) could be formed. In Figure 2, when the control parameter c = Δc, the optimization results of Formula (14) will correspond to point B. When Δc is a fixed step size, the control parameter c increases, and the optimization results will rapidly shift from point B to point C. If the parameter c is continuously improved, the non-dominated solution will slowly move from point C to point D. Furthermore, if parameter c is increased in a fixed step, the deviation of non-dominated solutions will remain uniform in the direction of f1(X)/|min f1(X)|. Consequently, the deviation of f2(X)/|min f2(X)| can be calculated. This process enables the evaluation of the gains and losses of the two optimization objective functions as the non-dominated solution shifts along the Pareto front, which provides a framework for recommending the optimal solution. Based on the above analysis, the pseudo-code of the proposed method is listed in Algorithm 1.
Algorithm 1. Pseudo code of the proposed method.
Input: In a stand-alone wind-photovoltaic-battery system with the hybrid electrolyzer, the mathematical model is shown as Formulas (1)~(11) and (14). The step parameter and maximum iteration are defined as Δc and Nmax. Assuming that the number of iterations N is 0. The vector X includes PPV(t), PWIND(t), P BESS d (t), P BESS c (t), PLoad(t), PAWE(t), PPEME(t), u BESS d (t), u BESS c (t), CSOE(t), CSOH(t), VSELL(t), VAWE(t), and VPEME(t), t = 1, 2, …, T.
1Minimizing each single objective function J1(X) and J2(X) based on CPLEX optimization tool;
2The minimum value of each optimization objective function is obtained by min(J1(X)) and min(J2(X));
3The control parameter c←Δc;
4Based on Formula (14), min(J2(X)|c) is obtained;
5Under the above parameter c condition, J 1 N (X) is calculated;
6While N <= Nmax
7        The number of iterations NN + 1;
8        The control parameter cc + Δc;
9        Based on Formula (14), min(J2(X)|c) is obtained;
10        Under the above parameter c condition, J 1 N (X) and J 2 N (X) are calculated;
11        Δ J 2 N (X) ← | J 2 N (X) − J 1   2 N - (X)|;
12        The SlopeN← Δ J 2 N (X)/Δc;
13end
14index = argmax(SlopeN, N = 1, 2,…, Nmax) // argmax() is a function for finding an index at the maximum value of the variable
Output: ( J 1 i n d e x (X), J 2 i n d e x (X)) and X under the parameter index × Δc condition

4. Case Analysis and Discussion

4.1. Parameter Description

Based on the structure of the stand-alone wind-photovoltaic-battery system with the hybrid electrolyzer comprising both AWE and PEME that is shown in Figure 1, a simulation model was constructed to validate the efficacy of the proposed methodology. This simulation case incorporated a PVG, WTG, a lithium-ion BESS, AWE unit, PEME unit, and HST. The system parameters are detailed in Table 1 [31,33,34]. The unit of hydrogen production cost refers to the Chinese CNY, ¥. Figure 3 shows the power curves of the load, PVGs, and WTGs in a day. The time interval was Δt = 1 h, resulting in a total simulation time of T = 24 h. In this study, the HST was assumed to possess sufficient capacity, and the purity of hydrogen and the form of hydrogen produced remained consistent across different electrolyzer configurations. These ensured equivalent conditions for both single-type electrolyzers and hybrid electrolyzer configurations within the proposed framework.
Table 1 illustrates various energy types in this simulation case including PVGs, WTGs, BESS, and hydrogen energy. The hybrid electrolyzer in this system comprised both AWE and PEME. AWE offers significant advantages regarding investment and hydrogen production costs; however, PEME is notably more efficient. Consequently, a hybrid electrolyzer will leverage the advantages of both AWE and PEME, enhancing the economic viability and energy utilization efficiency.
Figure 3 shows that for most of the day (areas A, C and E), the output power of the new energy source exceeded the power required by the load. The peak surplus power occurred at 12 h, demonstrating an excess power generation capacity exceeding 90 MW. Under stand-alone conditions, this discrepancy can lead to a significant waste of wind and photovoltaic energy. However, this issue can be addressed by producing and selling hydrogen energy. Conversely, there were times when the power consumption of the load surpassed that of the new energy source such as area B (6:00~9:00) and area D (19:00~22:00). In particular, at 20:00, the demand exceeded 30 MW. To ensure that the power consumption of the load is met, a BESS should be integrated into this energy system.
Meanwhile, this study compared the proposed method with other standard multi-objective optimization methods. Method 1 is an equal-weight method, and method 2 is a tolerance minimization method. The optimization objective functions are shown in Formulas (15) and (16), respectively. In addition, the constraint conditions for methods 1 and 2 are shown in Formula (13).
min J X = J 1 X min J 1 X + J 2 X min J 2 X
min J X = r s . t . f 1 X r | min f 1 X | + min f 1 X f 2 X r | min f 2 X | + min f 2 X

4.2. Results Analysis

Based on the above simulation parameters, the mathematical model of the stand-alone wind-photovoltaic-battery system with a hybrid electrolyzer was optimized by each single objective function. To demonstrate the performance of the hybrid electrolyzer, the optimization results of AWE, PEME, and AWE + PEME were compared with the proposed method. The optimization results for each objective function and the configuration outcomes under the three electrolyzer applications are illustrated in Table 2 and Figure 4, respectively.
Table 2 and Figure 4 demonstrate that when the economy of hydrogen production J1 was taken as the optimization objective, the rated power of AWE and PEME was 40.27 MW and 33.23 MW in the hybrid electrolyzer, respectively. The objective function value for J1 was the smallest at 442,790.62, and the objective function value for J2 was 1216, less than the 1259.66 from a 69.59 MW single AWE electrolyzer. Similarly, when the utilization rate of hydrogen production J2 was a single optimization objective, the planning results showed that the hybrid electrolyzer operated at a single rated power of 62.15 MW for the PEME. Here, the objective function value for J2 was the smallest at 905.29, and the objective function value for J1 was 478,127.59, smaller than the 486,189.99 from a single AWE electrolyzer with the same rated power. This demonstrates that the hybrid electrolyzer has clear advantages over a single AWE electrolyzer. Conversely, when compared with a single PEME electrolyzer under the objective of J2, the optimization results indicate that the rated power of AWE is zero, suggesting that PEME is significantly more efficient in terms of the hydrogen production utilization rate. When focusing on the economy of hydrogen production J1, the hybrid electrolyzer outperformed a single PEME electrolyzer due to the substantial cost advantage of AWE applications.
Figure 5 displays the implementation process of the proposed method and compares the results with other methods, which showed a significant contradiction between the two optimization objective functions. Specifically, as one optimization object’s value decreased, the other’s value increased. The Pareto front shown in Figure 5 was divided into three distinct regions: AB, BC, and CD. Each region represents notable differences in slope. In the AB region, while f1(X)/|min f1(X)| increased slowly, f2(X)/|min f2(X)| decreased rapidly. This means that by relaxing the optimization requirements for objective function J1, a greater benefit can be achieved for optimization objective J2, which is worthwhile. After moving into the BC region, the decrease in f2(X)/|min f2(X)| became more gradual, indicating that the cost of sacrificing optimization objective J1 to improve J2 was increasing. In the CD region, after incurring significant losses on optimization objective J1, the resulting benefit gained on optimization objective J2 was minimal, which is quite unreasonable. Furthermore, observing the changes in slope along the Pareto front, point B showed the most dramatic variation. Therefore, it is justifiable that point B should be recommended as the optimal solution. Notably, compared with the other methods, point B was successfully identified by the proposed method in this study. In contrast, the recommended results of methods 1 and 2 were situated near the intersection point C between the BC and CD regions, respectively. This means that the proposed method is effective and excellent.
Figure 6 and Table 3 present the rated power of the hybrid electrolyzer along with the optimization objective function values derived from different optimization methods. In Figure 6 and Table 3, when using the optimization objective min(J2) with method 1, the configuration result of the hybrid electrolyzer was a single PEME. This indicates that the utilization rate of hydrogen production was overly focused, and a relatively one-sided result was obtained. In contrast, when applying min(J1), the planning result revealed a hybrid electrolyzer composed of AWE and PEME. However, this approach excessively reduced the cost of hydrogen production, which significantly increased the loss of hydrogen production. Consequently, the rated power of the hybrid electrolyzer tended to be relatively high. When comparing method 1 with the proposed method, the total rated power of the hybrid electrolyzer remained consistent, although the proportions of AWE and PEME differed. Notably, the proposed method further reduced the hydrogen production costs by increasing the proportion of AWE within the hybrid electrolyzer. However, this came at the expense of a higher hydrogen production loss, which was mainly manifested by the low hydrogen production efficiency of AWE.
Compared with the results of a single optimization objective in Table 3, the total rated power of the hybrid electrolyzer, when assessed using multi-objective functions and the proposed method, matched min(J2) but was lower than min(J1). Under the hybrid electrolyzer structure, when focusing on a single optimization objective of minimizing the economy of hydrogen production, the proposed method decreased by 1.00% and increased by 21.71% in the economy and utilization of hydrogen production, respectively. Furthermore, compared with a single optimization objective minimizing the loss of hydrogen production, the utilization and economy of hydrogen production were reduced by 5.22% and increased by 6.46%, respectively. Overall, the proposed method achieved a better balance between the optimization objectives than the results from a single optimization objective, making it more advantageous.

4.3. Discussion

To further analyze the influence of the AWE and PEME technical parameters on the configuration results of the hybrid electrolyzer, Figure 7 depicts the optimization objective function value and the rated power of the hybrid electrolyzer based on the proposed method, considering different hydrogen production efficiencies of AWE and PEME. Subsequently, as the hydrogen production costs of AWE and PEME varied, Figure 8 presents the values of the optimization objective function and the rated power of the hybrid electrolyzer. Additionally, Figure 9 shows the optimization results of changing the investment costs for AWE and PEME.
The hydrogen production efficiency of AWE and PEME significantly influences the configuration ratio between these two technologies in a hybrid electrolyzer, as illustrated in Figure 7. When the hydrogen production efficiency of AWE exceeded 72%, the hybrid electrolyzer predominantly operated in a single AWE form, and the efficiency of PEME did not impact the system. This is primarily because AWE’s efficiency increases its cost advantages. Conversely, when the hydrogen production efficiency of AWE fell below 72%, a decline in AWE’s efficiency or an increase in PEME’s efficiency led to a higher proportion of PEME in the hybrid system. This shift highlights PEME’s advantages in hydrogen production efficiency, enabling the production of more hydrogen for sale under the same power conditions, which improves the economic viability of the hydrogen production system. In terms of optimization objectives, compared with improvements in PEME’s efficiency, AWE held a more significant role in achieving optimization objective J1. If PEME’s hydrogen production efficiency is below 78%, a decrease in AWE’s efficiency will result in the hybrid electrolyzer reverting to a single AWE configuration while maintaining constant rated power. This will lead to an increase in the value of the objective function J2. Conversely, if PEME’s hydrogen production efficiency exceeds 78% and AWE’s efficiency decreases, the proportion of PEME will increase, resulting in a decrease in the value of objective function J2. Therefore, the hydrogen production efficiencies of AWE and PEME are critical technical indicators that determine the composition and hybrid ratio of the hydrogen electrolyzer.
In Figure 8, when AWE’s per unit hydrogen production cost reduced or the per unit hydrogen production cost of PEME increased, the hydrogen production electrolyzer was a single AWE. Conversely, a single PEME form was presented. Conversely, when the AWE’s per-unit hydrogen production cost was fixed and the cost of PEME changed, various configurations could be observed in the hydrogen production electrolyzer. For instance, if the per unit hydrogen production cost of AWE is 20 ¥/kg, and the per unit hydrogen production cost of PEME is less than 25 ¥/kg or greater than 31 ¥/kg, the hydrogen production electrolyzer will consist of either a single PEME or AWE. However, when the per unit hydrogen production cost of PEME falls between 25 ¥/kg and 31 ¥/kg, a mixed configuration of AWE and PEME will be used. This indicates that the relative costs of hydrogen production between AWE and PEME are crucial in determining the optimal structure of the hydrogen production electrolyzer. In terms of optimization objective functions, compared with the decreasing per unit hydrogen production cost of AWE, the PEME had a more significant effect on optimization objective J1, which exhibited monotonicity. As the proportion of PEME rose, the optimization objective function J2 declined substantially. In contrast, the optimization objective function J2 increased significantly. The makeup of the hydrogen production electrolyzer considerably influences the optimization objective function J2. Thus, the relative per unit hydrogen production cost of AWE and PEME is a key technical indicator determining the composition and hybrid ratio of hydrogen production. This relationship is critical, as it fundamentally affects the optimization objective function J2.
In Figure 9, when the per unit power investment cost of AWE ranged from 600 ¥/MW to 1600 ¥/MW, and that of PEME ranged from 3500 ¥/MW to 4500 ¥/MW, the hydrogen production electrolyzer operated under a hybrid electrolyzer framework. The planning results of the hybrid electrolyzer depend on the relative power investment cost of AWE and PEME; the rated power does not only show monotonicity in a single direction. For instance, as AWE’s per unit power investment cost decreases, mainly when it falls below 1100 ¥/MW, the proportion of AWE increases. However, this increase is significantly impacted by the per unit power investment cost of PEME. Regarding the optimization objective functions, the per unit power investment costs of AWE and PEME exerted a substantial and monotonic effect on the optimization objective function J1. For example, if the AWE’s per unit power investment cost is less than 850 ¥/MW, the proportion of AWE rises. This leads to a significant increase in hydrogen production resource losses. Conversely, if the per unit power investment cost of AWE exceeds 1200 ¥/MW, the proportion of PEME increases, significantly reducing the hydrogen production losses.
Under the stand-alone operation condition, the supply of new energy and the consumption of power loads significantly influence the hybrid electrolyzer’s planning results. Therefore, Figure 10 examines the hybrid electrolyzer’s configuration results based on varying the permissible abandonment rates of new energy sources and allowable cut-off rates of the load.
Figure 10 illustrates that if the abandonment of new energy increases, the total rated power of hybrid electric generators will decrease. Consequently, a higher hydrogen production efficiency is required to satisfy the demand for hydrogen energy supply. As a result, the rated power of PEME in the hybrid electrolyzer remains relatively constant, while the rated power of AWE decreases. Moreover, with the permissible cut-off rate of load ascending, the rated power of PEME increases to remain steady, but AWE will slowly decrease and then be scaled up. This shows that if the electricity consumption of other loads is reduced, the total rated power of the hybrid electrolyzer will increase. In the newly added power of the hybrid electrolyzer, the proportion of AWE and PEME will be affected by the hydrogen production efficiency and cost parameters. Regarding the optimization objective functions, the abandonment rate of new energy had almost no effect on optimization objective function J1. However, as the permissible cut-off rate of load rose, the optimization objective function J2 showed a linear and rapid decline. This decrease can be attributed to the expansion of total rated power within the hybrid electrolyzer. The optimization objective function J2 is constrained by both the permissible abandonment rate of new energy and the permissible cut-off rate of load. An increase in the new energy’s abandonment rate results in a decline in optimization objective function J2, primarily due to reduced hydrogen production power. When the permissible cut-off rate of load increases, the optimization objective function J2 will gradually decrease and then be promoted. However, if the permissible cut-off rate of the load further increases, the rated power of AWE, which has lower hydrogen production costs, will also increase. This will lead to an increase in optimization objective function J2, which represents hydrogen production losses.

5. Conclusions

To take advantage of the low cost of AWE and high efficiency of PEME, a hydrogen production hybrid electrolyzer combining both AWE and PEME was implemented in a stand-alone wind-photovoltaic-battery system. Subsequently, a multi-objective optimization model was developed, focusing on the economy and efficiency of hydrogen production. The main conclusions are as follows.
(1)
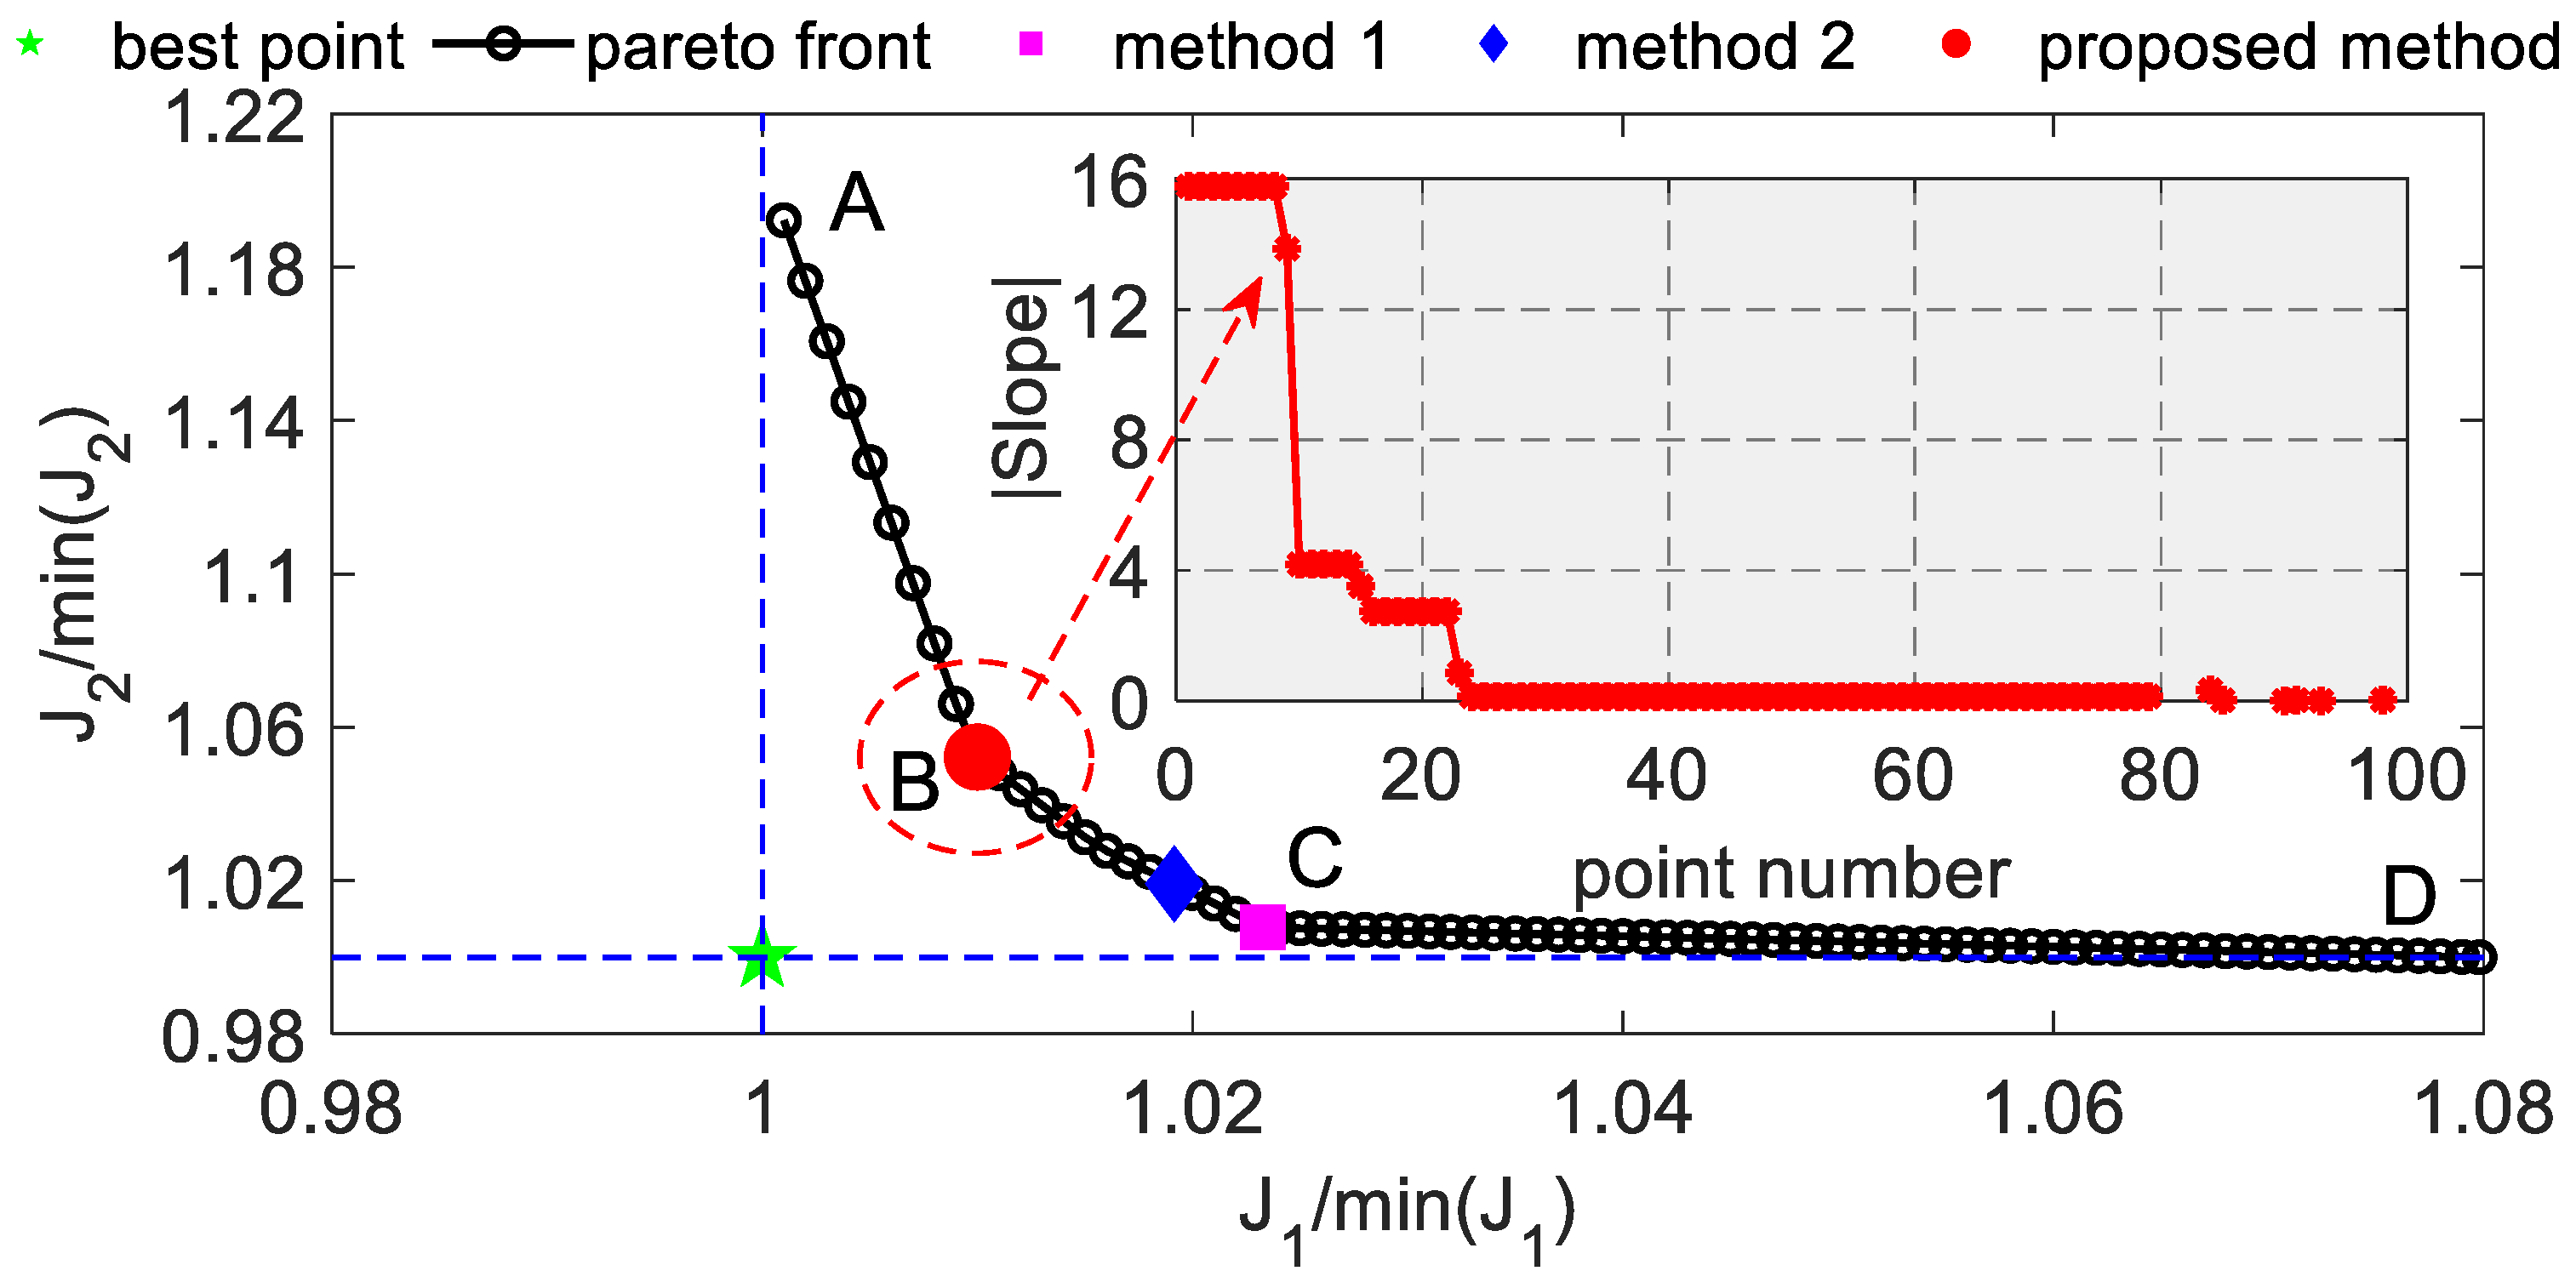
An adjustable parameter was introduced to transform a multi-objective problem into a single-objective optimization problem with specific parameter constraints. This allowed for the effective and controllable drawing of the Pareto front associated with the multi-objective optimization problem. The adjustable parameter can be quantitatively modified by stepping; the non-dominated solution that exhibits the most significant change in slope is recommended as the optimal solution. This has provided a new approach for selecting recommended solutions for multi-objective optimization problems.
(2)
A hybrid electrolyzer that combines AWE and PEME can effectively balance the costs and losses of hydrogen production. This approach takes advantage of AWE’s lower production costs and PEME’s higher efficiency. In terms of the composition of hydrogen production, a hybrid electrolyzer based on AWE and PEME can better balance the economy and losses of hydrogen production. As a result, the complementary advantages of the hydrogen production cost of AWE and the hydrogen production efficiency of PEME can be fully leveraged. With the changing efficiency and costs of hydrogen production methods, particularly AWE and PEME, if AWE’s efficiency improves or if PEME’s costs decrease, the design of hydrogen production electrolyzers is likely to transition to a unified structure.
(3)
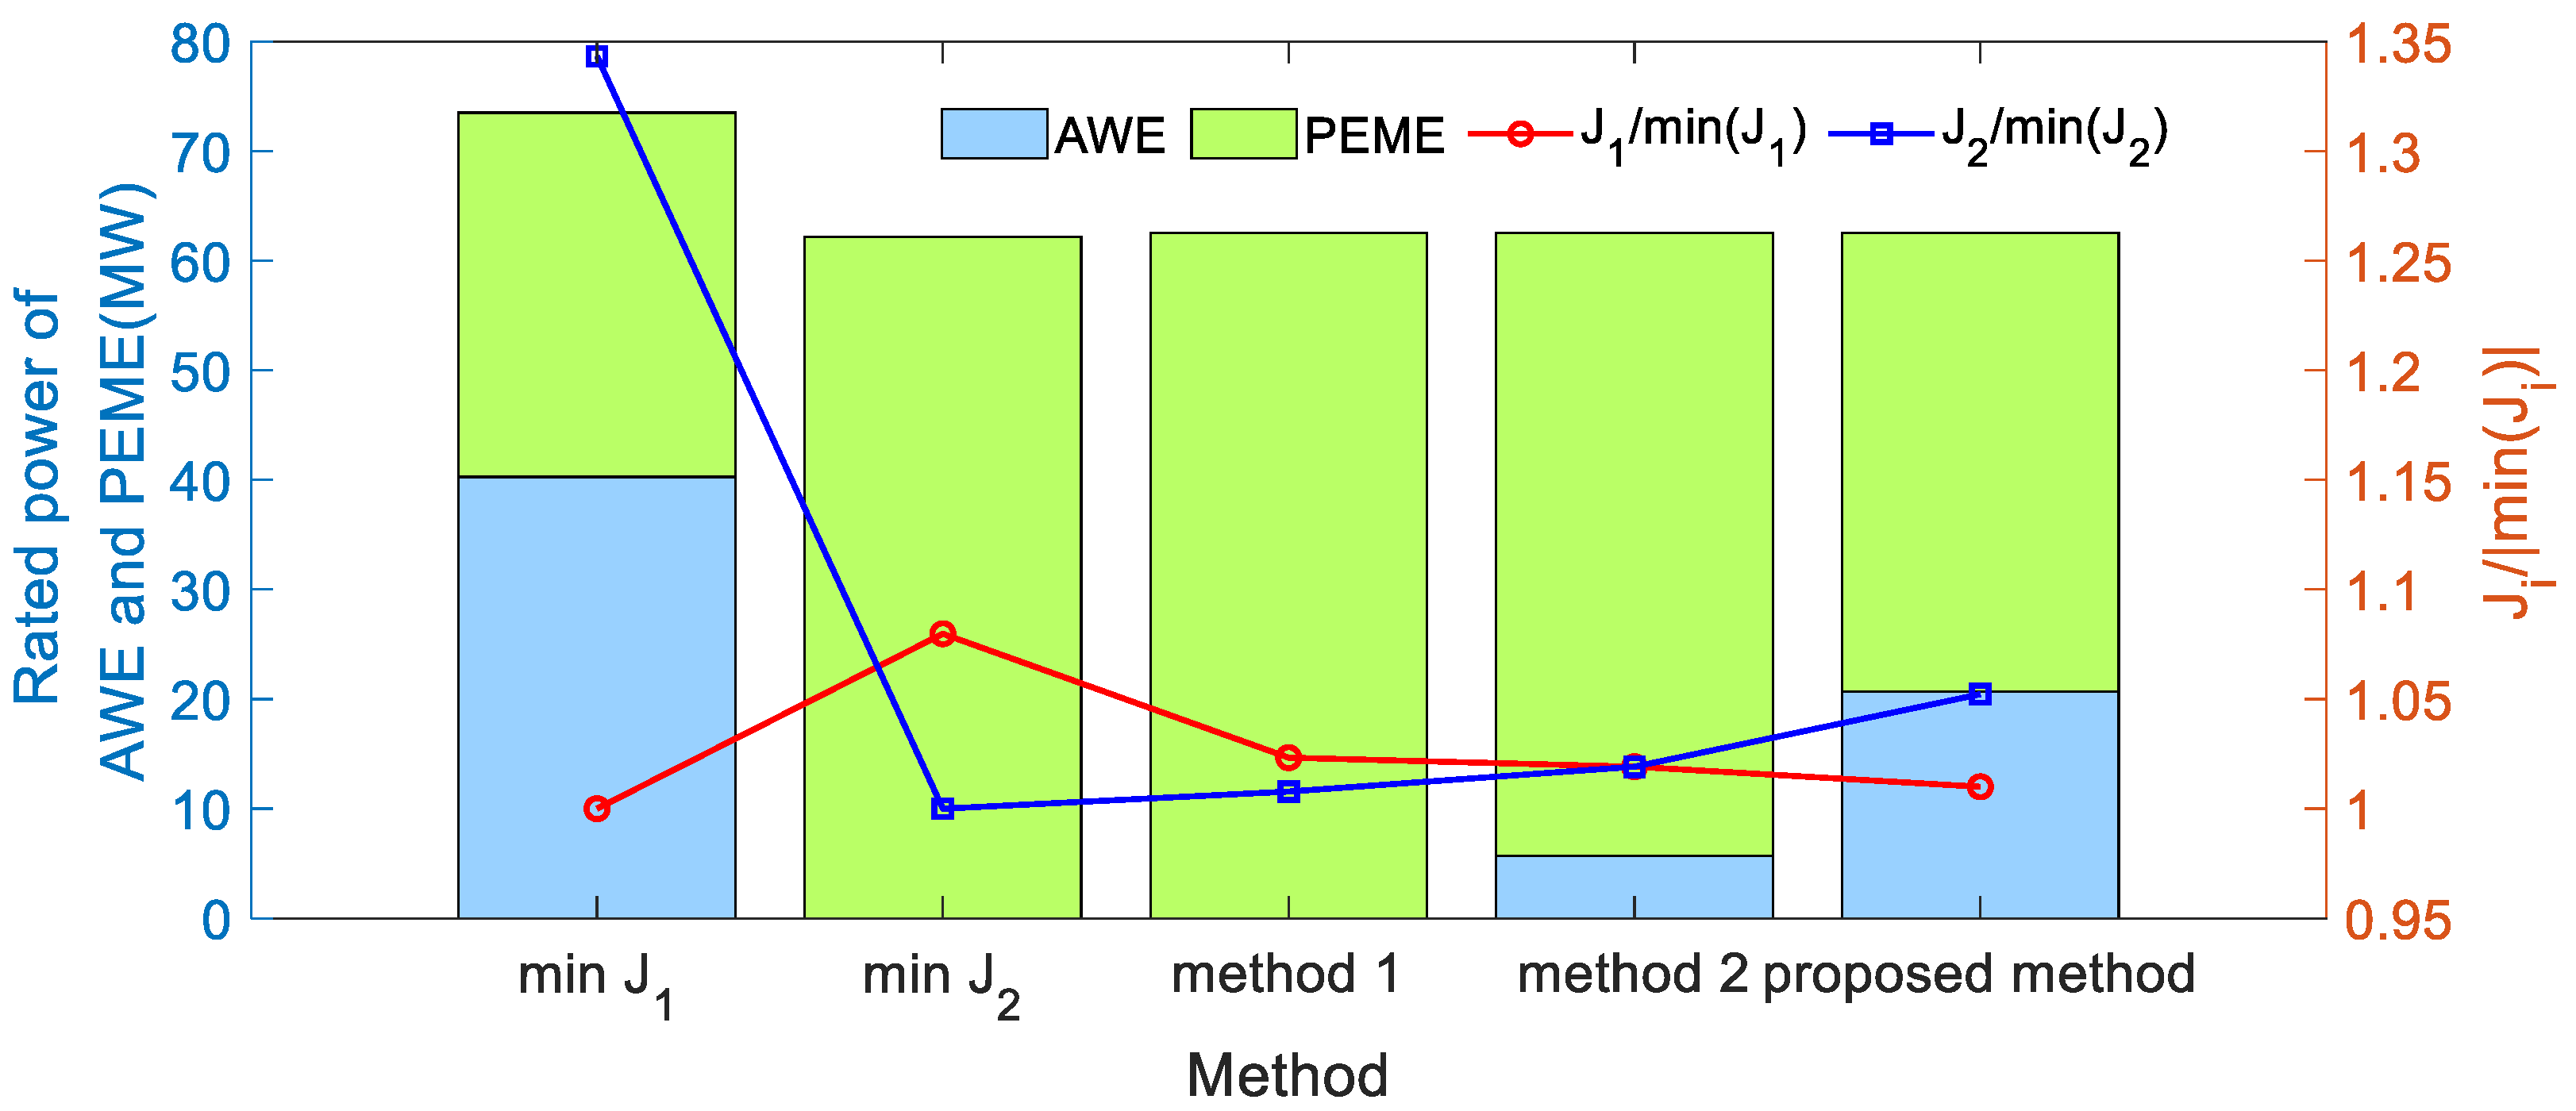
Under the structure of a hybrid electrolyzer compared with a single optimization objective function focused solely on minimizing the cost of hydrogen production, the proposed method achieved notable improvements. Specifically, this approach resulted in a 1.00% decrease in production costs while increasing hydrogen utilization by 21.71%. Additionally, compared with the single optimization objective function minimizing the loss of hydrogen production, the utilization and economy of hydrogen production were reduced by 5.22% and increased by 6.46%, respectively.
(4)
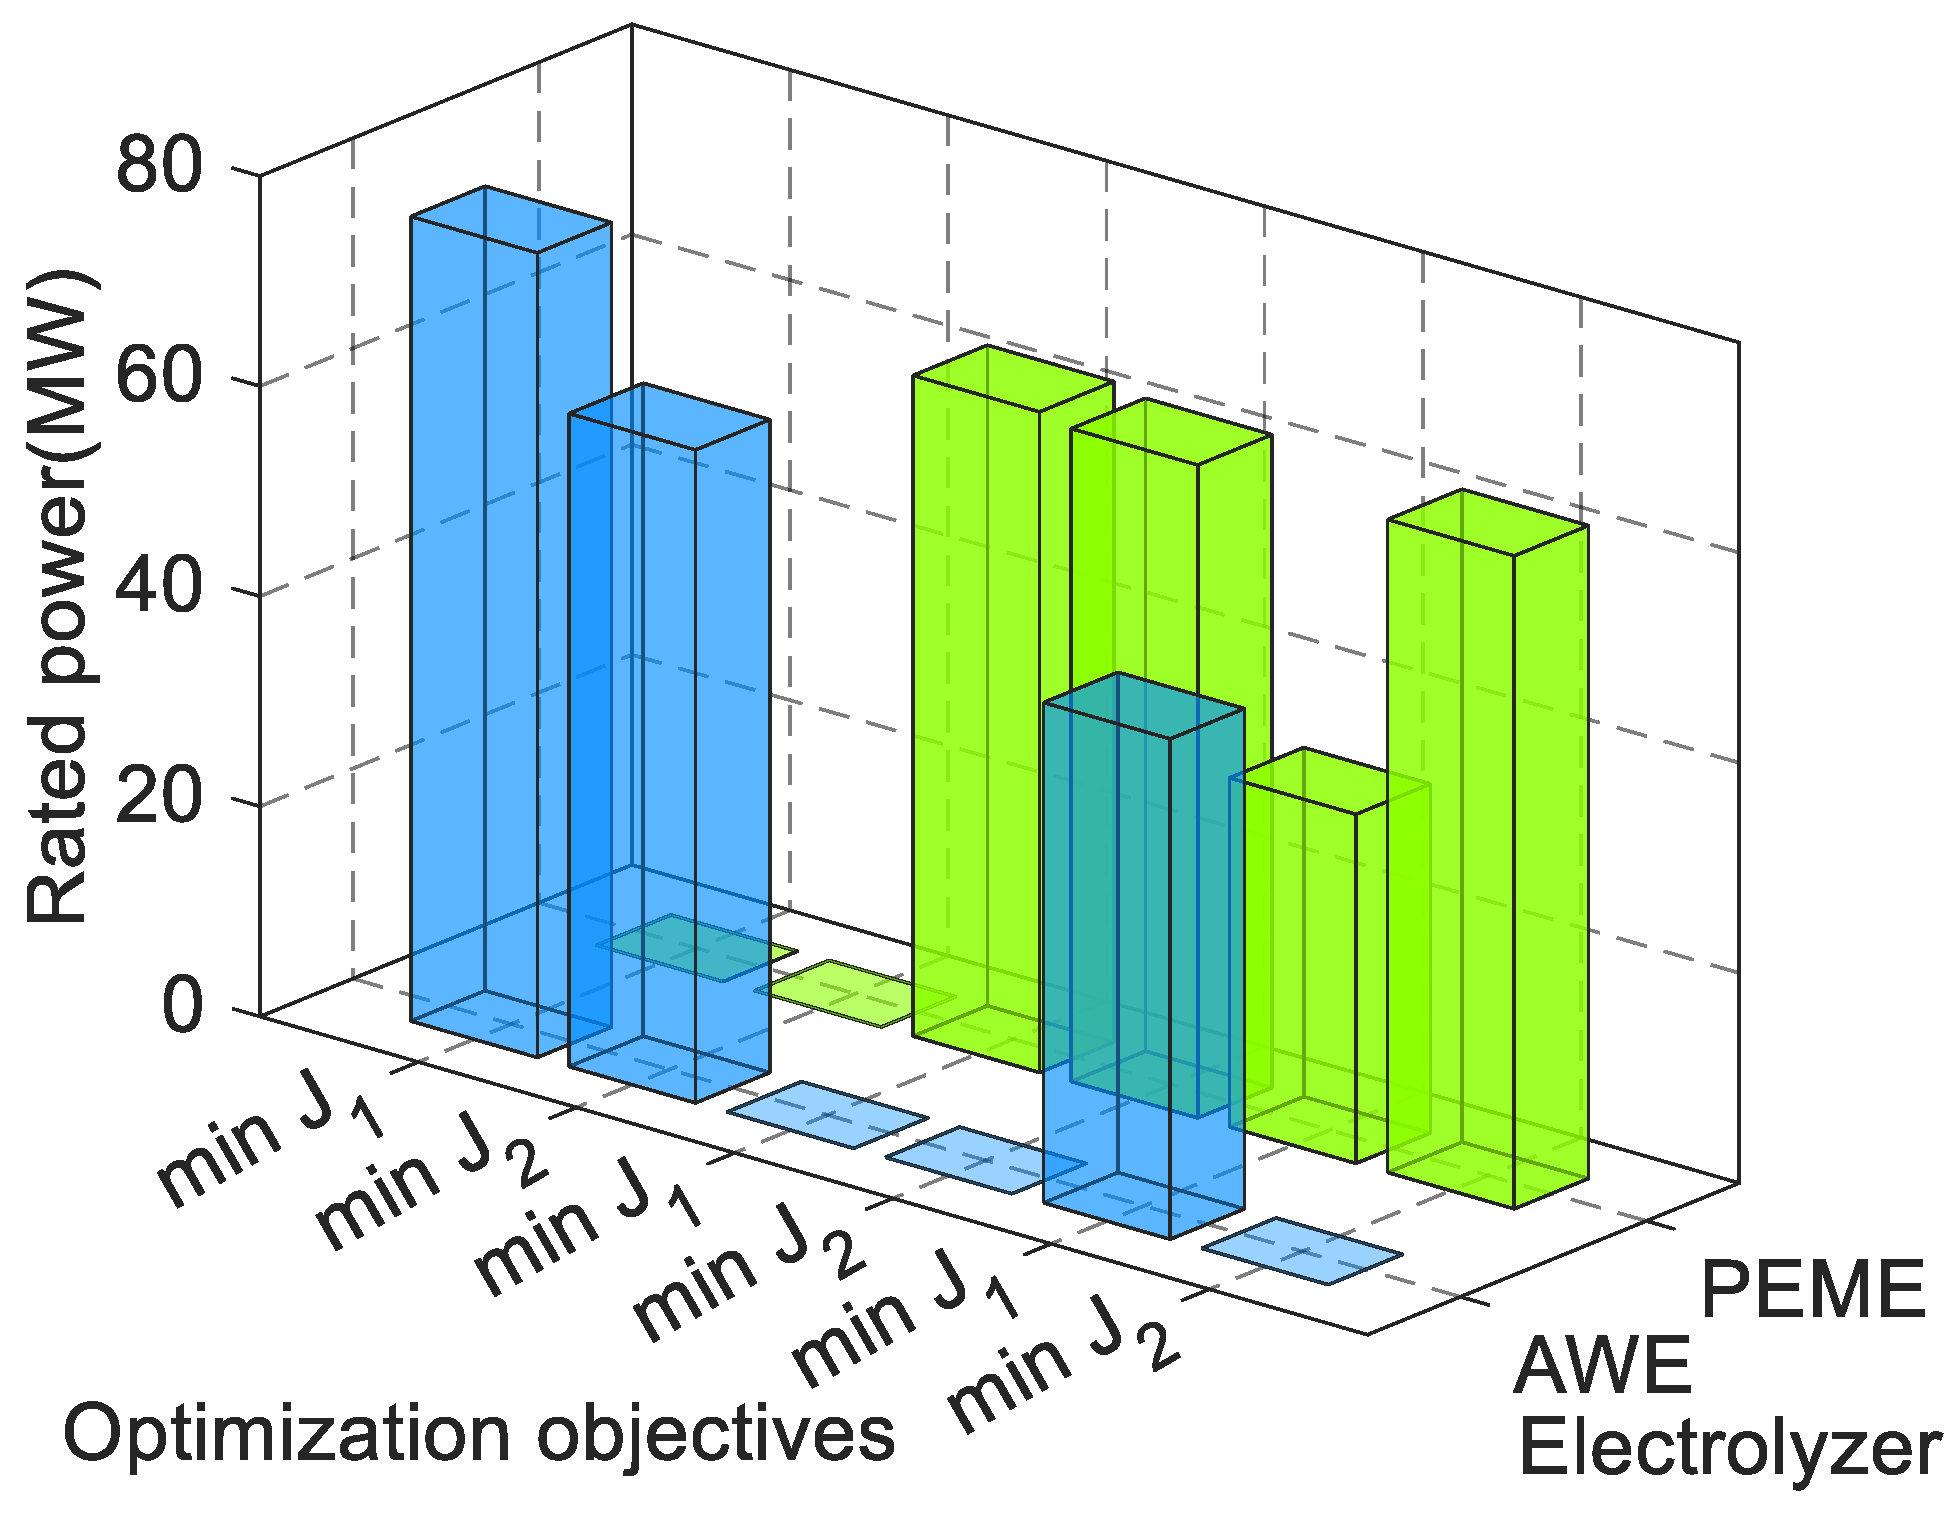
In a stand-alone wind-photovoltaic-battery system with a hybrid electrolyzer, when the hydrogen production efficiency of AWE falls below 72%, the proportion of PEME will significantly increase. In terms of per unit hydrogen production and investment construction cost, the relative value between AWE and PEME is crucial in determining the composition of the hydrogen production electrolyzer. Furthermore, under stand-alone conditions, the relationship between the new energy source and load electricity consumption is a key factor influencing the hybrid electrolyzer’s total rated power and composition ratio.
The physical processes and operational parameters governing hydrogen production, storage, and the levelized cost of the system constitute critical determinants of electrolyzer capacity. The refinement of the system’s mathematical model represents a central focus for subsequent research efforts. Furthermore, the variability in renewable energy generation capacity and the fluctuations in end-user electricity demand under extreme weather conditions are pivotal factors that significantly influence the operational performance and cost viability of hydrogen production units within a stand-alone system. These critical aspects necessitate comprehensive and in-depth investigation.

Author Contributions

Conceptualization, S.M.; Methodology, S.M. and M.C.; Validation, Z.M. and Y.M.; Formal analysis, Y.M. and Y.J.; Writing—original draft, S.M. and Z.M.; Writing—review and editing, Y.M. and M.C.; Visualization, Y.J.; Funding acquisition, S.M. All authors have read and agreed to the published version of the manuscript.

Funding

This research was funded by the R&D Program of the Beijing Municipal Education Commission (KM202410009013).

Institutional Review Board Statement

Not applicable.

Informed Consent Statement

Not applicable.

Data Availability Statement

The data used to support the findings of this study are available from the first author upon request.

Conflicts of Interest

Author Mingxuan Chen was employed by the company China Three Gorges Technology Co., Ltd. The remaining authors declare that the research was conducted in the absence of any commercial or financial relationships that could be construed as a potential conflict of interest.

Nomenclature

AWEAlkaline electrolyzer C SOE D , C SOE U The lower and upper range of the SOE
PEMEProton exchange membrane electrolyzerCSOHSOH of the HST
BESSBattery energy storage systemVSELLThe volume of hydrogen sold
PVGsPhotovoltaic power generation systemVAWE, VPEMEThe volume of hydrogen produced by AWE and PEME
WTGsWind turbine power generation systemρH2Hydrogen density
SOEState of energy V HESS N Rated capacity of the HST
SOHState of hydrogen V SELL max Maximum volume of hydrogen sold
HSTHydrogen storage tankηAWE, ηPEMEHydrogen production efficiency of AWE and PEME
PPVActual output power of the PVGs λ H 2 AWE , λ H 2 PEME The electric hydrogen ratio of AWE and PEME
P PV N Rated power of PVGsαAWE, αPEMEThe climbing rate of AWE and PEME
PWINDActual output power of the WTGs P AWE min , P AWE max Minimum and maximum power of AWE
P WIND N Rated power of WTGs P PEME min , P PEME max Minimum and maximum power of PEME
P BESS d , P BESS c Discharging and charging power of the BESS P AWE N , P PEME N Rated power of AWE and PEME
PLoadActive power of the load C SOH D , C SOH U Lower and upper range of the SOH
PAWEHydrogen production power of AWE C SOH init Initial SOH of the HST
PPEMEHydrogen production power of PEMEδ2Cut-off rate of load
δ1Abandonment rate of new energy source c PV , cWINDCost per kW/h of PVGs, and WTGs
CSOESOE of the BESScBESSCost per kW/h of BESS
S BESS N Rated capacity of the BESS c i inv The investment cost of AWE or PEME
ηd, ηcDischarging and charging efficiency of the BESS c i Pro Hydrogen production cost of AWE or PEME
u BESS d , u BESS c Discharging and charging state of the BESS c SELL Hydrogen sales revenue
C SOE init Initial SOE of the BESSγDiscount rate

References

  1. Alanazi, K.; Mittal, S.; Hawkes, A.; Shah, N. Renewable hydrogen trade in a global decarbonised energy system. Int. J. Hydrogen Energy 2025, 101, 712–730. [Google Scholar] [CrossRef]
  2. Nasser, M.; Megahed, T.F.; Ookawara, S.; Hassan, H. A Review of Water Electrolysis-Based Systems for Hydrogen Production Using Hybrid/Solar/Wind Energy Systems. Environ. Sci. Pollut. Res. 2022, 29, 86994–87018. [Google Scholar] [CrossRef] [PubMed]
  3. Awad, M.; Said, A.; Saad, M.H.; Farouk, A.; Mahmoud, M.M.; Alshammari, M.S.; Omar, A.I. A Review of Water Electrolysis for Green Hydrogen Generation Considering Pv/Wind/Hybrid/Hydropower/Geothermal/Tidal and Wave/Biogas Energy Systems, Economic Analysis, and Its Application. Alex. Eng. J. 2024, 87, 213–239. [Google Scholar] [CrossRef]
  4. De León, C.M.; Ríos, C.; Brey, J.J. Cost of Green Hydrogen: Limitations of Production from A Stand-Alone Photovoltaic System. Int. J. Hydrogen Energy 2023, 48, 11885–11898. [Google Scholar] [CrossRef]
  5. Van, L.P.; Hoang, L.H.; Duc, T.N. A Comprehensive Review of Direct Coupled Photovoltaic-Electrolyser System: Sizing Techniques, Operating Strategies, Research Progress, Current Challenges, and Future Recommendations. Int. J. Hydrogen Energy 2023, 48, 25231–25249. [Google Scholar] [CrossRef]
  6. Escamilla, A.; Sánchez, D.; García-Rodríguez, L. Techno-economic study of Power-to-Power renewable energy storage based on the smart integration of battery, hydrogen, and micro gas turbine technologies. Energy Convers. Manag. X 2023, 18, 100368. [Google Scholar] [CrossRef]
  7. Barhoumi, E.M.; Belgacem, I.B.; Zghaibeh, M.; Tlili, I. Optimal Sizing of Photovoltaic Systems Based Green Hydrogen Refueling Stations Case Study Oman. Int. J. Hydrogen Energy 2022, 47, 31964–31973. [Google Scholar] [CrossRef]
  8. Lehmann, J.; Wabbes, A.; Gonzalez, E.M.; Scheerlinck, S. Levelized Cost of Hydrogen Calculation from Off-Grid Photovoltaic Plants Using Different Methods. Sol. RRL 2022, 6, 2100482. [Google Scholar] [CrossRef]
  9. Zhao, D.; Xia, Z.; Guo, M.; He, Q.; Xu, Q.; Li, X.; Ni, M. Capacity Optimization and Energy Dispatch Strategy of Hybrid Energy Storage System Based on Proton Exchange Membrane Electrolyzer Cell. Energy Convers. Manag. 2022, 272, 116366. [Google Scholar] [CrossRef]
  10. Escamilla, A.; Sánchez, D.; García-Rodríguez, L. Assessment of power-to-power renewable energy storage based on the smart integration of hydrogen and micro gas turbine technologies. Int. J. Hydrogen Energy 2022, 47, 17505–17525. [Google Scholar] [CrossRef]
  11. Molu, R.J.J.; Naoussi, S.R.D.; Wira, P.; Mbasso, W.F.; Kenfack, S.T.; Das, B.K.; Ali, E.; Alshareef, M.J.; Ghoneim, S.S.M. Optimizing Technical and Economic Aspects of Off-Grid Hybrid Renewable Systems: A Case Study of Manoka Island, Cameroon. IEEE Access 2023, 11, 130909–130930. [Google Scholar] [CrossRef]
  12. Mohammed, A. An Optimization-Based Model for A Hybrid Photovoltaic-Hydrogen Storage System for Agricultural Operations in Saudi Arabia. Processes 2023, 11, 1371. [Google Scholar] [CrossRef]
  13. Babatunde, O.M.; Munda, J.L.; Hamam, Y. Off-Grid Hybrid Photovoltaic-Micro Wind Turbine Renewable Energy System with Hydrogen and Battery Storage: Effects of Sun Tracking Technologies. Energy Convers. Manag. 2022, 255, 115335. [Google Scholar] [CrossRef]
  14. Moltames, R.; Assareh, E.; Mohammadi Bouri, F.; Azizimehr, B. Simulation and Optimization of a Solar Based Trigeneration System Incorporating PEM Electrolyzer and Fuel Cell. Sol. Energy 2021, 6, 664–677. [Google Scholar]
  15. Cecilia, A.; Carroquino, J.; Roda, V.; Costa-Castelló, R.; Barreras, F. Optimal Energy Management in a Standalone Microgrid, with Photovoltaic Generation, Short-Term Storage, and Hydrogen Production. Energies 2020, 13, 1454. [Google Scholar] [CrossRef]
  16. Wu, G.; Li, T.; Xu, W.; Xiang, Y.; Su, Y.; Liu, J.; Liu, F. Chance-Constrained Energy-Reserve Co-Optimization Scheduling of Wind-Photovoltaic-Hydrogen Integrated Energy Systems. Int. J. Hydrogen Energy 2023, 48, 6892–6905. [Google Scholar] [CrossRef]
  17. Menesy, A.S.; Almomin, S.; Sultan, H.M.; Habiballah, I.O.; Gulzar, M.M.; Alqahtani, M.; Khalid, M. Techno-Economic Optimization Framework of Renewable Hybrid Photovoltaic/Wind Turbine/Fuel Cell Energy System Using Artificial Rabbits Algorithm. IET Renew. Power Gener. 2024, 18, 2907–2924. [Google Scholar] [CrossRef]
  18. Ren, Y.; Jin, K.; Gong, C.; Hu, J.; Liu, D.; Jing, X.; Zhang, K. Modelling and Capacity Allocation Optimization of a Combined Pumped Storage/Wind/Photovoltaic/Hydrogen Production System Based on the Consumption of Surplus Wind and Photovoltaics and Reduction of Hydrogen Production Cost. Energy Convers. Manag. 2023, 296, 117662. [Google Scholar] [CrossRef]
  19. Ke, Y.; Tang, H.; Liu, M.; Meng, Q.; Xiao, Y. Optimal Sizing for Wind-Photovoltaic-Hydrogen Storage Integrated Energy System Under Intuitionistic Fuzzy Environment. Int. J. Hydrogen Energy 2023, 48, 34193–34209. [Google Scholar] [CrossRef]
  20. Ma, S.; Wu, Y.; Li, J.; Hou, X.; Li, D. Economic Planning Method of Energy Storage System to Improve Grid Reliability. Acta Energiae Solaris Sin. 2024, 45, 251–262. [Google Scholar]
  21. Meng, G.; Ding, Y.; Pau, G.; Yu, L.; Tan, W. Multi-Objective Capacity Optimization Configuration of Independent Wind-Photovoltaic-Hydrogen-Battery System Based on Improved Mossa Algorithm. Front. Energy Res. 2023, 10, 1077462. [Google Scholar]
  22. Mukoni, E.; Garner, K.S. Multi-Objective Non-Dominated Sorting Genetic Algorithm Optimization for Optimal Hybrid (Wind and Grid)-Hydrogen Energy System Modelling. Energy 2022, 15, 7079. [Google Scholar] [CrossRef]
  23. Niu, M.; Li, X.; Sun, C.; Xiu, X.; Wang, Y.; Hu, M.; Dong, H. Operation Optimization of Wind/Battery Storage/Alkaline Electrolyzer System Considering Dynamic Hydrogen Production Efficiency. Energy 2023, 16, 6132. [Google Scholar] [CrossRef]
  24. Li, Z.; Liu, Y.; Du, M.; Cheng, Y.; Shi, L. Modeling and Multi-Objective Optimization of a Stand-Alone Photovoltaic-Wind Turbine-Hydrogen-Battery Hybrid Energy System Based on Hysteresis Band. Int. J. Hydrogen Energy 2023, 48, 7959–7974. [Google Scholar] [CrossRef]
  25. Zhang, Y.; Sun, H.; Tan, J.; Li, Z.; Hou, W.; Guo, Y. Capacity Configuration Optimization of Multi-Energy System Integrating Wind Turbine/Photovoltaic/Hydrogen/Battery. Energy 2022, 252, 124046. [Google Scholar] [CrossRef]
  26. Attemene, N.S.; Agbli, K.S.; Fofana, S.; Hissel, D. Optimal Sizing of a Wind, Fuel Cell, Electrolyzer, Battery and Supercapacitor System for Off-Grid Applications. Int. J. Hydrogen Energy 2020, 45, 5512–5525. [Google Scholar] [CrossRef]
  27. Alili, H.; Mahmoudimehr, J. Techno-Economic Assessment of Integrating Hydrogen Energy Storage Technology with Hybrid Photovoltaic/Pumped Storage Hydropower Energy System. Energy Convers. Manag. 2023, 294, 117437. [Google Scholar] [CrossRef]
  28. Zheng, Y.; You, S.; Bindner, H.W.; Münster, M. Incorporating Optimal Operation Strategies into Investment Planning for Wind/Electrolyser System. CSEE J. Power Energy Syst. 2022, 8, 347–359. [Google Scholar]
  29. Tebibel, H. Methodology for multi-objective optimization of wind turbine/battery/electrolyzer system for decentralized clean hydrogen production using an adapted power management strategy for low wind speed conditions. Energy Convers. Manag. 2021, 238, 114125. [Google Scholar] [CrossRef]
  30. Su, W.; Li, Q.; Zheng, W.; Han, Y.; Yu, Z.; Bai, Z.; Han, Y. Enhancing Wind-Solar Hybrid Hydrogen Production Through Multi-State Electrolyzer Management and Complementary Energy Optimization. Energy Rep. 2024, 11, 1774–1786. [Google Scholar] [CrossRef]
  31. Guo, F.; Xu, G.; Wang, X.; Zhang, Y.; Xu, C.; Wang, Y. A Planning Method for Off-grid Wind-Solar Hydrogen Storage System based on 8760 Hours Production Simulation. Power Syst. Technol. 2024, 48, 2227–2235. [Google Scholar]
  32. Li, P.; Han, P.; Liu, S.; Zhang, J. Capacity Coordinated Optimization of Battery, Thermal and Hydrogen Storage System for Multi-energy Complementary Power System. In Proceedings of the 2023 IEEE 6th International Electrical and Energy Conference (CIEEC), Hefei, China, 12–14 May 2023. [Google Scholar]
  33. Ma, S.; Li, Y.; Jiang, Y.; Wu, Y.; Sha, G. The Multiobjective Control Based on Tolerance Optimization in a Multienergy System. Int. Trans. Electr. Energy Syst. 2024, 9991046. [Google Scholar] [CrossRef]
  34. Zhang, X.; Fan, X.; Wu, Z.; Zheng, L. Hydrogen Energy Supply Chain Cost Analysis and Suggestions. Chem. Ind. Eng. Prog. 2022, 41, 2364–2371. [Google Scholar]
Figure 1. A stand-alone wind-photovoltaic-battery system with the hybrid electrolyzer.
Applsci 15 03135 g001
Figure 2. The schematic diagram of the Pareto front for a bi-objective optimization problem.
Applsci 15 03135 g002
Figure 3. The power curve from the new energy source and load under a day.
Applsci 15 03135 g003
Figure 4. The rated power of AWE and PEME using different objective functions and electrolyzer types.
Applsci 15 03135 g004
Figure 5. The pareto front of the optimization problem (J1/|min(J1)|, J2/|min(J2)|) using the proposed methods.
Applsci 15 03135 g005
Figure 6. The rated power of the electrolyzer and Ji/min(Ji) using different methods.
Applsci 15 03135 g006
Figure 7. The optimization results with changes in the efficiency of AWE and PEME.
Applsci 15 03135 g007
Figure 8. The optimization results with changes in the producing cost of hydrogen by AWE and PEME.
Applsci 15 03135 g008
Figure 9. The optimization results with changes in the AWE and PEME investment cost.
Applsci 15 03135 g009
Figure 10. The optimization results with changes in the permissible abandonment rate of new energy and the permissible cut-off rate of the load.
Applsci 15 03135 g010
Table 1. System parameters.
Simulation ParameterValueSimulation ParameterValue
Rated power of the PVGs100 MWMaximum power of AWE100 MW
Cost per kW/h of the PVGs0.359 ¥/kWhEfficiency of AWE60%
Rated power of the WTGs100 MWThe investment cost of AWE1233.33 ¥/kWh
Cost per kW/h of the WTGs0.242 ¥/kWhThe hydrogen production cost of AWE22.425 ¥/kg
Rated power of the BESS20 MWEnergy consumption of AWE55.56 kWh/kg
Rated capacity of the BESS40 MWhOperation life of AWE and PEME20 years
Cost per kW/h of the BESS0.7 ¥/kWhMaximum power of PEME100 MW
Charging efficiency of the BESS95%Efficiency of PEME90%
Discharging efficiency of the BESS92%Investment cost coefficient of PEME4000 ¥/kWh
SOE range of the BESS10~90%The hydrogen production cost of PEME29.903 ¥/kg
Initial SOE of the BESS50%Energy consumption of PEME48.89 kWh/kg
Capacity of the HST20,000 m3Maximum hydrogen sales rate10,000 m3/h
SOH range of the HST10~90%Hydrogen sales revenue50.4 ¥/kg
Initial SOH of the HST50%Discount rate γ8%
The abandonment rate of new energy source δ15%Initial stepper parameter Δc10−3
Cut-off rate of load δ23%
Table 2. J1 and J2 values under different objective functions and electrolyzer types.
Objective FunctionAWEPEMEAWE + PEME
J1J2J1J2J1J2
min(J1)450,244.911259.66451,513.581033.22442,790.621216.00
min(J2)486,189.991101.03478,127.59905.29478,127.59905.29
Table 3. Comparison results using different methods.
J1J2Rated Power of AWE (MW)Rated Power of PEME (MW)
min(J1)442,790.621216.0040.2733.23
min(J2)478,127.59905.290.0062.15
Method 1453,097.09912.350.0062.51
Method 2451,268.28922.625.7056.81
Proposed method447,218.53952.5618.8743.64
Disclaimer/Publisher’s Note: The statements, opinions and data contained in all publications are solely those of the individual author(s) and contributor(s) and not of MDPI and/or the editor(s). MDPI and/or the editor(s) disclaim responsibility for any injury to people or property resulting from any ideas, methods, instructions or products referred to in the content.

