Article

Comparative Analysis of Performance in the High-Bar vs. Low-Bar Squat

by
Manuel González
1,
Archit Navandar
2,
José M. González-Ravé
1,
Roberto Ojeda
3,
Fernando González-Mohíno
1 and
Daniel Juárez Santos-García
1,*
1
Sports Training Laboratory, Faculty of Sport Sciences, University of Castilla La Mancha, 45071 Toledo, Spain
2
Faculty of Sports Sciences, Universidad Politécnica de Madrid, 28040 Madrid, Spain
3
Department of Physical Education, Universidad de Las Palmas, 35015 Las Palmas de Gran Canaria, Spain
*
Author to whom correspondence should be addressed.
Appl. Sci. 2025, 15(6), 3143; https://doi.org/10.3390/app15063143
Submission received: 22 January 2025 / Revised: 5 March 2025 / Accepted: 12 March 2025 / Published: 13 March 2025

Abstract

:
The objective of this study was to compare the 1 Repetition Maximum (RM) performance in the parallel squat exercise with a low-bar vs. a high-bar technique and to analyze the gender differences. A secondary objective was to analyze the differences in the force–velocity profile between the low- and high-bar squat technique. Nineteen recreational strength-trained participants, 9 men (22 ± 1.9 years, 79.4 ± 13.9 kg, 1.77 ± 0.11 m) and 10 women (27.6 ± 3.12 years, 60.4 ± 5.0 kg, 1.67 ± 0.5 m), participated in this study. All participants performed two evaluations of the 1RM and the force–velocity curve in parallel squat exercises, separated by a week, one with a high bar and the other with a low bar technique. The level of significance set for this study was p < 0.05. The technical × gender interaction was not significant in any of the three variables analyzed: lifted load, mean propulsive velocity, and force. A difference (p < 0.001) in the lifted load and the mean force is observed between the techniques at 1RM, being in both cases (men and women) better in the low-bar performance. A difference (p < 0.001) was observed in relation to the technique × participation interaction when comparing the mean velocity and force obtained with the same absolute submaximal loads in each of the techniques. These data may guide a better and more precise organization of training when performing the squat exercise and differentiating the techniques to be used, using the low bar when the main objective is strength or power training.

1. Introduction

Coaches design resistance training programs to develop muscular strength and increase movement velocity [1]. The prescription of appropriate training loads is critical to constructing training plans, and training intensity or volume are the main variables manipulated [2]. Exercise intensity is one of the most important stimuli related to changes in strength levels [3], identified commonly with relative load (percentage of one-repetition maximum—1RM). 1RM is a fundamental metric in strength training, as it represents the maximum load an individual can lift in a single repetition. This indicator assesses the maximum strength and the ability to generate force in a specific movement. The 1RM not only allows for performance comparison between different individuals but is also essential for designing personalized and progressive training programs [4]. However, classical protocols to assess 1RM could have potential disadvantages worth noting (associated with injury when performed by novice subjects with poor technique or impracticality for large groups of athletes). An alternative is to use movement velocity. The load–velocity relationship has gained relevance because coaches can evaluate an athlete’s strength without the need to perform a 1RM, because it is possible to estimate it through submaximal loads [5]. In this case, it is common to measure the mean propulsive velocity during the concentric phase of the lift until the bar’s acceleration falls below that of gravity. This indicator is important because it reflects the athlete’s ability to maintain a constant and efficient velocity during the lift, which is crucial for technique and performance [6]. With the same technology used to [7,8,9,10] evaluate velocity during this type of protocol (i.e., linear position transducer), the force can be assessed during different exercises. In that sense, the force–velocity profile has gained popularity and is used to guide programming decisions.
The squat is one of the most widely used exercises in different sports settings, such as fitness, rehabilitation, and strength-power exercise in different sports [11]. The squat is known as a closed kinetic chain exercise consisting of shouldering the bar and performing synergistic hip and knee flexion on the descent phase to the desired depth, followed by knee and hip extension during the ascent phase which ends with the lifter in the starting position [12]. According to Stoppani [11], more than 200 muscles are activated while executing a squat. Moreover, the most relevant muscles implicated are the knee extensors, erector spinae, gluteus maximus, biceps femoris, rectus femoris, vastus lateralis, vastus medialis muscles, and triceps surae [13]. As a result, it forms an important part of strength training for many athletes. Training studies have assessed the effects of various barbell squat loading schemes on training adaptations, including changes in maximal strength and power in the squat. Additionally, adaptations from squat training and their effects on performance parameters such as countermovement jump height, peak acceleration, and running speed have also been documented [14].
The squat exercise can be varied based on stance width [7], alternating foot rotation, or the surface on which it is performed [15]. The depth of the descent phase also determines different variations, varying between the partial squat or quarter squat (knee flexion angle is between 60–90°), half squat (knee flexion angle is ~90°), parallel (the longitudinal axis of the thigh is parallel to the ground and the knee flexion angle is ~110°) and deep squat or full squat (the knee flexion angle is >120°) [16,17,18,19]. Other variations would affect the position of the bar: the Front Squat (the bar is placed on top of the pectorals lifting parallel to the clavicles) [20], the Overhead Squat (the bar is overhead with the shoulders fully extended) [21] and the Back Squat [15]. The latter, in turn, has two variations: the high bar (the bar is either centered across the shoulders just below the spinous process of the C7 vertebra), or the low bar (the bar is placed on the back across the spine of the scapula) [22].
Several studies have confirmed that a variation in where the bar is placed modifies the muscles involved [22,23]. Also, lifters adopt different postural control strategies based on the intensity of the load while performing both techniques [24]. The high bar squat permits a greater flexion of the knee, lesser flexion of the hip, a more upright torso, and a deeper squat. In the low-bar squat, there is more hip flexion and therefore more forward lean [16,25]. In terms of muscular activation, the high bar squat consists of increased activity of the quadriceps muscle, while in the low-bar squat, greater muscle activity of the erector spinae, adductor, and gluteal muscles can be observed [13]. Furthermore, Murawa, Fryzowicz, Kabacinski, Jurga, Gorwa, Galli, and Zago [23] conclude that there are significant differences in the activation of the posterior muscle chain between the two squat techniques. The erector spinae, gluteus maximus, biceps femoris, rectus femoris, vastus lateralis, and vastus medialis muscles are more active during the eccentric phase of the low-bar squat than during the high-bar squat. In the case of the knee extensor muscles, the differences between the techniques are rather negligible. Finally, in both techniques, the most crucial muscles—the gluteus maximus and biceps femoris—show higher levels of activation in the low-bar squat.
Since the differences in muscular activation are known, a question arises as to whether this translates to a difference in force and power production using one technique or another. This becomes an important factor in training athletes who use one technique more than the other. Among strength and power sports, powerlifting and weightlifting are the most widely practiced and popular, representing the two most common disciplines globally [26,27]. For example, powerlifting is a strength sport that consists of three attempts at maximal weight on three lifts: squat, bench press, and deadlift [27]. In this sport, Ferland and Comtois [28] reported that the most used technique is the low-bar squat. On the other side, weightlifters primarily use the high-bar technique, as it more closely mimics the movements involved in their snatch and clean and jerk competitions [29]. As there are different characteristics between techniques, it is necessary to have specific references in terms of force and velocity values during the execution of this exercise, which can help adapt the velocity-based training program accurately and achieve optimal results.
Another important question to be consider in this context is the difference in strength between genders. Sex-based differences can be appreciated in skeletal muscle fiber type composition and function [30]. Females have more of the slower Type I and -IIA fibers than males, which means a lower contractile velocity, an important factor during a squat. As we can see in a study performed by Mehls, et al. [31], there are differences in muscle activity between men and women during the back squat, with the biceps femoris showing a greater activation in men. Biomechanically, we can appreciate differences when they perform the Overhead Squat and Single Leg Squat [32]. For example, males displayed the Overhead Squat with greater peak knee frontal plane projection angles, peak hip flexion, and peak trunk flexion angles.
Therefore, the main objective of the present study was to compare the 1 Repetition Maximum (RM) performance (lifted load, mean propulsive velocity, and force) in the parallel squat exercise with the low-bar and high-bar techniques and to analyze the gender differences. A secondary objective was to analyze the differences in the force–velocity profile between the low and the high bar squat technique.

2. Materials and Methods

2.1. Study Design

A descriptive, comparative, controlled study was carried out to assess force and velocity differences between low-bar squats and high-bar squats. All of the tests were carried out at the same time of the day and two sessions were carried out, one for each type of squat, with a week of rest between them.

2.2. Participants

Nineteen participants, 9 males (22 ± 1.9 years, 79.4 ± 13.9 kg, 1.77 ± 0.11 m) and 10 females (27.6 ± 3.12 years, 60.4 ± 5.0 kg, 1.67 ± 0.5 m), voluntarily participated in this study. The recruitment process began with an outreach to 29 potential participants (Figure 1) These individuals were identified through various channels: online recruitment platforms (social media, academic mailing lists), community outreach (flyers and posters distributed at a university) and referral networks (encouraging participants to refer others who might be eligible). Inclusion criteria ensured that only individuals who met specific characteristics relevant to the research question were included in the study. These criteria were designed to maximize the reliability and validity of the findings while protecting participant safety: participants were required to be between the ages of 18 and 65 years and to have had previous experience in strength training (at least one year since they began training), performing both techniques in their squat (they had trained a minimum of 2 h/day, 3 days/week during the previous year) and they had a familiarization time in their training before the analysis. Participants were asked to avoid strenuous exercise, caffeine, and alcohol consumption for 24 h before each visit. Before the study, participants were instructed about the procedure to be carried out and the potential risks derived from their participation in the study. They gave their written consent for the intervention. The study was approved by the local University ethics committee (CEIS-643013-N9T3). Participants were excluded if they had suffered any kind of injury that affected their strength training in the three months prior to the test or the impossibility of performing the tests during the data collection period, and they could withdraw if they could not continue properly. Women who were pregnant were excluded due to the potential risks associated with strenuous physical activity or high-impact sports during pregnancy. In addition, the participants were asked not to perform any exercise involving the lower body 48 h before each measurement and not to work out at high intensity involving the lower body in the period between the measurements. They were instructed to maintain normal dietary habits over the course of the study.

2.3. Procedures

The mean propulsive velocity, mean force, and the load lifted were compared according to the technique used (high vs. low bar) and gender. To do this, the technique used in each case was controlled, considering also the angle of knee flexion to ensure that a parallel squat was performed.
First, an explanatory video on the two squat exercise techniques was sent to the participants. In these videos, participants could observe how they must start from an upright position, with the knees and hips fully extended and both feet positioned flat on the floor in parallel, shoulder-width apart. From this position, they were to descend in a continuous motion until reaching their parallel position (thighs aligned with the floor and the hips aligned with the knees). All participants performed two assessments of the parallel squat exercise separated by 7 days to achieve a full recovery, at the same time of day, under the same experimental conditions (without strenuous exercise 24 h before, similar food intake, hydration, instructions during the test, etc.) and similar environmental conditions (550 m altitude, 22–25 °C, 35–40% relative humidity).
Firstly, they performed a warm-up consisting of 10 min on a cycloergometer (Wattbike Trainer, Nottingham, UK) at a moderate intensity and then performed 5 min of joint mobility. Following this, the squat exercise force–velocity test was performed using free weights on a squat rack (Technogym®, Rack, Cesena, Italy). An Eleiko® (Eleiko AB, Halmstad, Sweden) Olympic bar (20 kg) and Technogym® Olympic discs (2.5 kg, 5 kg, 10 kg, 15 kg, 20 kg, 25 kg) were used for the testing. A linear position transducer (EV-PRO Isocontrol Dynamic, SDT, Madrid, Spain) and the corresponding software (Isocontrol Dynamic v. 6.0 for Windows) were used to measure the mean propulsive velocity [33] and mean force of each repetition. Knowing the mass (kg) of the load to be lifted and the acceleration, the device offers us the value of the force manifested, obtaining a value through the mean values of the propulsive phase, defined as the portion of the concentric phase during which the measured acceleration is greater than the acceleration due to gravity (9.81 m·s−2). This transducer recorded the position and direction of the bar with an accuracy of 0.0002 m. This validated system has been used in other studies for similar measurements [34,35]. A researcher controlled the correct performance of the squats according to the technique being studied. Also, three other participants offered safety and helped with execution if it was necessary.
Each participant, with the supervision of one of the researchers, performed the parallel squat, controlling the descent velocity (as previously shown in [36]) until the thighs were parallel to the floor and the hips aligned with the knees. When the position was achieved, the researcher gave an audible signal to initiate the concentric phase of the movement, which was performed at the maximal intended velocity. The 1RM test consisted of one repetition per load starting with 20 kg, with a gradual increase in load within 5–7 attempts to avoid fatigue. The test finished when the participant reached failure or when the recorded mean propulsive velocity was lower than 0.32 m/s [25]. The rest between loads was 4 min [37].
In the second session, the participants performed the other technique and repeated the absolute loads from their first sessions. If they reached the 1RM of the previous day without reaching failure or with a velocity greater than 0.32 m/s [25], they continued increasing the load based on the same criteria as in the first session. The recorded variables, that is, the mean force (N) and squat load (kg), were normalized to body weight.

2.4. Statistical Analysis

The mean and standard deviation of the main variables extracted was determined. Data analysis was carried out using both discrete and continuous data. For the discrete data analysis, the IBM SPSS Statistics 24 program was used. Normality was determined with the Shapiro–Wilks test. The statistical parameter mapping (SPM) analysis was done in Python (v. 3.6 for Windows) using the template found on the SPM1D website and adapting the same to our dataset [35].
First, the mean propulsive velocities at different loads with each technique were compared in each participant using a two-way repeated measures ANOVA: technique (high bar vs. low bar) × participant; and a two-way ANOVA: technique × gender (male vs. female). The same analyses were performed for the variable mean propulsive force. Second, the lifted load, mean propulsive velocity, and propulsive force in the 1RM squat exercise were analyzed using a two-way (technique × gender) ANOVA. For the continuous analysis, the mean propulsive velocity profile was compared using statistical parameter mapping (SPM) using the model of repeated measures ANOVA [36]. The level of significance was established at p < 0.05 and the effect size was calculated using partial eta squared (η2), considering ~0.01 as low, ~0.06 as medium, and ~0.14 as large [38].

3. Results

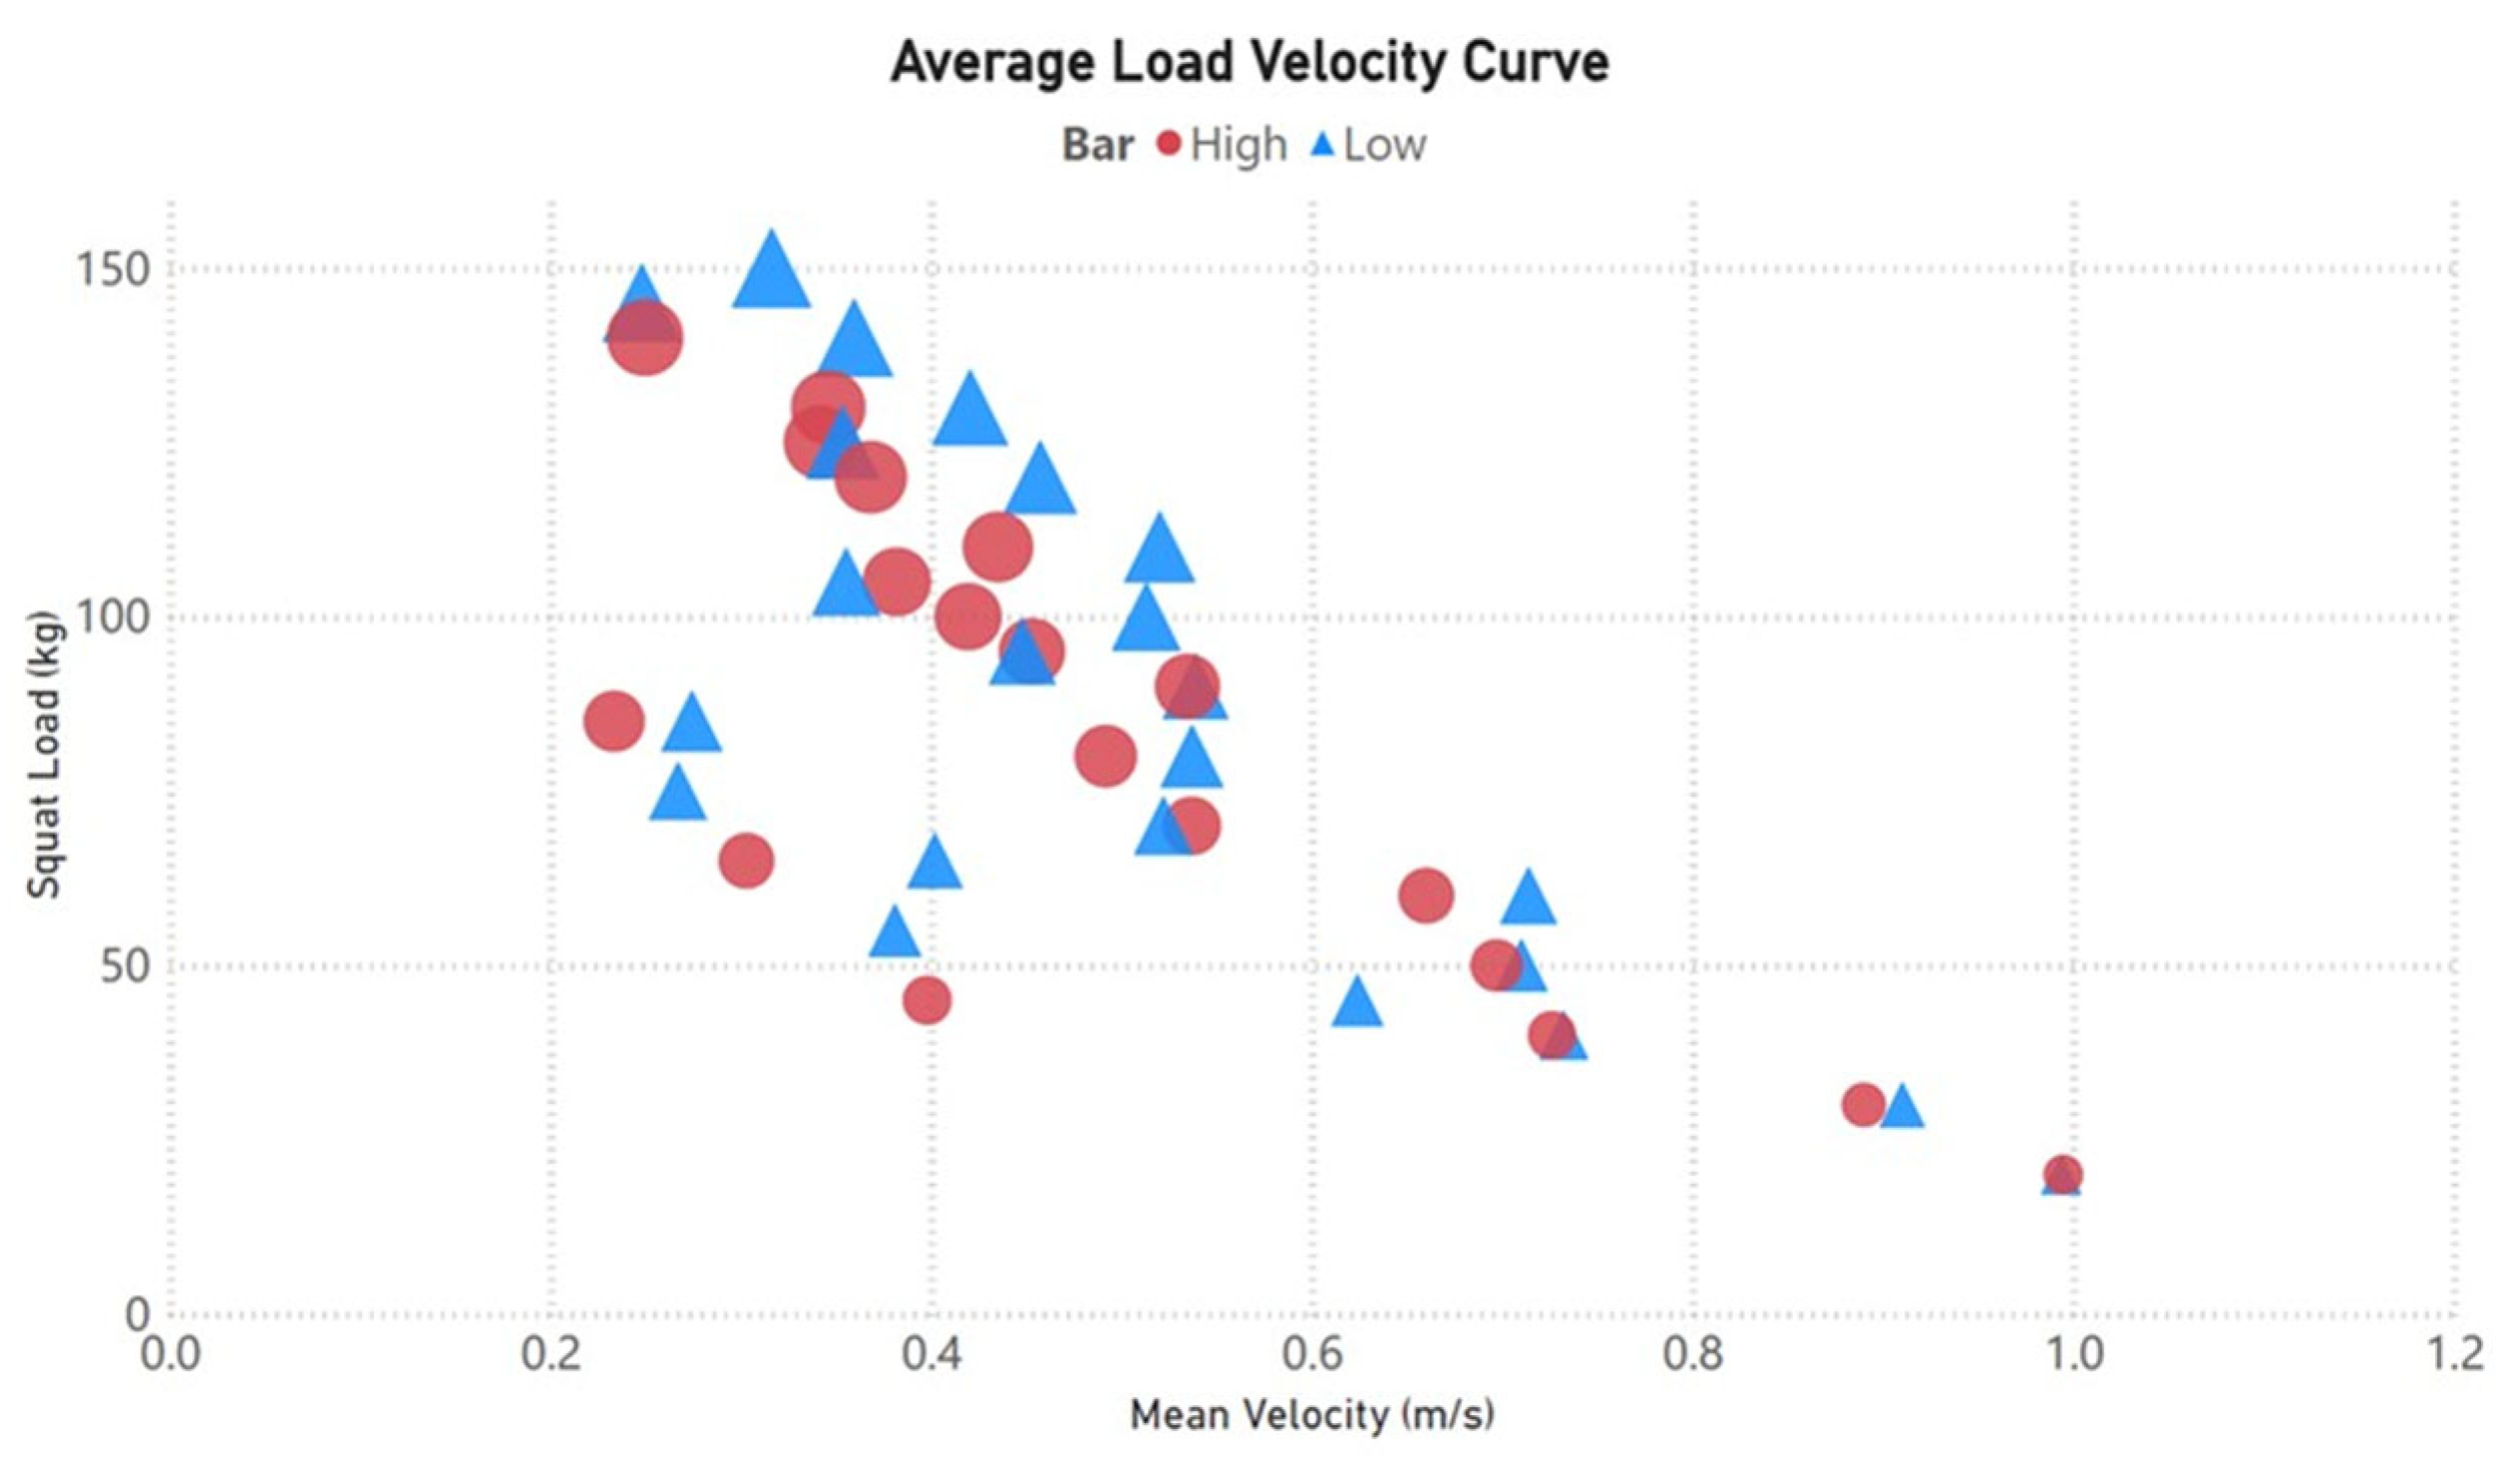
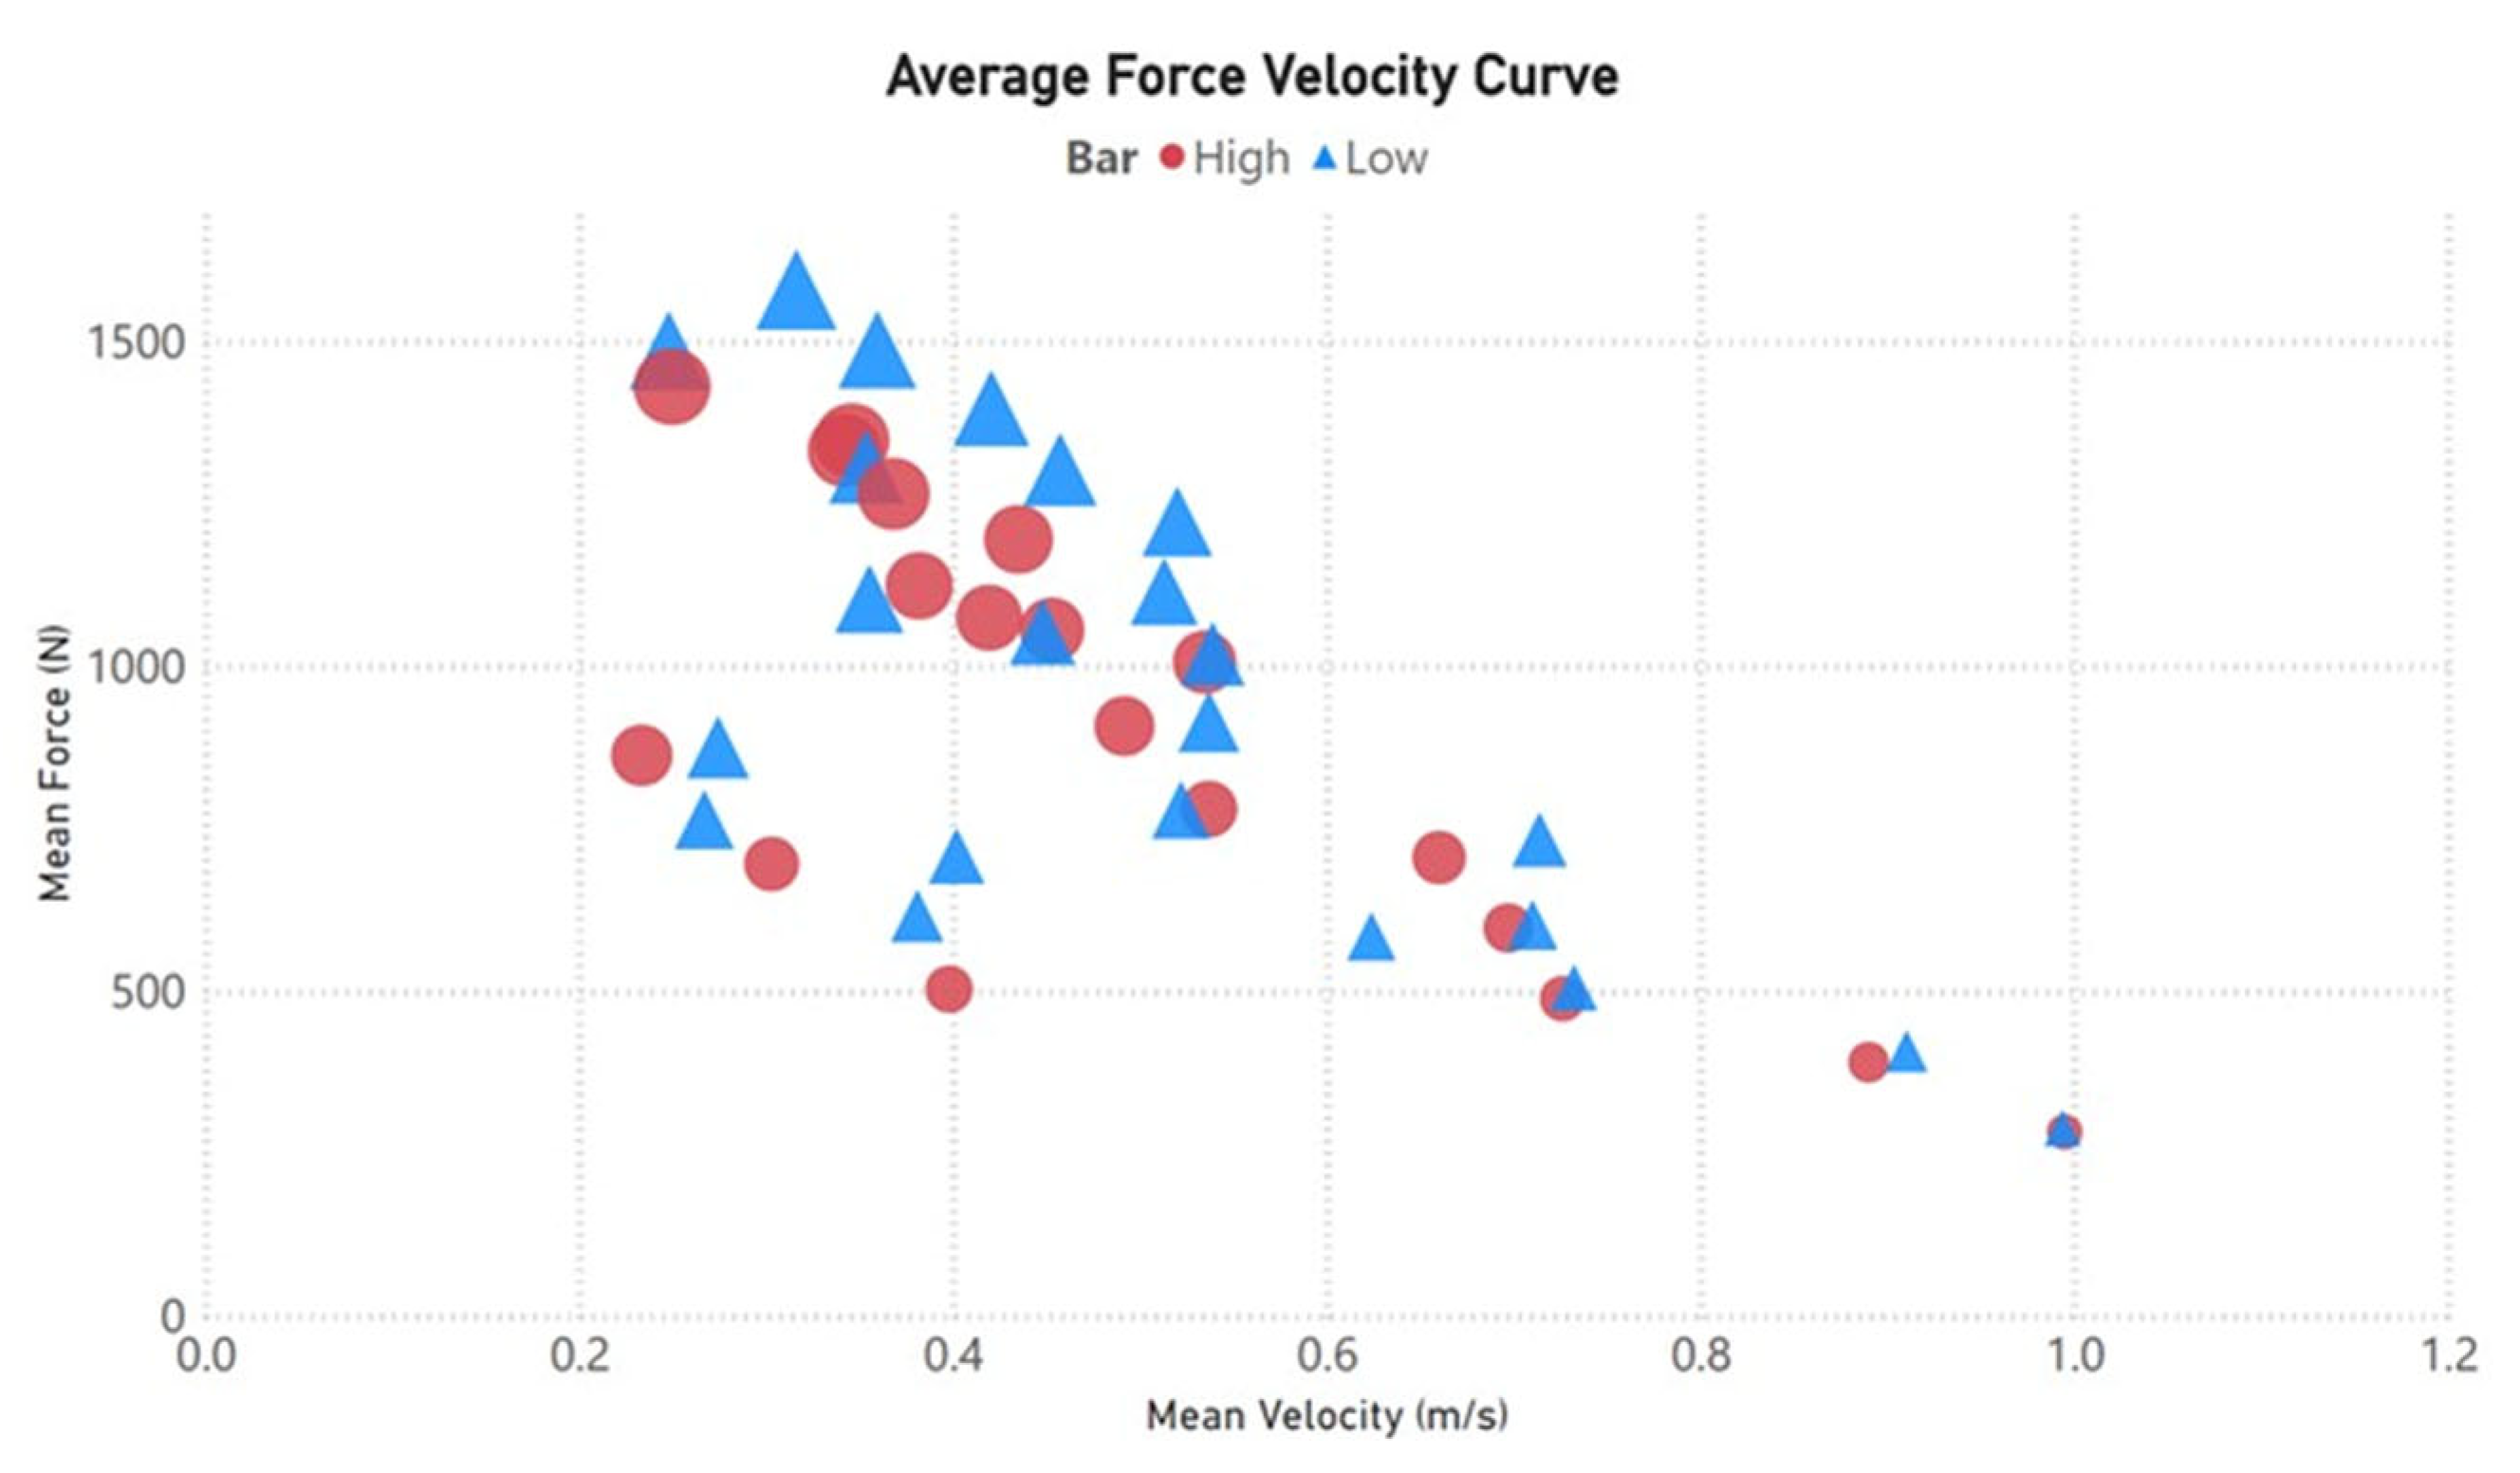
Following the analysis of the load–velocity (Figure 2) and force–velocity curve (Figure 3), a significant difference was observed in relation to the technique × participant interaction when comparing the mean velocity (F = 5.1; p < 0.001; partial η2 = 0.49) and mean force (F = 3.2; p < 0.001; partial η2 = 0.37) obtained with the same absolute submaximal loads in each of the techniques. When comparing the techniques irrespective of subjects, there is a significant difference in mean velocity (F = 49.5; p < 0.001; partial η2 = 0.34) and mean force (F = 54.4; p < 0.001; partial η2 = 0.36) between the techniques, with both measures being higher when the low-bar technique was used.
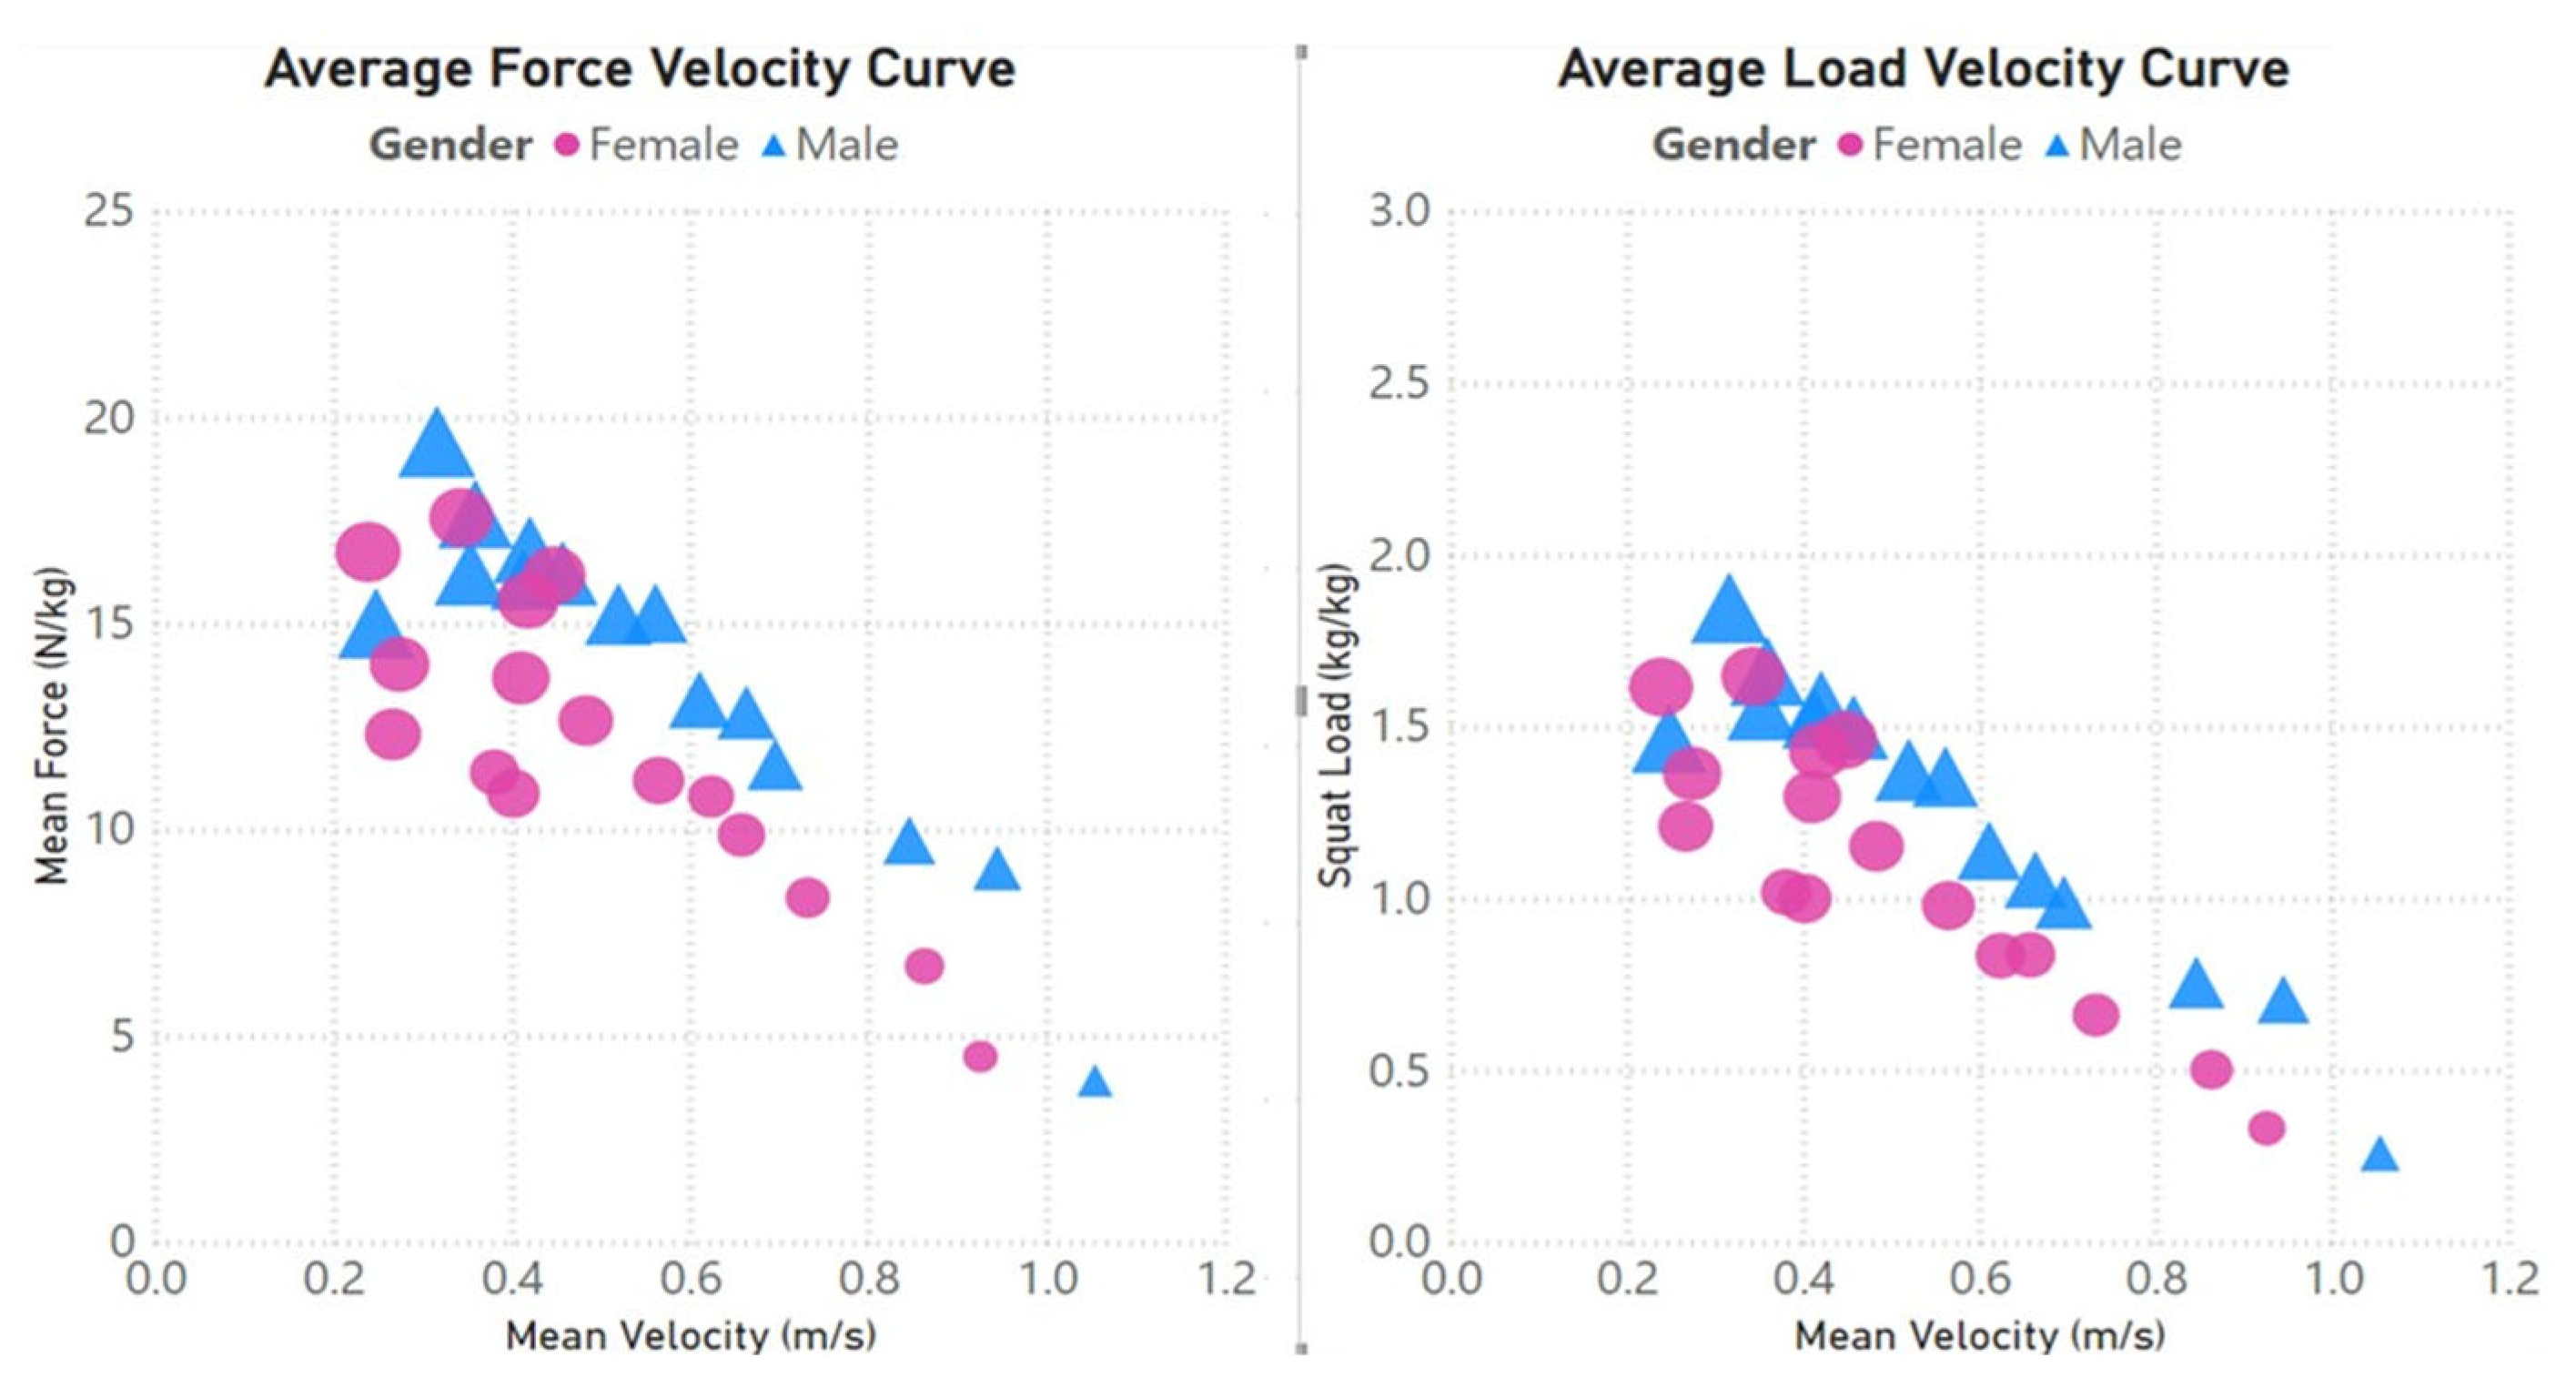
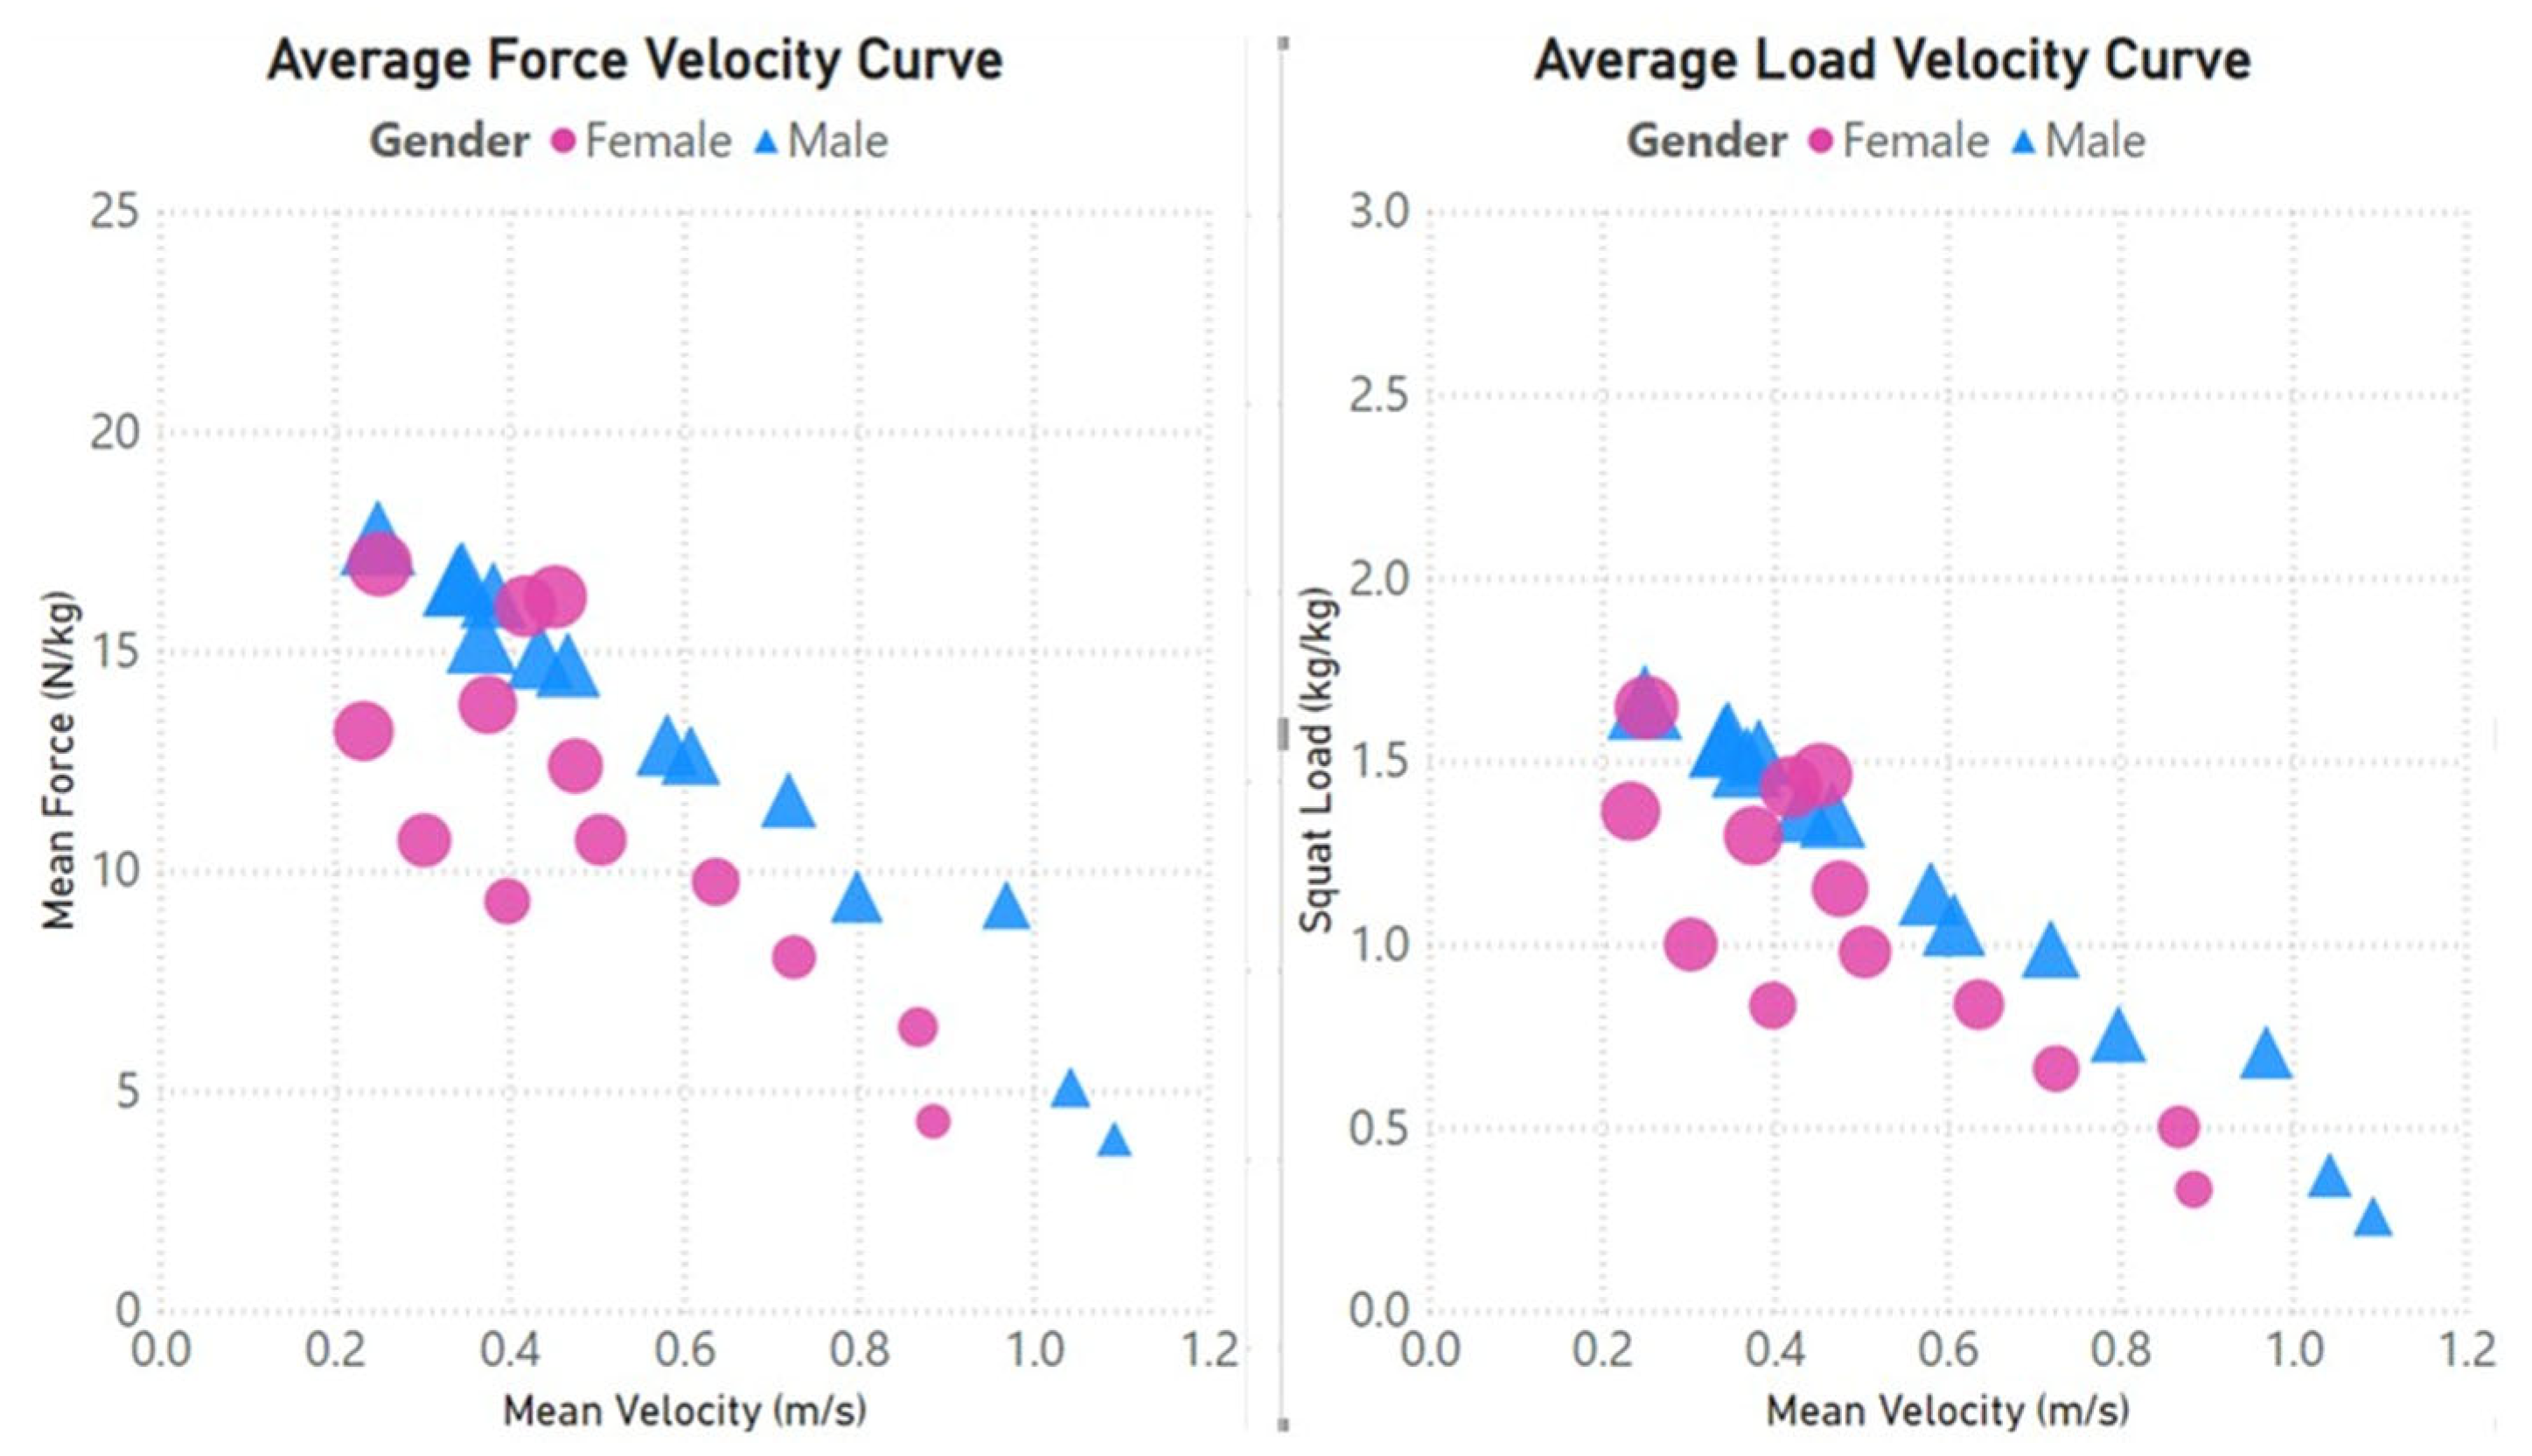
Regarding the analysis of the load–velocity and force–velocity curve considering the gender of the participant, the interaction technique × gender was not significant in mean propulsive velocity (F = 2.4; p = 0.13; partial η2 = 0.02). However, a significant interaction between technique × gender was observed in mean propulsive force (F = 4.3; p = 0.04; partial η2 = 0.04). In any case, if the propulsive force and the lifting load are normalized (Figure 4 and Figure 5), that is, expressed to the weight of the participant, no significant differences are observed between sexes, either for the mean propulsive force (F = 0.1; p = 0.81; partial η2 = 0.000) or for the lifted load (F = 0.2; p = 0.64; partial η2 = 0.001).
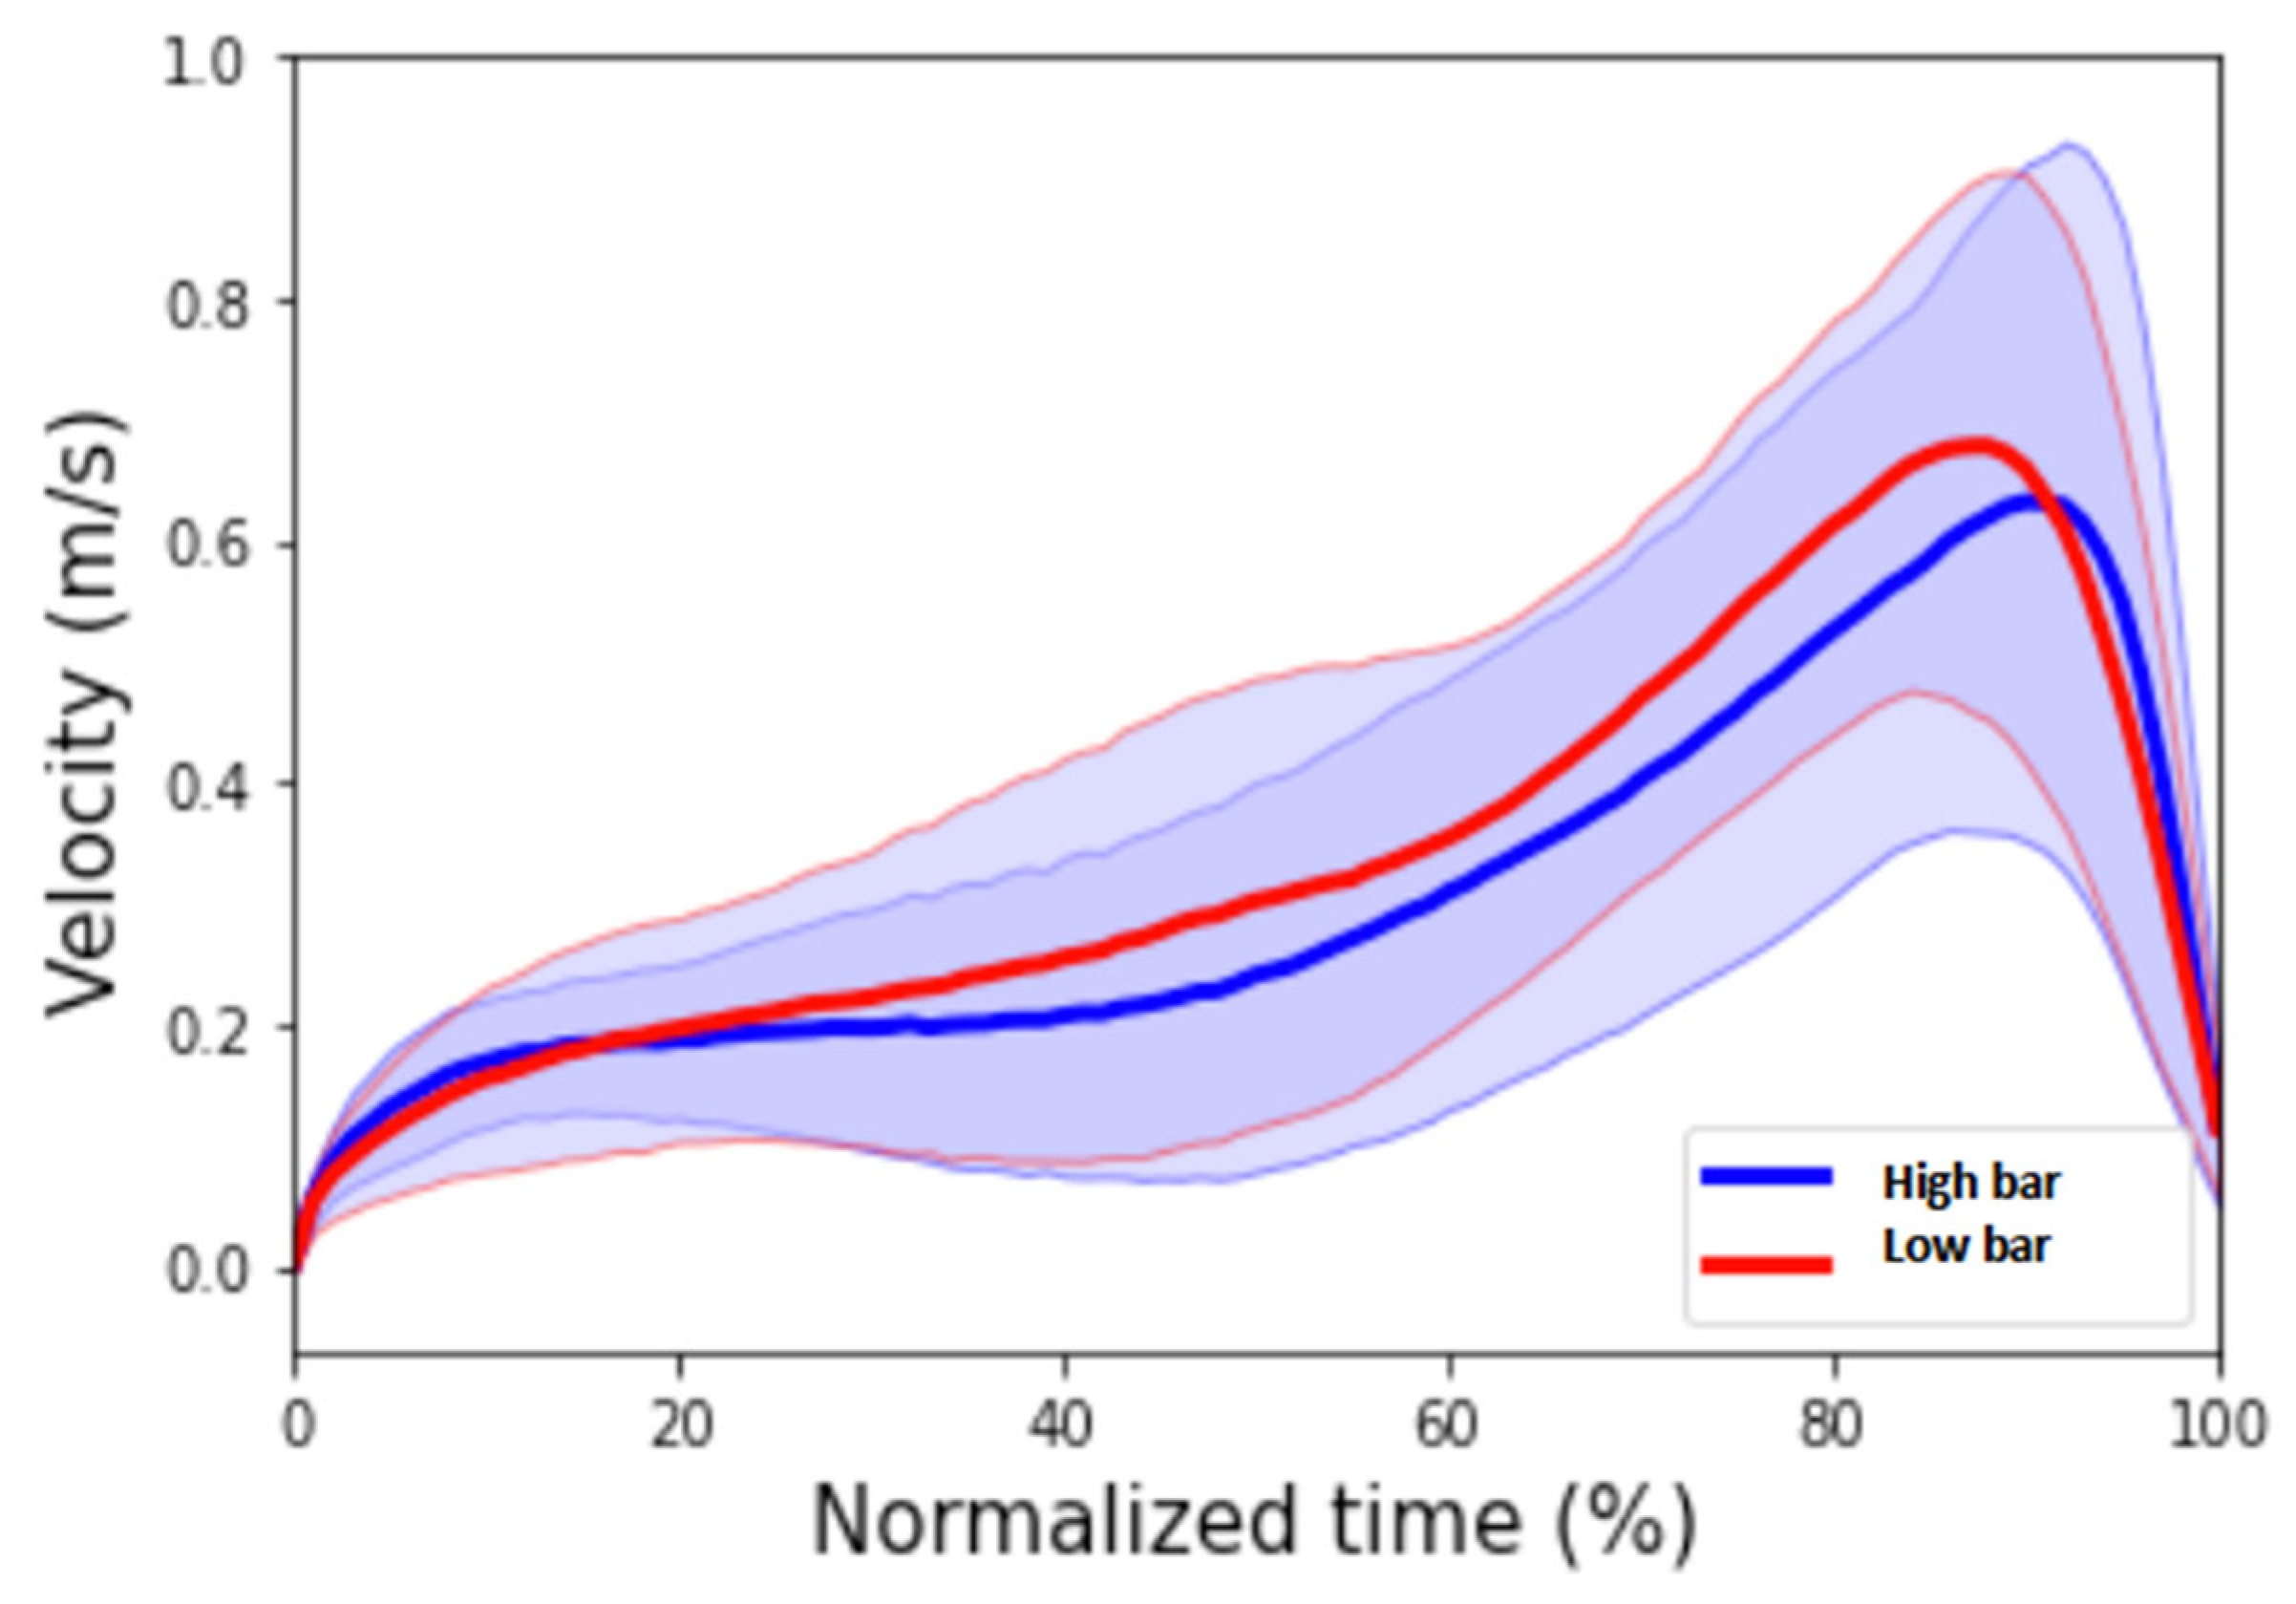
When comparing the 1RM technique specifically (Table 1), the interaction technique × gender was not significant in any of the three variables analyzed: lifted load (F = 2.8; p = 0.11; partial η2 = 0.14), mean propulsive velocity (F = 0.1; p = 0.80; partial η2 = 0.04), and mean propulsive force in 1RM (F = 3.0; p = 0.10; partial η2 = 0.15). When comparing the techniques irrespective of gender, a significant difference in the lifted load (F = 35.4; p < 0.001; partial η2 = 0.68) and the mean force (F = 23.7; p < 0.001; partial η2 = 0.14) is observed between the techniques, being higher for the low bar in both cases. However, no significant differences (partial η2 = 0.13) were observed in the mean velocity of the 1RM, which was also seen in the SPM analysis of the velocity profiles (Figure 6).

4. Discussion

This study aimed to compare the 1RM, load–velocity, and force–velocity relationships between the low-bar and high-bar squat exercise. Previous research has examined the factors that contribute to successful performance in competition events, with particular emphasis on the velocity and displacement of the barbell, which have been identified as key success factors for exercises such as the snatch and clean and jerk [39]. Participants executed both techniques in two sessions a week apart and the movement was recorded using a linear position transducer. The results showed that there was a difference between the techniques applied, with greater forces and loads being applied using the low-bar technique.
A mean difference of 7 kg in the 1RM was observed in this study when the participants performed the low-bar squat. As a consequence, a higher force was produced using this technique [40], a finding that is consistent with previously published literature [13,22]. Recent studies on well-trained powerlifters showed greater activation of all muscles in the eccentric phase and the hip extensors in the concentric phase at 60–70% 1RM [23,41], which could be one of the reasons for this improvement. Given that the force–velocity curve analysis in the present study also shows that the low-bar technique generates higher forces and velocities at similar loads, this could be an important consideration when programming the loads during training. For example, the velocity of 1RM for a squat exercise was established at 0.32 m/s in previous studies [19,28]. However, in our study we found changes in the velocity–load relationship regarding the technique, so these reference values could be modified.
Regarding gender, a significant interaction between technique × gender was observed in mean propulsive force. However, this difference disappears when the results are normalized to body mass. Mausehund and Krosshaug [42] compared normalized net joint moments, moment arms, and muscle activity in the bench press exercise between women and men, concluding that gender affected bench press technique substantially. Our results also showed that males demonstrated a higher load in both exercises compared to females, which is in accordance with previous research [43]. Despite the normalized data in men and women, the greater dispersion of values in females vs. males (as shown in Figure 4) showed us the initial differences among female participants. The relationship between muscle strength and body size has attracted considerable attention from researchers, based on everyday life experience suggesting that taller or heavier individuals are usually stronger than shorter and lighter ones [44]. The physiological differences between males and females, particularly in muscle fiber composition, play a significant role in athletic performance. Females typically have a higher proportion of slow-twitch (Type I) muscle fibers, which are more fatigue-resistant and suited for endurance activities, while males have a higher proportion of fast-twitch (Type II) muscle fibers, which are more suited for explosive strength and power activities. These differences are influenced by hormonal factors, such as testosterone and estrogen, which affect muscle mass, fiber type distribution, and contractile properties [45].
Another key finding in this study was that there were no differences in the velocity of the movement at 1RM. This can be explained by the findings of the aforementioned study [23], where no significant differences in knee extension angle were found between the two techniques. If the knee’s range of motion is similar in the two techniques, the linear squat depth (as determined by the linear position transducer) would not vary too much. Therefore, since movement velocity is one of the most important factors when programming strength training [46], this information can help design more accurate training programs based on velocity for those who train powerlifting using the low-bar technique in the squat.
Many athletes, both professionals and amateurs, and even coaches are unaware of the advantages of something as simple as slightly modifying the bar when squatting, both to maximize results and to carry out correct programming. Unfortunately, there are still few studies that have been carried out on this topic, and the majority of those were studies at the biomechanical and anthropometric level [47,48]. In this sense, the interaction between muscle fiber types and squat techniques can significantly impact performance under different loads. For instance, the high-bar squat, which involves greater knee flexion and a more upright torso, may favor the activation of slow-twitch (Type I) fibers due to its emphasis on quadriceps engagement and endurance. Conversely, the low-bar squat, which involves greater hip flexion and a forward lean, may favor the activation of fast-twitch (Type II) fibers due to its emphasis on hip extensors and explosive power. This is supported by findings that athletes with a higher proportion of Type II fibers tend to excel in power and sprint activities, while those with more Type I fibers perform better in endurance tasks [49].
Although most results demonstrated large effect sizes, as with many studies, a limitation of this study might be the moderate sample population of 10 men and 9 women. However, our participants had previous experience in strength training. A greater number of data points could have provided more rigorous values. Fat mass and fat-free mass were not analyzed and could again have provided more precise interpretations regarding normalized weight, which could be interesting for future investigations. The study is limited by its focus on the 1RM movement analyzed using SPM without performing a full waveform analysis. Future research incorporating musculoskeletal modeling with 3D motion capture, force plates, and EMG could provide valuable insights into muscle forces, joint ligament loading, and full-body coordination, thereby further elucidating the differences between techniques and genders [50]. It is also necessary to highlight that although the primary focus of the analysis was the effect of interaction, the lack of a standardized increase in load lifted for all participants could influence the comparison of the force–velocity profile by gender. Furthermore, although an acoustic signal was given before the participant began the upward movement from the parallel position, causing a pause of 1–2 s, the duration of this pause was not measured. For these reasons, our results should be considered with caution and considering the limitations mentioned above.
Several studies have employed different research designs to investigate squat techniques. For instance, some studies have used cross-sectional designs to compare muscle activation and performance metrics between high-bar and low-bar squats, while others have utilized longitudinal designs to assess the effects of training interventions over time. These differences in research design can influence the outcomes and interpretations of the studies. For example, cross-sectional studies may provide a snapshot of performance differences but may not capture long-term adaptations to different squat techniques [13,22].
From the practical point of view, the main contribution of this investigation was to show the different weights lifted in 1RM between the low-bar technique vs. the high bar. This approach can help coaches and athletes distinguish between them, because the use of one technique or another means differences in maximum force and weight. Moreover, coaches who quantify the relative intensity through velocity-based training (VBT) should know the speed at which the load is lifted with each technique. Studies with highly trained athletes may yield different findings than those obtained from recreational lifters; this should be taken into account when interpreting the obtained results.

5. Conclusions

The findings of this study offer valuable insights into training approaches using low-bar and high-bar squat techniques and their impact on force and velocity outputs. The results suggest that coaches may find greater gains in force and velocity metrics when athletes perform low-bar squats across different loads, including at 1RM. Additionally, the study appears to suggest that these differences between techniques persist regardless of gender, suggesting that male and female athletes can benefit equally from tailored technique-specific training interventions. For practical applications, coaches should consider incorporating low-bar squats into training regimens, especially for athletes focusing on strength and power development.

Author Contributions

All authors contributed significantly to the final version of this manuscript and to the interpretation of the results. M.G. and D.J.S.-G. conceived and planned the experiments. M.G. and D.J.S.-G. carried out the experiments. A.N. took the initiative to write the manuscript, which was completed by J.M.G.-R., R.O., M.G., F.G.-M. and D.J.S.-G. All authors have read and agreed to the published version of the manuscript.

Funding

This research received no external funding.

Institutional Review Board Statement

This study was conducted in accordance with the Declaration of Helsinki and approved by the Ethics Committee of the “Comité de ética de la investigación clínica con medicamentos” on 30 November 2022 (CEIC926).

Informed Consent Statement

Informed consent was obtained from all subjects involved in the study.

Data Availability Statement

The original contributions presented in the study are included in the article, further inquiries can be directed to the corresponding author.

Acknowledgments

We want to thank the participants for their efforts in participating in this study.

Conflicts of Interest

The authors declare no conflicts of interest.

References

  1. Jiménez-Reyes, P.; Samozino, P.; Brughelli, M.; Morin, J.-B. Effectiveness of an individualized training based on force-velocity profiling during jumping. Front. Physiol. 2017, 7, 677. [Google Scholar] [CrossRef] [PubMed]
  2. Suchomel, T.J.; Nimphius, S.; Bellon, C.R.; Stone, M.H. The importance of muscular strength: Training considerations. Sports Med. 2018, 48, 765–785. [Google Scholar] [CrossRef] [PubMed]
  3. Fry, A.C. The role of resistance exercise intensity on muscle fibre adaptations. Sports Med. 2004, 34, 663–679. [Google Scholar] [CrossRef] [PubMed]
  4. Grgic, J.; Lazinica, B.; Schoenfeld, B.J.; Pedisic, Z. Test–retest reliability of the one-repetition maximum (1RM) strength assessment: A systematic review. Sports Med.-Open 2020, 6, 31. [Google Scholar] [CrossRef]
  5. Sánchez-Medina, L.; González-Badillo, J.; Pérez, C.; Pallarés, J. Velocity-and power-load relationships of the bench pull vs. bench press exercises. Int. J. Sports Med. 2014, 35, 209–216. [Google Scholar] [CrossRef]
  6. Nieto-Acevedo, R.; Romero-Moraleda, B.; Díaz-Lara, F.J.; Rubia, A.d.l.; González-García, J.; Mon-López, D. A systematic review and meta-analysis of the differences in mean propulsive velocity between men and women in different exercises. Sports 2023, 11, 118. [Google Scholar] [CrossRef]
  7. Escamilla, R.F. Knee biomechanics of the dynamic squat exercise. Med. Sci. Sports Exerc. 2001, 33, 127–141. [Google Scholar] [CrossRef]
  8. Escamilla, R.; Lander, J.; Garhammer, J. Biomechanics of powerlifting and weightlifting exercises. In Exercise and Sport Science; Garrett, W.E., Kirkendall, D.T., Eds.; Lippincott Williams and Wilkins: Philadelphia, PA, USA, 2000; pp. 585–615. [Google Scholar]
  9. Graham, J.F. Back squat. Strength Cond. J. 2001, 23, 28. [Google Scholar] [CrossRef]
  10. Kompf, J.; Arandjelović, O. The sticking point in the bench press, the squat, and the deadlift: Similarities and differences, and their significance for research and practice. Sports Med. 2017, 47, 631–640. [Google Scholar] [CrossRef]
  11. Stoppani, J. Jim Stoppani’s Encyclopedia of Muscle & Strength; Human Kinetics: Champaign, IL, USA, 2023. [Google Scholar]
  12. Liberati, A.; Altman, D.G.; Tetzlaff, J.; Mulrow, C.; Gøtzsche, P.C.; Ioannidis, J.P.; Clarke, M.; Devereaux, P.J.; Kleijnen, J.; Moher, D. The PRISMA statement for reporting systematic reviews and meta-analyses of studies that evaluate health care interventions: Explanation and elaboration. J. Clin. Epidemiol. 2009, 62, e1–e34. [Google Scholar] [CrossRef]
  13. Glassbrook, D.J.; Helms, E.R.; Brown, S.R.; Storey, A.G. A review of the biomechanical differences between the high-bar and low-bar back-squat. J. Strength Cond. Res. 2017, 31, 2618–2634. [Google Scholar] [CrossRef] [PubMed]
  14. Clark, D.R.; Lambert, M.I.; Hunter, A.M. Muscle activation in the loaded free barbell squat: A brief review. J. Strength Cond. Res. 2012, 26, 1169–1178. [Google Scholar] [CrossRef] [PubMed]
  15. Yavuz, H.U.; Erdağ, D.; Amca, A.M.; Aritan, S. Kinematic and EMG activities during front and back squat variations in maximum loads. J. Sports Sci. 2015, 33, 1058–1066. [Google Scholar] [CrossRef]
  16. Contreras, B.; Vigotsky, A.D.; Schoenfeld, B.J.; Beardsley, C.; Cronin, J. A comparison of gluteus maximus, biceps femoris, and vastus lateralis electromyography amplitude in the parallel, full, and front squat variations in resistance-trained females. J. Appl. Biomech. 2016, 32, 16–22. [Google Scholar] [CrossRef]
  17. Cotter, J.A.; Chaudhari, A.M.; Jamison, S.T.; Devor, S.T. Differences in Rate of Increased Patellofemoral Joint Reaction Force in the Back Squat Exercise: 2593: Board# 201 June 4 9: 00 AM-10: 30 AM. Med. Sci. Sports Exerc. 2010, 42, 681. [Google Scholar]
  18. Esformes, J.I.; Keenan, M.; Moody, J.; Bampouras, T.M. Effect of different types of conditioning contraction on upper body postactivation potentiation. J. Strength Cond. Res. 2011, 25, 143–148. [Google Scholar] [CrossRef]
  19. Sánchez-Medina, L.; Pallarés, J.G.; Pérez, C.E.; Morán-Navarro, R.; González-Badillo, J.J. Estimation of relative load from bar velocity in the full back squat exercise. Sports Med. Int. Open 2017, 1, E80–E88. [Google Scholar] [CrossRef]
  20. Donnelly, D.V.; Berg, W.P.; Fiske, D.M. The effect of the direction of gaze on the kinematics of the squat exercise. J. Strength Cond. Res. 2006, 20, 145–150. [Google Scholar]
  21. Hasegawa, I. Using the overhead squat for core development. NSCA Perform. Train. J. 2004, 3, 19–21. [Google Scholar]
  22. Wretenberg, P.; Feng, Y.; Arborelius, U. High-and low-bar squatting techniques during weight-training. Med. Sci. Sports Exerc. 1996, 28, 218–224. [Google Scholar] [CrossRef]
  23. Murawa, M.; Fryzowicz, A.; Kabacinski, J.; Jurga, J.; Gorwa, J.; Galli, M.; Zago, M. Muscle activation varies between high-bar and low-bar back squat. PeerJ 2020, 8, e9256. [Google Scholar] [CrossRef] [PubMed]
  24. Giustino, V.; Vicari, D.S.S.; Patti, A.; Figlioli, F.; Thomas, E.; Schifaudo, N.; Tedesco, M.; Drid, P.; Paoli, A.; Palma, A. Postural control during the back squat at different load intensities in powerlifters and weightlifters. Ann. Med. 2024, 56, 2383965. [Google Scholar] [CrossRef] [PubMed]
  25. Badillo, J.J.G. La Velocidad de Ejecución Como Referencia Para la Programación, Control y Evaluación del Entrenamiento de Fuerza; Ergotech: Sofia, Bulgaria, 2017. [Google Scholar]
  26. Aasa, U.; Svartholm, I.; Andersson, F.; Berglund, L. Injuries among weightlifters and powerlifters: A systematic review. Br. J. Sports Med. 2017, 51, 211–219. [Google Scholar] [CrossRef]
  27. Travis, S.K.; Mujika, I.; Gentles, J.A.; Stone, M.H.; Bazyler, C.D. Tapering and peaking maximal strength for powerlifting performance: A review. Sports 2020, 8, 125. [Google Scholar] [CrossRef]
  28. Ferland, P.-M.; Comtois, A.S. Classic powerlifting performance: A systematic review. J. Strength Cond. Res. 2019, 33, S194–S201. [Google Scholar] [CrossRef]
  29. Staheli, N.; Cowley, J.C.; Lawrence, M.M. Comparison of Olympic and Safety Squat Bar Barbells on Force, Velocity, and Rating of Perceived Exertion During Acute High-Intensity Back Squats in Recreationally Trained Men. Int. J. Exerc. Sci. 2024, 17, 1120. [Google Scholar] [CrossRef]
  30. Haizlip, K.; Harrison, B.; Leinwand, L. Sex-based differences in skeletal muscle kinetics and fiber-type composition. Physiology 2015, 30, 30–39. [Google Scholar] [CrossRef]
  31. Mehls, K.; Grubbs, B.; Jin, Y.; Coons, J. Electromyography comparison of sex differences during the back squat. J. Strength Cond. Res. 2022, 36, 310–313. [Google Scholar] [CrossRef]
  32. Lisman, P.; Wilder, J.N.; Berenbach, J.; Foster, J.J.; Hansberger, B.L. Sex differences in lower extremity kinematics during overhead and single leg squat tests. Sports Biomech. 2024, 23, 273–286. [Google Scholar] [CrossRef]
  33. González-Badillo, J.J.; Sánchez-Medina, L. Movement velocity as a measure of loading intensity in resistance training. Int. J. Sports Med. 2010, 31, 347–352. [Google Scholar] [CrossRef]
  34. Izquierdo, M.; González-Badillo, J.; Häkkinen, K.; Ibanez, J.; Kraemer, W.; Altadill, A.; Eslava, J.; Gorostiaga, E.M. Effect of loading on unintentional lifting velocity declines during single sets of repetitions to failure during upper and lower extremity muscle actions. Int. J. Sports Med. 2006, 27, 718–724. [Google Scholar] [CrossRef] [PubMed]
  35. Juárez, D.; González-Ravé, J.M.; Navarro, F. Effects of complex vs non complex training programs on lower body maximum strength and power. Isokinet. Exerc. Sci. 2009, 17, 233–241. [Google Scholar] [CrossRef]
  36. Pallarés, J.G.; Sánchez-Medina, L.; Pérez, C.E.; De La Cruz-Sánchez, E.; Mora-Rodriguez, R. Imposing a pause between the eccentric and concentric phases increases the reliability of isoinertial strength assessments. J. Sports Sci. 2014, 32, 1165–1175. [Google Scholar] [CrossRef] [PubMed]
  37. Willardson, J.M.; Burkett, L.N. The effect of different rest intervals between sets on volume components and strength gains. J. Strength Cond. Res. 2008, 22, 146–152. [Google Scholar] [CrossRef]
  38. Cohen, J. Statistical Power Analysis for the Behavioral Sciences; Lawrence Erlbaum Associates Inc. Publishers: Hillsdale, NJ, USA, 1988. [Google Scholar]
  39. Mastalerz, A.; Szyszka, P.; Grantham, W.; Sadowski, J. Biomechanical analysis of successful and unsuccessful snatch lifts in elite female weightlifters. J. Hum. Kinet. 2019, 68, 69. [Google Scholar] [CrossRef]
  40. Suchomel, T.J.; Nimphius, S.; Stone, M.H. The importance of muscular strength in athletic performance. Sports Med. 2016, 46, 1419–1449. [Google Scholar] [CrossRef]
  41. Logar, J.; Kleva, M.; Marušič, U.; Supej, M.; Gerževič, M. Differences in the knee torque between high-and low-bar back squat techniques: A pilot study. Ann. Kinesiol. 2014, 5, 141–151. [Google Scholar]
  42. Mausehund, L.; Krosshaug, T. Understanding bench press biomechanics—Training expertise and sex affect lifting technique and net joint moments. J. Strength Cond. Res. 2023, 37, 9–17. [Google Scholar] [CrossRef]
  43. Alizadeh, S.; Rayner, M.; Mahmoud, M.M.I.; Behm, D.G. Push-Ups vs. Bench Press Differences in Repetitions and Muscle Activation between Sexes. J. Sports Sci. Med. 2020, 19, 289–297. [Google Scholar]
  44. Jaric, S. Muscle Strength Testing. Sports Med. 2002, 32, 615–631. [Google Scholar] [CrossRef]
  45. Hunter, S.K.; Angadi, S.S.; Bhargava, A.; Harper, J.; Hirschberg, A.L.; Levine, B.D.; Moreau, K.L.; Nokoff, N.J.; Stachenfeld, N.S.; Bermon, S. The Biological Basis of Sex Differences in Athletic Performance: Consensus Statement for the American College of Sports Medicine. Transl. J. Am. Coll. Sports Med. 2023, 8, 1–33. [Google Scholar] [CrossRef]
  46. Jidovtseff, B.; Harris, N.K.; Crielaard, J.-M.; Cronin, J.B. Using the load-velocity relationship for 1RM prediction. J. Strength Cond. Res. 2011, 25, 267–270. [Google Scholar] [CrossRef] [PubMed]
  47. Vigotsky, A.D.; Bryanton, M.A.; Nuckols, G.; Beardsley, C.; Contreras, B.; Evans, J.; Schoenfeld, B.J. Biomechanical, Anthropometric, and Psychological Determinants of Barbell Back Squat Strength. J. Strength Cond. Res. 2019, 33, S26–S35. [Google Scholar] [CrossRef]
  48. Bryanton, M.A.; Kennedy, M.D.; Carey, J.P.; Chiu, L.Z.F. Effect of Squat Depth and Barbell Load on Relative Muscular Effort in Squatting. J. Strength Cond. Res. 2012, 26, 2820–2828. [Google Scholar] [CrossRef]
  49. Hopwood, H.J.; Bellinger, P.M.; Compton, H.R.; Bourne, M.N.; Minahan, C. The Relevance of Muscle Fiber Type to Physical Characteristics and Performance in Team-Sport Athletes. Int. J. Sports Physiol. Perform. 2023, 18, 223–230. [Google Scholar] [CrossRef]
  50. Xu, D.; Zhou, H.; Quan, W.; Ma, X.; Chon, T.-E.; Fernandez, J.; Gusztav, F.; Kovács, A.; Baker, J.S.; Gu, Y. New insights optimize landing strategies to reduce lower limb injury risk. Cyborg Bionic Syst. 2024, 5, 0126. [Google Scholar] [CrossRef]
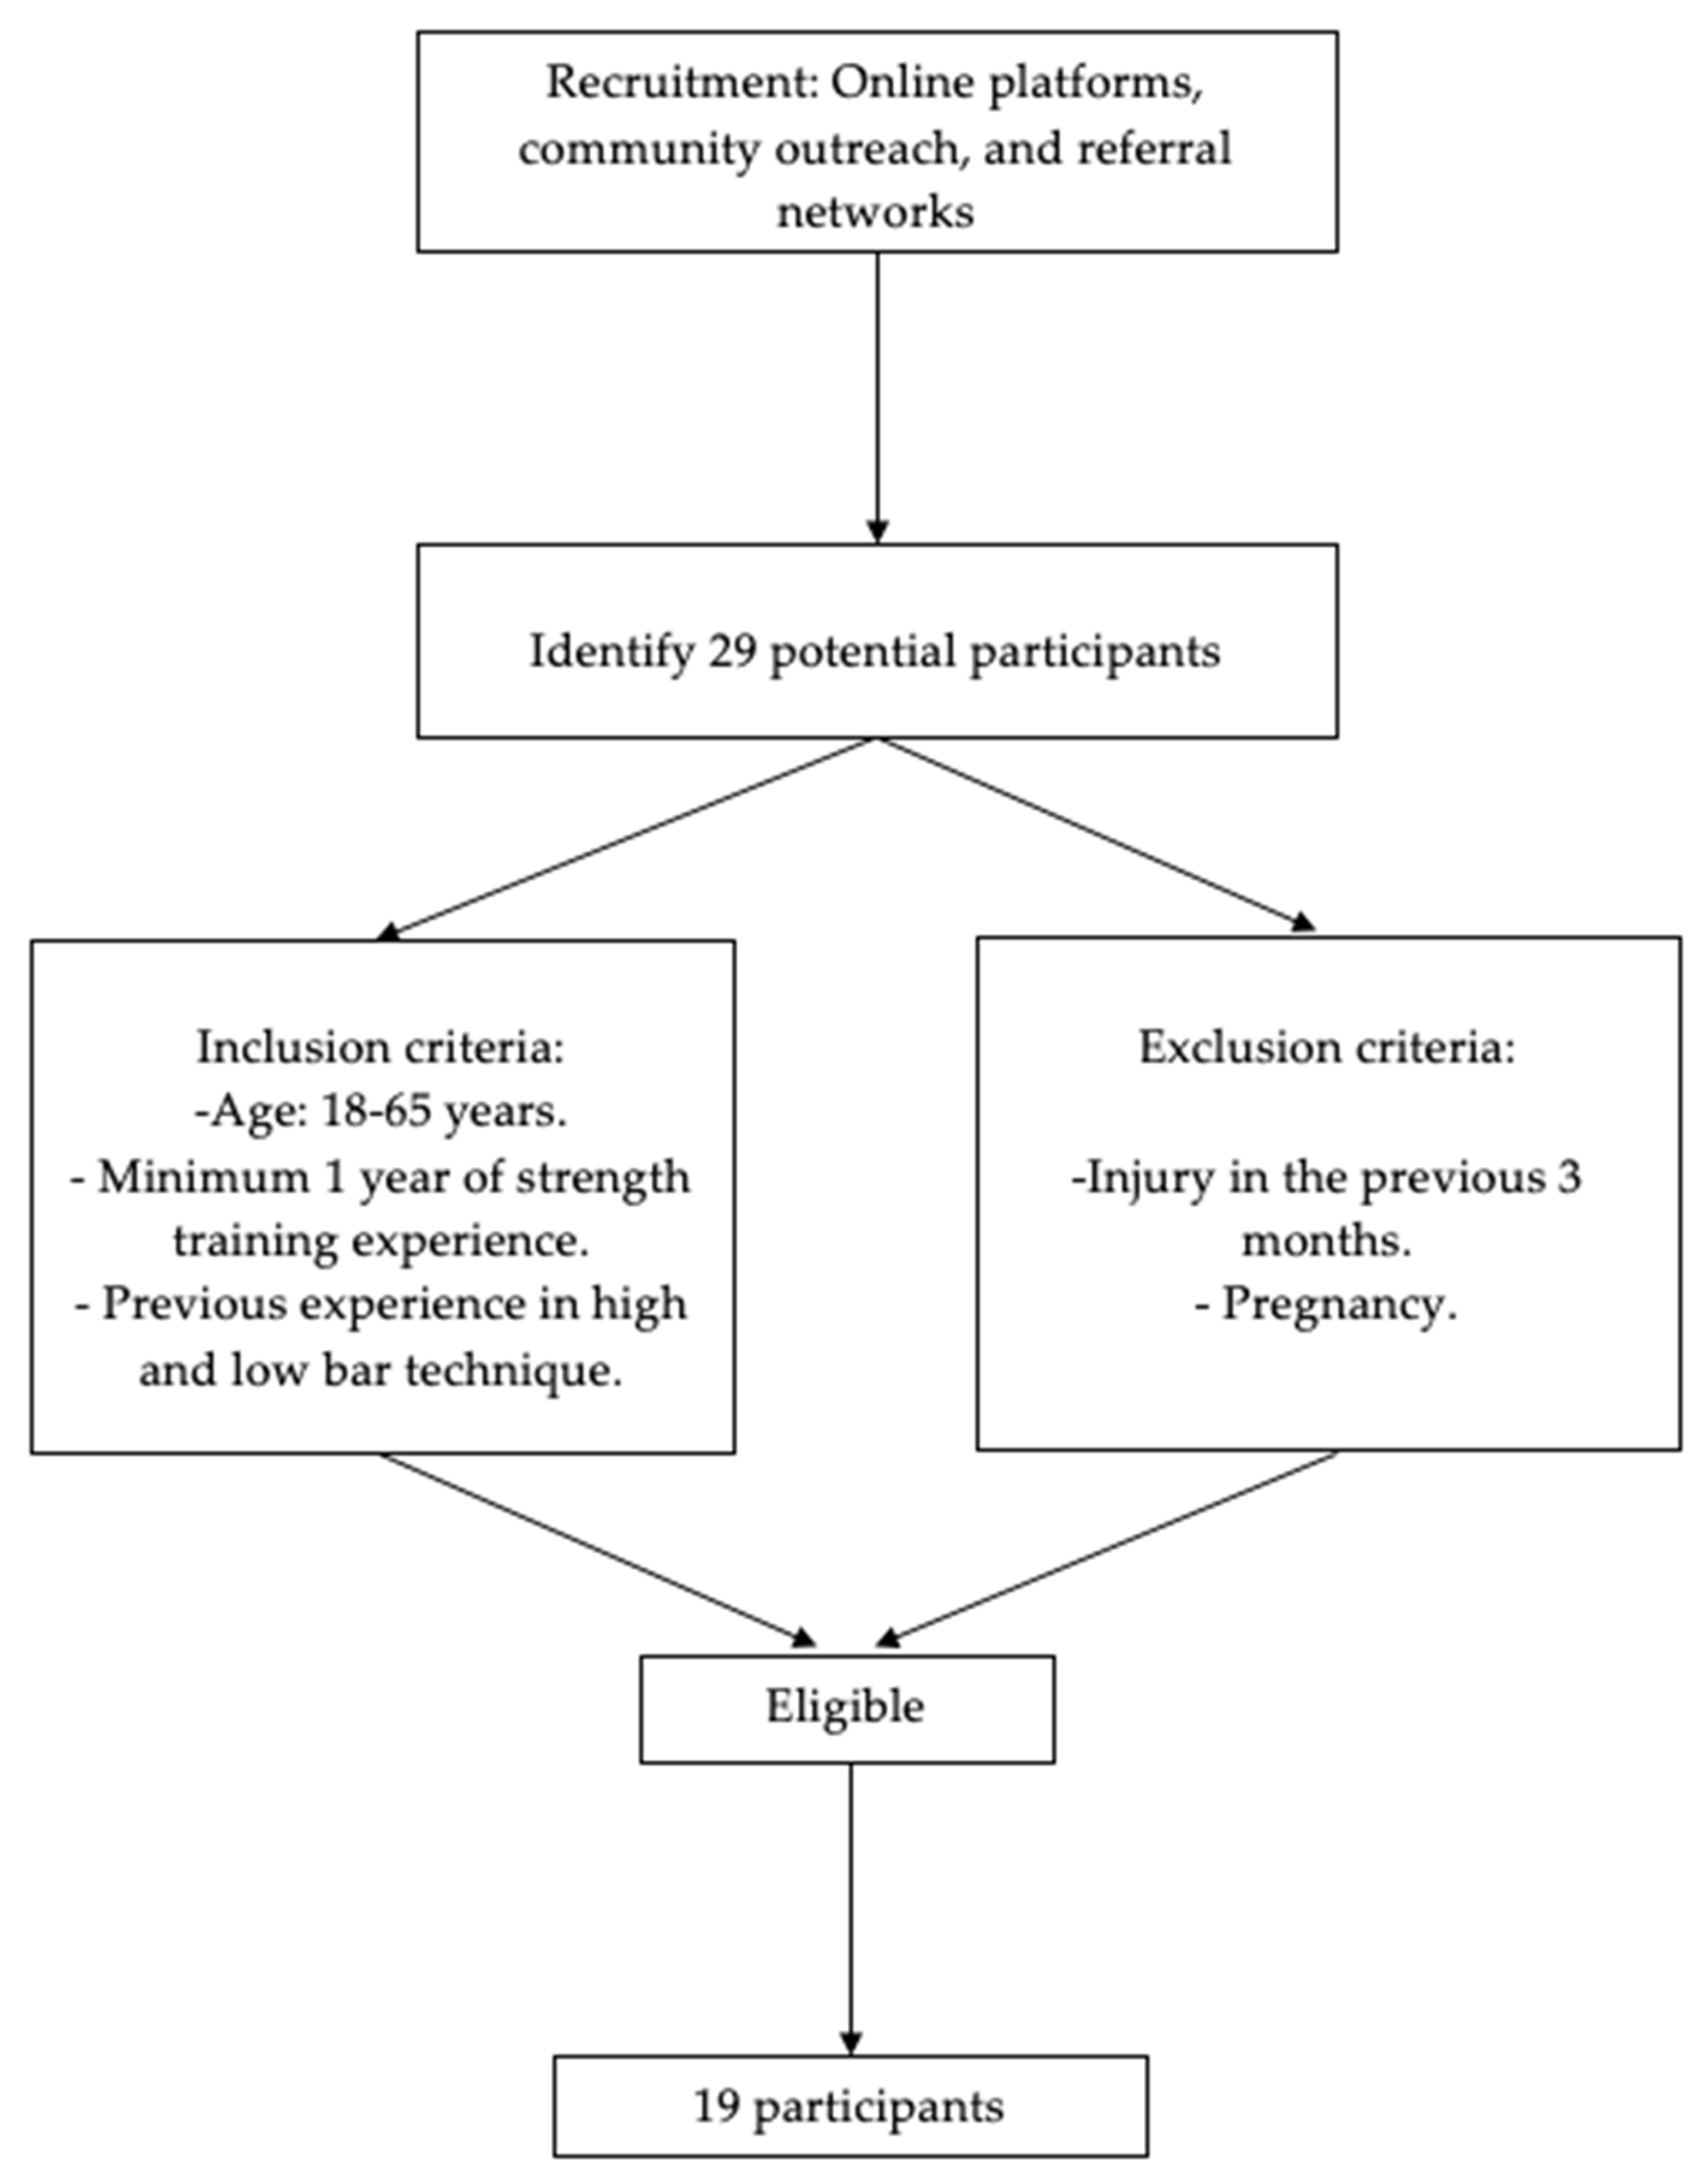
Figure 1. Participants’ selection, inclusion, and exclusion.
Applsci 15 03143 g001
Figure 2. The load–velocity curve shows average data for each absolute load lifted. Note: The size of the bubbles indicates the mean force applied in the concentric phase, i.e., smaller mean forces are represented by smaller bubbles.
Applsci 15 03143 g002
Figure 3. The force–velocity curve shows average data for each absolute load lifted. Note: The size of each bubble indicates the load lifted, i.e., smaller loads are represented by smaller bubbles.
Applsci 15 03143 g003
Figure 4. Low-bar technique with the means to each lifted load.
Applsci 15 03143 g004
Figure 5. High bar technique with the means to each lifted load.
Applsci 15 03143 g005
Figure 6. The continuous velocity profile of the movement during the concentric phase of the squat (i.e., from the lowermost position to the uppermost position) as recorded by the linear position transducer.
Applsci 15 03143 g006
Table 1. Back Squat test results (mean ± SD; and confidence intervals at 95%).
TechniqueParticipantsLoad 1RM (kg)Mean Propulsive Velocity at 1RM (m/s)Mean Propulsive Force at 1RM
(N)
High-bar squatMen
(N = 9)
123.3 ± 14.8
(112.0–134.7)
0.28 ± 0.07
(0.22–0.33)
1274.0 ± 143.0
(1165.3–1382.8)
Women
(N = 10)
75.5 ± 17.2
(64.7–86.3)
0.30 ± 0.08
(0.24–0.35)
788.6 ± 164.4
(685.4–891.8)
Total
(N = 19)
98.2 ± 29.1 ***0.29 ± 0.081018.5 ± 290.9 ***
Low-bar squatMen
(N = 9)
132.2 ± 16.2
(121.1–143.3)
0.31 ± 0.05
(0.25–0.37)
1386.8 ± 184.1
(1268.0–1505.6)
Women
(N = 10)
80.5 ± 15.4
(70.0–91.0)
0.32 ± 0.11
(0.26–0.37)
842.3 ± 154.2
(729.6–955.0)
Total
(N = 19)
105.0 ± 30.6 ***0.31 ± 0.081100.2 ± 324.0 ***
*** Difference (p < 0.001) between low- and high-bar squat exercise techniques as a result of the two-way ANOVA.
Disclaimer/Publisher’s Note: The statements, opinions and data contained in all publications are solely those of the individual author(s) and contributor(s) and not of MDPI and/or the editor(s). MDPI and/or the editor(s) disclaim responsibility for any injury to people or property resulting from any ideas, methods, instructions or products referred to in the content.