
Near-Infrared Spectroscopy for Assessing the Chemical Composition and Fatty Acid Profile of the Total Mixed Rations of Dairy Buffaloes

 , , , and
Abstract
Featured Application
Abstract
1. Introduction
2. Materials and Methods
2.1. Study Design
2.2. Chemical Composition and Fatty Acid Analysis of Total Mixed Ration
2.3. Collection of NIR Spectra
2.4. Division of Dataset and Spectra Preprocessing
2.5. Partial Least Squares Regression (PLSR) Models
3. Results and Discussion
3.1. Sample Composition
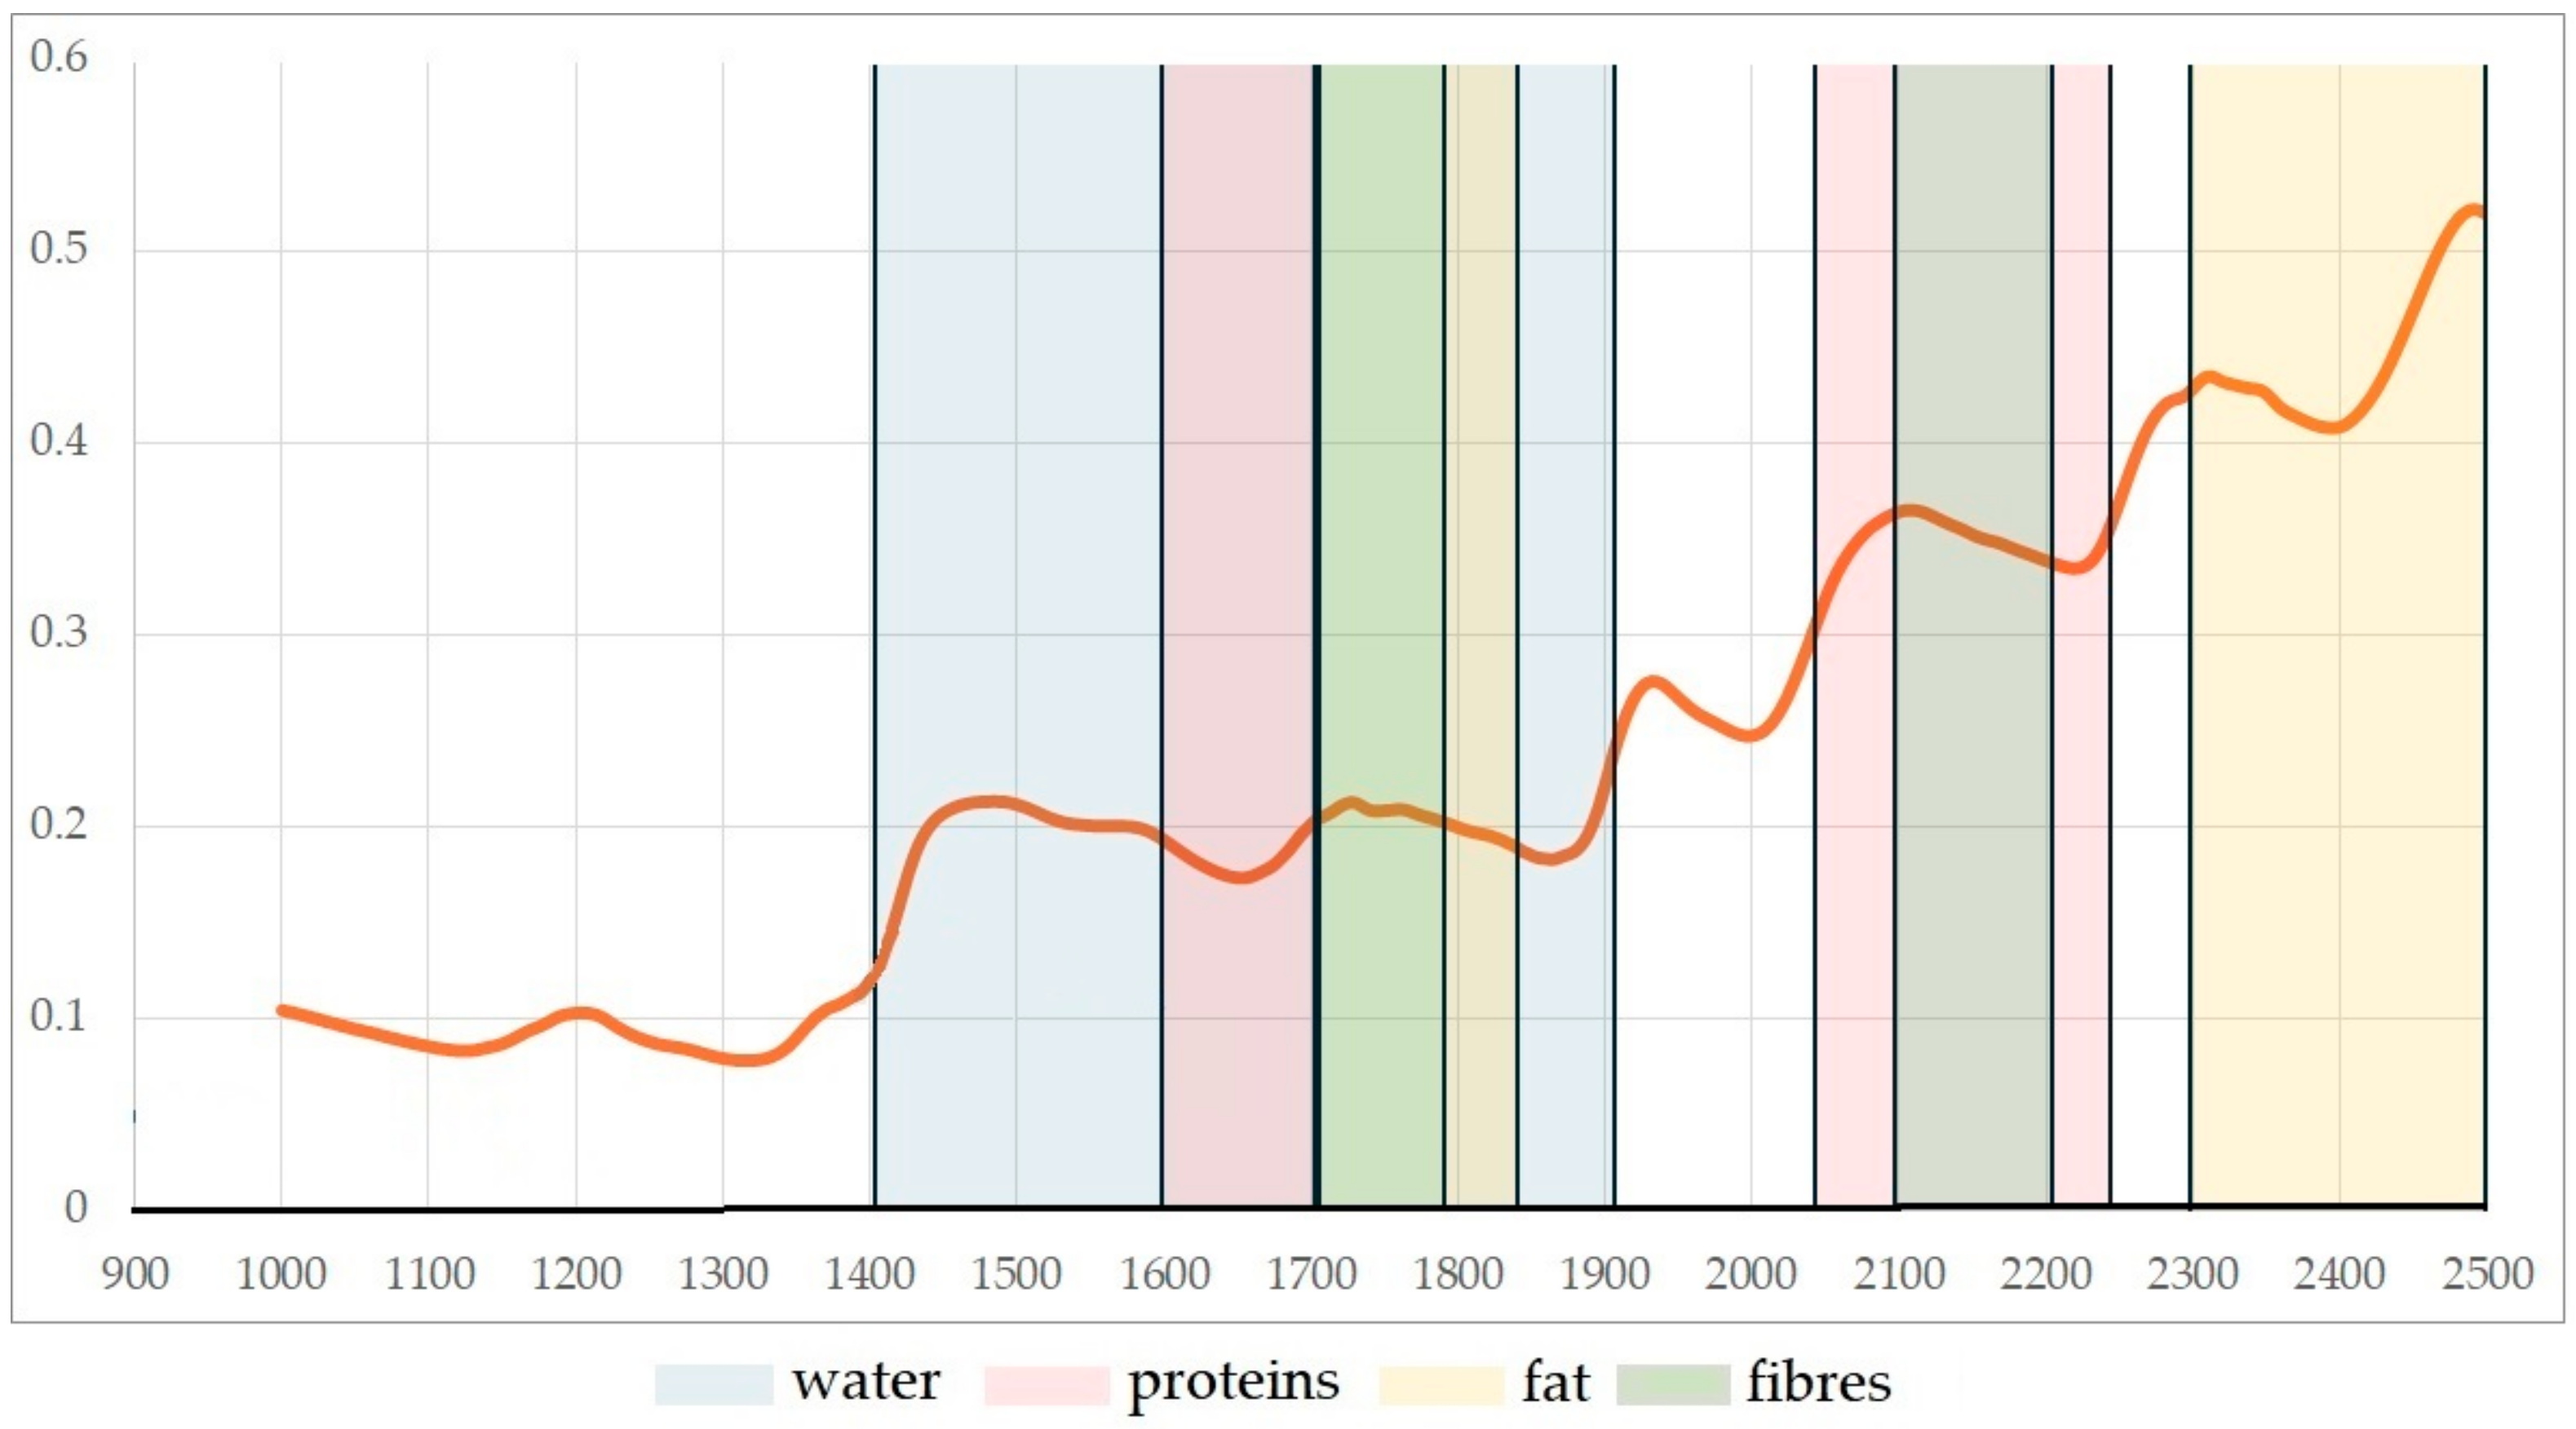
3.2. Spectral Characteristics
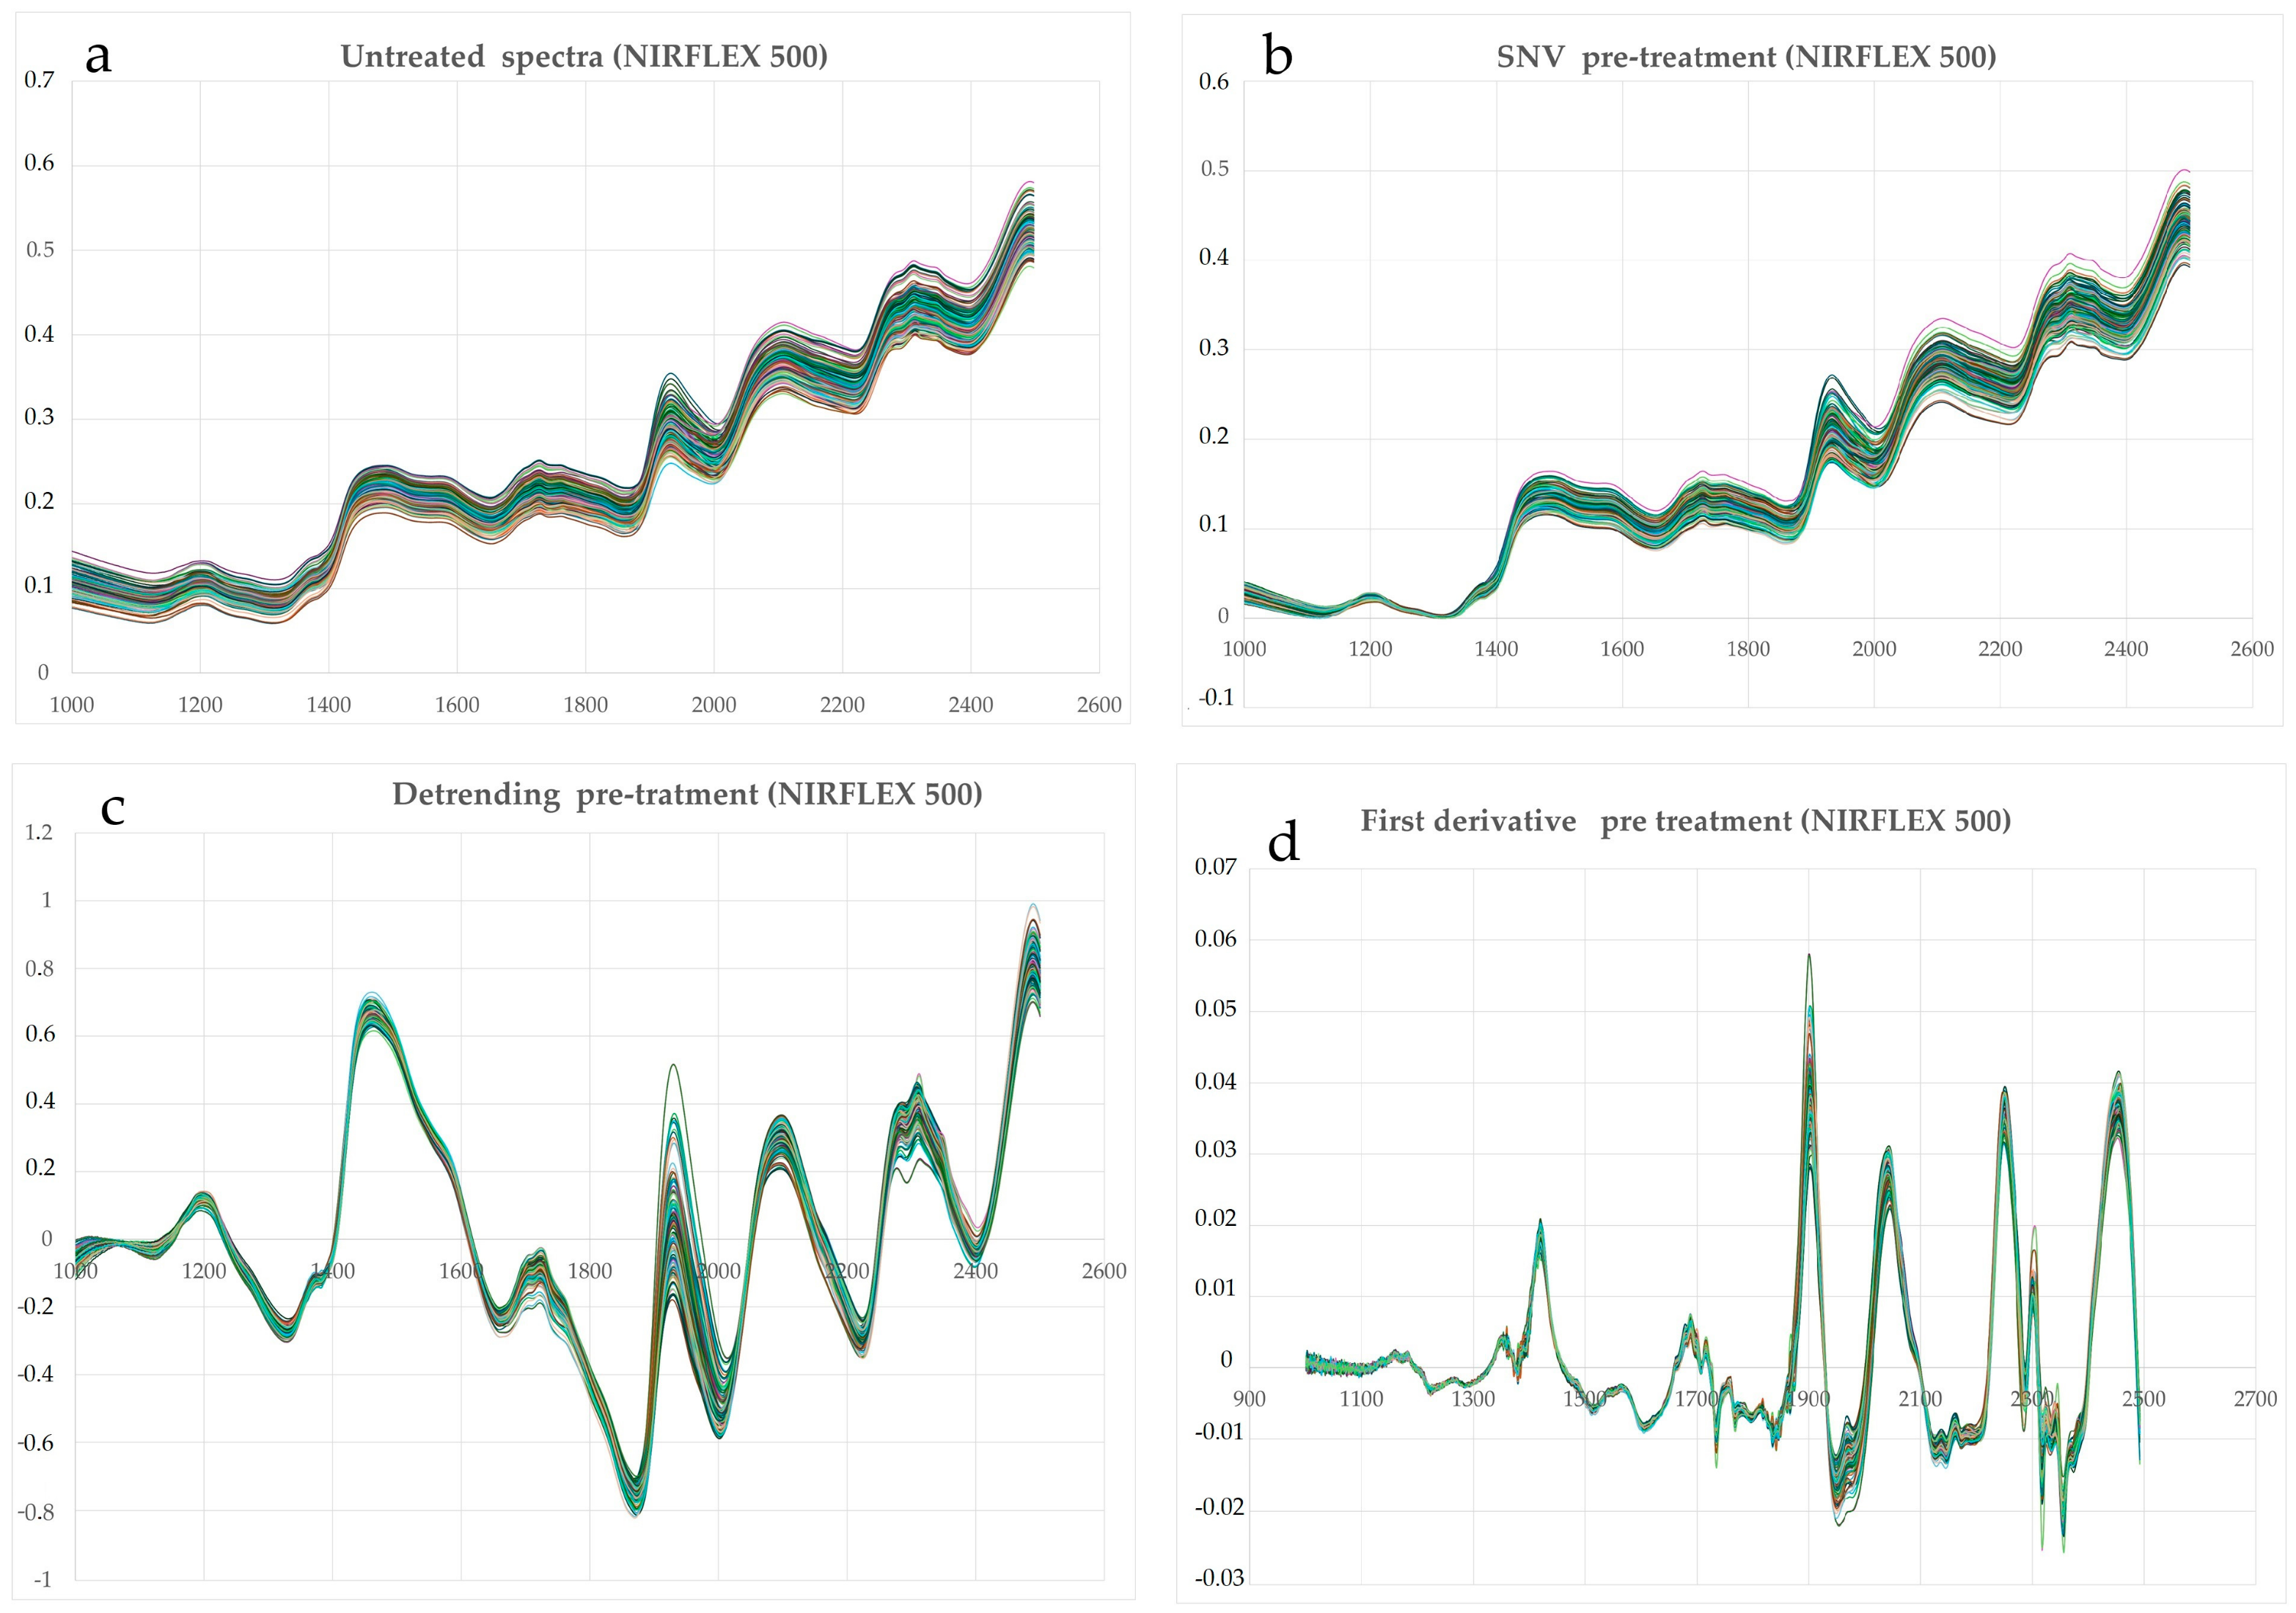
3.3. Pre-Treatment of NIR Spectra
3.4. Prediction Models
3.4.1. Prediction Model for Chemical Analysis
3.4.2. Prediction Model for Fatty Acids
4. Conclusions
Supplementary Materials
Author Contributions
Funding
Institutional Review Board Statement
Informed Consent Statement
Data Availability Statement
Conflicts of Interest
Abbreviations
| MDPI | Multidisciplinary Digital Publishing Institute |
| DOAJ | Directory of open access journals |
| TLA | Three-letter acronym |
| LD | Linear dichroism |
| TMRs | Total Mixed Rations |
| GC-FID | gas chromatograph with a flame ionisation detector |
| NIR | Near-infrared spectroscopy |
| FT-NIR | NIR with Fourier Transform |
| SNV | Standard Normal Variate |
| PLSR | Partial Least Squares Regression |
| LVs | Latent variables |
| S.D. | Standard deviation |
| C.V. | Coefficient of variation |
| RMSE | Root Mean Square Error |
| SEC | Standard error on calibration |
| SECV | Standard error on cross-validation |
| SEP | Standard error on prediction |
| R2 | Coefficient of determination for c = calibration, cv = cross-validation, p = prediction |
| RPD | Residual Predictive Deviation (RPD = SD/SECV or SEP) |
| RER | Range error ratio ((maximum–minimum)/SECV or SEP) |
| DM | Dry matter |
| CP | Crude protein |
| CF | Crude fibre |
| EE | Ether extract |
| aNDF | Neutral Detergent Fibre |
| ADF | Acid Detergent Fibre |
| ADL | Acid Detergent Lignin |
| FA | Fatty acid |
| FAMEs | Fatty acid methyl esters |
| SFAs | Saturated fatty acids |
| MUFAs | Monounsaturated fatty acids |
| PUFAs | Polyunsaturated fatty acids |
References
- Hanigan, M.D.; Daley, V.L. Use of mechanistic nutrition models to identify sustainable food animal production. Annu. Rev. Anim. Biosci. 2020, 8, 355–376. [Google Scholar] [CrossRef] [PubMed]
- Buxton, D.R. Quality-related characteristics of forages as influenced by plant environment and agronomic factors. Anim. Feed Sci. Technol. 1996, 59, 37–49. [Google Scholar] [CrossRef]
- Evangelista, C.; Petrocchi Jasinski, F.; Basiricò, L.; Turriziani, G.; Bernabucci, U. Particle size distribution of total mixed rations fed to Italian Mediterranean buffaloes measured by the PSPS: Impact on milk quality and digestibility. Ital. J. Anim. Sci. 2024, 23, 1535–1550. [Google Scholar] [CrossRef]
- Empel, M.J.V.; Makkar, H.P.S.; Dijkstra, J.; Lund, P. Nutritional, Technological and Managerial Parameters for Precision Feeding to Enhance Feed Nutrient Utilization and Productivity in Different Dairy Cattle Production Systems. CABI Rev. 2016, 11, 1–27. [Google Scholar] [CrossRef]
- Schingoethe, D.J. A 100-Year Review: Total mixed ration feeding of dairy cows. J. Dairy Sci. 2017, 100, 10143–10150. [Google Scholar] [CrossRef]
- Weiss, W.P.; Shoemaker, D.E.; McBeth, L.R.; Yoder, P.; St-Pierre, N.R. Within farm variation in nutrient composition of feeds. In Proceedings of the Tri-State Dairy Nutrition Conference, Columbus, OH, USA, 24–25 April 2012; pp. 103–117. [Google Scholar]
- Piccioli-Cappelli, F.; Calegari, F.; Calamari, L.; Bani, P.; Minuti, A. Application of a NIR device for precision feeding in dairy farms: Effect on metabolic conditions and milk production. Ital. J. Anim. Sci. 2019, 18, 754–765. [Google Scholar] [CrossRef]
- Buonaiuto, G.; Cavallini, D.; Mammi, L.M.E.; Ghiaccio, F.; Palmonari, A.; Formigoni, A.; Visentin, G. The accuracy of NIRS in predicting chemical composition and fibre digestibility of hay-based total mixed rations. Ital. J. Anim. Sci. 2021, 20, 1730–1739. [Google Scholar] [CrossRef]
- Hanuš, O.; Samková, E.; Křížová, L.; Hasoňová, L.; Kala, R. Role of Fatty Acids in Milk Fat and the Influence of Selected Factors on Their Variability—A Review. Molecules 2018, 23, 1636. [Google Scholar] [CrossRef]
- Uzun, P.; Masucci, F.; Serrapica, F.; Napolitano, F.; Braghieri, A.; Romano, R.; Manzo, N.; Esposito, G.; Di Francia, A. The inclusion of fresh forage in the lactating buffalo diet affects fatty acid and sensory profile of mozzarella cheese. J. Dairy Sci. 2018, 101, 6752–6761. [Google Scholar] [CrossRef]
- Toral, P.G.; Monahan, F.J.; Hervás, G.; Frutos, P.; Moloney, A.P. Review: Modulating ruminal lipid metabolism to improve the fatty acid composition of meat and milk. Challenges and opportunities. Animal 2018, 12, s272–s281. [Google Scholar] [CrossRef]
- Halmemies-Beauchet-Filleau, A.; Rinne, M.; Lamminen, M.; Mapato, C.; Ampapon, T.; Wanapat, M.; Vanhatalo, A. Review: Alternative and novel feeds for ruminants: Nutritive value, product quality and environmental aspects. Animal 2018, 12, S295–S309. [Google Scholar] [CrossRef] [PubMed]
- Yakubu, H.G.; Kovacs, Z.; Toth, T.; Bazar, G. The recent advances of near-infrared spectroscopy in dairy production—A review. Crit. Rev. Food Sci. Nutr. 2020, 62, 810–831. [Google Scholar] [CrossRef] [PubMed]
- Hossain, M.E.; Kabir, M.A.; Zheng, L.; Swain, D.L.; McGrath, S.; Medway, J. Near-infrared spectroscopy for analysing livestock diet quality: A systematic review. Syst. Rev. 2024, 10, e40016. [Google Scholar] [CrossRef]
- Yamada, W.; Cherney, J.; Cherney, D.; Runge, T.; Digman, M. Handheld Near-Infrared Spectroscopy for Undried Forage Quality Estimation. Sensors 2024, 24, 5136. [Google Scholar] [CrossRef]
- Evangelista, C.; Basiricò, L.; Bernabucci, U. An Overview on the Use of Near Infrared Spectroscopy (NIRS) on Farms for the Management of Dairy Cows. Agriculture 2021, 11, 296. [Google Scholar] [CrossRef]
- Serva, L.; Magrin, L.; Marchesini, G.; Andrighetto, I. Assessment of the effectiveness of a portable NIRS instrument in controlling the mixer wagon tuning and ration management. Animals 2021, 11, 3566. [Google Scholar] [CrossRef]
- Pereira-Crespo, S.; Botana, A.; Veiga, M.; González, L.; Resch, C.; García-Souto, V.; Martínez-Diz, M.d.P.; Lorenzana, R.; Flores-Calvete, G. Prediction of quality of total mixed ration for dairy cows by near infrared reflectance spectroscopy and empirical equations. J. Appl. Anim. Res. 2022, 50, 69–79. [Google Scholar] [CrossRef]
- Jancewicz, L.J.; Swift, M.L.; Penner, G.; Beauchemin, K.; Koenig, K.; Chibisa, G.; He, M.; McKinnon, J.; Yang, W.; McAllister, T.A.; et al. Development of NIRS calibrations to estimate fecal composition and nutrient digestibility in beef cattle. Can. J. Anim. Sci. 2016, 97, 51–64. [Google Scholar] [CrossRef]
- Guerra, A.; Simoni, M.; Longobardi, V.; Goi, A.; Mantovani, G.; Danese, T.; Neglia, G.; De Marchi, M.; Righi, F. Effectiveness of near-infrared spectroscopy to predict the chemical composition of feces and total-tract apparent nutrients digestibility estimated with undigestible neutral detergent fiber or acid-insoluble ash in lactating buffaloes’ feces. J. Dairy Sci. 2024, 107, 5653–5666. [Google Scholar] [CrossRef]
- Mentink, R.L.; Hoffman, P.C.; Bauman, L.M. Utility of Near-Infrared Reflectance Spectroscopy to Predict Nutrient Composition and In Vitro Digestibility of Total Mixed Rations. J. Dairy Sci. 2006, 89, 2320–2326. [Google Scholar] [CrossRef]
- de Oliveira, D.M.; Pasquini, C.; de Araújo Nogueira, A.R.; Rabelo, M.D.; Simeone, M.L.F.; de Souza, G.B. Comparative analysis of compact and benchtop near-infrared spectrometers for forage nutritional trait measurements. Microchem. J. 2024, 196, 109682. [Google Scholar] [CrossRef]
- Ozaki, Y.; Huck, W.C.; Beć, K.B. Chapter 2—Near-IR Spectroscopy and Its Applications. In Molecular and Laser Spectroscopy; Gupta, V.P., Ed.; Elsevier: Amsterdam, The Netherlands, 2018; Volume 2, pp. 11–38. [Google Scholar] [CrossRef]
- Czarnecki, M.A.; Beć, K.B.; Grabska, J.; Hofer, T.S.; Ozaki, Y. Overview of Application of NIR Spectroscopy to Physical Chemistry. In Near-Infrared Spectroscopy; Ozaki, Y., Huck, C., Tsuchikawa, S., Engelsen, S.B., Eds.; Springer: Singapore, 2021; pp. 297–330. [Google Scholar] [CrossRef]
- González-Domínguez, R.; Sayago, A.; Fernández-Recamales, Á. An Overview on the Application of Chemometrics Tools in Food Authenticity and Traceability. Foods 2022, 11, 3940. [Google Scholar] [CrossRef] [PubMed]
- Zeaiter, M.; Roger, J.-M.; Bellon-Maurel, V. Robustness of models developed by multivariate calibration. Part II: The influence of pre-processing methods. TrAC Trends Anal. Chem. 2005, 24, 437–445. [Google Scholar] [CrossRef]
- Yun, Y.-H.; Li, H.-D.; Deng, B.-C.; Cao, D.-S. An overview of variable selection methods in multivariate analysis of near-infrared spectra. TrAC Trends Anal. Chem. 2019, 113, 102–115. [Google Scholar] [CrossRef]
- Foster, J.G.; Clapham, W.M.; Fedders, J.M. Quantification of Fatty Acids in Forages by Near-Infrared Reflectance Spectroscopy. J. Agric. Food Chem. 2006, 54, 3186–3192. [Google Scholar] [CrossRef]
- Calderon, F.J.; Reeves, J.B., III; Foster, J.G.; Clapham, W.M.; Fedders, J.M.; Vigil, M.F.; Henry, W.B. Comparison of Diffuse Reflectance Fourier Transform Mid-Infrared and Near-Infrared Spectroscopy with Grating-Based Near-Infrared for the Determination of Fatty Acids in Forages. J. Agric. Food Chem. 2007, 55, 8302–8309. [Google Scholar] [CrossRef]
- Arslan, A.; Aygun, Y.Z.; Turkmen, M.; Celiktas, N.; Mert, M. Combining non-destructive devices and multivariate analysis as a tool to quantify the fatty acid profiles of linseed genotypes. Talanta 2025, 281, 126798. [Google Scholar] [CrossRef]
- Bionaz, M.; Vargas-Bello-Pérez, E.; Busato, S. Advances in fatty acids nutrition in dairy cows: From gut to cells and effects on performance. J. Anim. Sci. Biotechnol. 2020, 11, 110. [Google Scholar] [CrossRef]
- AOAC International. Association of Official Analytical Chemist (AOAC), 18th ed.; AOAC: Gaithersburg, MD, USA, 2006. [Google Scholar]
- Van Soest, P.J.; Robertson, J.B.; Lewis, B.A. Methods for dietary fiber, neutral detergent fiber, and nonstarch polysaccharides in relation to animal nutrition. J. Dairy Sci. 1991, 74, 3583–3597. [Google Scholar] [CrossRef]
- Folch, J.; Lees, M.; Sloane-Stanley, G.H. A simple method for the isolation and purification of total lipids from animal tissues. J. Biol. Chem. 1957, 226, 497–509. [Google Scholar] [CrossRef]
- Contò, M.; Cifuni, G.F.; Iacurto, M.; Failla, S. Effect of pasture and intensive feeding systems on the carcass and meat quality of buffalo. Anim. Biosci. 2022, 35, 105–114. [Google Scholar] [CrossRef] [PubMed]
- Pasquini, C. Near infrared spectroscopy: A mature analytical technique with new perspectives—A review. Anal. Chim. Acta 2018, 1026, 8–36. [Google Scholar] [CrossRef] [PubMed]
- Williams, P.; Norris, K. Variables affecting near infrared reflectance spectroscopic analysis. In Near Infrared Technology in the Agricultural and Food Industries; Williams, P., Norris, K., Eds.; AACC: St. Paul, MN, USA, 1987; pp. 143–167. [Google Scholar]
- Barnes, R.J.; Dhanoa, M.S.; Lister, S.J. Standard normal variate transformation and de-trending of near-infrared diffuse reflectance spectra. Appl. Spectrosc. 1989, 43, 772–777. [Google Scholar] [CrossRef]
- Malley, D.F.; McClure, C.; Martin, P.D.; Buckley, K.; McCaughey, W.P. Compositional Analysis of Cattle Manure During Composting Using a Field-Portable Near-Infrared Spectrometer. Commun. Soil Sci. Plant Anal. 2005, 36, 455–475. [Google Scholar] [CrossRef]
- Williams, P. Near-Infrared Technology—Getting the Best Out of Light: A Short Course in the Practical Implementation of Near-Infrared Spectroscopy for the User, 2nd ed.; PDK Projects Inc.: Nanaimo, BC, Canada, 2004. [Google Scholar]
- Evangelista, C.; Bernabucci, U.; Basiricò, L. Effect of antioxidant supplementation on milk yield and quality in Italian Mediterranean lactating buffaloes. Animals 2022, 12, 1903. [Google Scholar] [CrossRef]
- Masucci, F.; Serrapica, F.; Cutrignelli, M.I.; Sabia, E.; Balivo, A.; Di Francia, A. Replacing maize silage with hydroponic barley forage in lactating water buffalo diet: Impact on milk yield and composition, water and energy footprint, and economics. J. Dairy Sci. 2024, 107, 9426–9441. [Google Scholar] [CrossRef]
- Pereira-Crespo, S.; Flores-Calvete, G.; Valladares-Alonso, J.; Díaz-Díaz, N.; Díaz-Díaz, D.; Resch-Zafra, C.; Fernández-Lorenzo, B.; Latorre, A.; González, L.; Dagnac, T. Prediction of fatty acids composition of annual forage clovers and serradella by near infrared spectroscopy. In Forage Resources and Ecosystem Services Provided by Mountain and Mediterranean Grasslands and Rangelands; Baumont, R., Carrère, P., Jouven, M., Lombardi, G., López-Francos, A., Martin, B., Peeters, A., Porqueddu, C., Eds.; FAO: Rome, Italy, 2014; Zaragoza: CIHEAM/INRA/FAO/VetAgro Sup Clermont-Ferrand/Montpellier SupAgro. (Options Méditerranéennes: Série A. Séminaires Méditerranéens, No. 109); pp. 375–378. [Google Scholar]
- Burns, D.A.; Ciurczak, E.W. Handbook of Near-Infrared Analysis, 3rd ed.; CRC Press: Boca Raton, FL, USA, 2007. [Google Scholar]
- Ripoll, G.; Failla, S.; Panea, B.; Hocquette, J.-F.; Dunner, S.; Olleta, J.L.; Christensen, M.; Ertbjerg, P.; Richardson, I.; Contò, M.; et al. Near-Infrared Reflectance Spectroscopy for Predicting the Phospholipid Fraction and the Total Fatty Acid Composition of Freeze-Dried Beef. Sensors 2021, 21, 4230. [Google Scholar] [CrossRef]
- Giaretta, E.; Mordenti, A.; Palmonari, A.; Brogna, N.; Canestrari, G.; Belloni, P.; Cavallini, D.; Mammi, L.; Cabbri, R.; Formigoni, A. NIRs calibration models for chemical composition and fatty acid families of raw and freeze-dried beef: A comparison. J. Food Compos. Anal. 2019, 83, 103257. [Google Scholar] [CrossRef]
- Workman, J. Spectral interpretation. In Handbook of Near-Infrared Analysis; CRC Press: Boca Raton, FL, USA, 2021; pp. 45–67. [Google Scholar]
- Shenk, J.S.; Westerhaus, M.O. Population Definition, Sample Selection, and Calibration Procedures for Near Infrared Reflectance Spectroscopy. Crop Sci. 1991, 31, 469–474. [Google Scholar] [CrossRef]
- Azzouz, T.; Puigdoménech, A.; Aragay, M.; Tauler, R. Comparison between different data pre-treatment methods in the analysis of forage samples using near-infrared diffuse reflectance spectroscopy and partial least-squares multivariate calibration method. Anal. Chim. Acta 2003, 484, 121–134. [Google Scholar] [CrossRef]
- Pérez-Marín, D.; de la Roza-Delgado, B.; Entrenas, J.A.; Garrido-Cuevas, M.; Garrido-Varo, A. Transferring a large data library of fresh total mixed rations from a benchtop to 2 portable near-infrared spectrometers for on-farm real-time decisions. J. Dairy Sci. 2022, 105, 2380–2392. [Google Scholar] [CrossRef]
- Meignan, T.; Lechartier, C.; Chesneau, G.; Bareille, N. Effects of feeding extruded linseed on production performance and milk fatty acid profile in dairy cows: A meta-analysis. J. Dairy Sci. 2017, 100, 4394–4408. [Google Scholar] [CrossRef]

| Type | NIRFlex 500 BÜCHI |
|---|---|
| Sensor | Extended range InGaAs (temperature controlled) |
| Spectrum range | 1000–2500 nm |
| Numerical resolution | 4 cm−1 (with boxcar apodisation) |
| Average optical resolution | HWHN 3.25 nm |
| Supply | 100–230 VAC ± 10%, 50/60 Hz, 350 W |
| Type of measurements | Reflectance/transmittance Measurement cells (NIRFlex Solids) |
| Measurement geometry | FT-NIR Internal and automatic |
| R2 | RPD | RER | Classification | Application |
|---|---|---|---|---|
| <0.80 | <2.0 | <7 | Very poor | Not recommended |
| 2.0 to 2.5 | Poor | Rough screening | ||
| 0.80 to 0.90 | 2.5 to 3.0 | <10 | Fair | Screening |
| 3.0 to 3.5 | >10 | Good | Quality control | |
| 0.90 to 0.95 | 3.5 to 4.0 | Very good | Process control | |
| >0.95 | >4.0 | >20 | Excellent | Any application |
| Calibration Set (168) | Independent Set for Validation (72) | |||||||
|---|---|---|---|---|---|---|---|---|
| % | Mean | Range | S.D. | C.V. | Mean | Range | S.D. | C.V. |
| DM * | 52.33 | 25.48 | 5.65 | 10.80 | 52.34 | 22.04 | 5.73 | 10.95 |
| Ash | 6.76 | 3.69 | 0.79 | 11.75 | 6.83 | 3.81 | 0.85 | 12.40 |
| CP | 12.08 | 9.31 | 1.58 | 13.09 | 12.59 | 9.57 | 1.82 | 14.45 |
| EE | 2.50 | 2.45 | 0.39 | 15.64 | 2.45 | 2.03 | 0.42 | 17.10 |
| CF | 28.96 | 24.54 | 5.26 | 18.16 | 30.08 | 21.61 | 4.97 | 16.52 |
| aNDF | 44.72 | 25.72 | 5.01 | 11.21 | 46.56 | 23.49 | 5.16 | 11.08 |
| ADF | 30.40 | 15.63 | 3.35 | 11.02 | 31.38 | 17.22 | 3.70 | 11.78 |
| ADL | 6.45 | 5.95 | 1.18 | 18.31 | 6.97 | 5.82 | 1.20 | 17.26 |
| Starch | 14.50 | 12.85 | 2.73 | 18.80 | 13.18 | 12.05 | 2.65 | 20.08 |
| Calibration Set (168) | Independent Set for Validation (72) | |||||||
|---|---|---|---|---|---|---|---|---|
| % | Mean | Range | S.D. | C.V. | Mean | Range | S.D. | C.V. |
| 14:0 | 0.47 | 0.52 | 0.10 | 20.64 | 0.50 | 0.48 | 0.10 | 20.80 |
| 16:0 | 17.36 | 8.89 | 1.83 | 10.56 | 18.05 | 7.50 | 1.73 | 9.57 |
| 16:1 | 0.46 | 0.70 | 0.12 | 25.22 | 0.46 | 0.67 | 0.10 | 21.09 |
| 18:0 | 3.12 | 3.76 | 0.63 | 20.26 | 3.08 | 2.98 | 0.61 | 19.77 |
| 18:1 cis-9 | 20.89 | 8.69 | 1.81 | 8.65 | 20.53 | 8.55 | 1.61 | 7.82 |
| 18:1 cis-11 | 1.03 | 0.56 | 0.10 | 9.81 | 1.05 | 0.48 | 0.10 | 8.95 |
| 18:2 n-6 | 42.54 | 21.57 | 3.62 | 8.04 | 43.25 | 17.88 | 3.73 | 8.62 |
| 18:3 n-6 | 1.78 | 4.17 | 0.87 | 48.99 | 2.01 | 3.29 | 0.79 | 42.49 |
| 18:3 n-3 | 9.77 | 13.98 | 3.59 | 36.77 | 8.64 | 13.77 | 3.96 | 45.84 |
| SFA | 21.81 | 7.91 | 1.99 | 9.11 | 22.21 | 7.81 | 1.81 | 8.13 |
| MUFA | 22.89 | 7.52 | 1.67 | 7.30 | 22.48 | 7.87 | 1.66 | 7.36 |
| PUFA | 55.19 | 12.16 | 2.28 | 4.14 | 54.89 | 9.91 | 1.98 | 3.61 |
| Calibration Set | Independent Set for Validation | ||||||||
|---|---|---|---|---|---|---|---|---|---|
| % | LV | OUT | R2c | SEC | R2cv | SECV | OUT | R2p | SEP |
| DM * | 7 | 0 | 0.93 | 1.22 | 0.92 | 1.32 | 1 | 0.89 | 1.41 |
| Ash | 5 | 5 | 0.87 | 0.25 | 0.86 | 0.26 | 1 | 0.85 | 0.29 |
| CP | 4 | 0 | 0.91 | 0.45 | 0.90 | 0.47 | 2 | 0.88 | 0.58 |
| EE | 6 | 2 | 0.90 | 0.12 | 0.89 | 0.13 | 0 | 0.87 | 0.15 |
| CF | 7 | 4 | 0.87 | 1.55 | 0.85 | 1.68 | 0 | 0.84 | 1.77 |
| aNDF | 7 | 5 | 0.90 | 1.41 | 0.88 | 1.55 | 1 | 0.81 | 1.71 |
| ADF | 6 | 4 | 0.88 | 1.07 | 0.87 | 1.12 | 1 | 0.85 | 1.36 |
| ADL | 5 | 2 | 0.83 | 0.39 | 0.82 | 0.42 | 3 | 0.81 | 0.43 |
| Starch | 7 | 0 | 0.92 | 0.74 | 0.91 | 0.79 | 0 | 0.88 | 0.82 |
| Calibration Set | Independent Set for Validation | |||
|---|---|---|---|---|
| % | RPDcv | RERcv | RPDp | RERp |
| DM * | 4.29 | 19.36 | 4.06 | 15.62 |
| Ash | 3.04 | 14.14 | 2.95 | 13.28 |
| CP | 3.32 | 19.54 | 3.12 | 16.42 |
| EE | 2.92 | 18.28 | 2.70 | 13.10 |
| CF | 3.14 | 14.64 | 2.80 | 12.18 |
| aNDF | 3.22 | 16.55 | 3.01 | 13.70 |
| ADF | 2.98 | 13.89 | 2.71 | 12.62 |
| ADL | 2.83 | 14.27 | 2.80 | 13.57 |
| Starch | 3.45 | 16.25 | 3.22 | 14.68 |
| Calibration Set | Independent Set for Validation | ||||||||
|---|---|---|---|---|---|---|---|---|---|
| % | LV | OUT | R2c | SEC | R2cv | SECV | OUT | R2p | SEP |
| 14:0 | 4 | 0 | 0.86 | 0.03 | 0.84 | 0.03 | 0 | 0.83 | 0.04 |
| 16:0 | 7 | 4 | 0.85 | 0.60 | 0.83 | 0.65 | 3 | 0.82 | 0.65 |
| 16:1 | 6 | 2 | 0.88 | 0.04 | 0.86 | 0.04 | 2 | 0.84 | 0.04 |
| 18:0 | 7 | 3 | 0.87 | 0.17 | 0.85 | 0.18 | 2 | 0.83 | 0.24 |
| 18:1 cis-9 | 7 | 3 | 0.87 | 0.55 | 0.85 | 0.59 | 2 | 0.84 | 0.63 |
| 18:1 cis-11 | 7 | 3 | 0.84 | 0.03 | 0.81 | 0.03 | 1 | 0.78 | 0.04 |
| 18:2 n-6 | 7 | 2 | 0.88 | 1.10 | 0.86 | 1.20 | 1 | 0.84 | 1.21 |
| 18:3 n-6 | 6 | 0 | 0.91 | 0.21 | 0.90 | 0.23 | 0 | 0.90 | 0.21 |
| 18:3 n-3 | 7 | 3 | 0.86 | 1.09 | 0.84 | 1.19 | 3 | 0.81 | 1.21 |
| SFA | 6 | 4 | 0.83 | 0.65 | 0.80 | 0.69 | 3 | 0.77 | 0.75 |
| MUFA | 6 | 1 | 0.89 | 0.51 | 0.87 | 0.54 | 4 | 0.81 | 0.69 |
| PUFA | 7 | 4 | 0.83 | 0.79 | 0.81 | 0.85 | 3 | 0.80 | 0.79 |
| Calibration Set | Independent Set for Validation | |||
|---|---|---|---|---|
| % | RPDcv | RERcv | RPDp | RERp |
| 14:0 | 2.94 | 15.73 | 2.97 | 13.63 |
| 16:0 | 2.84 | 13.78 | 2.67 | 11.59 |
| 16:1 | 3.05 | 18.42 | 2.62 | 18.14 |
| 18:0 | 3.53 | 21.01 | 2.52 | 12.30 |
| 18:1 cis-9 | 3.09 | 14.85 | 2.54 | 13.51 |
| 18:1 cis-11 | 3.16 | 17.66 | 2.41 | 12.36 |
| 18:2 n-6 | 3.01 | 17.95 | 3.09 | 14.80 |
| 18:3 n-6 | 3.88 | 18.52 | 3.82 | 15.83 |
| 18:3 n-3 | 3.02 | 11.73 | 3.27 | 11.37 |
| SFA | 2.87 | 11.41 | 2.42 | 10.47 |
| MUFA | 3.07 | 13.81 | 2.40 | 11.42 |
| PUFA | 2.70 | 14.36 | 2.51 | 12.57 |
Disclaimer/Publisher’s Note: The statements, opinions and data contained in all publications are solely those of the individual author(s) and contributor(s) and not of MDPI and/or the editor(s). MDPI and/or the editor(s) disclaim responsibility for any injury to people or property resulting from any ideas, methods, instructions or products referred to in the content. |
© 2025 by the authors. Licensee MDPI, Basel, Switzerland. This article is an open access article distributed under the terms and conditions of the Creative Commons Attribution (CC BY) license (https://creativecommons.org/licenses/by/4.0/).
Share and Cite
Evangelista, C.; Contò, M.; Basiricò, L.; Bernabucci, U.; Failla, S. Near-Infrared Spectroscopy for Assessing the Chemical Composition and Fatty Acid Profile of the Total Mixed Rations of Dairy Buffaloes. Appl. Sci. 2025, 15, 3211. https://doi.org/10.3390/app15063211
Evangelista C, Contò M, Basiricò L, Bernabucci U, Failla S. Near-Infrared Spectroscopy for Assessing the Chemical Composition and Fatty Acid Profile of the Total Mixed Rations of Dairy Buffaloes. Applied Sciences. 2025; 15(6):3211. https://doi.org/10.3390/app15063211
Chicago/Turabian StyleEvangelista, Chiara, Michela Contò, Loredana Basiricò, Umberto Bernabucci, and Sebastiana Failla. 2025. "Near-Infrared Spectroscopy for Assessing the Chemical Composition and Fatty Acid Profile of the Total Mixed Rations of Dairy Buffaloes" Applied Sciences 15, no. 6: 3211. https://doi.org/10.3390/app15063211
APA StyleEvangelista, C., Contò, M., Basiricò, L., Bernabucci, U., & Failla, S. (2025). Near-Infrared Spectroscopy for Assessing the Chemical Composition and Fatty Acid Profile of the Total Mixed Rations of Dairy Buffaloes. Applied Sciences, 15(6), 3211. https://doi.org/10.3390/app15063211