Article

A Component-Based Approach to Early Warning Systems: A Theoretical Model

by
Daniel Chovanec
1,
Boris Kollár
1,
Bronislava Halúsková
1,
Jozef Kubás
1,
Marcin Pawęska
2 and
Jozef Ristvej
1,*
1
Department of Crisis Management, Faculty of Security Engineering, University of Žilina, Univerzitná 1, 010 26 Žilina, Slovakia
2
International University of Logistics and Transport in Wroclaw, Sołtysowicka 19B, 51-168 Wrocław, Poland
*
Author to whom correspondence should be addressed.
Appl. Sci. 2025, 15(6), 3218; https://doi.org/10.3390/app15063218
Submission received: 12 February 2025 / Revised: 10 March 2025 / Accepted: 13 March 2025 / Published: 15 March 2025

Abstract

:
Natural hazards pose an increasing threat to society, necessitating the development of effective early warning systems (EWSs). This paper explores their critical role in mitigating the impacts of natural hazards. Its primary objective is to define and categorise the components of EWSs, summarise the components of existing systems, and propose a framework for a comprehensive early warning system. This paper includes a thorough review of the available scientific literature on early warning systems, natural hazards, and their underlying causes. It identifies both primary and secondary causes of selected natural hazards, along with their manifestations. Particular emphasis is placed on the significance of sensors and modern technologies for real-time data collection and processing. Based on this analysis, a framework is proposed that integrates various data sources, technologies, and components to enhance preparedness. The findings highlight the necessity of a holistic approach to early warning systems, one that accounts for different types of disasters and the specific needs of at-risk populations. The proposed framework may serve as a foundation for further development and the implementation of more effective early warning systems.

1. Introduction

Natural hazards not only pose a significant threat to human lives and property but also to the overall ecosystem in which we live. In the past, people relied on the assumption that only certain types of natural hazards could occur in their area. This assumption was mainly based on the local and regional characteristics of the territory. However, today, we are witnessing that this is no longer the case. An example is the tornado that struck the Czech Republic in 2021 [1].
In recent years, we have seen multiple devastating crisis events, or disasters, caused by natural forces. Numerous examples can be cited, with some of the most destructive disasters occurring within the European Union and its neighbouring countries.
The 2023 earthquake on the Turkey–Syria border claimed more than 56,000 lives, according to the Centre for Disaster Philanthropy. Infrastructure in the affected area was destroyed, with more than 230,000 buildings damaged or completely destroyed [2].
The impact of climate change and natural factors will lead to more frequent crisis events in the future, with an expected increase in their scale. In central Europe, the most common type of crisis event is flooding [3]. Devastating floods are occurring increasingly often across the European Union. An example is the August 2023 floods in Slovenia. A combination of several factors led to catastrophic flooding in the country, with a calculated return period of 250 years. Key contributing factors included weather anomalies such as above-average rainfall in the affected area, autumn-like weather patterns, high soil moisture, and an increased frequency of storms. Additionally, the affected region had already been impacted by minor landslides and fallen vegetation, which had not been cleared from forests before the flood. As a result, the disaster caused damages amounting to nearly 10 billion euros, affected more than 12,000 homes, and resulted in three fatalities [4].
Another example of severe flooding includes the 2024 floods in Germany [5], the Czech Republic [6], and the Spanish city of Valencia, where more than 190,000 people were affected. Additionally, 3200 km of roads and engineering networks were damaged, and more than 200 lives were lost [7].
Beyond flooding, wildfires also pose a major threat in Europe. In recent years, large wildfires have particularly affected Greece and Portugal [8]. Other natural hazards include snow avalanches and storms, landslides, droughts, hurricanes, thunderstorms, and extreme heatwaves.
These crisis events demonstrate that their frequency is increasing and their consequences are becoming more severe. To ensure the protection of the population, early warning systems (EWSs) play a crucial role. Given these circumstances, it is essential for such systems to be as comprehensive as possible.

1.1. Early Warning Systems

According to the Global Status of Multi-Hazard Early Warning Systems: 2024 [9], the mortality rate caused by disasters is up to six times higher in countries where EWSs are less comprehensive or less developed. Compared to countries with well-established and complex EWSs, nations with limited or moderately developed EWSs experience a four-fold increase in disaster-related mortality. These figures are based on empirical data [9].
The availability of EWSs is also one of the key priorities of the Sendai Framework for Disaster Risk Reduction 2030 [10]. This objective is monitored using the following indicators:
  • “Number of countries that have multi-hazard monitoring and forecasting systems,
  • number of people per 100,000 that are covered by early warning information through local governments or through national dissemination mechanisms,
  • percentage of local governments having a plan to act on early warnings,
  • number of countries that have accessible, understandable, usable and relevant disaster risk information and assessment available to the people at the national and local levels,
  • percentage of population exposed to or at risk from disasters protected through pre-emptive evacuation following early warning” [10].
These systems should be supported by communication mechanisms as well as monitoring systems and technologies. At the same time, the use of low-cost and simple devices should also be encouraged [10].
According to The Report of the Midterm Review of the Implementation of the Sendai Framework for Disaster Risk Reduction 2015–2030, expanding the reach of EWSs requires partnerships with media, financial institutions, and educational organisations. Additionally, it is essential to enhance the reliability of risk information and strengthen the technological infrastructure, such as meteorological stations and river sensors [11].
According to the Guide to Multi-Hazard Early Warning Systems (2023) [12], an EWS consists of four key components, which are:
  • Disaster risk knowledge;
  • Observations, monitoring, analysis, and forecasting;
  • Warning dissemination;
  • Preparedness and response capabilities.
Disaster Risk Knowledge primarily involves risk assessment and the identification of elements and their characteristics within areas threatened by crisis events. In this context, it is essential to consider the characteristics of vulnerable populations and to collect relevant data, including historical records [13]. These data should then be compiled into a unified database.
The second EWS component focuses on threat monitoring and detection. The core of this component is identifying the threats faced by different population groups. It is then necessary to implement monitoring mechanisms and technologies. For effective detection, it is also essential to define threshold values or indicators that signal an approaching threat.
The third goal of Warning Dissemination is to ensure that warning information reaches all people without exception, considering all population groups and using various communication channels.
The final EWS component is primarily concerned with vulnerable communities and population groups. Protection and preparedness plans for these groups should be developed [12].
The level of implementation of these components is described in The Report of the Midterm Review of the Implementation of the Sendai Framework for Disaster Risk Reduction (2023). The data from which the following results were extracted are also available via the Early Warning for All Dashboard [14].
Since 2015, a growing trend in EWS implementation across UN member states has been observed. While these systems are often not yet fully developed as multi-hazard early warning systems (MHEWSs), their gradual implementation is a positive step.
As of March 2024, 108 countries worldwide reported having an EWS in place, representing 55% of all countries globally. According to the report, the highest level of implementation is in the Europe and central Asia region, with 60% of countries, while the lowest is in the Americas and the Caribbean region, at only 40%, and in the African region, at 50%. This report also outlines EWS implementation results according to its core components. Among all countries that reported having an EWS, 91% had implemented the Warning Dissemination component. However, the lowest level of implementation was recorded for the Disaster Risk Knowledge component, fundamental to every aspect of EWSs, which had been established in only 58 countries (49%). The coverage of Disaster Risk Knowledge is lowest in the Americas and the Caribbean (20%) and in Africa (20%). However, Africa is the only region that reported zero countries having a comprehensive capability for this component. The Arab States have increased their reporting on this component from 9% in 2023 to 27% in 2024. The highest reporting is in the Asia–Pacific region, where over 40% of countries reported having some capability [11].
The Sendai Framework for Disaster Risk Reduction defines an EWS as “An integrated system of hazard monitoring, forecasting and prediction, disaster risk assessment, communication and preparedness activities, systems and processes that enables individuals, communities, governments, businesses and others to take timely action to reduce disaster risks in advance of hazardous events”. An MHEWS is defined as follows: “Multi-hazard early warning systems address several hazards and/or impacts of similar or different type in contexts where hazardous events may occur alone, simultaneously, cascadingly or cumulatively over time, and taking into account the potential interrelated effects” [15].
Definitions of EWSs can also be found in several scientific studies. According to Mohanty et al. (2022), “an early warning system is a climate change adaptation measure that utilises integrated communication technologies to assist communities in preparing for potentially dangerous climate-related events. A successful EWS protects lives and livelihoods, as well as land and infrastructure, and contributes to long-term sustainability. Early warning systems help to reduce economic losses and mitigate the number of injuries or deaths from a disaster, by providing information that allows individuals and communities to protect their lives and property. Early warning information empowers people to take action when a disaster closes to happening” [16].
Banzal (2022) characterises EWSs based on their technical and technological components. “Early Warning Systems (EWS) may consist of set of equipment, sensors, simulators, dissemination protocols, communication satellite and wireline and wireless terrestrial communication systems & communication links, a wide range of ICT tools, simulators, and prediction models, firmware, technical human resources and standard operating procedures and guidelines” [17].
From the perspective of EWS components, other factors, such as monitoring and warning, are equally important. This includes risk assessment and evaluating potential impacts on the population and infrastructure, which in turn highlights the need for developing crisis response plans [18].
Several authors describe EWS components in their studies, with classifications that are either identical or similar to those defined by the Sendai Framework for Disaster Risk Reduction [19,20,21].
Other studies focus on EWSs from the perspective of individual components, such as Risk Knowledge [21], or on technological solutions aimed at optimising EWSs [22,23,24]. Further research explores EWSs for specific hazards, including floods [25,26,27], wildfires [28,29], earthquakes [29], and landslides [30,31,32].

1.2. Factors Influencing the Occurrence and Effect of Natural Hazards

Natural hazard EWSs monitor, analyse, and model data on various variables influencing the occurrence and impact of natural disasters. Many complex forecasting and risk assessment models integrate multiple variables monitored through modern technologies, such as remote sensing and IoT sensors [32].
The identification of these variables and data collection represents a key element in the development of EWSs and MHEWSs. Various technical standards, indices, indicators, and scientific studies can serve as a basis for collecting information on factors affecting natural hazards.
For example, Bindzárová Gergeľová et al. (2020) [33] present variables essential for hydrodynamic modelling. While their study does not primarily focus on variables themselves, it provides a detailed description of input variables and the process of acquiring them for hydrodynamic modelling [33].
The relationship between flood causes and consequences was studied by Nabinejad and Schüttrumpf (2023) [34]. Their research highlighted the differences between floods in arid regions compared to those in humid and temperate areas. The authors described in detail the relationships between geographical, climatic, hydrological, and topographical characteristics and flood dynamics [34].
Vojtek et al. (2022) [35] examined the impact of geographical characteristics on flood occurrence and behaviour in Slovakia. Their study considered variables influencing surface runoff, including slope, curvature, maximum five-day precipitation, river density, land cover, soil texture, lithology, and flood frequency [35].
Regarding landslides, the primary monitored variables are precipitation and slope stability [31]. Wang et al. (2018) explored landslides from both natural and economic perspectives, identifying a correlation between landslides and population density and GDP growth rate [36].
For wildfires, Fangrong et al. (2024) investigated changes in wildfire patterns due to terrain and meteorological variations, specifically vegetation type, slope gradient, wind speed, and wind direction [37].
These studies represent just a fraction of the possible approaches for identifying variables influencing the occurrence and behaviour of various natural hazards.
To enhance risk knowledge within MHEWSs, it is essential to develop a comprehensive database of variables based on validated studies and to create complex forecasting and risk assessment models. Thorough identification of all relevant variables can also support the analysis and selection of suitable measurement devices for data collection in MHEWSs.

1.3. Aims and Contributions of This Article

The aim of this paper is to define and categorise EWSs and their components, with a focus on the timeline of natural disaster development and the need for information distribution based on warnings or alerts during different phases of their progression. This approach is unique, as there is currently no widely adopted similar classification, despite the fact that information requirements vary significantly at different stages of a crisis event. The proposed classification of components highlights the importance of real-time data and the targeted distribution of this information, which is crucial for the effective implementation of EWSs.
This paper identifies the primary and secondary causes of crisis events and their manifestations, which play a key role in preventing and mitigating natural hazards. Understanding these factors is essential for comprehending the dynamics of such events and is critical for the development of EWSs that can help mitigate their negative impacts. The identification of these factors also underscores the importance of implementing sensors to monitor different aspects of natural disasters, enabling the early detection of risks and the provision of relevant data for decision-making.
For the identified manifestations of natural hazards, an analysis of sensors used for measuring the respective parameters was conducted. The sensor list was compiled based on an analysis of scientific publications, with the objective of identifying 5–10 types of sensors for each natural hazard manifestation.
The main contribution of this paper lies in consolidating and aligning information on EWSs and their functionality. Rather than focusing on a specific type of natural hazard, this approach provides a general perspective on the requirements these systems should meet across all types of natural hazards. By doing so, the article reflects the universal criteria necessary for the effective operation of EWSs. The proposed classification of EWSs into three components based on the disaster timeline offers a new perspective on this issue. These components not only describe the data sources used but also address the methods of information dissemination to the public.

2. Materials and Methods

As part of this research, a definition of EWSs has been established. The definition is based on the studied materials in this article and the authors’ expertise gained through years of academic research in disaster management. Early warning systems are classified into three defined components based on the timeline of a hazard’s development and the need for information distribution. The general classification of risk components, as defined by UNDRR [9], consists of four elements. However, this model focuses on three components, prioritising the technological aspects and timeline factors crucial for effective EWSs. Each component is distinct in terms of the data collected and requires specific actions to facilitate warnings and alerts for the population. The classification into components stems from the data requirements and the types of data assessed at a given time. Additionally, the format and level of data distribution to at-risk populations are also considered. To formulate these components, we conducted a comprehensive review of relevant data and information, incorporating key factors into each component’s description. This process involved analysing:
  • Technology for data collection;
  • Timeline and probability of occurrence;
  • Information distribution requirements;
  • Relevant measures and restrictions.
The next section of this paper focuses on selected natural hazards, primarily those that are currently the most devastating in terms of economic damage and loss of life [9]. However, not all such events have been included in this study. In the case of storms and cyclones, the key associated phenomena are wind and heavy rainfall, which often lead to flooding. Additionally, cyclones align with the definition of storms [38,39]. Given these common characteristics, the same types of sensors would be used for monitoring flooding and wind-related parameters.
Based on an analysis of correlations between different natural hazards, as well as a review of their impacts and characteristics, this paper focuses only on selected natural hazards:
  • Floods;
  • Droughts;
  • Extreme temperature;
  • Wildfires;
  • Wind;
  • Landslides;
  • Earthquakes.
For the purposes of EWSs, the primary causes of selected natural hazards were identified. The criteria for primary causes were that they must be measurable by sensors and critical for the event’s occurrence (i.e., if the primary cause does not occur, the crisis event cannot take place). In addition, secondary causes were also defined. A secondary cause is one that is not essential for the crisis event to occur, but it significantly influences its intensity or extent. The criteria for measurability by sensors was applied also. The identification of primary and secondary causes and manifestations involved a thorough examination of relevant literature from the Scopus database. Sources were selected based on their focus on the specific natural hazard under consideration and their detailed description of its causes. Although a systematic approach was not employed in formulating the causes, each cause is supported by at least two independent sources. The final selection and definition of the causes were further refined through expert judgment and in-depth discussions among the authors.
From the perspective of public warnings, the manifestation of the crisis event is the most crucial aspect. These manifestations reflect the negative impacts of the natural hazards, posing threats to human life, property, and the environment. Their effects result in financial losses as well as fatalities.
The primary causes, secondary causes, and manifestations of natural hazards were categorised into groups based on the type of parameters influencing them. These groups play a key role in understanding the origins of crisis events, providing a structured approach to categorising dominant influencing factors. The methodology for forming these groups is outlined in Table 1.
However, for each natural hazard, there are numerous primary causes that influence its occurrence. Nevertheless, integrating all these factors into EWSs would be highly complex and financially demanding. These factors may include cartographic data, geological information, or other contextual variables that are difficult to measure. For this reason, the identification of primary and secondary causes in this study focused solely on critical, measurable physico-chemical parameters.
For the analysis of sensors, only scientific literature from Scopus and Web of Science database was used. Hundreds of articles were reviewed to identify five to ten sensors per parameter, thereby creating a framework for further study and summarising the types of sensors used. Targeted search strategy was employed to identify relevant literature on sensors used in EWSs. The search query “‘name of the hazard’ sensors for early warning system” was used, and results were sorted by relevance. Each article was then reviewed to extract information on sensor types. This compiled sensor database serves as a foundation for future research and complements the sensor analysis conducted in this study.
The materials used in this research included scientific studies, articles, and reports on existing EWSs and the requirements set by various global international organisations and institutions. The primary sources of relevant literature were Scopus and Web of Science, along with official reports and documents from organisations operating in the humanitarian sector, including the United Nations (UN) and legal regulations. The selected materials focus mostly on the impacts of natural disasters, with an emphasis on EWS functionality and requirements.
The proposed EWS components are based on identified gaps and needs highlighted in the review of multiple studies, taking into account the perspectives of the authors referenced in the text. The identification of primary and secondary parameters, as well as the manifestations of natural disasters, is supported by the research presented in the Section 1 and Section 4, ensuring a comprehensive approach to this issue. To support these analyses, a comparative study and categorisation of different EWS approaches was conducted, from which a proposed conceptual framework was developed.
The theoretical conclusions were further substantiated by case studies on the implementation of EWSs, where gaps and shortcomings were identified. These gaps are reflected upon and analysed throughout the article, providing a comprehensive perspective on the current state of EWSs and potential improvements.

3. Results

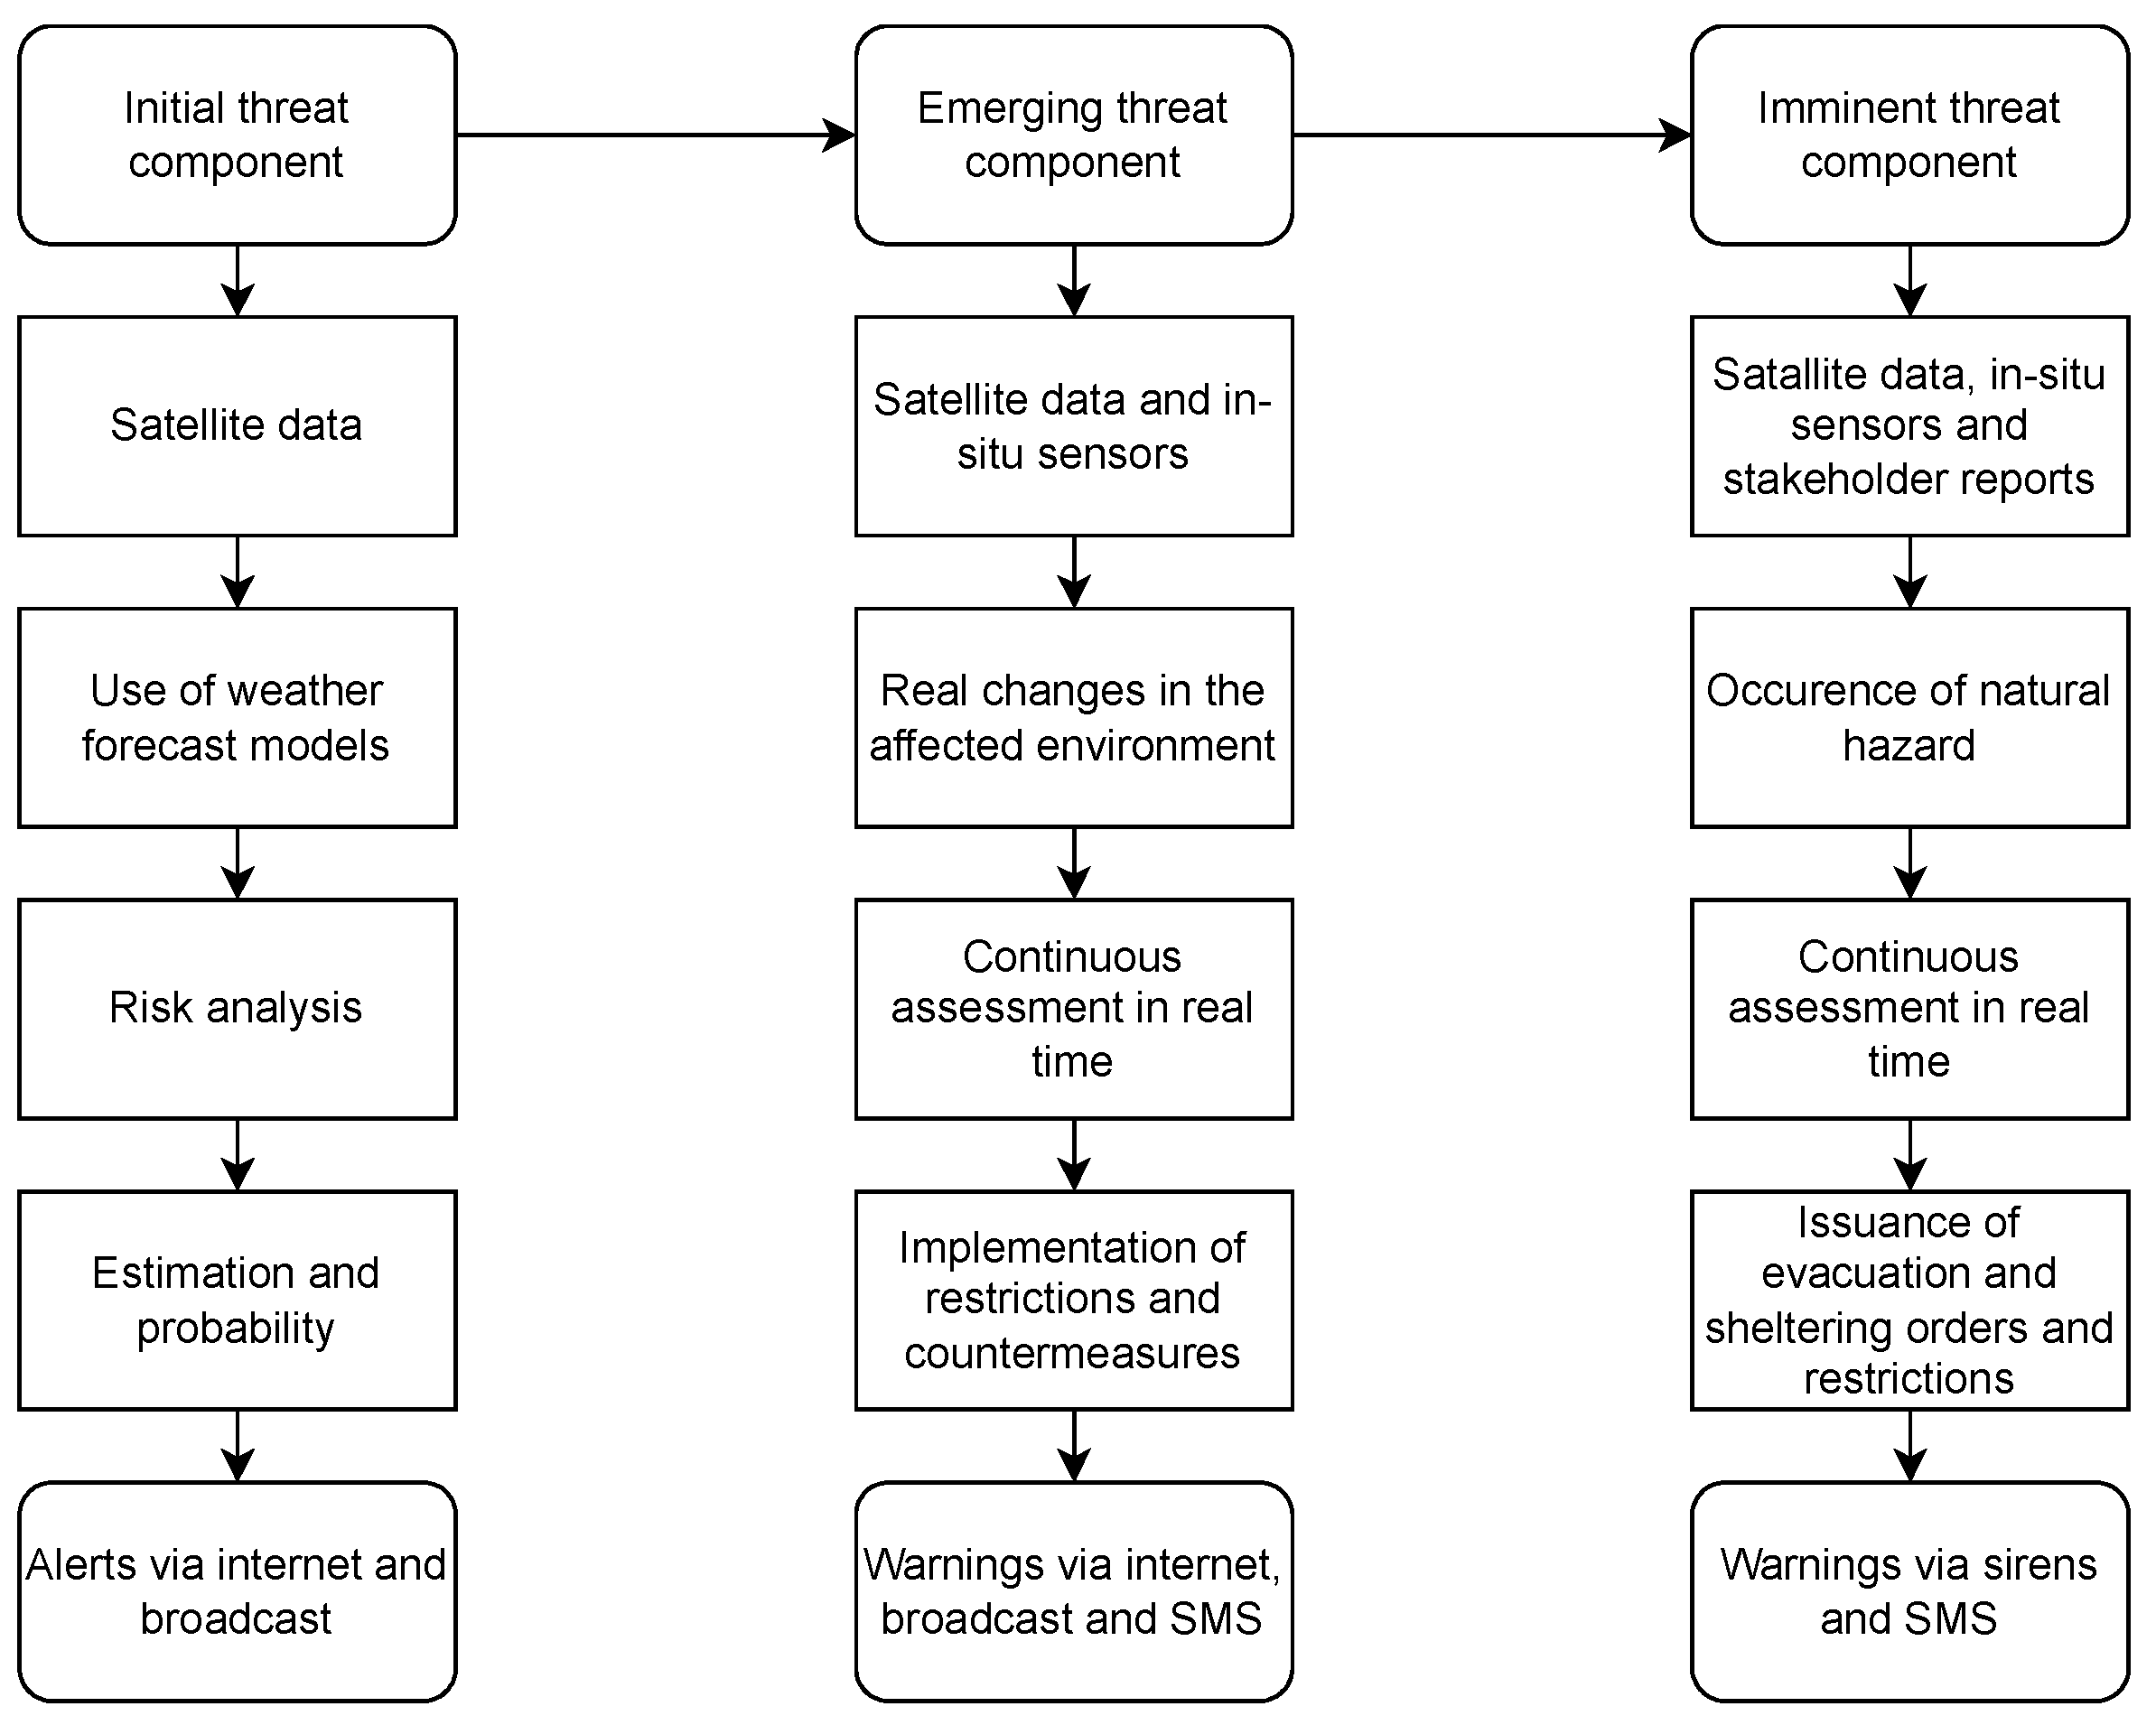
3.1. Components of Early Warning Systems

EWSs currently have a wide range of applications. They are used to warn against crisis events of various types. Since crisis management is a multidisciplinary field, such systems require knowledge from various disciplines, which should be integrated into the general crisis management framework, under which the need for EWSs also falls. As Zhou et al. [22] mentioned, EWSs rely on a wide sensor network, simulation tools, and decision-making systems. The foundation of every system lies in data collection, which is then analysed and assessed. For natural crisis events, this primarily involves physical parameters, as well as chemical ones, which influence the occurrence of natural hazard.
The infrastructure of EWSs relies on data collection using sensors or satellite technologies. The systems consist of numerous parts, and various technological devices and often people are integrated into them. An EWS could be defined as a complex system, consisting of data sources, data transmission, data storage, data assessment and evaluation, and the distribution of information about specific impending hazards through technical communication means. The basic difference between EWSs and MHEWSs is the complexity of MHEWSs, which functions for multiple natural hazards; however, the term EWS is also often used in this context.
The basic data sources for warning systems are generally sensors. However, in addition to sensors, more complex satellite technologies and satellites should be implemented. The systems should be as comprehensive as possible since their role should not only be to warn about imminent threats in real time, but they should also provide information for early warnings and alerts about the potential development of crisis events. From the perspective of the importance of threat information, EWSs and MHEWSs could be divided into three components based on the timeline in which they operate and the information they distribute:
  • Initial threat component;
  • Emerging threat component;
  • Imminent threat component.
The first component should be the initial threat component. Within this component, the system should record the initial signs of a crisis event, respectively, the potential for its occurrence, the probability of its occurrence, including the likely affected area. These are initial data, which we already acquire today and can work with effectively. These data are used in weather forecasts. This primarily involves the use of forecast models, which mainly stem from satellite images and satellites.
These satellites can quantify physical geographic phenomena associated with the movements of the earth’s surface (earthquakes, mass movements), water (floods, tsunamis, storms), and fires. These satellites contain different kinds of sensors that are used for the remote sensing of natural hazards over a number of spatial and temporal scales [41]. However, empirical data also play a very important role here, from which the most probable effects of crisis events are modelled [42].
The greatest use of these data sources lies in estimating precipitation, temperature, and wind, which reflect the key characteristics of natural crisis phenomena. They are particularly significant in predicting hurricanes, floods, droughts, extreme temperatures, strong winds, and storms. Additionally, they play a crucial role in assessing fire risk. These insights provide crisis management with initial information and the opportunity to prepare for potential crisis events. The information is primarily used in the crisis management cycle during the prevention phase [43].
On a global scale, the technological infrastructure for this already exists; however, the main reason for the lack of implementation in crisis management is not the unavailability of solutions but rather the lack of awareness among relevant stakeholders and authorised management regarding their existence or potential [44]. Meteorological entities generally have access to this information. However, a challenge may arise from limited access to these technologies and the data they generate for poorer countries that lack the financial resources for their own remote sensing technologies or are not part of larger networks that possess such data. A particular challenge lies in integrating these data into crisis management structures and extracting relevant information from meteorological systems for the needs of crisis management.
Beyond the need for crisis management, this information should also serve the general public, informing them of existing risks that could arise from certain activities, helping them plan accordingly. These insights should be distributed in the form of alerts. At this stage, distribution should occur through crisis management applications, the internet, or broadcast, while critical infrastructure entities should receive alerts via pre-established methods. Other forms of communication to the public are less meaningful at this stage, as this information should be disseminated several days before a potential threat emerge. Additionally, at such an early stage, there is still a degree of uncertainty regarding the development of the situation.
The second component should focus on the initial onset of a natural hazard. This component primarily deals with the actual impact of given influences on a specific area, rather than just the probability of occurrence, as in the first component. At this stage, there is a shift in hydrological, meteorological, or geological conditions in a given area. From a crisis management perspective, this phase involves restricting certain activities that pose a danger or preparing countermeasures. The information provided as an alert is now transited into a warning. It is recommended that warnings at this stage should be issued also via SMS to maximise public awareness of the potential danger [12,45].
Since 2018, the European Union has enforced Directive (EU) 2018/1972 of the European Parliament and of the Council of 11 December 2018 establishing the European Electronic Communications Code, which mandates that all member states implement an SMS and broadcast-based warning system for designated risk areas [46]. Such messages should include details about the emerging danger, recommendations for necessary actions, and activities that should be strictly avoided. Additionally, important businesses should be notified, particularly those that may pose a hazard or are classified as high-risk. These include critical infrastructure facilities and enterprises handling hazardous substances.
For the second component, meteorological information from satellites and data from ground-based sensors should be integrated. Real-time data should be used to continuously assess and adjust predictive models, ensuring the most accurate possible estimation of a crisis event’s development.
The third component should account for the actual occurrence of a crisis event and its impact as a direct threat. This is the moment when there is a real risk to life, health, property, or the environment—an imminent threat requiring immediate attention, emergency response, and the implementation of protective measures to mitigate its effects. In this phase, measures such as evacuation, sheltering, or restricted access to affected areas may be enacted.
The goal of the third component is to warn the public of an imminent threat with clear instructions for protection and appropriate action. At this stage, warnings and notifications should be communicated through sirens as well as SMS messages. Crisis event information should be conveyed as clearly and concisely as possible. Public messages must meet certain quality criteria—they must be truthful, timely, and comprehensive [47]. The information should precisely indicate the type of crisis event, the extent of the threat, the severity level, and the necessary actions to be taken.
EWSs must be comprehensive. All three components should be integrated into a single system within the crisis management structure, ensuring access to up-to-date and relevant information required for decision-making and response. Real-time data sources, particularly sensors and remote sensing technologies, play a crucial role. While a significant amount of data infrastructure already exists, further development is necessary—especially in establishing measuring stations equipped with sensors to monitor parameters that trigger crisis events, as well as to measure their actual manifestations. Figure 1 presents a model of an EWS based on three components.
For crisis management, receiving, analysing, and modelling these data are critical. Emphasis should be placed on a unified information system that not only displays all relevant information but also evaluates all the data using machine learning methods or artificial intelligence, with direct capabilities for issuing alerts and warnings.

3.2. The Importance of Sensors in Early Warning Systems

Sensors play a crucial role in EWSs. They collect real-time data, which are extracted into databases and can be integrated into various systems, including the Geographic Information System (GIS) [48]. They are fundamental for data collection to assess crisis events, their severity, or for developing predictive models, as well as for analysing past events and their extent. In addition to real-time data, empirical data are also valuable for evaluating the impact or severity of crisis events. Their role in EWSs within crisis management is particularly significant. Depending on their configuration, sensors detect the presence of input information and its value.
Ideally, information is automatically evaluated using machine learning or artificial intelligence, and warnings are sent to at-risk populations within seconds. This is especially crucial for earthquakes, where machine-based evaluation is essential for applying ground motion prediction equations (GMPEs) [49]. These equations enable the calculation of the anticipated affected area of an earthquake. One of the most advanced earthquake EWSs is in Japan, where sensors detect P-waves across a wide network. The system then distributes alerts to the affected population a few seconds before the arrival of stronger seismic waves. The system can also estimate the magnitude and intensity of the earthquake [50].
Sensors are also widely used in flood EWSs. There are several ways to use them effectively, but one of the most critical parameters for flood risk and EWSs is water level height. During rainfall events, river levels rise due to natural runoff from the terrain. The most common cause of flooding is a river overflowing its banks due to intense or prolonged rainfall [51].
When assessing flood risk, two key indicators are essential for predictive models and evaluating flood severity:
  • Water level height;
  • Flow velocity.
Flow velocity or water discharge helps estimate the anticipated water level height in a given section of the river. Using empirical data, it is possible to calculate both discharge and inflow from real-time data. If discharge is lower than inflow, water accumulates, leading to a rise in water levels. The water level height directly reflects the destructive nature of floods and their potential formation [52,53].
However, for early warning purposes, real-time data are the most critical. It is essential to integrate meteorological stations and sensor networks into crisis management structures and ensure their continuous evaluation [54]. By analysing a digital elevation model (DEM), it is possible to identify locations where the riverbed is shallowest and narrowest. When combined with empirical data and rating curves, these models help identify areas where river overflow is most likely. Water level sensors should be installed at these critical locations [55].
An alert should be sent to at-risk populations when:
  • The river level at a sensor site reaches a critical threshold;
  • The rate of water level increase suggests that overflow will occur in the near future.
Another key parameter is flow velocity, which provides insights into river discharge. If inflow exceeds discharge at certain points, water accumulates, increasing the risk of localised flooding.
These examples illustrate how sensors can be used to monitor crisis event formation. However, their implementation is possible for many other crisis events beyond earthquakes and floods. Selecting appropriate sensors is essential, both for monitoring the factors that trigger crisis events and for detecting the actual manifestation of those events.

3.3. Requirements for Early Warning Systems

EWSs should reflect current requirements for sustainability from the perspective of sustainable development goals [56], accuracy, integration, and complexity. Ideally, sensors and all necessary components for signal and information distribution should be powered by renewable energy sources. One possible solution is the use of solar panels or wind turbines. These renewable sources have already been applicated in many applications and have proven to be an efficient source of energy [57,58].
However, both options present certain disadvantages. Solar panels are highly dependent on direct sunlight and receive only a small amount of energy from diffuse radiation. The biggest challenge arises during prolonged cloudy weather or winter months, when only diffuse solar radiation is available for an extended period. On the other hand, the main drawback of wind turbines is the long-term absence of wind. A suitable solution could be a combination of solar panels and wind turbines with an appropriately oversized 12 V battery. The battery must be capable of ensuring the operation of all components for at least seven days.
It is common for meteorological station components, such as sensors, to be designed for 12 V batteries, eliminating the need for voltage converters. To ensure continuity and availability of information, it would also be advisable to have a backup power source from the grid where feasible and financially viable. Using renewable energy as the primary source meets sustainability requirements.
Ensuring an uninterrupted dataset is one of the key quality parameters for flood prediction. Annual peak flow records are compiled, where possible, from an uninterrupted observation period. However, the periods used to select annual peak flow records may not be the same for all hydrometric stations. According to OTN ŽP 3112-1:03, datasets of annual peak flows must be homogeneous. Homogeneity in this context means that the data must be selected from a period in which there was no significant human-induced influence on the hydrological regime, such as the construction of reservoirs, water diversions, or extensive river modifications [59].
By centralising multiple sensors in one location, a comprehensive monitoring system can be established. It is important to recognise that in addition to physical and chemical parameters, which ultimately reflect the destructive nature of a crisis event, various other phenomena contribute to the formation of natural hazards. These factors can be classified into:
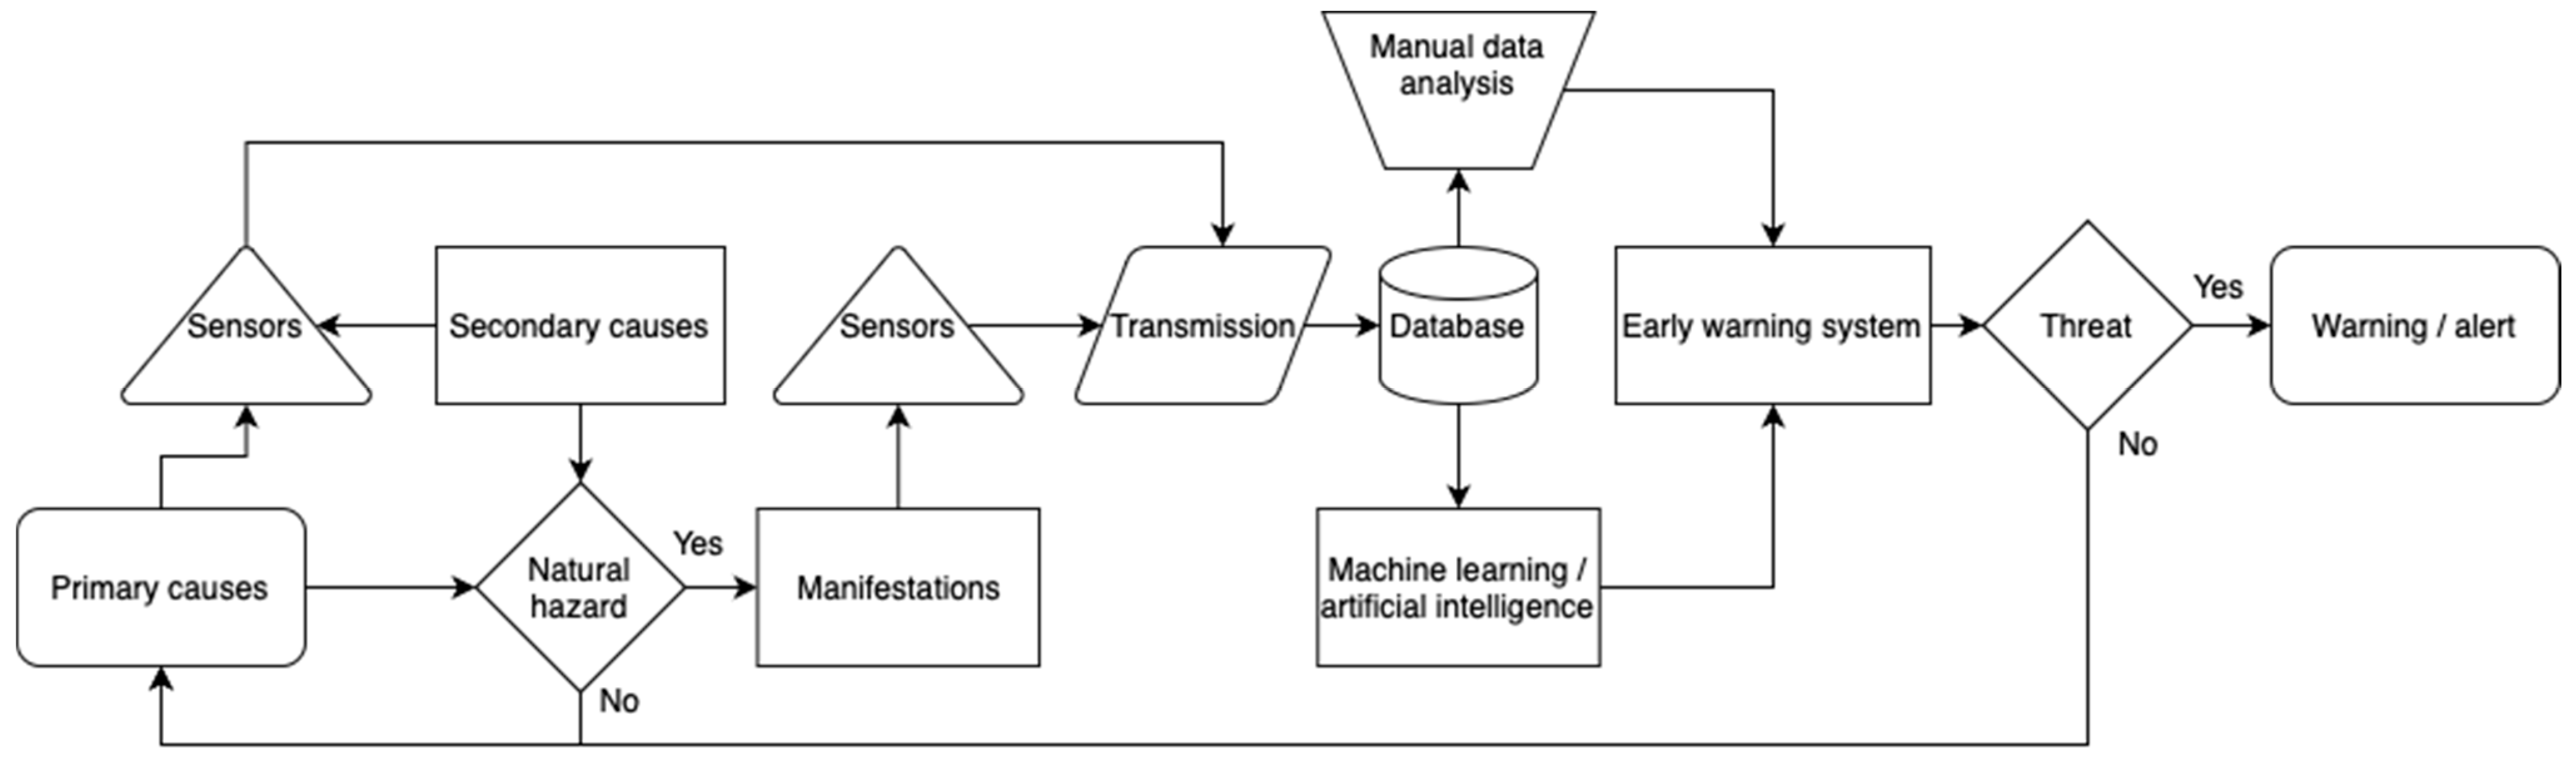
  • Primary causes, which directly trigger a crisis event;
  • Secondary causes, which influence the intensity and extent of the event.
Additionally, other factors may affect the occurrence of a given hazard, such as terrain characteristics, forest cover, sediment accumulation, or infrastructure. Some of these factors are particularly difficult to assess or monitor over time. Even if they are not identified as primary or secondary causes, they may significantly influence the final manifestation of crisis events.
Table 2 presents primary causes of natural hazards, as well as secondary factors that affect their intensity and extent. A categorisation of these causes was conducted to define the fundamental reasons behind their occurrence.
The primary causes of floods are highlighted in a significant review by Abegaz et al. [51], where it can be observed that floods are most often the result of excessive precipitation, frequently accompanied by storms or hurricanes, snowmelt, and, in coastal areas, high tides. Research by other authors confirms this assumption [52,60,61].
Secondary causes increase the intensity of floods, as they lead to soil saturation with water, reduced evapotranspiration, or high humidity affecting evaporation.
In the case of droughts, the main causes include a lack of precipitation in the affected area, high temperatures leading to increased soil drying, and excessive evapotranspiration [62,63,64]. A lack of groundwater further accelerates evapotranspiration, as does low humidity.
Wildfires, while a natural hazard, are strongly influenced by anthropogenic activity. The key causes therefore include physical parameters that significantly increase the risk of ignition. In this regard, temperature and air humidity play a crucial role [65,66,67].
For landslides, from a climatic perspective, precipitation levels have a major impact. During rainfall events, the soil becomes saturated with water, leading to a rise in groundwater levels and soil moisture. Rainfall therefore reduces embankment stability [68]. As pointed out by Zhao et al. [69], in addition to rainfall, internal dynamic factors, such as earthquakes, play a significant role. As noted by Korkmaz [70], ground shaking and ground failure lead to ground motion, which contributes to the occurrence of earthquakes.
Beyond identifying primary and secondary causes, it is also important to consider the final effect, manifestation. This effect reflects the destructive impact of various hazards, and in the development of an EWS, its monitoring is crucial. Observing these parameters plays the most important role in the response phase of the crisis management cycle. Manifestation refers to the direct impact of a natural hazard, representing its primary consequence upon occurrence. Essentially, it marks the transition of the hazard from a potential threat to an active force with measurable consequences.
Table 3 illustrates the manifestations of natural hazards, which represent the primary danger or sources of risk to the population.

3.4. Flowchart for Early Warning Systems

Based on Table 2, the primary and secondary causes influencing the occurrence of natural hazards have been identified. Table 3 further categorises the manifestations of these hazards.
When designing a comprehensive monitoring and early warning system, it is essential to consider not only the causes of these events but also their manifestations, as these are the direct sources of risk. In EWSs, sensors should be used to identify both the causes and consequences of hazards. Therefore, a data flow analysis is necessary.
The diagram follows the initial impact of primary causes, which are continuously monitored by sensors. These data are constantly transmitted to a data centre, where they are analysed. The same applies to secondary causes.
The manifestations of natural hazards represent state variables, they exist at all times, but their values fluctuate. When a hazard occurs, these values change, creating anomalies. Throughout the event, their development is monitored by sensors that collect real-time data, which are then sent to the data centre or database.
Modern EWSs often integrate automated processes, artificial intelligence, and machine learning [71,72,73]. However, human input is still used for data monitoring and analysis in many cases. If an anomaly meets the criteria for activating a warning system, the system is triggered, and an alert or warning is issued. In this case, the final step in the model is the distribution of this information to the affected population. A flowchart of such a system is illustrated in Figure 2.
However, some data remain static or are difficult to measure—primarily spatial data. This includes factors such as substrate composition, terrain slope, orientation, and land use and land cover, which should be available to crisis management teams for risk assessment [35].

3.5. Types of Sensors for Monitoring Natural Hazards

As previously mentioned, sensors play a crucial role in data collection and monitoring of key variables in EWSs. Their ability to provide real-time data is essential for the timely detection and assessment of potential natural hazards, enabling authorities to take proactive measures to mitigate risks and minimise damage.
Based on Table 3, which identifies the manifestations of natural hazards, an in-depth sensor analysis has been conducted to determine the types of sensors commonly used for data collection on each specific parameter.
By evaluating the most effective sensor technologies for different hazard types, it is possible to enhance the efficiency and reliability of EWSs, ensuring that critical information is available for decision-makers in disaster management and emergency response. Types of sensors for different manifestations of natural hazards is presented in Table 4.

4. Discussion

One of the most important activities in preventing the impacts of crisis events is the collection and evaluation of monitored data, as well as the reception and assessment of information on the occurrence of such events. Additionally, the operation of warning and notification systems plays a crucial role in crisis management [47].
The primary contribution of this paper is the harmonisation and consolidation of information regarding EWSs and their functionality. Rather than focusing on a single specific natural hazard, this study examines the functionality and requirements of EWSs from a general perspective, thus reflecting the fundamental criteria that such systems should meet for all natural hazards. A comprehensive analysis of sensors used to monitor the manifestations of natural hazards is crucial for advancing EWSs and disaster preparedness. Despite their critical role in hazard detection, there is a notable lack of comparative studies evaluating the effectiveness and suitability of different sensor types. Addressing this gap could enhance risk assessment, improve response strategies, and ultimately save lives.
This paper introduces a new classification of EWSs, dividing them into three components based on a timeline. These components not only describe the sources of data used but also the methods of information dissemination to the public. However, as Kelman and Glantz (2014) have outlined, differing views exist on how extensive EWS information should be. If it should provide only basic information or ensure that this information reaches all target audiences, it must be correctly understood and appropriately and promptly responded to [133].
Additionally, this paper defines EWSs while addressing the challenges associated with their individual elements. The definition encompasses the requirements imposed on EWSs. A prerequisite for effective warning systems is the integration of the subsystems of detection of extreme events, management of important information, and public response, and to also maintain relationships between them through preparedness [134].
The proposed structure into three components aligns with the classification of EWSs into upstream and downstream components. The upstream incorporates the system’s tools and procedures for the creation of the early warning message by a monitoring or operational centre, while the downstream is dedicated to the dissemination of the early warning message [135].
Furthermore, this paper identifies and summarises the primary and secondary measurable causes of selected natural hazards, highlighting the parameters that should be monitored using available technologies. It also defines the manifestations of these natural hazards, emphasising their destructive impact. This parameter is of greatest importance in an EWS, as its occurrence signifies an immediate threat to human lives, property, and the environment. Our understanding remains limited, and further research is necessary. Identifying causes helps in developing mitigation strategies, potentially saving millions of lives and reducing economic losses [136].
The development and advancement of EWSs are integral to this concept. Hanz and Roewekamp (2018) have also analysed the causes and consequences of natural hazards, confirming that the assessment of natural hazards is crucial as it identifies potential causes and their manifestations, enabling systematic screening of hazard combinations. This understanding helps mitigate risks and ensures the safe operation of critical infrastructures against various natural phenomena [137].
However, natural hazards often exhibit a cascading effect, where the manifestation of one event can trigger another. Gill and Malamoud (2014) [138] noted that geophysical and hydrological hazards are receptors that can be triggered by most of the other types of hazards, while geophysical and atmospheric causes are the most common triggers. The results of such studies contribute to a broader understanding of complex interactions, which could be integrated into EWSs and rapid response tools. However, their research focused on classifying 21 types of natural hazards [138].
Since the entire monitoring and early warning system relies on data collection through sensors, a flowchart illustrating the application of sensors in EWSs is presented. The diagram clearly depicts the critical areas in data acquisition and the subsequent data flow leading to warnings or alerts sent to affected businesses, entities, or residents. The purpose of this diagram is to visually highlight the essential elements of the system and to highlight the importance of addressing this topic.
The development and implementation of EWSs face numerous challenges, primarily due to the complexity of these systems and their components. While significant emphasis is placed on comprehensive and technologically advanced systems, there is also a growing role for low-cost alternatives. These simplified systems are particularly useful in remote communities and less developed countries. The use of basic EWSs with SMS notifications has proven to be effective in reducing damages [139]. Such low-cost micro-electromechanical systems have been developed in Taiwan for on-site earthquake warnings [140], in the Himalayan region for landslides [141], and in Pakistan for flood early warning systems [142]. What these solutions have in common is the use of simple technologies, which are significantly cheaper, even if they are not as precise. However, they can effectively detect and assess environmental changes. The implementation of such systems is particularly meaningful in remote communities and developing countries, where resources for more advanced systems are limited. Further research is needed to analyse the advantages and disadvantages of these systems, providing a deeper insight into their benefits and potential applications.

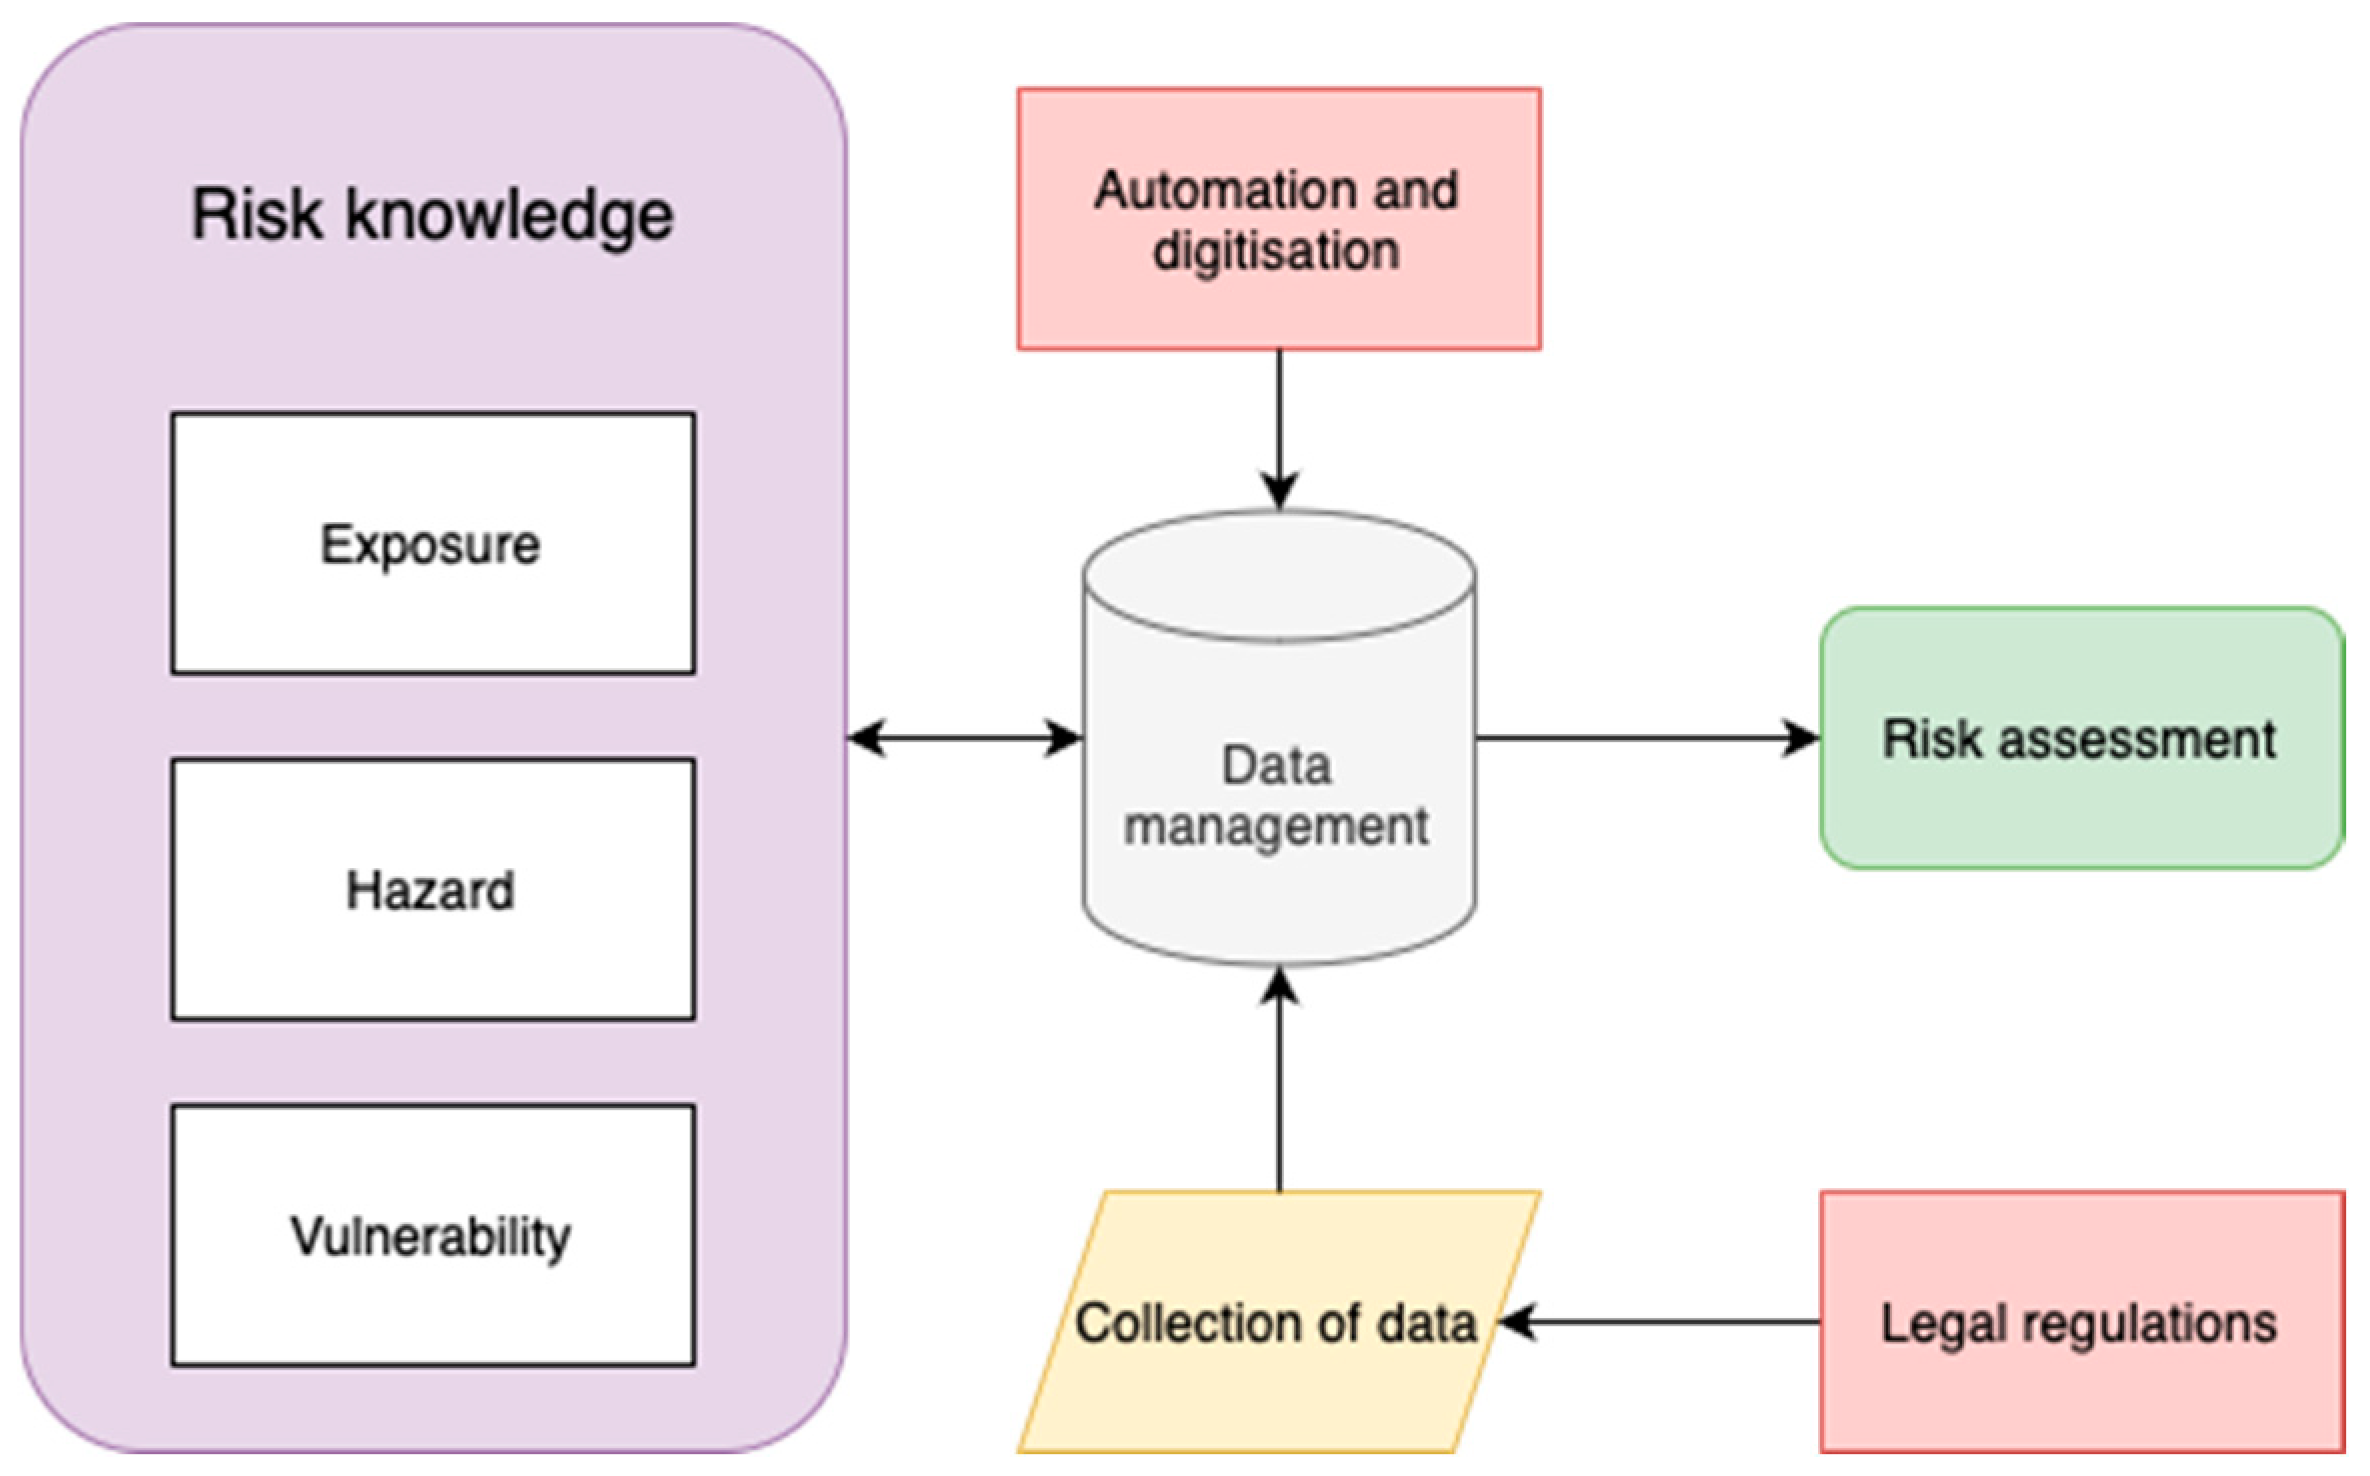
Data Management and Data Quality

Risk knowledge plays a key role in EWSs. According to the IPCC [143], risk is “the potential for adverse consequences for human or ecological systems, recognizing the diversity of values and objectives associated with such systems”.
Hazard, vulnerability, and exposure are the primary components of risk, and their relevance is constantly evolving. A major challenge remains the collection of relevant data on these elements, as well as ensuring access for decision-making authorities [9]. Figure 3 illustrates a framework for data-driven risk assessment.
In this context, data management becomes crucial. It is one of the recommendations in the National Disaster Risk Assessment document. Risk assessment is a process heavily dependent on the availability and quality of data. Experts recommend the creation of a common data repository to facilitate regular updates and risk assessments. The best way to ensure data availability, based on experience, is through legal regulations. Therefore, in-depth analyses and gap assessments should be conducted between available and required data [144].
As mentioned earlier, automation and digitisation of data are necessary. Data from satellite imagery and sensors can be used for developing vulnerability maps to plan how to prevent certain hazards or to predict damages. It is necessary to count with data and assess the capacities in place to monitor risks, as part of EWSs. Machine learning and artificial intelligence has a huge potential to classify and evaluate information from ongoing events [135]. Through sophisticated pattern recognition applied to vast datasets, AI can more accurately predict natural hazard occurrences, including time, location, and scale. This enhanced prediction enables faster and more effective early warning systems, bolstered by the integration of varied data from sources such as sensors and satellites [145].
Despite improvements in the availability of meteorological and hydrological data, gaps remain in exposure, vulnerability, and past crisis event data. Such data are typically available at regional or national levels; however, for MHEWSs and risk assessment, data from the local or community level are essential. The Global Status of Multi-Hazard Early Warning Systems 2024 outlines key areas and recommendations for data management and risk knowledge:
  • Centralisation of data;
  • Data integrability;
  • Focus on local-level data;
  • Data accessibility for decision-makers;
  • Ensuring data quality;
  • Focus on data security [9].
An important step towards effective data management is the establishment of a national data governance framework and the development of operational procedures to ensure data reusability and accessibility. Investments in data infrastructure and the design of interoperable systems are also crucial. These efforts should aim to improve field data collection and streamline online reporting, ultimately enhancing efficiency and accuracy in disaster response [11].
The loss data sector and its information systems and database architecture have been studied by Faiella et al. (2022) [146].
In terms of information communication, it is essential to prevent errors. In EWS communication processes, errors can occur at any stage, whether due to the sender, receiver, or transmission process. The sender may misinterpret the situation, misidentify data, or incomplete information may be sent under stress. Transmission errors may result from technical failures, network issues, or other unforeseen circumstances. The receiver might misunderstand the message or alter it based on assumptions. Such errors can lead to incomplete or incorrect decisions, resulting in further damages and losses [47]. The use of artificial intelligence and machine learning in these systems can significantly reduce errors, particularly if algorithms for data evaluation are properly configured.
This paper identified in Table 4 various types of sensors that can be universally applied. Some types are used more frequently than others. Since it was not possible to comprehensively assess all types of sensors, ten types were selected for each manifestation of a natural crisis event based on the studied literature. As the number of publications on sensors runs into the thousands, it was not possible to set precise conditions for a systematic analysis. Nevertheless, such a summary of sensor types is useful, as it highlights the need for in-depth analyses and comparisons of individual sensor types. Some sensor types are used more frequently than others for various reasons. For example, resistance temperature detectors (RTDs), thermocouples, and thermistors are the most common types of temperature sensors [104]. Despite efforts to find more comprehensive reviews, it was found that most are limited to only 2–3 types of sensors and do not provide a more thorough comparison. Another limitation was the definitions of sensor types by different authors. Within optical temperature sensors, there is another division into a greater number of types, based on the material used or technological differences. In the case of fires, the sensors for air quality must focus directly on the chemicals that may be present in the air. These include, for example, carbon monoxide, nitrogen dioxide, and other hydrocarbons [110]. In the case of earthquakes, the majority of sensors used are micro-electromechanical system (MEMS)-based sensors [147]. Other types of sensors were rarely found, which is why their number is significantly lower compared to others. These are just examples of specifics, of which there is an indeterminable number. However, such a grouping of sensor types, focusing on several parameters, is quite unique, and no similar grouping was found.
The researched area requires further attention, particularly regarding the integration of modern sensors into EWSs. Climate change and the increasing occurrence of extreme weather events have amplified both the intensity and frequency of natural hazards. As a result, studying natural hazards and disaster risks is crucial for protecting livelihoods and economic stability. Effective forecasting and EWSs rely on precise hazard-related data, with forecasting accuracy improving through the integration of multiple models. Additionally, advanced numerical weather prediction technologies, such as the Weather Research and Forecasting (WRF) model, have been developed based on a deep understanding of atmospheric dynamics. However, challenges remain in accurately simulating and predicting hazard and disaster evolution under varying meteorological and complex terrain conditions. Therefore, enhancing our understanding of natural hazard processes is essential for improving EWSs, which play a vital role in saving lives [148]. The use and necessity of implementing EWSs are also part of the smart cities concept, where the focus is on ensuring the safety of residents [149].

5. Conclusions

This paper highlights the importance of EWSs in mitigating the impact of natural hazards by facilitating timely and effective responses. By classifying EWSs into three components, this paper provides a structured framework that enhances their capabilities and clarifies their requirements. The research underscores the importance of integrating real-time data from sensors, remote sensing technologies, and predictive models to ensure accurate and timely hazard detection.
A key contribution of this study is the identification of primary and secondary causes of various natural hazards, along with an analysis of the manifestations that should be monitored and assessed. The results emphasise the necessity of a comprehensive approach to EWS development, ensuring that information reaches relevant stakeholders and the general public in a timely and actionable manner. Moreover, the study demonstrates the potential and importance of advanced technologies, such as artificial intelligence and machine learning, to improve risk assessment and automate information dissemination.
Despite the growing implementation of EWSs worldwide, challenges remain, particularly in ensuring accessibility, data reliability, and integration into crisis management structures. Furthermore, the development of low-cost EWSs should be prioritised for regions with limited resources, ensuring broader coverage and resilience against disasters.
Future research should focus on optimising sensor networks, improving predictive models, and developing low-cost yet advanced EWSs. As climate change intensifies the frequency and severity of natural hazards, strengthening and expanding EWSs remains an urgent priority for disaster risk reduction and resilience building.

Author Contributions

Conceptualisation, D.C., J.R., J.K. and M.P.; methodology: J.R., D.C., J.K. and B.H.; validation: D.C., B.K. and B.H.; formal analysis: D.C., B.K. and B.H.; investigation and resources: D.C., B.K. and B.H.; writing the original manuscript draft preparation: J.R., D.C., J.K. and M.P.; writing—review and editing: J.R., D.C. and M.P.; visualisation: D.C., B.K. and B.H.; supervision: J.R., J.K. and M.P.; project administration and funding acquisition: J.R., B.K. and J.K. All authors have read and agreed to the published version of the manuscript.

Funding

Funded by the EU NextGenerationEU through the Recovery and Resilience Plan for Slovakia under the project No. 17R05-04-V01-00005, and funded by the EU NextGenerationEU through the Recovery and Resilience Plan for Slovakia under the project No. 09I03-03-V05-00002.

Institutional Review Board Statement

Not applicable.

Informed Consent Statement

Not applicable.

Data Availability Statement

The data presented in this study are available in the article.

Acknowledgments

This article is the result of continuous scientific and research activities of several years of the authors, who are active in the positions of lecturers and research workers at the Department of Crisis Management, Faculty of Security Engineering of the University of Žilina in Žilina, Slovakia. Scientific and research activities of the faculty are focused on solving the theoretical basis of Crisis Management and Security and Safety Sciences. A significant factor of recognition of scientific professionalism of the faculty staff is also their cooperation for many years with the bodies of state administration and self-government in the section of crisis management. The views expressed, however, are solely those of the authors and not necessarily those of the institutions with which they are affiliated or of their funding sources. Also, the authors are solely responsible for any errors or omissions.

Conflicts of Interest

The authors declare no conflicts of interest.

References

  1. Sulik, S. Convective Environment and Development of a Tornadic Supercell in the Czech Republic on 24 June 2021. Meteorol. Hydrol. Water Manage. 2022, 10, 60–72. [Google Scholar] [CrossRef]
  2. 2023 Turkey-Syria Earthquake. Available online: https://disasterphilanthropy.org/disasters/2023-turkey-syria-earthquake/ (accessed on 17 January 2025).
  3. Titko, M.; Ristvej, J.; Zamiar, Z. Population Preparedness for Disasters and Extreme Weather Events as a Predictor of Building a Resilient Society: The Slovak Republic. Int. J. Environ. Res. Public Health 2021, 18, 2311. [Google Scholar] [CrossRef] [PubMed]
  4. Bezak, N.; Panagos, P.; Liakos, L.; Mikoš, M. Brief Communication: A First Hydrological Investigation of Extreme August 2023 Floods in Slovenia, Europe. Nat. Hazards Earth Syst. Sci. 2023, 23, 3885–3893. [Google Scholar] [CrossRef]
  5. Germany Floods|JBA Risk Management Event Response. Available online: https://www.jbarisk.com/knowledge-hub/event-response/germany-floods-may-june-2024/ (accessed on 17 January 2025).
  6. Czech Republic: Floods—DREF Operation MDRCZ003—Czechia|ReliefWeb. Available online: https://reliefweb.int/report/czechia/czech-republic-floods-dref-operation-mdrcz003 (accessed on 17 January 2025).
  7. The Copernicus Emergency Management Service Monitors the Floods in Valencia, Spain|Copernicus. Available online: https://www.copernicus.eu/en/media/image-day-gallery/copernicus-emergency-management-service-monitors-floods-valencia-spain (accessed on 17 January 2025).
  8. Grünig, M.; Seidl, R.; Senf, C. Increasing Aridity Causes Larger and More Severe Forest Fires across Europe. Glob. Change Biol. 2023, 29, 1648–1659. [Google Scholar] [CrossRef]
  9. World Meteorological Organization (WMO); UN Office for Disaster Risk Reduction (UNDRR). Global Status of Multi-Hazard Early Warning Systems 2024. Available online: https://library.wmo.int/records/item/69085-global-status-of-multi-hazard-early-warning-systems-2024 (accessed on 7 January 2025).
  10. Sendai Framework for Disaster Risk Reduction 2015–2030. Available online: https://sdgs.un.org/sites/default/files/publications/2157sendaiframeworkfordrren.pdf (accessed on 21 January 2025).
  11. The Report of the Midterm Review of the Implementation of the Sendai Framework for Disaster Risk Reduction 2015–2030|UNDRR. Available online: https://www.undrr.org/publication/report-midterm-review-implementation-sendai-framework-disaster-risk-reduction-2015-2030 (accessed on 20 January 2025).
  12. Words into Action Guidelines: Multi-Hazard Early Warning Systems|UNDRR. Available online: https://www.undrr.org/words-into-action/guide-multi-hazard-early-warning (accessed on 20 January 2025).
  13. Luino, F.; Barriendos, M.; Gizzi, F.T.; Glaser, R.; Gruetzner, C.; Palmieri, W.; Porfido, S.; Sangster, H.; Turconi, L. Historical Data for Natural Hazard Risk Mitigation and Land Use Planning. Land 2023, 12, 1777. [Google Scholar] [CrossRef]
  14. Early Warnings for All Dashboard. Available online: https://earlywarningsforall.org/site/early-warnings-all/early-warnings-all-dashboard (accessed on 20 January 2025).
  15. Definition: Early Warning System|UNDRR. Available online: https://www.undrr.org/terminology/early-warning-system (accessed on 29 January 2025).
  16. Mohanty, A.; Dubey, A.; Singh, R.B. The Application of Early Warning System in India. In Cyclonic Disasters and Resilience: An Empirical Study on South Asian Coastal Regions; Mohanty, A., Dubey, A., Singh, R.B., Eds.; Springer Nature: Singapore, 2022; pp. 65–102. ISBN 978-981-19121-5-3. [Google Scholar]
  17. Banzal, P. Disaster Early Warning Communication Systems. In Hydro-Meteorological Extremes and Disasters; Goyal, M.K., Gupta, A.K., Gupta, A., Eds.; Springer Nature: Singapore, 2022; pp. 87–102. ISBN 978-981-19072-5-8. [Google Scholar]
  18. Zarocostas, J. Early Warning Systems for Disasters Key for Health. Lancet 2022, 400, 1396. [Google Scholar] [CrossRef]
  19. Meninno, S.; Giambelli, M.; Deda, M.; Masi, R.; Gioia, A.; Ponte, E.; Massabò, M.; Morando, M.; Vio, R.; Paniccia, C.; et al. Establishing Effective Links between Early Warnings and Early Action: General Criteria for Floods. In Proceedings of the European Geosciences Union General Assembly 2024 (EGU24), Vienna, Austria, 14–19 April 2024. Copernicus Meetings. [Google Scholar]
  20. Oktari, R.S.; Munadi, K.; Ridha, M. Effectiveness of Dissemination and Communication Element of Tsunami Early Warning System in Aceh. Procedia Econ. Financ. 2014, 18, 136–142. [Google Scholar] [CrossRef]
  21. Hermans, T.D.G.; Šakić Trogrlić, R.; van den Homberg, M.J.C.; Bailon, H.; Sarku, R.; Mosurska, A. Exploring the Integration of Local and Scientific Knowledge in Early Warning Systems for Disaster Risk Reduction: A Review. Nat. Hazards 2022, 114, 1125–1152. [Google Scholar] [CrossRef]
  22. Zhou, H.; Taal, A.; Koulouzis, S.; Wang, J.; Hu, Y.; Suciu, G.; Poenaru, V.; de Laat, C.; Zhao, Z. Dynamic Real-Time Infrastructure Planning and Deployment for Disaster Early Warning Systems. In Proceedings of the Computational Science—ICCS 2018, Wuxi, China, 11–13 June 2018; Shi, Y., Fu, H., Tian, Y., Krzhizhanovskaya, V.V., Lees, M.H., Dongarra, J., Sloot, P.M.A., Eds.; Springer International Publishing: Cham, Switzerland, 2018; pp. 644–654. [Google Scholar]
  23. Uchida, N.; Ishida, T.; Yuze, H.; Shibata, Y. Early Weather Warning System with Real-Time Monitoring by IoT Sensors Considering Scalability and Reliability. In Proceedings of the Mobile Internet Security, Okinawa, Japan, 19–21 December 2023; You, I., Choraś, M., Shin, S., Kim, H., Astillo, P.V., Eds.; Springer Nature: Singapore, 2024; pp. 220–230. [Google Scholar]
  24. Hammood, W.A.; Abdullah Arshah, R.; Mohamad Asmara, S.; Al Halbusi, H.; Hammood, O.A.; Al Abri, S. A Systematic Review on Flood Early Warning and Response System (FEWRS): A Deep Review and Analysis. Sustainability 2021, 13, 440. [Google Scholar] [CrossRef]
  25. Henao Salgado, M.J.; Zambrano Nájera, J. Assessing Flood Early Warning Systems for Flash Floods. Front. Clim. 2022, 4, 787042. [Google Scholar] [CrossRef]
  26. Zang, Y.; Meng, Y.; Guan, X.; Lv, H.; Yan, D. Study on Urban Flood Early Warning System Considering Flood Loss. Int. J. Disaster Risk Reduct. 2022, 77, 103042. [Google Scholar] [CrossRef]
  27. Shang, D.; Zhang, F.; Yuan, D.; Hong, L.; Zheng, H.; Yang, F. Deep Learning-Based Forest Fire Risk Research on Monitoring and Early Warning Algorithms. Fire 2024, 7, 151. [Google Scholar] [CrossRef]
  28. Kotroni, V.; Cartalis, C.; Michaelides, S.; Stoyanova, J.; Tymvios, F.; Bezes, A.; Christoudias, T.; Dafis, S.; Giannakopoulos, C.; Giannaros, T.M.; et al. DISARM Early Warning System for Wildfires in the Eastern Mediterranean. Sustainability 2020, 12, 6670. [Google Scholar] [CrossRef]
  29. Kumar, R.; Mittal, H.; Sandeep; Sharma, B. Earthquake Genesis and Earthquake Early Warning Systems: Challenges and a Way Forward. Surv. Geophys. 2022, 43, 1143–1168. [Google Scholar] [CrossRef]
  30. Barla, M.; Antolini, F. An Integrated Methodology for Landslides’ Early Warning Systems. Landslides 2016, 13, 215–228. [Google Scholar] [CrossRef]
  31. Guzzetti, F.; Gariano, S.L.; Peruccacci, S.; Brunetti, M.T.; Marchesini, I.; Rossi, M.; Melillo, M. Geographical Landslide Early Warning Systems. Earth-Sci. Rev. 2020, 200, 102973. [Google Scholar] [CrossRef]
  32. Kollar, B.; Haluskova, B.; Novakova, K.; Ristvej, J. Modern Technologies in the Field of Hydrology to Prevent Crisis Phenomena and Extraordinary Events. In Proceedings of the International Multidisciplinary Scientific GeoConference: SGEM 23, Albena, Bulgaria, 3–9 July 2023; pp. 171–178. [Google Scholar]
  33. Bindzárová Gergeľová, M.; Kuzevičová, Ž.; Labant, S.; Gašinec, J.; Kuzevič, Š.; Unucka, J.; Liptai, P. Evaluation of Selected Sub-Elements of Spatial Data Quality on 3D Flood Event Modeling: Case Study of Prešov City, Slovakia. Appl. Sci. 2020, 10, 820. [Google Scholar] [CrossRef]
  34. Nabinejad, S.; Schüttrumpf, H. Flood Risk Management in Arid and Semi-Arid Areas: A Comprehensive Review of Challenges, Needs, and Opportunities. Water 2023, 15, 3113. [Google Scholar] [CrossRef]
  35. Vojtek, M.; Janizadeh, S.; Vojteková, J. Riverine Flood Potential Assessment at Municipal Level in Slovakia. J. Hydrol. Reg. Stud. 2022, 42, 101170. [Google Scholar] [CrossRef]
  36. Wang, Y.; Lin, Q.; Shi, P. Spatial Pattern and Influencing Factors of Landslide Casualty Events. J. Geogr. Sci. 2018, 28, 259–274. [Google Scholar] [CrossRef]
  37. Fangrong, Z.; Yuning, G.; Guochao, Q.; Yi, M.; Guofang, W. Multi-Factor Coupled Forest Fire Model Based on Cellular Automata. J. Saf. Sci. Resil. 2024, 5, 413–421. [Google Scholar] [CrossRef]
  38. Vyazilova, N.A.; Vyazilova, A.E. Storm Cyclones in the North Atlantic. Russ. Meteorol. Hydrol. 2014, 39, 371–377. [Google Scholar] [CrossRef]
  39. Feser, F. Constructing Records of Storminess. In Oxford Research Encyclopedia of Climate Science; Oxford University Press: Oxford, UK, 2018; ISBN 978-0-19-022862-0. [Google Scholar]
  40. Below, R.; Wirtz, A.; Guha-Sapir, D. Disaster Category Classification and Peril Terminology for Operational Purposes; Centre for Research on the Epidemiology of Disasters (CRED), University of Louvain (UCLouvain): Brussels, Belgium, 2009. [Google Scholar]
  41. Gillespie, T.W.; Chu, J.; Frankenberg, E.; Thomas, D. Assessment and Prediction of Natural Hazards from Satellite Imagery. Prog. Phys. Geogr. Earth Environ. 2007, 31, 459–470. [Google Scholar] [CrossRef] [PubMed]
  42. Hubig, N.; Fengler, P.; Züfle, A.; Yang, R.; Günnemann, S. Detection and Prediction of Natural Hazards Using Large-Scale Environmental Data. In Proceedings of the Advances in Spatial and Temporal Databases: 15th International Symposium, SSTD 2017, Arlington, VA, USA, 21–23 August 2017; Gertz, M., Renz, M., Zhou, X., Hoel, E., Ku, W.-S., Voisard, A., Zhang, C., Chen, H., Tang, L., Huang, Y., et al., Eds.; Springer International Publishing: Cham, Switzerland, 2017; pp. 300–316. [Google Scholar]
  43. Význam Posudzovania Rizík v Rámci Cyklu Krízového Riadenia—ProQuest. Available online: https://www.proquest.com/docview/3115153973/fulltextPDF/98A1F9C955EC47FCPQ/1?accountid=49401&sourcetype=Scholarly%20Journals (accessed on 29 January 2025).
  44. Ristvej, J.; Sokolová, L.; Starackova, J.; Ondrejka, R.; Lacinak, M. Experiences with Implementation of Information Systems within Preparation to Deal with Crisis Situations in Terms of Crisis Management and Building Resilience in the Slovak Republic. In Proceedings of the 2017 International Carnahan Conference on Security Technology (ICCST), Madrid, Spain, 23–26 October 2017; pp. 1–6. [Google Scholar]
  45. Goniewicz, K.; Burkle, F.M. Disaster Early Warning Systems: The Potential Role and Limitations of Emerging Text and Data Messaging Mitigation Capabilities. Disaster Med. Public Health Prep. 2019, 13, 709–712. [Google Scholar] [CrossRef]
  46. Directive (EU) 2018/1972 of the European Parliament and of the Council of 11 December 2018 Establishing the European Electronic Communications Code (Recast) (Text with EEA Relevance). Off. J. Eur. Union L 2018, 321, 36–214.
  47. Šimák, L. Krízový Manažment vo Verejnej Správe, 2nd ed.; Žilinská Univerzita v Žiline: Žilina, Slovakia, 2015; ISBN 978-80-554-1165-1. [Google Scholar]
  48. Chovanec, D.; Kollár, B.; Ristvej, J. Use of Information to Support Application Software and Simulations in Crisis Management. In Proceedings of the 38th Annual European Simulation and Modelling Conference, ESM 2024, San Sebastian, Spain, 23–25 October 2024; pp. 175–179. [Google Scholar]
  49. Nakanishi, R.; Takemura, S. Development of an Offshore Ground Motion Prediction Equation for Peak Ground Acceleration Considering Path Effects Based on S-Net Data. Earth Planets Space 2024, 76, 146. [Google Scholar] [CrossRef]
  50. Fujinawa, Y.; Noda, Y. Japan’s Earthquake Early Warning System on 11 March 2011: Performance, Shortcomings, and Changes. Earthq. Spectra 2013, 29, S341–S368. [Google Scholar] [CrossRef]
  51. Abegaz, R.; Wang, F.; Xu, J. History, Causes, and Trend of Floods in the U.S.: A Review. Nat. Hazards 2024, 120, 13715–13755. [Google Scholar] [CrossRef]
  52. Sholihah, Q.; Kuncoro, W.; Wahyuni, S.; Puni Suwandi, S.; Dwi Feditasari, E. The Analysis of the Causes of Flood Disasters and Their Impacts in the Perspective of Environmental Law. IOP Conf. Ser. Earth Environ. Sci. 2020, 437, 012056. [Google Scholar] [CrossRef]
  53. Almikaeel, W.; Šoltész, A.; Čubanová, L.; Baroková, D. Hydro-Informer: A Deep Learning Model for Accurate Water Level and Flood Predictions. Nat. Hazards 2024. [Google Scholar] [CrossRef]
  54. UNDP. Early Warning Systems for Natural Disasters. United Nations Development Programme (UNDP). 2021. Available online: https://www.adaptation-undp.org/sites/default/files/resources/undp_brochure_early_warning_systems.pdf (accessed on 29 January 2025).
  55. Sampson, C.C.; Smith, D.R.; Kumar, R.; Schwartz, J.S.; Haider, Z.; Kalin, L.; Bae, J.; Gagne, D. Implications of Using Global Digital Elevation Models for Flood Risk Assessment: A Case Study in the United States. Water Resour. Res. 2020, 56, e2020WR028241. [Google Scholar] [CrossRef]
  56. United Nations. Transforming Our World: The 2030 Agenda for Sustainable Development; United Nations General Assembly: New York, NY, USA, 2015; A/RES/70/1; Available online: https://docs.un.org/en/A/RES/70/1 (accessed on 6 March 2025).
  57. Horng, G.-J.; Chang, T.-Y. The Adaptive Node-Selection Mechanism Scheme in Solar-Powered Wireless Sensor Networks. In Proceedings of the 2014 International Conference on Intelligent Green Building and Smart Grid (IGBSG), Taipei, Taiwan, 23–25 April 2014; pp. 1–4. [Google Scholar]
  58. Singh, M.G.; Rithigaa, S.; Raj, D. Sharmila Forest Fire Detection and Prevention System Using IoT. In Proceedings of the Proceedings of 3rd International Conference on Machine Learning, Advances in Computing, Renewable Energy and Communication, Ghaziabad, India, 10–11 December 2021; Tomar, A., Malik, H., Kumar, P., Iqbal, A., Eds.; Springer Nature: Singapore, 2022; pp. 453–460. [Google Scholar]
  59. OTN ŽP 3112-1:03; Kvantita povrchových a podzemných vôd. The Ministry of the Environment of the Slovak Republic: Bratislava, Slovakia, 2003.
  60. Changnon, S.A.; Kunkel, K.E.; Andsager, K. Causes for Record High Flood Losses in the Central United States. Water Int. 2001, 26, 223–230. [Google Scholar] [CrossRef]
  61. Chang, H.; Franczyk, J. Climate Change, Land-Use Change, and Floods: Toward an Integrated Assessment. Geogr. Compass 2008, 2, 1549–1579. [Google Scholar] [CrossRef]
  62. Shi, B.; Zhu, X.; Hu, Y.; Yang, Y. Drought Characteristics of Henan Province in 1961-2013 Based on Standardized Precipitation Evapotranspiration Index. J. Geogr. Sci. 2017, 27, 311–325. [Google Scholar] [CrossRef]
  63. Sun, B.; Zhao, H.; Wang, X. Effects of Drought on Net Primary Productivity: Roles of Temperature, Drought Intensity, and Duration. Chin. Geogr. Sci. 2016, 26, 270–282. [Google Scholar] [CrossRef]
  64. Gebremeskel Haile, G.; Tang, Q.; Sun, S.; Huang, Z.; Zhang, X.; Liu, X. Droughts in East Africa: Causes, Impacts and Resilience. Earth-Sci. Rev. 2019, 193, 146–161. [Google Scholar] [CrossRef]
  65. Price, O.F.; Bradstock, R.A. The Spatial Domain of Wildfire Risk and Response in the Wildland Urban Interface in Sydney, Australia. Nat. Hazards Earth Syst. Sci. 2013, 13, 3385–3393. [Google Scholar] [CrossRef]
  66. Collins, K.M.; Penman, T.D.; Price, O.F. Some Wildfire Ignition Causes Pose More Risk of Destroying Houses than Others. PLoS ONE 2016, 11, e0162083. [Google Scholar] [CrossRef]
  67. Qiu, L.; Chen, J.; Fan, L.; Sun, L.; Zheng, C. High-Resolution Mapping of Wildfire Drivers in California Based on Machine Learning. Sci. Total Environ. 2022, 833, 155155. [Google Scholar] [CrossRef]
  68. Sari, P.T.K.; Mochtar, I.B. Causes of Landslides in Road Embankment with Retaining Wall and Pile Foundation: A Case Study of National Road Project in Porong-Sidoarjo, Indonesia. Int. J. Adv. Sci. Eng. Inf. Technol. 2023, 13, 42–48. [Google Scholar] [CrossRef]
  69. Zhao, S.; Zeng, R.; Zhang, Z.; Meng, X.; Qi, T.; Long, Z.; Guo, W.; Si, G. Landslide Mapping and Causes of Landslides in the China–Nepal Transportation Corridor Based on Remote Sensing Technology. Remote Sens. 2024, 16, 356. [Google Scholar] [CrossRef]
  70. Korkmaz, K.A. Earthquake Disaster Risk Assessment and Evaluation for Turkey. Env. Geol 2009, 57, 307–320. [Google Scholar] [CrossRef]
  71. Thirugnanam, H.; Ramesh, M.V.; Rangan, V.P. Enhancing the Reliability of Landslide Early Warning Systems by Machine Learning. Landslides 2020, 17, 2231–2246. [Google Scholar] [CrossRef]
  72. Longo, R.; Lacanna, G.; Innocenti, L.; Ripepe, M. Artificial Intelligence and Machine Learning Tools for Improving Early Warning Systems of Volcanic Eruptions: The Case of Stromboli. IEEE Trans. Pattern Anal. Mach. Intell. 2024, 46, 7973–7982. [Google Scholar] [CrossRef]
  73. Al-Rawas, G.; Nikoo, M.R.; Al-Wardy, M.; Etri, T. A Critical Review of Emerging Technologies for Flash Flood Prediction: Examining Artificial Intelligence, Machine Learning, Internet of Things, Cloud Computing, and Robotics Techniques. Water 2024, 16, 2069. [Google Scholar] [CrossRef]
  74. Sulistyowati, R.; Sujono, H.A.; Musthofa, A.K. A River Water Level Monitoring System Using Android-Based Wireless Sensor Networks for a Flood Early Warning System. In Proceedings of the Proceedings of Second International Conference on Electrical Systems, Technology and Information 2015 (ICESTI 2015), Bali, Indonesia, 9–12 September 2015; Pasila, F., Tanoto, Y., Lim, R., Santoso, M., Pah, N.D., Eds.; Springer: Singapore, 2016; pp. 401–408. [Google Scholar]
  75. Poovizhi, S.; Premalatha, M.; Nivetha, C. Automatic Water Level Monitoring and Seat Availability Details in Train Using Wireless Sensor Network. In Proceedings of the 2017 International Conference on Computation of Power, Energy Information and Commuincation (ICCPEIC), Melmaruvathur, India, 22–23 March 2017; pp. 321–324. [Google Scholar]
  76. Son, Y.; Di Lorenzo, E.; Park, K.; Wipperfurth, S.; Luo, J. Data Assimilation of Hyper-Local Water Level Sensors for Real-Time Monitoring of Coastal Inundation. Coast. Eng. 2023, 186, 104398. [Google Scholar] [CrossRef]
  77. Ji, Y.; Zhang, M.; Wang, Y.; Wang, P.; Wang, A.; Wu, Y.; Xu, H.; Zhang, Y. Microwave-Photonic Sensor for Remote Water-Level Monitoring Based on Chaotic Laser. Int. J. Bifurc. Chaos 2014, 24, 1450032. [Google Scholar] [CrossRef]
  78. Dalai, C.; Singh, M.; Sunad Kumara, A.N.; Patel, W.; Patil, H.; Maranan, R. Monitoring Water Levels in Rivers with Optical Fiber Sensors. In Proceedings of the 2024 5th International Conference on Innovative Trends in Information Technology (ICITIIT), Kottayam, India, 15–16 March 2024; pp. 1–6. [Google Scholar]
  79. Baek, S.; Lee, J.J.; Shin, J.; Kim, J.H.; Hong, S.; Kim, S. Resistive Water Level Sensors Based on AgNWs/PEDOT:PSS-g-PEGME Hybrid Film for Agricultural Monitoring Systems. ACS Omega 2022, 7, 15459–15466. [Google Scholar] [CrossRef]
  80. De Leon, A.F.; Cruz, F.R.G. Water Level Monitoring and Flood Warning System Using Light Detection and Ranging (LiDAR) Sensor with Hybrid Renewable Solar-Wind Power. In Proceedings of the 2021 IEEE 13th International Conference on Humanoid, Nanotechnology, Information Technology, Communication and Control, Environment, and Management (HNICEM), Manila, Philippines, 28–30 November 2021; pp. 1–5. [Google Scholar]
  81. Xu, C.; Pu, X.; Fang, J.; Yang, T.; Xin, M. Water Level Monitoring Sensor Based on Iontronic Piezo-Capacitance Effect. In Sustainable Development of Water and Environment; Jeon, H.-Y., Ed.; Environmental Science and Engineering; Springer Nature: Cham, Switzerland, 2023; pp. 279–291. ISBN 978-3-031-42587-5. [Google Scholar]
  82. Yang, Q.; Yu, A.J.; Simonton, J.; Yang, G.; Dohrmann, Y.; Kang, Z.; Li, Y.; Mo, J.; Zhang, F.-Y. An Inkjet-Printed Capacitive Sensor for Water Level or Quality Monitoring: Investigated Theoretically and Experimentally. J. Mater. Chem. A 2017, 5, 17841–17847. [Google Scholar] [CrossRef]
  83. Rocher, J.; Parra, L.; Lloret, J.; Mengual, J. An Inductive Sensor for Water Level Monitoring in Tubes for Water Grids. In Proceedings of the 2018 IEEE/ACS 15th International Conference on Computer Systems and Applications (AICCSA), Aqaba, Jordan, 28 October–1 November 2018; pp. 1–7. [Google Scholar]
  84. Liu, G.; Sheng, Q.; Piassetta, G.R.L.; Hou, W.; Han, M. A Fiber-Optic Water Flow Sensor Based on Laser-Heated Silicon Fabry-Pérot Cavity. In Proceedings of the Fiber Optic Sensors and Applications XIII, Baltimore, MD, USA, 18–21 April 2016; SPIE: Bellingham, WA, USA, 2016; Volume 9852, pp. 288–294. [Google Scholar]
  85. Pillai, A.N.; Abhiram, B.; Arun, R.; Harin, B.; Nisha, K.L.; Sathayadevan, S.; Vyshak, K. Cost-Effective Solutions for Underwater Ultrasonic Flow Rate Sensors in Renewable Energy Applications—An Appraisal. In Proceedings of the 2024 Second International Conference on Smart Technologies for Power and Renewable Energy (SPECon), Ernakulam, India, 2–4 April 2024; pp. 1–6. [Google Scholar]
  86. Wan, Y. Design and Application of a New Low and Lower Limit Differential Pressure Flow Rate Sensor. In Proceedings of the 2023 3rd International Conference on Energy, Power and Electrical Engineering (EPEE), Wuhan, China, 15–17 September 2023; pp. 793–797. [Google Scholar]
  87. Bansode, P.M.; Kulkarni, V.B. IR and LASER Sensors for Newtonian Fluids for Flow-Rate Measurement Using FPGA. In Proceedings of the 2015 International Conference on Industrial Instrumentation and Control (ICIC), Pune, India, 28–30 May 2015; pp. 821–824. [Google Scholar]
  88. van Maanen, H.R.E. Measurement of the Liquid Water Flow Rate Using Microwave Sensors in Wet-Gas Meters: Not as Simple as You Might Think. In Proceedings of the 26th International North Sea Flow Measurement Workshop, Scotland, UK, 21–24 October 2008; pp. 345–354. [Google Scholar]
  89. Brown, C.U.; Vogl, G.W.; Tam, W.C. Measuring Water Flow Rate for a Fire Hose Using a Wireless Sensor Network for Smart Fire Fighting. Fire Technol. 2021, 57, 3125–3150. [Google Scholar] [CrossRef]
  90. Shaun, F.; Nefzaoui, E.; Regina, H.; Cesar, W.; Marty, F.; Capochichi-Gnambodoe, M.; Poulichet, P.; Basset, P.; Peressuti, F.; Sarkar, S.; et al. On the Co-Integration of a Thermo-Resistive Flow-Rate Sensor in a Multi-Parameter Sensing Chip for Water Network Monitoring. In Proceedings of the 2017 19th International Conference on Solid-State Sensors, Actuators and Microsystems (TRANSDUCERS), Kaohsiung, Taiwan, 18–22 June 2017; pp. 1069–1072. [Google Scholar]
  91. Gong, Y.; Zhang, M.; Gong, C.; Wu, Y.; Rao, Y.; Fan, X. Sensitive Optofluidic Flow Rate Sensor Based on Laser Heating and Microring Resonator. Microfluid Nanofluid 2015, 19, 1497–1505. [Google Scholar] [CrossRef]
  92. Wrasse, A.d.N.; Bertoldi, D.; Morales, R.E.M.; Jose da Silva, M. Two-Phase Flow Rate Measurement Using a Capacitive Sensor and a Venturi Meter. In Proceedings of the 2017 IEEE SENSORS, Glasgow, UK, 29 October–1 November 2017; pp. 1–3. [Google Scholar]
  93. Mane, S.; Das, N.; Singh, G.; Cosh, M.; Dong, Y. Advancements in Dielectric Soil Moisture Sensor Calibration: A Comprehensive Review of Methods and Techniques. Comput. Electron. Agric. 2024, 218, 108686. [Google Scholar] [CrossRef]
  94. Chen, L.; Zhangzhong, L.; Zheng, W.; Yu, J.; Wang, Z.; Wang, L.; Huang, C. Data-Driven Calibration of Soil Moisture Sensor Considering Impacts of Temperature: A Case Study on FDR Sensors. Sensors 2019, 19, 4381. [Google Scholar] [CrossRef] [PubMed]
  95. Zhao, Y.-D.; Bai, C.-X.; Kuang, Q.-M.; Zhang, J.; Wolfgang, P. Performance of Three Types of Soil Moisture Sensors: SWR, TDR and FD. Beijing Linye Daxue Xuebao/J. Beijing For. Univ. 2006, 28, 158–160. [Google Scholar]
  96. Yu, L.; Gao, W.; Shamshiri, R.R.; Tao, S.; Ren, Y.; Zhang, Y.; Su, G. Review of Research Progress on Soil Moisture Sensor Technology. Int. J. Agric. Biol. Eng. 2021, 14, 32–42. [Google Scholar] [CrossRef]
  97. Lim, G.R.; Herrera, S.X.O.; Cruz, F.R.G. Selection of Suitable Soil Moisture Sensor for Clay Soil. In Proceedings of the 2024 IEEE International Conference on Automatic Control and Intelligent Systems (I2CACIS), Shah Alam, Malaysia, 29 June 2024; pp. 308–313. [Google Scholar]
  98. Yan, K.; Liu, J.; Sun, N.; Zhong, W. Soil Moisture Sensor Design Based on Fiber Bragg Grating. In Proceedings of the Tenth International Symposium on Precision Engineering Measurements and Instrumentation, Kunming, China, 8–10 August 2018; SPIE: Bellingham, WA, USA, 2019; Volume 11053, pp. 562–567. [Google Scholar]
  99. Meng, Z. A Comparative Analysis of Common Types of Temperature Sensors: Seeking Optimal Solutions for Diverse Industrial Environments. IET Conf. Proc. 2025, 2024, 27–31. [Google Scholar] [CrossRef]
  100. Mulayim, S.; Ozkan, E.; Erkorkmaz, T. A New Single Ended Calibration Approach of Fiber Optic Based Linear Type Temperature Sensor for Tunnels. In Proceedings of the 2023 14th International Conference on Electrical and Electronics Engineering (ELECO), Bursa, Turkey, 30 November–2 December 2023; pp. 1–4. [Google Scholar]
  101. Danh, L.V.Q.; Thao, L.H.; Danh, T.H.; Loc, C.V.; Viet, T.X.; Hoan, T.N.K.; Phieu, L.T.; Ngon, N.C. An IoT-Based Indoor Fire Early Warning System Using Far Infrared Thermal Sensors. In Achieving Sustainable Business Through AI, Technology Education and Computer Science: Volume 2: Teaching Technology and Business Sustainability; Hamdan, A., Ed.; Springer Nature: Cham, Switzerland, 2024; pp. 295–306. ISBN 978-3-031-71213-5. [Google Scholar]
  102. Kim, C.-E.; Ha, T.-J. Capacitive-Type Wearable Temperature Sensors Based on Yttria-Stabilized Zirconia Films Fabricated via Microwave-Assisted All-Solution-Process and Their Application for Detection of Touch Stimuli. J. Alloys Compd. 2025, 1011, 178334. [Google Scholar] [CrossRef]
  103. Zhousheng, Z.; Guoxing, R.; Aiqing, M.; Lu, Z.; Feng, L. Design of Passive Wireless Resonance Type SAW Temperature Sensor. In Proceedings of the 2014 International Conference on Power System Technology, Chengdu, China, 20–22 October 2014; pp. 1451–1456. [Google Scholar]
  104. Arman Kuzubasoglu, B.; Kursun Bahadir, S. Flexible Temperature Sensors: A Review. Sens. Actuators A Phys. 2020, 315, 112282. [Google Scholar] [CrossRef]
  105. Maskay, A.; Pereira Da Cunha, M. High-Temperature Microwave Acoustic Vibration Sensor. In Proceedings of the 2018 IEEE International Ultrasonics Symposium (IUS), Kobe, Japan, 22–25 October 2018; pp. 1–3. [Google Scholar]
  106. Hiraka, K.; Shinagawa, R.; Gogami, A.; Iuchi, T. Rapid-Response Hybrid-Type Surface-Temperature Sensor. Int. J. Thermophys. 2008, 29, 1166–1173. [Google Scholar] [CrossRef]
  107. Müller, A.; Giangu, I.; Stavrinidis, A.; Stefanescu, A.; Stavrinidis, G.; Dinescu, A.; Konstantinidis, G. Sezawa Propagation Mode in GaN on Si Surface Acoustic Wave Type Temperature Sensor Structures Operating at GHz Frequencies. IEEE Electron Device Lett. 2015, 36, 1299–1302. [Google Scholar] [CrossRef]
  108. Liu, Y.; Kahn, R.A.; Chaloulakou, A.; Koutrakis, P. Analysis of the Impact of the Forest Fires in August 2007 on Air Quality of Athens Using Multi-Sensor Aerosol Remote Sensing Data, Meteorology and Surface Observations. Atmos. Environ. 2009, 43, 3310–3318. [Google Scholar] [CrossRef]
  109. Lee, S.; chul-Jung, W.; Park, J. Design of IoT Based Fire-Watching and Atmospheric Environment Monitoring Systems Applied with Compound Sensors and Image Processing. IJSH 2016, 10, 155–168. [Google Scholar] [CrossRef]
  110. Lertsinsrubtavee, A.; Kanabkaew, T.; Raksakietisak, S. Detection of Forest Fires and Pollutant Plume Dispersion Using IoT Air Quality Sensors. Environ. Pollut. 2023, 338, 122701. [Google Scholar] [CrossRef]
  111. Wang, Z.; Yi, Z.; Qin, M.; Huang, Q.-A.; Zhou, Z.-F. Linearity and Sensitivity Analysis of MEMS Thermal Wind Sensor via Analytical Model. IEEE Trans. Instrum. Meas. 2023, 72, 9502209. [Google Scholar] [CrossRef]
  112. Tariq, H.; Touati, F.; Crescini, D.; Ben Mnaouer, A. State-of-the-Art Low-Cost Air Quality Sensors, Assemblies, Calibration and Evaluation for Respiration-Associated Diseases: A Systematic Review. Atmosphere 2024, 15, 471. [Google Scholar] [CrossRef]
  113. Si, C.W.; Han, G.W.; Ning, J.; Zhong, W.W.; Yang, F.H. Design of a MEMS Resonant Wind Sensor on Airplane Wing. Key Eng. Mater. 2013, 562–565, 436–440. [Google Scholar] [CrossRef]
  114. Shang, Z.; Qi, S.; Ma, R.; Li, Y. Design of Wind Sensor Measurement and Control System for Extreme Cold Environment. In Proceedings of the Proceedings of the 2022 6th International Conference on Electronic Information Technology and Computer Engineering, Xiamen, China, 21–23 October 2022; Association for Computing Machinery: New York, NY, USA, 2023; pp. 406–410. [Google Scholar]
  115. Adkins, K.; Swinford, C.; Wambolt, P.; Bease, G. Development of a Sensor Suite for Atmospheric Boundary Layer Measurement with a Small Multirotor Unmanned Aerial System. Int. J. Aviat. Aeronaut. Aerosp. 2020, 7, 4. [Google Scholar] [CrossRef]
  116. Du, L.; Zhao, Z.; Pang, C.; Fang, Z. Drag Force Micro Solid State Silicon Plate Wind Velocity Sensor. Sens. Actuators A Phys. 2009, 151, 35–41. [Google Scholar] [CrossRef]
  117. Ye, Y.; Wan, S.; Li, S.; He, X. Full-Bridge Design for Error Reduction of 3-D Printed Mechanical Wind Sensor. IEEE Sens. J. 2022, 22, 21569–21574. [Google Scholar] [CrossRef]
  118. Su, L.; Wang, H.; Tian, Z.; Wang, H.; Cheng, Q.; Yu, W. Low Detection Limit and High Sensitivity Wind Speed Sensor Based on Triboelectrification-Induced Electroluminescence. Adv. Sci. 2019, 6, 1901980. [Google Scholar] [CrossRef] [PubMed]
  119. Moll, J.; Salman, R.; Pozdniakov, D.; Nuber, A.; Friedman, H.; Arnold, P.; Mälzer, M.; Krozer, V. Motion Sensing of a Wind Turbine Prototype Using a Bistatic FMCW Doppler Radar Sensor. In Proceedings of the 2018 11th German Microwave Conference (GeMiC), Freiburg, Germany, 12–14 March 2018; pp. 99–102. [Google Scholar]
  120. Hung, J.-B.; Chang, P.-C.; Hsuan, C.-Y.; Lin, T.-H. Performance Comparison of the Buoy-Mounted and Land-Based Laser Wind Sensor in the Harbor. In Proceedings of the 24th International Ocean and Polar Engineering Conference, Busan, Korea, 15–20 June 2014; pp. 451–456. [Google Scholar]
  121. Sandra, K.R.; George, B.; Kumar, V.J. Combined Variable Reluctance-Hall Effect Displacement Sensor. IEEE Trans. Instrum. Meas. 2018, 67, 1169–1177. [Google Scholar] [CrossRef]
  122. Di Martire, D.; Iglesias, R.; Monells, D.; Centolanza, G.; Sica, S.; Ramondini, M.; Pagano, L.; Mallorquí, J.J.; Calcaterra, D. Comparison between Differential SAR Interferometry and Ground Measurements Data in the Displacement Monitoring of the Earth-Dam of Conza Della Campania (Italy). Remote Sens. Environ. 2014, 148, 58–69. [Google Scholar] [CrossRef]
  123. Yao, C.; Hong, C.; Su, D.; Zhang, Y.; Yin, Z. Design and Verification of a Wireless Sensing System for Monitoring Large-Range Ground Movement. Sens. Actuators A Phys. 2020, 303, 111745. [Google Scholar] [CrossRef]
  124. Abu_AL_Aish, A.; Salah, W.; Alrashdan, M.; Zneid, B. Design of Differential Cylindrical Capacitive Displacement Sensor. J. Electr. Electron. Eng. 2020, 13, 5–8. [Google Scholar]
  125. Djuric, S.M.; Nagy, L.F.; Damnjanovic, M.S. Detection of Ground Reaction Force Using a Miniaturized Inductive Displacement Sensor. In Proceedings of the 14th International Power Electronics and Motion Control Conference EPE-PEMC 2010, Ohrid, Macedonia, 6–8 September 2010; pp. T15-7–T15-12. [Google Scholar]
  126. Shin, J.; Kim, S.; Jung, Y.-H.; Min, H.; Kim, T.; Jung, J. Paving Block Displacement Detection and Measurement Using 3D Laser Sensors on Unmanned Ground Vehicles. Autom. Constr. 2024, 168, 105813. [Google Scholar] [CrossRef]
  127. Buchoud, E.; Vrabie, V.; Mars, J.I.; D’Urso, G.; Girard, A.; Blairon, S.; Hénault, J.-M. Quantification of Submillimeter Displacements by Distributed Optical Fiber Sensors. IEEE Trans. Instrum. Meas. 2016, 65, 413–422. [Google Scholar] [CrossRef]
  128. Rezaee, M.; Joodaki, M. Two-Dimensional Displacement Sensor Based on CPW Line Loaded by Defected Ground Structure With Two Separated Transmission Zeroes. IEEE Sens. J. 2017, 17, 994–999. [Google Scholar] [CrossRef]
  129. Anderson, S.; Cunningham, E.; Barford, P.; Fratta, D.; Nissen-Meyer, T.; Wang, H. Assessing the Expansion of Ground-Motion Sensing Capability in Smart Cities via Internet Fiber-Optic Infrastructure. Seismol. Res. Lett. 2024, 95, 3633–3651. [Google Scholar] [CrossRef]
  130. Brokešová, J.; Málek, J. New Portable Sensor System for Rotational Seismic Motion Measurements. Rev. Sci. Instrum. 2010, 81, 084501. [Google Scholar] [CrossRef]
  131. Chatzopoulos, G.; Papadopoulos, I.; Vallianatos, F.; Makris, J.P.; Kouli, M. Strong Ground Motion Sensor Network for Civil Protection Rapid Decision Support Systems. Sensors 2021, 21, 2833. [Google Scholar] [CrossRef]
  132. Macpherson, K.A.; Fee, D.; Colwell, J.R.; Witsil, A.J. Using Local Infrasound to Estimate Seismic Velocity and Earthquake Magnitudes. Bull. Seismol. Soc. Am. 2023, 113, 1434–1456. [Google Scholar] [CrossRef]
  133. Kelman, I.; Glantz, M.H. Early Warning Systems Defined. In Reducing Disaster: Early Warning Systems for Climate Change; Singh, A., Zommers, Z., Eds.; Springer: Dordrecht, The Netherlands, 2014; pp. 89–108. ISBN 978-94-017-8598-3. [Google Scholar]
  134. Mileti, D. Disasters by Design: A Reassessment of Natural Hazards in the United States; Joseph Henry Press: Washington, DC, USA, 1999; ISBN 978-0-309-26173-9. [Google Scholar]
  135. JRC Science for Disaster Risk Management 2020. Available online: https://publications.jrc.ec.europa.eu/repository/handle/JRC114026 (accessed on 30 January 2025).
  136. Ward, P.J.; Blauhut, V.; Bloemendaal, N.; Daniell, J.E.; de Ruiter, M.C.; Duncan, M.J.; Emberson, R.; Jenkins, S.F.; Kirschbaum, D.; Kunz, M.; et al. Review Article: Natural Hazard Risk Assessments at the Global Scale. Nat. Hazards Earth Syst. Sci. 2020, 20, 1069–1096. [Google Scholar] [CrossRef]
  137. Heinz-Peter, B.; Marina, R.; Heinz-Peter, B.; Marina, R. Natural Hazards: Systematic Assessment of Their Contribution to Risk and Their Consequences. In Probabilistic Modeling in System Engineering; IntechOpen: London, UK, 2018; ISBN 978-1-78984-409-2. [Google Scholar]
  138. Gill, J.C.; Malamud, B.D. Reviewing and Visualizing the Interactions of Natural Hazards. Rev. Geophys. 2014, 52, 680–722. [Google Scholar] [CrossRef]
  139. Yumang, A.N.; Paglinawan, C.C.; Paglinawan, A.C.; Avendaño, G.O.; Esteves, J.A.C.; Pagaduan, J.R.P.; Selda, J.D.S. Real-Time Flood Water Level Monitoring System with SMS Notification. In Proceedings of the 2017 IEEE 9th International Conference on Humanoid, Nanotechnology, Information Technology, Communication and Control, Environment and Management (HNICEM), Manila, Philippines, 1–3 December 2017; pp. 1–3. [Google Scholar]
  140. Wu, Y.-M.; Mittal, H. A Review on the Development of Earthquake Warning System Using Low-Cost Sensors in Taiwan. Sensors 2021, 21, 7649. [Google Scholar] [CrossRef]
  141. Mittal, H.; Kumar, A.; Wu, Y.-M. Development of Earthquake Detection and Warning System Based on MEMS Sensors. Sens. Mater. 2021, 33, 3240. [Google Scholar] [CrossRef]
  142. Randhawa, R.H.; Mahmood, R.; Ahmad, T. AquaEye: A Low Cost Flood Early Warning System for Developing Countries. In Proceedings of the 2018 International Conference on Frontiers of Information Technology (FIT), Islamabad, Pakistan, 17–19 December 2018; pp. 345–349. [Google Scholar] [CrossRef]
  143. Chen, D.; Rojas, M.; Samset, B.H.; Cobb, K.; Diongue Niang, A.; Edwards, P.; Emori, S.; Faria, S.H.; Hawkins, E.; Hope, P.; et al. Framing, context, and methods. In Climate Change 2021: The Physical Science Basis. Contribution of Working Group I to the Sixth Assessment Report of the Intergovernmental Panel on Climate Change; Masson-Delmotte, V., Zhai, P., Pirani, A., Connors, S.L., Péan, C., Berger, S., Caud, N., Chen, Y., Goldfarb, L., Gomis, M.I., Eds.; Cambridge University Press: Cambridge, UK, 2021; pp. 147–286. [Google Scholar] [CrossRef]
  144. National Disaster Risk Assessment. Available online: https://www.unisdr.org/files/52828_nationaldisasterriskassessmentpart1.pdf (accessed on 17 January 2025).
  145. Pan, Z.; Xu, Z.; Chen, L.; Peng, C.; Liu, E. Application of Artificial Intelligence Technology in Flood Early Warning System. In Proceedings of the 2024 3rd International Conference on Artificial Intelligence and Autonomous Robot Systems (AIARS), Bristol, UK, 29–31 July 2024; pp. 438–442. [Google Scholar] [CrossRef]
  146. Faiella, A.; Menoni, S.; Boni, M.P.; Panoutsopoulou, M.; Thoma, T.; Salari, S.; Rueda, N. Enabling Knowledge through Structured Disaster Damage & Loss Data Management System. Sustainability 2022, 14, 6187. [Google Scholar] [CrossRef]
  147. Chandrakumar, C.; Prasanna, R.; Stephens, M.; Tan, M.L. Earthquake Early Warning Systems Based on Low-Cost Ground Motion Sensors: A Systematic Literature Review. Front. Sens. 2022, 3, 1020202. [Google Scholar] [CrossRef]
  148. Cui, P.; Peng, J.; Shi, P.; Tang, H.; Ouyang, C.; Zou, Q.; Liu, L.; Li, C.; Lei, Y. Scientific Challenges of Research on Natural Hazards and Disaster Risk. Geogr. Sustain. 2021, 2, 216–223. [Google Scholar] [CrossRef]
  149. Kubas, J.; Polorecka, M.; Holla, K.; Soltes, V.; Kelisek, A.; Strachota, S.; Maly, S. Use of Toxic Substance Release Modelling as a Tool for Prevention Planning in Border Areas. Atmosphere 2022, 13, 836. [Google Scholar] [CrossRef]
Figure 1. Model of an EWS based on the three-component approach.
Applsci 15 03218 g001
Figure 2. Flow chart of early warning systems.
Applsci 15 03218 g002
Figure 3. Data-driven risk assessment.
Applsci 15 03218 g003
Table 1. Category classification of natural causes [40].
Disaster GroupDefinition
GeophysicalEvents originating from solid earth
MeteorologicalEvents caused by short-lived/small to meso-scale atmospheric processes (in the spectrum from minutes to days)
HydrologicalEvents caused by deviations in the normal water cycle and/or overflow of bodies of water caused by wind set-up
ClimatologicalEvents caused by long-lived/meso- to macro-scale processes (in the spectrum from intraseasonal to multi-decadal climate variability)
Table 2. Primary and secondary causes of natural hazards.
Natural HazardPrimary CauseGroupSecondary CauseGroup
FloodsRainfallMeteorologicalSoil moistureHydrological
SnowmeltsHydrologicalTemperatureMeteorological
Not applicableNot applicablePressureMeteorological
Not applicableNot applicableHumidityMeteorological
DroughtsTemperatureMeteorologicalGroundwaterHydrological
EvapotranspirationHydrologicalHumidityMeteorological
RainfallMeteorologicalNot applicableNot applicable
Extreme temperaturesTemperatureMeteorologicalHumidityMeteorological
WildfiresTemperatureMeteorologicalSoil moistureHydrological
HumidityMeteorologicalWindMeteorological
WindWindMeteorologicalPressureMeteorological
LandslidesRainfallMeteorologicalSoil moistureHydrological
EarthquakesGeophysicalNot applicableNot applicable
EarthquakesGround motionGeophysicalNot applicableNot applicable
Table 3. Manifestations of the natural hazards.
Natural HazardManifestationGroup
FloodsWater levelHydrological
Flow rateHydrological
DroughtsSoil moisture (saturation)Hydrological
Water levelHydrological
Extreme TemperaturesTemperature Meteorological
WildfiresTemperatureMeteorological
Air qualityMeteorological
WindWindMeteorological
LandslidesGround displacementGeophysical
EarthquakesGround motionGeophysical
Table 4. Types of sensors applicable for measuring natural hazard manifestations [74,75,76,77,78,79,80,81,82,83,84,85,86,87,88,89,90,91,92,93,94,95,96,97,98,99,100,101,102,103,104,105,106,107,108,109,110,111,112,113,114,115,116,117,118,119,120,121,122,123,124,125,126,127,128,129,130,131,132].
Natural HazardParameterTypes of Sensors
FloodsWater levelPressure, ultrasonic, radar, optical fibre, microwave–photonic, inductive, LiDaR, infrared, capacitive, resistive
Flow ratePhotoelectric, thermo-resistive, optofluidic, pressure, ultrasonic, piezoelectric, capacitive, microwave, infrared, fibre optic
DroughtsSoil moistureResistive, capacitive, dielectric, impedance, time domain reflectometry, frequency domain, standing wave ratio, neutron probe, weight, optical fibre
Water level-
Extreme temperaturesTemperatureCapacitive, fibre optic, optical (several types), resistive, semiconductive, thermistors, thermocouples, surface acoustic wave, infrared, microwave
WildfiresTemperature-
Air qualityElectrochemical, infrared, optical gas, capacitive gas, calorimetric gas, acoustic gas, spectroradiometer, resistive
WindWindThermal anemometer, acoustic resonance, laser, pressure, strain gauge mechanical, ultrasonic, drag force, capacitive, triboelectric, triboelectric, Doppler radar
LandslidesGround displacementInductive, microwave, laser, fibre optic, radar, resistive, capacitive, Hall effect
EarthquakesGround motionAcoustic, strong ground motion, fibre optic, rotational frequency, infrasound
Disclaimer/Publisher’s Note: The statements, opinions and data contained in all publications are solely those of the individual author(s) and contributor(s) and not of MDPI and/or the editor(s). MDPI and/or the editor(s) disclaim responsibility for any injury to people or property resulting from any ideas, methods, instructions or products referred to in the content.

