
Parameter Optimization of Orbital TIG Welding on Stainless Steel Pipe

 , ,
, , 
Abstract
1. Introduction
2. Experimental Material and Method
2.1. Experimental Material
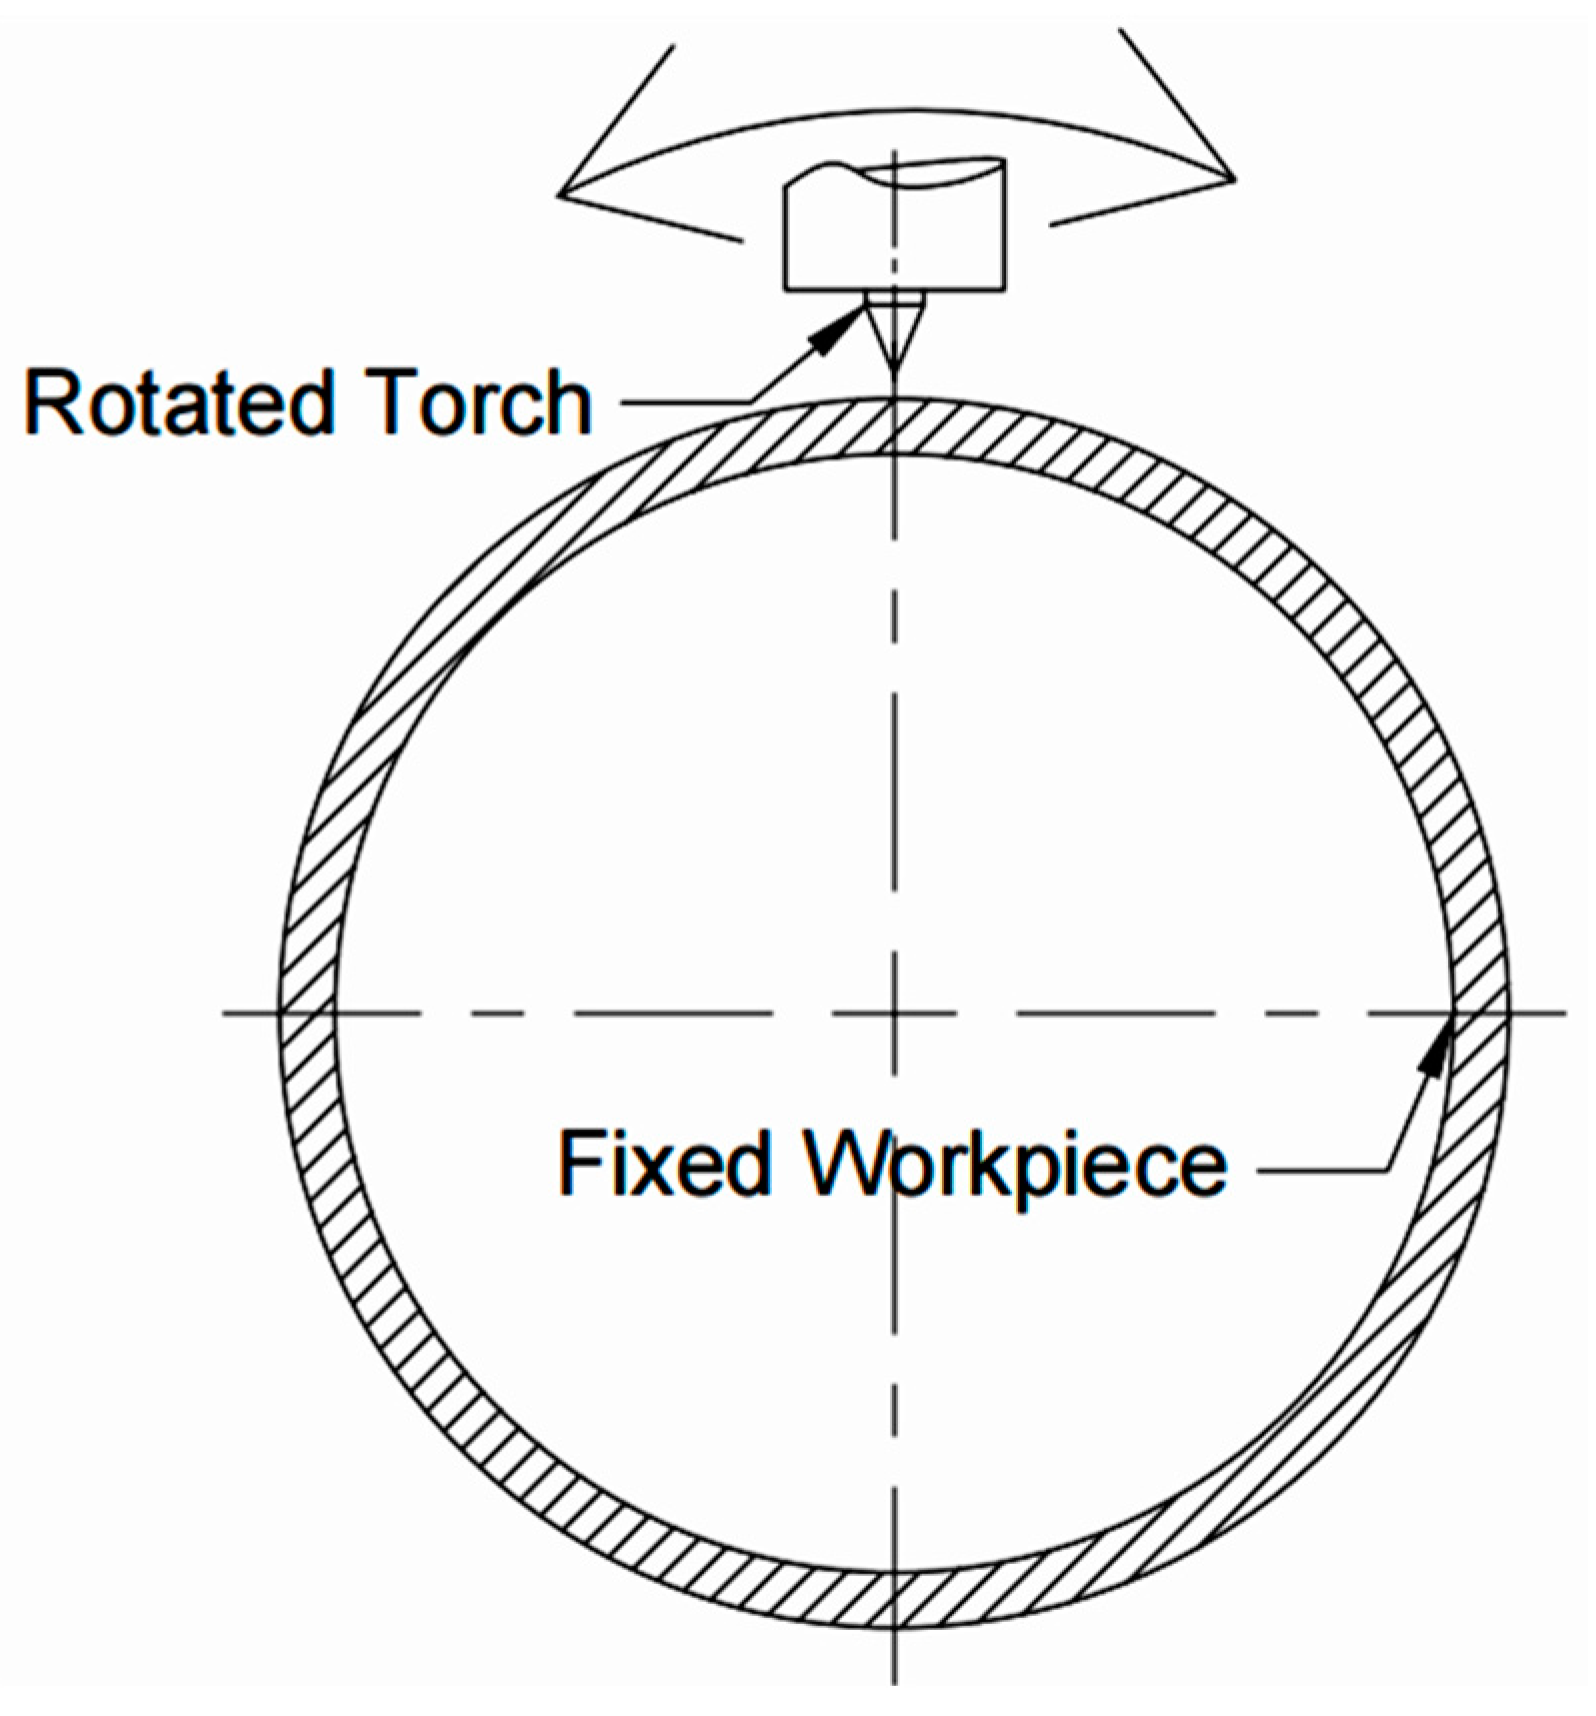
2.2. Experimental Method
3. Results and Discussion
3.1. Visual Test Results
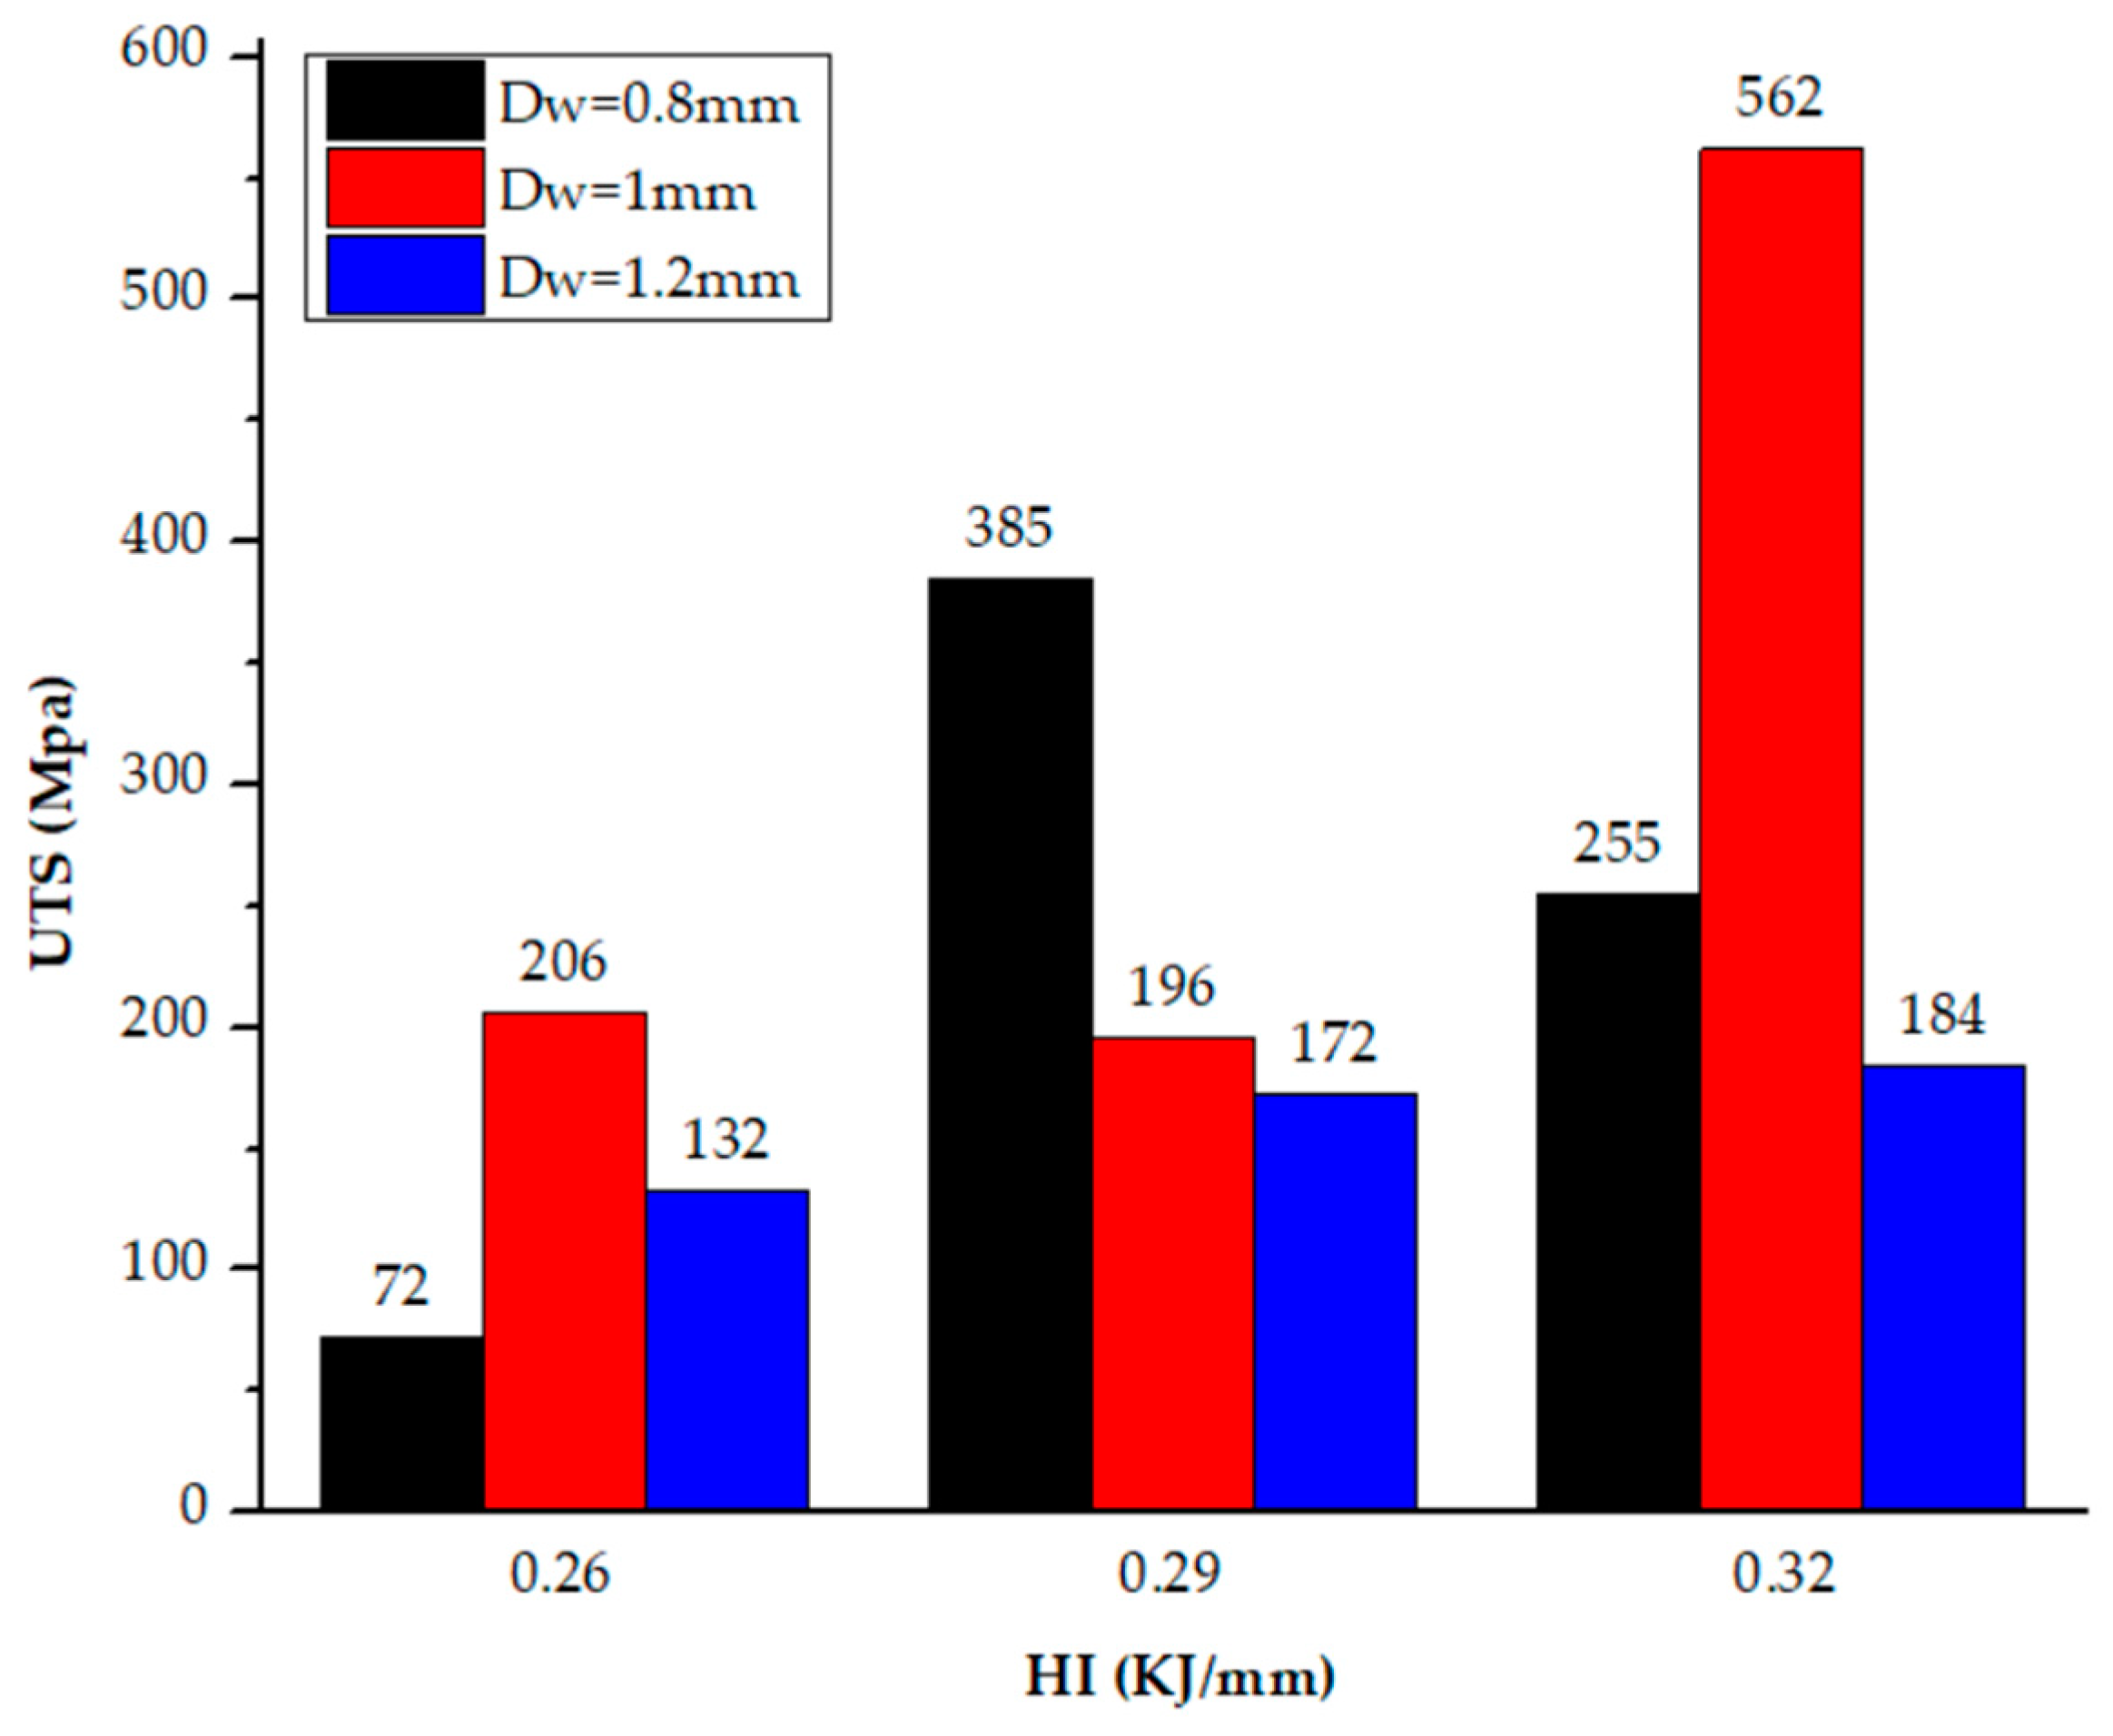
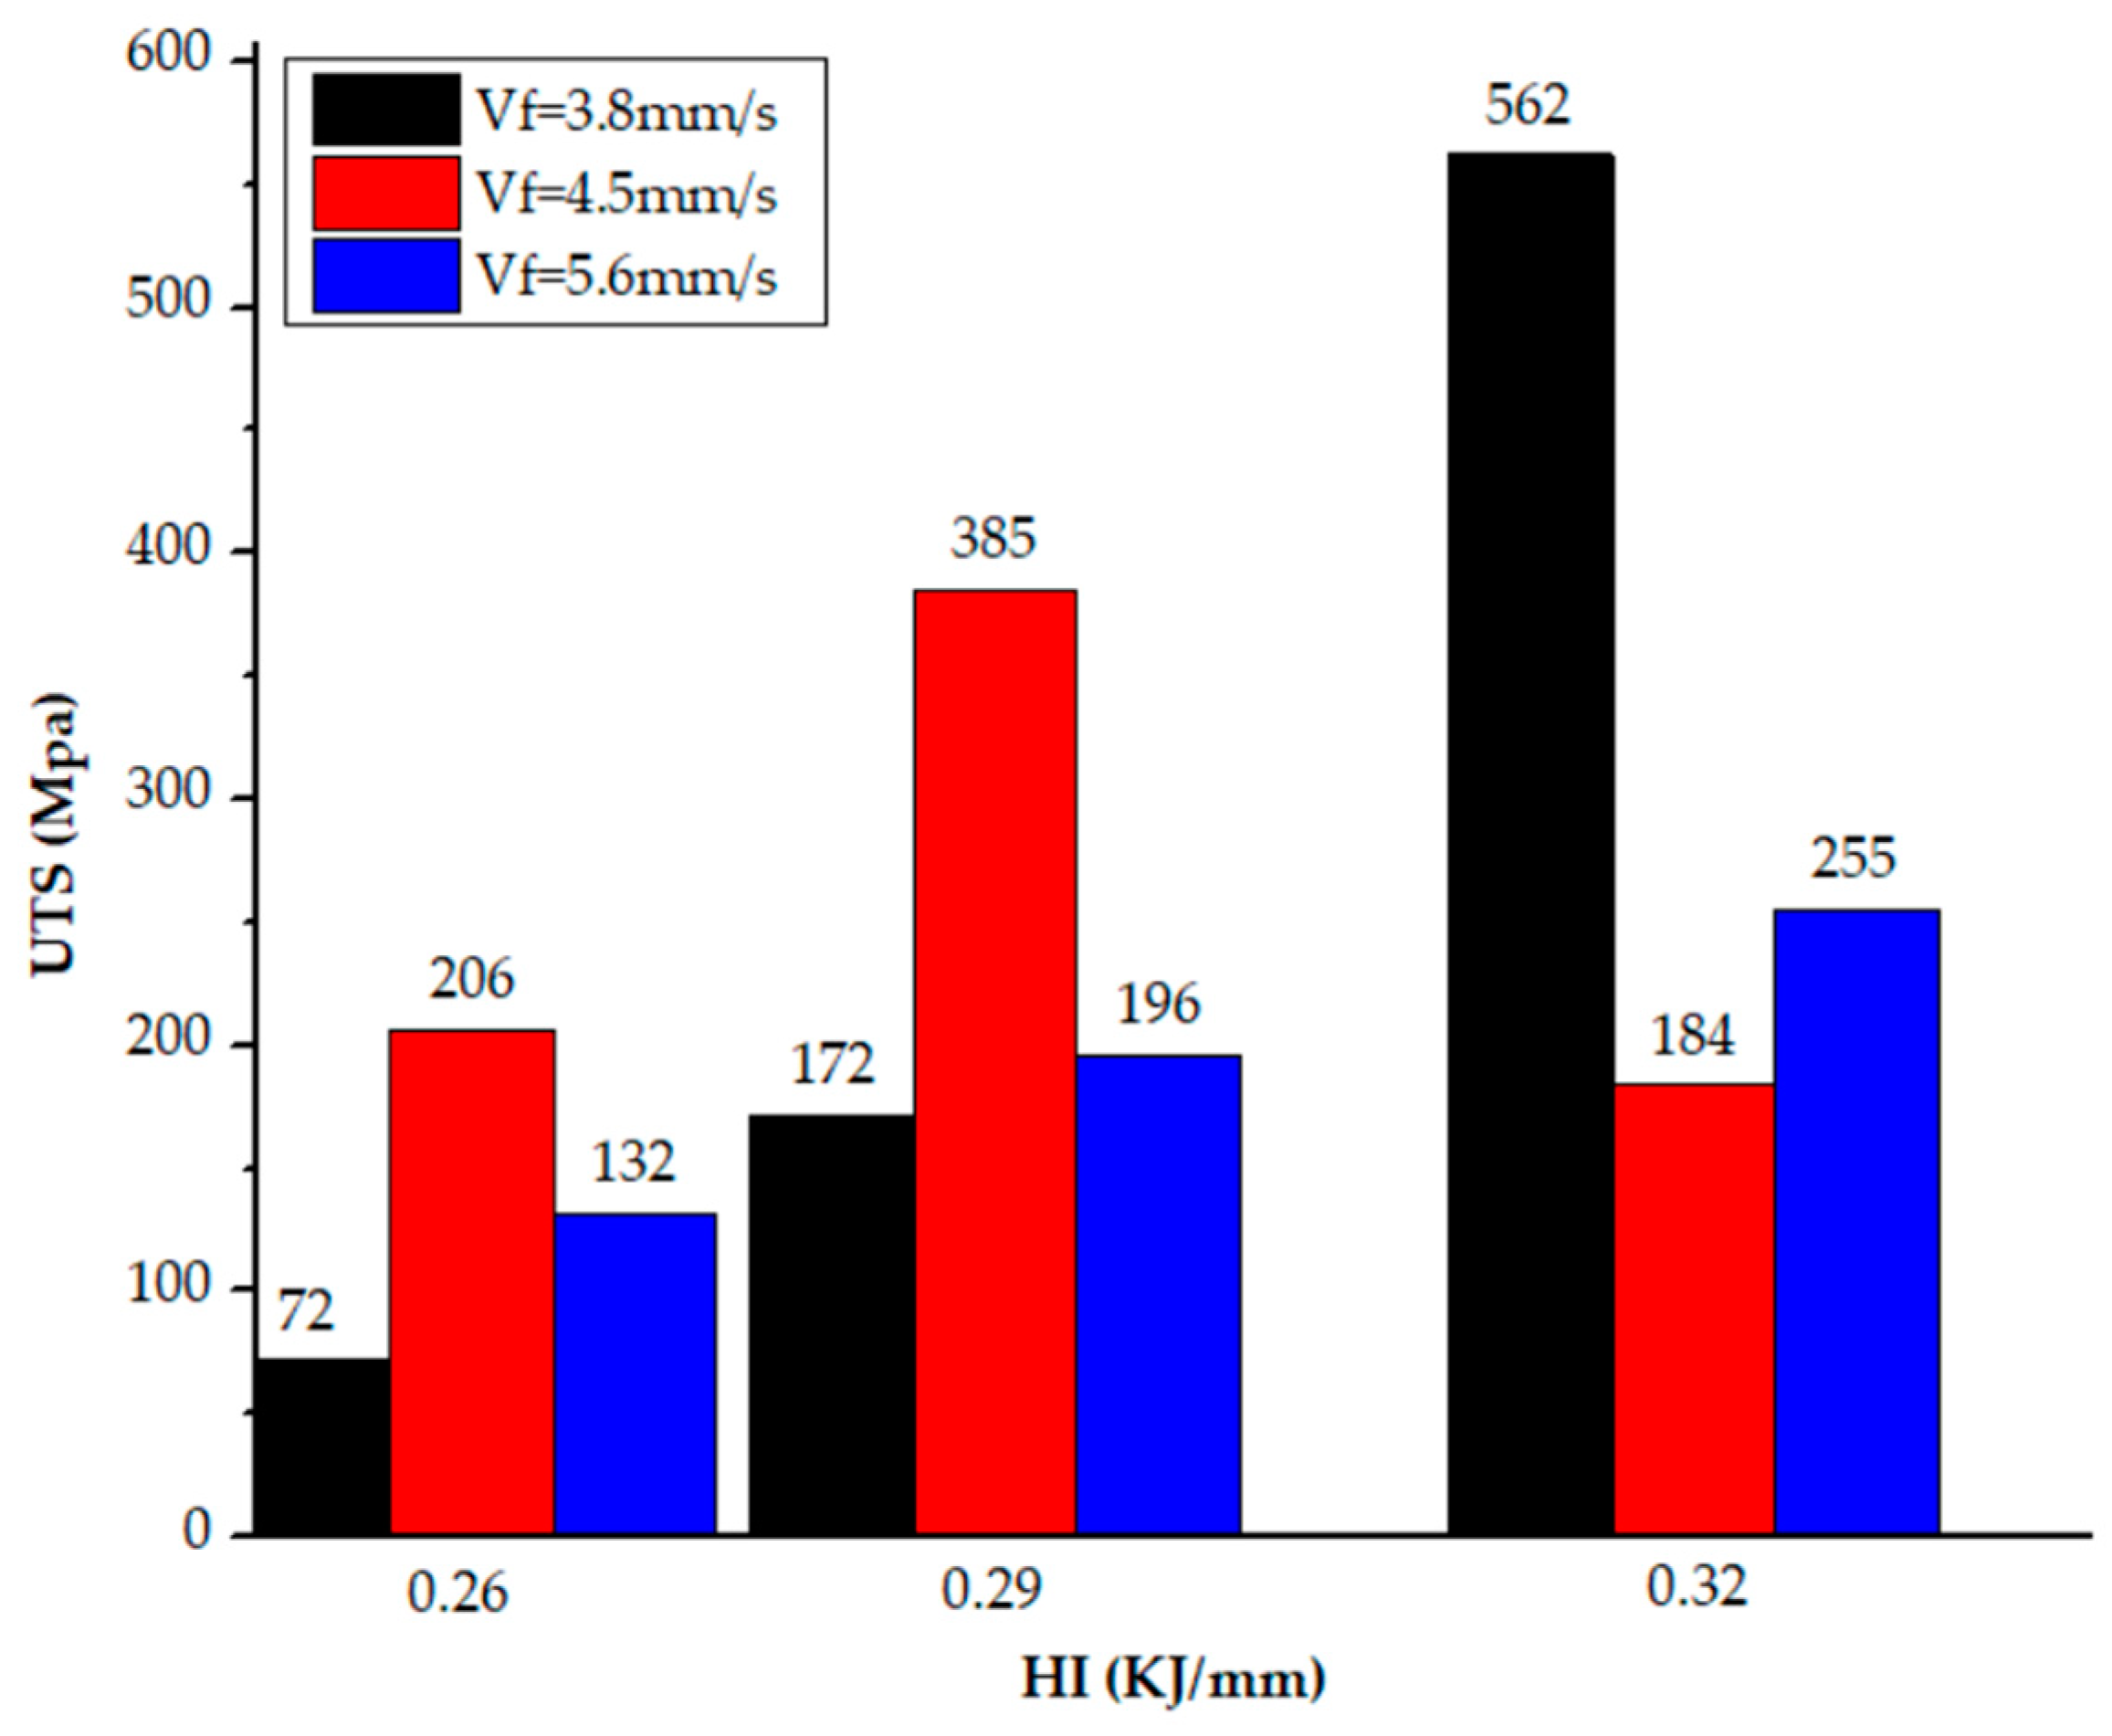
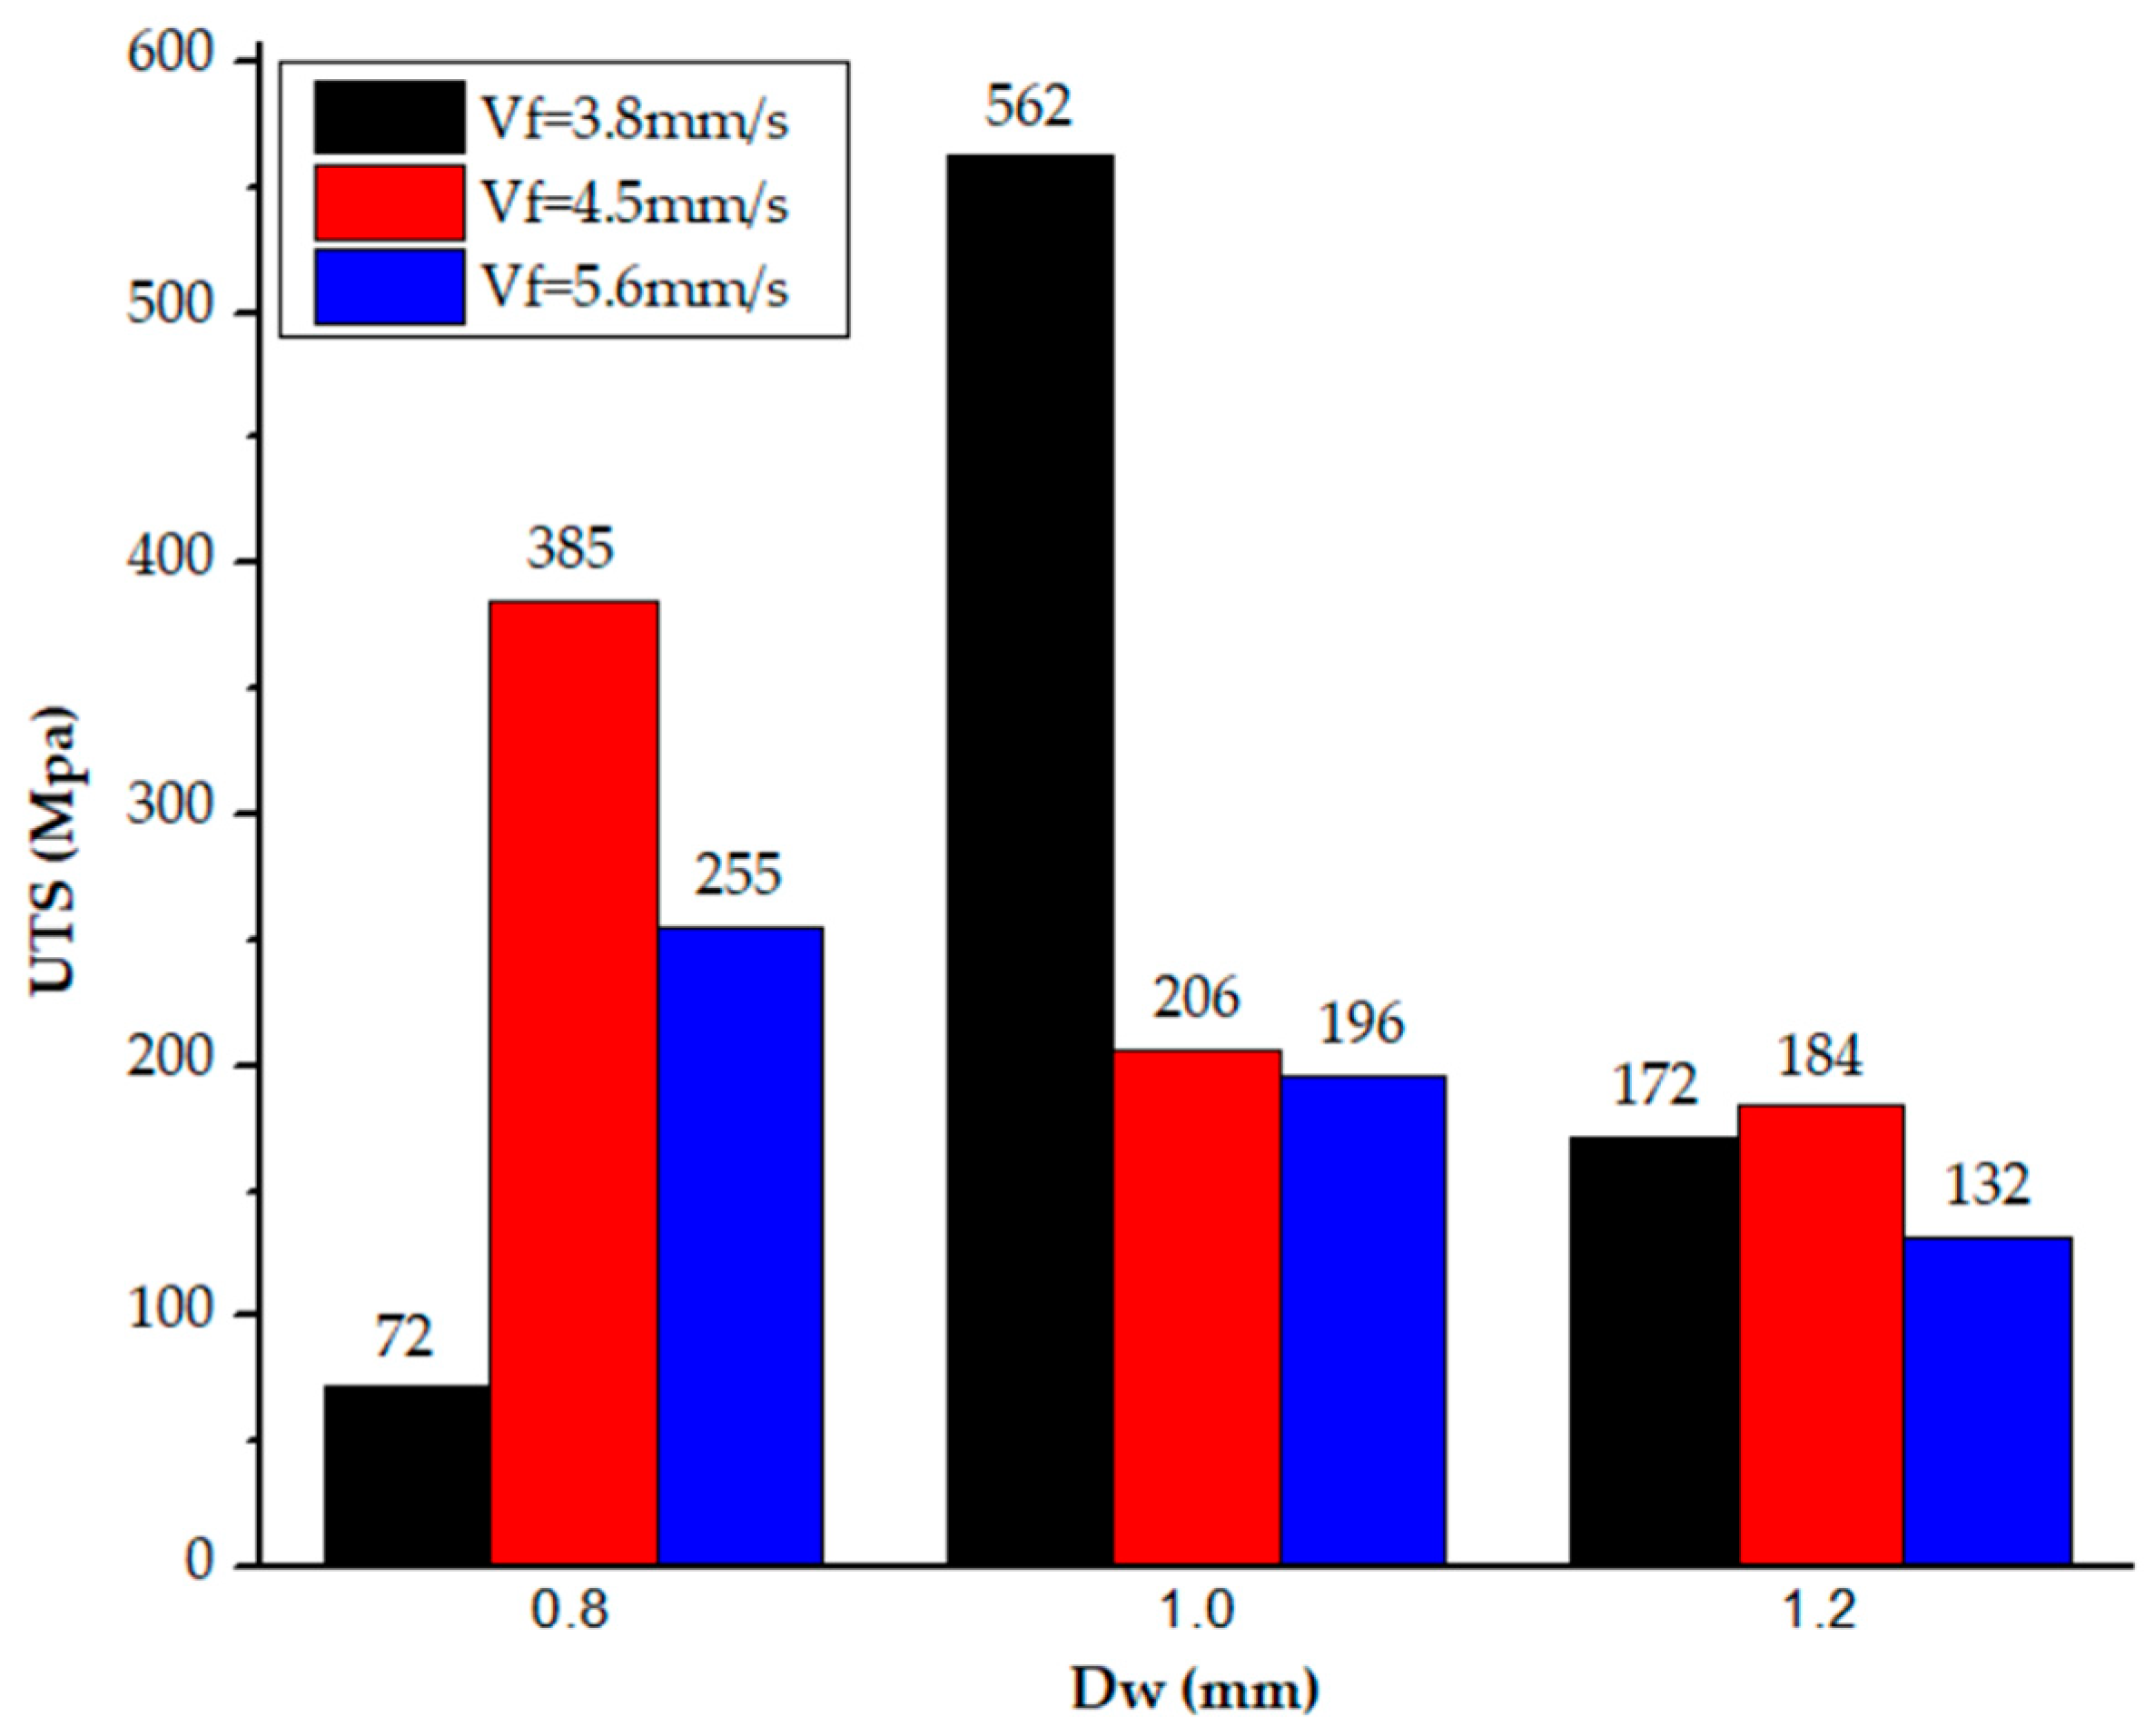
3.2. Tension Test Results
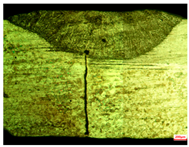
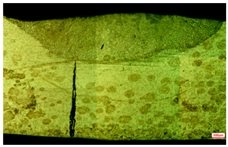
3.3. Microstructure
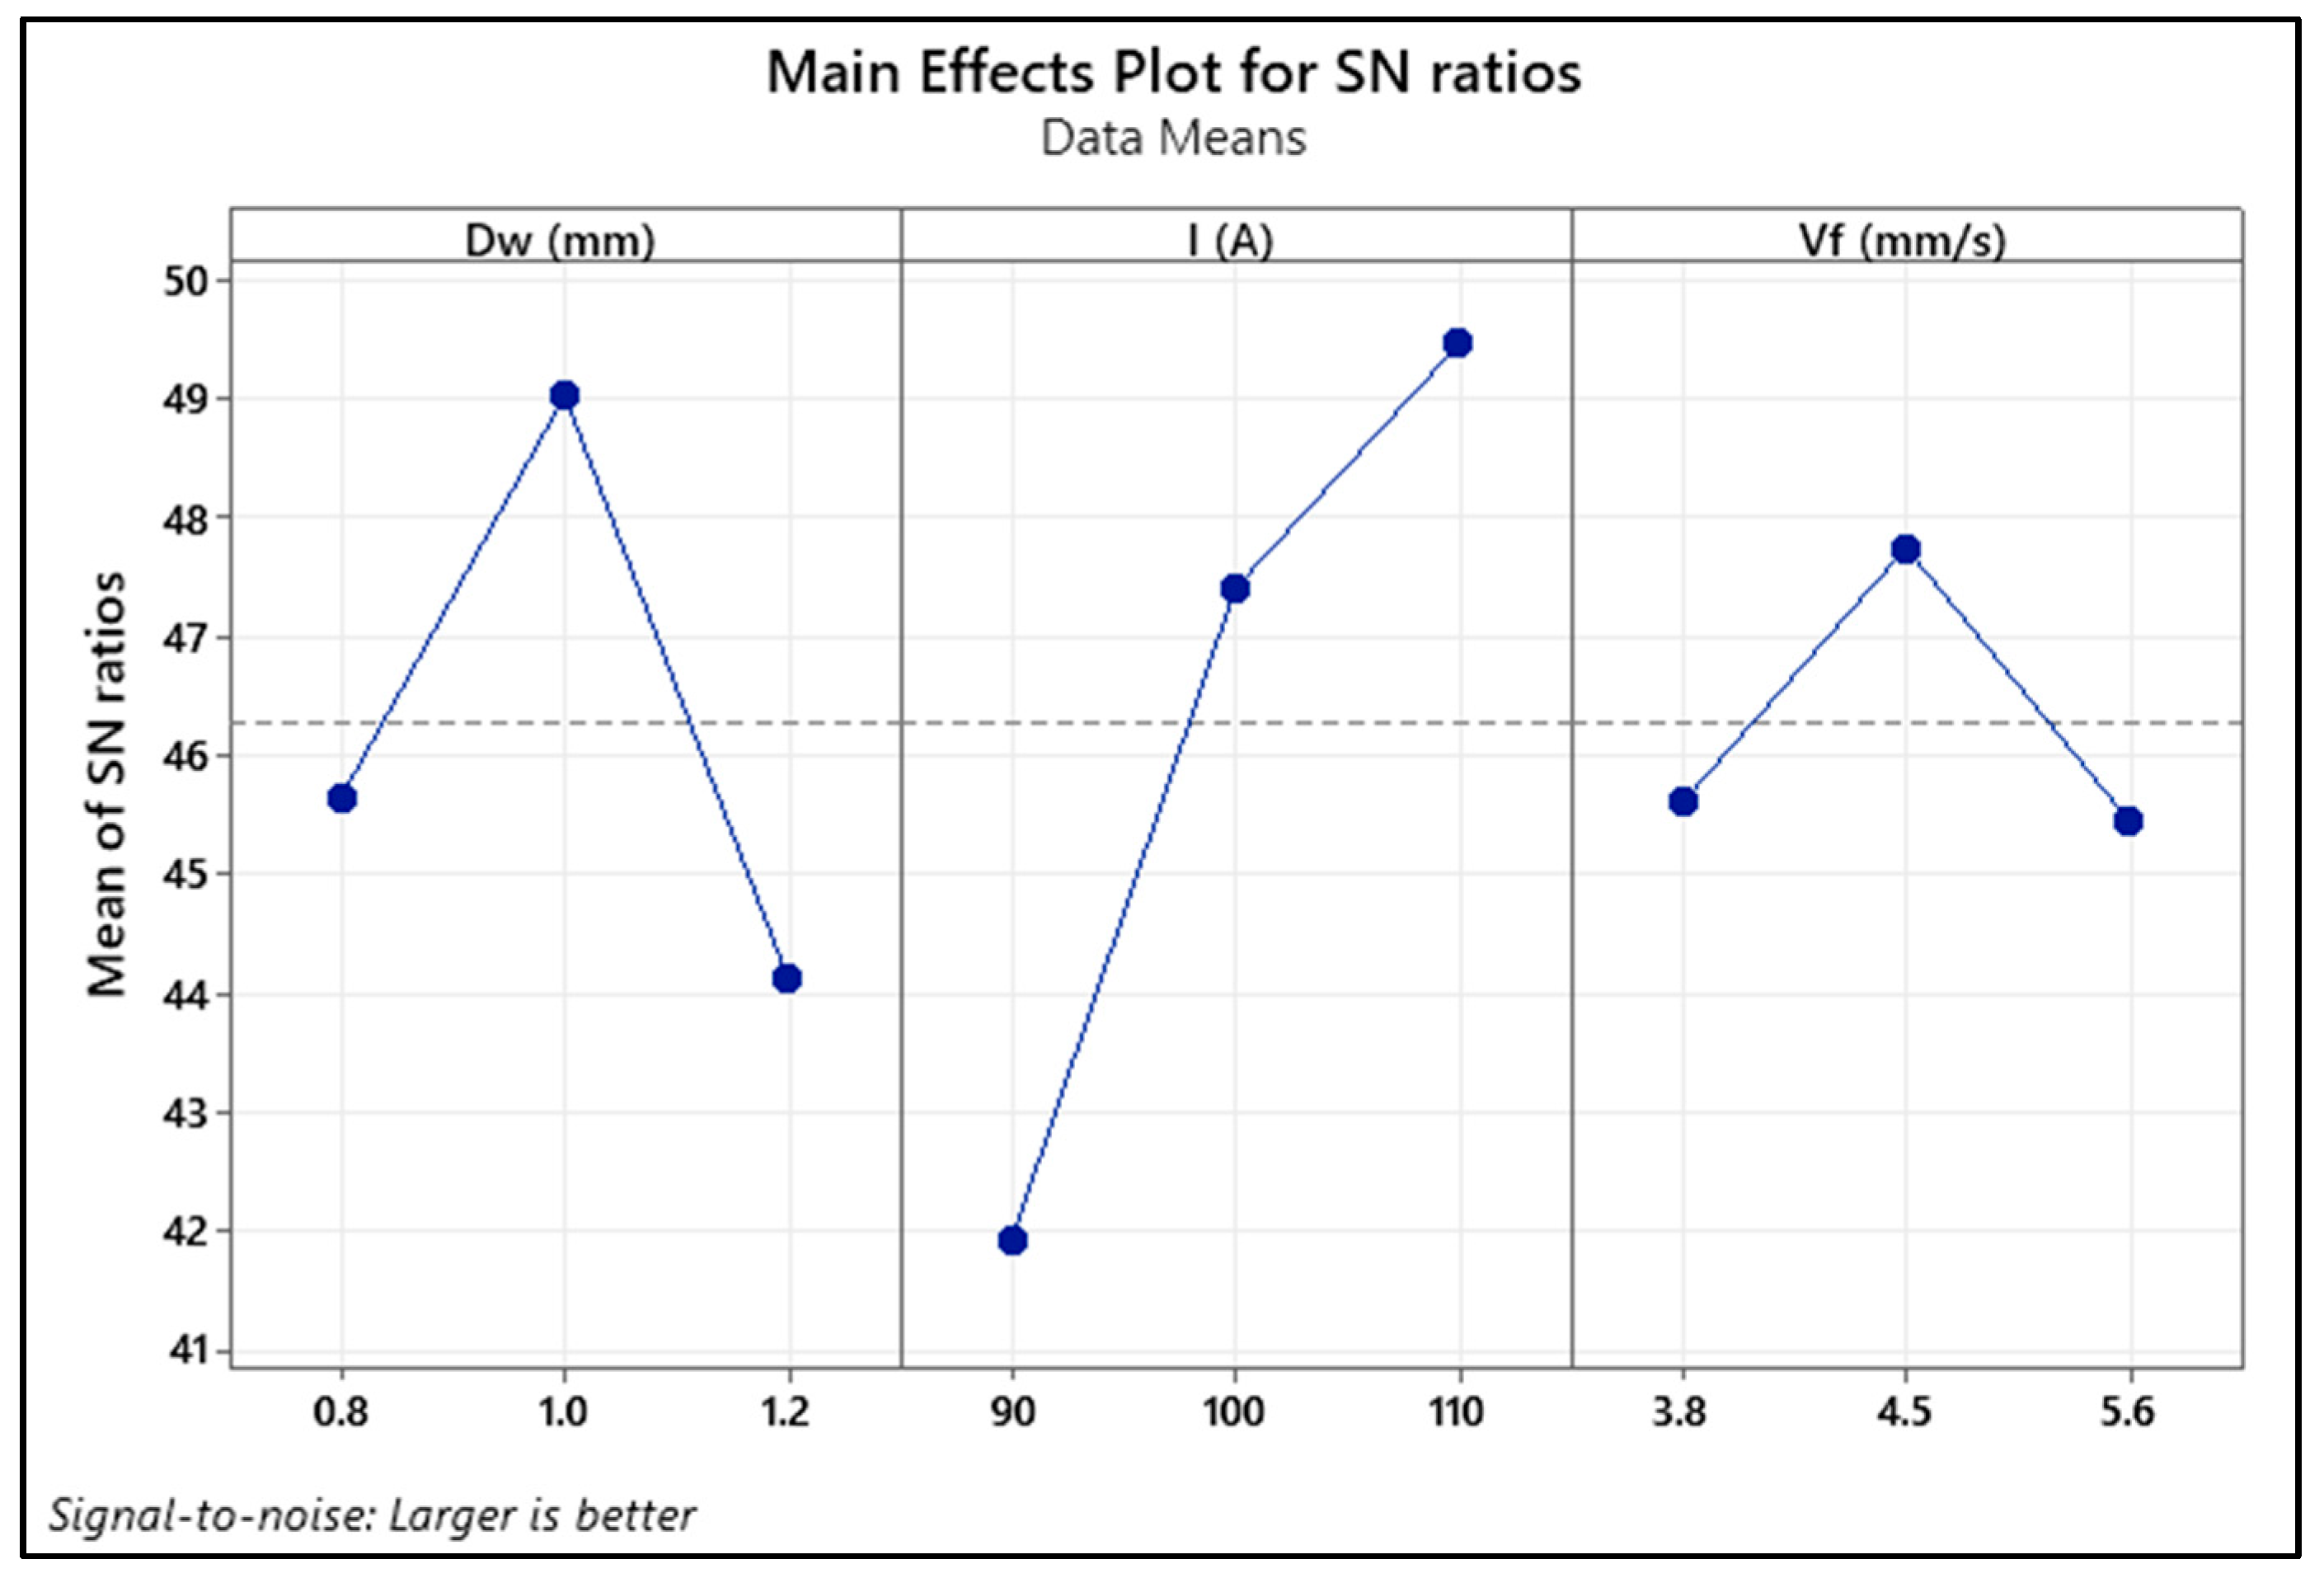
3.4. Taguchi Analysis
4. Conclusions
Author Contributions
Funding
Institutional Review Board Statement
Informed Consent Statement
Data Availability Statement
Acknowledgments
Conflicts of Interest
References
- Polysoude, S.A.S. The Orbital Welding Handbook; Polysoude: Nantes, France, 2009. [Google Scholar]
- e Silva, R.H.G.; Schwedersky, M.B.; da Rosa, Á.F. Evaluation of toptig technology applied to robotic orbital welding of 304L pipes. Int. J. Press. Vessel. Pip. 2020, 188, 104229. [Google Scholar] [CrossRef]
- Gomes de Oliveira, G.L.; Cordeiro de Miranda, H.; Farias, J.P. Residual stress evaluation in small diameter pipes welded using the orbital TIG process. Weld. Int. 2010, 24, 749–757. [Google Scholar] [CrossRef]
- Riffel, K.C.; Silva, R.H.G.E.; Dalpiaz, G.; Marques, C.; Schwedersky, M.B. Keyhole GTAW with dynamic wire feeding applied to orbital welding of 304L SS pipes. Soldag. Inspeção 2019, 24, e2418. [Google Scholar] [CrossRef]
- Baskoro, A.S.; Kiswanto, G.; Widyianto, A.; Panji, M. Influence of Welding Parameters on Macrostructure, Microstructure and Mechanical Properties in Orbital Pipe Welding of A36 Mild Steel Pipe. Int. J. Integr. Eng. 2021, 13, 288–296. [Google Scholar]
- McNair, S.A.; Chaharsooghi, A.S.; Carnevale, M.; Rhead, A.; Onnela, A.; Daguin, J.; Cichy, K.; Postema, H.; Bacchetta, N.; French, T.; et al. Manufacturing technologies and joining methods of metallic thin-walled pipes for use in high pressure cooling systems. Int. J. Adv. Manuf. Technol. 2022, 118, 667–681. [Google Scholar] [CrossRef]
- Robertson, S.; Penney, J.; McNeil, J.L.; Hamel, W.R.; Gandy, D.; Frederick, G.; Tatman, J. Piping and pressure vessel welding automation through adaptive planning and control. JOM 2020, 72, 526–535. [Google Scholar] [CrossRef]
- Kim, D.S.; Heo, S.H.; Heo, S.U.; Kim, J. Orbital-Rail-Type Automatic Inspection Device for Pipeline Welds Using Radiation Dose Prediction Results from FLUKA Simulation. Appl. Sci. 2024, 14, 6165. [Google Scholar] [CrossRef]
- García González, J.; Hernández-Ortega, J.J.; Jiménez-Ballesta, A.E.; Pedreño, R.Z. Analysis of Tube-to-Tubesheet Welding in Carbon Steel Heat Exchangers of a Double Plate Header Box. Materials 2021, 15, 261. [Google Scholar] [CrossRef]
- Mamvura, T.A.; Paterson, A.E.; Fanucchi, D. The impact of pipe geometry variations on hygiene and success of orbital welding of brewing industry equipment. J. Inst. Brew. 2017, 123, 81–97. [Google Scholar] [CrossRef]
- Shen, S.; Oguocha, I.N.A.; Yannacopoulos, S. Effect of heat input on weld bead geometry of submerged arc welded ASTM A709 Grade 50 steel joints. J. Mater. Process. Technol. 2012, 212, 286–294. [Google Scholar] [CrossRef]
- Rai, R.; Kelly, S.M.; Martukanitz, R.P.; DebRoy, T. A convective heat-transfer model for partial and full penetration keyhole mode laser welding of a structural steel. Metall. Mater. Trans. A 2008, 39, 98–112. [Google Scholar] [CrossRef]
- Benyounis, K.Y.; Olabi, A.G.; Hashmi, M.S.J. Effect of laser welding parameters on the heat input and weld-bead profile. J. Mater. Process. Technol. 2005, 164, 978–985. [Google Scholar] [CrossRef]
- Nowacki, J.; Rybicki, P. The influence of welding heat input on submerged arc welded duplex steel joints imperfections. J. Mater. Process. Technol. 2005, 164, 1082–1088. [Google Scholar] [CrossRef]
- Kumar, R. Defects Associated with Welding Techniques and Their Detection Methods. In Advanced Welding Techniques; CRC Press: Boca Raton, FL, USA, 2024; pp. 63–89. [Google Scholar]
- Singh, N.K.; Pradhan, S.K. Experimental and numerical investigations of pipe orbital welding process. Mater. Today Proc. 2020, 27, 2964–2969. [Google Scholar] [CrossRef]
- Baskoro, A.S.; Widyianto, A.; Prasetyo, E.; Kiswanto, G. The Taguchi and Response Surface Method for Optimizing Orbital Pipe Welding Parameters in Pulsed Current Gas Tungsten Arc Welding (PC-GTAW) for SS316L. Trans. Indian Inst. Met. 2024, 77, 1607–1620. [Google Scholar] [CrossRef]
- Mengistie, A.K.; Bogale, T.M. Development of automatic orbital pipe MIG welding system and process parameters’ optimization of AISI 1020 mild steel pipe using hybrid artificial neural network and genetic algorithm. Int. J. Adv. Manuf. Technol. 2023, 128, 2013–2028. [Google Scholar] [CrossRef]
- Widyianto, A.; Baskoro, A.S.; Kiswanto, G.; Ganeswara, M.F.G. Effect of welding sequence and welding current on distortion, mechanical properties and metallurgical observations of orbital pipe welding on SS 316L. East.-Eur. J. Enterp. Technol. 2021, 2, 110. [Google Scholar] [CrossRef]
- ASTM A276/A276M; Standard Specification for Stainless Steel Bars and Shapes. ASTM: West Conshohocken, PA, USA, 2023.
- Van Huong, H.; Nguyen, T.T.; Nguyen, V.T.; Nguyen, V.T.T. Material Strength Optimization of Dissimilar MIG Welding between Carbon and Stainless Steels. Metals 2024, 14, 1011. [Google Scholar] [CrossRef]
- American National Standards Institute. Specification for Welding of Austenitic Stainless Steel Tube and Pipe Systems in Sanitary (Hygienic) Applications (AWS D18.1/D18.1M:2009), 2nd ed.; AWS: Seattle, WA, USA, 2009; ISBN 978-0-87171-749-8. [Google Scholar]
- ISO 6892-1; International Standard. Metallic Materials-Tensile Testing-Part 1: Method of Test at Room Temperature. 3rd ed. International Organization for Standardization: Geneva, Switzerland, 2019.
- The American Society of Mechanical Engineers. An International Code 2019 ASME Boiler & Pressure Vesel Code. In Section IX: Welding, Brazing and Fusing Qualifications (ASME BPVC.IX-2019); The American Society of Mechanical Engineers: New York, NY, USA, 2019. [Google Scholar]
- Nguyen, T.T.; Hoang, V.H.; Nguyen, V.T.; Nguyen, V.T.T. Dissimilar MIG Welding Optimization of C20 and SUS201 by Taguchi Method. J. Manuf. Mater. Process. 2024, 8, 219. [Google Scholar] [CrossRef]
- Khdir, Y.K.; Kako, S.A.; Gardi, R.H. Study of Welding Dissimilar Metals—Low-carbon Steel AISI 1018 and Austenitic Stainless Steel AISI 304. Poly Tech. J. 2020, 10, 1. [Google Scholar] [CrossRef]
- Thien, T.N.; Thang, T.Q.; Hau, N.T. Effect of Orbital Welding Parameters on the Weld Geometry. Adv. Mater. Eng. Mater. 2022, 1066, 41–46. [Google Scholar] [CrossRef]
- Pu, J.; Zhao, Y.; Jiang, Y.; Zou, J.; Song, S. Influence of wire feeding speed on the melting behavior and formation of narrow-gap joint by laser welding with filler wire. J. Laser Appl. 2020, 32, 032007. [Google Scholar] [CrossRef]
- Huang, W.; Chen, S.; Xiao, J.; Jiang, X.; Jia, Y. Investigation of filler wire melting and transfer behaviors in laser welding with filler wire. Opt. Laser Technol. 2021, 134, 106589. [Google Scholar] [CrossRef]
- Zhao, Y.; Long, Y.; Li, Z. Research progress of transition layer and filler wire for laser welding of steel and aluminum dissimilar metals. Int. J. Adv. Manuf. Technol. 2022, 119, 4149–4158. [Google Scholar] [CrossRef]
- Chen, S.; Zhang, S.; Huang, N.; Zhang, P.; Han, J. Droplet transfer in arcing-wire GTAW. J. Manuf. Process. 2016, 23, 149–156. [Google Scholar] [CrossRef]
- Kumar, S.; Shahi, A.S. Effect of heat input on the microstructure and mechanical properties of gas tungsten arc welded AISI 304 stainless steel joints. Mater. Des. 2011, 32, 3617–3623. [Google Scholar] [CrossRef]


| Grade | C | Mn | Si | P | S | Cr | Ni | N |
|---|---|---|---|---|---|---|---|---|
| SUS 304 | 0.07 | 2.00 | 0.75 | 0.045 | 0.030 | 17.5–19.5 | 8.0–10.5 | 0.10 |
| Levels | Factors | |||
|---|---|---|---|---|
| Dw (mm) | I (A) | Vf (mm/s) | ||
| Low | 1 | 0.8 | 90 | 3.8 |
| Medium | 2 | 1.0 | 100 | 4.5 |
| High | 3 | 1.2 | 110 | 5.6 |
| Dw (mm) | I (A) | Vf (mm/s) | HI (kJ/mm) | |
|---|---|---|---|---|
| S1 | 0.8 | 90 | 3.8 | 0.26 |
| S2 | 0.8 | 100 | 4.5 | 0.29 |
| S3 | 0.8 | 110 | 5.6 | 0.32 |
| S4 | 1.0 | 90 | 4.5 | 0.26 |
| S5 | 1.0 | 100 | 5.6 | 0.29 |
| S6 | 1.0 | 110 | 3.8 | 0.32 |
| S7 | 1.2 | 90 | 5.6 | 0.26 |
| S8 | 1.2 | 100 | 3.8 | 0.29 |
| S9 | 1.2 | 110 | 4.5 | 0.32 |
| S1 | S2 | S3 | S4 | S5 | S6 | S7 | S8 | S9 | Marking Position | |
|---|---|---|---|---|---|---|---|---|---|---|
| 1 | 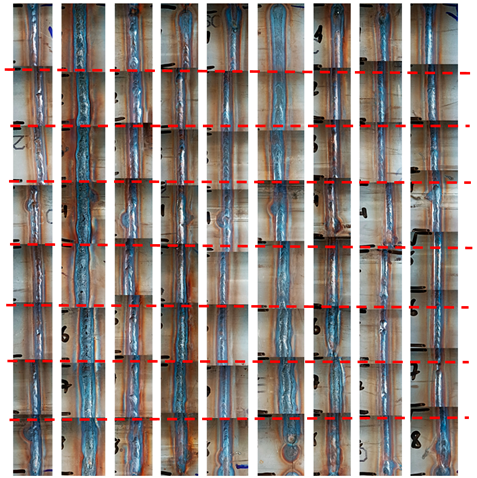 |  | ||||||||
| 2 | ||||||||||
| 3 | ||||||||||
| 4 | ||||||||||
| 5 | ||||||||||
| 6 | ||||||||||
| 7 | ||||||||||
| 8 | ||||||||||
| Samples | Critical Positions | |||
|---|---|---|---|---|
| (A) Max. Misalignment | (B) Max. Concavity | (C) Max. Convexity | (D) Min. Face Width | |
| S1 | P | F | P | P |
| S2 | P | F | F | P |
| S3 | P | P | P | P |
| S4 | P | P | P | P |
| S5 | P | P | P | P |
| S6 | P | P | P | P |
| S7 | P | P | P | P |
| S8 | P | F | P | P |
| S9 | P | P | P | P |
| Sample | S1 | S2 | S3 | S4 | S5 | S6 | S7 | S8 | S9 |
|---|---|---|---|---|---|---|---|---|---|
| UTS (MPa) | 72 | 385 | 255 | 206 | 196 | 562 | 132 | 172 | 184 |
| HI = 0.26 (kJ/mm) | HI = 0.29 (kJ/mm) | HI = 0.32 (kJ/mm) | ||||||
|---|---|---|---|---|---|---|---|---|
| Dw = 0.8 mm | ||||||||
 |  |  | ||||||
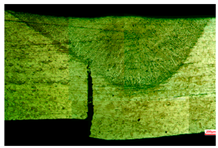
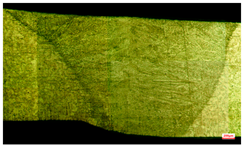
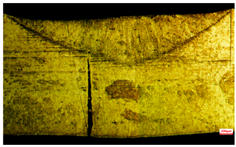
| S1 | D = 1.0 | W = 3.0 | S2 | D = 2 | W = 4.6 | S3 | D = 0.76 | W = 2.8 |
| = 3.8 | UTS = 72 | = 4.5 | UTS = 385 | = 5.6 | UTS = 255 | |||
| Dw = 1 mm | ||||||||
 |  |  | ||||||
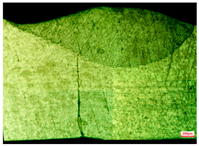
| S4 | D = 1.4 | W = 3.3 | S5 | D = 0.8 | W = 3 | S6 | D = 2 | W = 3.8 |
| = 4.5 | UTS = 206 | = 5.6 | UTS = 196 | = 3.8 | UTS = 562 | |||
| Dw = 1.2 mm | ||||||||
 |  |  | ||||||
| S7 | D = 0.8 | W = 3.5 | S8 | D = 0.7 | W = 2.9 | S9 | D = 0.72 | W = 3.5 |
| = 5.6 | UTS = 132 | = 3.8 | UTS = 172 | = 4.5 | UTS = 184 | |||
| Note | D: Depth of weld (mm) W: Width of weld (mm) : Wire feeding speed (mm/s) | UTS: ultimate tensile strength (MPa) HI: heat Input (kJ/mm) | 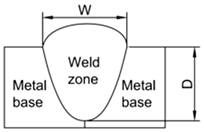 | |||||
| Level | Dw (mm) | I (A) | Vf (mm/s) |
|---|---|---|---|
| 1 | 45.66 | 41.95 | 45.62 |
| 2 | 49.04 | 47.42 | 47.76 |
| 3 | 44.14 | 49.47 | 45.46 |
| Delta | 4.90 | 7.53 | 2.30 |
| Rank | 2 | 1 | 3 |
| Dw (mm) | I (A) | Vf (mm/s) | HI (kJ/mm) |
|---|---|---|---|
| 1 | 110 | 4.5 | 0.32 |
Disclaimer/Publisher’s Note: The statements, opinions and data contained in all publications are solely those of the individual author(s) and contributor(s) and not of MDPI and/or the editor(s). MDPI and/or the editor(s) disclaim responsibility for any injury to people or property resulting from any ideas, methods, instructions or products referred to in the content. |
© 2025 by the authors. Licensee MDPI, Basel, Switzerland. This article is an open access article distributed under the terms and conditions of the Creative Commons Attribution (CC BY) license (https://creativecommons.org/licenses/by/4.0/).
Share and Cite
Ngoc, T.T.; Nguyen, V.-T.; Do, T.T.; Hoang, V.H.; Ngoc Huy, D.; Tan Phat, H.; Nguyen, V.T.T. Parameter Optimization of Orbital TIG Welding on Stainless Steel Pipe. Appl. Sci. 2025, 15, 3227. https://doi.org/10.3390/app15063227
Ngoc TT, Nguyen V-T, Do TT, Hoang VH, Ngoc Huy D, Tan Phat H, Nguyen VTT. Parameter Optimization of Orbital TIG Welding on Stainless Steel Pipe. Applied Sciences. 2025; 15(6):3227. https://doi.org/10.3390/app15063227
Chicago/Turabian StyleNgoc, Thien Tran, Van-Thuc Nguyen, Thanh Trung Do, Van Huong Hoang, Dinh Ngoc Huy, Ha Tan Phat, and Van Thanh Tien Nguyen. 2025. "Parameter Optimization of Orbital TIG Welding on Stainless Steel Pipe" Applied Sciences 15, no. 6: 3227. https://doi.org/10.3390/app15063227
APA StyleNgoc, T. T., Nguyen, V.-T., Do, T. T., Hoang, V. H., Ngoc Huy, D., Tan Phat, H., & Nguyen, V. T. T. (2025). Parameter Optimization of Orbital TIG Welding on Stainless Steel Pipe. Applied Sciences, 15(6), 3227. https://doi.org/10.3390/app15063227