Review

Detecting Defects in Materials Using Nondestructive Microwave Testing Techniques: A Comprehensive Review

by
Ahmad Ghattas
,
Ramzi Al-Sharawi
,
Amer Zakaria
* and
Nasser Qaddoumi
Department of Electrical Engineering, American University of Sharjah, Sharjah P.O. Box 26666, United Arab Emirates
*
Author to whom correspondence should be addressed.
Appl. Sci. 2025, 15(6), 3274; https://doi.org/10.3390/app15063274
Submission received: 20 February 2025 / Revised: 11 March 2025 / Accepted: 12 March 2025 / Published: 17 March 2025
(This article belongs to the Section Electrical, Electronics and Communications Engineering)

Abstract

:
Microwave nondestructive testing (MNDT) has shown great potential in detecting defects in various materials. This is due to it being safe and noninvasive. Safety is essential for the operators as well as the specimens being tested. Being noninvasive is important in maintaining the health of critical structures and components across various industries. In this paper, a review of MNDT methods is given with a comparison against other NDT techniques. First, the latter techniques are described, namely testing using a dye penetrant, ultrasound, eddy currents, magnetic particles, or radiography. Next, an overview of various microwave NDT methods is provided through a review of the applications, advantages, and limitations of each technique. Further, a detailed review of emerging MNDT techniques like microwave microscopy, active microwave thermography, and chipless radio frequency identification is presented. Next, a brief description of current and emerging algorithms employed in MNDT is discussed, with emphasis on those using artificial intelligence. By providing a comprehensive review, this article aims to shed light on the current state of MNDT, thus serving as a reference for subsequent innovations in this rapidly evolving domain.

1. Introduction

Nondestructive testing (NDT), also referred to as nondestructive inspection (NDI) or nondestructive evaluation (NDE), refers to a set of analysis techniques used in various fields and industries to inspect and test the properties of a material, component, or system without causing damage. The nondestructive nature of theses evaluations makes them ideal for ongoing monitoring and quality control during manufacturing or in-service inspections [1]. They offer cost-effectiveness by preventing the unnecessary destruction of utilizable parts while ensuring safety and reliability by detecting potential failures before they occur. On the other hand, destructive testing, which involves subjecting a test sample to failure conditions, provides definitive results about the material’s properties under specific conditions; however, this comes at the expense of the sample. Thus, destructive testing is less suitable for finished goods or applications where preserving the item’s integrity is critical. Nondestructive and destructive testing are fundamental approaches that are used across various industries, each having distinct applications, advantages, and limitations.
NDT is widely used in sectors where component failure could lead to significant hazards or economic losses [2]. For example, inspecting aircraft components and structures in the aviation sector is essential for ensuring safety without causing any damage or changes to the objective under test [3,4]. Similarly, in the oil and gas industry, NDT is used for pipeline and infrastructure inspection to prevent leaks and guarantee operational safety without affecting the integrity of the structure under test [5,6]. In the manufacturing industry, NDT serves the purpose of quality control by verifying the integrity of products without affecting their usability [7]. This technique is also vital in the civil infrastructure domain, where it is applied to bridges [8,9], buildings [10], and other critical structures to detect potential failures and enhance safety without damaging them [11,12]. NDT is also employed in the transportation sector, which encompasses rail [13], automotive [14], and maritime areas [15], to conduct thorough inspections of vehicles and infrastructure without interrupting transportation operations. By integrating NDT into regular maintenance and inspection routines, these industries can significantly reduce the risk of unexpected failures, thus improving efficiency across operations [16].
On the contrary to NDT, destructive testing involves evaluating a material’s properties by intentionally making it fail. It is primarily used to determine material properties such as tensile strength, ductility, and hardness through various tests. Typically, destructive testing is used for testing prototypes from batches in industries where the loss of one component is not economically critical. However, it is often not cost-effective or feasible to apply destructive testing to large and expensive structures such as bridges, large machinery, and aircraft prototypes, owing to the associated heavy losses yielded by taking such structures to failure.
The objective of this paper is to conduct a comprehensive review of NDT techniques and methodologies, with a focus on microwave NDT (MNDT) techniques. This study distinguishes between traditional NDT and MNDT techniques by providing an in-depth analysis of each method. In Section 2, such distinction is achieved by initially exploring the practical applications, benefits, and inherent limitations of standard NDT techniques. Next, in Section 3 and Section 4, this review shifts attention towards MNDT, showing recent progress in the field and comparing diverse strategies for defect detection. Finally, traditional algorithms used in MNDT are discussed and compared against emerging algorithms that utilize artificial intelligence (AI) in Section 5. This detailed examination not only highlights the current state of MNDT but also identifies future directions and potential improvements in the method, particularly through the adoption of cutting-edge computational tools. The review is concluded by a brief discussion and conclusion in Section 6 and Section 7.

2. Standard Nondestructive Testing and Evaluation Techniques

The detection of flaws in materials and structures is crucial since their presence can have significant implications on safety, reliability, and performance. Researchers are constantly investigating different techniques and methods for detecting cracks in materials, components, and assemblies without destroying their serviceability. The most common of such nondestructive methods is discussed below.

2.1. Dye Penetrant Testing

One traditional NDT technique is dye penetrant testing, also called penetrant inspection (PI) or liquid penetrant testing (LPT). This technique is demonstrated in Figure 1. First, a dye or liquid penetrant is applied onto the surface of interest. The penetrant is then kept for sufficient time to allow for it to infiltrate into any defects present on the surface. After enough time has passed, the excess penetrant is removed, keeping only that which penetrated the defects. Next, a developer is applied to the specimen to make the defect with the penetrant more visible under normal lighting conditions or ultraviolet light [17].
Given its simplicity, this technique is typically not researched much but is used to compare it with other methods. For example, Endramawan et al. [18] conducted tests on shielded metal arc welding (SMAW) butt joints using dye penetrant (PT) and ultrasonic testing (UT). The tests were to distinguish the resulting discontinuity and determine acceptance criteria per the standards outlined by the American Society of Mechanical Engineers (ASME) [19]. Using this procedure, [18] used dye penetrant testing to yield indications of porosity defects on the surfaces of their investigated specimens, highlighting the effectiveness of PT in detecting surface-level defects compared to UT.

2.2. Ultrasonic Testing

Ultrasonic testing (UT) is an NDT technique that employs high-frequency (HF) sound waves to characterize and inspect internal defects or cracks in materials. Figure 2 shows two diagrams that depict the principle of ultrasound testing [12]. In Figure 2a, we can see that an ultrasonic source emits sound waves onto an obstacle, and a detector co-located with the source measures the reflected waves. Furthermore, the reflections are utilized to measure the defects mostly on the surface. Another UT technique is shown in Figure 2b, where acoustic waves are transmitted through the specimen. The source and detector are not co-located and are positioned at different points. The reflections are utilized to detect internal cracks.
Various works exist within the literature that utilize this NDT technique. For example, Kouche et al. [20] described the integration of ultrasonic-based NDT with wireless sensor networks (WSNs) to monitor materials continuously. Kouche’s proposed system was successfully deployed to monitor the thickness of tungsten and steel compound metal sheets used in vibration screens. Thus, such an WSN-based NDT technique proved its effectiveness in achieving low-cost, real-time wireless material examination, paving the way for its practical use [20].
Similarly, Sharma et al. [21] reviewed studies on the use of UT for defect detection on metallic, nonmetallic, and plastic pipes, with the results presented as ultrasonic C-scans. Their review highlights UT’s effectiveness in detecting defects smaller than 0.8 mm in size [21].
Furthermore, Zhukov et al. [22] utilized UT to investigate the structure and dimensions of inclusions found within the defective metallic pipes in natural gas pipelines. Their system detected defects at various depths in the metallic pipes; their solution showed UT’s effectiveness in detecting defects at multiple depths within a material [22].
UT methods were utilized to characterize and evaluate the performance of carbon-fiber-reinforced polymers (CFRPs) and glass-fiber-reinforced polymers (GFRPs) that are used in many applications [23,24,25,26]. In [23], Helfen et al. utilized two different UT methods to determine various parameters about the CFRP. Mahmoud et al. [24] used UT testing to study CFRP–concrete specimens subjected to accelerated aging conditions. In [25], Bastianini et al. used pulsed UT testing to evaluate the bonding between composite materials and substrates; here, different composite materials (CFRPs and GFRPs) were applied to various substrates (concrete, masonry, and polyurethane). Lastly, in [26], Berketis et al. utilized the UT method to monitor the damage and degradation of wet GFRP composites.
A sub-field of UT, termed guided wave ultrasonic testing (GWUT), is used in buried metallic pipeline systems. The waves in GWUT can propagate along pipes in circumferential and longitudinal directions, providing an advantage over the purely longitudinal nature of UT waves [27]. Using this approach, Shah et al. [5] presented a paper on detecting cracks in polyethylene pipes. A laboratory experiment was conducted using an ultrasonic testing system made of low-priced piezoceramic transducers arranged in a pitch–catch configuration. The authors of [5] found that detecting cracks with lengths smaller than the wavelength of the interacting acoustic wave mode requires greater crack depth for detection. On the other hand, cracks with lengths greater than or equal to the interacting mode wavelength are comparatively easier to detect [5].
It is worth noting that, despite its various advantages, UT faces limitations in terms of measuring materials with minimal thickness, making these approaches less suitable for assessing thin structures. Additionally, evaluating materials like cast iron using UT presents challenges due to limited sound transmission and significant attenuation in conductors [28].

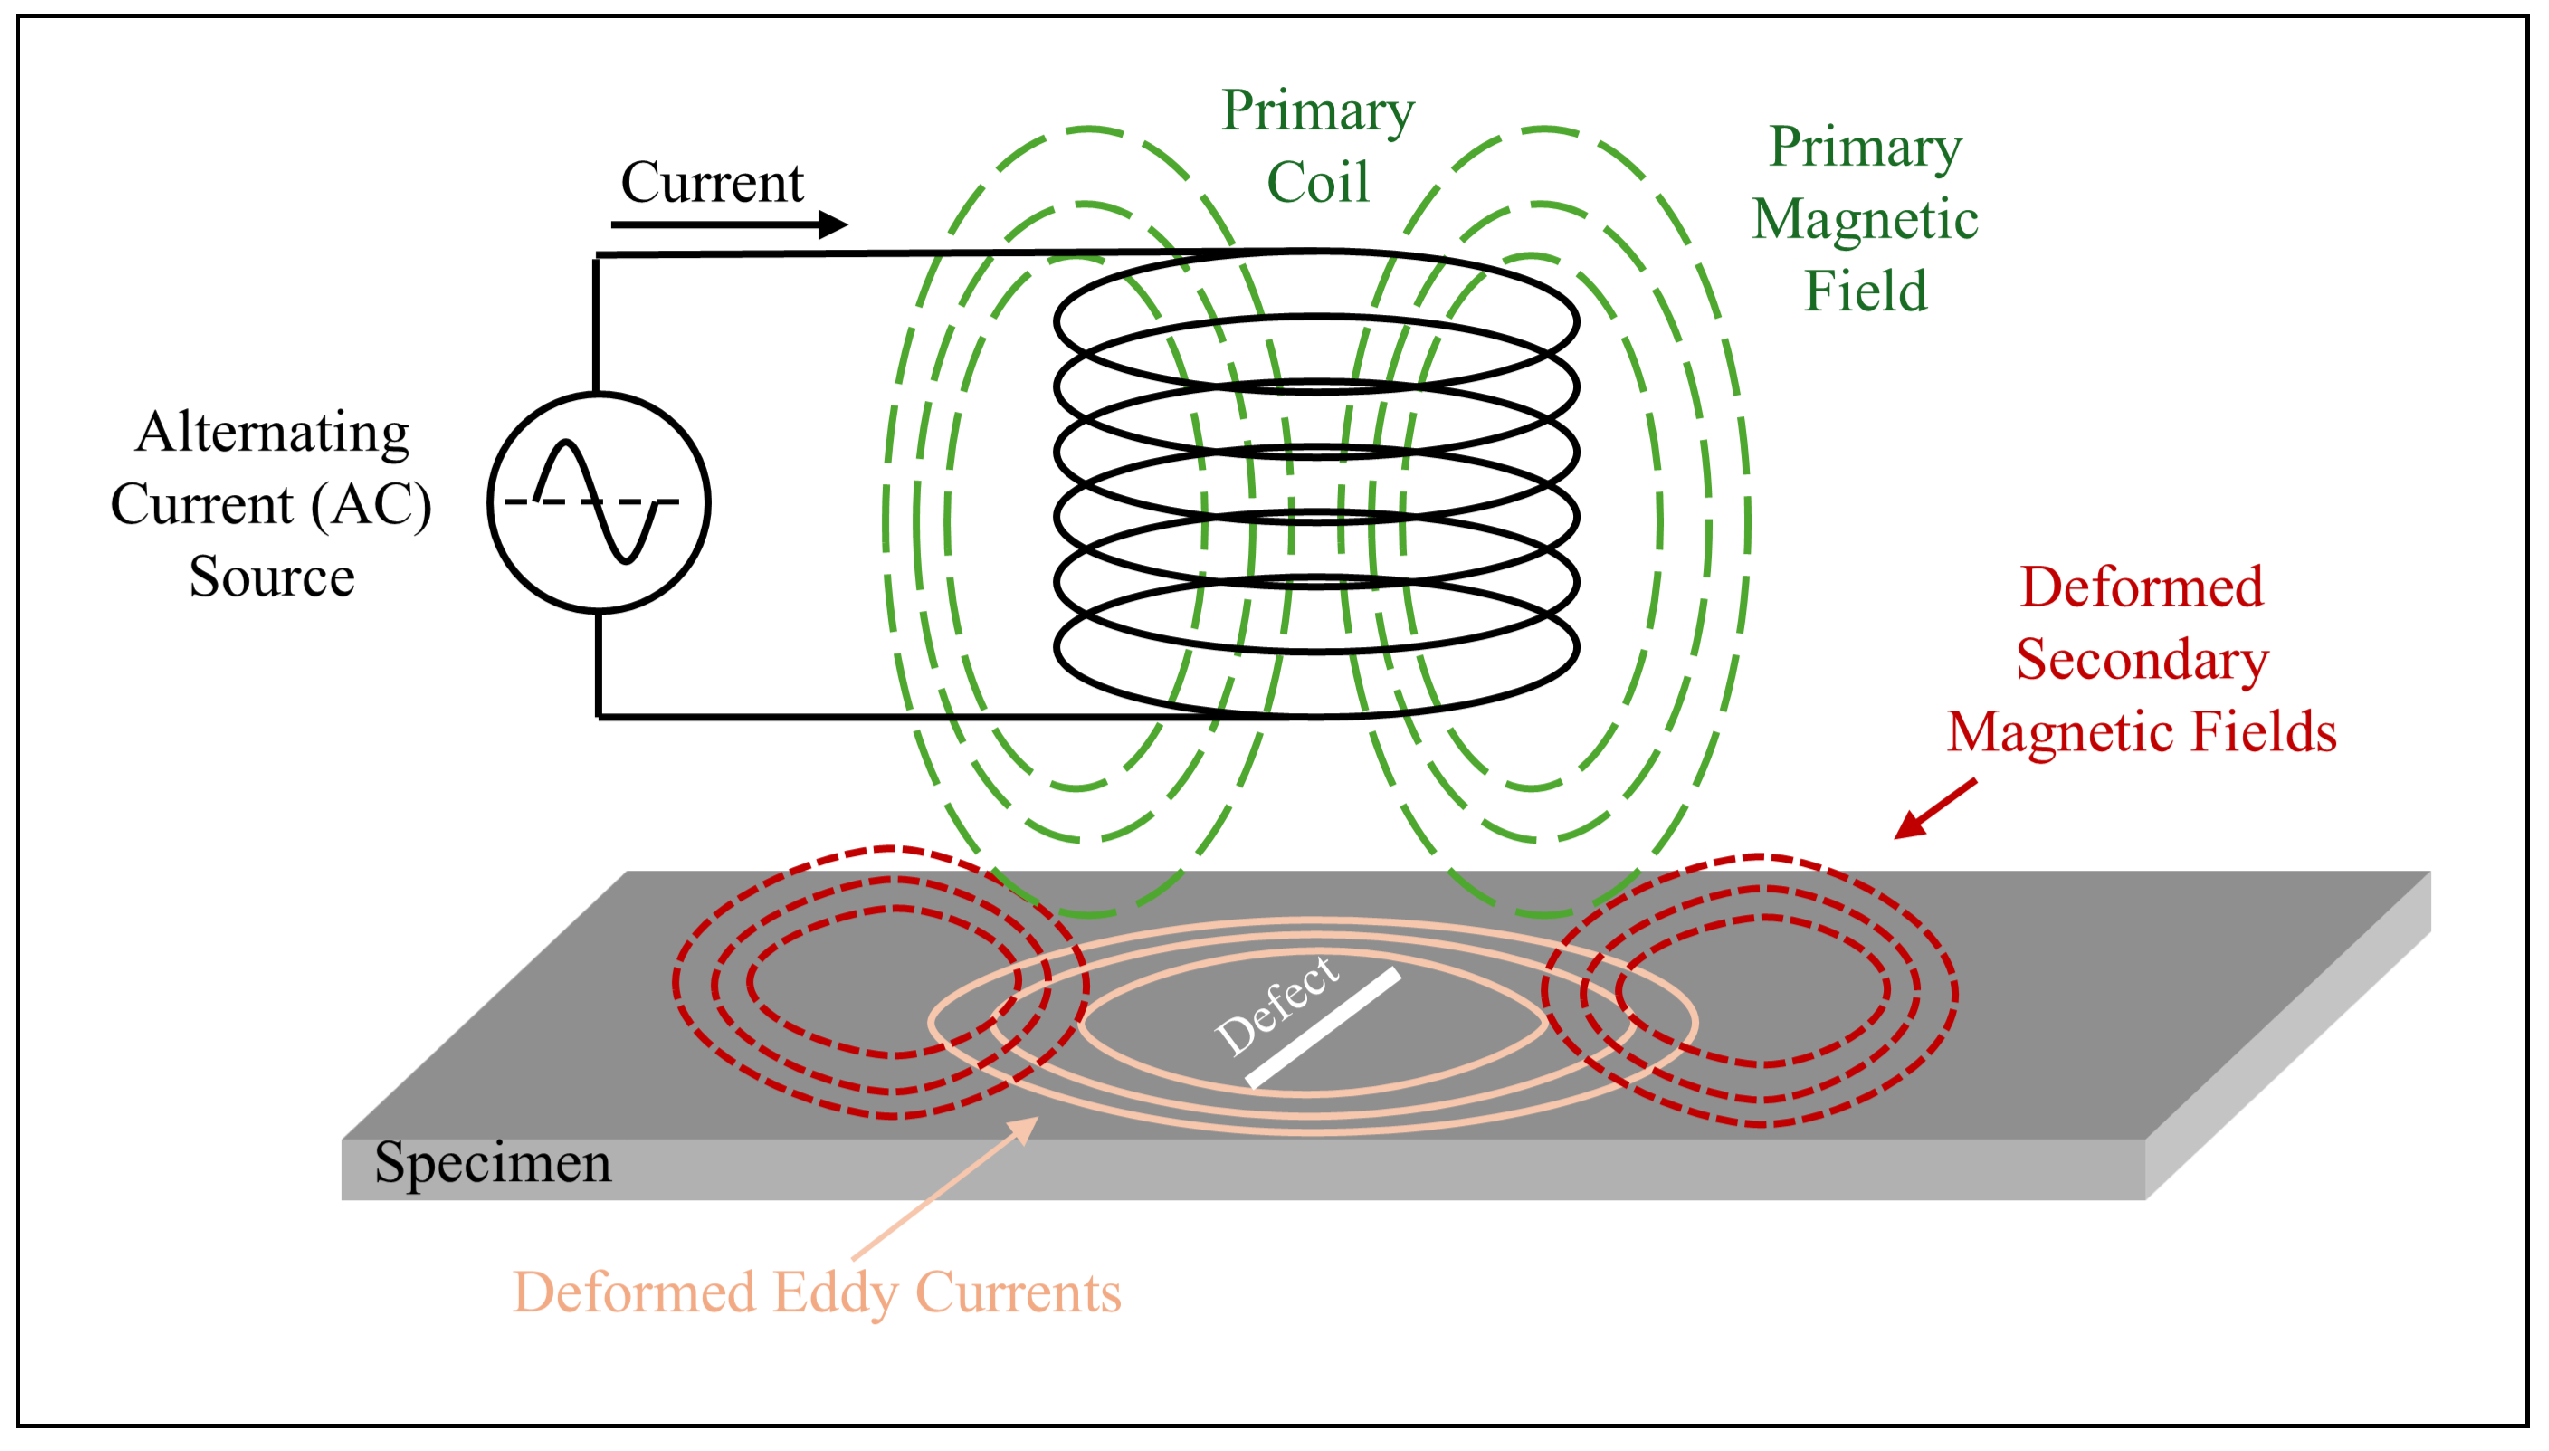
2.3. Eddy Current Testing

Eddy current testing (ECT) is an NDT technique that uses the principle of electromagnetic induction to inspect and characterize materials [29]. Figure 3 shows a demonstration of ECT. A primary coil generates a magnetic field transmitted to the inspected specimen, which should be conductive. This primary magnetic field induces a current on the specimen, generating a secondary magnetic field. Another coil measures this secondary magnetic field. Furthermore, the presence of a defect deforms the induced current on the specimen surface, which in turn changes the secondary magnetic field. This secondary field is measured using the receiver coil, which enables the detection of the defect.
ECT has been researched thoroughly in the literature. For example, the authors of [6] investigated a pipe crack detection system using an ECT platform. This paper presented a novel design for a probe incorporated into a distributed ECT system. The system is distributed because the probe consists of a rotating excitation primary coil and an array of receiver coils; this enables the probe to rotate inside a pipe while conducting measurements. Moreover, the system was utilized to inspect cracks within the interior of a carbon steel pipe sample in colorredreal time. Their methodology demonstrated that their system was highly efficient in detecting defects, with a maximum percentage error of −2.11% for a circumferential defect within the pipe [6], thus advocating for ECT’s usability in accurate defect detection.
Another example is in the paper by Santos et al. [30], where the system utilized a phased array ultrasound to detect volumetric defects within a weld bead volume, with ECT being used to identify surface and subsurface cracks [30]. The phased array ultrasound results showcased that temperature affects sound attenuation, thus the detection ability; this can be compensated for up to 200 ° C. In contrast, the eddy current results showed no notable influence for temperatures up to 300 ° C [30].
A third example is the system in Ulapane et al. [31], which utilized pulsed eddy current (PEC) sensing to inspect defects or cracks in the critical water pipe sectors. PEC signals have a broad frequency spectrum; thus, they can penetrate into different depths within the specimen. This enables the extraction of more information about the specimen under test. The authors designed and implemented an exciter–detector coil sensor and presented a calibration strategy. Furthermore, they investigated the effect of various parameters like lift-off on the accuracy of estimating thickness.
Despite the successes with ECT, a major concern is its poor effectiveness when used on materials or pipes with low electrical conductivity, which might be the case in some industries and applications.

2.4. Magnetic Particle Testing

Another type of NDT technique is magnetic particle testing (MPT). First, the specimen is magnetized, which is followed by applying magnetic particles. The presence of defects in the specimen will result in magnetic flux leakage. Therefore, the magnetic particles will aggregate together and be attracted to the defect location [32]. A diagram to demonstrate the MPT principle is shown in Figure 4.
In the literature, MPT stands out as an optimal choice within the aerospace industry, proving to be highly effective in identifying defects within critical components such as landing gear, engine parts, and various structural elements [3].
Ito and Nishimura presented another application of the MPT technique [33], where microcapsules were introduced to fluorescent magnetic particles to detect cracks in pipes. The results show that this approach can be valuable for elemental analysis at specific locations, such as narrow areas, where other NDT techniques are impractical.
In addition, researchers have used MPT to locate and size stress corrosion cracks (SCCs) in pipelines before performing incremental grinding to determine the crack’s depths. Using MPT yielded precise measurements regarding the location and size of the SCCs [34].
Zolfaghari et al. [35] also studied the sensitivity and reliability of MPT for detecting surface defects in welded materials. The technique presented in this study had a sensitivity parameter with a detection rate at 0.5 mm intervals of the crack lengths and could detect all cracks and defects beyond 2.5 mm.
Despite its ability to finely detect cracks, a significant limitation of MPT is its incompatibility with non-magnetic materials, restricting its application scope.

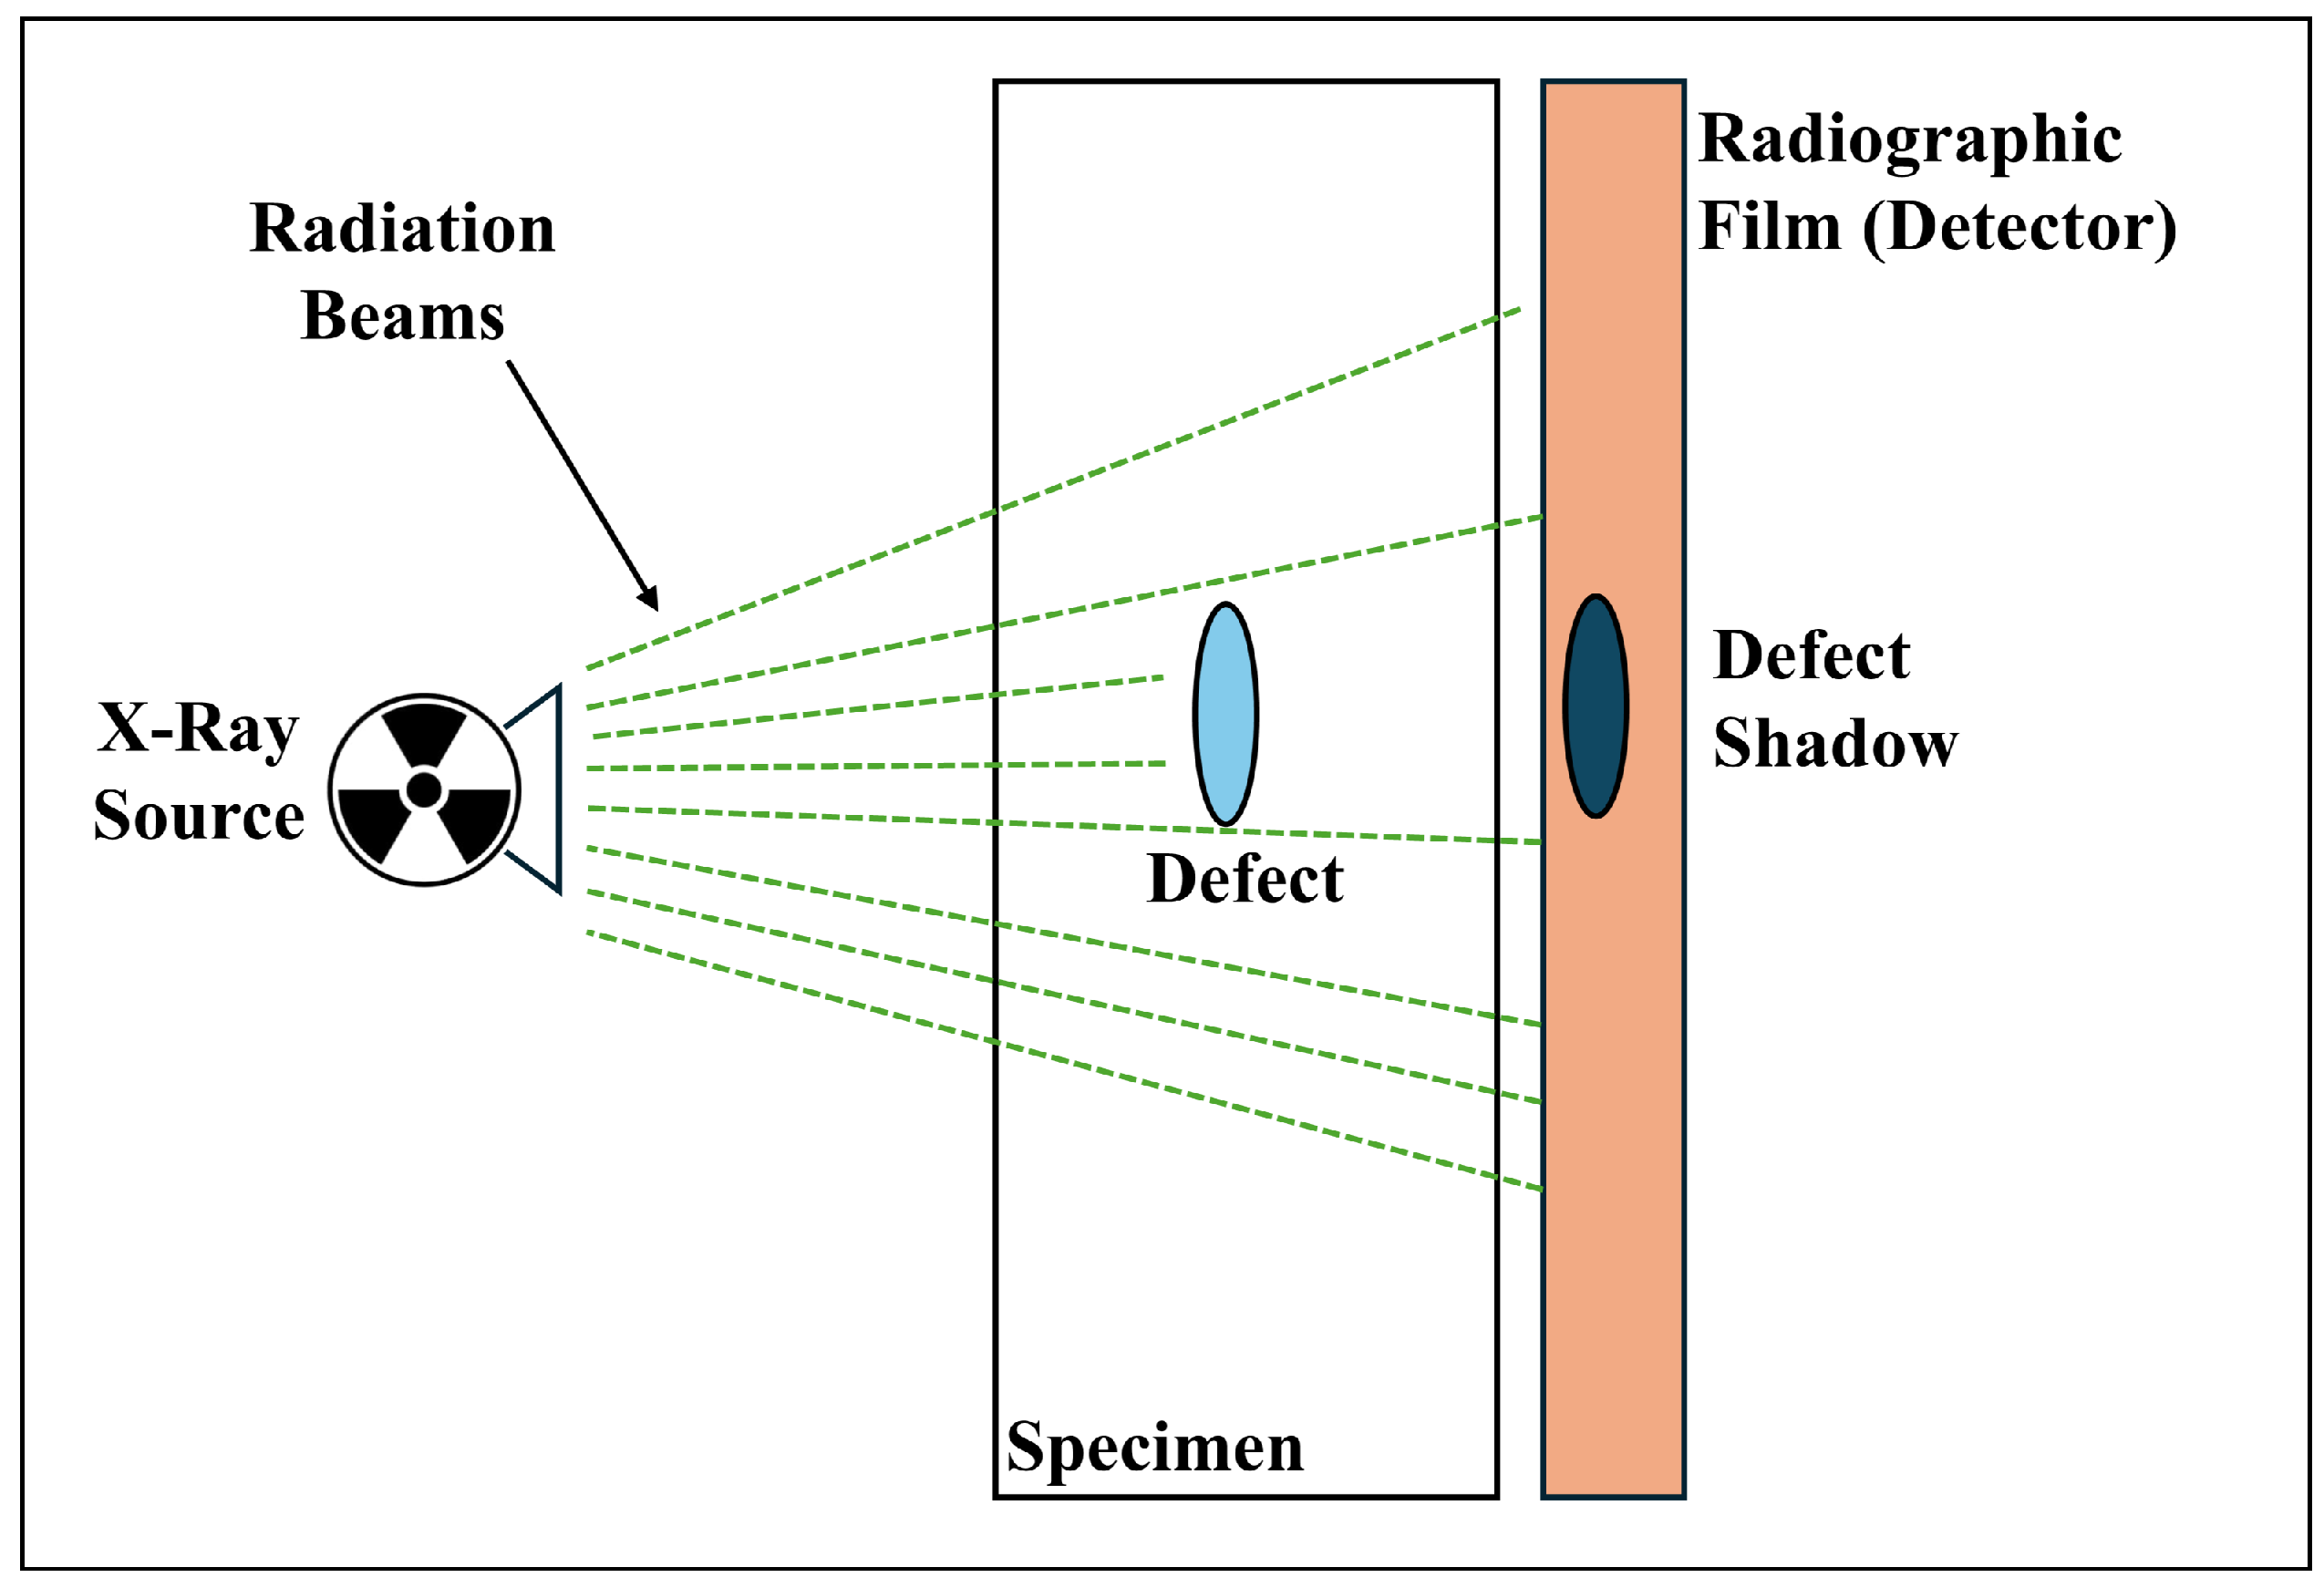
2.5. Radiography Testing

Another type of NDT technique usually used for crack detection is radiography testing. This technique involves utilizing ionizing radiation such as gamma rays or X-rays to penetrate the component of interest, with the resulting shadow image being captured on a film or digital detector. A diagram demonstrating X-ray radiography is shown in Figure 5.
Shafeek et al. [36] utilized such an approach and developed an innovative automatic vision system to inspect and detect welding cracks in gas pipelines from their corresponding radiographic images. The presented system would process radiographic images and employ diverse computer vision and image processing algorithms. The goal was to identify welding defects and compute essential parameters, including dimensions such as the area, width, length, and perimeter of the detected cracks [36]. The advantages of their system included its low cost, high accuracy in detecting welding defects, and the elimination of the need for skilled inspectors to interpret the images [36].
Further, the authors in [37] introduced an approach for characterizing pipeline defects by capturing a limited number of radiographs from various angles around the pipe. The results of this approach were accurate to within ± 3 mm for lateral and axial dimensions. The experimental results in this approach were compared against simulation examples. The types of inspected defects included inner wall flat-bottomed holes and inner wall corrosion patches.
It is worth noting that, while radiography testing offers the advantage of providing in-depth visuals of the internal composition of materials, it is associated with potential health risks and environmental implications due to ionizing radiation exposure.

2.6. Conclusion and Comparison to MNDT

Descriptive summaries of standard nondestructive techniques are provided in Table 1. Furthermore, according to various sources in the literature, a quantitative comparison between traditional NDT techniques and MNDT techniques is given in Table 2. It should be noted here that the values in Table 2 are approximate as they are dependent on the material under test, equipment, and testing condition.
While the standard NDT techniques are well-established and widely used across various industries, MNDT provides unique advantages. For example, compared to standard NDT, MNDT can achieve greater penetration depths in nonmetallic materials, such as composites, plastics, and ceramics [38], making it particularly useful for inspecting thick or multilayered structures.
Moreover, microwaves are sensitive to material properties such as permittivity and conductivity, allowing for detailed material characterization and detection of defects and material conditions, which might not be possible with other NDT techniques [39].
Additionally, MNDT utilizes low-power non-ionizing radiation. This makes MNDT safe for the operator, the specimen under test, and the surrounding areas; thus, no radiation shielding or extensive safety precautions are required [40]. The latter might not be true for traditional NDT methods like radiography testing.
Furthermore, many MNDT devices are portable and adaptable to various inspection environments, with this versatility proving to be particularly useful for infrastructure and on-site inspections where mobility and adaptability are crucial [41].
Aside from technical advantages, MNDT is more cost-effective for specific applications than standard NDT, particularly in terms of operational costs, maintenance costs, and inspection speed, which can lead to reduced downtime and increased productivity [42,43].
The forthcoming section describes the applications, techniques, and previous work on MNDT techniques for crack detection.
Table 1. Overview of standard NDT techniques.
NDT TechniqueWorking PrincipleAdvantagesLimitationsApplications
Visual inspectionDirect observation
  • Simple
  • Cost-effective
  • Immediate results
  • Only detects surface defects
  • Skill-dependent
  • Welding [44]
  • Structures [45]
Dye penetrant testingDye reveals surface defects
  • Sensitive to small defects
  • Used on a variety of materials
  • Only detects surface defects
  • Requires clean surfaces
Ultrasonic testingSound waves detect flaws
  • High depth of penetration
  • Accurate positioning and sizing defects
  • Requires expertise
  • Surface preparation needed
  • Thickness measurement [20,22]
  • Internal flaws detection in metal [27]
  • Welding [18,47]
  • Composites monitoring and characterization [23,24,25,26]
Eddy current testingElectric currents identify defects
  • High sensitivity to surface defects
  • Portable
  • Only applicable to conductive materials
  • Limited depth
  • Coating thickness measurements [31]
  • Crack detection [6,30,31,48]
Magnetic particle testingMagnetic fields highlight flaws
  • High sensitivity
  • Immediate
  • Only applicable to ferromagnetic materials
  • Surface assessment needed
  • Automotive cracks [33,34,35]
  • Aerospace [3]
Radiography testingX-rays/gamma rays image defects
  • Deep and surface detection
  • Permanent record
  • Use of ionizing radiation
  • High cost
  • Casting inspection [49,50]
  • Pipelines integrity assessment [36,37]
Table 2. Quantitative comparison of NDT techniques.
NDT TechniqueMinimum Detectable
Defect Size
Penetration DepthRelative Cost
Dye penetrant testing≈0.02–0.1 mmSurface onlyLow
Ultrasonic testing≈0.1–1 mmUp to several 100 mm
(dependent on frequency)
Moderate–high
Eddy currents testing≈0.01–0.5 mm≈1–10 mm
(dependent on material
conductivity and frequency)
Moderate
Magnetic particle testing≈0.05–0.2 mm≈1–2 mm
(surface and near-surface)
Low–moderate
Radiography testing≈0.1–1 mmSeveral centimeters to decimeters
(dependent on radiation energy)
High
Microwave testing≈0.5–2 mmSeveral millimeters to centimeters
(dependent on material’s
electric properties and frequency)
Moderate

3. Microwave NDT Techniques

Microwave nondestructive testing (MNDT) and evaluation refers to techniques that utilize electromagnetic signals at frequencies in the range of 300 MHz to 300 GHz to inspect materials and identify potential defects noninvasively and without causing damage [38,51,52].
MNDT was introduced in the 1950s, garnering additional interest in the 1960s [38]. The 1990s marked a significant revival in research and development activities in this field, which was expanded to encompass nondestructive evaluation (NDE), where material properties were quantitatively analyzed [38,53]. Initially regarded as “emerging techniques”, microwave methods have gained substantial recognition over time due to their increasing applicability. As a testament to their established status, the American Society for Nondestructive Testing (ASNT) officially acknowledged MNDT as a distinct method in 2016 [38,42].
Microwave inspection techniques depend on two propagation phenomena: reflection and transmission. Each behavior offers subtle and detailed insights into the material’s structure and properties [38]. In reflection, the transmitted microwave signals are reflected from the structure, with varying amplitude and phase, revealing microstructural details about the inspected object [38]. Conversely, transmission involves microwave signals penetrating the specimen, where the data captured on the opposite side are analyzed for dielectric behavior, material loss, and the intricate interplay of porosity and permeability with frequency and temperature [38,54,55]. Advanced modeling and validation techniques link these characteristics to critical material properties, enhancing the precision and applicability of MNDT.
Furthermore, MNDT techniques can be divided into five methods: far-field, near-field, resonance, microwave imaging, and reflectometry. The common thing with all these methods is that they utilize the reflection and transmission phenomena to inspect the object under test. Nevertheless, these methods are different in various aspects. A description of each MNDT method is given in the following sections.

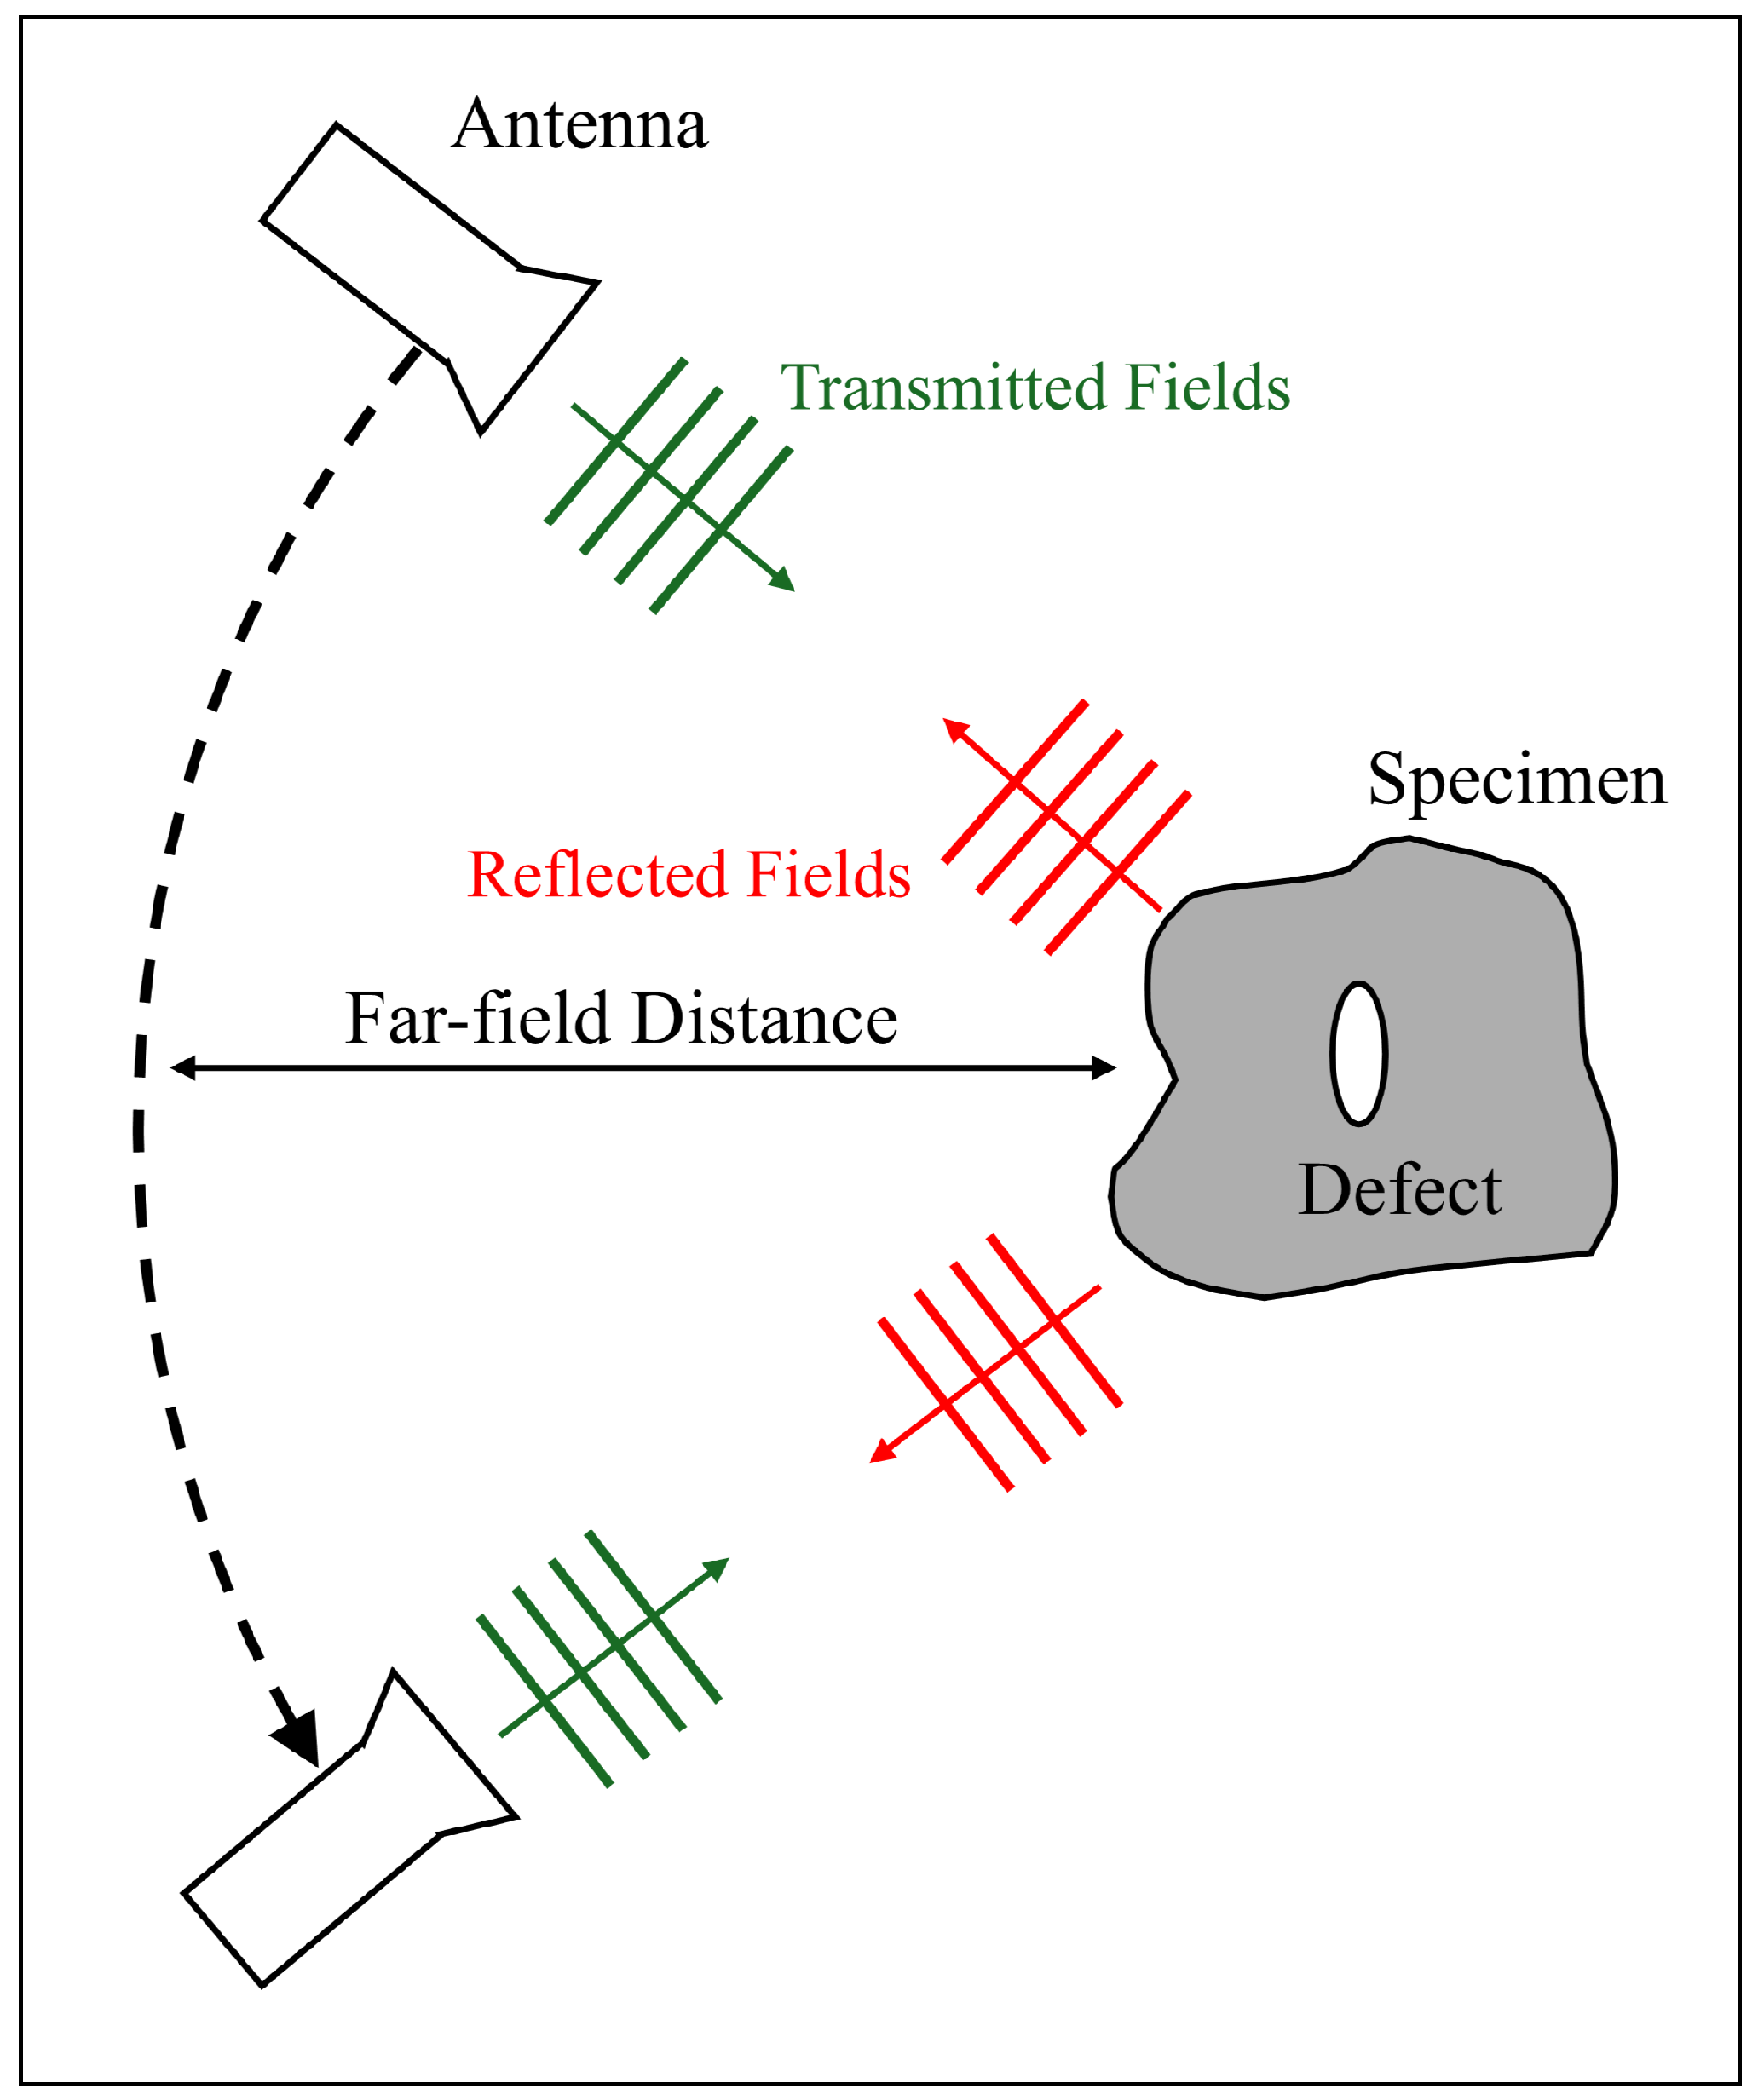
3.1. Far-Field Method

Microwave NDT techniques can be segmented into two main sub-methods: far-field and near-field. The terms far-field and near-field represent regions of the electromagnetic field (EM) radiation surrounding a microwave source. The boundary between these two regions relies on the predominant wavelength ( λ ) of the electromagnetic signal produced by the source and the largest dimension (D) of the source’s antenna [56]. The wavelength ( λ ) is calculated as the ratio of the speed of the electromagnetic signal in a medium (u) to its frequency (f), that is,
λ = u f .
Furthermore, the far-field region occurs when the sample is 2 D 2 / λ away from the source.
Hence, the far-field NDT method, as the name suggests, utilizes the propagation characteristics of microwave signals in the far-field region. Since the object under test is “far” from the source, it enables the detection of flaws, structural anomalies, or material properties in a noninvasive manner, with a large inspection area. Generally, researchers commonly use the far-field method to detect defects and cracks when contact or near-contact measurements pose challenges.
Figure 6 depicts a far-field system. An antenna radiates a specimen with an electromagnetic signal. This antenna is located at the far-field region with respect to the specimen. Furthermore, the same antenna measures the reflected signal from the specimen with a defect. This is repeated for different locations of the antenna surrounding the specimen. Using complex algorithms, the received signals from the different antenna locations are used to create an image of the specimen to locate the defect.
With its popularity, the far-field method has been investigated heavily in the literature, with one notable research path being incorporating far-field technology into synthetic aperture radars (SARs) for imaging and detecting exposed or covered defects [57]. The following are some examples of research utilizing the SAR far-field method.
Arunachalam et al. [58] investigated the potential use of a far-field MNDT technique for imaging concrete through experimental tests and numerical simulations on cement-based samples. Their method employed far-field microwave reflection coefficients, and it achieved promising results.
Another application example is that of Büyüköztürk et al. [59], who utilized a far-field antenna to detect damage and defects in glass-fiber-reinforced polymer (GFRP) wrapped in concrete columns. The noninvasive measurements indicated that there was an increase in the concrete strength of the GFRP and bar deformation coefficient, leading to a likely shift in the bond failure mode of the composite structure [59]. Despite the results, this study has limitations, as one significant constraint is the requirement for extensive spatial and frequency bandwidths to achieve accurate imaging results [60]. This demand can lead to challenges in the operational efficiency of data processing.
Using polarimetric SAR, Abou-Khousa et al. [61] explored the detection of randomly oriented cracks hidden beneath a thick dielectric layer by studying notches concealed under a 6.25 mm thick Teflon insulator. They utilized six 0.25 mm wide electrical discharge machining (EDM) notches and a single dual-polarized circular aperture antenna combined with synthetic aperture radar imaging [61].
Another far-field method used in material characterization is the processing of commodity Wi-Fi signals transmitted through a specimen [62,63]. In this method, Wi-Fi signals are radiated through a sample, and the received Wi-Fi signals’ channel state information (CSI) is analyzed. The collected CSI is utilized to identify the type of materials in the specimen. This method was successful in distinguishing between different constructive materials [62] and in identifying composites in various concrete mixtures [62].
In addition to SAR and Wi-Fi, a common application in far-field MNDT is ground-penetrating radar (GPR) [64]. In this method, the device is placed on a surface and transmits electromagnetic pulses. The reflected signals, measured by the device, are processed to create a subsurface image. GPR is commonly used in various industrial applications such as archaeology [65], civil engineering [66], and geology [67]. GPR has several advantages, such as providing high-resolution, real-time results. Nevertheless, the GPR results are highly affected by surface properties such as its conductivity and roughness. Additionally, operator expertise may be required to interpret the GPR images in some cases.
In summary, despite the advantages of far-field MNDT, the multidimensional and complex nature of the data may necessitate expertise and sophisticated algorithms to interpret them. Such sophistication hardens the analysis of the results, thus requiring advanced knowledge in signal processing [68], which might make other MNDT methods more favorable in specific applications.

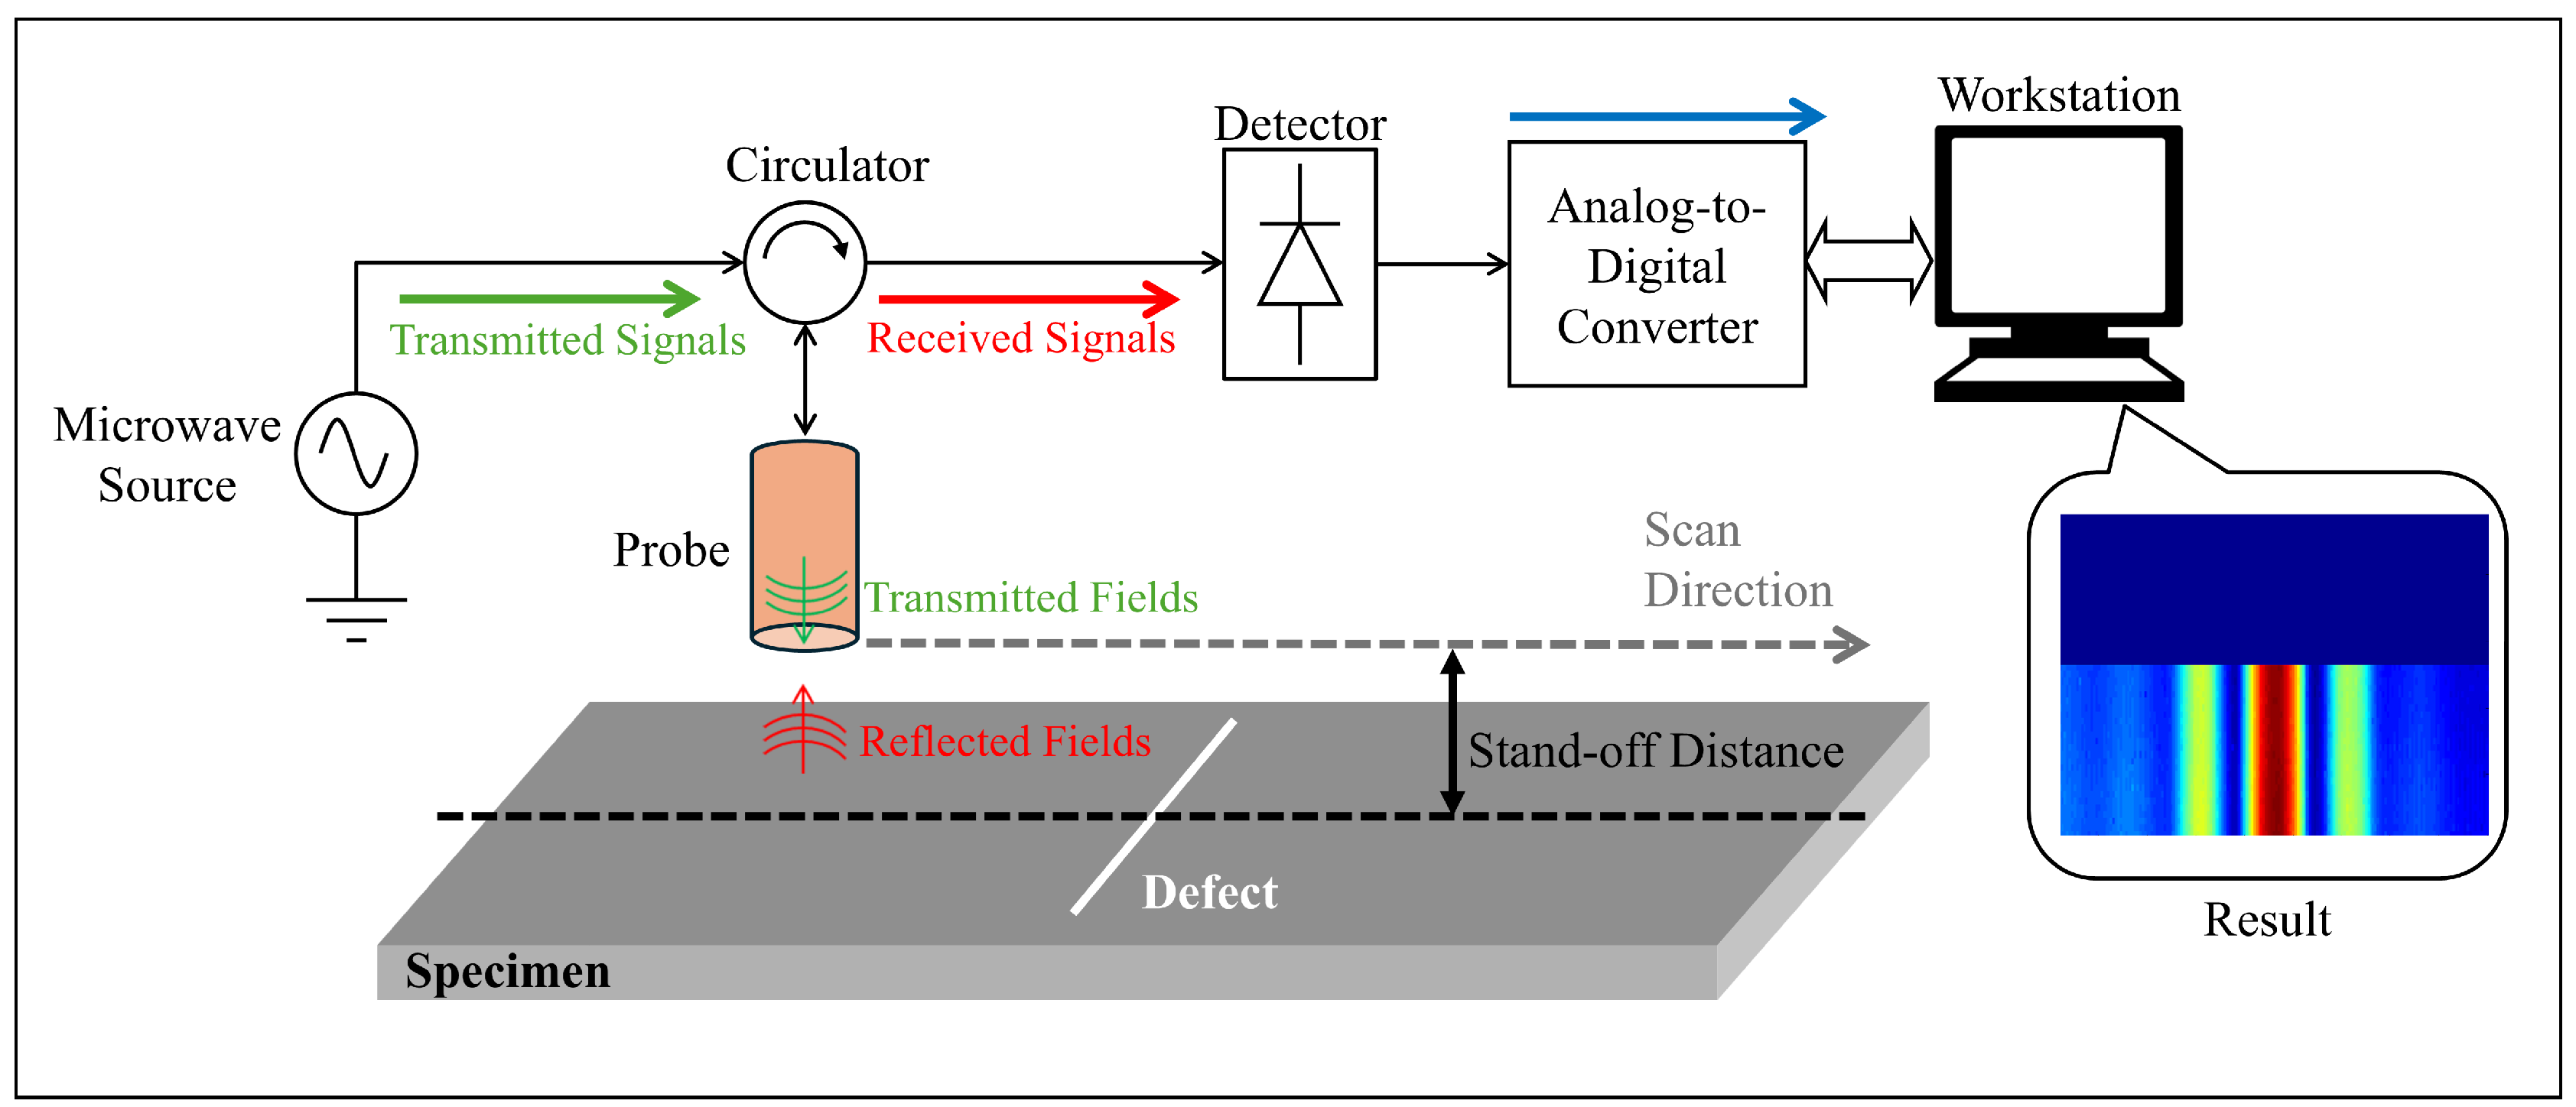
3.2. Near-Field Method

Near-field refers to testing in a region close to the antenna/probe. This reactive near-field region is commonly found at a distance less than one-sixth of a wavelength from the nearest surface of the antenna. Thus, unlike the far-field method, the near-field method involves testing an object close to the transducer. This minimizes signal attenuation and maximizes sensitivity to minor defects, allowing for higher spatial resolution [51].
A near-field testing setup is demonstrated in Figure 7. A probe is positioned at a near-field stand-off distance from a specimen. This probe moves along the specimen during a measurement scan. At each scan location, a microwave source transmits electromagnetic signals to the specimen via the probe. The reflected signals from the specimen are captured by the probe and processed by a workstation to obtain information about the defect, such as its location and characteristics.
Near-field technologies for defect detection make use of different transducers or probes such as open-ended coaxial probes, rectangular waveguide (RWG) apertures, circular waveguide (CWG) apertures, and flanged parallel-plate waveguides [51].
Coaxial probes have been demonstrated to have the ability to detect cracks irrespective of orientation. For example, Amar et al. [69] designed an open-ended coaxial sensor for surface defect detection in conducting and dielectric materials. This sensor was proficient in identifying small defects in the order of micrometers and accurately measured surface depths in an aluminum plate across various depths and diverse shapes. Additionally, using this probe, the method excelled in measuring various electromagnetic attributes such as complex permeability, complex permittivity, and reflection coefficients, among other critical parameters, thereby offering a comprehensive evaluation of material properties.
Despite their success, coaxial probes face a significant limitation. As the gap between the end of the probe and the material being tested (stand-off or lift-off distance) widens, the sensitivity of the coaxial probe decreases drastically [70]. Consequently, their sensitivity is low compared to other probes due to the substantial reflection at the probe’s open end.
In addition to coaxial probes, rectangular waveguides (RWGs) have served as near-field probes for capturing images of subsurface inclusions and cracks in various dielectric materials. Open-ended RWG probes have become the foremost instrument for applying near-field techniques for accurately inspecting and assessing cracks [71]. This probe stands out due to its adaptability to multilayered materials, making it ideal for analyzing complex structures like laminar composites and thermal heat shields. Its ability to handle layered configurations enhances the performance, safety, and efficiency in various applications, including aerospace, construction, and sports equipment [72].
Using RWG transducers, Qaddoumi et al. [73] developed an innovative method employing MNDT for improved inspection and evaluation of corrosion under paint. The findings were encouraging, showing that substituting the stand-off layer (air) with a dielectric layer of known properties led to notable enhancements in measurement sensitivity and resolution in specific MNDT applications. In a different investigation by the same researchers, the standard RWG was tapered to achieve better resolution while preserving sensitivity [74]. The outcomes indicate that tapering the RWG improves the spatial resolution of the captured images compared to standard rectangular waveguides.
Another common probe in near-field imaging is the circular waveguides (CWGs). The distinguishing difference between RWGs and CWGs is that the latter have a circular cross-section, whereas RWGs have a rectangular cross-section. Given their similarities, there exist various studies that compare CWGs and RWGs, such as [75]. In this study, the authors designed a custom-made Teflon-loaded CWG to inspect defects in a honeycomb structure and compared the results with those obtained using an RWG probe. The study’s findings indicated that a circular probe offers superior image resolution compared to a traditional RWG [75]. Aside from [75], various researchers have also conducted comprehensive evaluations of CWGs and compared their results with those of RWGs, such as those in [76,77,78]. Across these studies, a consistent finding emerged: CWGs consistently outperformed RWGs in terms of both resolution and sensitivity. Thus, CWG is a superior probe with the potential for broader use in areas where high resolution and sensitivity are crucial.
A fourth probe considered in near-field MNDT is the flanged parallel-plate waveguide. It consists of parallel metal plates with a flanged edge. Park et al. utilized a flanged parallel-plate waveguide to identify two-dimensional (2D) surface cracks on a metallic plate [79]. By analyzing the measured signal characteristic for each crack, the authors could estimate its corresponding properties, including its width, depth, position, and the material within the crack. Further, in a different investigation, Yadegari et al. [80] proposed a model in which a parallel-plate waveguide with a finite flange was designed to scan a lengthy crack in a perfect conductor.
Despite the advantages of flanged parallel-plate waveguides, they suffer from multiple constraints. Notably, a flanged parallel-plate waveguide is inadequate for assessing the dielectric properties of highly conductive materials due to the material absorbing the microwave energy, thus preventing it from traveling through the waveguide [81].
Given the variety of near-field MNDT probes and the ease of conducting near-field measurements, some industry-level solutions are available. For example, an advanced microwave mapping probe (AMMP) is utilized in the aerospace industry to detect defects in radomes and to measure the thickness of non-conductive coatings [4]. This product can be either handheld or mounted on a robot.
In general, near-field techniques are popular methods; however, they suffer from the disadvantage that they can be applied to small regions of the specimen. Therefore, to scan large sections of a material, the transducer needs to scan or move along the specimen, which might add complexities to the system.

3.3. Resonator Method

Another microwave NDT technique is the resonant method. This technique utilizes the resonant behavior of microwave signals to assess an object’s structural integrity and composition qualities without destroying its serviceability. It is based on the principle that when a material is exposed to microwave signals at specific resonant frequencies, the electromagnetic response is influenced by the material’s characteristics, such as its electrical properties and the presence of defects. By analyzing shifts in the resonant frequency, quality factor, and signal amplitude, information about the material can be obtained [38].
An example of a resonant probe in an MNDT experimental setup is shown in Figure 8 [70]. In this system, the resonant probe consists of a spiral resonator, an electrically small loop, and a matching network. The probe is connected to a vector network analyzer (VNA) to measure its frequency response. Furthermore, the probe is integrated into a scanning table to detect defects in a sample. When there is a defect, the frequency response from the probe changes, with the results processed and visualized as an image.
The resonator method has high sensitivity and can be susceptible to small variations in the material structure or properties. Consequently, discrepancies or shifts in the resonant frequencies can indicate the occurrence of cracks, voids, or changes within a material [42]. The technique for detecting cracks based on resonant frequency has shown promising potential in determining crack sizes by leveraging the correlation between the crack dimensions and variations in resonant frequency [42], making it the source of significant research in the literature.
The resonator method has been utilized in various MNDT research applications due to its shared characteristics with the near-field method [51]. Different studies have presented sensitive sensors for defect inspection on metallic surfaces, such as those in [82,83] that used complementary split-ring resonators (CSRRs). The sensor presented in [82] was shown to detect notches with a width of 0.2 mm and a depth of 2 mm by shifting the resonance frequency by 1.5 GHz. The sensor introduced in [83] detected cracks with a width of 0.1 mm by shifting the resonance frequency by more than 240 MHz. The two sensors in [82,83] were shown to operate while either in contact with the object under test or with a very small stand-off from it; in practice, it is difficult to control and maintain a small stand-off due to dirt, corrosion, and the roughness of the surface. It is also worth noting that, in these methods, the sensitivity to depth is reduced after a certain crack depth, making their use challenging in certain applications.
In a different study, a sensor based on a microstrip line coupled with a split-ring resonator (SRR) was developed [84]. The optimization of the unit cell design was achieved through a comprehensive parametric analysis of the critical design elements of the ring. The design offered multiple benefits, including eliminating the need for calibration, exceptional high-resolution capabilities down to 0.7 mm, a broad operational frequency spectrum spanning 6 to 12 GHz, and flexible integration into an array configuration for expanded functionality [84].
MNDT has undergone rapid advancements, yet challenges persist in detecting cracks on metal surfaces, characterized by difficulties in measurement accuracy and low detection sensitivity. To address these issues, Yang et al. [85] introduced a novel approach involving a dual-cell waveguide MNDT probe equipped with an SRR array, which functions at a frequency of 12.5 GHz. The proposed design enables the precise detection of tiny cracks on metal surfaces with a minimum detectable size of 0.5 mm. Furthermore, in this study, the discrepancy between the simulated and actual experimental outcomes was remarkably low, at only 9% [85]. The findings reveal that measurement variations correlate closely and quantitatively with the crack’s width and depth, demonstrating the probe’s effectiveness in pinpointing and assessing the dimensions of surface cracks with millimeter-scale depths and widths.
Further, researchers have developed planar resonant probes to overcome the limitations of CSRR probes. In [86], the authors reported the imaging results of an ultra-high frequency (UHF) probe implemented using a spiral resonator (SR) with eight turns for inspecting hidden defects and corrosion metal. The results show that the UHF resonant probe rendered high-resolution images at a much lower frequency in comparison to the Ka-band near-field probe frequency [86]. The effectiveness of UHF probes can be further enhanced by developing techniques for characterizing cracks and optimizing the selection of modes. In another study, Haryono et al. [70] developed a planar resonator probe for high-resolution polarization-independent microwave near-field imaging, particularly aimed at detecting small defects in materials. A demonstration of the system and some results are shown in Figure 8. The probe operates at a frequency below 1 GHz and offers a resolution of approximately 3 mm. Experimental comparisons with various other probes demonstrated that this planar probe provided a considerable enhancement in imaging for low signal-to-noise ratio (SNR) scenarios, indicating its higher sensitivity and better imaging capability for both metallic and dielectric samples, including polarized targets like narrow cuts [70]. An expanded study of [70] in [87] presented the use of a UHF microwave planar resonator probe for NDT of surface-breaking defects in metallic materials. This paper demonstrated the probe’s effectiveness in detecting and characterizing micro-cracks through simulation analysis and experimental results, highlighting its high sensitivity and imaging capability for detecting cracks as fine as 0.07 mm. These findings emphasize the probe’s potential as a reliable crack inspection and characterization tool in various industries.
Despite their success, the challenging aspect of the resonant method is optimizing the circuitry utilized with the resonance probe. The circuitry is essential to ensure the probes work at the design frequency, with slight frequency variations being detectable.

3.4. Microwave Imaging Method

Microwave imaging (MWI) involves emitting microwave signals toward a test object from different directions and analyzing the reflected signals to create an image of the material’s surface or interior. This method helps detect flaws or inhomogeneities inside materials, as well as characterizing material properties.
Figure 9 depicts a block diagram of a MWI system. In the system, a specimen is surrounded by several antennas within the imaging domain. Each antenna acts as a transmitter and receiver successively. When an antenna is in transmit mode, it radiates the specimen with an electromagnetic signal; the reflected scattered signals from the specimen are measured by the other antennas, which are in receive mode. After collecting all the measurements, they are processed using an inversion algorithm to obtain information about the electrical properties of the specimen. For example, as shown in Figure 9, the information is represented as a color map of the dielectric constant.
Researchers have developed several methods and techniques to detect material defects using microwave imaging. For example, a study conducted by Giri and Kharkovsky [88] proposed a system that features an innovative integrated sensor unit that combines a microwave antenna with two laser displacement sensors. This unit is designed to automatically trace the contour of the tested material while maintaining a consistent stand-off distance. As it moves, the system measures the reflected signals to construct images of the material. This robust system provides instant insights into any defects in the structure.
The authors of [89] presented another example of a microwave imaging system. The researchers designed an X-band (8–12 GHz) microwave imaging system to collect data for examining different multilayered structures. In this system, ultra-wideband (UWB) noise waveforms were utilized. Furthermore, the system could accurately locate internal boundaries, inclusions, or defects in tested samples [89]. The findings indicate that meticulous selection of the UWB noise waveforms can significantly help in accurately determining the size of defects within materials, with the notable advantage of having high immunity from high RF interference; this is due to the random nature of the UWB signals, as opposed to traditional deterministic waveforms [89].
Massa et al. [90] proposed a microwave imaging technique that effectively solves inverse scattering equations by leveraging a priori information about the scenario under examination and employing a cost-efficient numerical method for field prediction. The technique proposed in [90] used the Sherman–Morrison–Woodbury (SMW) updating formula for electric field computations, showcasing great effectiveness in defect retrieval while maintaining a low computational cost. Further exploitation of a priori knowledge of the scenario under test can be utilized to extend the proposed procedure to three-dimensional geometries [90].
Further, the authors in [91] presented a review of microwave imaging systems to detect breast cancer. In this application, a breast is illuminated by various sources of electromagnetic signals from multiple angles. For each source, the scattered field data are collected. The measured data are processed using algorithms that solve the inverse scattering problem associated with microwave imaging. The algorithm outputs color maps that represent the electrical properties of the breast.
Jiya et al. [92] introduced a microwave imaging technique for detecting cracks in concrete structures using UWB signals. The paper employs a delay-and-sum beamformer algorithm with full-view mounted antennas for image reconstruction. This study successfully demonstrated the technique’s ability to detect cracks as small as 5 mm with a resolution of λ / 4 . The results indicate the technique’s potential for early crack detection in cement-based materials.
Another area where microwave imaging is employed practically is in security applications [93]. A solution provided by Rohde and Schwarz is the QPS full-body security scanner, which utilizes low-power electromagnetic millimeter waves to detect hidden items underneath clothing noninvasively [94,95]. A similar solution is the ProVision system provided by EAS Envimet [96,97]. This system uses millimeter microwave imaging technology along with SAR to detect on-body concealed objects.
In comparison to other techniques, microwave imaging has the advantage of creating electrical profiles of the objects under test. Nevertheless, this comes at the expense of solving the associated inverse problem, which could be computationally expensive.

3.5. Reflectometry Method

The reflectometry method involves transmitting microwave signals towards a specimen and analyzing the reflected waves due to discontinuities [98]. In MNDT, such discontinuities could be due to the presence of defects or changes in electrical properties. Variations in the amplitude and phase of the reflected signals are crucial to determining the discontinuities’ location and nature. Furthermore, this method has two types: frequency–domain reflectometry (FDR) and time–domain reflectometry (TDR). In FDR, continuous wave signals within a frequency range are transmitted through the specimen, and spectral information of the reflected signals is collected to characterize the specimen’s material. In TDR, a fast pulse is sent through the specimen, and the time delay of the signals is analyzed to detect defect locations. Each method has its pros and cons.
An example of the reflectometry method is that of Carrigan et al. [98], which presented a K-band microwave reflectometry tool introduced into a robot designed to traverse pipelines. This robot employs a systematic scanning method to detect and assess defects and external wall degradation in a high-density polyethylene (HDPE) pipe. The specific pipe examined had a diameter of 150 mm and a wall thickness of 9.8 mm. The investigation in [98] shows that signals from minor defects were masked by fluctuations due to the intense background signal emanating from the metal surface of the plastic-lined metal pipe.
Similarly, Akbar et al. introduced a novel NDT technique that uses a TDR for detecting delamination in metal-backed GFRP laminates [99]. By utilizing the Inverse Fast Fourier transform (IFFT) algorithm to analyze reflections in the time domain, delamination was shown to be effectively identified by examining the magnitude of signal reflection at specific time steps. Experimental validation demonstrated the method’s ability to evaluate delamination at depths as low as 1 mm, marking a significant advancement in the rapid and precise inspection of GFRP laminates [99]. In a continuation to their previous work, Akbar et al. [100] developed a microwave TDR technique that involves scanning a coated surface with an open-ended rectangular waveguide (OERW), and then examining the time domain reflections by connecting the OERW to a vector network analyzer (VNA). The proposed method, shown in Figure 10, accurately estimated variations as small as 0.1 mm in the thickness of the dielectric material beneath each scanned area.
Another work by Xie et al. [101] introduced an innovative MNDT technique for detecting material defects utilizing TDR, wavelet decomposition analysis, and artificial neural networks. This technique had notable broad applicability across various dielectric materials with varying thicknesses, demonstrating significant versatility and generalization capabilities in defect detection.

3.6. Conclusions

Overall, current MNDT techniques have provided excellent results in anomaly detection across various applications. A comprehensive overview of the discussed techniques can be found in Table 3. The table compares the methods based on each technique’s working principle, probe type, advantages, limitations, and applications. The following section will address emerging methods related to microwave NDT.

4. Emerging Microwave NDT Techniques

The advancements in microwave NDT techniques have significantly enhanced material inspection capabilities. These emerging methods utilize microwave technology to inspect, characterize, and detect defects in numerous materials with improved precision and sensitivity. Such advancements broaden the scope of applications and offer noninvasive, rapid, and cost-effective solutions for quality assurance and structural integrity assessments across multiple industries. Moreover, ongoing developments in emerging techniques aim to address existing limitations, such as pre- and post-inspection cleaning requirements, sensitivity to magnetic permeability and object coating, and the ability of some MNDT techniques only to examine non-porous surfaces [110]. Some of such emerging methods are discussed in this section.

4.1. Microwave Microscopy

Microwave microscopy and near-field MNDT are intricately linked by utilizing localized microwave fields in the near-field region to conduct material evaluations. Microwave microscopy is a specialized subset within the expensive realm of near-field MNDT techniques. It is distinguishable by its targeted emphasis on achieving high-resolution material characterization and imaging, extending to the microscopic scale. This precision enables a deeper and more detailed analysis of material properties and internal structures, making microwave microscopy a powerful tool for detecting minute defects and inhomogeneities within various materials. In microwave microscopy, probes are designed with exceptionally small tips, often integrated with a resonator, to attain super-resolution capabilities. This implementation allows for a thorough and detailed examination of surface properties across various materials, including metals, semiconductors, and dielectrics. Although the penetration depth of microwave microscopy is inherently limited, its precision in characterizing surface properties is unparalleled, contingent upon maintaining a consistent stand-off distance throughout the testing process [111].
One of the various works on microwave microscopy is that of Wang et al. [112], who developed an advanced high-temperature MNDT system that incorporates a quartz lamp radiation module for heating and an in-house microwave microscope probe for real-time, high-temperature inspections. This system, shown in Figure 11, demonstrated exceptional performance across multiple frequency bands, achieving super-resolution imaging. Notably, it resolved a metal grating with 0.5 mm features at 1 GHz, achieving a remarkable λ / 600 super-resolution [112]. The system’s effectiveness was further shown through the high-temperature examination of external cracks on aluminum and GFRP samples, complemented by a post-processing algorithm that fixed non-uniform background lighting issues. The system also successfully visualized subsurface structures like honeycomb cores beneath a 1.0 mm panel, showcasing its ability for detailed subsurface analysis and accurate assessment of core wall positions and bonding thicknesses.
Another study on microwave microscopy is that of Gu et al. [113], who investigated the effect of various parameters on the performance of a custom-built near-field scanning microwave microscope. The device was designed using a vertical coaxial evanescent probe. A matching network, which utilized the interferometric method, was integrated to enhance measurement sensitivity and accuracy in the 2 to 20 GHz frequency range [113]. This work’s key findings included identifying optimized key parameters for microwave microscopy, which significantly affect the measurement precision and stability. An example of such a parameter is the intermediate frequency bandwidth.

4.2. Active Microwave Thermography

Microwave thermography combines the features of both microwave technology and thermographic techniques [114]. It is an NDT technique that detects microwave radiation from objects and can be divided into two types: passive and active [115]. In the passive method shown in Figure 12a [115], the natural microwave radiation from objects is detected by recording the specimen’s temperature using an infrared (IR) camera without exposing the object to external microwave sources. On the other hand, in active microwave thermography (AMT) shown in Figure 12 [115], electromagnetic energy is radiated onto the object, which heats it. Further, the thermal excitation or response is measured using IR cameras. The thermal excitation can be varied by controlling the microwave source’s frequency, polarization, and power intensity. In passive and active microwave thermography, the thermal response allows for depth measurement and precise localization of defects, enhancing the ability to assess the severity and extent of subsurface anomalies with greater accuracy [116]. Moreover, passive thermography facilitates qualitative defect assessments, while active thermography offers qualitative and quantitative analyses [117].
The more common thermography technique is the active method. Thus, various active thermography techniques have emerged based on the nature of the external thermal excitation. Such methods include pulsed thermography (PT) [118], step thermography (ST) [119], and modulated thermography (MT), also known as lock-in thermography (LT) [120]. Furthermore, a hybrid advancement in this field is pulsed phase thermography (PPT), which merges the features of both PT and MT to offer enhanced detection capabilities [121].
Foudazi et al. [122] presented the use of AMT for the NDT of external defects in metallic materials. The findings indicate that, when a metal with a dielectric-filled crack is exposed to an electric field polarized perpendicular to the length of the crack, a propagating mode is initiated within the crack, resulting in dielectric heating. The study revealed that cracks are identifiable through the AMT detection technique at angles ranging from 0 ° to around 65 ° , with the ideal heating duration for effective detection being approximately 5–30 s [122].
Furthermore, in another investigation, Mirala et al. [123] utilized AMT to inspect and detect water ingress within structures. This paper established a mathematical analysis relating water location and level to the temperature distribution on the inspection surface. The results from AMT measurements on a rubber sample with a small volume of water demonstrated the technique’s potential for water detection and accurate depth estimation of water ingress. The experiments showed that even a small amount of water could be detected after a short duration of microwave excitation, with an average in-depth estimation error of approximately 5% [123].
Another significant study related to AMT is that of Mirala et al. [124], which significantly contributes to using the NDT method for composite materials. This paper investigated the application of AMT in assessing microwave-absorbing structures, notably carbon-fiber-reinforced polymers equipped with RF-absorbing materials. The findings highlighted the enhanced detection capabilities of AMT, as evidenced by a pronounced thermal contrast of up to 5   ° C in the presence of absorbing materials, thereby confirming its potential as a reliable tool in the NDT of such complex structures [124].

4.3. Chipless Radio Frequency Identification

Chipless radio frequency identification (RFID) technology has emerged as a pioneering solution, distinguishing itself from conventional RFID systems by eliminating the need for electronic chips or power sources within tags. Incorporating chipless RFID into MNDT provides a promising avenue for advanced structural health monitoring, enabling the detection and characterizing of defects and anomalies in various materials without direct contact or the necessity for onboard power. Chipless RFID operates without the need for a chip or communication protocol. The tag’s physical signal or signature exclusively encodes the data and information [125,126]; therefore, data are acquired through passive backscattering and are unmodulated, following the principle of radar. Researchers are increasingly gravitating toward chipless RFID technology and diverging from chipped RFID, driven by its cost-effectiveness, inherent simplicity, enhanced printability, and robust performance in high-temperature settings [127,128,129], making it a focus of intense research.
Figure 13 shows a block diagram demonstrating the working principle of a chipless RFID sensor system [126]. The sensor reader transmits a signal through an antenna to interrogate a sensor tag mounted on the specimen. The reflections from the RFID tag and the specimen result in a backscattered signal measured by the receive antenna. Next, signal processing and feature extraction are performed on the backscattered signal to identify the tag ID and read the sensor information. Furthermore, changes to the specimen due to defects will be interpreted as changes in the sensor information.
An innovative chipless RFID sensor tag was developed by [126] for metal defect detection and characterization, utilizing frequency signature-based identification. The design incorporates dipole resonators for ID encoding and a circular microstrip patch antenna (CMPA) to serve as the crack sensor. The experimental results demonstrate the sensor’s ability to detect cracks of widths 1 mm, 2 mm, and 3 mm on a metallic surface of 80 cm × 80 cm, positioned 30 cm below from the antenna [126]. The horizontal cracks in the specimen resulted in a resonant frequency shift of approximately −13.43 MHz for every 0.1 mm expansion in crack width, proving the tag’s high sensitivity and potential for structural health monitoring applications.
In a different study, Brinker and Zoughi [130] presented a novel methodology for material characterization using embedded chipless RFID in materials. Through simulations and measurements, this study investigates how changes in material properties affect the RFID tag’s frequency response, which is binary-encoded. Notable results include the demonstration that embedding the tag in different materials shifts its frequency response, providing a significant understanding of the material’s characteristics. For instance, when embedded in a lossless dielectric material with a relative permittivity of 4, the frequency response of the tag decreased, illustrating the method’s potential for NDT and material characterization [130].
Another research paper presented a 7-bit chipless RFID multisensory device for temperature sensing and crack monitoring within an Internet-of-Things (IoT) framework [125]. The device was designed on a Rogers RT/Duroid 6010.2LM material with six metallic resonators and a circular microstrip patch antenna [125]. The sensor exhibited a sensitive response to temperature variations, drifting the frequency response by approximately 26.2 MHz for every 10   ° C increase in temperature. Additionally, for crack sensing, the sensor detected changes in crack width by measuring frequency shifts, demonstrating the sensor’s potential for multifunctional monitoring in various applications.
Although chipless RFID technology offers various advantages, it has several drawbacks. These include constrained storage capacity (due to the absence of memory), susceptibility to environmental conditions (such as humidity and temperature), and the presence of metals or liquids. These drawbacks can impact performance and shorten the operational range compared to traditional RFID systems [131].

4.4. Conclusions

Emerging technologies related to MNDT techniques have shown potential in various applications, with some limitations. An overview of the working principle, probe types, advantages, limitations, and applications of the discussed emerging techniques are summarized in Table 4.

5. AI-Based Microwave NDT Algorithms

The scientific community has made various efforts to develop algorithms to analyze data, extract relevant features, and interpret information to detect and characterize material defects or anomalies in MNDT applications. The selection of an algorithm is determined by the MNDT method, alongside the nature and characteristics of the material being inspected. Furthermore, the algorithm’s objective is to solve the inverse scattering problem (ISP) associated with the MNDT technique.
In ISPs, the fields are measured, and the goal is to estimate the location, shape, and/or the electrical properties of a specimen or a defect. ISPs are mathematically complex due to the nonlinearity of the problem and the fact it is ill-posed [132]. Non-linearity arises due to the mathematical relation between the electromagnetic fields and the specimen. The fact that the problem is ill-posed is due to its non-uniqueness and instability. Here, non-uniqueness means that the same problem might have multiple solutions. Moreover, instability means that a small variation in the measured fields might result in a large variation in the solutions.
There are various optimization algorithms utilized in the MNDT literature to solve the inverse scattering problem [133,134,135,136,137,138,139,140], but due to its complexity, more recent works are utilizing artificial intelligence (AI), in particular machine learning (ML). This trend highlights a growing emphasis in MNDT on harnessing the potential of advanced computational methodologies for enhancing precision and efficiency [141]. Moreover, the value of using AI models stems from their ability to identify minor signal fluctuations to automate crack detection in scanned surfaces [141]. Next, some research works related to utilizing AI in MNDT are given.
Ali et al. [141] presented the application of an AI model designed to detect sub-millimeter cracks on metallic surfaces, utilizing a waveguide sensor equipped with an SRR. This approach was evaluated using a metal plate featuring multiple cracks, with the experimental results of this procedure demonstrating promising accuracy in categorizing the given cracks. The outcomes obtained with AI models confirm the feasibility of incorporating them into standard MNDT techniques, with the accuracy rates exceeding 99% [141].
Further, a novel microwave-based NDT approach that utilized the k-means unsupervised machine learning algorithm for identifying defects in GFRPs was presented in [142]. The proposed method involved scanning a composite material using an open-ended RWG operating across a frequency range from 18 to 26.5 GHz, utilizing 101 frequency points [142]. The system was shown to identify defects as small as 1 mm, with the results demonstrating a significant improvement in defect detection capability, making it a promising method for composite inspection.
Gacem et al. [62,63] used the collected CSI data from Wi-Fi signals to train convolutional neural networks (CNNs) to perform regression and classification tasks. In [62], a CNN was utilized to classify construction materials into different types. Furthermore, regression models were used to estimate material parameters such as thickness and water content. Further, in [63], CNN models were trained to classify concrete mixtures based on their compositions.
Maricar et al. [143] proposed a novel deep neural network (DNN), attention-UNet (ATTN-UNet), to solve the electromagnetic inverse scattering problem in microwave imaging. Their proposed architecture builds upon the traditional UNet architecture first presented in [144] by incorporating attention mechanisms, which allows their model to focus on more significant aspects of the input over others. Moreover, the outputs of the DNN are colormaps representing the electrical properties of the specimen. The ATTN-UNet architecture was trained on noiseless synthetic data collected using targets from the MNIST dataset [145] before being tested on experimental data from the University of Manitoba repository. The results of their approach advocate for their model’s applicability in microwave imaging applications, with low values for structural similarity index (SSIM) and mean squared error (MSE) across different test conditions [143].
Machine learning techniques have also been used in active infrared thermography imaging algorithms for defect detection [146,147]. Furthermore, Vallerand and Maldague proposed a novel statistical method and compared its defect detection capabilities with perceptron and Kohonen neural networks [147]. Using this approach, it was shown that the perceptron neural network (PNN) yielded a correct characterization of 84% with regard to temperature, 77% with regard to phase, and 82% with regard to amplitude when evaluating the entire image produced by pulsed thermography, thus advocating for the integration of such neural network architectures within standard MNDT techniques.
Advanced machine learning methodologies have been shown to enhance the detection and visualization of corrosion under insulation (CUI) severity [148]. These technologies not only diagnose the current state of corrosion but also forecast future CUI progression and accurately assess the remaining lifespan of the inspected materials, enabling proactive maintenance strategies [148].
In summary, implementing AI in MNDT has appreciable impacts on sensitivity, cost, and automation [141]. Furthermore, using AI to post-process data gathered from microwave sensors is a fundamental aspect of portable testing devices, enabling them to surpass traditional rack-mounted equipment fitted with large displays and requiring advanced plotting capabilities, thus making it a promising addition to MNDT that will attract further research in the coming years.

6. Discussion

This paper breaks down significant advancements and developments in MNDT techniques, highlighting the most significant turning points in detecting and evaluating cracks across various materials. Microwave NDT techniques have emerged as remarkable alternatives to traditional NDT methods. They offer enhanced efficiency and effectiveness, primarily due to their high sensitivity and resolution in detecting surface and subsurface defects [51].
In contrast to traditional NDT methods, MNDT techniques employ electromagnetic waves in the microwave spectrum, enabling deeper material penetration and better defect characterization without harmful radiation. A unique aspect of MNDT lies in the method of energy transmission into the testing environment. As a result, coupling can occur via air or a suitable dielectric, and there is usually no need for special treatment or coupling agents [42].
The first MNDT technique discussed in this paper is the far-field method, which employs microwave propagation characteristics in the far-field region to detect defects. On the other hand, near-field methods, with their innovative probe designs like coaxial probes and rectangular waveguides, have demonstrated remarkable capability in identifying minute crack inconsistencies, providing a detailed analysis of crack geometry and properties [51]. It is worth noting that both of these methods possess their limitations: the far-field method suffers from limited spatial resolution, whereas the near-field method suffers from requiring short-range distances between the transducer and specimen under test, making it essential to choose between the two methods depending on the requirements of the application of interest.
The resonator method was also among the MNDT techniques discussed. This method further extends the capabilities of near-field and far-field NDT by leveraging the sensitivity of resonant structures to minute changes in material properties, offering a high degree of precision in crack detection. The distinction between the near-field, far-field, and resonant methods is based on the wavelength produced by the source and the dimensions of the radiating component, and choosing between these methods is dependent on the specific application area.
Additional MNDT techniques discussed were microwave imaging and microwave reflectometry, which are typically utilized for detecting defects in materials. These two techniques are effective in detecting changes in material properties, including composition, density, or structural flaws. Thus, they are employed for various applications, such as industrial inspection, medical imaging, and material characterization. Both methods rely on the interaction of microwave signals with materials to extract useful information, often using different equipment and software for data analysis. The spatial resolution accuracy depends on the algorithm employed for microwave imaging; however, this approach can be computationally expensive [106], representing a drawback of the microwave imaging technique. On the other hand, a crucial limitation of microwave reflectometry is the sensitivity of the measurements to minor changes in the lift-off distance separating the probe from the object being tested [98]. Variations in lift-off as small as 0.05 mm can significantly affect the measurements, potentially obscuring the detection of defects [98].
Aside from these traditional MNDT approaches, there are various emerging techniques in MNDT, such as microwave microscopy, active microwave thermography (AMT), and chipless RFID. Microwave microscopy is excellent for its ability to characterize high-resolution materials and is essential for identifying minute defects across various materials, particularly metals, semiconductors, and dielectrics [111,112]. Active microwave thermography, divided into passive and active types, enhances defect localization and depth quantification, with innovative techniques like pulsed phase thermography offering improved detection aptitudes [115,116,117,118,119,120,121]. Additionally, the exploration of chipless RFID technology for structural health monitoring presents a non-contact solution for defect detection, eliminating the need for electronic chips [125,126,127,128,129,130,131]. These emerging techniques show promising potential in revolutionizing material inspection and structural integrity assessments and are bound to be enhanced further with subsequent research.
Despite their numerous advantages, MNDT techniques are not without challenges. One of the primary limitations is their sensitivity to environmental conditions, such as temperature and humidity, which can affect the accuracy of measurements. Moreover, the sophisticated equipment required for MNDT, including high-frequency signal generators and sensitive detectors, hinders widespread adoption in field applications.
However, the recent integration of AI with MNDT methods presents a promising avenue. AI, in particular ML, can significantly enhance data analysis, enabling the automation of defect detection and classification and thus reducing the reliance on expert interpretation [141]. This integration can lead to more efficient and accurate investigations, particularly for complex structures [149].
Future research should focus on several key areas to overcome current limitations and expand the applicability of MNDT techniques. Enhancing the resolution and sensitivity of these methods will be crucial for detecting smaller and more complex defects. Developing more cost-effective, portable, and user-friendly devices can facilitate broader adoption, especially for on-site inspections. Additionally, further exploration into the integration of AI algorithms can refine data analysis processes, making MNDT methods more resilient and reliable.

7. Conclusions

The following conclusions can be drawn from this review paper:
  • Detecting defects in materials is crucial for monitoring their structural health and ensuring their integrity. There are two main kinds of methods for detecting defects: destructive testing methods and nondestructive testing methods.
  • While destructive testing methods guarantee definitive results, NDT approaches are still preferred, owing to their cost-effectiveness, safety, and reliability.
  • NDT methods can be categorized into standard and MNDT techniques. Although standard NDT techniques are frequently employed in industry, MNDT offers exceptional advantages such as greater penetration depths in nonmetallic materials and safer inspection due to using low-power non-ionizing electromagnetic signals.
  • MNDT techniques are highly effective in noninvasively detecting minute surface defects in materials as well as concealed imperfections in non-conductors, even at large distances from the specimen under test.
  • Numerous microwave probes have been devised and refined for a wide range of inspection scenarios, each offering unique advantages and limitations.
  • The resulting integration of MNDT techniques in different applications offers promising solutions for defect detection, making it vital for ensuring the structural integrity of components.
  • Growing attention to MNDT techniques has spurred the scientific community to develop novel hardware for NDT techniques and new algorithms:
    In hardware, microwave microscopy, active microwave thermography, and chipless radio frequency identification have emerged to enhance testing precision and sensitivity.
    In algorithms, the incorporation of AI, and specifically ML, has been shown to improve the data analysis process, making MNDT methods more robust and reliable.
By staying abreast of the latest advancements in this field, engineers can leverage innovative microwave testing techniques to address the evolving challenges in NDT and boost the overall reliability of composite materials and structures. Collaboration with industry stakeholders, continuous education, and investment in research and development also serve as a pivotal way to position NDT techniques effectively within the industry. Engaging with standardization bodies and promoting knowledge exchange through workshops and seminars can help achieve consistency, reliability, and broader acceptance of these techniques in various industrial applications.

Author Contributions

Investigation, A.G. and R.A.-S.; data curation, A.G. and R.A.-S.; writing—original draft, A.G.; writing—review and editing, R.A.-S., A.Z. and N.Q.; visualization, A.G. and A.Z.; supervision, A.Z. and N.Q. All authors have read and agreed to the published version of the manuscript.

Funding

This research was funded by the American University of Sharjah (AUS) Faculty Research Grant FRG23-C-E02, the Open Access Program (OAP), and the Master of Science in Electrical Engineering (MSEE) program at AUS. This paper represents the opinions of the authors and does not mean to represent the position or opinions of the American University of Sharjah.

Data Availability Statement

No new data were created or analyzed in this study. Data sharing is not applicable to this article.

Conflicts of Interest

The authors declare no conflicts of interest.

References

  1. Wang, B.; Zhong, S.; Lee, T.L.; Fancey, K.S.; Mi, J. Non-destructive testing and evaluation of composite materials/structures: A state-of-the-art review. Adv. Mech. Eng. 2020, 12, 1687814020913761. [Google Scholar] [CrossRef]
  2. Mix, P.E. Introduction to Nondestructive Testing: A Training Guide; John Wiley & Sons: Hoboken, NJ, USA, 2005. [Google Scholar]
  3. Burke, S.; Ditchburn, R. Review of Literature on Probability of Detection for Magnetic Particle Nondestructive Testing; Department of Defence, Australia: Fishermans Bend, VIC, Australia, 2013.
  4. Compass Technology Group, LLC. AMMP Spot Probe Family. Available online: https://compasstech.com/products/microwave-nde-equipment/ammp-spot-probes/ (accessed on 5 March 2025).
  5. Shah, J.; El-Hawwat, S.; Wang, H. Guided Wave ultrasonic testing for crack detection in polyethylene pipes: Laboratory experiments and numerical modeling. Sensors 2023, 23, 5131. [Google Scholar] [CrossRef]
  6. Rifai, D.; Abdalla, A.N.; Razali, R.; Ali, K.; Faraj, M.A. An Eddy current testing platform system for pipe defect inspection based on an optimized Eddy current technique probe design. Sensors 2017, 17, 579. [Google Scholar] [CrossRef] [PubMed]
  7. Gupta, M.; Khan, M.A.; Butola, R.; Singari, R.M. Advances in applications of Non-Destructive Testing (NDT): A review. Adv. Mater. Process. Technol. 2022, 8, 2286–2307. [Google Scholar] [CrossRef]
  8. Rehman, S.K.U.; Ibrahim, Z.; Memon, S.A.; Jameel, M. Nondestructive test methods for concrete bridges: A review. Constr. Build. Mater. 2016, 107, 58–86. [Google Scholar] [CrossRef]
  9. Khedmatgozar Dolati, S.S.; Caluk, N.; Mehrabi, A.; Khedmatgozar Dolati, S.S. Non-destructive testing applications for steel bridges. Appl. Sci. 2021, 11, 9757. [Google Scholar] [CrossRef]
  10. Ottosen, L.M.; Kunther, W.; Ingeman-Nielsen, T.; Karatosun, S. Non-Destructive Testing for Documenting Properties of Structural Concrete for Reuse in New Buildings: A Review. Materials 2024, 17, 3814. [Google Scholar] [CrossRef]
  11. Silva, M.I.; Malitckii, E.; Santos, T.G.; Vilaça, P. Review of conventional and advanced non-destructive testing techniques for detection and characterization of small-scale defects. Prog. Mater. Sci. 2023, 138, 101155. [Google Scholar] [CrossRef]
  12. Hassani, S.; Dackermann, U. A systematic review of advanced sensor technologies for non-destructive testing and structural health monitoring. Sensors 2023, 23, 2204. [Google Scholar] [CrossRef]
  13. Mićić, M.; Brajović, L.; Lazarević, L.; Popović, Z. Inspection of RCF rail defects–Review of NDT methods. Mech. Syst. Signal Process. 2023, 182, 109568. [Google Scholar] [CrossRef]
  14. Maev, R.G.; Chertov, A.; Scott, R.; Stocco, D.; Ouellette, A.; Denisov, A.; Oberdorfer, Y. NDE in the Automotive Sector. In Handbook of Nondestructive Evaluation 4.0; Springer: Berlin/Heidelberg, Germany, 2024; pp. 1–38. [Google Scholar] [CrossRef]
  15. Olsen, A.A. Corrosion Monitoring and Non-destructive Testing. In Equipment Conditioning Monitoring and Techniques: Guidance for the Maritime Domain; Springer: Berlin/Heidelberg, Germany, 2024; pp. 99–116. [Google Scholar] [CrossRef]
  16. Dwivedi, S.K.; Vishwakarma, M.; Soni, A. Advances and researches on non destructive testing: A review. Mater. Today Proc. 2018, 5, 3690–3698. [Google Scholar] [CrossRef]
  17. Reddy, K.A. Non-destructive testing, evaluation of stainless steel materials. Mater. Today Proc. 2017, 4, 7302–7312. [Google Scholar] [CrossRef]
  18. Endramawan, T.; Sifa, A. Non destructive test dye penetrant and ultrasonic on welding SMAW Butt joint with acceptance criteria ASME standard. IOP Conf. Ser. Mater. Sci. Eng. 2018, 306, 012122. [Google Scholar] [CrossRef]
  19. ASME Committee. 2013 ASME Boiler and Pressure Vessel Code Section VIII Division I; American Society of Mechanical Engineers: New York, NY, USA, 2013; Available online: https://www.asme.org/wwwasmeorg/media/resourcefiles/aboutasme/who%20we%20are/bpvc%20resources/bpvc-cc-bpv-2013-supplement-4.pdf (accessed on 10 March 2025).
  20. El Kouche, A.; Hassanein, H.S. Ultrasonic non-destructive testing (NDT) using wireless sensor networks. Procedia Comput. Sci. 2012, 10, 136–143. [Google Scholar] [CrossRef]
  21. Sharma, A.; Sinha, A. Ultrasonic testing for mechanical engineering domain: Present and future perspective. Int. J. Res. Ind. Eng. 2018, 7, 243–253. [Google Scholar] [CrossRef]
  22. Zhukov, D.; Konovalov, S.; Melnikov, A.; Chen, D. Metallography of non-metallic inclusions in pipe metal and impact assessment of defect structures on non-destructive testing outcomes. CIS Iron Steel Rev. 2021, 1, 58–63. [Google Scholar] [CrossRef]
  23. Helfen, T.; Venkat, R.S.; Rabe, U.; Hirsekorn, S.; Boller, C. Characterisation of CFRP through enhanced ultrasonic testing methods. Appl. Compos. Mater. 2012, 19, 913–919. [Google Scholar] [CrossRef]
  24. Mahmoud, A.M.; Ammar, H.H.; Mukdadi, O.M.; Ray, I.; Imani, F.S.; Chen, A.; Davalos, J.F. Non-destructive ultrasonic evaluation of CFRP–concrete specimens subjected to accelerated aging conditions. Ndt & E Int. 2010, 43, 635–641. [Google Scholar] [CrossRef]
  25. Bastianini, F.; Di Tommaso, A.; Pascale, G. Ultrasonic non-destructive assessment of bonding defects in composite structural strengthenings. Compos. Struct. 2001, 53, 463–467. [Google Scholar] [CrossRef]
  26. Berketis, K.; Tzetzis, D.; Hogg, P. Impact damage detection and degradation monitoring of wet GFRP composites using noncontact ultrasonics. Polym. Compos. 2009, 30, 1043–1049. [Google Scholar] [CrossRef]
  27. Waqar, M.; Memon, A.M.; Sabih, M.; Alhems, L.M. Composite pipelines: Analyzing defects and advancements in non-destructive testing techniques. Eng. Fail. Anal. 2024, 157, 107914. [Google Scholar] [CrossRef]
  28. OnestopNDT. A Comprehensive Overview on Ultrasonic Testing. 2022. Available online: https://www.onestopndt.com/ndt-articles/ultrasonic-testing (accessed on 5 March 2025).
  29. García-Martín, J.; Gómez-Gil, J.; Vázquez-Sánchez, E. Non-destructive techniques based on Eddy current testing. Sensors 2011, 11, 2525–2565. [Google Scholar] [CrossRef]
  30. Santos, D.; Machado, M.A.; Monteiro, J.; Sousa, J.P.; Proença, C.S.; Crivellaro, F.S.; Rosado, L.S.; Santos, T.G. Non-destructive inspection of high-temperature piping combining ultrasound and Eddy current testing. Sensors 2023, 23, 3348. [Google Scholar] [CrossRef] [PubMed]
  31. Ulapane, N.; Alempijevic, A.; Vidal Calleja, T.; Valls Miro, J. Pulsed Eddy current sensing for critical pipe condition assessment. Sensors 2017, 17, 2208. [Google Scholar] [CrossRef] [PubMed]
  32. Deng, Y.; Liu, X. Electromagnetic imaging methods for nondestructive evaluation applications. Sensors 2011, 11, 11774–11808. [Google Scholar] [CrossRef]
  33. Ito, F.; Nishimura, A. Fabrication and application of microcapsules including fluorescent magnetic particles for crack inspection of pipes. Trans. Mater. Res. Soc. Jpn. 2013, 38, 667–672. [Google Scholar] [CrossRef]
  34. Smith, M.; Sutherby, R. The detection of pipeline SCC flaws using the ACFM technique. Insight Non-Destr. Test. Cond. Monit. 2005, 47, 765–768. [Google Scholar] [CrossRef]
  35. Zolfaghari, A.; Zolfaghari, A.; Kolahan, F. Reliability and sensitivity of magnetic particle nondestructive testing in detecting the surface cracks of welded components. Nondestruct. Test. Eval. 2018, 33, 290–300. [Google Scholar] [CrossRef]
  36. Shafeek, H.; Gadelmawla, E.; Abdel-Shafy, A.; Elewa, I. Assessment of welding defects for gas pipeline radiographs using computer vision. NDT E Int. 2004, 37, 291–299. [Google Scholar] [CrossRef]
  37. Haith, M.I.; Huthwaite, P.; Lowe, M.J. Defect characterization from limited view pipeline radiography. NDT E Int. 2017, 86, 186–198. [Google Scholar] [CrossRef]
  38. Zoughi, R. Microwave Non-Destructive Testing and Evaluation Principles; Springer Science & Business Media: Berlin/Heidelberg, Germany, 2000; Volume 4. [Google Scholar] [CrossRef]
  39. Ghasr, M.T.; Abou-Khousa, M.A.; Kharkovsky, S.; Zoughi, R.; Pommerenke, D. Portable real-time microwave camera at 24 GHz. IEEE Trans. Antennas Propag. 2011, 60, 1114–1125. [Google Scholar] [CrossRef]
  40. Verma, S.K.; Bhadauria, S.S.; Akhtar, S. Review of nondestructive testing methods for condition monitoring of concrete structures. J. Constr. Eng. 2013, 2013, 834572. [Google Scholar] [CrossRef]
  41. Hasar, U. Non-destructive testing of hardened cement specimens at microwave frequencies using a simple free-space method. NDT E Int. 2009, 42, 550–557. [Google Scholar] [CrossRef]
  42. Brinker, K.; Dvorsky, M.; Al Qaseer, M.T.; Zoughi, R. Review of advances in microwave and millimetre-wave NDT&E: Principles and applications. Philos. Trans. R. Soc. A 2020, 378, 20190585. [Google Scholar] [CrossRef]
  43. Ghodgaonkar, D.K.; Ali, N.A.; Giubbolini, L. Microwave nondestructive testing of composite materials using free-space microwave measurement techniques. In Proceedings of the 15th World Conference on Non-Destructive Testing, Roma, Italy, 15–21 October 2000; pp. 15–21. [Google Scholar]
  44. Deepak, J.; Raja, V.B.; Srikanth, D.; Surendran, H.; Nickolas, M. Non-destructive testing (NDT) techniques for low carbon steel welded joints: A review and experimental study. Mater. Today Proc. 2021, 44, 3732–3737. [Google Scholar] [CrossRef]
  45. Pushpakumara, B.J.; Silva, S.D.; Silva, G.S.D. Visual inspection and non-destructive tests-based rating method for concrete bridges. Int. J. Struct. Eng. 2017, 8, 74–91. [Google Scholar] [CrossRef]
  46. Vera, J.; Caballero, L.; Taboada, M. Reliability of dye penetrant inspection method to detect weld discontinuities. Russ. J. Nondestruct. Test. 2024, 60, 85–95. [Google Scholar] [CrossRef]
  47. Yang, L.; Chuai, R.; Cai, G.; Xue, D.; Li, J.; Liu, K.; Liu, C. Ultrasonic Non-Destructive Testing and Evaluation of Stainless-Steel Resistance Spot Welding Based on Spiral C-Scan Technique. Sensors 2024, 24, 4771. [Google Scholar] [CrossRef]
  48. Dai, L.; Feng, H.; Wang, T.; Xuan, W.; Liang, Z.; Yang, X. Pipe crack recognition based on Eddy current NDT and 2D impedance characteristics. Appl. Sci. 2019, 9, 689. [Google Scholar] [CrossRef]
  49. Bosse, S.; Lehmhus, D.; Kumar, S. Automated porosity characterization for aluminum die casting materials using X-ray radiography, synthetic X-ray data augmentation by simulation, and machine learning. Sensors 2024, 24, 2933. [Google Scholar] [CrossRef]
  50. Hena, B.; Ramos, G.; Ibarra-Castanedo, C.; Maldague, X. Automated Defect Detection through Flaw Grading in Non-Destructive Testing Digital X-ray Radiography. NDT 2024, 2, 378–391. [Google Scholar] [CrossRef]
  51. Abou-Khousa, M.A.; Rahman, M.S.U.; Donnell, K.M.; Al Qaseer, M.T. Detection of surface cracks in metals using microwave and millimeter-wave nondestructive testing techniques—A review. IEEE Trans. Instrum. Meas. 2023, 72, 1–18. [Google Scholar] [CrossRef]
  52. Zoughi, R.; Ganchev, S. Microwave nondestructive evaluation: State-of-the-art review. NASA STI/Recon Tech. Rep. N 1995, 95, 34346. [Google Scholar]
  53. Memon, M.U.; Lim, S. Review of electromagnetic-based crack sensors for metallic materials (recent research and future perspectives). Metals 2016, 6, 172. [Google Scholar] [CrossRef]
  54. Sobkiewicz, P.; Bieńkowski, P.; Błażejewski, W. Microwave defectoscopy–detection of composite delamination. J. Phys. Conf. Ser. 2021, 1782, 012034. [Google Scholar] [CrossRef]
  55. Wang, X.; Liang, J.G.; Wu, J.K.; Gu, X.F.; Kim, N.Y. Microwave detection with various sensitive materials for humidity sensing. Sens. Actuators B Chem. 2022, 351, 130935. [Google Scholar] [CrossRef]
  56. Li, Z.; Zhou, L.; Lei, H.; Pei, Y. Microwave near-field and far-field imaging of composite plate with hat stiffeners. Compos. Part B Eng. 2019, 161, 87–95. [Google Scholar] [CrossRef]
  57. Dvorsky, M.; Al Qaseer, M.T.; Zoughi, R. Crack sizing using dual-polarized microwave SAR imaging. In Proceedings of the 2020 IEEE International Instrumentation and Measurement Technology Conference (I2MTC), Dubrovnik, Croatia, 25–28 May 2020; pp. 1–6. [Google Scholar] [CrossRef]
  58. Arunachalam, K.; Melapudi, V.; Udpa, L.; Udpa, S. Microwave NDT of cement-based materials using far-field reflection coefficients. NDT E Int. 2006, 39, 585–593. [Google Scholar] [CrossRef]
  59. Büyüköztürk, O.; Yu, T.Y. Far-field radar NDT technique for detecting GFRP debonding from concrete. Constr. Build. Mater. 2009, 23, 1678–1689. [Google Scholar] [CrossRef]
  60. Álvarez López, Y.; García Fernández, M.; Grau, R.; Las-Heras, F. A synthetic aperture radar (SAR)-based technique for microwave imaging and material characterization. Electronics 2018, 7, 373. [Google Scholar] [CrossRef]
  61. Abou-Khousa, M.A.; ur Rahman, M.S. Covered cracks detection using dual-polarization synthetic aperture radar imaging. IEEE Trans. Instrum. Meas. 2021, 70, 1–4. [Google Scholar] [CrossRef]
  62. Gacem, M.A.; Zakaria, A.S.; Ismail, M.H.; Tariq, U.; Yehia, S. Measurement of construction materials properties using Wi-Fi and convolutional neural networks. IEEE Access 2022, 10, 126100–126116. [Google Scholar] [CrossRef]
  63. Gacem, M.A.; Zakaria, A.; Ismail, M.H.; Yehia, S.; Tariq, U. Concrete classification using Wi-Fi channel state information and convolutional neural networks. Constr. Build. Mater. 2024, 439, 137280. [Google Scholar] [CrossRef]
  64. Daniels, D.J. Ground Penetrating Radar; IET: Herts, UK, 2004; Volume 1. [Google Scholar]
  65. Conyers, L.B. Ground-Penetrating Radar for Archaeology; Rowman & Littlefield: Lanham, MD, USA, 2023. [Google Scholar]
  66. GSSI. Ground Penetrating Radar (GPR) Equipment: GSSI Inc.: Georadar. Available online: https://www.geophysical.com/ (accessed on 5 March 2025).
  67. Screening Eagle. Subsurface Mapping Solutions for Resource Exploration. Available online: https://www.screeningeagle.com/en/industries/environmental/resource-exploration (accessed on 5 March 2025).
  68. Lee, J.S.; Pottier, E. Polarimetric Radar Imaging: From Basics to Applications; CRC Press: Boca Raton, FL, USA, 2017. [Google Scholar] [CrossRef]
  69. Amar, H.; Ghodbane, H.; Amir, M.; Guezoui, Z.; Zergoug, M.; Azzi, S. Detection of Defects Using Open-Ended Coaxial Probe. Int. J. Syst. Appl. Eng. Dev. 2017, 11, 297–300. [Google Scholar]
  70. Haryono, A.; Aljaberi, K.; Rahman, M.S.U.; Abou-Khousa, M.A. High resolution and polarization independent microwave near-field imaging using planar resonator probes. IEEE Access 2020, 8, 191421–191432. [Google Scholar] [CrossRef]
  71. Zoughi, R.; Kharkovsky, S. Microwave and millimetre wave sensors for crack detection. Fatigue Fract. Eng. Mater. Struct. 2008, 31, 695–713. [Google Scholar] [CrossRef]
  72. Case, J.T.; Kenderian, S. Microwave NDT: An inspection method. Mater. Eval. 2017, 75, 339–346. [Google Scholar]
  73. Qaddoumi, N.N.; Saleh, W.M.; Abou-Khousa, M. Innovative near-field microwave nondestructive testing of corroded metallic structures utilizing open-ended rectangular waveguide probes. IEEE Trans. Instrum. Meas. 2007, 56, 1961–1966. [Google Scholar] [CrossRef]
  74. Qaddoumi, N.N.; Abou-Khousa, M.; Saleh, W.M. Near-field microwave imaging utilizing tapered rectangular waveguides. IEEE Trans. Instrum. Meas. 2006, 55, 1752–1756. [Google Scholar] [CrossRef]
  75. Shafi, K.M.; ur Rahman, M.S.; Abou-Khousa, M.A.; Ramzi, M.R. Applied microwave imaging of composite structures using open-ended circular waveguide. In Proceedings of the 2017 IEEE International Conference on Imaging Systems and Techniques (IST), Beijing, China, 18–20 October 2017; pp. 1–5. [Google Scholar] [CrossRef]
  76. Sediq, A.S.B.; Qaddoumi, N. Near-field microwave image formation of defective composites utilizing open-ended waveguides with arbitrary cross sections. Compos. Struct. 2005, 71, 343–348. [Google Scholar] [CrossRef]
  77. ur Rahman, M.S.; Yassin, A.; Abou-Khousa, M.A. Microwave imaging of thick composite structures using circular aperture probe. Meas. Sci. Technol. 2018, 29, 095403. [Google Scholar] [CrossRef]
  78. Ramzi, M.R.; Abou-Khousa, M.; Prayudi, I. Near-Field Microwave Imaging Using Open-Ended Circular Waveguide Probes. IEEE Sens. J. 2017, 17, 2359–2366. [Google Scholar] [CrossRef]
  79. Park, H.H.; Cho, Y.H.; Eom, H.J. Surface crack detection using flanged parallel-plate waveguide. Electronics Letters 2001, 37, 1526–1527. [Google Scholar] [CrossRef]
  80. Yadegari, A.M.; Moini, R.; Sadeghi, S.H.H.; Mazlumi, F. Output signal prediction of an open-ended rectangular waveguide probe when scanning cracks at a non-zero lift-off. NDT E Int. 2010, 43, 1–7. [Google Scholar] [CrossRef]
  81. Holtmann, P.H. Open-Ended Hollow Coaxial Cable Resonance Sensing via Permittivity Fluctuations for Applications to Exhaled Breath Health Monitoring. Master’s Thesis, Missouri University of Science and Technology, Rolla, MO, USA, 2022. [Google Scholar]
  82. Albishi, A.M.; Ramahi, O.M. Microwaves-Based High Sensitivity Sensors for Crack Detection in Metallic Materials. IEEE Trans. Microw. Theory Tech. 2017, 65, 1864–1872. [Google Scholar] [CrossRef]
  83. Albishi, A.M.; Boybay, M.S.; Ramahi, O.M. Complementary Split-Ring Resonator for Crack Detection in Metallic Surfaces. IEEE Microw. Wirel. Components Lett. 2012, 22, 330–332. [Google Scholar] [CrossRef]
  84. Mukherjee, S.; Shi, X.; Udpa, L.; Udpa, S.; Deng, Y.; Chahal, P. Design of a Split-Ring Resonator Sensor for Near-Field Microwave Imaging. IEEE Sens. J. 2018, 18, 7066–7076. [Google Scholar] [CrossRef]
  85. Yang, X.; Yin, Y.; Zhang, D.; Wu, S.; Huang, K.; Yuan, J.; Zhu, Z. Array Waveguide Probe Loaded with Split-Ring Resonators for Sizing the Cracks in Metal Surface. IEEE Microw. Wirel. Components Lett. 2018, 28, 171–173. [Google Scholar] [CrossRef]
  86. ur Rahman, M.S.; Mustapha, A.A.; Abou-Khousa, M.A. Detection of Cracks under Cover and Corrosion using UHF Probe. In Proceedings of the 2022 IEEE International Instrumentation and Measurement Technology Conference (I2MTC), Ottawa, ON, Canada, 16–19 May 2022; pp. 1–5. [Google Scholar] [CrossRef]
  87. ur Rahman, M.S.; Gaya, S.M.; Abou-Khousa, M.A. Non-destructive Testing and Evaluation of Surface-Breaking Cracks using Microwave Planar Resonator Probe. In Proceedings of the 2022 IEEE Microwaves, Antennas, and Propagation Conference (MAPCON), Bangalore, India, 12–16 December 2022; pp. 552–556. [Google Scholar] [CrossRef]
  88. Giri, P.; Kharkovsky, S. Dual-Laser Integrated Microwave Imaging System for Nondestructive Testing of Construction Materials and Structures. IEEE Trans. Instrum. Meas. 2018, 67, 1329–1337. [Google Scholar] [CrossRef]
  89. Navagato, M.D.; Narayanan, R.M. Microwave imaging of multilayered structures using ultrawideband noise signals. NDT E Int. 2019, 104, 19–33. [Google Scholar] [CrossRef]
  90. Caorsi, S.; Donelli, M.; Massa, A.; Pastorino, M.; Randazzo, A.; Rosani, A. A microwave imaging method for NDE/NDT based on the SMW technique for the electromagnetic field prediction. In Proceedings of the 21st IEEE Instrumentation and Measurement Technology Conference (IMTC), Como, Italy, 18–20 May 2004; Volume 1, pp. 184–189. [Google Scholar] [CrossRef]
  91. AlSawaftah, N.; El-Abed, S.; Dhou, S.; Zakaria, A. Microwave imaging for early breast cancer detection: Current state, challenges, and future directions. J. Imaging 2022, 8, 123. [Google Scholar] [CrossRef]
  92. Jiya, E.A.; Anwar, N.S.N.; Abdullah, M.Z. Detection of Cracks in Concrete Structure Using Microwave Imaging Technique. Int. J. Microw. Sci. Technol. 2016, 2016, 3195716. [Google Scholar] [CrossRef]
  93. Wang, Z.; Chang, T.; Cui, H.L. Review of active millimeter wave imaging techniques for personnel security screening. IEEE Access 2019, 7, 148336–148350. [Google Scholar] [CrossRef]
  94. Rohde & Schwarz. R&S QPS Security Scanners. Available online: https://www.rohde-schwarz.com/ae/home_48230.html (accessed on 5 March 2025).
  95. Ahmed, S.S. Microwave imaging in security—Two decades of innovation. IEEE J. Microwaves 2021, 1, 191–201. [Google Scholar] [CrossRef]
  96. EAS Envimet. ProVision PV2. Available online: https://www.envimet.com/en/product/provision-pv2/ (accessed on 5 March 2025).
  97. Appleby, R.; Anderton, R.N. Millimeter-wave and submillimeter-wave imaging for security and surveillance. Proc. IEEE 2007, 95, 1683–1690. [Google Scholar] [CrossRef]
  98. Carrigan, T.D.; Forrest, B.E.; Andem, H.N.; Gui, K.; Johnson, L.; Hibbert, J.E.; Lennox, B.; Sloan, R. Nondestructive Testing of Nonmetallic Pipelines Using Microwave Reflectometry on an In-Line Inspection Robot. IEEE Trans. Instrum. Meas. 2019, 68, 586–594. [Google Scholar] [CrossRef]
  99. Akbar, M.F.; Jawad, G.N.; Danoon, L.R.; Sloan, R. Delamination Detection in Glass-Fibre Reinforced Polymer (GFRP) Using Microwave Time Domain Reflectometry. In Proceedings of the 2018 15th European Radar Conference (EuRAD), Madrid, Spain, 26–28 September 2018; pp. 253–256. [Google Scholar] [CrossRef]
  100. Akbar, M.F.; Jawad, G.N.; Rashid, L.D.; Sloan, R. Nondestructive Evaluation of Coatings Delamination Using Microwave Time Domain Reflectometry Technique. IEEE Access 2020, 8, 114833–114841. [Google Scholar] [CrossRef]
  101. Xie, Y.; Yang, X.; Su, P.; He, Y.; Qiu, Y. A Microwave Time Domain Reflectometry Technique Combining the Wavelet Decomposition Analysis and Artificial Neural Network for Detection of Defects in Dielectric Structures. IEEE Trans. Instrum. Meas. 2022, 71, 1–11. [Google Scholar] [CrossRef]
  102. Amineh, R.K. Microwave nondestructive testing of nonmetallic pipes: An overview of the major developments. IEEE Instrum. Meas. Mag. 2024, 27, 54–66. [Google Scholar] [CrossRef]
  103. Donnell, K.M.; McClanahan, A.; Zoughi, R. On the crack characteristic signal from an open-ended coaxial probe. IEEE Trans. Instrum. Meas. 2014, 63, 1877–1879. [Google Scholar] [CrossRef]
  104. Iaccheri, E.; Varani, M.; Ragni, L. Cost-effective open-ended coaxial technique for liquid food characterization by using the reflection method for industrial applications. Sensors 2022, 22, 5277. [Google Scholar] [CrossRef] [PubMed]
  105. Balasubramanian, V.; Jain, M.C.; Golovin, K.; Zarifi, M.H. Real-time non-destructive erosion monitoring of coatings using passive microwave split ring resonator sensor. In Proceedings of the 2023 IEEE International Conference on Consumer Electronics (ICCE), Las Vegas, NV, USA, 6–8 January 2023; pp. 1–4. [Google Scholar] [CrossRef]
  106. Xie, Z.; Li, Y.; Sun, L.; Wu, W.; Cao, R.; Tao, X. A Simple High-Resolution Near-Field Probe for Microwave Non-Destructive Test and Imaging. Sensors 2020, 20, 2670. [Google Scholar] [CrossRef] [PubMed]
  107. Fang, Y.; Yang, X.; Chen, H.e.; Chen, Z.; Wang, R.; Li, Y.; Xie, S. Non-destructive quantitative evaluation of delamination depth and thickness in GFRP using microwave reflectometry. NDT E Int. 2024, 144, 103065. [Google Scholar] [CrossRef]
  108. Origlia, C.; Rodriguez-Duarte, D.O.; Tobon Vasquez, J.A.; Bolomey, J.C.; Vipiana, F. Review of microwave near-field sensing and imaging devices in medical applications. Sensors 2024, 24, 4515. [Google Scholar] [CrossRef]
  109. Yago Ruiz, Á.; Cavagnaro, M.; Crocco, L. An effective framework for deep-learning-enhanced quantitative microwave imaging and its potential for medical applications. Sensors 2023, 23, 643. [Google Scholar] [CrossRef] [PubMed]
  110. Sobkiewicz, P.; Bieńkowski, P.; Błażejewski, W. Microwave Non-Destructive Testing for Delamination Detection in Layered Composite Pipelines. Sensors 2021, 21, 4168. [Google Scholar] [CrossRef]
  111. Tabib-Azar, M.; Pathak, P.; Ponchak, G.; LeClair, S. Nondestructive Superresolution Imaging of Defects and Nonuniformities in Metals, Semiconductors, Dielectrics, Composites, and Plants Using Evanescent Microwaves. Rev. Sci. Instrum. 1999, 70, 2783–2792. [Google Scholar] [CrossRef]
  112. Wang, P.; Li, Z.; Pei, Y. In situ high temperature microwave microscope for nondestructive detection of surface and sub-surface defects. Opt. Express 2018, 26, 9595–9606. [Google Scholar] [CrossRef]
  113. Gu, S.; Haddadi, K.; Fellahi, A.E.; Lasri, T. Setting Parameters Influence on Accuracy and Stability of Near-Field Scanning Microwave Microscopy Platform. IEEE Trans. Instrum. Meas. 2016, 65, 890–897. [Google Scholar] [CrossRef]
  114. Yang, R.; Zhang, H.; Li, T.; He, Y. An investigation and review into microwave thermography for NDT and SHM. In Proceedings of the 2015 IEEE Far East NDT New Technology & Application Forum (FENDT), Zhuhai, China, 28–31 May 2015; pp. 133–137. [Google Scholar] [CrossRef]
  115. Zhang, H.; Yang, R.; He, Y.; Foudazi, A.; Cheng, L.; Tian, G. A Review of Microwave Thermography Nondestructive Testing and Evaluation. Sensors 2017, 17, 1123. [Google Scholar] [CrossRef]
  116. Sun, J.G. Analysis of Pulsed Thermography Methods for Defect Depth Prediction. J. Heat Transf. 2005, 128, 329–338. [Google Scholar] [CrossRef]
  117. Vergani, L.; Colombo, C.; Libonati, F. A review of thermographic techniques for damage investigation in composites. Frat. E Integrità Strutt. 2014, 8, 1–12. [Google Scholar] [CrossRef]
  118. Waugh, R.C.; Dulieu-Barton, J.M.; Quinn, S. Modelling and evaluation of pulsed and pulse phase thermography through application of composite and metallic case studies. NDT E Int. 2014, 66, 52–66. [Google Scholar] [CrossRef]
  119. Roche, J.M.; Balageas, D. Common tools for quantitative pulse and step-heating thermography - Part II: Experimental investigation. Quant. Infrared Thermogr. J. 2015, 12, 1–20. [Google Scholar] [CrossRef]
  120. Maldague, X.P.V. Theory and Practice of Infrared Technology for Nondestructive Testing; John Wiley & Sons: Hoboken, NJ, USA, 2001. [Google Scholar]
  121. Maldague, X.P.V.; Marinetti, S. Pulse Phase Thermography. J. Appl. Phys. 1996, 79, 2694–2698. [Google Scholar] [CrossRef]
  122. Foudazi, A.; Mirala, A.; Ghasr, M.T.; Donnell, K.M. Active Microwave Thermography for Nondestructive Evaluation of Surface Cracks in Metal Structures. IEEE Trans. Instrum. Meas. 2019, 68, 576–585. [Google Scholar] [CrossRef]
  123. Mirala, A.; Foudazi, A.; Al Qaseer, M.T.; Donnell, K.M. Active Microwave Thermography to Detect and Locate Water Ingress. IEEE Trans. Instrum. Meas. 2020, 69, 9774–9783. [Google Scholar] [CrossRef]
  124. Mirala, A.; Ghasr, M.T.; Donnell, K.M. Nondestructive assessment of microwave absorbing structures via active microwave thermography. In Proceedings of the 2018 IEEE International Instrumentation and Measurement Technology Conference (I2MTC), Houston, TX, USA, 14–17 May 2018; pp. 1–6. [Google Scholar] [CrossRef]
  125. Marindra, A.M.J. Chipless RFID Sensor Systems for Structural Health Monitoring. Ph.D. Thesis, Newcastle University, Newcastle upon Tyne, UK, 2020. [Google Scholar]
  126. Marindra, A.M.J.; Tian, G.Y. Chipless RFID sensor tag for metal crack detection and characterization. IEEE Trans. Microw. Theory Tech. 2018, 66, 2452–2462. [Google Scholar] [CrossRef]
  127. Tedjini, S.; Karmakar, N.; Perret, E.; Vena, A.; Koswatta, R.; E-Azim, R. Hold the Chips: Chipless Technology, an Alternative Technique for RFID. IEEE Microw. Mag. 2013, 14, 56–65. [Google Scholar] [CrossRef]
  128. Preradovic, S.; Karmakar, N.C. Chipless RFID: Bar Code of the Future. IEEE Microw. Mag. 2010, 11, 87–97. [Google Scholar] [CrossRef]
  129. Karmakar, N.C. Tag, You’re It: Radar Cross Section of Chipless RFID Tags. IEEE Microw. Mag. 2016, 17, 64–74. [Google Scholar] [CrossRef]
  130. Brinker, K.; Zoughi, R. Embedded chipless RFID measurement methodology for microwave materials characterization. In Proceedings of the 2018 IEEE International Instrumentation and Measurement Technology Conference (I2MTC), Houston, TX, USA, 14–17 May 2018; pp. 1–6. [Google Scholar] [CrossRef]
  131. Brinker, K. Chipless RFID Tag Design, Measurement, and Sensing for Nondestructive Evaluation (NDE) Applications. Ph.D. Thesis, Iowa State University, Ames, IA, USA, 2022. [Google Scholar]
  132. Zakaria, A. The Finite-Element Contrast Source Inversion Method for Microwave Imaging Applications; University of Manitoba: Winnipeg, MB, Canada, 2012. [Google Scholar]
  133. Takahashi, S.; Kidera, S. Efficient Inverse Scattering Algorithm by Incorporating RPM Method for Microwave Non-destructive Imaging. In Proceedings of the 2018 26th European Signal Processing Conference (EUSIPCO), Rome, Italy, 3–7 September 2018; pp. 1222–1226. [Google Scholar] [CrossRef]
  134. Arkadan, A.; Sareen, T.; Subramaniam, S. Genetic algorithms for nondestructive testing in crack identification. IEEE Trans. Magn. 1994, 30, 4320–4322. [Google Scholar] [CrossRef]
  135. Caorsi, S.; Massa, A.; Pastorino, M. A crack identification microwave procedure based on a genetic algorithm for nondestructive testing. IEEE Trans. Antennas Propag. 2001, 49, 1812–1820. [Google Scholar] [CrossRef]
  136. Mojabi, P.; LoVetri, J. Overview and classification of some regularization techniques for the Gauss–Newton inversion method applied to inverse scattering problems. IEEE Trans. Antennas Propag. 2009, 57, 2658–2665. [Google Scholar] [CrossRef]
  137. Chew, W.C.; Wang, Y.M. Reconstruction of two-dimensional permittivity distribution using the distorted Born iterative method. IEEE Trans. Med. Imaging 1990, 9, 218–225. [Google Scholar] [CrossRef]
  138. Van Den Berg, P.M.; Kleinman, R.E. A contrast source inversion method. Inverse Probl. 1997, 13, 1607. [Google Scholar] [CrossRef]
  139. Rubæk, T.; Meaney, P.M.; Meincke, P.; Paulsen, K.D. Nonlinear microwave imaging for breast-cancer screening using Gauss–Newton’s method and the CGLS inversion algorithm. IEEE Trans. Antennas Propag. 2007, 55, 2320–2331. [Google Scholar] [CrossRef]
  140. Donelli, M.; Massa, A. Computational approach based on a particle swarm optimizer for microwave imaging of two-dimensional dielectric scatterers. IEEE Trans. Microw. Theory Tech. 2005, 53, 1761–1776. [Google Scholar] [CrossRef]
  141. Ali, A.; Hu, B.; Ramahi, O. Intelligent Detection of Cracks in Metallic Surfaces Using a Waveguide Sensor Loaded with Metamaterial Elements. Sensors 2015, 15, 11402–11416. [Google Scholar] [CrossRef]
  142. Shrifan, N.H.M.M.; Jawad, G.N.; Isa, N.A.M.; Akbar, M.F. Microwave Nondestructive Testing for Defect Detection in Composites Based on K-Means Clustering Algorithm. IEEE Access 2021, 9, 4820–4828. [Google Scholar] [CrossRef]
  143. Maricar, M.F.; Zakaria, A.; Qaddoumi, N. Attention-Unet for Electromagnetic Inverse Scattering Problems in Microwave Imaging. IEEE Trans. Microw. Theory Tech. 2024. [Google Scholar] [CrossRef]
  144. Ronneberger, O.; Fischer, P.; Brox, T. U-Net: Convolutional Networks for Biomedical Image Segmentation. arXiv 2015, arXiv:1505.04597. [Google Scholar]
  145. Deng, L. The MNIST Database of Handwritten Digit Images for Machine Learning Research. IEEE Signal Process. Mag. 2012, 29, 141–142. [Google Scholar] [CrossRef]
  146. Doshvarpassand, S.; Wu, C.; Wang, X. An overview of corrosion defect characterization using active infrared thermography. Infrared Phys. Technol. 2019, 96, 366–389. [Google Scholar] [CrossRef]
  147. Vallerand, S.; Maldague, X. Defect characterization in pulsed thermography: A statistical method compared with Kohonen and Perceptron neural networks. NDT E Int. 2000, 33, 307–315. [Google Scholar] [CrossRef]
  148. Yee, T.S.; Shrifan, N.H.M.M.; Al-Gburi, A.J.A.; Isa, N.A.M.; Akbar, M.F. Prospect of Using Machine Learning-Based Microwave Nondestructive Testing Technique for Corrosion Under Insulation: A Review. IEEE Access 2022, 10, 88191–88210. [Google Scholar] [CrossRef]
  149. Shrifan, N.; Akbar, M.F.; Isa, N. Prospect of Using Artificial Intelligence for Microwave Nondestructive Testing Technique: A Review. IEEE Access 2019, 7, 110628–110650. [Google Scholar] [CrossRef]
Figure 1. A block diagram demonstrating the steps of dye or liquid penetrant testing: (a) apply penetrant to specimen; (b) wash excess penetrant after some time; (c) apply developer to make the defect with penetrant more visible.
Applsci 15 03274 g001
Figure 2. Diagrams that demonstrate two techniques for performing ultrasound testing [12]: (a) a tecnique based on measuring the reflections from the specimen, and (b) a technique based measuring the signals propagating through the specimen.
Applsci 15 03274 g002
Figure 3. A diagram demonstrating the eddy current testing. The induced currents on the specimen are deformed due to the defect.
Applsci 15 03274 g003
Figure 4. A demonstration of the MPT principle in NDT. After the specimen is magnetized, magnetic particles are applied. These particles will aggregate at the defect location with a magnetic flux leakage.
Applsci 15 03274 g004
Figure 5. A demonstration of X-ray radiography. The radiographic film or detector captures the defect’s shadow.
Applsci 15 03274 g005
Figure 6. A demonstration of far-field testing. An antenna located at the far-field region of the specimen transmits an electromagnetic wave toward a specimen. At the same location, the reflected wave from the specimen with the defect is measured. The antenna is moved at various locations surrounding the target.
Applsci 15 03274 g006
Figure 7. A demonstration of near-field testing. Along the scan path, a probe at a stand-off distance from the specimen transmits electromagnetic signals (green) and receives the reflected signals (red). The reflected signals from different probe positions are processed to locate the defect and can be used to create a colormap showing the defect position.
Applsci 15 03274 g007
Figure 8. An MNDT system that uses the resonator method: (a) the simulation model of the developed probe consisting of the spiral resonator, an electrically small loop, and the matching network; (b) the circuitry of the probe; (c) the measurement system; (d) a sample with various defects; and (e) the results for this sample [70].
Applsci 15 03274 g008
Figure 9. A block diagram of a microwave imaging system. Each antenna acts as a transmitter and receiver. As a transmitter, the antenna radiates the specimen, and the scattered electric fields are measured by receivers surrounding it. The collected data are processed using an inversion algorithm to obtain a color map of the electrical properties of the specimen with defects.
Applsci 15 03274 g009
Figure 10. A diagram to demonstrate the method in [100]: (a) a sample without any delamination, and (b) a sample exhibiting delamination. In (b), multiple reflections occur due to the presence of a defect; the reflectometry system measures these as time delays in the received signals.
Applsci 15 03274 g010
Figure 11. The microwave microscope probe’s design: (a) a schematic representation; (b) a simulation showing the fringe electric field at the open tip of the probe in free space; (c) a simulation of the electric field distribution on a metal surface under the probe with a 0.5 mm standoff; and (d) the normalized reflection coefficient magnitude ( | S 11 | ) as the distance between the probe and the surface increases [112].
Applsci 15 03274 g011
Figure 12. Microwave thermography setups: (a) passive thermography and (b) active thermography [115].
Applsci 15 03274 g012
Figure 13. A diagram demonstrating the use of a chipless RFID in MNDT. An RFID tag is placed on the specimen and is interrogated by a sensor reader. The variations to the backscattered signal from the tag indicate the presence of a defect.
Applsci 15 03274 g013
Table 3. Comparison of microwave nondestructive testing and evaluation methods.
Far-FieldNear-FieldResonant MethodMicrowave ImagingReflectometry
Working principle Based on the propagation of electromagnetic waves in the far-field region.Relies on the electromagnetic interaction between the probe and the specimen at distances in the near-field region.Utilizes the change in the resonance characteristics (frequency, quality factor, amplitude) of a resonant structure when interacting with the specimen under test.Involves illuminating the object with microwave signals and then using the scattered or reflected signals to reconstruct images, revealing internal structures or defects.Based on measuring the reflection of microwave signals from a structure. Variations in the reflected signal indicate changes in impedance, revealing defects or features.
Probe type
  • Cavity resonators [42]
  • Ultra-wideband horn antenna [89]
  • Open-ended rectangular waveguide [99,100,101]
  • Dual-polarized circular aperture antenna [61]
  • Dielectric resonators [42]
  • P-shaped wide-slot antenna [92]
  • Coaxial probes [104]
  • Printed antennas [62,63]
  • Flanged parallel-plate waveguide [79]
  • Complementary spiral resonator probe [106]
  • Pyramidal horn antenna [107]
Advantages
  • Suitable for large area inspection
  • High resolution and sensitivity
  • High sensitivity to material properties
  • High-resolution imaging capabilities
  • Simple and cost-effective
  • Non-contact method
  • Suitable for surface and subsurface inspection
  • Effective for thin materials
  • Effective for both surface and subsurface inspection
  • Effective for both surface and subsurface inspection
  • Good for far-distance measurements
  • Effective for complex geometries
  • Simple and cost-effective setups
  • Can provide qualitative information
  • Suitable for material characterization
Limitations
  • Limited inspection area
  • Requires precise tuning
Can be complex and expensive
  • Limited depth penetration
  • Lower resolution compared to near-field
  • Proximity to the specimen is required
  • Limited by the size and shape of the resonant cavity or structures
  • Requires sophisticated algorithms for image reconstruction
  • Accuracy depends on the probe design and operating frequency
  • Less effective for surface and subsurface defects
  • Can be more complex and expensive compared to far-field technique
  • May not be suitable for large or complex geometries
Sensitivity to noise and interference
  • May require calibration for complex measurements
Applications
  • Printed circuit board inspection [70]
  • Metal characterization [82,83]
  • Cable fault location [98]
  • Material inspection using Wi-Fi [62,63]
  • Composite material inspection [4,56]
  • Thickness measurement [85,105]
  • Detection of defects in composite materials [88,89]
  • Layer thickness measurement [98,99,100]
  • Large structure inspection [56]
  • Detection of delamination and voids in composites [84]
  • Security scanning and surveillance [93,94,95,96,97]
  • Detection of delamination and voids in composites [98,99,100,107]
Table 4. Comparison of emerging MNDT techniques.
Microwave MicroscopyActive Microwave ThermographyChipless RFID
Working PrincipleEmploys microwave interaction with the sample at a microscopic level to generate high-resolution images or dataHeats the specimen with microwave signals and uses thermal cameras to identify temperature variations due to defectsUses encoded electromagnetic fields reflected by chipless objects to transmit data
Probe type
  • Evanescent microwave probe [111]
  • Coaxial evanescent microwave probe [113]
Advantages
  • High-resolution imaging
  • Suitable for a wide range of materials
  • High sensitivity to surface defects
  • Fast inspection over large areas
  • Non-contact method
  • No need for physical tags
  • Durable and cost-effective
  • Can operate in harsh environments
Limitations
  • Limited sample size due to high resolution
  • Requires sophisticated equipment and expertise
  • Limited to surface or near-surface defects
  • May require complex data analysis
  • Limited data storage capacity
  • Shorter read range compared to chipped RFID
  • Sensitivity to environmental conditions
Applications
  • Material characterization [111,112,113]
  • Semiconductor inspection [111,112]
  • Biological sample analysis [111]
  • Structural health monitoring [125,126]
  • Material characterization [130,131]
  • Security and authentication applications [127,128,129]
Disclaimer/Publisher’s Note: The statements, opinions and data contained in all publications are solely those of the individual author(s) and contributor(s) and not of MDPI and/or the editor(s). MDPI and/or the editor(s) disclaim responsibility for any injury to people or property resulting from any ideas, methods, instructions or products referred to in the content.

