Article

On the Formation of Carbonaceous By-Product Species in Spray Flame Synthesis of Maghemite Nanoparticles

1
Particle Technology Group, University of Paderborn, 33102 Paderborn, Germany
2
Department of Material Science, University of Paderborn, 33100 Paderborn, Germany
3
Institute for Combustion Technology, RWTH Aachen University, 52056 Aachen, Germany
4
Institute of Heat and Mass Transfer, RWTH Aachen University, 52056 Aachen, Germany
*
Author to whom correspondence should be addressed.
Appl. Sci. 2025, 15(6), 3294; https://doi.org/10.3390/app15063294
Submission received: 5 February 2025 / Revised: 5 March 2025 / Accepted: 13 March 2025 / Published: 18 March 2025

Abstract

:
This study investigates the formation of by-product species during flame spray synthesis (SFS) of superparamagnetic maghemite (γ-Fe2O3) nanoparticles. Four samples are synthesized by utilizing two standardized burner types (SpraySyn1 and SpraySyn2) and varying the iron (III) nonahydrate (INN) concentration (0.1 M and 0.2 M) in the precursor feed while using ethanol and 2-ethylhexanoic acid as solvent. Conducting complementary powder analysis revealed a predominant presence of carboxylates and carbonates as by-product species (~14–18 wt.%), while no strong indications for elemental carbon and precursor/solvent residues can be found. Carbonates/carboxylates are located on particle surfaces, and the particles’ surface loadings by these species are independent of the precursor concentration but depend on burner type, with SpraySyn2 exhibiting lower values, indicating a more complete combustion for this burner. Through time-resolved thermophoretic sampling, we further demonstrate that carbon forms temporally in the visible flame center when using SpraySyn1. Since carbon solely forms momentarily within large flame pulses and decomposes further downstream, its temporal formation is of minor relevance for the final particle purity. However, its local co-existence aside from γ-Fe2O3 in the flame has potential to bias in situ diagnostics.

1. Introduction

Spray flame synthesis (SFS) is a versatile technique for the fabrication of functional nanoparticulate metal oxides, such as maghemite (γ-Fe2O3), which is advantageous for several medical and biomedical applications given its superparamagnetic properties attained at sufficient low domain/particle size, e.g., drug delivery, hyperthermia, and protein separation [1,2,3]. Corresponding particles can also be prepared by wet-phase chemistry [4,5]. However, SFS offers several advances, such as simple scalability; wide access to low-budget, low-toxic precursors; and the fact that particles with higher (surface) purity are typically obtained [6,7,8].
To fabricate superparamagnetic γ-Fe2O3 by SFS, a precursor composition composed of iron (III) nonahydrate (INN), ethanol (EtOH), and 2-ethylhexanoic acid (EHA) can be utilized, which typically should yield a dominant gas-to-particle conversion [9,10,11,12]. It should be mentioned here that in SFS, a precursor is dissolved in organic solvents, and the solution obtained is atomized by dispersion gas (typically oxygen), which becomes ignited by a self-sustaining gaseous flame (pilot flame) yielding a turbulent, reactive, multiphase flow. There, particles can either evolve from the gas phase (gas-to-particle conversion) or by precipitation processes taking place in the liquid phase (droplet-to-particle conversion) [6,7,8]. Given the size dependencies of these pathways, superparamagnetic γ-Fe2O3 can only be achieved from the gas phase, which has the potential to yield particles <10 nm. Droplet-to-particle conversions solely yield particles of several hundred nm size and above and are therefore not suitable to synthesize nanoscale superparamagnetic γ-Fe2O3. Additionally, the occurrence of droplet-to-particle conversions also yields bimodal size distributions, which is usually undesired.

1.1. By-Product Types in SFS and Their Relevance

Due to the SFS working principle besides the target oxide nanoparticles, solely CO2 and water are released in case the organic metal precursor, as well as organic solvent components, oxidize entirely. Nitrogen-containing precursors, such as INN, do additionally yield NOx and/or N2. Since these corresponding gaseous by-products can be easily separated from the particle product, SFS gives access to materials with high purity. Nevertheless, even in SFS, side products can emerge, at least in SFS in three ways:
  • Precursor and solvent residues can be by-products in case these species do not react/disintegrate entirely [13].
  • CO2 can lead to the formation of carbonates, and incompletely burned hydrocarbons can physi- and chemisorb on the particle surface [14,15,16,17,18].
  • Elemental carbon can evolve as a side product, typically forming core-shell structures together with FexOy [13,19,20,21].
It is noteworthy to mention that it depends on the perspective whether such by-products are a disadvantage or not. For instance, the formation of carbon shells can even be beneficial if the fabrication of reduced phases is intended (e.g., Fe, FeC, and FeO) due to limited mass transfers hindering the oxidation of Fe, FeO, or Fe3O4 [13,20,21,22]. However, in case the fabrication of γ-Fe2O3 for biomedical applications is intended, the above-mentioned co-products are undesired and can mitigate particle functionalities in several ways. For instance, most practical applications are weight-related. Hence, the presence of some wt.% co-product does mitigate the materials’ functionality accordingly. Moreover, elemental carbon and carbonates/carboxylates can be located on the particle surface, determining the particles’ surface chemistry.
Unfortunately, little is known about how the formation of the above-mentioned by-products can be influenced/mitigated by adapting the operation conditions in SFS. Admittedly, the literature already indicated that sufficient atomisation conditions, a high specific flame enthalpy, and low oxygen stoichiometries ( ϕ ) are advantageous for achieving complete decomposition of the burner feeds [13,19,20]. However, it is still not possible to foretell the evolution of these side products for individual SFS experiments, and some findings in the literature show slight contradictions. For instance, Strobel and Pratsinis systematically manipulated ϕ by adjusting burner operation conditions, and carbon depositions were avoided by adapting global oxygen excess, ϕ   < 1 [19]. However, in other SFS setups, simply applying a global oxygen excess does not necessarily yield carbon-free particle outcomes. Carvajal et al. operated SFS their burner setup at even lower ϕ , and particles exhibited considerable core-shell structures anyway [13]. Although these studies seem to be in contradiction in a first glance, they solely demonstrate the necessity of considering local/temporal flame conditions to investigate the formation of by-products rather than relying on global values only.
In addition to the fact that the utilisation of identical parameter sets with different burners may give rise to divergent gas phase properties, the SFS community demonstrated that gas phase properties can also vary considerably over time in individual flames. This was evidenced, for instance, in studies using the SpraySyn1 burner [23,24,25]. This burner type was introduced in 2019 by Schneider et al. to unify SFS experiments [26] and served as groundwork for numerous experimental and numerical SFS studies [27,28,29,30,31,32,33,34,35,36]. In this context, Bieber at al. determined the flame luminescence (representing the flames’ activity) by high-speed monitoring during the synthesis of γ-Fe2O3 using 0.1 M INN in EtOH + EHA, which demonstrated considerable transient combustion conditions for SpraySyn1 [24]. As shown in Figure 1b, the flame luminescence of corresponding flames can be denoted by normalized mean gray levels (NMGf) and can be distinguished into different states: flame flickering (I) and flame pulsing (II, III). Given the fact that flame pulses emerge from the ignition of large liquid lumps [24], one can hypothesize that flame pulsations may cause the formation of side products, e.g., the formation of carbon may take place predominantly in flame pulses due to limited oxygen availabilities. The fact that such transient flame conditions may promote by-products was also recently indicated by studies conducted on other SFS burners. For instance, Kennedy et al. processed INN in EtOH and EHA using a burner supplied by ParteQ GmbH (Kuppenheim, Germany), and powder analysis indicated that γ-Fe2O3 samples exhibit higher carboxylate/carbonate contents in case particles evolve from transient combustion conditions [18].
Based on the studies mentioned above, a successor model, the so-called SpraySyn2 burner, was subsequently developed. This burner has been already utilized in some studies yet [37,38,39,40]. The revision mainly considered adaptions in the nozzle design to improve flame stability [23,24,37].
Figure 1. Flame luminescence in the SFS of FexOy using SpraySyn1 as burner and 0.1 M INN in EtOH + EHA as precursor solution. Panel (a) represents photography taken by SLR camera (exposure time 1/8 s), while (b) illustrates the flame luminosity as a function of time measured by high-speed monitoring (exposure time 33 µs), according to Bieber et al. [24].
Applsci 15 03294 g001

1.2. Study Scope

Here, two experimental approaches are followed to examine the evolutions of side products in SFS.
First, γ-Fe2O3 samples are prepared by processing INN in EtOH + EHA using SpraySyn1 and SpraySyn2, and the obtained materials are compared regarding the presence of by-products using complementary powder analysis techniques. Since the literature implies that carbonates/carboxylates and/or elementary carbon may be predominately present on particle surfaces, we hypothesized that the content of these species may scale with the material’s specific surface area (SSA). To examine this hypothesis, samples with different SSA values are manufactured by adapting two INN concentrations in the liquid feed (0.1 M and 0.2 M). This way, the dependency of co-product contents on the burner type, and the materials’ SSA can be evidenced. The presented methodology can be applied to other SFS setups in the future to compare/denote the surface chemistry of SFS-made materials. In the long term, this could contribute to the fabrication of SFS materials with well-defined surface properties.
Second, the hypothesis is addressed whether the above-mentioned transient combustion conditions taking place in the SFS using SpraySyn1 promotes a local and temporal formation of carbon. For this purpose, γ-Fe2O3 particles are fabricated using SpraySyn1, and samples are extracted thermophoretically with high time resolution (1.5 ms) from the flame center at 5 cm height above burner (HAB). The samples are subsequently examined regarding a carbon presence by transmission electron microscopy (TS-TEM). Therefore, a tailored thermophoretic sampler is utilized. Given to its feature of very low sampling times, samples are extracted from different flame activities (cf. Figure 1b). In addition, samples are extracted downstream at 15 cm HAB to prove whether expected carbon deposition can also be recognized outside the visible flame. From a methodological point, it is evidenced whether TS-TEM experiments can be utilized to examine particle characteristics in SFS with certain spatial and temporal resolutions. From a phenomenological point of view, by comparing the TS-TEM experiments to the powder analysis data, the relevance of local and temporal carbon formations for the final powder quality is addressed.

2. Materials and Methods

2.1. Using Standardized Burner Types

SpraySyn1 and SpraySyn2 are used, which have been developed in the past decade in order to unify SFS experiments. Both burner configurations (Figure 2) have in common that they are composed of two elementary assemblies: a coaxial nozzle in the center and a surrounding flat porous sintered brass matrix. The nozzle itself has an internal capillary tube conveying the liquid feed and an annular coaxial dispersion gas piping. A continuously running laminar pilot flame composed of premixed CH4 and O2 passes through the annular region of the sintered brass matrix near the nozzle and ignites the spray. Moreover, a sheath gas stream of filtered air is supplied to the outer annular region of the brass matrix to stabilize the pilot and spray flame.
Despite both types having high constructional similarities, they differ crucially in their nozzle design: SpaySyn2 utilizes an inclined dispersion gas piping relative to the liquid feed capillary, while a parallel orientation is applied for SpraySyn1. As demonstrated by Bieber et al. and Karaminejad et al., angling the dispersion gas piping this way yields spray flames with steadier activity profiles [23,24]. Here, both burners are operated at similar operation conditions using 10 slm O2 as dispersion gas, 16 slm O2 + 2 slm CH4 for the pilot flame, and 120 slm particle-free dried air as sheath gas. All gas flows are controlled by mass flow controllers manufactured by Bronkhorst High-Tech B.V. (Ruurlo, The Netherlands).
Figure 2. Comparison of nozzle geometries of SpraySyn1 (a) and SpraySyn2 (b) incl. gas supplies and liquid feeds (grey arrows).
Applsci 15 03294 g002

2.2. Precursor Systems and Global Oxygen Availability

Two precursor compositions are processed containing either 0.1 M INN or 0.2 M INN dissolved in a 35:65 mixture (v/v%) of EtOH and EHA. INN is manufactured from Sigma Aldrich (purity > 99%), EtOH is obtained from VWR (MAK free, water content <0.20%-vol), and EHA is from Sigma Aldrich (purity >99%). Table 1 briefly reflects the ϕ and H applied in our SFS experiments. As mentioned above, these values are expected to impact the formation of by-products; hence, they are of interest for comparing/denoting SFS experiments. The values shown in Table 1 are calculated by balancing all mass feeds and oxidative reactions taking place in the flame while assuming a complete and neglecting the entrainment of sheath air and ambient air. Thus, they represent conservative estimated averages. Nevertheless, a minor impact on the INN conc. on ϕ and H is indicated. Given their definition, H and ϕ are insensitive to the burner type applied. For information considering the reaction balances, the reader is referred to Tischendorf et al. [11].

2.3. Powder Analyses

SFS experiments are conducted for 2 h, which yields ~799 mg γ-Fe2O3 for 0.1 M INN and ~1597 mg for 0.2 M INN in theory. This was expected to be enough to conduct all powder analysis intended. For particle collection, the flame aerosols are extracted at a height of ~20 cm HAB through a fume hood and subsequently conveyed through an ePTFE membrane (R+B Filter GmbH, Langenbrettach, Germany) using a vacuum pump type Mink MM 1144 BV (Dr.-Ing. K. Busch GmbH, Maulburg, Germany). According to the volume flow rate of the pump (~60 m3 h−1), extracted aerosol samples exhibit a convection time span until reaching the surface filtration device of ~75 ms, which is enough time for sufficient cooling. By thermocouple, one measures temperatures in the range of 100–150 °C near the membrane. All four powder samples are subsequently stored and analyzed identically by means of the subsequent six measurement techniques.
(1)
Raman spectroscopy is performed using an inVia™ confocal Raman microscope (Renishaw GmbH, Pliezhausen, Germany). Therefore, a low laser intensity of 1% at 633 nm (0.175 mW) is used to avoid any phase transformations that could otherwise occur during Raman measurements [41]. Each measurement consisted of 50 repetitions, with each repetition lasting 10 s, resulting in a total sampling duration of 500 s.
(2)
TEM samples are analyzed using a JEOL JEM-ARM200F high-resolution microscope with Cs correction and field emission HRTEM-STEM capabilities sourced from JEOL (Germany) GmbH (Freising, Germany). Therefore, conventional carbon-coated Cu grids (type S160, PLANO GmbH, Wetzlar, Germany) are used. TEM samples are either obtained from thermophoretic sampling or dipping sample grids into the powder. No organic solvents are used for preparation, which can otherwise cause biases in TEM examinations [11].
(3)
Thermogravimetric analysis (TGA) coupled with differential scanning calorimetry (DSC) and mass spectrometry (MS) is conducted using an STA 449 F1 Jupiter® device obtained from NETZSCH GmbH (Selb, Germany). Therefore, powders are pressed into pellets and heated from 25 to 800 °C in a silicon carbide oven, while the gas atmosphere was monitored by MS using a QMS 403 Aëolos® quadrupole device also sourced from NETZSCH GmbH (Selb, Germany). Mass-to-charge (m/z) ratios of 18 (H2O), 44 (CO2), and 32 (O2) are monitored while a rather low-temperature ramp of 7.5 K min−1 is applied to mitigate possible superpositions of thermal events. Measurements are carried out in synthetic air and argon. Altering the atmosphere in this way is valuable for revealing the origin of thermal events, i.e., oxidative decomposition events are sensitive to the O2 availability, while physical mechanisms, such as physical gas desorption and evaporation, are not.
(4)
Attenuated total reflection Fourier transform infrared spectroscopy (ATR-FTIR) measurements are conducted using a Vertex® 70 spectroscope manufactured by Bruker Corporation (Billerica, MA, USA). The absorbance is measured in the wavelength range of 370–4500 cm−1 with a resolution of 4 cm−1. A platinum holder is used for the ATR measurements.
(5)
Macroscopic magnetic properties are investigated with the vibrating sample magnetometer (VSM) option of a PPMS DynaCool obtained from Quantum Design GmbH (Pfungstadt, Germany). Therefore, field-dependent M(H) magnetization loops are recorded at 300 K up to a maximum field of 7 kOe.
(6)
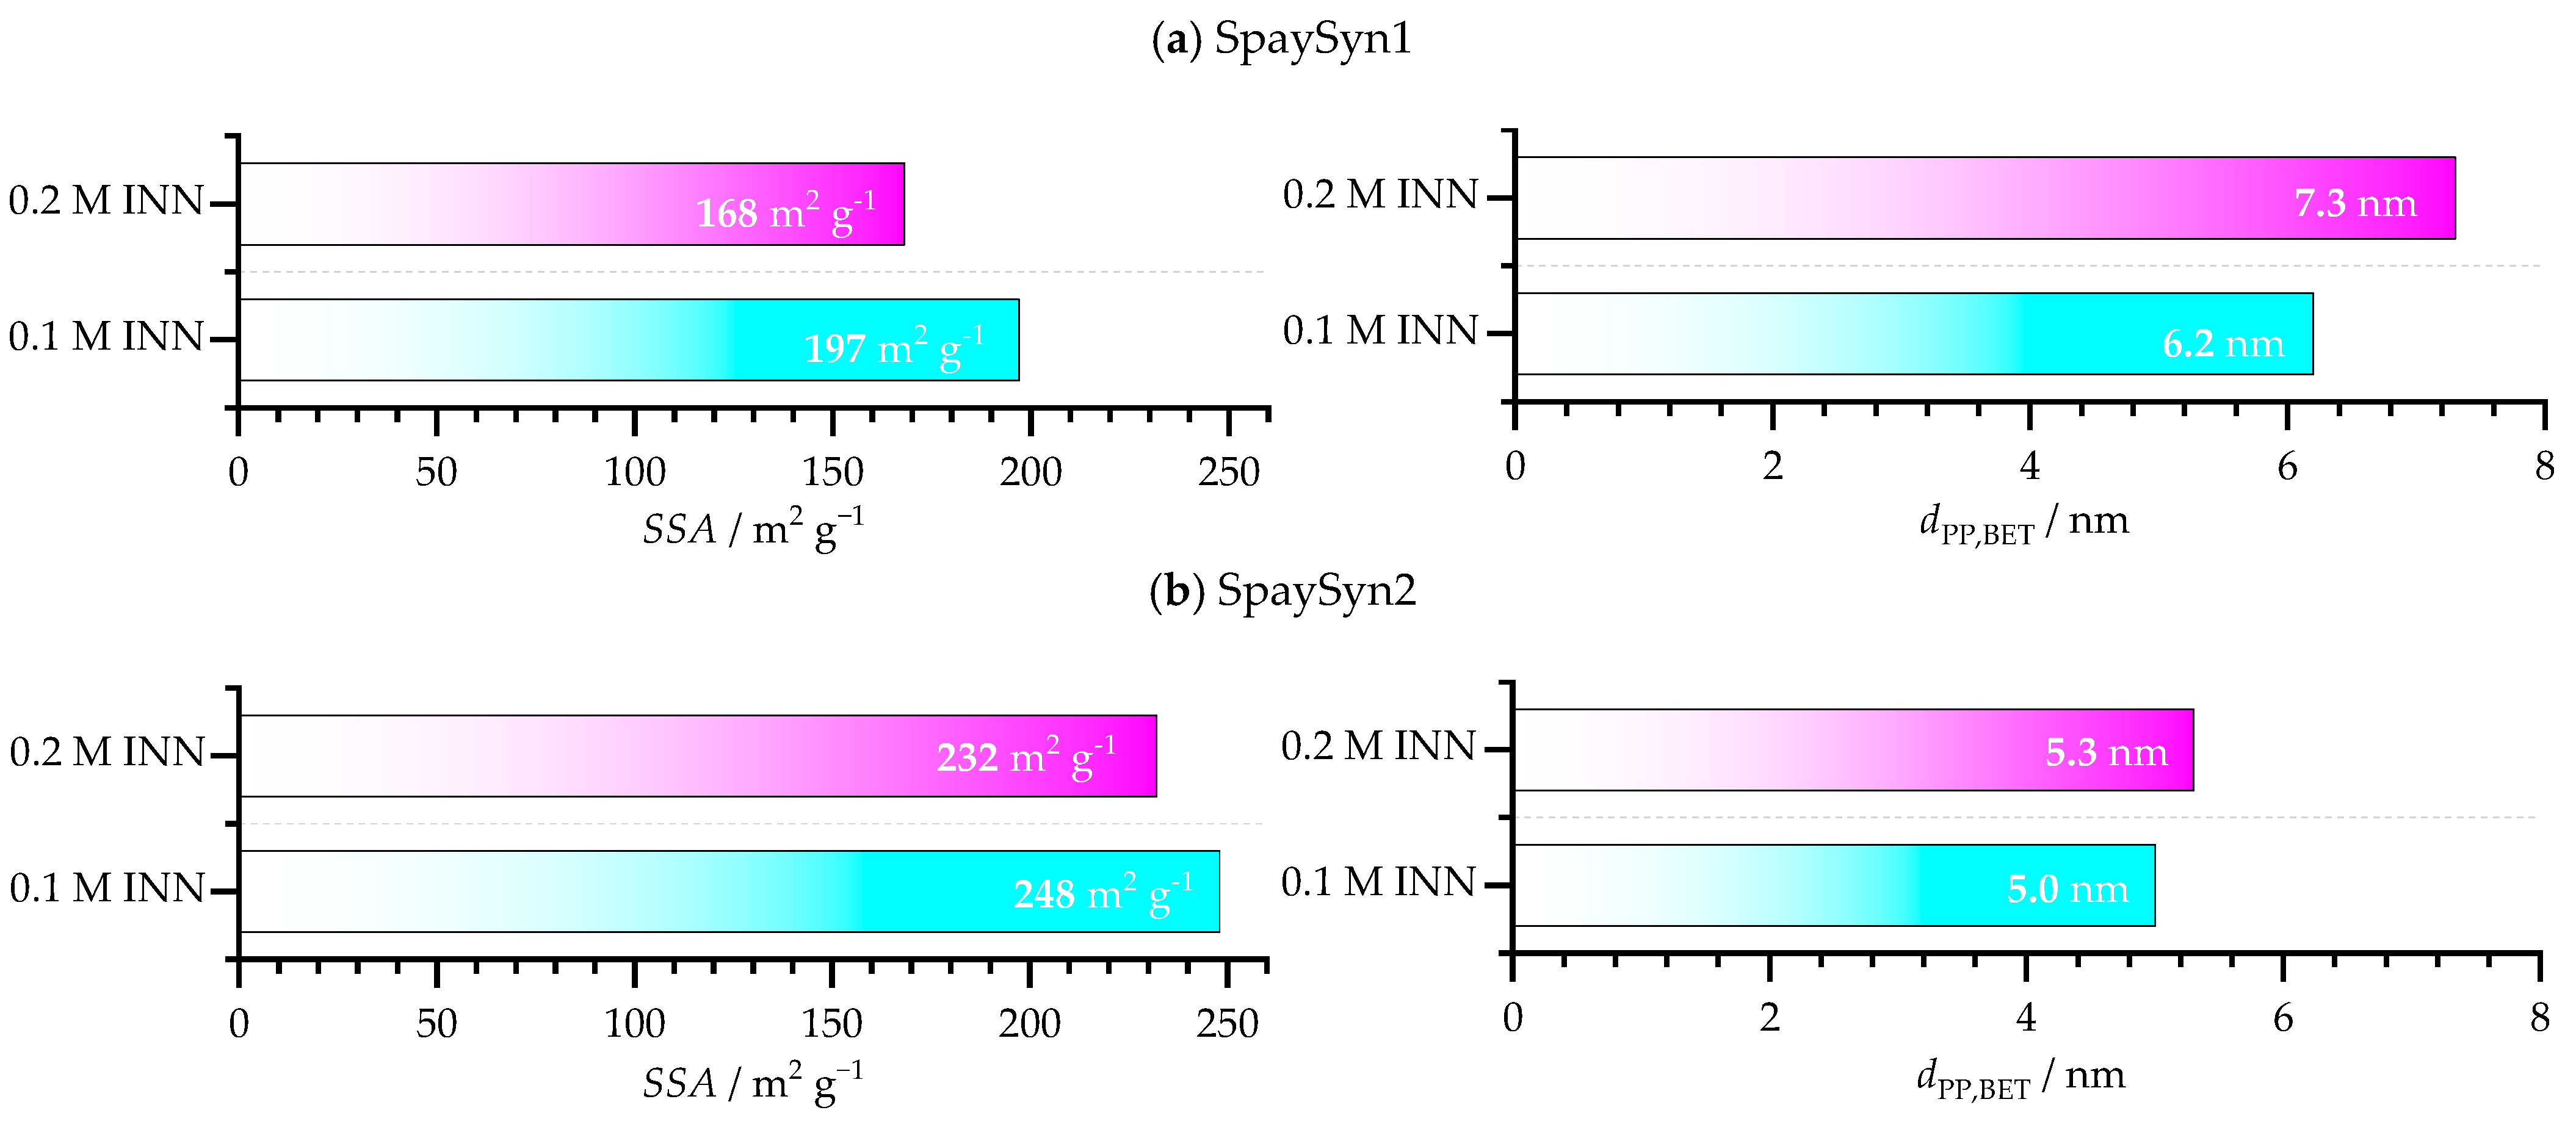
Brunauer-Emmet-Teller (BET) N2 physisorption is conducted at −196 °C utilizing a Quantachrome Autosorb 6 from Anton Paar Germany GmbH (Ostfildern-Scharnhausen, Germany) to record sorption isotherms, and the SSA is determined considering five points in the relative pressure region 0.1–0.3. Therefore, samples are vacuum-degassed overnight at 120 °C. Since the SSA represents the ratio of the cumulative surface of all particles, i S i , to their cumulative mass, i M i , an equivalent primary particle diameter d P P , B E T is obtained by Equation (1), assuming all particles to be spherical and perfectly monodisperse. Hence, d P P , B E T represents a surface equivalent mass-weighted average particle diameter, with S P P as the particles’ surface and V P P as the particles’ volume, N the total number of primary particles, and ρ the material density, which is ~4.88 g cm−3 for γ-Fe2O3:
S S A = i S i ,   i M i = i S i ,   ρ i V i N S P P ρ N V P P = 6 ρ d P P , B E T

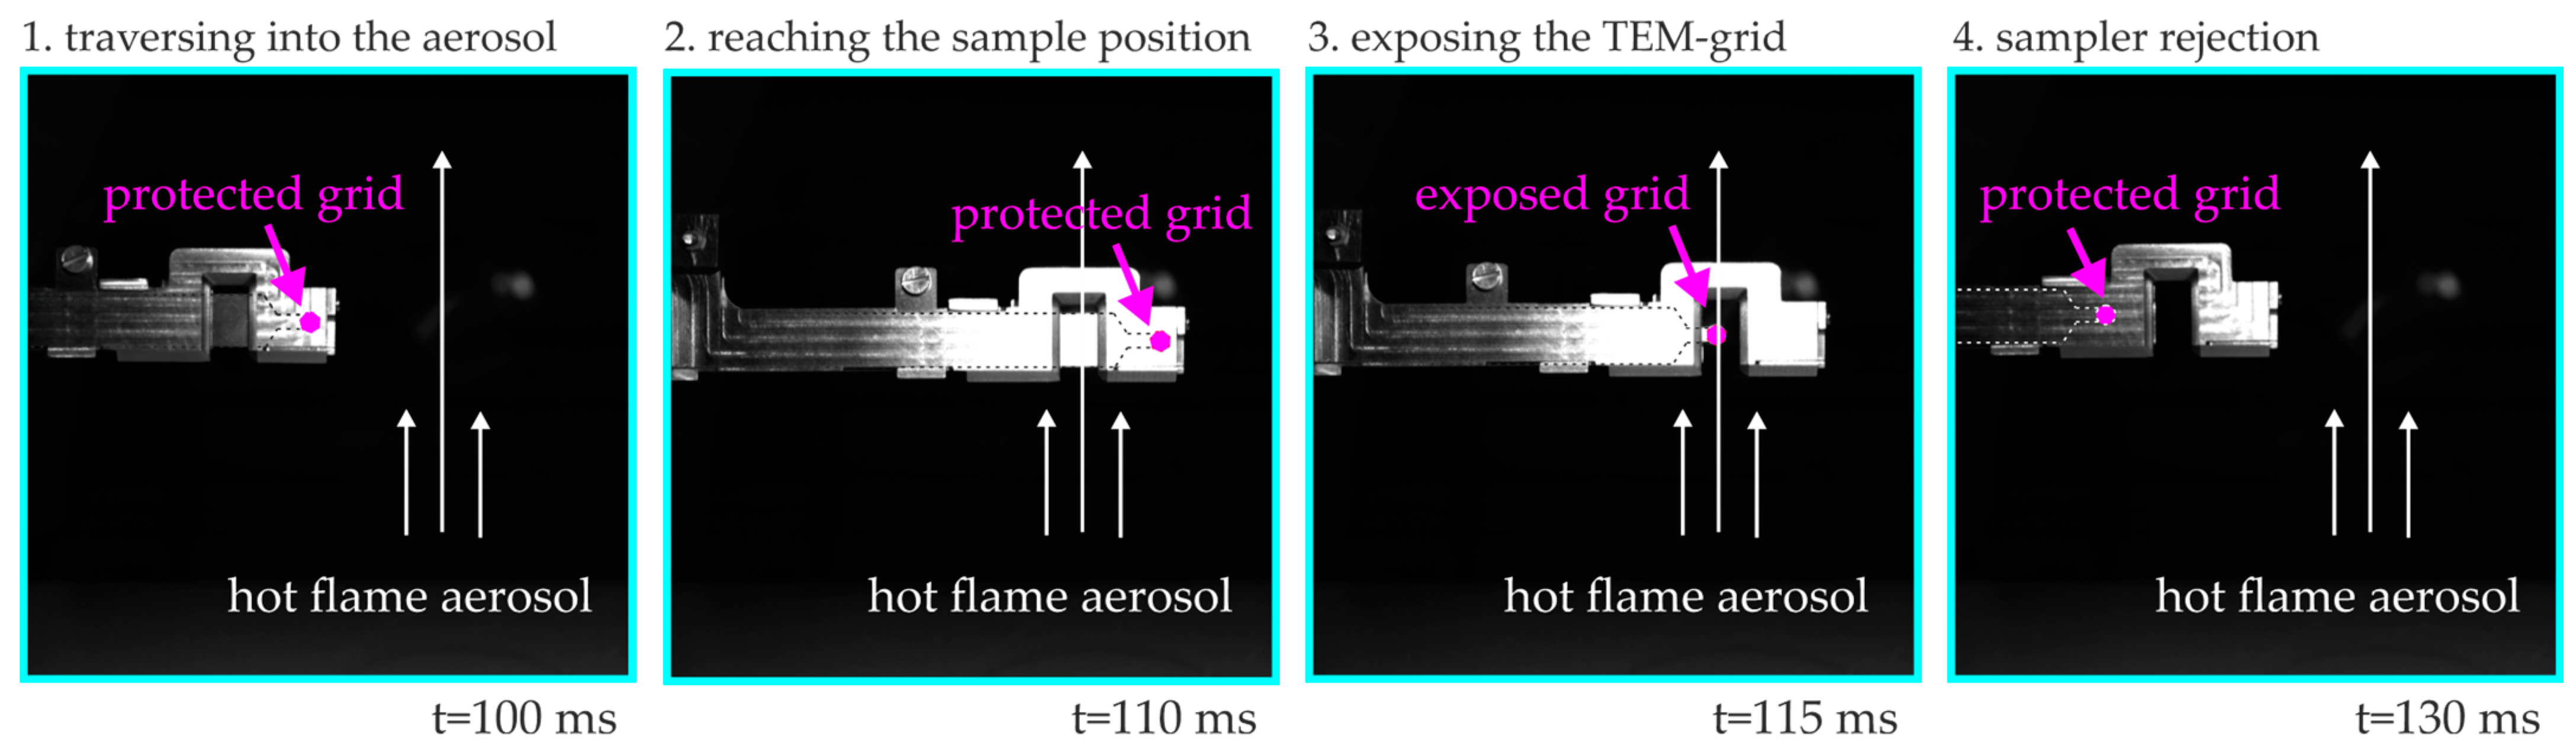
2.4. Thermophoretic Sampling for Transmission Electron Microscopy (TS-TEM)

Extracting particle samples for TEM locally at 5 cm and 15 cm HAB along the flames’ centerline is conducted using a tailored thermophoretic sampler (Figure 3). Therefore, the TEM-grid is traversed to the sampling position initially (frames 1 and 2) and is subsequently exposed there for a defined timespan, t s (frame 3). Before and after sampling, the grid is shielded from the environment to exclude “way sampling” (i.e., particle collection during traversing). Given its modular design the TS-TEM sampler utilized here allows an experimental manipulation of t s in the range ~1–20 ms. This allows the conduction of TS-TEM experiments with variable, high temporal and spatial resolution, which represents a unique feature, since other TS-TEM samplers known from the literature solely allow t s > 3 ms [42,43,44,45,46,47]. In the design, a parallel flow arrangement (grid vs. gas flow) is considered to predominately extract particles by thermophoretic forces. Given the particle sizes attained here (<10 nm), thermophoretic particle size dependencies due to the Cunningham slip correction (via the Knudsen number) [48] are neglectable.

3. Results and Discussion

For simplification solely, most relevant data is provided in the following, and for entire datasets, the reader is referred to www.spraysyn.org (accessed on 1 February 2025).

3.1. Final Particle Characteristics of Samples Obtained by SpraySyn1 and SpraySyn2

By processing 0.1 M and 0.2 M INN in EtOH + EHA in SFS using SpraySyn1 and SpraySyn2, brown-reddish powders are obtained, with experimental yields in the range of ~70–80%. Compared to other SFS setups, these values are comparably high. For example, Carvajal et al. also processed INN containing precursor solutions, which corresponded to yields in the range ~15–30% [13]. This indicates a more complete reaction yield in our setups. However, yield discrepancies can also be attributed to particle losses caused by thermophoresis on the reactor wall and particle residues on the filter which can take place in experimental setups in different extent. The particle samples obtained here display very hydrophobic character and any attempt to disperse the particles in water is unsuccessful.

3.1.1. TEM and Raman Spectroscopy

By examining the samples by TEM and Raman spectroscopy, information considering the carbon presence and statements about the iron oxide phases present are obtained. Since all samples showed identical Raman spectra and since TEM is utilized on a qualitative basis, Figure 4 solely corresponds to one sample (0.1 M INN, SpraySyn1).
As shown exemplarily in Figure 4a, examining the synthesized samples by TEM evidences the presence of small-sized particles <10 nm. This implies that particles originate here predominately from the gas-to-particle pathway aligning with expectations. By proving arbitrary spots by Fast Fourier Transformation (FFT), clear diffraction patterns emerge (frame 3), indicating well-crystalline particles and the obtained d-spacing values match to γ-Fe2O3 and/or Fe3O4 [4,5]. Regarding the particle purity, no indications for carbon depositions can be obtained by TEM as no core-shell structures and/or amorphous particles can be recognized. In case carbon would be present with some single wt.%, considerable core-shell structures should be recognizable in TEM observations [13].
Hence, the TEM examination indicated at very first glance that samples of high purity are obtained, which also matches with the experimental yield values indicating high reaction yields. Admittedly, some very small particles appear to be amorphous at first sight (frames 2, 4). However, by applying high resolutions in TEM, noticeable line diffractions become visible revealing crystalline particles (frames 5, 6).
Figure 4. Exemplary TEM images (a) and Raman data (b). Both techniques suggest γ-Fe2O3 as product. Shown sample: SpraySyn1, 0.1 M INN in EtOH + EHA. Raman references: Fe3O4, γ-Fe2O3, and α-Fe2O3 according to de Faria et al. [49] and carbon bands according to Strobel and Pratsinis [19].
Applsci 15 03294 g004
Since Fe3O4, γ-Fe2O3, and α-Fe2O3 (hematite) exhibit individual signals in the low wavenumber region <1000 cm−1 [49], Raman spectroscopy allows the qualitative identification of phase types in FexOy samples. As exemplary shown in Figure 4b, three strong signals exist at ~350, ~510, and ~710 cm−1 revealing a predominant presence of γ-Fe2O3 rather than Fe3O4 or α-Fe2O3. Noteworthy, all powder spectra also exhibit a shoulder at ~650 cm−1, which can also be attributed to the γ-Fe2O3 in general. However, since Fe3O4 attains its strongest signal at this position, the data does not entirely discard the presence of any traces of Fe3O4 from a very critical point of view.
Given the fact that carbon yields Raman active features in the high wavenumber region, >1000 cm−1 [7,13,19,20,50], we expected that the obtained spectra will also provide information about carbon depositions. Noteworthy, as mentioned above TEM examinations gave no indications for carbon depositions. However, TEM observations are also very point-selective, which is accompanied with a certain experimental uncertainty.
In case carbon is present, Raman spectra can display two distinct bands. At the one hand the so-called D-band can be found at ~1300 cm−1, which is sensitive to atomic disorders, and is typically pronounced for amorphous carbon in consequence. At the other hand, carbon can exhibit the so-called G-band, typically located at ~1590 cm−1. This feature corresponds to the vibration of sp2 hybridized carbon and is consequently characteristic of ordered carbon (graphene) [50].
By examining the samples’ Raman spectra >1000 cm−1, two pronounced signals can be found in the powder spectra at 1375 cm−1 and 1575 cm−1, indicating carbon depositions in contrast to TEM observations. However, by reviewing the literature, we found that iron oxides also can yield signals in the high wavenumber region, mitigating the proof of carbon for FexOy. For example, α-Fe2O3 can generate a signal at ~1320 cm−1 caused by two-magnon scattering or second-order phonon–phonon interaction of the LO signal, which becomes Raman active by crystal disorders [13]. For γ-Fe2O3 (which represents the dominant phase here) even two vibrations were published by two authors [41,49]. According to de Faria et al., they can be located at ~1380 and ~1580 cm−1 [49]. Given to these observations, one derives a an ambiguous picture considering the proof of carbon by solely considering the TEM and Raman data.

3.1.2. BET and Magnetic Properties

To examine whether average particle sizes differ among the four synthesized samples, BET measurements are conducted. This revealed the respective BET-related average mean primary particle diameter, d P P , B E T , and the materials’ SSA values. Noteworthy, the materials’ SSA is of particular relevance for catalytic applications, while d P P , B E T is of greater relevance for superparamagnetic applications, due to the correlation of magnetism and particle size [1,2,3].
By examining the samples’ by BET, it is revealed that increasing the INN concentration correlates with a rising d P P , B E T and declining SSA value (Figure 5). This phenomenon can be attributed to the fact that larger particles emerge in the gas phase by the interplay of agglomeration and sintering at higher precursor concentrations. The BET analysis also reveals a systematic higher d P P , B E T for SpraySyn1 samples (Figure 5a) compared to samples from SpraySyn2 (Figure 5b). This effect can be attributed to the fact that the lifetime of particles in high-temperature fields is shorter for SpraySyn2 [23]. All samples display a Type III isotherm with slight hysteresis relative pressure regions, indicating pore-sizes in the low two-digit nm regime (Figure S1). Given the fact that synthesized particles are considerably small (<10 nm), these hysteresis observed are likely caused by voids between particle-aggregates and agglomerates.
Given the fact that γ-Fe2O3 particles of considerable small size are obtained, all samples display superparamagnetic behavior during measurements by means of vibrational magnetometry conducted at room temperature (Figure S2). As demonstrated graphically in the supplement, no hysteresis in the magnetization functions can be observed. However, the samples display quite different magnetization strengths. In this regard, Table 2 summarizes all four saturation magnetization values ( M S ) measured at a high-field magnetization of H = 70 kOe, and the data is compared to the samples’ d P P , B E T . As shown, a correlation between M S and d P P , B E T is obtained, consistent with the theory that smaller particle sizes are accompanied by mitigation of M S [1,2,3]. This data comparison briefly demonstrates the possibility to manipulate the M S of superparamagnetic γ-Fe2O3 by changing the burner type and/or the precursor concentration in SFS.

3.1.3. ATR-FTIR

Due to their measurement principles, TEM and Raman spectroscopy provide only limited information on whether carbonates/carboxylates and precursor/solvent residues may be present, making other techniques mandatory. By characterizing all samples by ATR-FTIR, qualitatively similar spectra are obtained, and two exemplary spectra are shown in Figure 6 (SpraySyn1 samples). As depicted, a global maximum is revealed at 575 cm−1, which is typical for γ-Fe2O3 [51] (Fe–O vibrations).
Apart from the γ-Fe2O3 signals, all spectra exhibit prominent signals in the mid to upper wavenumber region (1000–3000 cm−1), evidencing the presence of side products. To verify whether these dominant signals indicate residues of the precursor and/or the solvents used, a comparison with the spectra of EtOH, INN, and EHA can be conducted (Figure 6a). As shown, the spectra of INN, EtOH, and EHA differ crucially from the synthesized samples’ spectra in the mid-wavenumber regime (fingerprint region), which refutes the assertion of substantial precursor/solvent residues.
In order to identify the side products in greater detail, literature references are mandatory: Given the extant literature, the vibration quartet at 2962, 2935, 2877, and 2868 cm−1 (magnified in Figure 6c) reveals stretching vibrations due to methyl and methylene groups (CH2, CH3) [52,53]. Thus, the presence of aliphatic species is evidenced. In addition, as magnified in Figure 6b, very prominent double peaks exist at 1420 and 1520 cm−1. According to several references, this indicates C–O stretching vibrations caused by complexly bound carboxylates (R–COO) and/or carbonates (CO32−) [15,54]. Thus, ATR-FTIR measurements reveal the presence of carboxylates and, presumably, carbonates. From a structural point of view, the above-mentioned aliphatic species are likely incorporated in the molecular rest (R) of surface-bond carboxylates, explaining the particles’ hydrophobic character. It is worth mentioning that carboxylates and carbonates usually show only one C–O stretch at one wavelength in ATR-FTIR measurements; however, when these species are complex-bonded to some ligands, their C–O stretches split into two energy states, yielding two signals [55]. The SFS community has already postulated that carbonates and carboxylates may form surface complexes together with surface Fe atoms on γ-Fe2O3, and some possible binding configurations are schematically depicted in the supplement (Figure S2) [16,17].
Figure 6. Exemplary ATR-FTIR data for γ-Fe2O3 particles prepared by SpraySyn1 by processing 0.1 M INN and 0.2 M INN in EtOH + EHA. Subfigures present most important wavenumber regions with (a) 500–3200 cm−1, (b) 1350–1650 cm−1, (c) 2750–3000 cm−1.
Applsci 15 03294 g006

3.1.4. TGA-DSC-MS

By examining the samples by TGA-DSC-MS, again revealing identical measurement profiles from a qualitative point of view. The entire TGA-DSC-MS data of one sample is depicted in Figure 7. There, Figure 7a refers to the thermal treatment conducted in synthetic air while Figure 7b corresponds to argon. The samples’ thermal events are discussed on a qualitative basis first. Subsequently, samples are compared by considering the TGA-DSC-MS data from a quantitative point of view (Table 3).
From a qualitative point of view, all samples exhibit an initial mass loss accompanied by water emission below ~200 °C. The absence of other m/z signals beyond m/z = 18 suggests that physical water desorption is the prevalent process in this temperature range. This is further supported by a slight positive curvature in the DSC signal. The water emission (m/z = 18 trace) reaches a maximum at ~120 °C independent of the atmosphere applied. Under air atmosphere, between ~200 °C and ~400 °C, m/z = 18 signals emerge again, coinciding with a decrease in m/z = 32 signals, an increase in m/z = 44 signals, and exothermic DSC signals. Therefore, the CO2 emission peaks at ~225 °C and ~270 °C, while the deviation of the sample mass (dark blue) reaches minima simultaneously. In this temperature range, the relative sample masses decrease sigmoidal, attaining a steady state after ~400 °C.
The thermal behavior in the air suggests that the present carbonaceous by-products oxidize in the range of 200–400 °C, yielding CO2 and H2O while consuming O2. Given this temperature range, the TGA-DSC-MS data rejects the probability of elemental carbon, which should yield considerable thermal events at much higher temperatures [13,20]. Hence, the samples’ thermal behavior does not evidence the suggestions obtained by Raman spectroscopy but aligns with the TEM impressions. Additionally, the samples’ thermal behavior also refutes the assertion that INN might be present in the materials’ outcome, which aligns with the ATR-FTIR data. INN residues should yield certain mass losses at ~135 °C and ~155 °C [56], which is, however, not recognizable either in the mass evolution or in the DSC signal. In air, all samples exhibit an additional DSC signal at ~490 °C according to the phase transfer of γ-Fe2O3 to α-Fe2O3 [4,5].
Figure 7. Exemplary TGA-DSC-MS data for γ-Fe2O3 particles prepared by SpraySyn1 by processing 0.1 M INN in EtOH + EHA. Synthetic air (a) and argon (b) are applied at atmosphere.
Applsci 15 03294 g007
At a first glance, given the fact that the boiling temperature of EHA is at ~228 °C, the thermal event taking place in the air at 225 °C indicates EHA residues. These EHA residues could evaporate, which may cause m/z = 44 (CO2) signals in the MS fragmentation (NIST MS number: 291562). Although this claim appears to be plausible at first glance, it can be refuted by considering the samples’ thermal behavior under argon.
As shown by the sample’s thermal behavior under argon atmosphere (Figure 7b), CO2 and H2O signals occur over a wider temperature range, and especially the thermal event at ~225 °C is absent. This phenomenon invalidates the evaporation-fragmentation mechanism for EHA mentioned above, which should take place independently of the atmosphere applied. Instead, the samples’ thermal behavior under argon is well aligning, which the theory that carboxylates and carbonates are present as dominant by-product species. In the absence of oxygen, the decomposition of these species is hindered, leading to a splitting of thermal events (pyrolysis). As a result, the CO2 and H2O signals separate into an increased number of events at ~270, ~360, ~385, and ~680 °C.
Despite the above-mentioned thermal events being qualitatively identical among all samples, the respective mass losses differ crucially depending on the sample type, and the TGA-DSC-MS data can be quantitatively compared in two distinct ways:
(1)
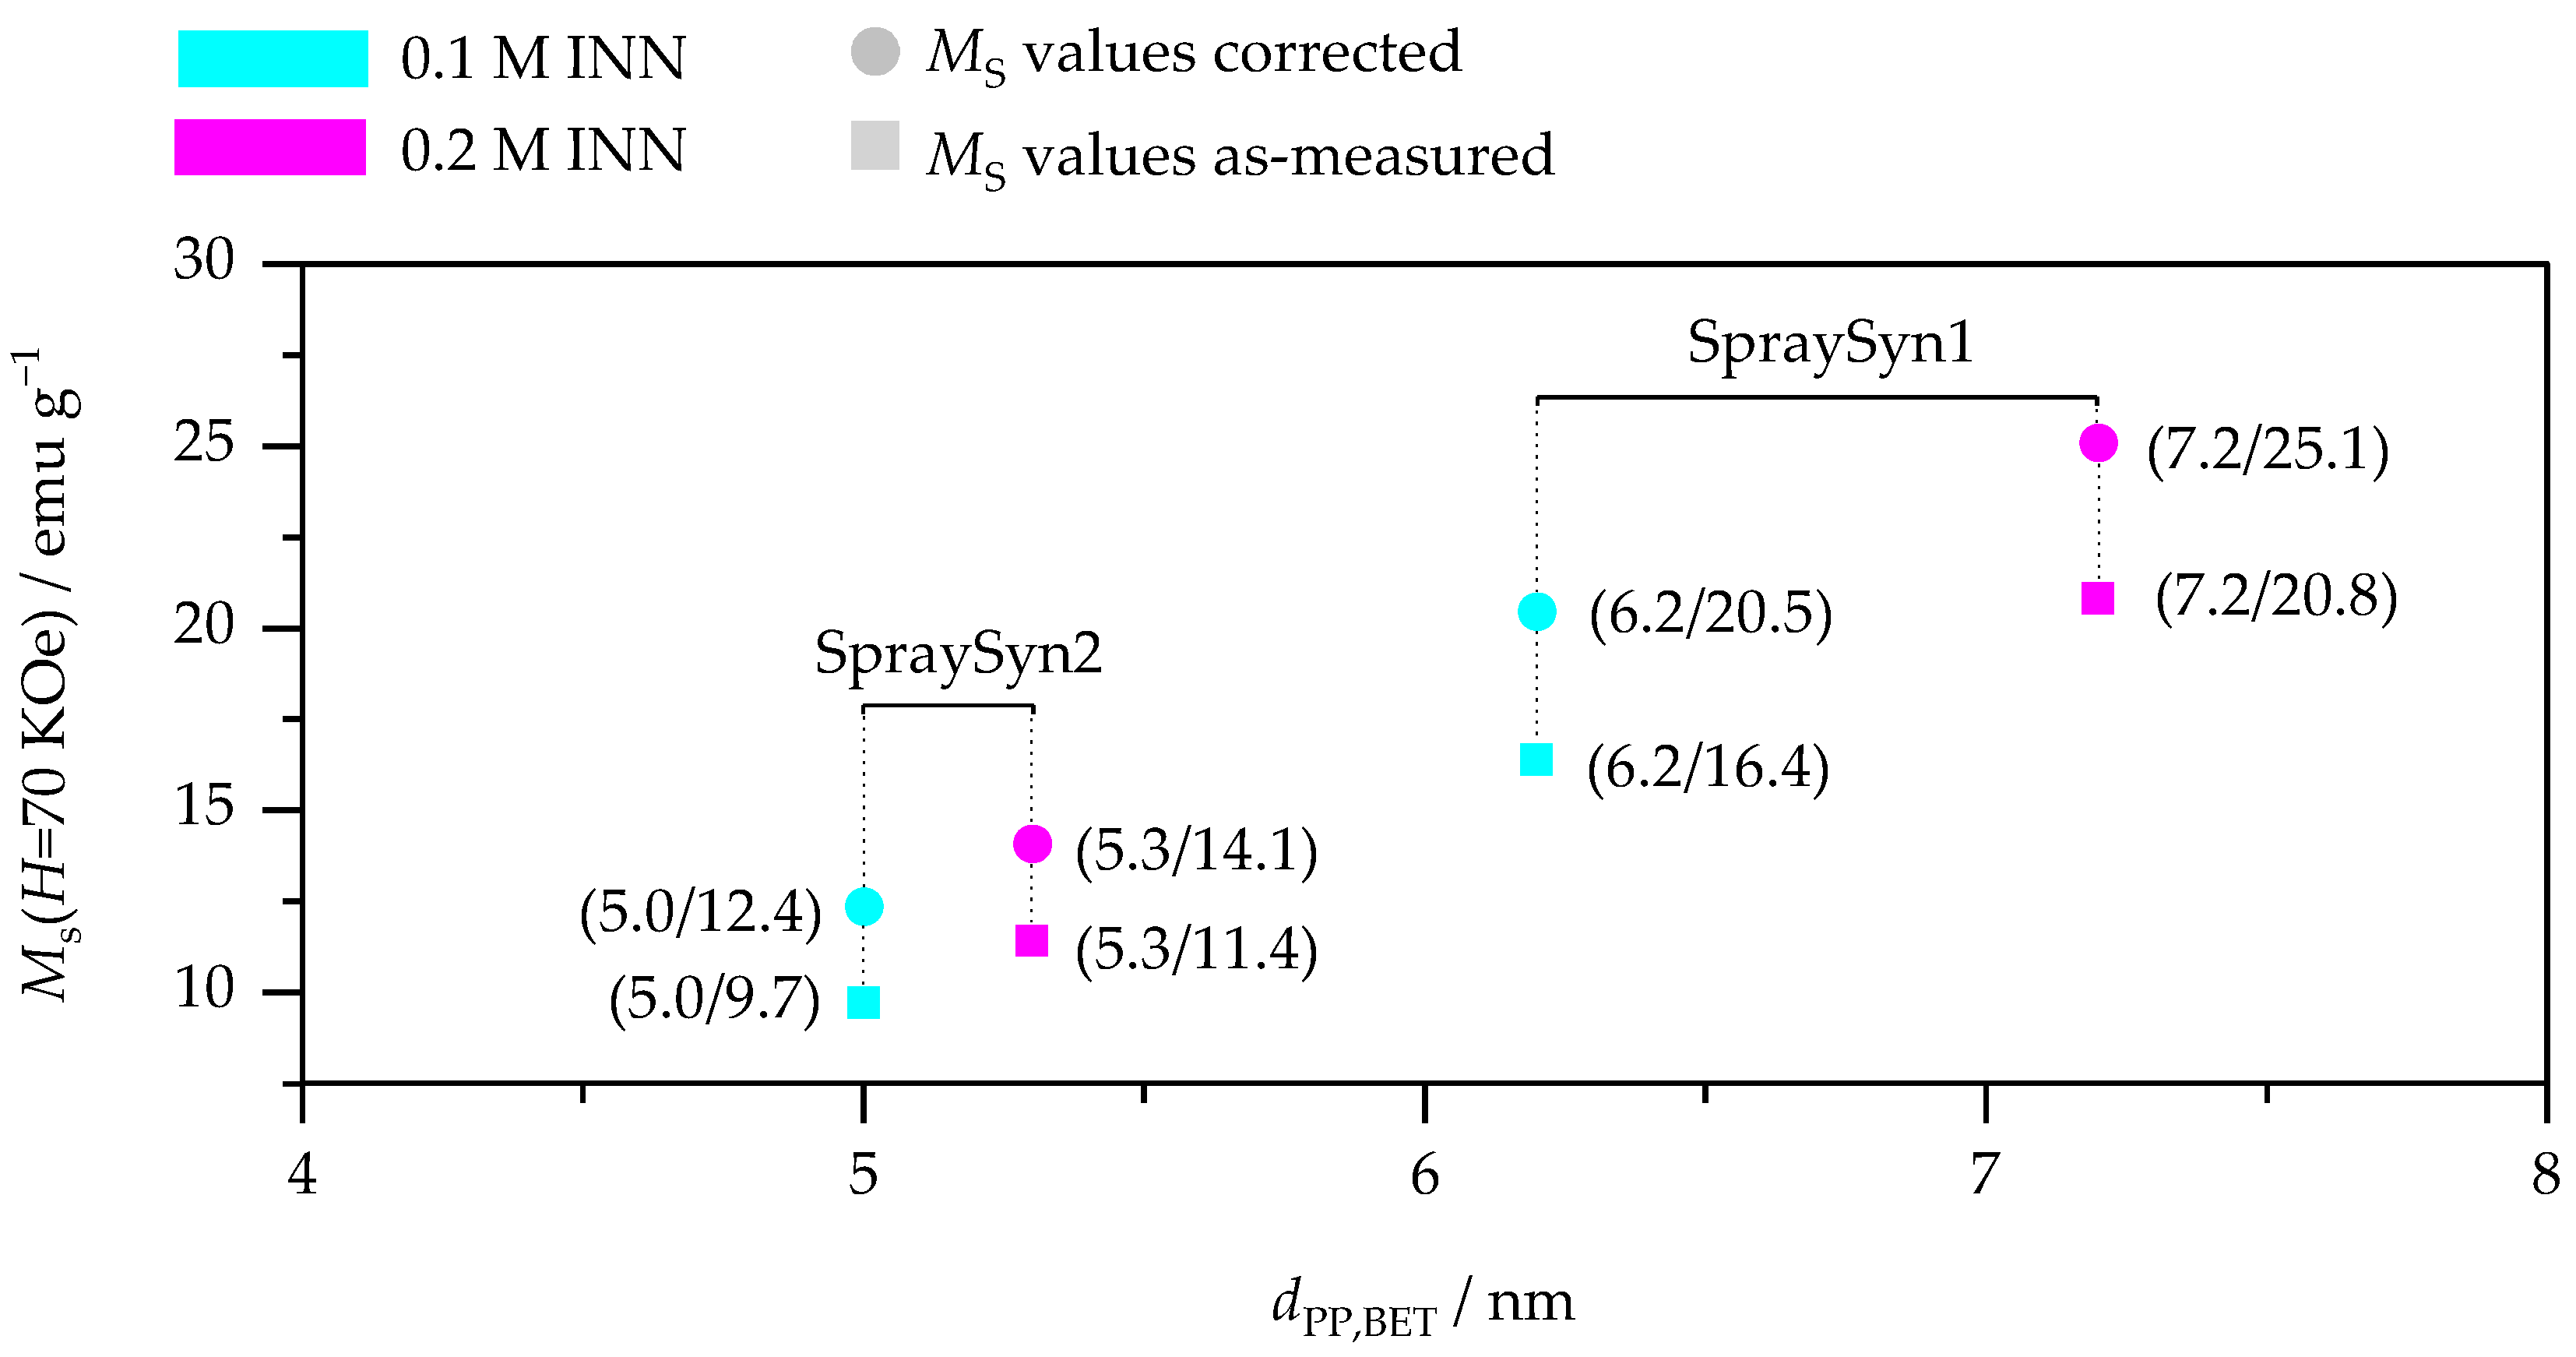
Since γ-Fe2O3 represents the dominant particle phase, each sample’s total γ-Fe2O3 content is given by the final steady-state TGA value in air, and all four contents of γ-Fe2O3 are presented in Table 3. As shown, the materials exhibit considerable mass losses (~17–21 wt.%) since by-products are present. The fact that solely four-fifths of the overall material mass belonging to γ-Fe2O3 is of particular relevance for weight-related particle applications, e.g., the vibrational magnetometry conducted earlier. To demonstrate this issue, Figure 8 depicts the materials as-measured M S values vs. M S values normalized to each sample’s respective γ-Fe2O3 content. These normalized values represent the M S values one would achieve if particle surfaces were entirely pure. This could be accomplished by applying post-synthesis treatments (e.g., thermal annealing or wet-chemistry procedures [2,15,57]). Since water, carbonates, and carboxylates are diamagnetic, they do not contribute to magnetic responses in VSM measurements, making the normalization procedure mentioned above plausible for the M S data.
(2)
Moreover, the individual mass fractions of water and carbonates/carboxylates can be determined by differentiating the TGA mass losses according to their respective TGA temperature ranges (below 150 °C for water desorption and above for thermal decomposition of organic species). This temperature threshold can be chosen because it represents a balanced compromise between the water desorption process and the organic species oxidation process (cf. Figure 7). Examining the TGA data this way reveals that the materials exhibit a weight loss of ~14–18 wt.% due to the oxidation of carbonates/carboxylates and of ~2–3 wt.% caused by water desorption (Table 3). Given the fact that these species are located on the particle surface, one can subsequently normalize their relative mass fractions to the samples’ respective SSA, yielding values for the particle surface loading (PSL, unit: mg m−2). This normalization procedure yields PSL values for water and organics, and corresponding values are shown in Table 3. As presented there, organic PSLs are independent of the precursor concentration. However, they depend on the burner type applied: SpraySyn1 samples exhibit organic PSLs at ~0.87 mg m−2, while SpraySyn2 samples attain slightly lower organic PSLs in the range of ~0.69–0.73 mg m−2. On the one hand, this indicates that SpraySyn2 yields particles with fewer carboxylates on the surface. On the other hand, this also indicates that surface-bond carboxylates could have lower average molar masses for SpraySyn2 samples. Both possibilities could coincide with a slightly more complete combustion for this burner type, likely attributable to differences in the burners’ flame activity profile: Recently, the study of Kennedy et al. indicated in experiments on a single SFS burner type that more transient combustion conditions can cause higher carboxylate and carbonate contents, which aligns well with the findings here [18]. Because the above-mentioned calculation of organic PSL values enables the comparison of the purity of SFS samples independently of the particle size, our methodology may be very valuable to denote/compare SFS-made materials in a more systematic way in the future. It would be interesting to prove whether this normalization approach is also transferable on other SFS materials.
Table 3. Comparison of the chemical composition of SFS-made γ-Fe2O3, as given by the TGA-DSC-MS data. Samples are prepared by using SpraySyn1 and SpraySyn2 as burner types and 0.1 M INN and 0.2 M INN in EtOH + EHA as precursor solution.
Burner typeSpraySyn1SpraySyn2
INN conc.0.1 M 0.2 M 0.1 M0.2 M
Total mass loss during TGA in air/%19.8017.0121.4118.83
γ-Fe2O3 content/%80.2082.9978.5981.17
Water relative mass/%2.702.433.352.83
Carbonate/carboxylate relative mass/%17.1014.5918.0616.00
PSL by water/mg m−20.140.140.140.12
PSL by carboxylates/carbonates/mg m−20.870.870.730.69

3.2. Local Particle Characteristics Probed by TS-TEM

In the second part of our study, the question is addressed whether TS-TEM experiments can be used to examine a local carbon formation with a certain temporal resolution. Given the powder analysis (Section 3.1), one may not expect a considerable carbon formation in situ. However, when processing 0.1 M INN in EtOH + EHA using SpraySyn1 (cf. Figure 1b) atomization, mixture formation and ignition are temporally unsteady [23,24], which may promote a temporal and local formation of carbon in the flame center. Hence, TS-TEM experiments are conducted at 5 cm HAB, and samples are extracted either from flame flickering or flame pulsing, allowing the examination of particle structures momentarily present during different flame activity. TS-TEM is also conducted at 15 cm HAB to investigate weather carbon can be found downstream of the flame.

3.2.1. TS-TEM Conducted at 15 cm HAB

By exposing a TEM sample grid at 15 cm HAB for t s = 100 ms, characteristic particle structures as shown in Figure 9a can be recognized. For this particular setup, the structural evolution of γ-Fe2O3 particles is mostly completed at 15 cm HAB since the process temperature as well as chemical reactions are already quenched to high extent there [27]. As illustrated in frame 1, low grid-loading densities are achieved by using t s = 100 ms, and agglomerates/aggregates are scattered at equal distances on the grid surface.
In terms of particle purity, neither amorphous particles nor core-shell structures can be found at 15 cm HAB, aligning with the powder analysis data (final particle structures do not exhibit carbon depositions). Admittedly, some very small particles appear amorphous at first glance (frame 4). However, on magnification, their crystal plane diffractions become visible (frame 5). By conducting FFT analysis on arbitrary particles, we obtained diffraction patterns comparable to the pattern previously shown in Figure 4a, again matching to γ-Fe2O3 and Fe3O4.
Regarding the particle structures the TS-TEM experiment at 15 cm HAB reveal that final particles structures are compact in structure (frames 2–5). Most aggregates and agglomerates are composed of only a small number of primary particles (frames 2, 3, 5). Moreover, even hexagonal particles without any agglomeration/aggregation are readily present (frame 4), and from a subjective point of view, most particles are in a range of ~5–20 nm.
Figure 9. Structure characteristics of γ-Fe2O3 particles present at 15 cm HAB using SpraySyn1 while processing 0.1 M INN in EtOH + EHA. Panel (a) represents exemplary illustrations obtained by TS-TEM experiments, while (b) represents HIAT-SMPS data with d P , E M as the particles’ electrical mobility equivalent diameter, N as number concentration, and σ G , N as number-weighted distribution width.
Applsci 15 03294 g009
These structure impressions were supplemented by local online measurements using a hole-in-tube probe coupled with scanning mobility particle sizing (HIAT-SMPS), which gave access to the particle size distribution present at 15 cm HAB. According to the experimental details of this approach, a sample is extracted continuously over a period of 1 min [11]. Hence, the data is averaged over a large time span compared to TS-TEM providing a certain statistical reliability. As illustrated in Figure 9b, by conducting HIAT-SMPS measurements at 15 cm HAB, log-normal particle size distributions are obtained with an average particle diameter of d P , E M ¯ = 10.5 nm and a geometrical standard deviation of σ G , N = 1.51, well aligning with the qualitative TEM data.

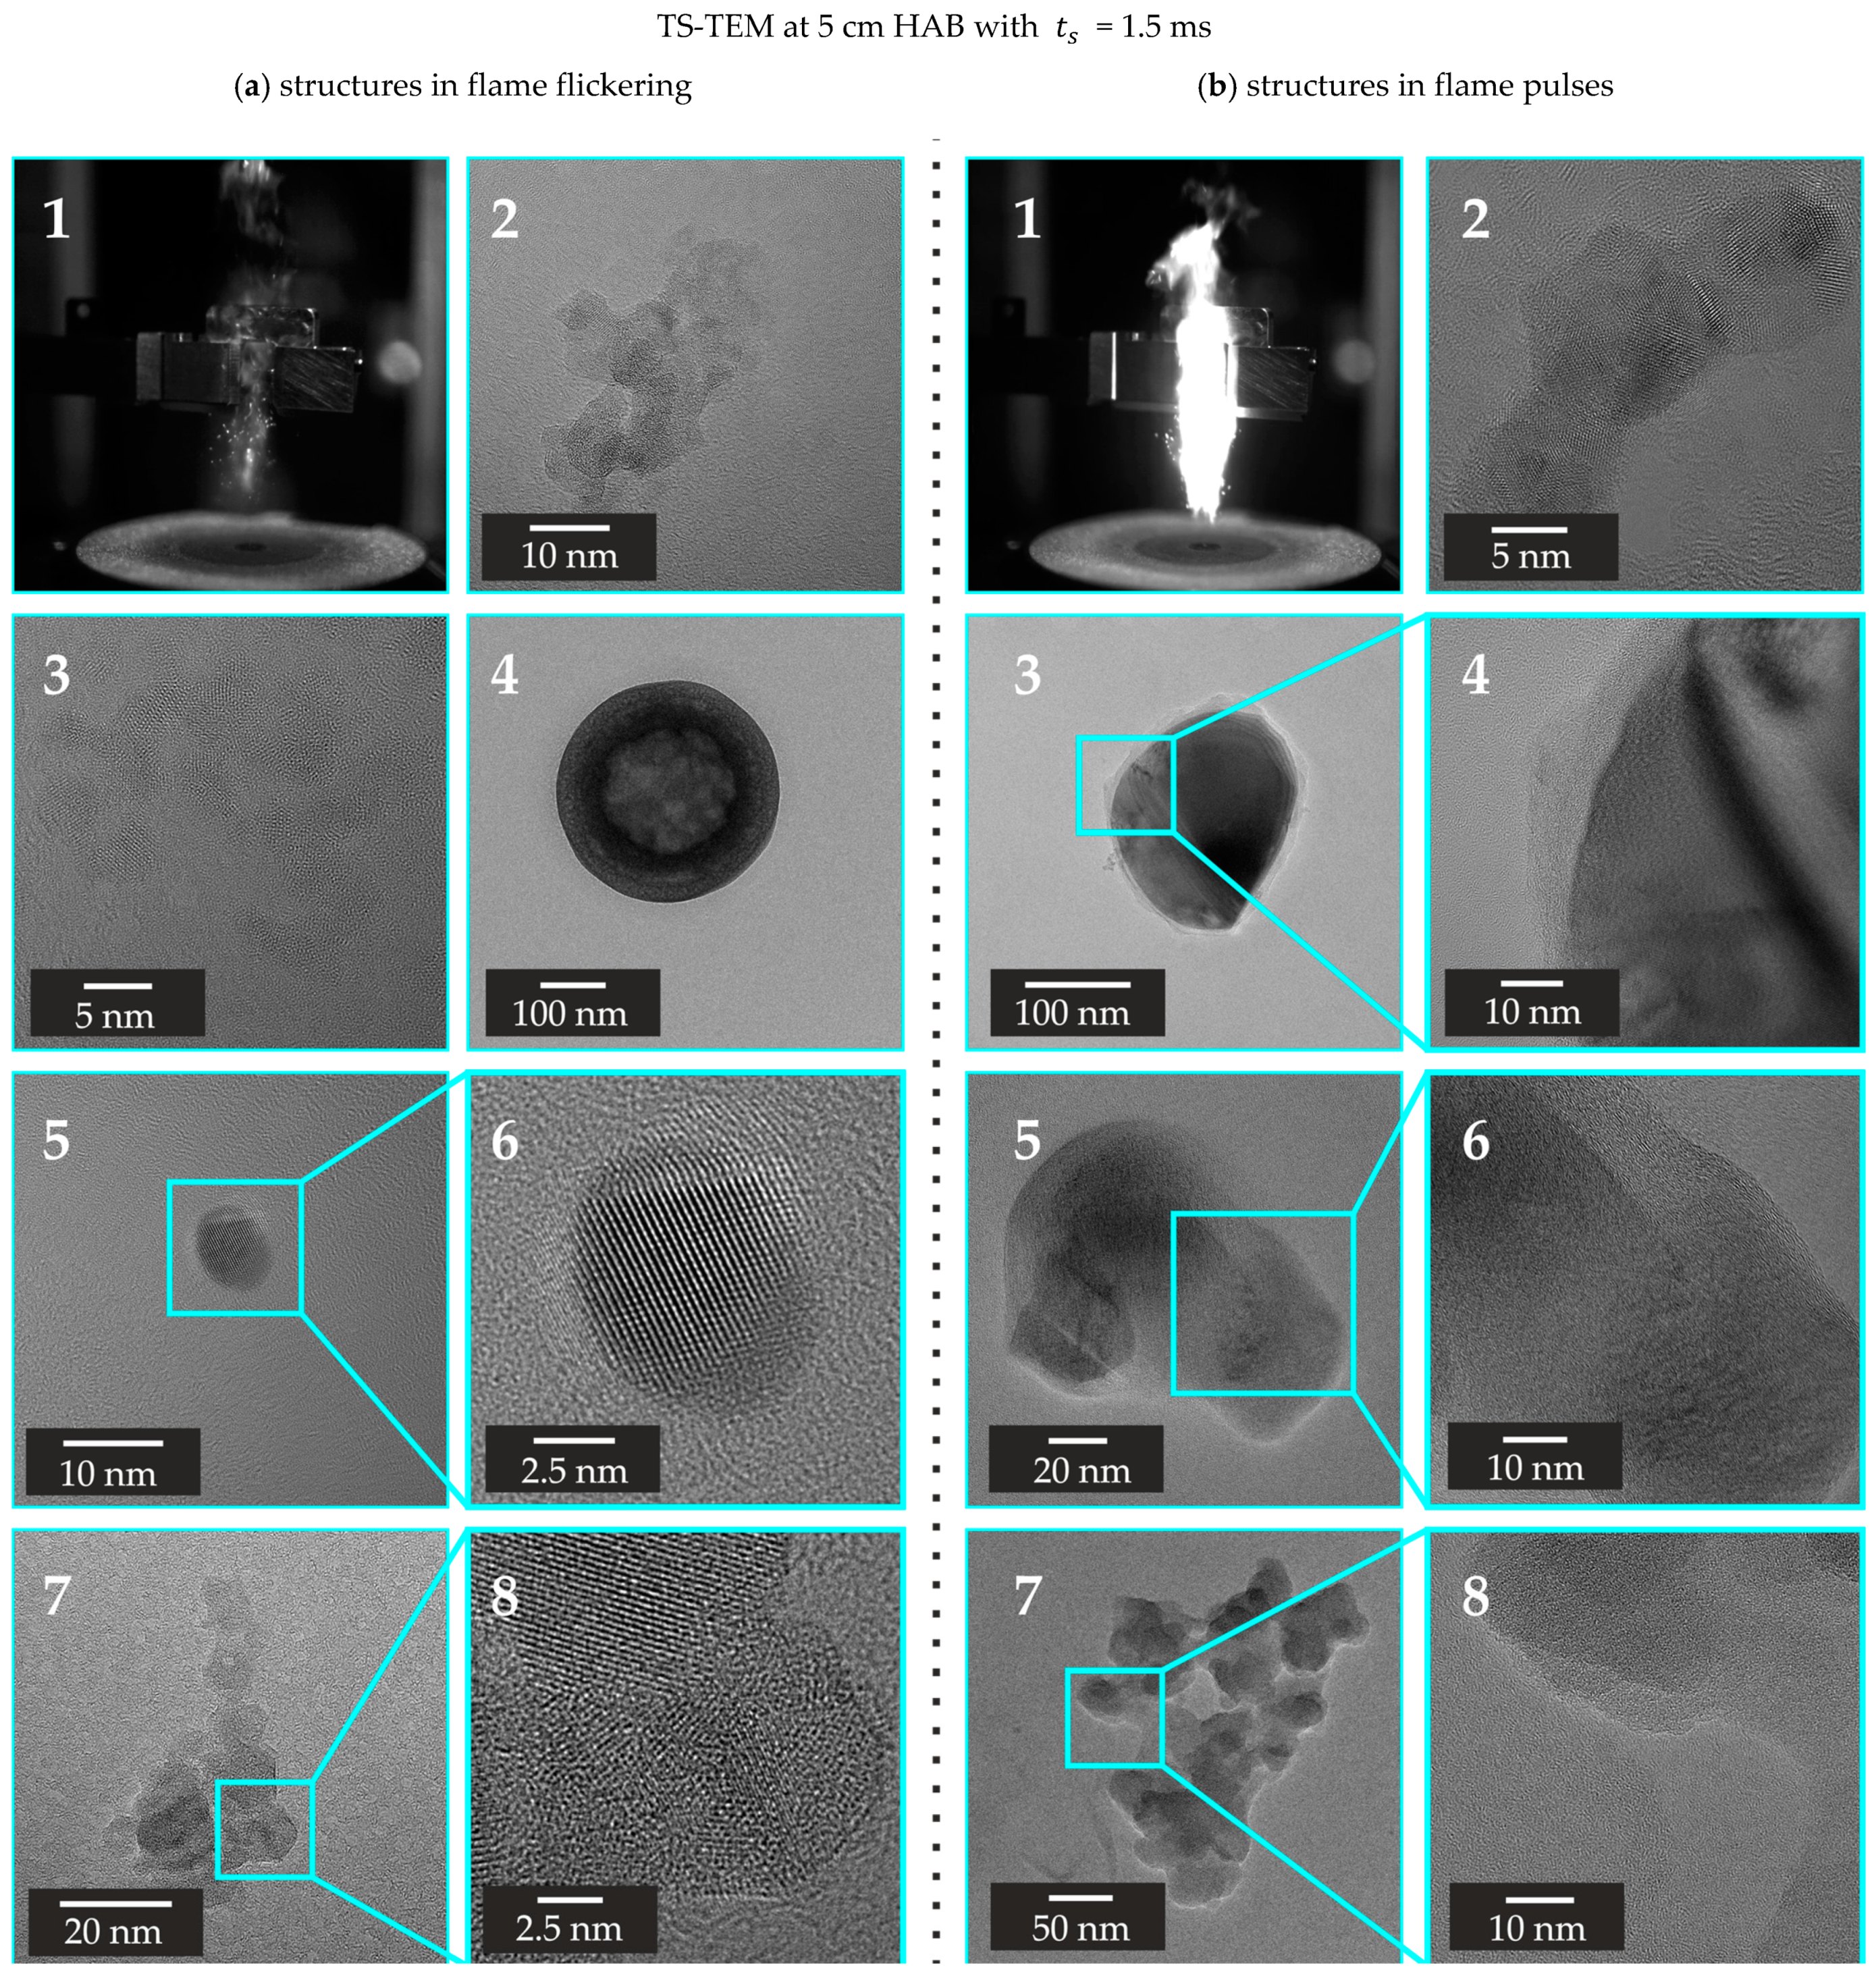
3.2.2. TS-TEM Conducted at 5 cm HAB

At 5 cm HAB, by applying sufficient low thermophoretic sampling times, particles can be selectively extracted either from different flame activities. Here, samples were taken by trial-and-error experiments using a sampling time of t s = 1.5 ms. In these experiments, extraction procedures were monitored using high-speed imaging (Fastcam SA-X2 1080K-M3 camera, Photron Deutschland GmbH, Reutlingen, Germany), and afterward, it was evaluated to which activity the extracted sample was related to. The corresponding high-speed data is available online (www.spraysyn.org, accessed on 1 February 2025).
By conducting trial-and-error experiments this way, we obtained samples predominately corresponding to either flame flickering or flame pulses, and representative particle structures present 5 cm HAB are illustrated in Figure 10. There, Figure 10a represents particle structures present in flame flickering, while Figure 10b depicts particle structures present in flame pulses.
As shown in Figure 10a, well-crystalline aggregates, aggregates, and non-agglomerated single particles can be readily found within flame flickering. From a subjective point of view, aggregates and agglomerates are most prominent (frames 2, 3, 7), followed by non-aggregated single particles (frames 4, 5). By applying higher magnification, the particles’ crystallinity can be evidenced since line patterns can be unambiguously recognized (frames 6, 8). By examining arbitrary particles this way, no evidences of amorphous matter, indicating carbon depositions can be recognized.
Figure 10. Structure characteristics of γ-Fe2O3 particles present at 5 cm HAB using SpraySyn1 while processing 0.1 M INN in EtOH + EHA. Panel (a) illustrates structures present in flame flickering (period of low flame activity), while (b) depicts particle morphologies present in pulses (period of high flame activity).
Applsci 15 03294 g010
As shown in Figure 10b, particles present in flame pulses have quite different morphologies. Most importantly, most extracted particles display core-shell structures (frames 3–6). Since these particles exhibit a crystalline core with an amorphous shell, it is indicated that carbon co-exists aside γ-Fe2O3 particles. Some layers showed C-onion structures upon magnification, which are typical for ordered carbon (frame 6) [21]. Aside from core-shell structures, also entirely amorphous aggregates can be recognized, indicating soot [58], and a corresponding structure is depicted in frame 7. Even at higher magnification, corresponding particles do not display any line pattern, unambiguously evidencing an absence of crystallinity (frame 8). All these structures co-exist aside crystalline γ-Fe2O3 particles (frame 2).
In relation, TS-TEM experiments conducted at 5 cm indicate that elementary carbon forms as side products aside from γ-Fe2O3 within flame pulses at 5 cm HAB when processing 0.1 M INN in EtOH + EHA using SpraySyn1. Since particles extracted from the flickering are crystalline, it is suggested that fuel-rich conditions are only temporarily present in flame pulses, causing a temporal/local oxygen deficiency promoting the formation of carbon there. Since no evidence is given for carbon by conducting TS-TEM experiments at 15 cm HAB, it is further suggested that carbon depositions oxidize/decompose further downstream.
The qualitative TS-TEM experiments employed here are of particular interest to the SFS community since the co-existence of carbon in SFS has potential to introduce experimental biases into optical/intrusive in situ diagnostics. Given the intrusive nature of thermophoretic sampling, a certain experimental bias on the carbon formation cannot be excluded, as sampling requires a temperature gradient, which also has the potential to promote carbon depositions. Hence, we encourage addressing the investigation of local and temporal carbon formation in SFS in future studies by further, non-intrusive techniques. In future studies, further time-resolved TS-TEM experiments could be used to investigate by-product formation in more detail. This may cover the examination of a statistical number of particles and/or samples, which could contribute to the quantification of local carbon contents. Since corresponding examinations will involve time-consuming post-image processing, we therefore encourage to consider the implementation of automated TEM analysis methods [59,60,61,62].

4. Conclusions

Powder analysis revealed that carboxylates and carbonates can be present as by-product species in considerable amounts in superparamagnetic γ-Fe2O3 prepared by SFS. As these species are located on particle surfaces, their mass contents can be normalized to the particle surface area, yielding particle surface loading (PSL) values that are independent to the samples’ particle size. A dependence of the organic PSL on the burner type was demonstrated, with SpraySyn2 showing lower loading values (~0.69–0.73 mg m−2) compared to SpraySyn1 (~0.87 mg m−2). This indicates a slightly more complete combustion for SpraySyn2, as carboxylates represent non-combusted organic species from the gas phase. The methodology used to determine the PSL values can be transferred to other SFS systems, allowing a more systematic comparison of the surface chemistry of SFS-made materials. In VSM measurements, the γ-Fe2O3 samples synthesized here exhibit superparamagnetism at room temperature with M S values (9.7–20.8 emu g−1) well correlating with the particle size (5.0–7.2 nm). Since the measured magnetic responses are attenuated by the amount of non-magnetic species present on the particle surface (~17–21 wt.%), materials with even stronger magnetic responses could potentially be obtained by applying surface purification techniques.
In addition, local particle investigations using time-resolved thermophoretic sampling followed by TEM (TS-TEM) revealed that carbon evolves instantaneously in flame pulses when synthesizing γ-Fe2O3 using SpraySyn1. There, core-shell structures and amorphous aggregates can be readily identified as co-existing with crystalline γ-Fe2O3. Downstream of the flame and in the final particle product, no evidence of carbon deposition can be found, demonstrating a low relevance of this temporal carbon formation for the final particle purity. However, the local/temporal presence of carbon in the visible flame has the potential to bias in situ diagnostics.

Supplementary Materials

The following supporting information can be downloaded at: https://www.mdpi.com/article/10.3390/app15063294/s1, Figure S1: BET N2 adsorption and desorption isotherms. Samples are prepared by using SpraySyn1 and SpraySyn2 as burner types and 0.2 M INN in EtOH + EHA as precursor solution; Figure S2: Magnetic responses measured by VSM at room temperature. Samples are prepared by using SpraySyn1 and SpraySyn2 as burner types and 0.1 M INN and 0.2 M INN in EtOH + EHA as precursor solution; Figure S3: Complex-binding configurations of carboxylates (A) and carbonates (B) on FexOy.

Author Contributions

Conceptualization, R.T. and H.-J.S.; methodology, R.T. and K.D.; software, R.T. and K.D.; validation, R.T. and K.D.; formal analysis, R.T.; investigation, R.T. and K.D.; resources, R.T., H.-J.S., K.D. and M.S.; data curation, R.T. and F.F.; writing—original draft preparation, R.T.; writing—review and editing, K.D., F.F., M.R., R.K., H.P., M.S. and H.-J.S.; visualization, R.T.; supervision, R.K., H.P., M.S. and H.-J.S.; project administration, R.T., F.F., M.R., R.K., H.P. and H.-J.S.; funding acquisition, R.T., F.F., M.R., R.K., H.P. and H.-J.S. All authors have read and agreed to the published version of the manuscript.

Funding

We kindly thank the DFG (German Research Foundation) for funding (grant number 375857587 including subproject numbers: SCHM 1429/13-1, KN 764/20-1, Pl 368/19-1).

Institutional Review Board Statement

Not applicable.

Informed Consent Statement

Not applicable.

Data Availability Statement

Entire data (powder analysis data and high-speed recordings) are available on an open-source database (www.spraysyn.org, accessed on 1 February 2025). Additionally, we provide the data and the TS sampler on request.

Conflicts of Interest

The authors declare no conflicts of interest.

References

  1. Pankhurst, Q.A.; Conolly, J.; Jones, S.K.; Dobson, J. Applications of magnetic nanoparticles in biomedicine. Appl. Phys. B 2003, 36, R167–R181. [Google Scholar] [CrossRef]
  2. Gupta, A.K.; Gupta, M. Synthesis and surface engineering of iron oxide nanoparticles for biomedical applications. Biomaterials 2005, 26, 3995–4021. [Google Scholar] [CrossRef] [PubMed]
  3. Gul, S.; Khan, S.B.; Rehman, I.U.; Khan, M.A.; Khan, M.I. A Comprehensive Review of Magnetic Nanomaterials Modern Day Theranostics. Front. Mater. 2019, 6, 179. [Google Scholar] [CrossRef]
  4. Cornell, R.M.; Schwertmann, U. The Iron Oxides: Structure, Properties, Reactions, Occurrences, and Uses; Wiley-VCH: Weinheim, Germany, 2003. [Google Scholar]
  5. Schwertmann, U.; Cornell, R.M. Iron Oxides in the Laboratory: Preparation and Characterization; John Wiley & Sons: Hoboken, NJ, USA, 2008. [Google Scholar]
  6. Li, S.; Ren, Y.; Biswas, P.; Tse, S.D. Flame aerosol synthesis of nanostructured materials and functional devices: Processing, modeling, and diagnostics. Prog. Energy Combust. Sci. 2016, 55, 1–59. [Google Scholar] [CrossRef]
  7. Strobel, R.; Pratsinis, S.E. Flame aerosol synthesis of smart nanostructured materials. J. Mater. Chem. 2007, 17, 4743. [Google Scholar] [CrossRef]
  8. Teoh, W.Y.; Amal, R.; Mädler, L. Flame spray pyrolysis: An enabling technology for nanoparticles design and fabrication. Nanoscale 2010, 2, 1324–1347. [Google Scholar] [CrossRef]
  9. Sorvali, M.; Nikka, M.; Juuti, P.; Honkanen, M.; Salminen, T.; Hyvärinen, L.; Mäkelä, J.M. Controlling the phase of iron oxide nanoparticles fabricated from iron (III) nitrate by liquid flame spray. Int. J. Ceram. Eng. Sci. 2019, 1, 194–205. [Google Scholar] [CrossRef]
  10. Sorvali, M.; Honkanen, M.; Hyvärinen, L.; Kuisma, R.; Larjo, J.; Mäkelä, J.M. Crystallographic phase formation of iron oxide particles produced from iron nitrate by liquid flame spray with a dual oxygen flow. Int. J. Ceram. Eng. Sci. 2021, 3, 227–236. [Google Scholar] [CrossRef]
  11. Tischendorf, R.; Simmler, M.; Weinberger, C.; Bieber, M.; Reddemann, M.; Fröde, F.; Lindner, J.; Pitsch, H.; Kneer, R.; Tiemann, M.; et al. Examination of the evolution of iron oxide nanoparticles in flame spray pyrolysis by tailored in situ particle sampling techniques. J. Aerosol Sci. 2021, 154, 105722. [Google Scholar] [CrossRef]
  12. Hammad, M.; Hardt, S.; Mues, B.; Salamon, S.; Landers, J.; Slabu, I.; Wende, H.; Schulz, C.; Wiggers, H. Gas-phase synthesis of iron oxide nanoparticles for improved magnetic hyperthermia performance. J. Alloys Compd. 2020, 824, 153814. [Google Scholar] [CrossRef]
  13. Carvajal, L.; Buitrago-Sierra, R.; Santamaría, A.; Angel, S.; Wiggers, H.; Gallego, J. Effect of Spray Parameters in a Spray Flame Reactor During FexOy Nanoparticles Synthesis. J. Therm. Spray Technol. 2020, 29, 368–383. [Google Scholar] [CrossRef]
  14. Meierhofer, F.; Li, H.; Gockeln, M.; Kun, R.; Grieb, T.; Rosenauer, A.; Fritsching, U.; Kiefer, J.; Birkenstock, J.; Mädler, L.; et al. Screening Precursor-Solvent Combinations for Li4Ti5O12 Energy Storage Material Using Flame Spray Pyrolysis. ACS Appl. Mater. Interfaces 2017, 9, 37760–37777. [Google Scholar] [CrossRef] [PubMed]
  15. Alkan, B.; Medina, D.; Landers, J.; Heidelmann, M.; Hagemann, U.; Salamon, S.; Andronescu, C.; Wende, H.; Schulz, C.; Schuhmann, W.; et al. Spray-Flame-Prepared LaCo 1– xFexO3 Perovskite Nanoparticles as Active OER Catalysts: Influence of Fe Content and Low-Temperature Heating. ChemElectroChem 2020, 7, 2564–2574. [Google Scholar] [CrossRef]
  16. Grimm, S.; Stelzner, T.; Leuthäußer, J.; Barth, S.; Heide, K. Particle size effects on the thermal behaviour of maghemite synthesised by flame pyrolysis. Thermochim. Acta 1997, 300, 141–148. [Google Scholar] [CrossRef]
  17. Grimm, S.; Schulz, M.; Barth, S.; Müller, R. Flame pyrolysis—A preparation route for ultrafine pure gamma-Fe2O3 powders and the control of their particle size and properties. J. Mater. Sci. 1997, 32, 1083–1092. [Google Scholar] [CrossRef]
  18. Kennedy, C.M.; Zhang, Y.; Zou, S.; Dunn, M.J.; Masri, A.R. Influence of flame stability on iron oxide nanoparticle growth during FSP. J. Aerosol Sci. 2025, 183, 106475. [Google Scholar] [CrossRef]
  19. Strobel, R.; Pratsinis, S.E. Direct synthesis of maghemite, magnetite and wustite nanoparticles by flame spray pyrolysis. Adv. Powder Technol. 2009, 20, 190–194. [Google Scholar] [CrossRef]
  20. Li, Y.; Hu, Y.; Huang, G.; Li, C. Metallic iron nanoparticles: Flame synthesis, characterization and magnetic properties. Particuology 2013, 11, 460–467. [Google Scholar] [CrossRef]
  21. Herrmann, I.K.; Grass, R.N.; Mazunin, D.; Stark, W.J. Synthesis and Covalent Surface Functionalization of Nonoxidic Iron Core−Shell Nanomagnets. Chem. Mater. 2009, 21, 3275–3281. [Google Scholar] [CrossRef]
  22. Ren, Y.; Ran, K.; Kruse, S.; Mayer, J.; Pitsch, H. Flame synthesis of carbon metal-oxide nanocomposites in a counterflow burner. Proc. Combust. Inst. 2021, 38, 1269–1277. [Google Scholar] [CrossRef]
  23. Karaminejad, S.; Dupont, S.M.; Bieber, M.; Reddemann, M.A.; Kneer, R.; Dreier, T.; Endres, T.; Schulz, C. Characterization of spray parameters and flame stability in two modified nozzle configurations of the SpraySyn burner. Proc. Combust. Inst. 2023, 39, 2673–2682. [Google Scholar] [CrossRef]
  24. Bieber, M.; Al-Khatib, M.; Fröde, F.; Pitsch, H.; Reddemann, M.A.; Schmid, H.J.; Tischendorf, R.; Kneer, R. Influence of angled dispersion gas on coaxial atomization, spray and flame formation in the context of spray-flame synthesis of nanoparticles. Exp. Fluids 2021, 62, 98. [Google Scholar] [CrossRef]
  25. Kumar, A.; Kirchmann, J.; Beyrau, F.; Kronenburg, A. Jet flapping and its effect on flame oscillations in the SPP1980 SpraySyn burner. Exp. Therm. Fluid Sci. 2023, 142, 110826. [Google Scholar] [CrossRef]
  26. Schneider, F.; Suleiman, S.; Menser, J.; Borukhovich, E.; Wlokas, I.; Kempf, A.; Wiggers, H.; Schulz, C. SpraySyn—A standardized burner configuration for nanoparticle synthesis in spray flames. Rev. Sci. Instrum. 2019, 90, 85108. [Google Scholar] [CrossRef]
  27. Fröde, F.; Grenga, T.; Dupont, S.M.; Kneer, R.; Tischendorf, R.; Massopa, O.; Schmid, H.J.; Pitsch, H. Large Eddy Simulation of Iron Oxide Formation in a Laboratory Spray Flame. Appl. Energy Combust. Sci. 2023, 16, 100191. [Google Scholar] [CrossRef]
  28. Skenderović, I.; Kruis, F.E. Investigation and simulation of droplet breakup and iron oxide nanoparticle formation in spray-flame synthesis. J. Aerosol Sci. 2025, 185, 106535. [Google Scholar] [CrossRef]
  29. Abdelsamie, A.; Guan, W.; Nanjaiah, M.; Wlokas, I.; Wiggers, H.; Thévenin, D. Investigating the impact of dispersion gas composition on the flame structure in the SpraySyn burner using DNS. Proc. Combust. Inst. 2024, 40, 105398. [Google Scholar] [CrossRef]
  30. Lang, P.; Kücükmeric, E.; Huber, F.J.T.; Will, S. Investigation of iron oxide nanoparticle formation in a spray-flame synthesis process using laser-induced incandescence. Appl. Phys. B 2024, 130, 199. [Google Scholar] [CrossRef]
  31. Klukas, S.; Giglmaier, M.; Underberg, M.; Schnurre, S.M.; Prenting, M.M.; Endres, T.; Wiggers, H.; Schulz, C.; Sieber, M.; Schimek, S.; et al. Iron oxide nanoparticle synthesis: Simulation-based comparison of laboratory- and pilot plant-scale spray-flame synthesis. Appl. Energy Combust. Sci. 2024, 18, 100263. [Google Scholar] [CrossRef]
  32. Kirstein, T.; Aßmann, S.; Furat, O.; Will, S.; Schmidt, V. Determination of droplet size from wide-angle light scattering image data using convolutional neural networks. Mach. Learn. Sci. Technol. 2024, 5, 15049. [Google Scholar] [CrossRef]
  33. Eitner, A.; Al-Kamal, A.K.; Ali, M.Y.; Sheikh, M.-A.; Schulz, C.; Wiggers, H. Spray-flame synthesis of Nb-doped TiO2 nanoparticles and their electrochemical performance in sodium-ion batteries. Appl. Energy Combust. Sci. 2024, 17, 100252. [Google Scholar] [CrossRef]
  34. Baik, S.-J.; Martins, F.J.W.A.; Beyrau, F.; Kempf, A. Synthetic Inlet Conditions for Inhomogeneous Flows from Filters, Packed Beds, or Sinter Plates. Flow Turbul. Combust. 2024, 112, 483–489. [Google Scholar] [CrossRef]
  35. Aßmann, S.; Huber, F.J.; Will, S. In situ characterization of particle formation in spray flame synthesis using wide-angle light scattering. Particuology 2024, 86, 304–312. [Google Scholar] [CrossRef]
  36. Al-Kamal, A.K.; Hammad, M.; Yusuf Ali, M.; Angel, S.; Segets, D.; Schulz, C.; Wiggers, H. Titania/graphene nanocomposites from scalable gas-phase synthesis for high-capacity and high-stability sodium-ion battery anodes. Nanotechnology 2024, 35, 225602. [Google Scholar] [CrossRef]
  37. Lang, P.; Schneider, N.E.; Huber, F.J.; Will, S. Characterization of the SpraySyn 2.0 burner: Droplet diameters, flame stability and particle sizes. Appl. Energy Combust. Sci. 2025, 22, 100324. [Google Scholar] [CrossRef]
  38. Jüngst, N.; Ersoy, V.; Smallwood, G.J.; Kaiser, S.A. Neural networks for classification and segmentation of thermally-induced droplet breakup in spray-flame synthesis. J. Aerosol Sci. 2024, 176, 106314. [Google Scholar] [CrossRef]
  39. Kirchmann, J.; Kronenburg, A.; Prenting, M.M.; Karaminejad, S.; Dreier, T.; Endres, T.; Patil, S.; Beyrau, F. Characterizing the SpraySyn burners with MMC-LES. Appl. Energy Combust. Sci. 2023, 15, 100182. [Google Scholar] [CrossRef]
  40. Tischendorf, R.; Massopo, O.; Prymak, O.; Dupont, S.; Fröde, F.; Pitsch, H.; Kneer, R.; Schmid, H.-J. Maghemite nanoparticles synthesis via spray flame synthesis and particle characterization by hole in a tube sampling and scanning mobility particle sizing (HIAT-SMPS). Appl. Energy Combust. Sci. 2024, 17, 100235. [Google Scholar] [CrossRef]
  41. Hanesch, M. Raman spectroscopy of iron oxides and (oxy)hydroxides at low laser power and possible applications in environmental magnetic studies. Geophys. J. Int. 2009, 177, 941–948. [Google Scholar] [CrossRef]
  42. Altenhoff, M.; Teige, C.; Storch, M.; Will, S. Novel electric thermophoretic sampling device with highly repeatable characteristics. Rev. Sci. Instrum. 2016, 87, 125108. [Google Scholar] [CrossRef]
  43. Kunze, F.; Kuns, S.; Spree, M.; Hülser, T.; Schulz, C.; Wiggers, H.; Schnurre, S.M. Synthesis of silicon nanoparticles in a pilot-plant-scale microwave plasma reactor: Impact of flow rates and precursor concentration on the nanoparticle size and aggregation. Powder Technol. 2019, 342, 880–886. [Google Scholar] [CrossRef]
  44. Carbone, F.; Moslih, S.; Gomez, A. Probing gas-to-particle transition in a moderately sooting atmospheric pressure ethylene/air laminar premixed flame. Part II: Molecular clusters and nascent soot particle size distributions. Combust. Flame 2017, 181, 329–341. [Google Scholar] [CrossRef]
  45. Vargas, A.M.; Gülder, Ö.L. A multi-probe thermophoretic soot sampling system for high-pressure diffusion flames. Rev. Sci. Instrum. 2016, 87, 55101. [Google Scholar] [CrossRef] [PubMed]
  46. Leschowski, M.; Dreier, T.; Schulz, C. An automated thermophoretic soot sampling device for laboratory-scale high-pressure flames. Rev. Sci. Instrum. 2014, 85, 45103. [Google Scholar] [CrossRef] [PubMed]
  47. Lee, J.; Altman, I.; Choi, M. Design of thermophoretic probe for precise particle sampling. J. Aerosol Sci. 2008, 39, 418–431. [Google Scholar] [CrossRef]
  48. Talbot, L.; Cheng, R.K.; Schefer, R.W.; Willis, D.R. Thermophoresis of particles in a heated boundary layer. J. Fluid Mech. 1980, 101, 737–758. [Google Scholar] [CrossRef]
  49. De Faria, D.L.A.; Silva, S.V.; de Oliveira, M.T. Raman Microspectroscopy of Some Iron Oxides and Oxyhydroxides. J. Raman Spectrosc. 1997, 28, 873–878. [Google Scholar] [CrossRef]
  50. Saito, R.; Hofmann, M.; Dresselhaus, G.; Jorio, A.; Dresselhaus, M.S. Raman spectroscopy of graphene and carbon nanotubes. Adv. Phys. 2011, 60, 413–550. [Google Scholar] [CrossRef]
  51. Li, D.; Teoh, W.Y.; Selomulya, C.; Woodward, R.C.; Munroe, P.; Amal, R. Insight into microstructural and magnetic properties of flame-made γ-Fe2O3 nanoparticles. J. Mater. Chem. 2007, 17, 4876. [Google Scholar] [CrossRef]
  52. Zhu, H.J.; Hill, R.H. The photochemical metal organic deposition of manganese oxide films from films of manganese (II) 2-ethylhexanoate: A mechanistic study. J. Non Cryst. Solids 2002, 311, 174–184. [Google Scholar] [CrossRef]
  53. Lee, Y.-J.; Jun, K.-W.; Park, J.-Y.; Potdar, H.S.; Chikate, R.C. A simple chemical route for the synthesis of γ-Fe2O3 nano-particles dispersed in organic solvents via an iron–hydroxy oleate precursor. J. Ind. Eng. Chem. 2008, 14, 38–44. [Google Scholar] [CrossRef]
  54. Meierhofer, F.; Mädler, L.; Fritsching, U. Nanoparticle evolution in flame spray pyrolysis—Process design via experimental and computational analysis. AIChE J. 2020, 66, e16885. [Google Scholar] [CrossRef]
  55. Bargar, J.R.; Kubicki, J.D.; Reitmeyer, R.; Davis, J.A. ATR-FTIR spectroscopic characterization of coexisting carbonate surface complexes on hematite. Geochim. Cosmochim. Acta 2005, 69, 1527–1542. [Google Scholar] [CrossRef]
  56. Deshpande, K.; Mukasyan, A.; Varma, A. Direct Synthesis of Iron Oxide Nanopowders by the Combustion Approach: Reaction Mechanism and Properties. Chem. Mater. 2004, 16, 4896–4904. [Google Scholar] [CrossRef]
  57. Angel, S.; Tapia, J.D.; Gallego, J.; Hagemann, U.; Wiggers, H. Spray-Flame Synthesis of LaMnO 3+δ Nanoparticles for Selective CO Oxidation (SELOX). Energy Fuels 2021, 35, 4367–4376. [Google Scholar] [CrossRef]
  58. Rodriguez-Fernandez, H.; Dasappa, S.; Sabado, K.D.; Camacho, J. Production of Carbon Black in Turbulent Spray Flames of Coal Tar Distillates. Appl. Sci. 2021, 11, 10001. [Google Scholar] [CrossRef]
  59. Frei, M.; Kruis, F.E. Image-based size analysis of agglomerated and partially sintered particles via convolutional neural networks. Powder Technol. 2020, 360, 324–336. [Google Scholar] [CrossRef]
  60. Frei, M.; Kruis, F.E. Fully automated primary particle size analysis of agglomerates on transmission electron microscopy images via artificial neural networks. Powder Technol. 2018, 332, 120–130. [Google Scholar] [CrossRef]
  61. Mahr, C.; Stahl, J.; Gerken, B.; Baric, V.; Frei, M.; Krause, F.F.; Grieb, T.; Schowalter, M.; Mehrtens, T.; Kruis, E.; et al. Characterization of mixing in nanoparticle hetero-aggregates by convolutional neural networks. Nano Sel. 2024, 5, 2300128. [Google Scholar] [CrossRef]
  62. Sipkens, T.A.; Frei, M.; Baldelli, A.; Kirchen, P.; Kruis, F.E.; Rogak, S.N. Characterizing soot in TEM images using a convolutional neural network. Powder Technol. 2021, 387, 313–324. [Google Scholar] [CrossRef]
Figure 3. TS-TEM extraction principle. Images captured by high-speed monitoring without flame. The TEM grid (magenta) is adhered to an inner slider (dotted line) and is exposed to the environment by passing through a recess (width = 7 mm).
Applsci 15 03294 g003
Figure 5. BET data for γ-Fe2O3 particles prepared by SpraySyn1 (a) and SpraySyn2 (b). Samples: 0.1 M INN and 0.2 M INN in EtOH + EHA.
Applsci 15 03294 g005
Figure 8. Experimental M S values as measured by VSM at H = 70 kOe (squares) compared to the samples’ M S values normalized to their γ-Fe2O3 content (spheres). Samples are prepared by using SpraySyn1 and SpraySyn2 as burner types and 0.1 M INN and 0.2 M INN in EtOH + EHA as precursor solution.
Applsci 15 03294 g008
Table 1. Comparison of ϕ and H applied.
INN conc.0.1 M0.2 M0.1 M0.2 M
Burner typeSpraySyn1SpraySyn2
H/kJ mol−13.113.103.113.10
ϕ/-0.26240.26220.26240.2622
Table 2. High-field magnetizations ( M S at H = 70 kOe) determined by VSM. Given their difference in d P P , B E T , γ-Fe2O3 samples exhibit different magnetic response strengths. Samples prepared by SFS using SpraySyn1 and SpraySyn2 by processing 0.1 M INN and 0.2 M INN in EtOH + EHA.
INN conc.0.1 M0.2 M0.1 M0.2 M
Burner type SpraySyn1SpraySyn2
d P P , B E T /nm6.27.25.05.3
M S /emu g−116.420.89.711.4
Disclaimer/Publisher’s Note: The statements, opinions and data contained in all publications are solely those of the individual author(s) and contributor(s) and not of MDPI and/or the editor(s). MDPI and/or the editor(s) disclaim responsibility for any injury to people or property resulting from any ideas, methods, instructions or products referred to in the content.

