
A Study on Deep Learning Performances of Identifying Images’ Emotion: Comparing Performances of Three Algorithms to Analyze Fashion Items


Abstract
:1. Introduction
1.1. Research Background and Topic
1.2. Related Works
1.3. Structure and Research Process
2. Algorithms and Neural Network Definitions
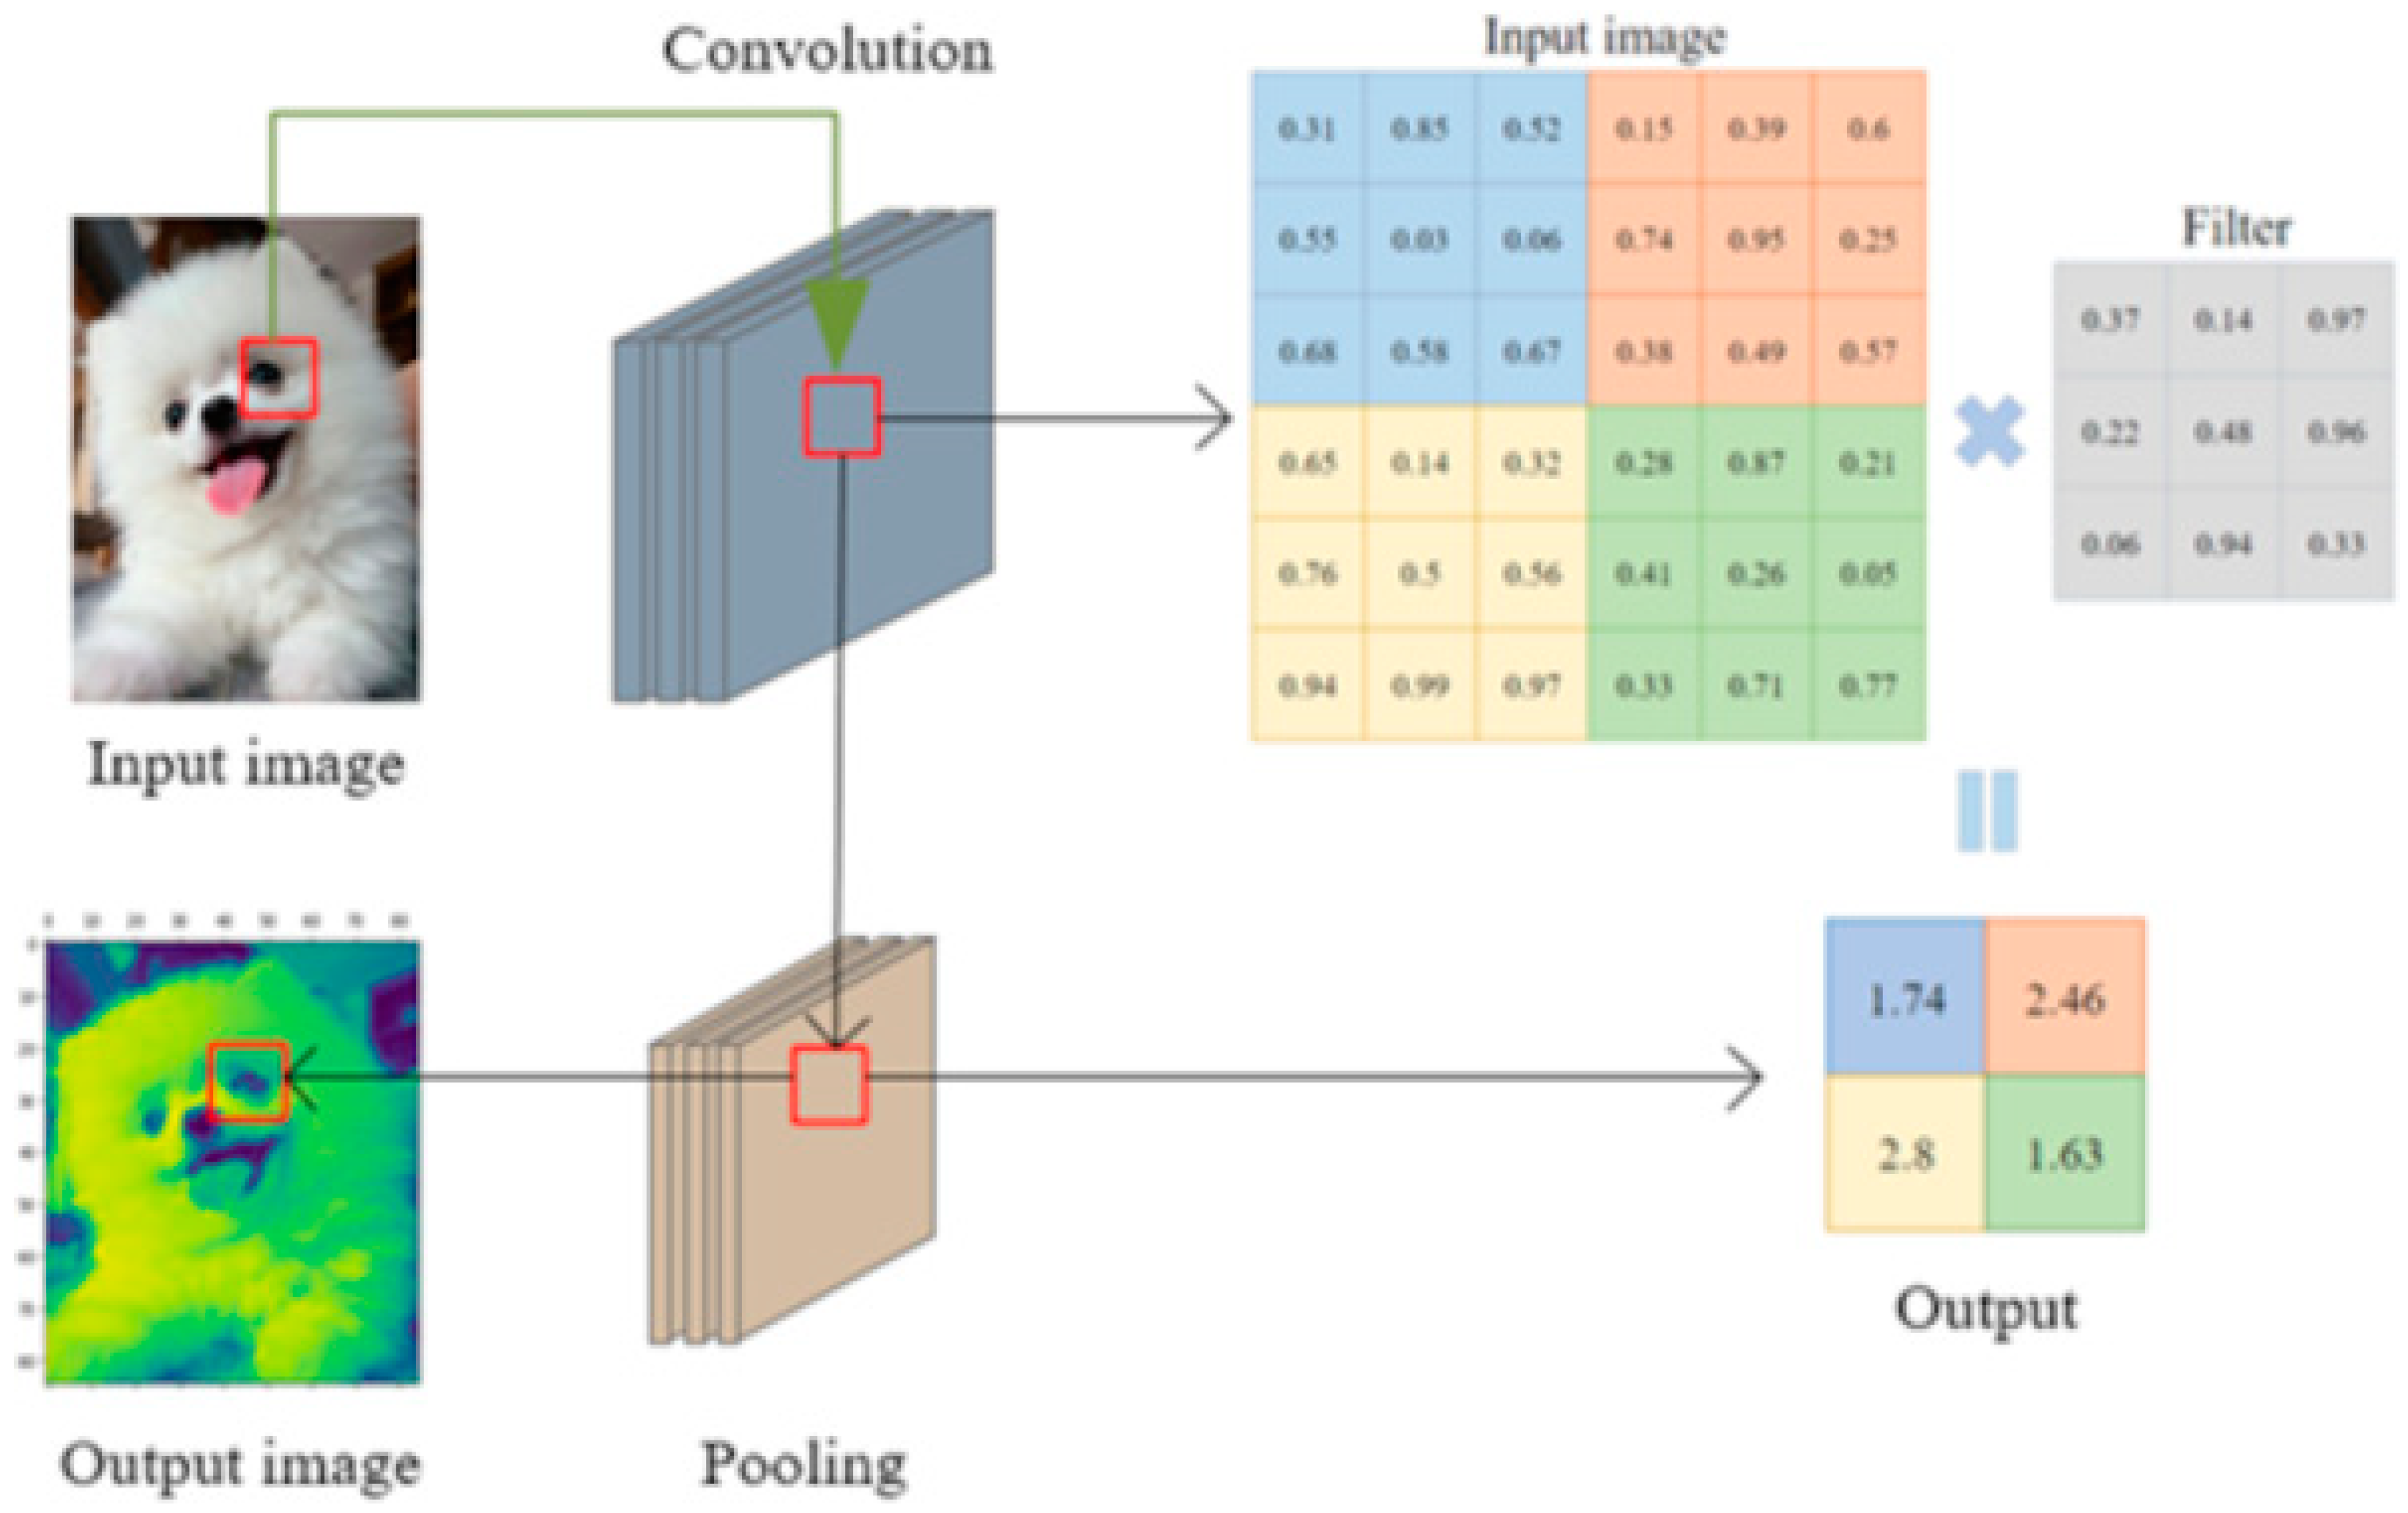
2.1. CNN (Convolutional Neural Network)
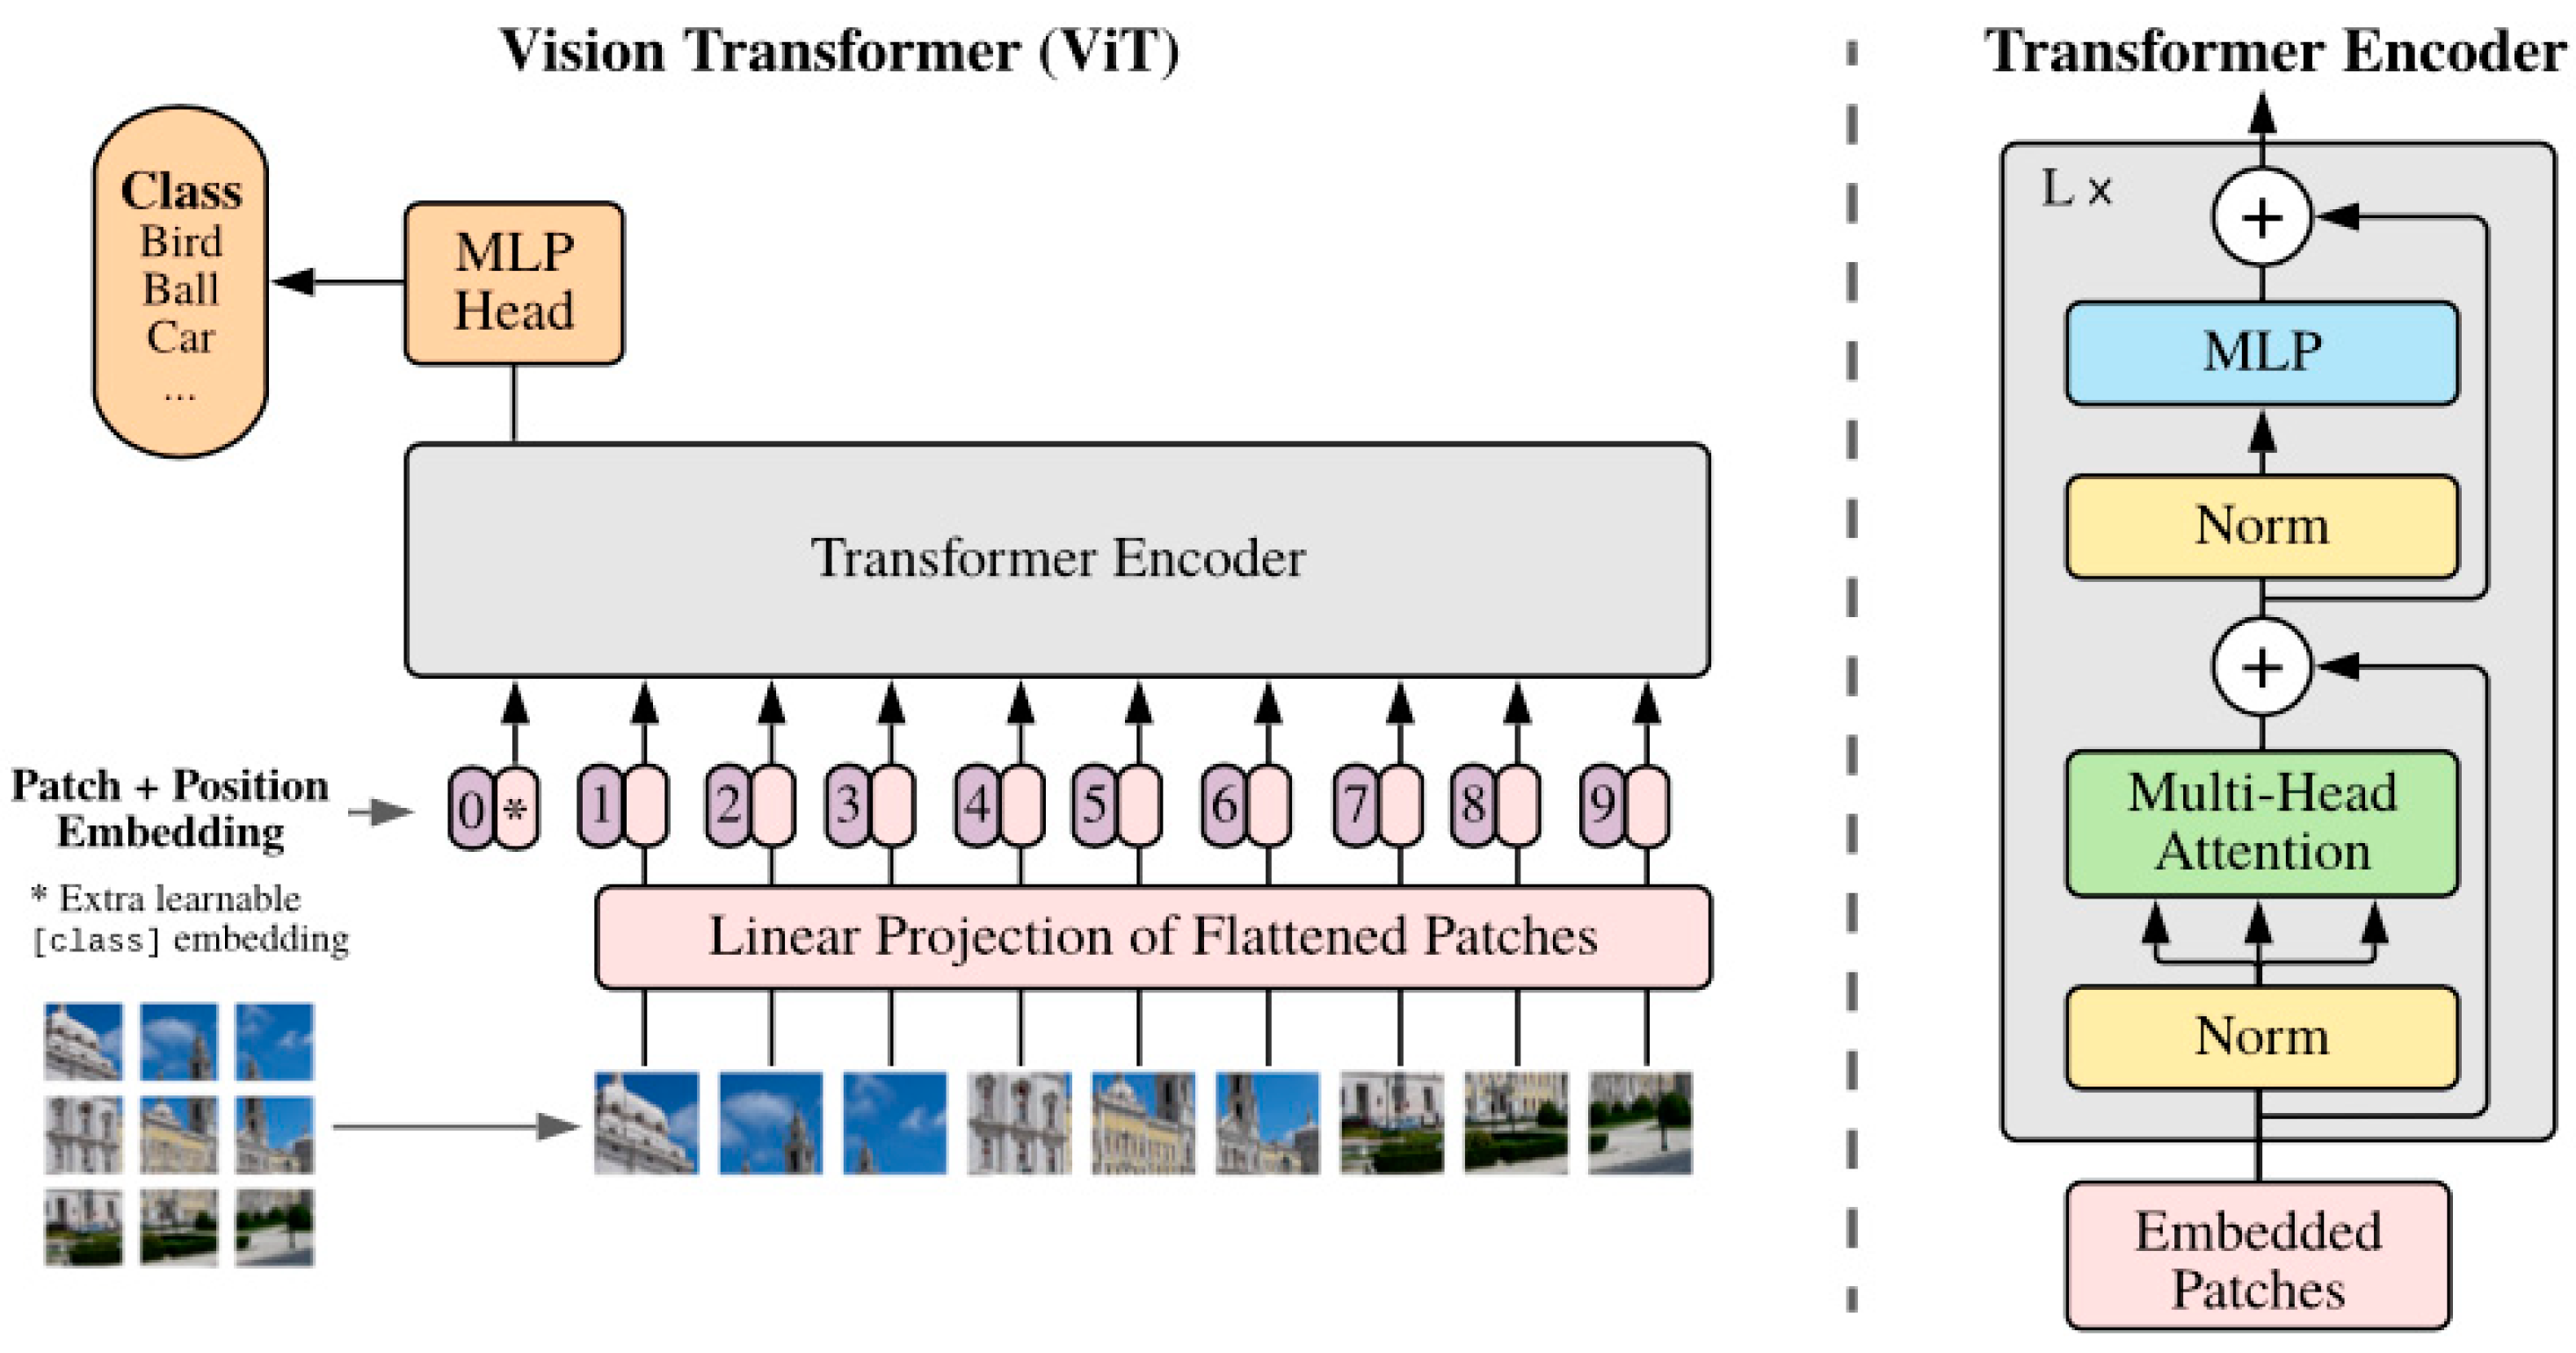
2.2. ViT (Vision Transformer)
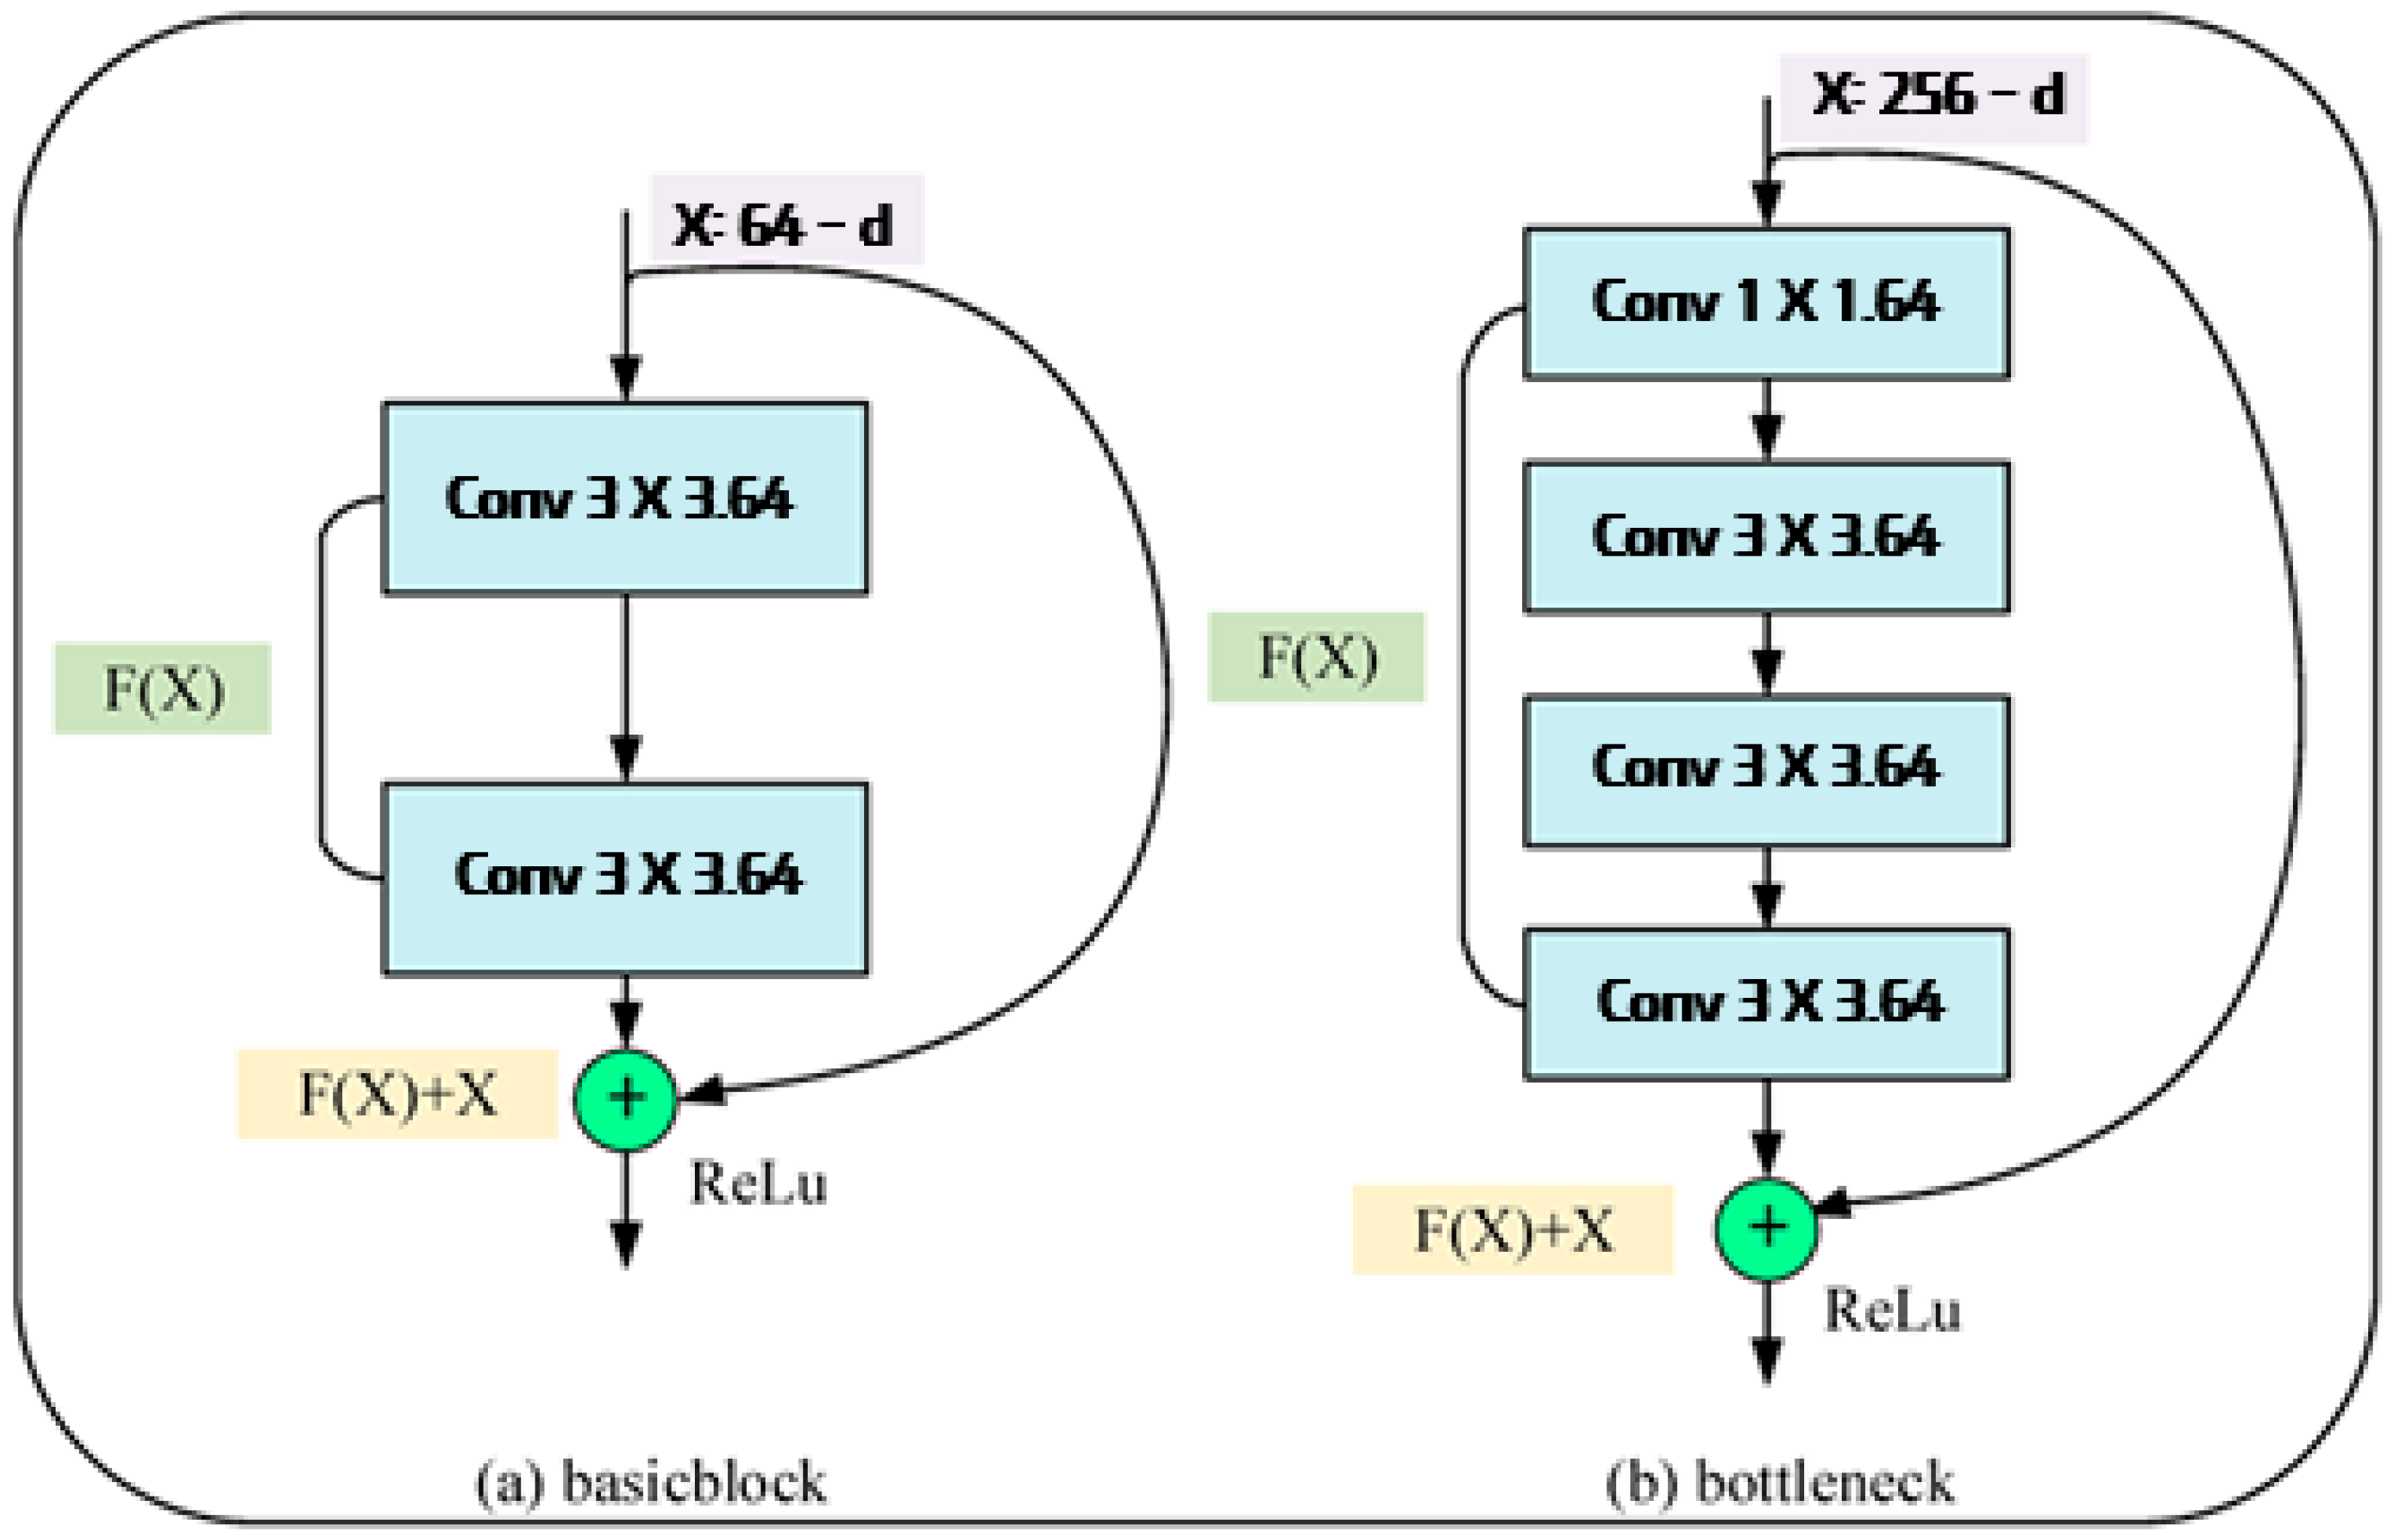
2.3. ResNet (Residual Network)
2.4. CoAtNet (Convolution and Self-Attention Network)
3. Materials and Methods
3.1. Dataset Description and Preprocessing
3.2. Model Design and Settings
4. Experimental Results and Interpretation
5. Conclusions
5.1. Summary of Experimental Results and Implications
5.2. Limitations of the Sutdy and Future Research Suggestions
Author Contributions
Funding
Institutional Review Board Statement
Informed Consent Statement
Data Availability Statement
Conflicts of Interest
References
- Giri, C.; Harale, N.; Thomassey, S.; Zeng, X. Analysis of Consumer Emotions about Fashion Brands: An Exploratory Study. Data Sci. KnowledGe Eng. Sens. Decis. Support 2018, 11, 1567–1574. [Google Scholar]
- Yeo, S.F.; Tan, C.L.; Kumar, A.; Tan, K.H.J.; Wong, J.K. Investigating the Impact of AI-Powered Technologies on Instragrammers’ Purchase Decisions in Digitalization Era—A Study of the Fashion and Apparel Industry. Technol. Forecast. Soc. Chang. 2022, 177, 121551. [Google Scholar] [CrossRef]
- Chakriswaran, P.; Vincent, D.R.; Srinivasan, K.; Sharma, V.; Chang, C.-Y.; Reina, D.G. Emotion AI-Driven Sentiment Analysis: A Survey, Future Research Directions, and Open Issues. Appl. Sci. 2019, 9, 5462. [Google Scholar] [CrossRef]
- Krizhevsky, A.; Sutskever, I.; Hinton, G.E. ImageNet Classification with Deep Convolutional Neural Networks. Commun. ACM 2012, 60, 84–90. [Google Scholar] [CrossRef]
- Tabibu, S.; Vinod, P.K.; Jawahar, C.V. Pan-Renal Cell Carcinoma Classification and Survival Prediction from Histopathology Images Using Deep Learning. Sci. Rep. 2019, 9, 10509. [Google Scholar] [CrossRef] [PubMed]
- Abd Alaziz, H.M.; Elmannai, H.; Saleh, H.; Hadjouni, M.; Anter, A.M.; Koura, A.; Kayed, M. Enhancing Fashion Classification with Vision Transformer (ViT) and Developing Recommendation Fashion Systems Using DINOVA2. Electronics 2023, 12, 4263. [Google Scholar] [CrossRef]
- He, K.; Zhang, X.; Ren, S.; Sun, J. Deep Residual Learning for Image Recognition. In Proceedings of the IEEE Conference on Computer Vision and Pattern Recognition (CVPR), Las Vegas, NV, USA, 27–30 June 2016; pp. 770–778. [Google Scholar] [CrossRef]
- Verma, G.; Verma, H. Hybrid-Deep Learning Model for Emotion Recognition Using Facial Expressions. Rev. Socionetwork Strateg. 2020, 14, 171–180. [Google Scholar] [CrossRef]
- LeCun, Y.; Boser, B.; Denker, J.S.; Henderson, D.; Howard, R.E.; Hubbard, W.; Jackel, L.D. Backpropagation Applied to Handwritten Zip Code Recognition. Neural Comput. 1989, 1, 541–551. [Google Scholar] [CrossRef]
- Alzubaidi, L.; Zhang, J.; Humaidi, A.J.; Al-Dujaili, A.; Duan, Y.; Al-Shamma, O.; Santamaría, J.; Fadhel, M.A.; Al-Amidie, M.; Farhan, L. Review of Deep Learning: Concepts, CNN Architectures, Challenges, Applications, Future Directions. J. Big Data 2021, 8, 53. [Google Scholar] [CrossRef]
- Zhao, L.; Zhang, Z. A Improved Pooling Method for Convolutional Neural Networks. Sci. Rep. 2024, 14, 1589. [Google Scholar] [CrossRef]
- Zhao, S.; Duan, Y.; Zhang, B. A Deep Learning Methodology Based on Adoptive Multiscale CNN and Enhanced Highway LSTM for Industrial Process Fault Diagnosis. Reliab. Eng. Syst. Saf. 2024, 249, 110208. [Google Scholar] [CrossRef]
- Han, K.; Wang, Y.; Chen, H.; Chen, X.; Guo, J.; Liu, Z.; Tang, Y.; Xiao, A.; Xu, C.; Xu, Y.; et al. A Survey of Vision Transformers. IEEE Trans. Pattern Anal. Mach. Intell. 2022, 45, 87–110. [Google Scholar] [CrossRef] [PubMed]
- Thisanke, H.; Deshan, C.; Chamith, K.; Seneviratne, S.; Vidanaarachchi, R.; Herath, D. Semantic Segmentation Using Vision Transformers: A Survey. Eng. Appl. Artif. Intell. 2023, 126, 106669. [Google Scholar] [CrossRef]
- Viso.AI, Vision Transformers (ViT) in Image Recognition—2024 Guide. Available online: https://viso.ai/deep-learning/vision-transformer-vit/ (accessed on 24 December 2024).
- Li, X.; Xu, X.; He, X.; Wei, X.; Yang, H. Intelligent Crack Detection Method Based on GM-ResNet. Sensors 2023, 23, 8369. [Google Scholar] [CrossRef]
- Dai, Z.; Liu, H.; Le, Q.V.; Tan, M. CoAtNet: Marrying Convolution and Attention for All Data Sizes. Adv. Neural Inf. Process. Syst. 2021, 34, 3965–3977. [Google Scholar] [CrossRef]
- Asif, M.; Rajab, T.; Hussain, S.; Rashid, M.; Wasi, S.; Ahmed, A.; Kanwal, K. Performance Evaluation of Deep Learning Algorithm Using High-End Media Processing Board in Real-Time Environment. J. Sens. 2022, 2022, 6335118. [Google Scholar] [CrossRef]
- Pham, T.C.; Luong, C.M.; Hoang, V.D.; Doucet, A. AI outperformed every dermatologist in dermoscopic melanoma diagnosis, using an optimized deep-CNN architecture with custom mini-batch logic and loss function. Sci. Rep. 2021, 11, 17485. [Google Scholar] [CrossRef]
- Alayón, S.; Hernández, J.; Fumero, F.J.; Sigut, J.F.; Díaz-Alemán, T. Comparison of the Performance of Convolutional Neural Networks and Vision Transformer-Based Systems for Automated Glaucoma Detection with Eye Fundus Images. Appl. Sci. 2023, 13, 12722. [Google Scholar] [CrossRef]
- Khan, A.; Rauf, Z.; Sohail, A.; Khan, A.R.; Asif, H.; Asif, A.; Farooq, U. A survey of the vision transformers and their CNN-transformer based variants. Artif. Intell. Rev. 2023, 56, 2917–2970. [Google Scholar] [CrossRef]
- Maurício, J.; Domingues, I.; Bernardino, J. Comparing Vision Transformers and Convolutional Neural Networks for Image Classification: A Literature Review. Appl. Sci. 2023, 13, 5521. [Google Scholar] [CrossRef]
- Muthukumar, V.; Naran, A.; Subramanian, V.B.; Belkin, M.; Hsu, D.; Sahai, A. Classification vs Regression in Overparameterized Regimes: Does the Loss Function matter? J. Mach. Learn. Res. 2021, 22, 1–69. [Google Scholar]


| First Category | Second Category | Amount of Goods |
|---|---|---|
| Bottom | Pants | 94 |
| Skirt | 134 | |
| Outer | Cardigan | 120 |
| Coat | 120 | |
| Jacket | 120 | |
| Top | Blouse | 112 |
| Knit | 118 | |
| Shirt | 109 | |
| Vest | 58 | |
| T-Shirt | 104 | |
| Dress | Dress | 80 |
| Total | 1169 |
| Emotional Pairwise Comparison | Paring Scores (If a Is 10, a’s Pair = 0) | Dummy Variables (1: Pairing Score > 5, 0: Paring Score < 5) | |
|---|---|---|---|
| Well-Decorated | Classic | Totally 10 | 0/1 |
| Fancy | Simple | Totally 10 | 0/1 |
| Sexy | Elegant | Totally 10 | 0/1 |
| Lively | Demure | Totally 10 | 0/1 |
| Energetic | Calm | Totally 10 | 0/1 |
| Light | Dark | Totally 10 | 0/1 |
| Soft | Hard | Totally 10 | 0/1 |
| Practical | Premium | Totally 10 | 0/1 |
| Party Look | Daily Life Look | Totally 10 | 0/1 |
| Stand-out | Ordinary | Totally 10 | 0/1 |
| Feminine | Mannish | Totally 10 | 0/1 |
| Features | Definition for the Study |
|---|---|
| EPOCH | 20 times for each epoch X 20 epochs |
| Data Set | Totally 1169 Fashion Wear Images with Four Categories of Top/Bottom/Outer/Dress |
| Machine Learning Environment | Python 3.10 and PyTorch 2.10 at Google Colaboratory Lab with GPU |
| Optimizer and Activation Function | ADAM/Sigmoid |
| Training: Testing Ratio | Training 80: Testing 20 |
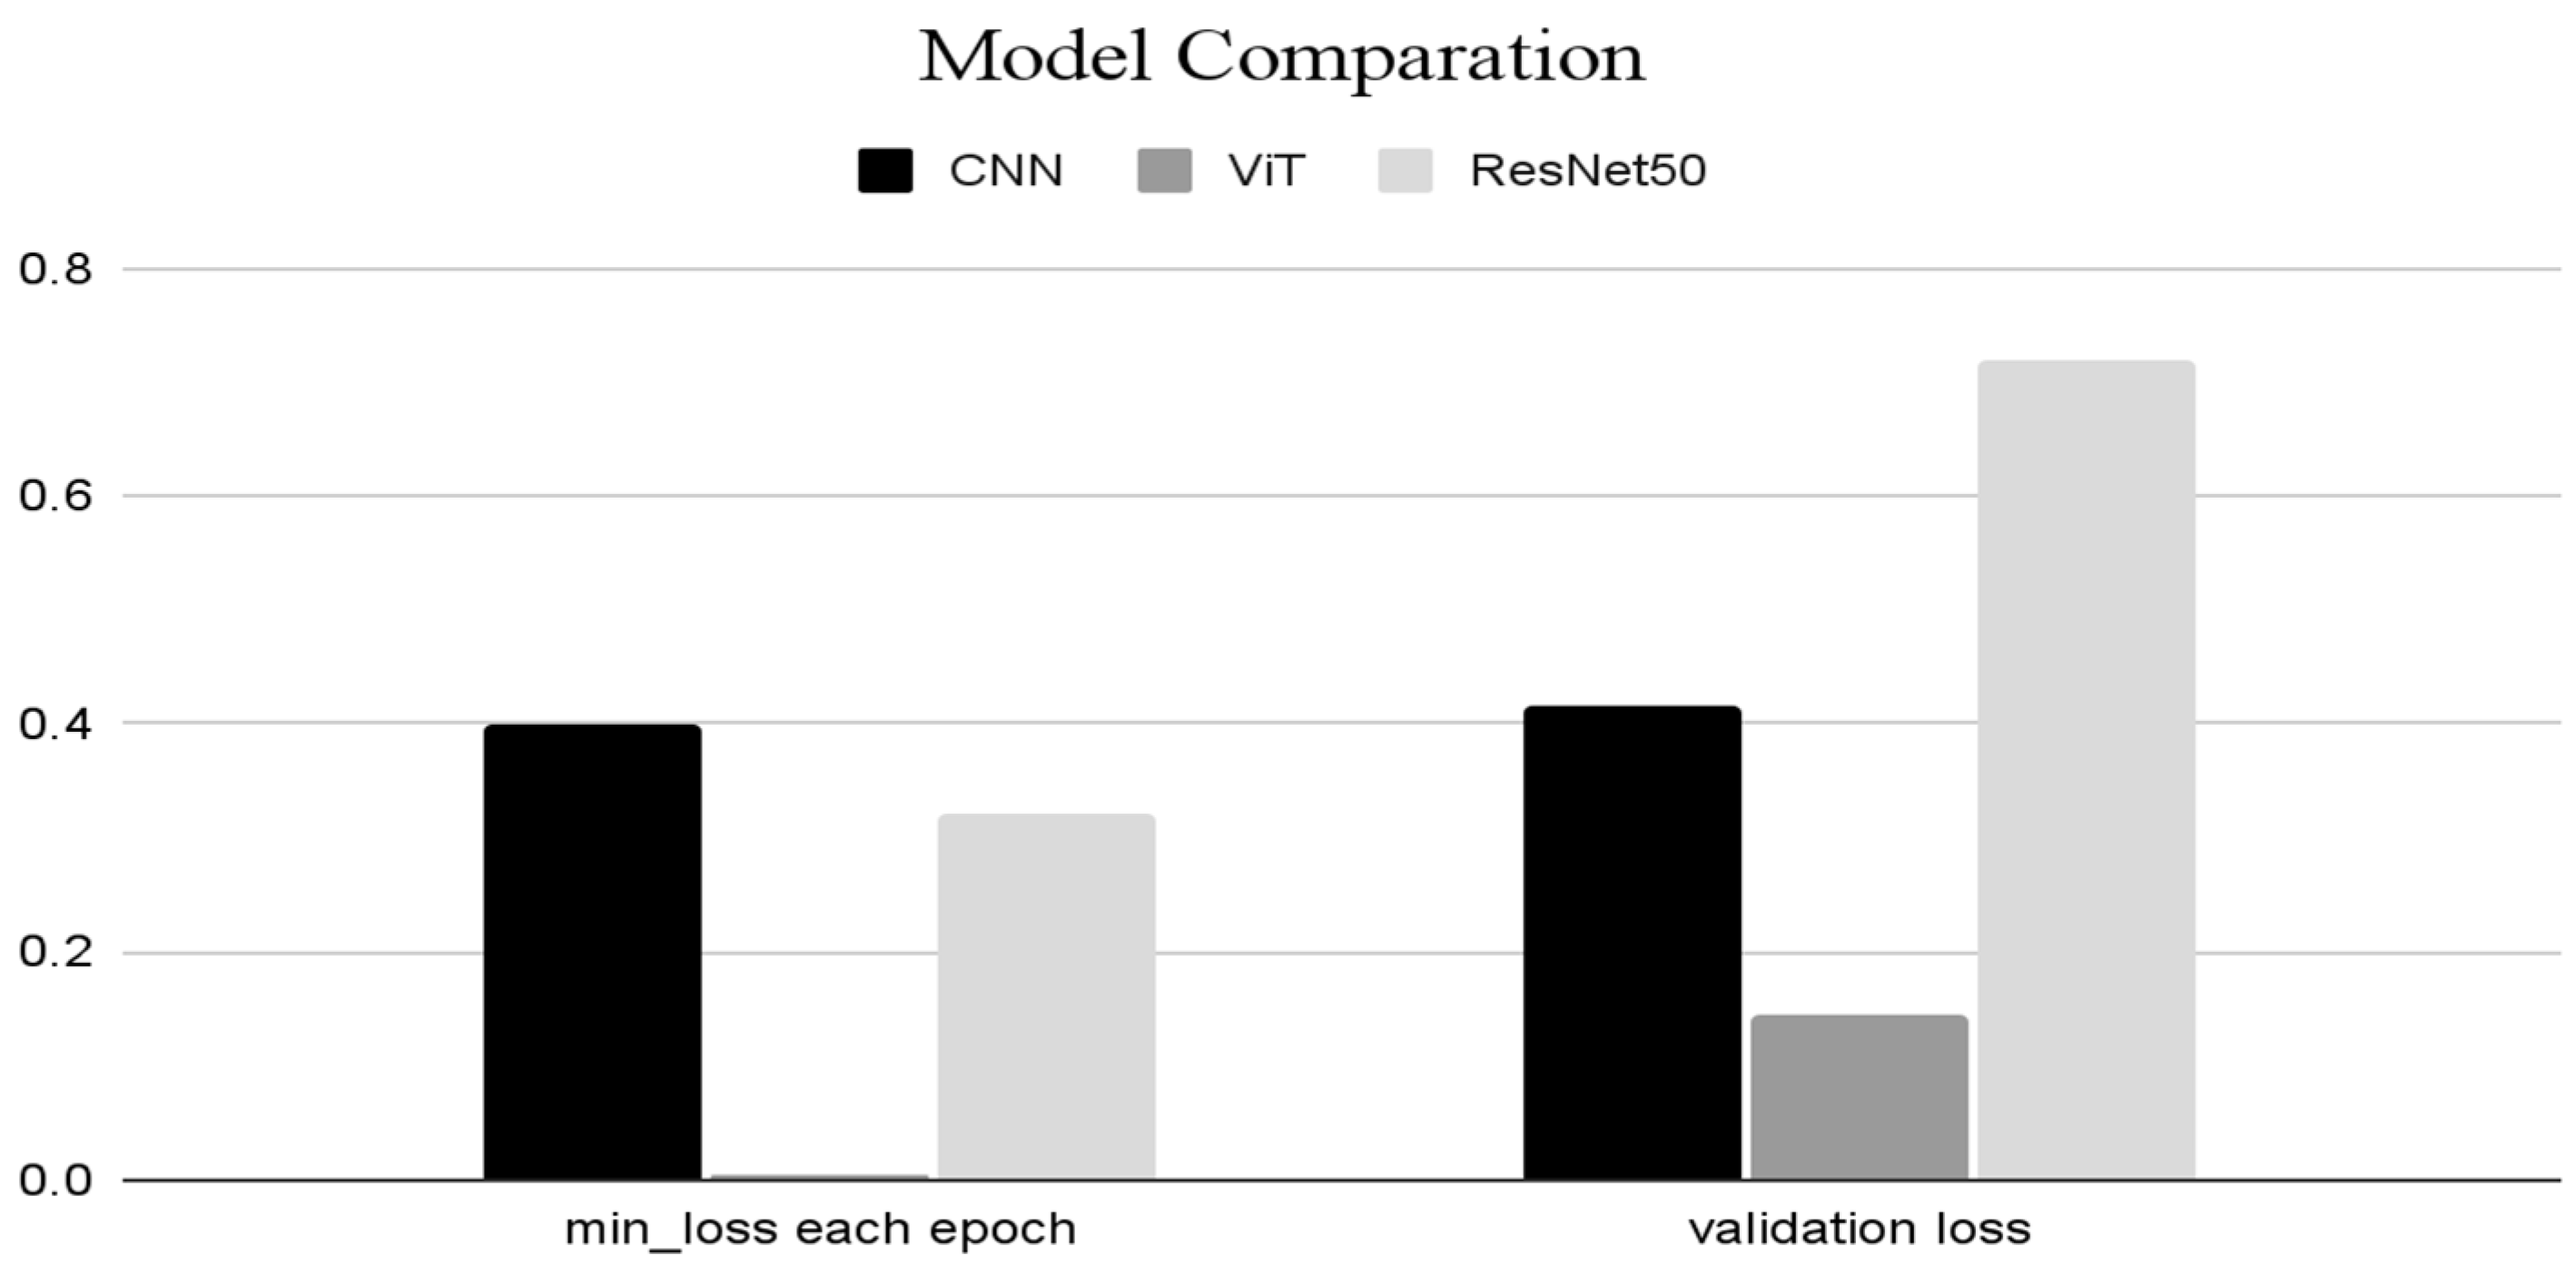
| Algorithm | Min Loss per Each Epoch | Validation Loss |
|---|---|---|
| CNN | 0.3987 | 0.4157 |
| ViT | 0.0038 | 0.1438 |
| ResNet50 | 0.3225 | 0.718 |
Disclaimer/Publisher’s Note: The statements, opinions and data contained in all publications are solely those of the individual author(s) and contributor(s) and not of MDPI and/or the editor(s). MDPI and/or the editor(s) disclaim responsibility for any injury to people or property resulting from any ideas, methods, instructions or products referred to in the content. |
© 2025 by the authors. Licensee MDPI, Basel, Switzerland. This article is an open access article distributed under the terms and conditions of the Creative Commons Attribution (CC BY) license (https://creativecommons.org/licenses/by/4.0/).
Share and Cite
Lee, G.; Yi, S.; Lee, J. A Study on Deep Learning Performances of Identifying Images’ Emotion: Comparing Performances of Three Algorithms to Analyze Fashion Items. Appl. Sci. 2025, 15, 3318. https://doi.org/10.3390/app15063318
Lee G, Yi S, Lee J. A Study on Deep Learning Performances of Identifying Images’ Emotion: Comparing Performances of Three Algorithms to Analyze Fashion Items. Applied Sciences. 2025; 15(6):3318. https://doi.org/10.3390/app15063318
Chicago/Turabian StyleLee, Gaeun, Seoyun Yi, and Jongtae Lee. 2025. "A Study on Deep Learning Performances of Identifying Images’ Emotion: Comparing Performances of Three Algorithms to Analyze Fashion Items" Applied Sciences 15, no. 6: 3318. https://doi.org/10.3390/app15063318
APA StyleLee, G., Yi, S., & Lee, J. (2025). A Study on Deep Learning Performances of Identifying Images’ Emotion: Comparing Performances of Three Algorithms to Analyze Fashion Items. Applied Sciences, 15(6), 3318. https://doi.org/10.3390/app15063318