Article

Microstructure Characteristics and Mechanical Properties of High-Strength Invar Alloy by Wire Arc Additive Manufacturing

1
“The Belt and Road Initiative” Advanced Materials International Joint Research Center of Hebei Province, School of Materials Science and Engineering, Hebei University of Technology, Tianjin 300130, China
2
Research Institute for Energy Equipment Materials, Tianjin Key Laboratory of Materials Laminating Fabrication and Interfacial Controlling Technology, Tianjin 300130, China
3
HBIS Group Technology Research Institute, HBIS Group, Shijiazhuang 052165, China
*
Author to whom correspondence should be addressed.
Appl. Sci. 2025, 15(6), 3351; https://doi.org/10.3390/app15063351
Submission received: 14 February 2025 / Revised: 13 March 2025 / Accepted: 13 March 2025 / Published: 19 March 2025
(This article belongs to the Section Additive Manufacturing Technologies)

Abstract

:
Wire arc additive manufacturing (WAAM) is a viable technology for manufacturing complex and medium-to-large-sized invar alloy components. However, the cyclic thermal input during the WAAM process may cause the austenite grains in the component to grow abnormally, adversely impacting the material’s mechanical properties. The addition of alloying elements such as Cr, Mo, and V can refine the microstructure of invar alloy to solve these problems. This study examines the influence of Cr, Mo, V, and N on the microstructure and mechanical properties of invar alloy produced through wire arc additive manufacturing. The elements Cr, Mo, and V can form various carbides and nitrides in invar alloys. These precipitation phases are distributed in various forms at grain boundaries and inside the grain, which can refine both the grain and the cellular substructure inside the grain. Moreover, these precipitation phases are distributed in different forms, impeding dislocation movement, thereby enhancing the strength of the invar alloy. The mean tensile strength of WAAM-fabricated high-strength invar alloy in this study attained 793 MPa, approximately 99% higher than that of ordinary invar alloy. The mechanical anisotropy of WAAM-fabricated invar alloy can be ascribed to the thermal interactions between adjacent deposition units.

1. Introduction

Fe-36Ni invar alloy, a prototypical low-expansion alloy, was discovered by physicist Guillaume in 1986 while searching for suitable materials for the production of geodetic [1]. The invar alloy exhibits an exceptionally low coefficient of thermal expansion below the Curie temperature, with a value at room temperature that is just one-tenth that of conventional alloys. Invar alloy is used in many applications because it has very low thermal expansion and good mechanical properties. It is commonly found in pendulum clocks, precise electric devices, cryogenic storage containers, aerospace, oil and gas transportation, and high-voltage transmission, among others [2,3,4,5,6,7]. Nonetheless, conventional manufacturing techniques for component fabrication, including processes like casting and machining, are subject to specific constraints. These processes are characterized by extended production cycles, significant tool wear, and challenges in manufacturing components with intricate structures [8,9]. Accordingly, it is of paramount importance to identify a process that can enhance production efficiency and fabricate intricate structural components [10,11].
Wire arc additive manufacturing technology has been widely used by the manufacturing industry because of its high efficiency and high process adaptability; it has been widely used in the manufacturing of steel products [12]. The invar alloy is an extensively malleable metal with a face-centered cubic lattice structure, renowned for commendable weldability and compatibility with the WAAM process [13,14]. However, on account of the substantial heat input coupled with the intricate thermal cycling process inherent in the additive molding technique, several issues are manifested in the microstructure of invar alloy post-additive molding [15]. These issues include the presence of pores, discrepancies in microstructural homogeneity, and grain growth, all of which stand to compromise the mechanical properties of the invar 36 specimens produced through additive manufacturing [16]. Recently, Sood et al. [17] found that during the additive manufacturing process, judiciously diminishing the heat input can simultaneously mitigate the occurrence of thermal cracks and increase the grain boundary density, thereby enhancing the overall mechanical properties of the invar alloy specimens produced through additive manufacturing. Aldalur et al. [18] deposited thin-walled invar samples using both gas metal arc welding (GMAW) technology and plasma arc welding (PAW) technology. The investigation found that when heat input was lowered, the shape of the dendrites in the samples made using the GMAW technique became more consistent, and the carbides were smaller and more evenly spread out. Jiao et al. [19] employed the wire arc additive manufacturing technique to successfully fabricate invar alloy thin-walled specimens, and subsequent heat treatment experiments were conducted on these specimens. The research findings indicate that the mechanical properties of the specimens were substantially enhanced following heat treatment. This enhancement is primarily ascribed to the development of a fine grain size and a more uniform distribution of precipitates during the heat treatment process, which substantially bolstered the material’s mechanical properties. Hua et al. [20] used ultrasound to assist the WAAM process of Inconel 65 alloy, and the results showed that ultrasound promoted the transformation of columnar grains into equiaxed grains and refined the grain size, thereby reducing the anisotropy of mechanical properties. In the studies mentioned above, the researchers improved the properties of the invar alloy-deposited specimens mainly by adjusting the welding process. Nevertheless, the utility of these interventions in bolstering the performance of invar alloy-deposited specimens is constrained, and their adaptation to actual manufacturing processes presents certain challenges. Consequently, in order to improve the comprehensive mechanical properties of invar alloy samples prepared by wire arc additive manufacturing technology while maintaining production efficiency, it is necessary to develop a high-strength invar alloy and optimize its composition without affecting the low expansion properties of invar alloy, so as to achieve the purpose of improving its mechanical properties.
Previous studies have shown that the elements Cr, Mo, and V can form stable carbides and nitrides in steel [21]. These carbides and nitrides are dispersed in the matrix and can act to refine grain size and pin grain boundaries and dislocations [22]. Therefore, in this study, a high-strength invar alloy for wire arc additive manufacturing was developed by adding Cr-Mo-V-N elements to the invar alloy, and the effects of alloying elements on the microstructure and mechanical properties of the invar alloy were studied by comparing with the invar alloy without alloying element modification. Considering the special heat input in the process of wire arc additive manufacturing, the microstructure and the mechanical properties of different directions in the sample were also studied.

2. Materials and Methods
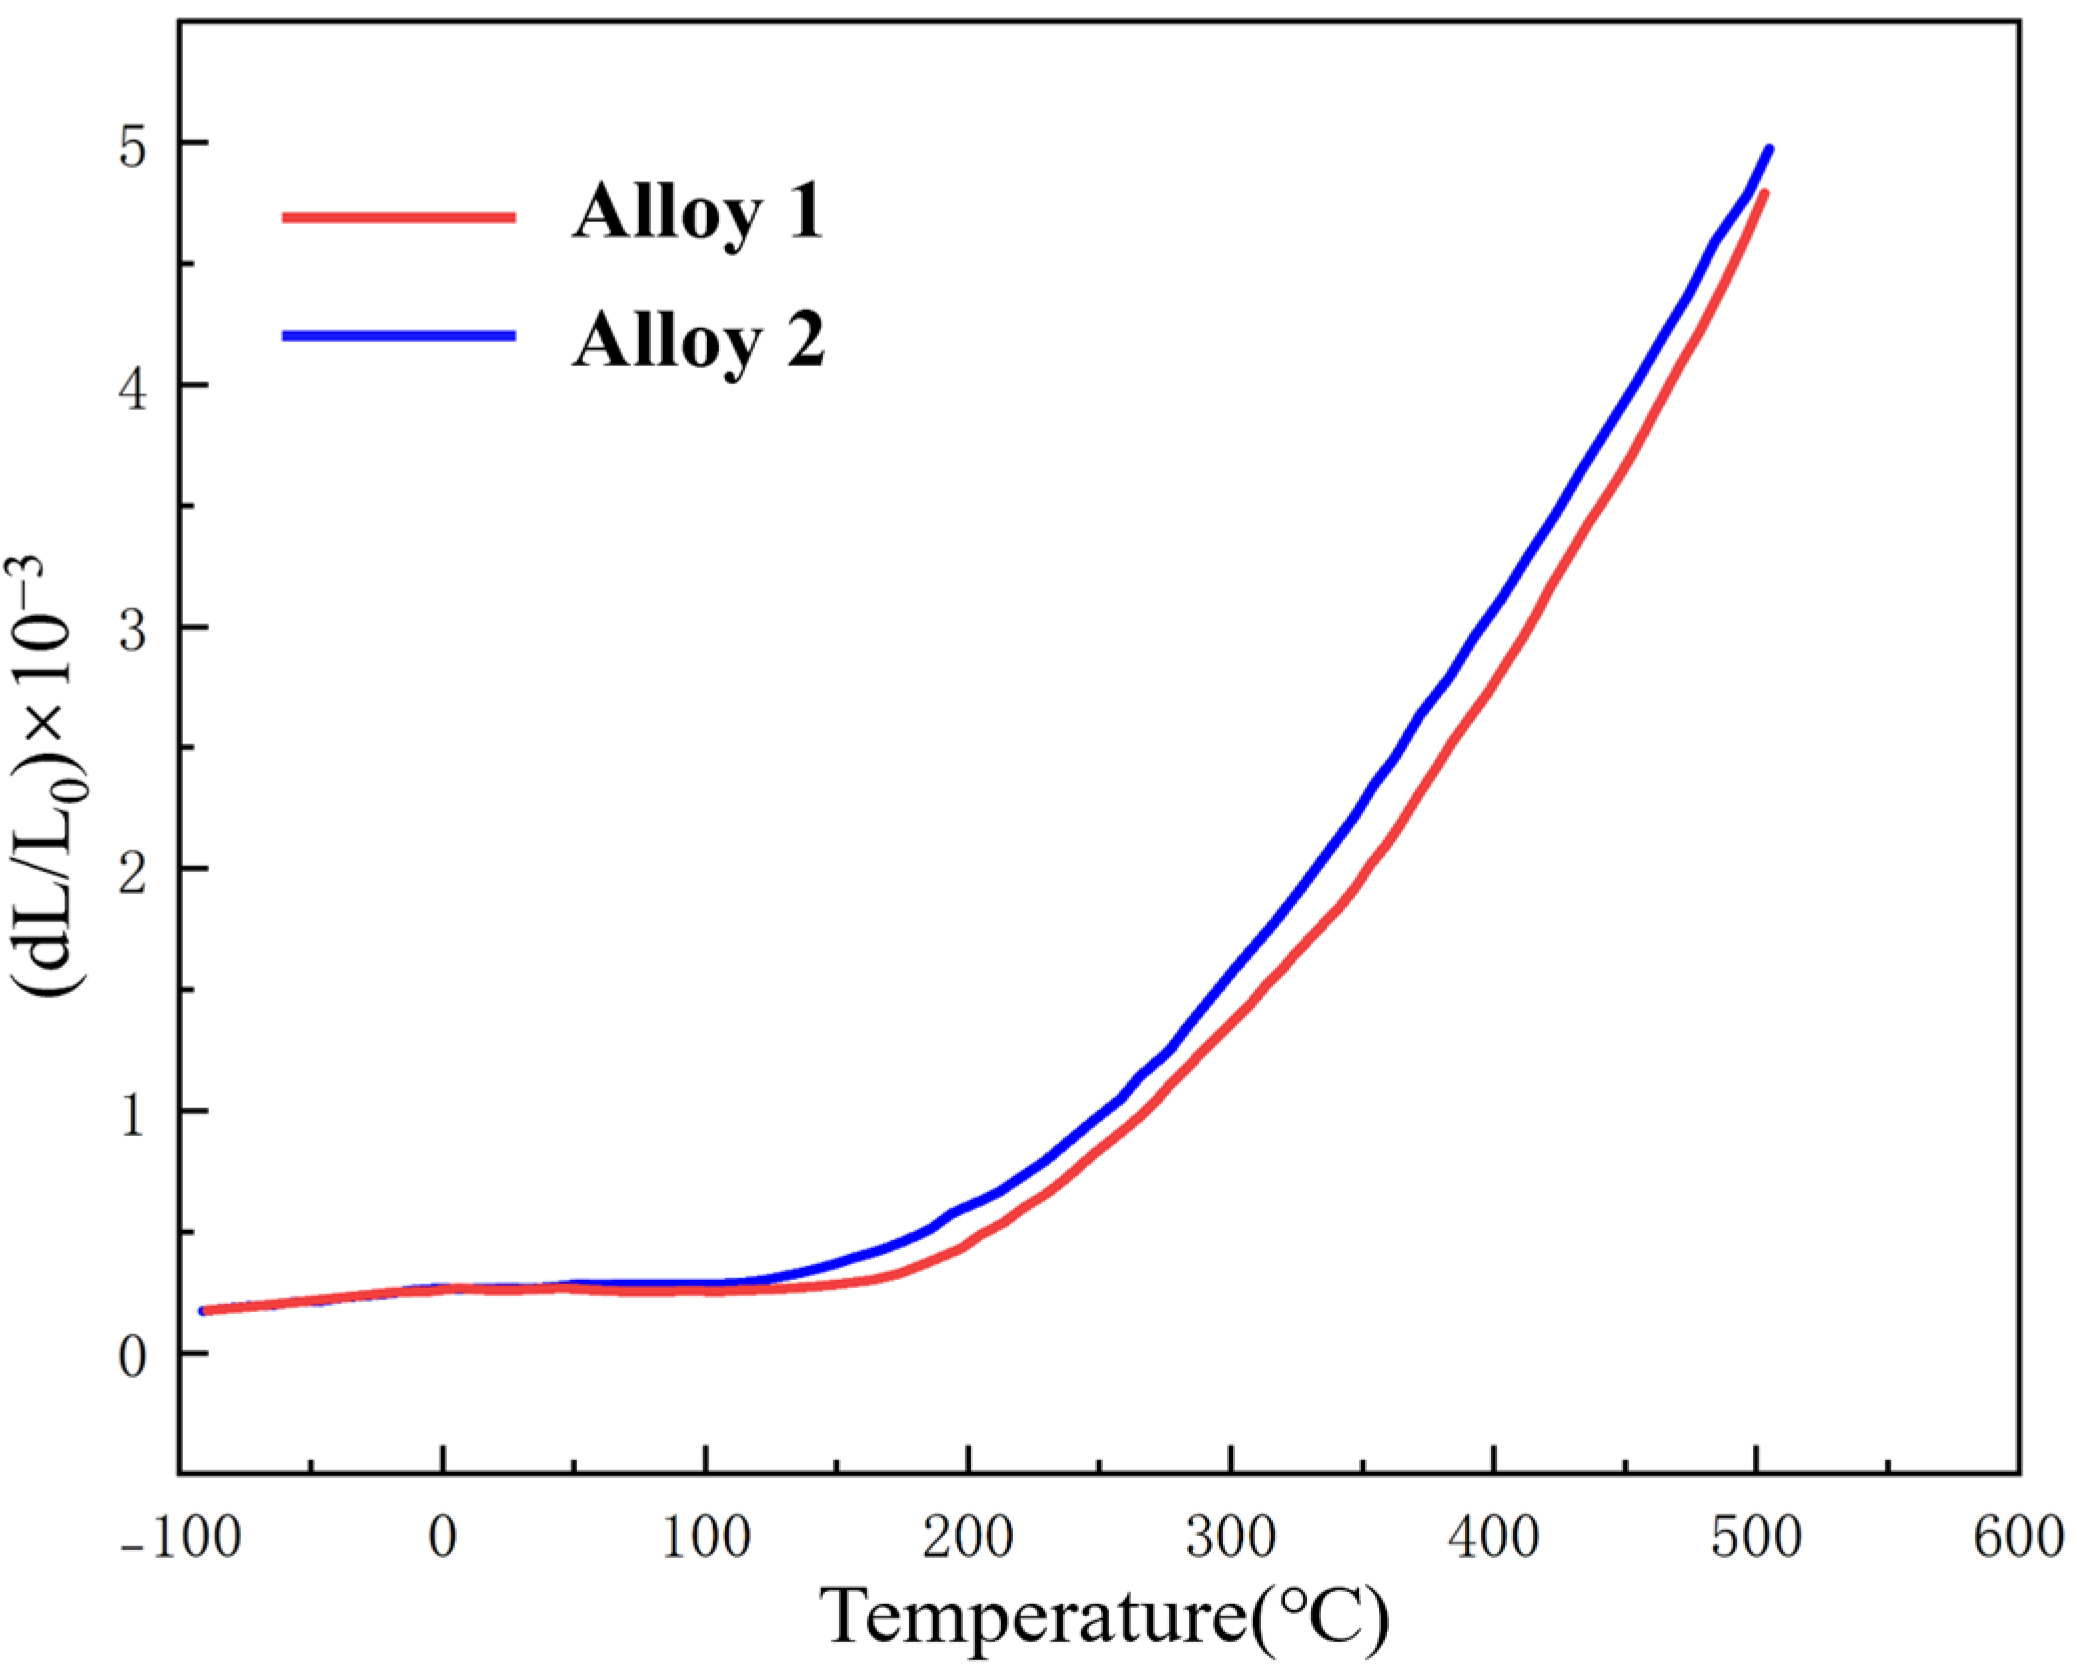
2.1. Materials

Invar alloy, supplied by Hebei Iron and Steel Group, Shijiazhuang, China, was used as the raw material for the experiment. DDVIF-50-100-2.5 vacuum induction furnace and magnesium oxide ceramic crucible were used to prepare the raw test material. To prevent splashing of molten steel during the melting process, argon gas was used for protection, and a 50 kg ingot was finally produced. Then, the invar alloy ingot was made into wire by hot pressing, rolling, and cold drawing process. In this work, the area reduction rate in the drawing process is 20–30%, which is converted to an elongation coefficient λ of 1.25–1.43. Nine drawing dies were used in the drawing process, with drawing die angle α of 8–14°. The specific preparation process of the invar alloy wire is shown in Figure 1. The Agilent 5110SVDV inductively coupled plasma emission spectrometer was used to analyze the V content in the alloy, the LECO nitrogen and oxygen analyzer was used to analyze the N content, the CS800 carbon analyzer was used to detect the C content, the other elements in the alloy were determined by atomic emission spectroscopy, and the final composition of the invar alloy wire is shown in Table 1. The purpose of testing alloy 1 was to provide a basis for comparison with alloy 2. Figure 2 shows the linear thermal expansion curves of alloy 1 and alloy 2, and it can be seen that the thermal expansion properties of alloy 1 and alloy 2 are not much different below 50 °C. Above room temperature (25–100 °C), the average CET values of alloy 1 and alloy 2 are 0.22 × 10⁻⁶/°C, 0.27 × 10⁻⁶/°C, respectively, both in accordance with the standard (α(25–100°C) ≤ 1.5 × 10⁻⁶ °C).

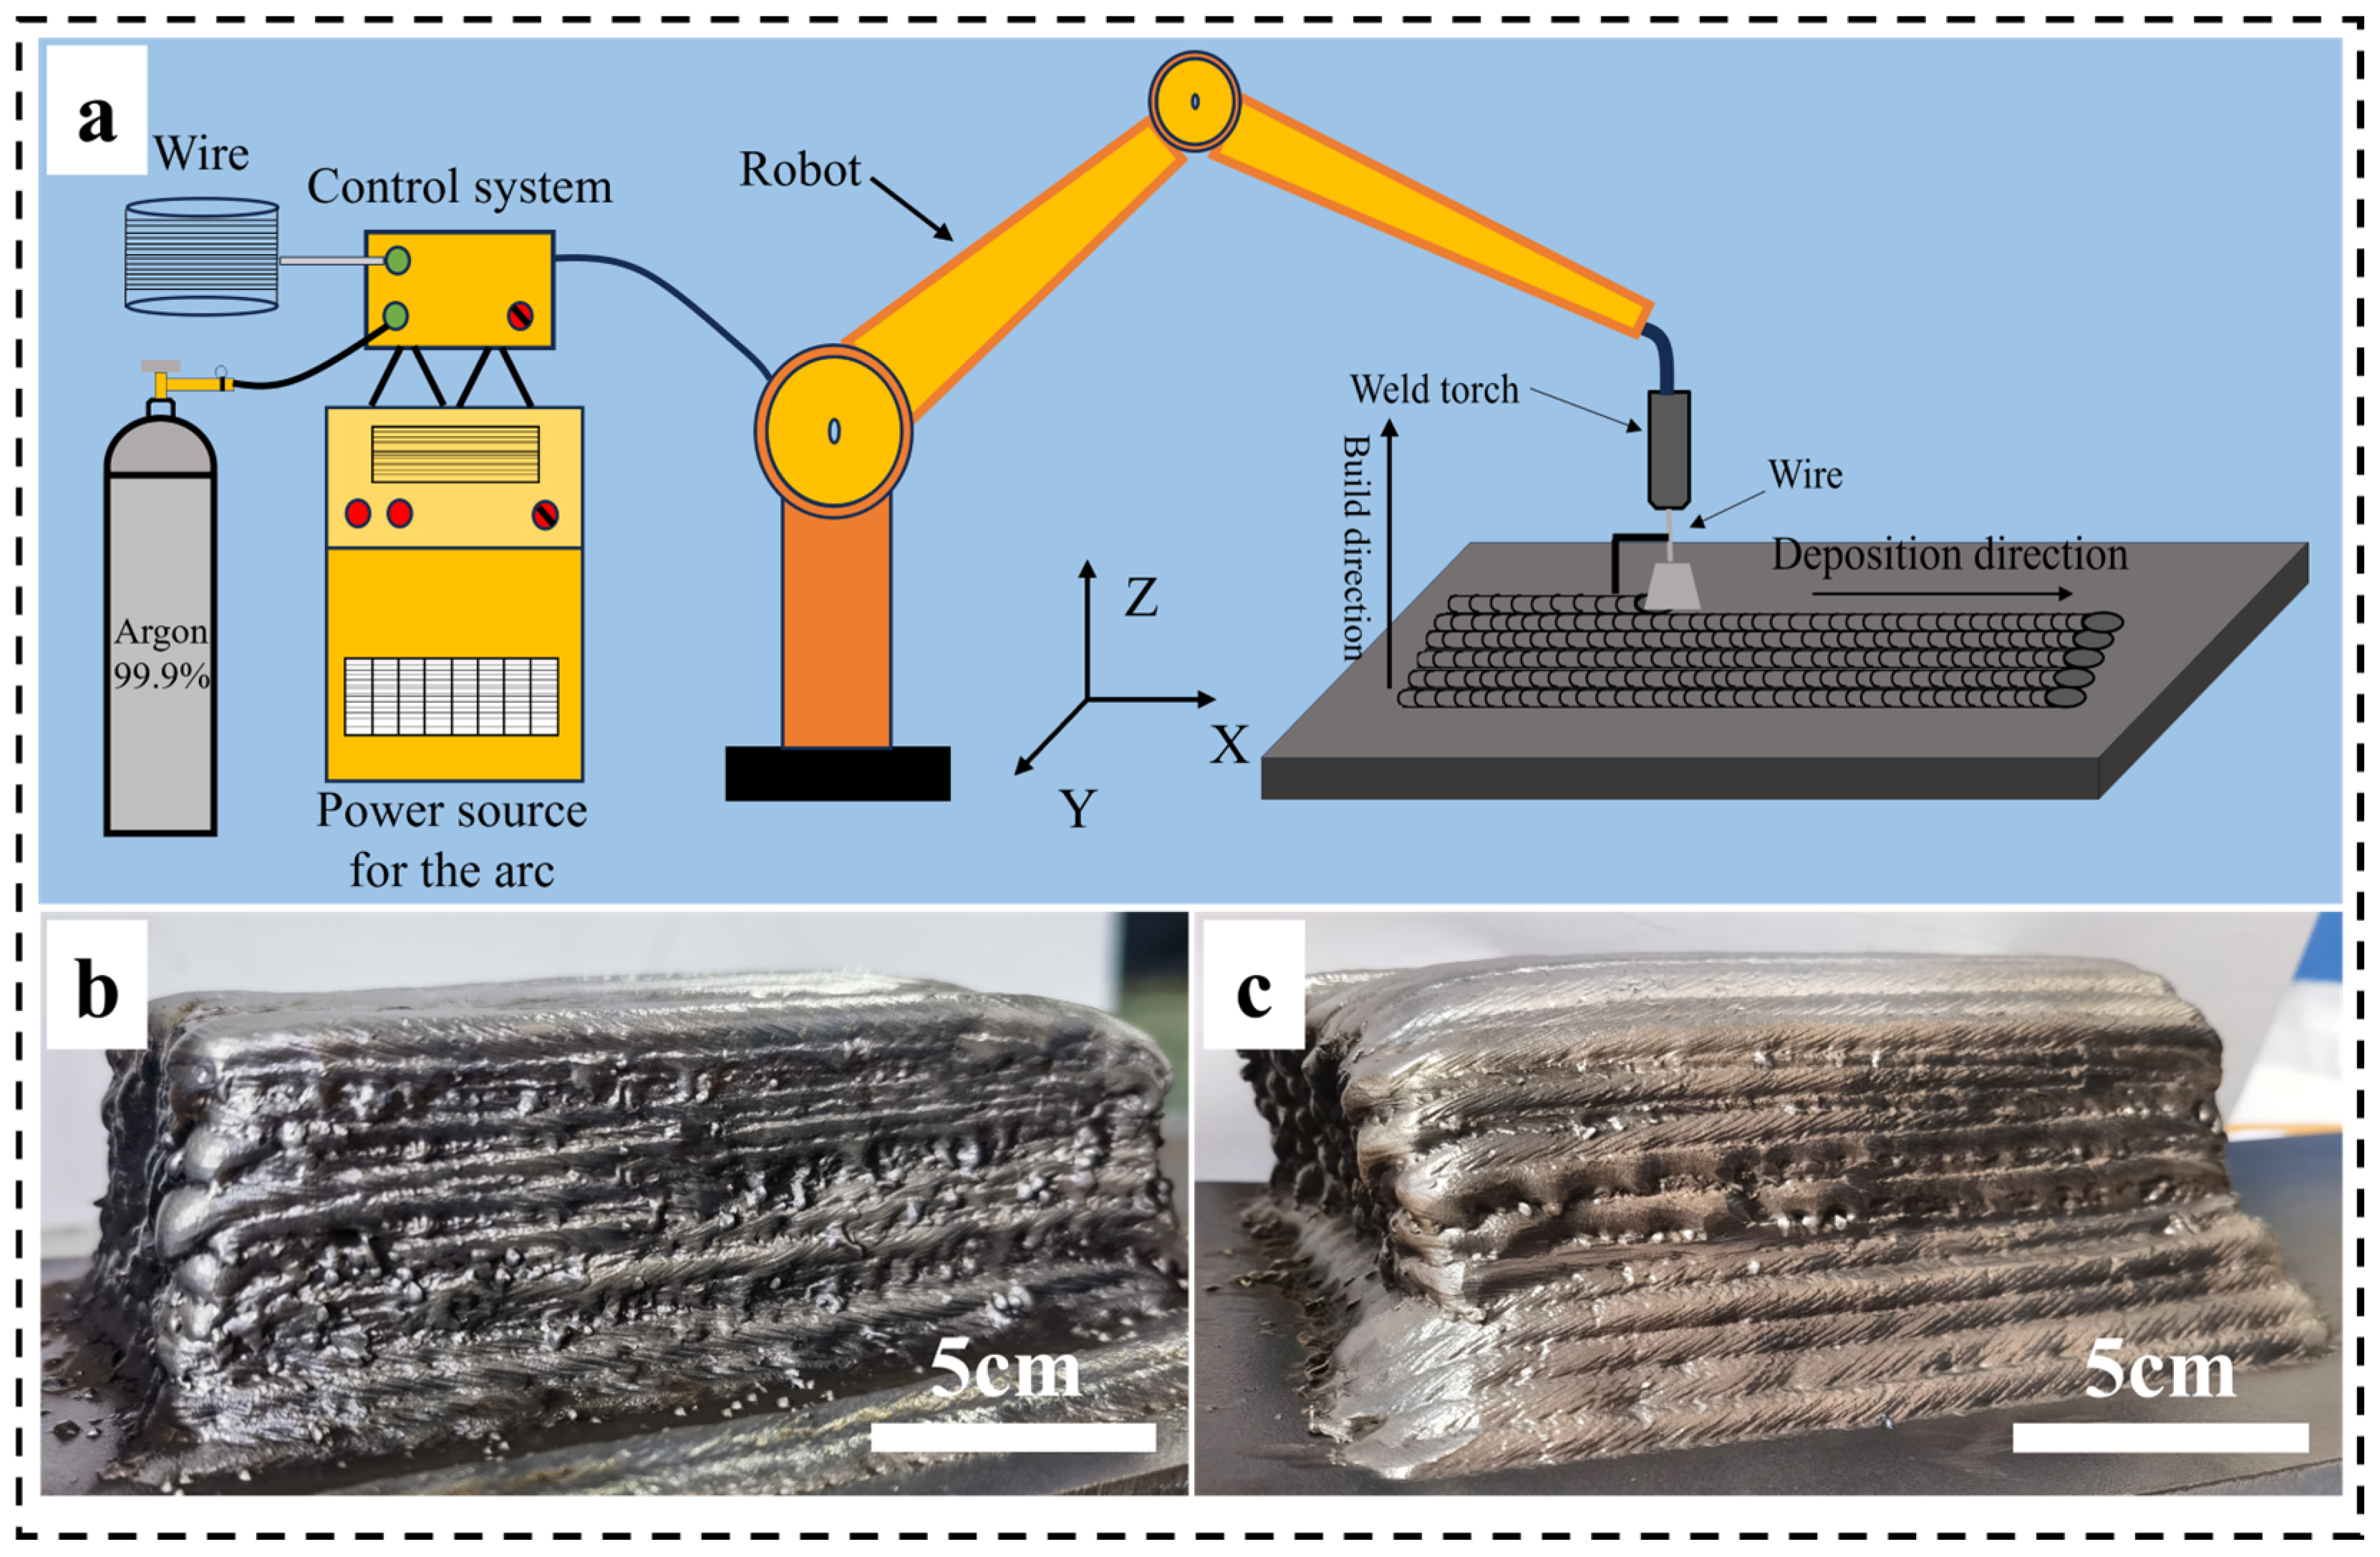
2.2. Manufacturing Process

The wire arc additive manufacturing system assembled in this lab was used to prepare the samples, as shown in Figure 3a. The system is fitted with a six-axis robotic arm (YA-1VAR61CJ0, Panasonic, Osaka, Japan). The experiment used a 400 × 150 × 20 mm Q235 steel plate as the substrate. The substrate was cleaned with ethanol and dried prior to deposition. The metal was deposited layer by layer using a pulsed electrode gas-shielded welding machine (YD-500GL4, Panasonic, Osaka, Japan) as the heat source to melt the wire. This research has established the process parameters with a current of 150 A, a voltage of 20 V, and a travel speed of 0.4 m/min. High-purity argon was used as a shielding gas in the deposition process. The wire arc additive manufacturing system automatically adjusts the wire feed speed to align with the set voltage and current. Specimens fabricated from alloy 1 and alloy 2 were named the alloy 1 specimen and the alloy 2 specimen, respectively. The macroscopic morphology of the alloy 1 and alloy 2 specimens is shown in Figure 3b,c.

2.3. Material Characterization

The cross-section shown in Figure 4 was selected as the observation plane to study the microstructure distribution of the invar alloy specimen in different build directions. The metallurgical samples were cut out by electric spark-cutting equipment and then ground, polished, and etched in turn. The metallurgical samples were etched with FeCl3 ethanol solution (30%), and the etching time was 10–15 s. Subsequently, the resulting microstructures were analyzed using an Axio-VertA1MAT optical microscope (Karl Zeiss, Jena, Germany). The JSM-7100F (JEOL, Tokyo, Japan) scanning electron microscope (SEM), equipped with energy dispersive spectrometer (EDS, JEOL, Tokyo, Japan) and electron backscatter diffraction (EBSD, JEOL, Tokyo, Japan), was used for observing the microscopic morphology. For EBSD examination, specimens were prepared by electrochemical polishing with a solution of 10% perchloric acid and 90% ethanol (v/v%). The element distribution and precipitated phase composition of the sample were analyzed with the JXA-8530 (JEOL, Tokyo, Japan) electron probe microanalyzer (EPMA).

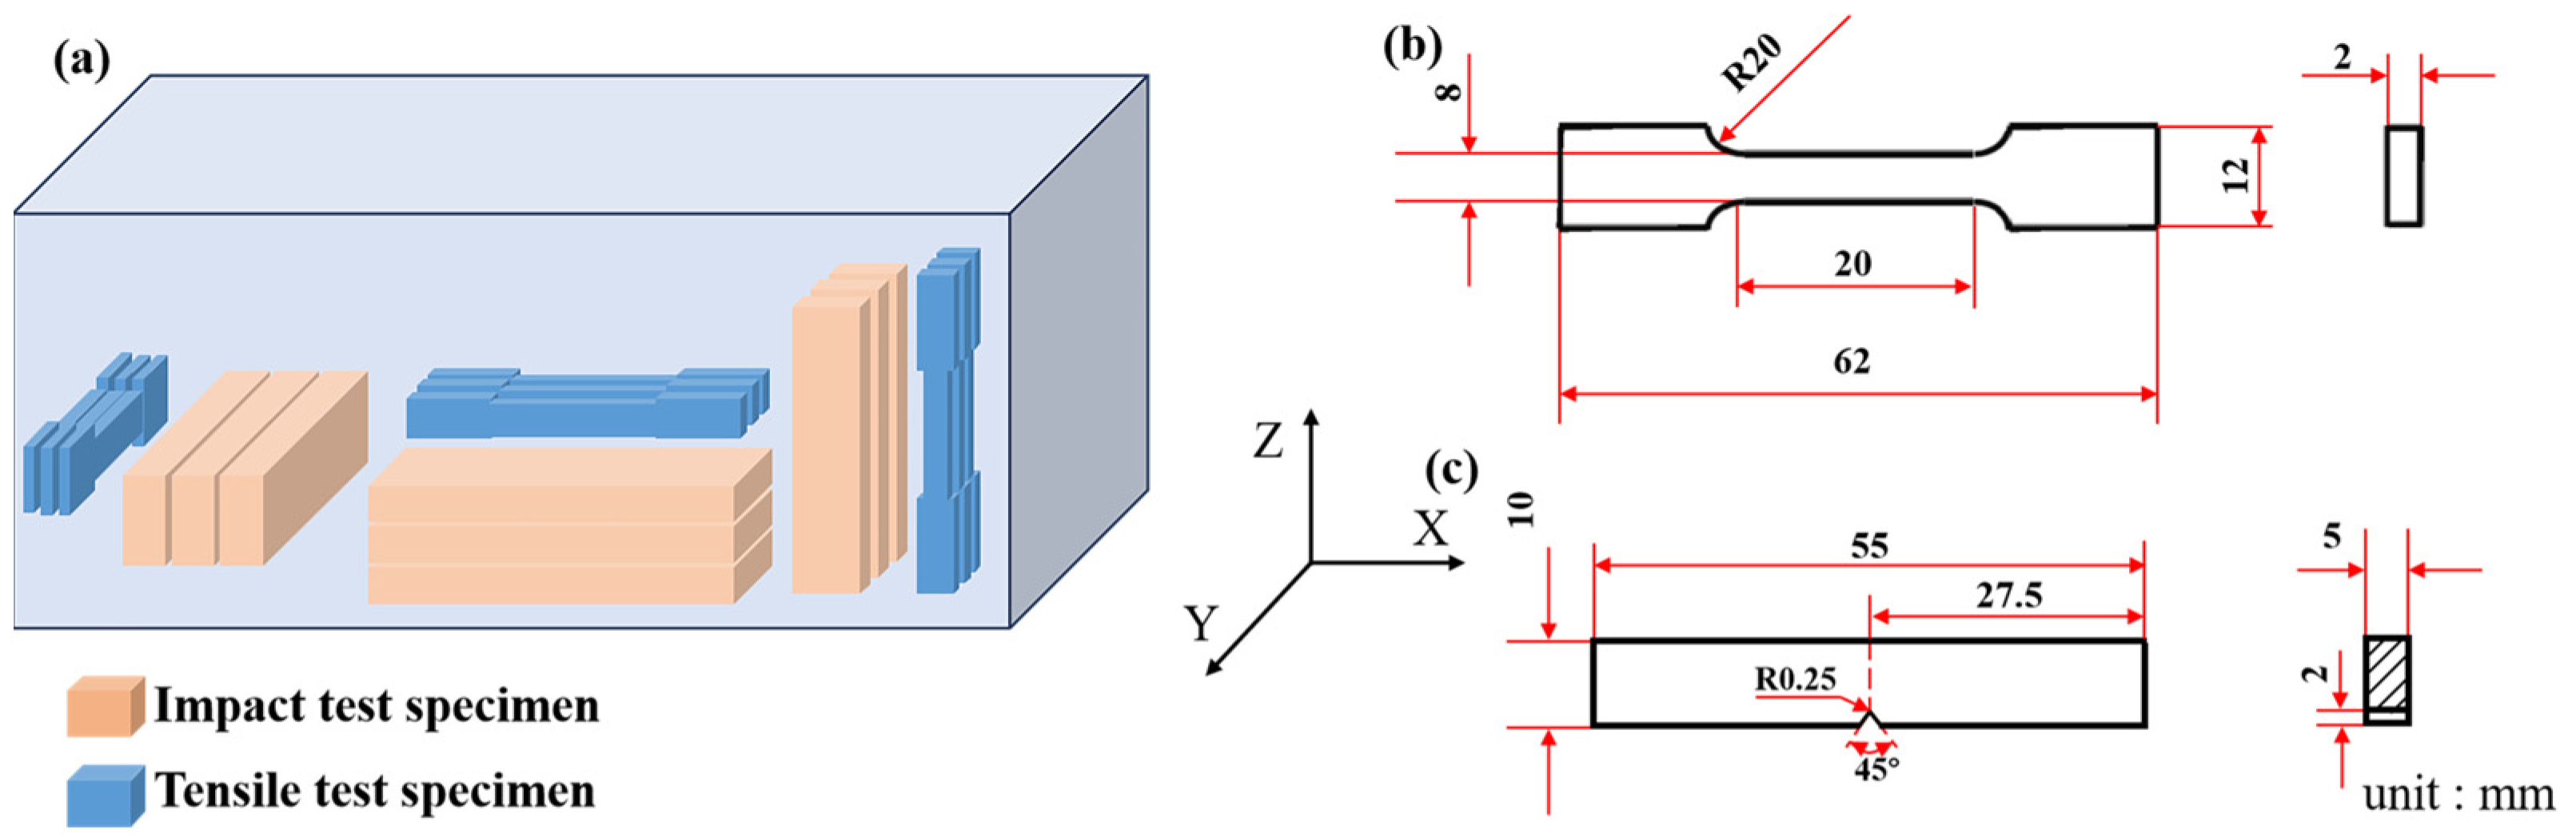
2.4. Mechanical Property Tests

The sampling positions and dimensions of the tensile and impact samples are depicted in Figure 5. The tensile test was conducted at room temperature using the AGS-XD50kN electronic universal testing machine (Shimadzu, Kyoto, Japan) with a loading rate of 1 mm/min. The impact toughness tests were performed on the JBW-300B impact testing machine (kerce, Shandong, China) at both room temperature and low temperature (−196 °C). Before the low-temperature impact test, the impact test specimen needs to be soaked in liquid nitrogen for 15 min, and the impact test would be completed within 3–5 s after the specimen was removed from the liquid nitrogen. An HMV-2T microhardness tester (Shimadzu, Kyoto, Japan) measured the hardness of different parts in the alloy 1 and alloy 2 samples. A load of 1.96 N was applied, with a loading time of 15 s. All measurements were taken at least three times and then averaged.

3. Results and Discussion
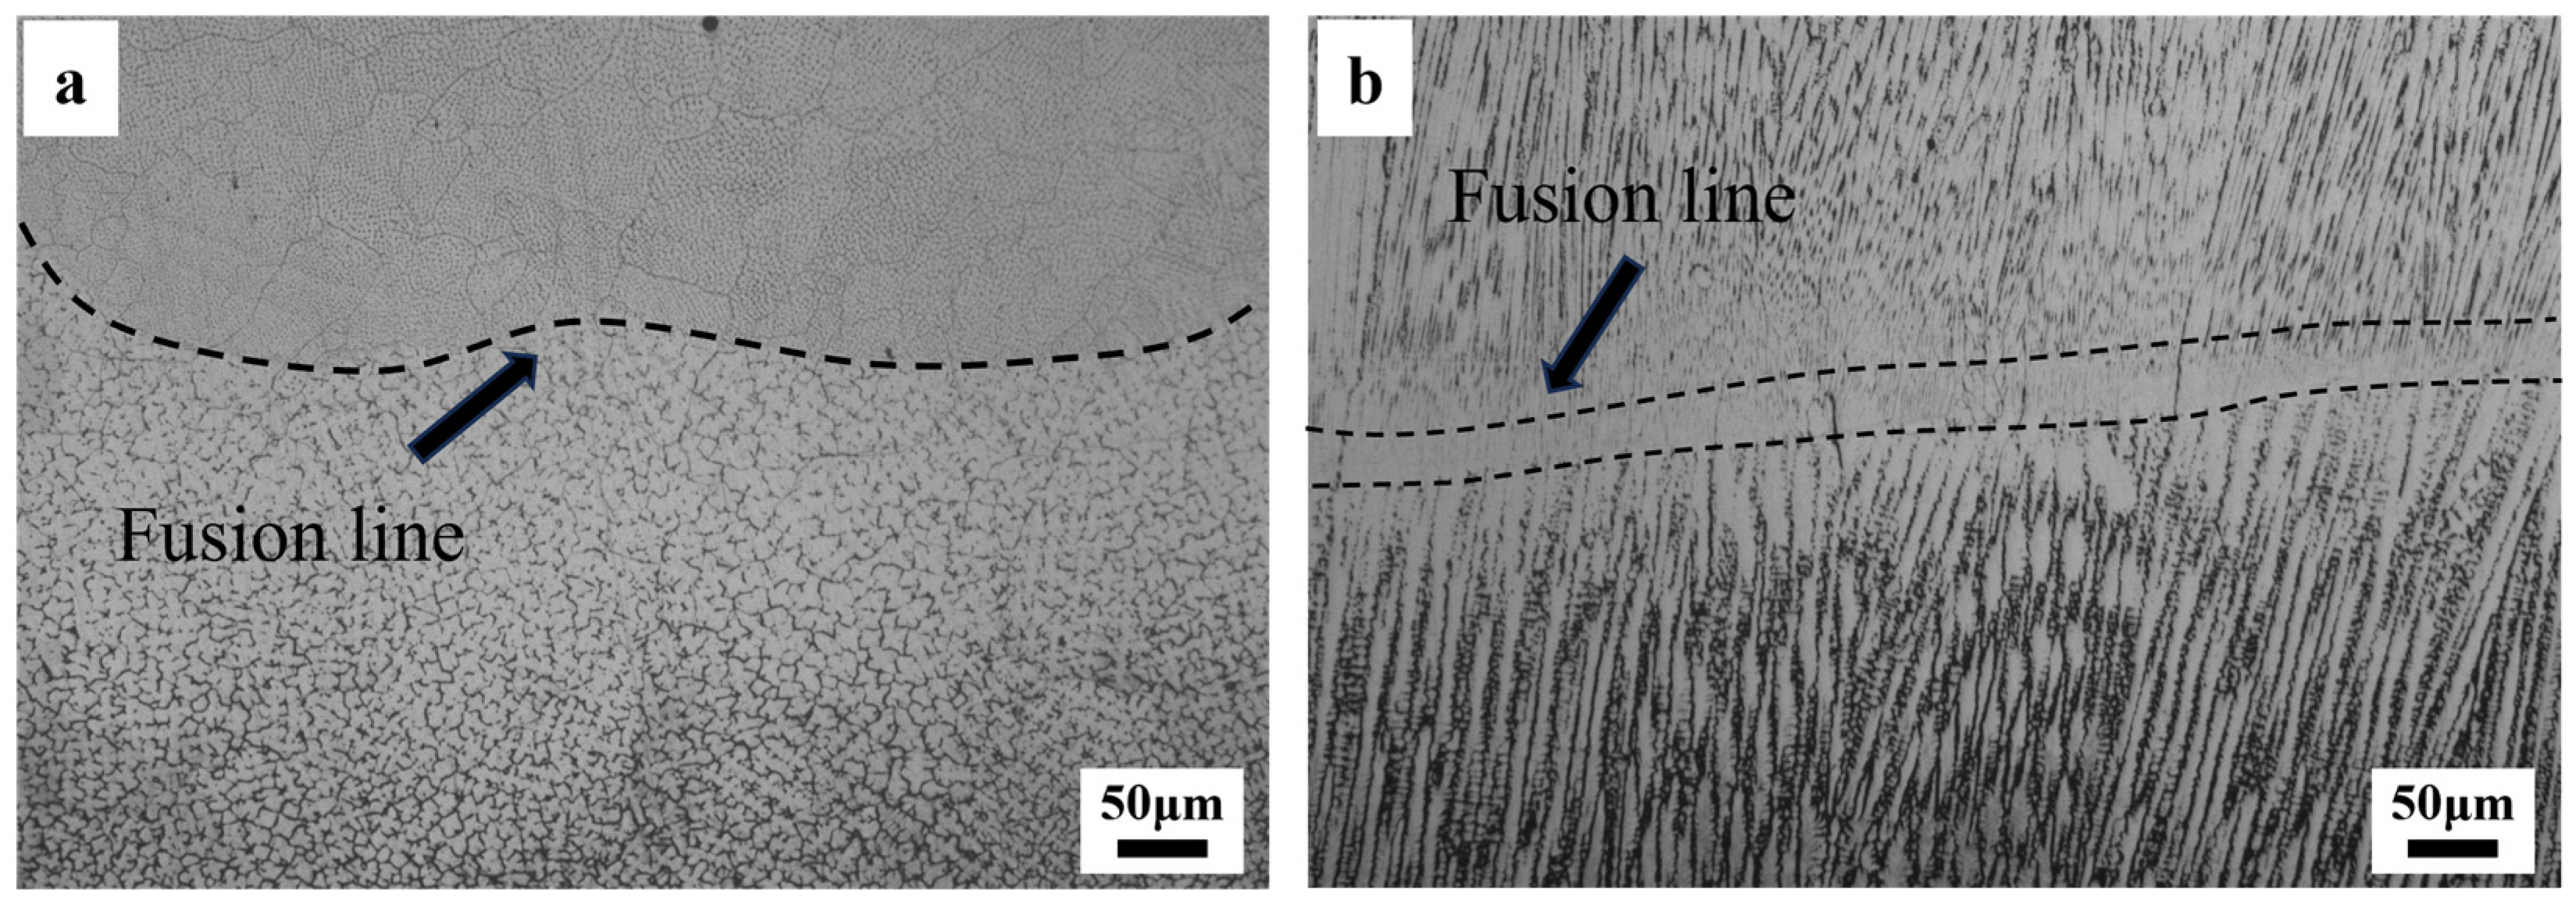
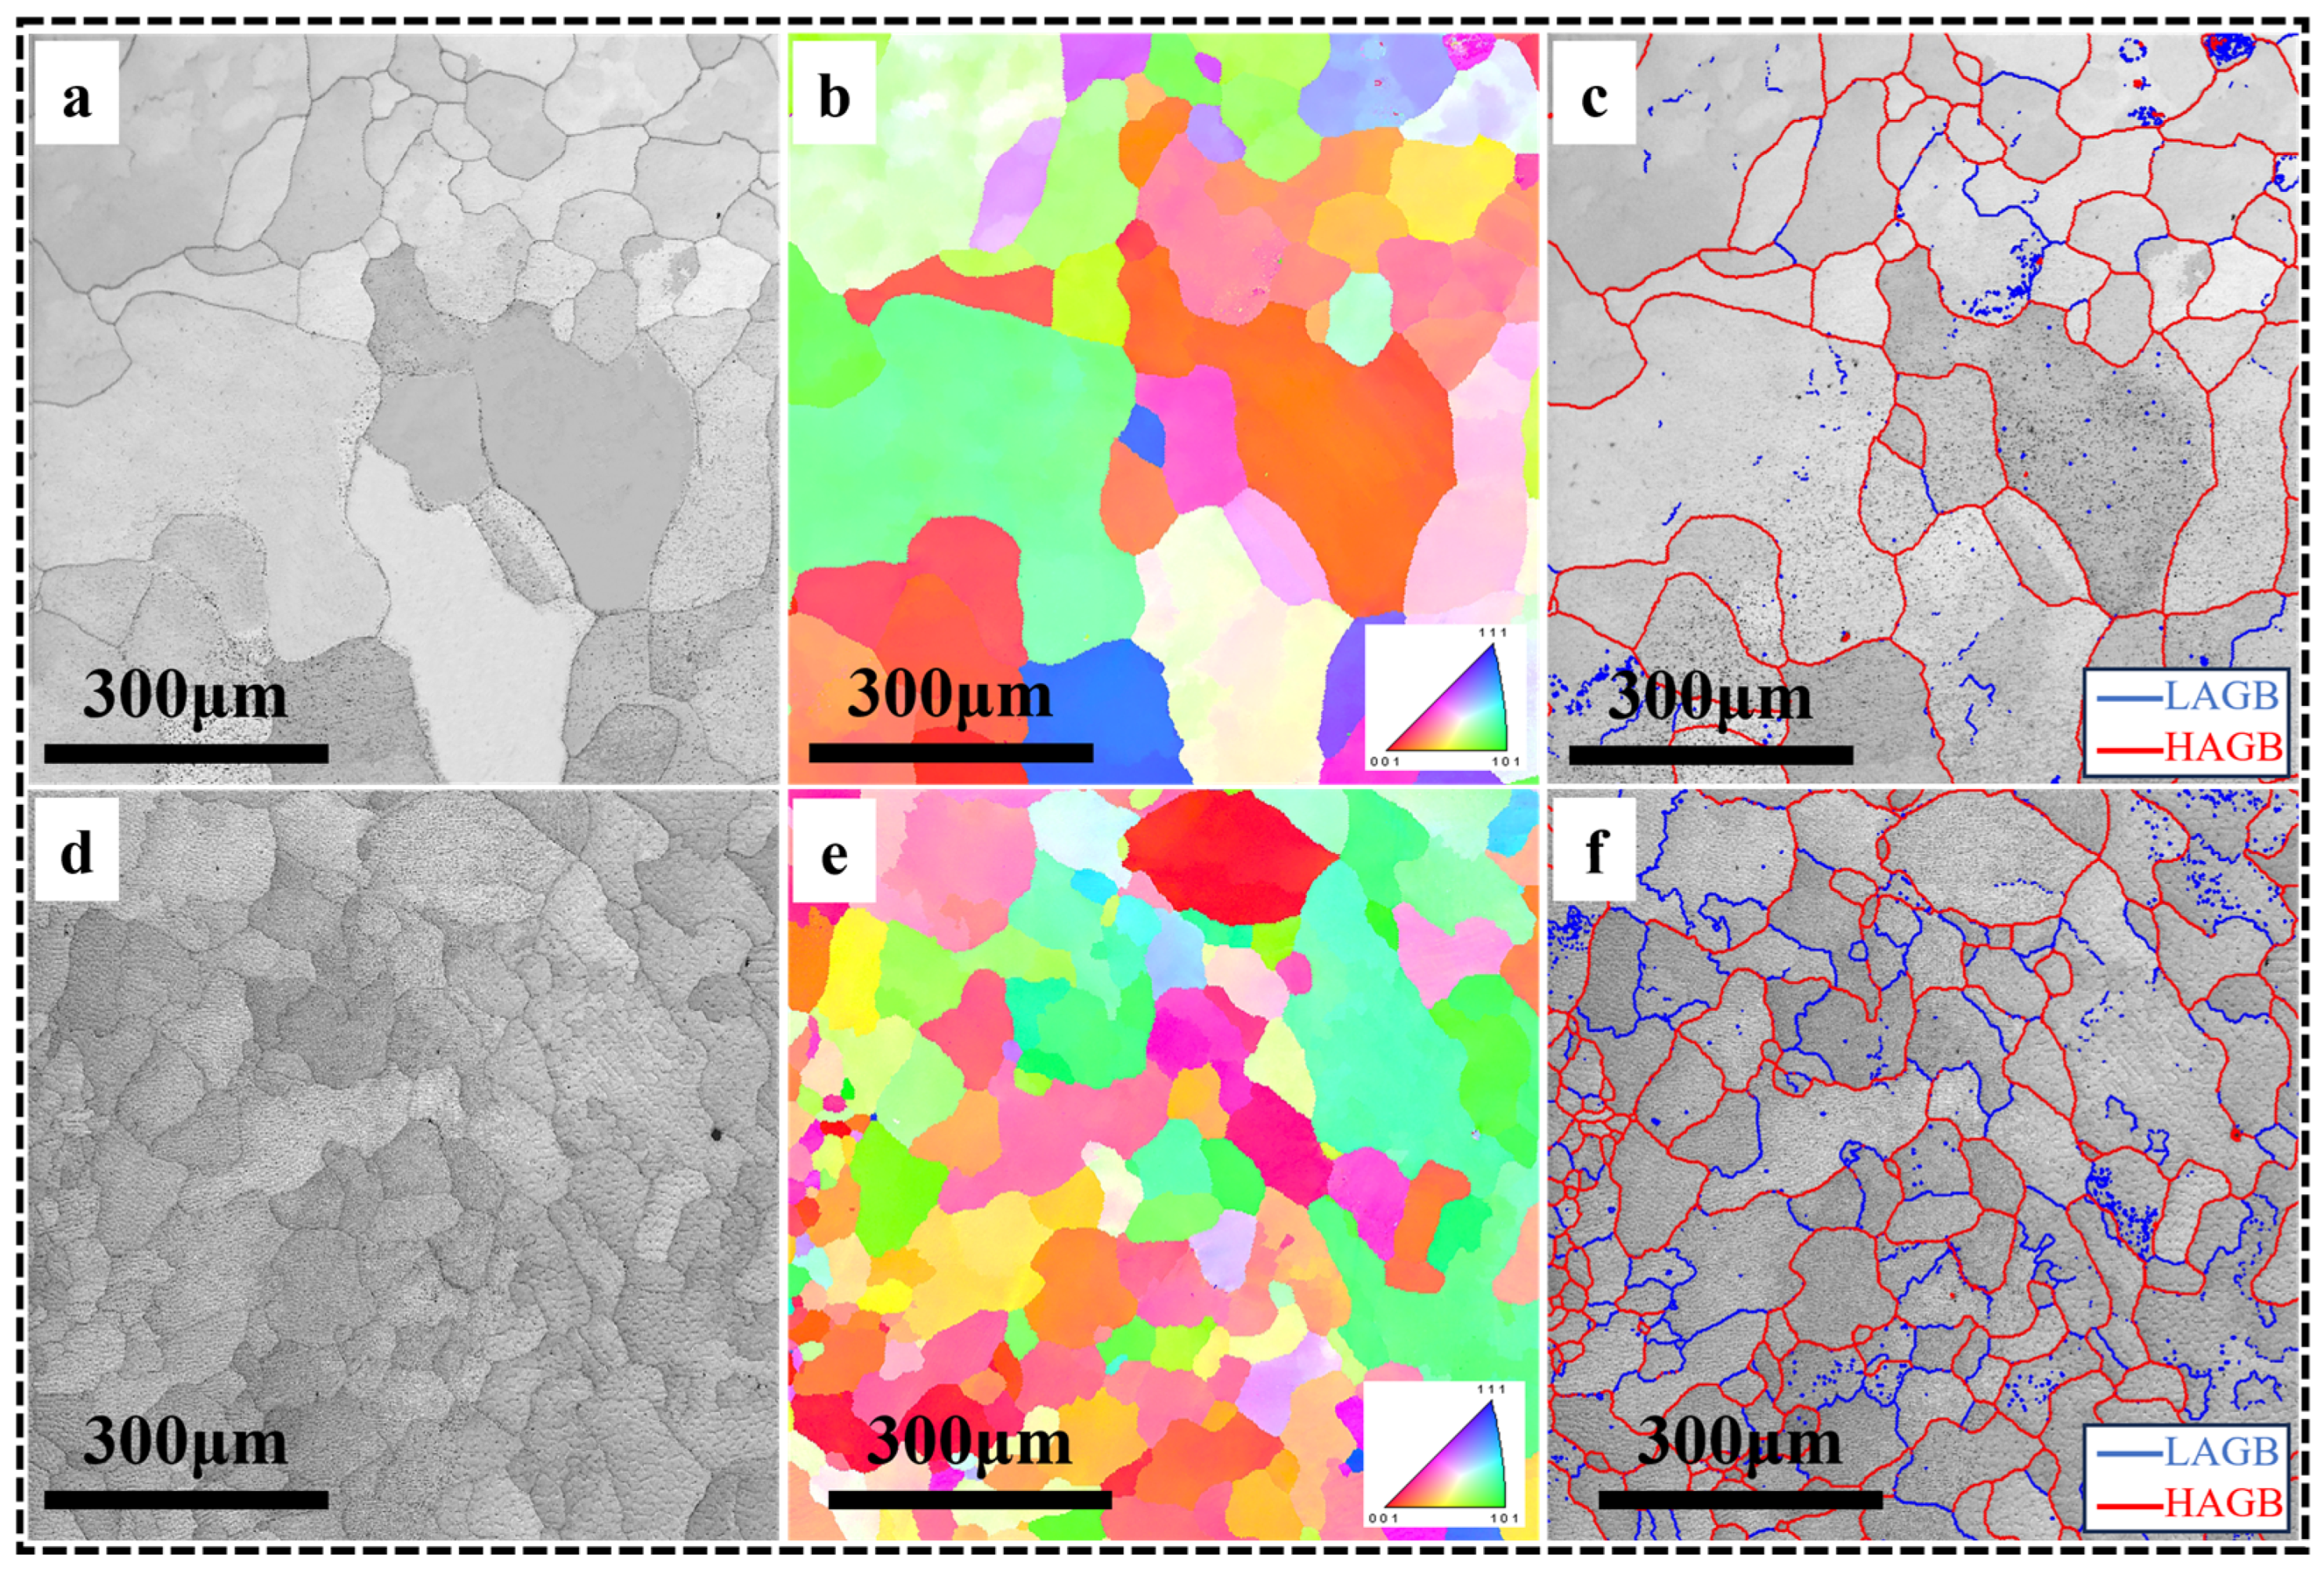
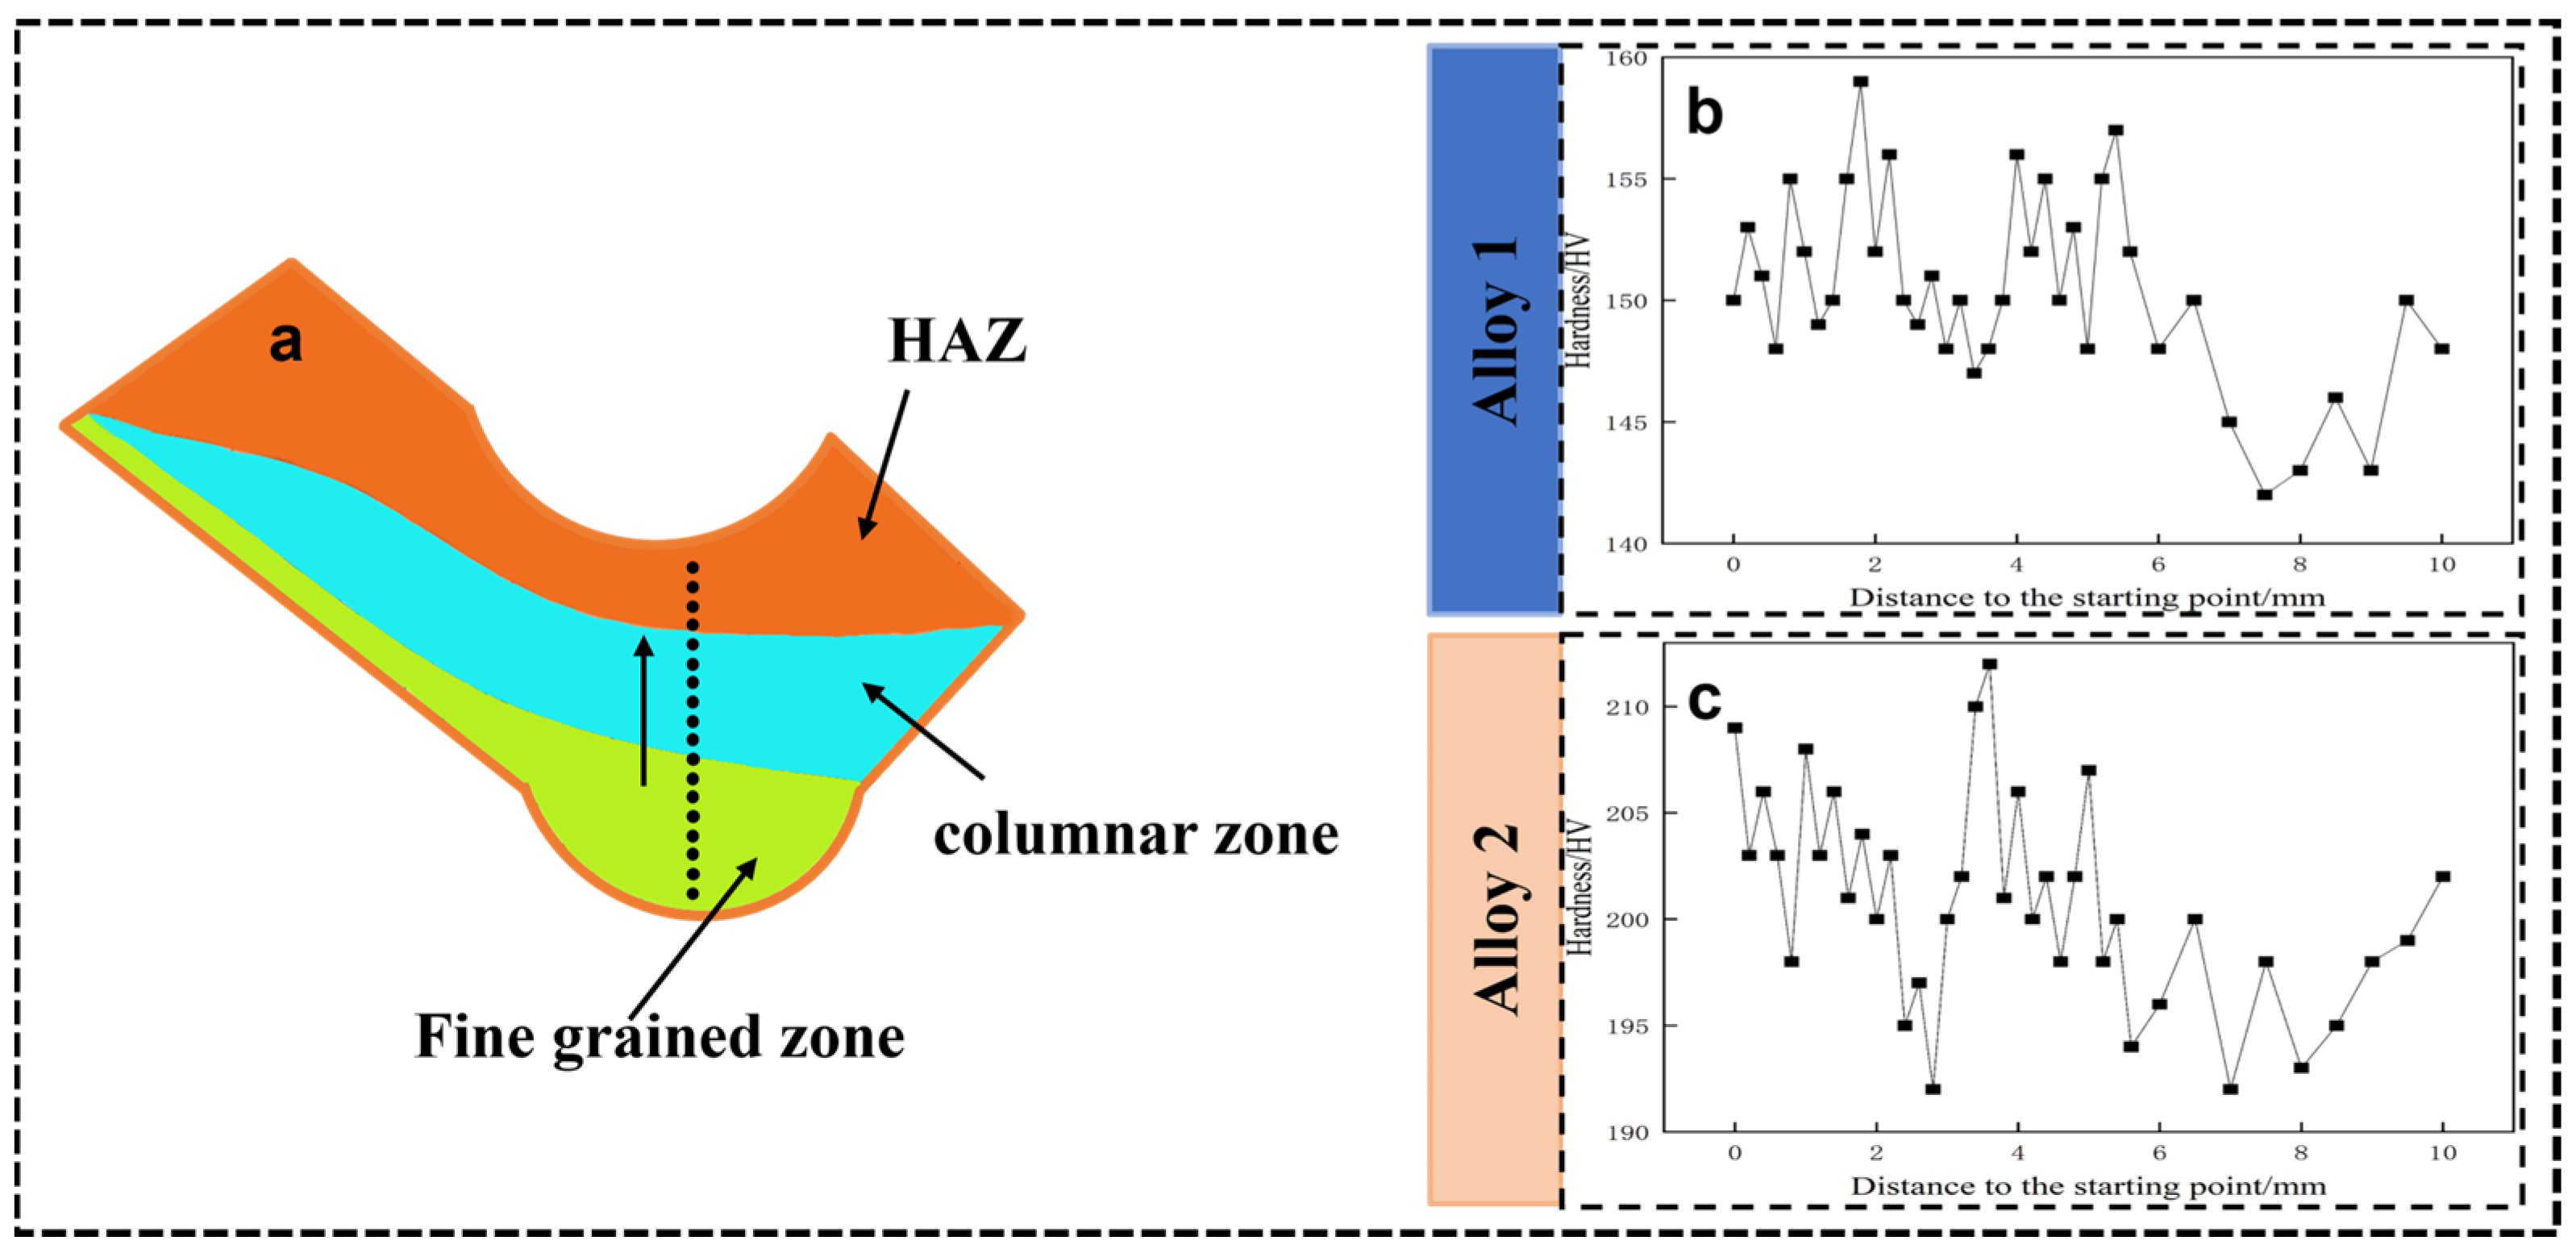
3.1. Microstructure

In the WAAM process, each deposition is accompanied by thermal input. The continuous thermal cycle results in a differentiated microstructure distribution within the deposition unit. Based on the ultimate microstructure distribution, the deposition unit can be divided into three main regions: the fine crystal region, the columnar crystal region, and the heat-affected region. Figure 6 and Figure 7 illustrate the microstructures of different sections in the WAAM-fabricated invar alloy.
In Figure 6a,b, the dark regions and deposition units on the Y–Z section of WAAM-fabricated invar alloy are periodically distributed. It has been confirmed that the dark region in Figure 6a is actually a heat-affected area formed during deposition [23]. Figure 6c shows a singular deposition unit, wherein the microstructures exhibit variation across different locations, primarily associated with the thermal dissipation conditions of the molten pool during solidification and the cyclical thermal input throughout the deposition process. During the cooling of the molten pool, the substantial temperature gradient of the liquid metal at the bottom results in an elevated heat dissipation rate, consequently leading to the formation of fine grains. The liquid metal at the core of the molten pool exhibits a reduced temperature gradient and diminished heat dissipation, resulting in a larger grain size. At the same time, as the molten pool during deposition radiates heat to the air above and to the metal below, a temperature gradient along the Z-axis is formed, and the crystals grow in the direction of the highest temperature gradient, eventually forming columnar grains along the Z-axis [24]. The heat-affected zone is located at the top of the deposition unit, and the grains within this zone are predominantly coarse columnar grains. This occurs because when the top area of the deposition unit is exposed to the heat influence from the overlying deposition units, the temperature in this region increases to the austenitizing temperature, leading to the growth of austenitic grains and the subsequent formation of coarse columnar grains [25]. This phenomenon can also be seen in the X–Y and X–Z planes, shown in Figure 6b and Figure 7a. These figures are microscopic images of the continuous deposition areas near the fusion line in the X–Y and X–Z planes. Two adjacent deposition units, the austenite grains in the earlier-formed deposition unit, will further grow due to the thermal influence of the later-formed deposition unit.
Figure 8 shows the microstructures of the alloy 1 specimen and alloy 2 specimen in the X–Y section. It is evident that the grain morphology of both the alloy 1 specimen and alloy 2 specimen is dominated by equiaxial crystals in the X–Y section. As shown in Figure 8a, the grain size distribution in the alloy 1 specimen is uneven, with the smallest grain size being only 29 μm, the largest grain size being 538 μm, and the average grain size being 311 μm. The grain size of the alloy 2 specimen clearly has become finer in Figure 8b, and its homogeneity has somewhat improved. With an average grain size of 206.22 μm, the alloy 2 specimen shows a grain refinement of almost 33.7% over the alloy 1 specimen. In addition, we can observe some fine cellular substructures, which are regularly arranged within the austenite grains, as depicted in Figure 8c,d. However, in the alloy 1 specimen, the size of the cellular substructures is significantly larger in some areas than in others. The cellular substructures in the alloy 2 specimen were not only smaller in size but also more homogeneous compared to those in the alloy 1 specimen. The average size of the cellular substructures in the alloy 2 specimen is 6 microns, which is about 45% smaller compared to cellular substructures in the alloy 1 specimen. It can be noted that the inclusion of a Cr, Mo, V, and N composite modifier refines not only the grain structure of the invar alloy specimen but also the cellular substructure within the grains.
Figure 9 compares and analyzes the microstructure of the alloy 1 specimen and alloy 2 specimen using EBSD technology. The results show that the grains on the X–Y planes of alloy 1 and alloy 2 are equiaxed, and the different colored regions in Figure 9b,e represent grains with different orientations. Figure 9c,f show the distribution of grain boundary orientation differences, with the blue lines representing low-angle grain boundaries (LAGB, 2 ≤ θ ≤ 15°) and the red lines representing high-angle grain boundaries (HAGB, θ ≥ 15°). The proportion of low-angle grain boundaries in alloy 1 and alloy 2 samples is 22.2% and 36.3%, respectively. To a certain extent, small-angle grain boundaries can reflect the dislocation density, and the larger the proportion of small-angle grain boundaries, the greater the degree of dislocation accumulation [26].

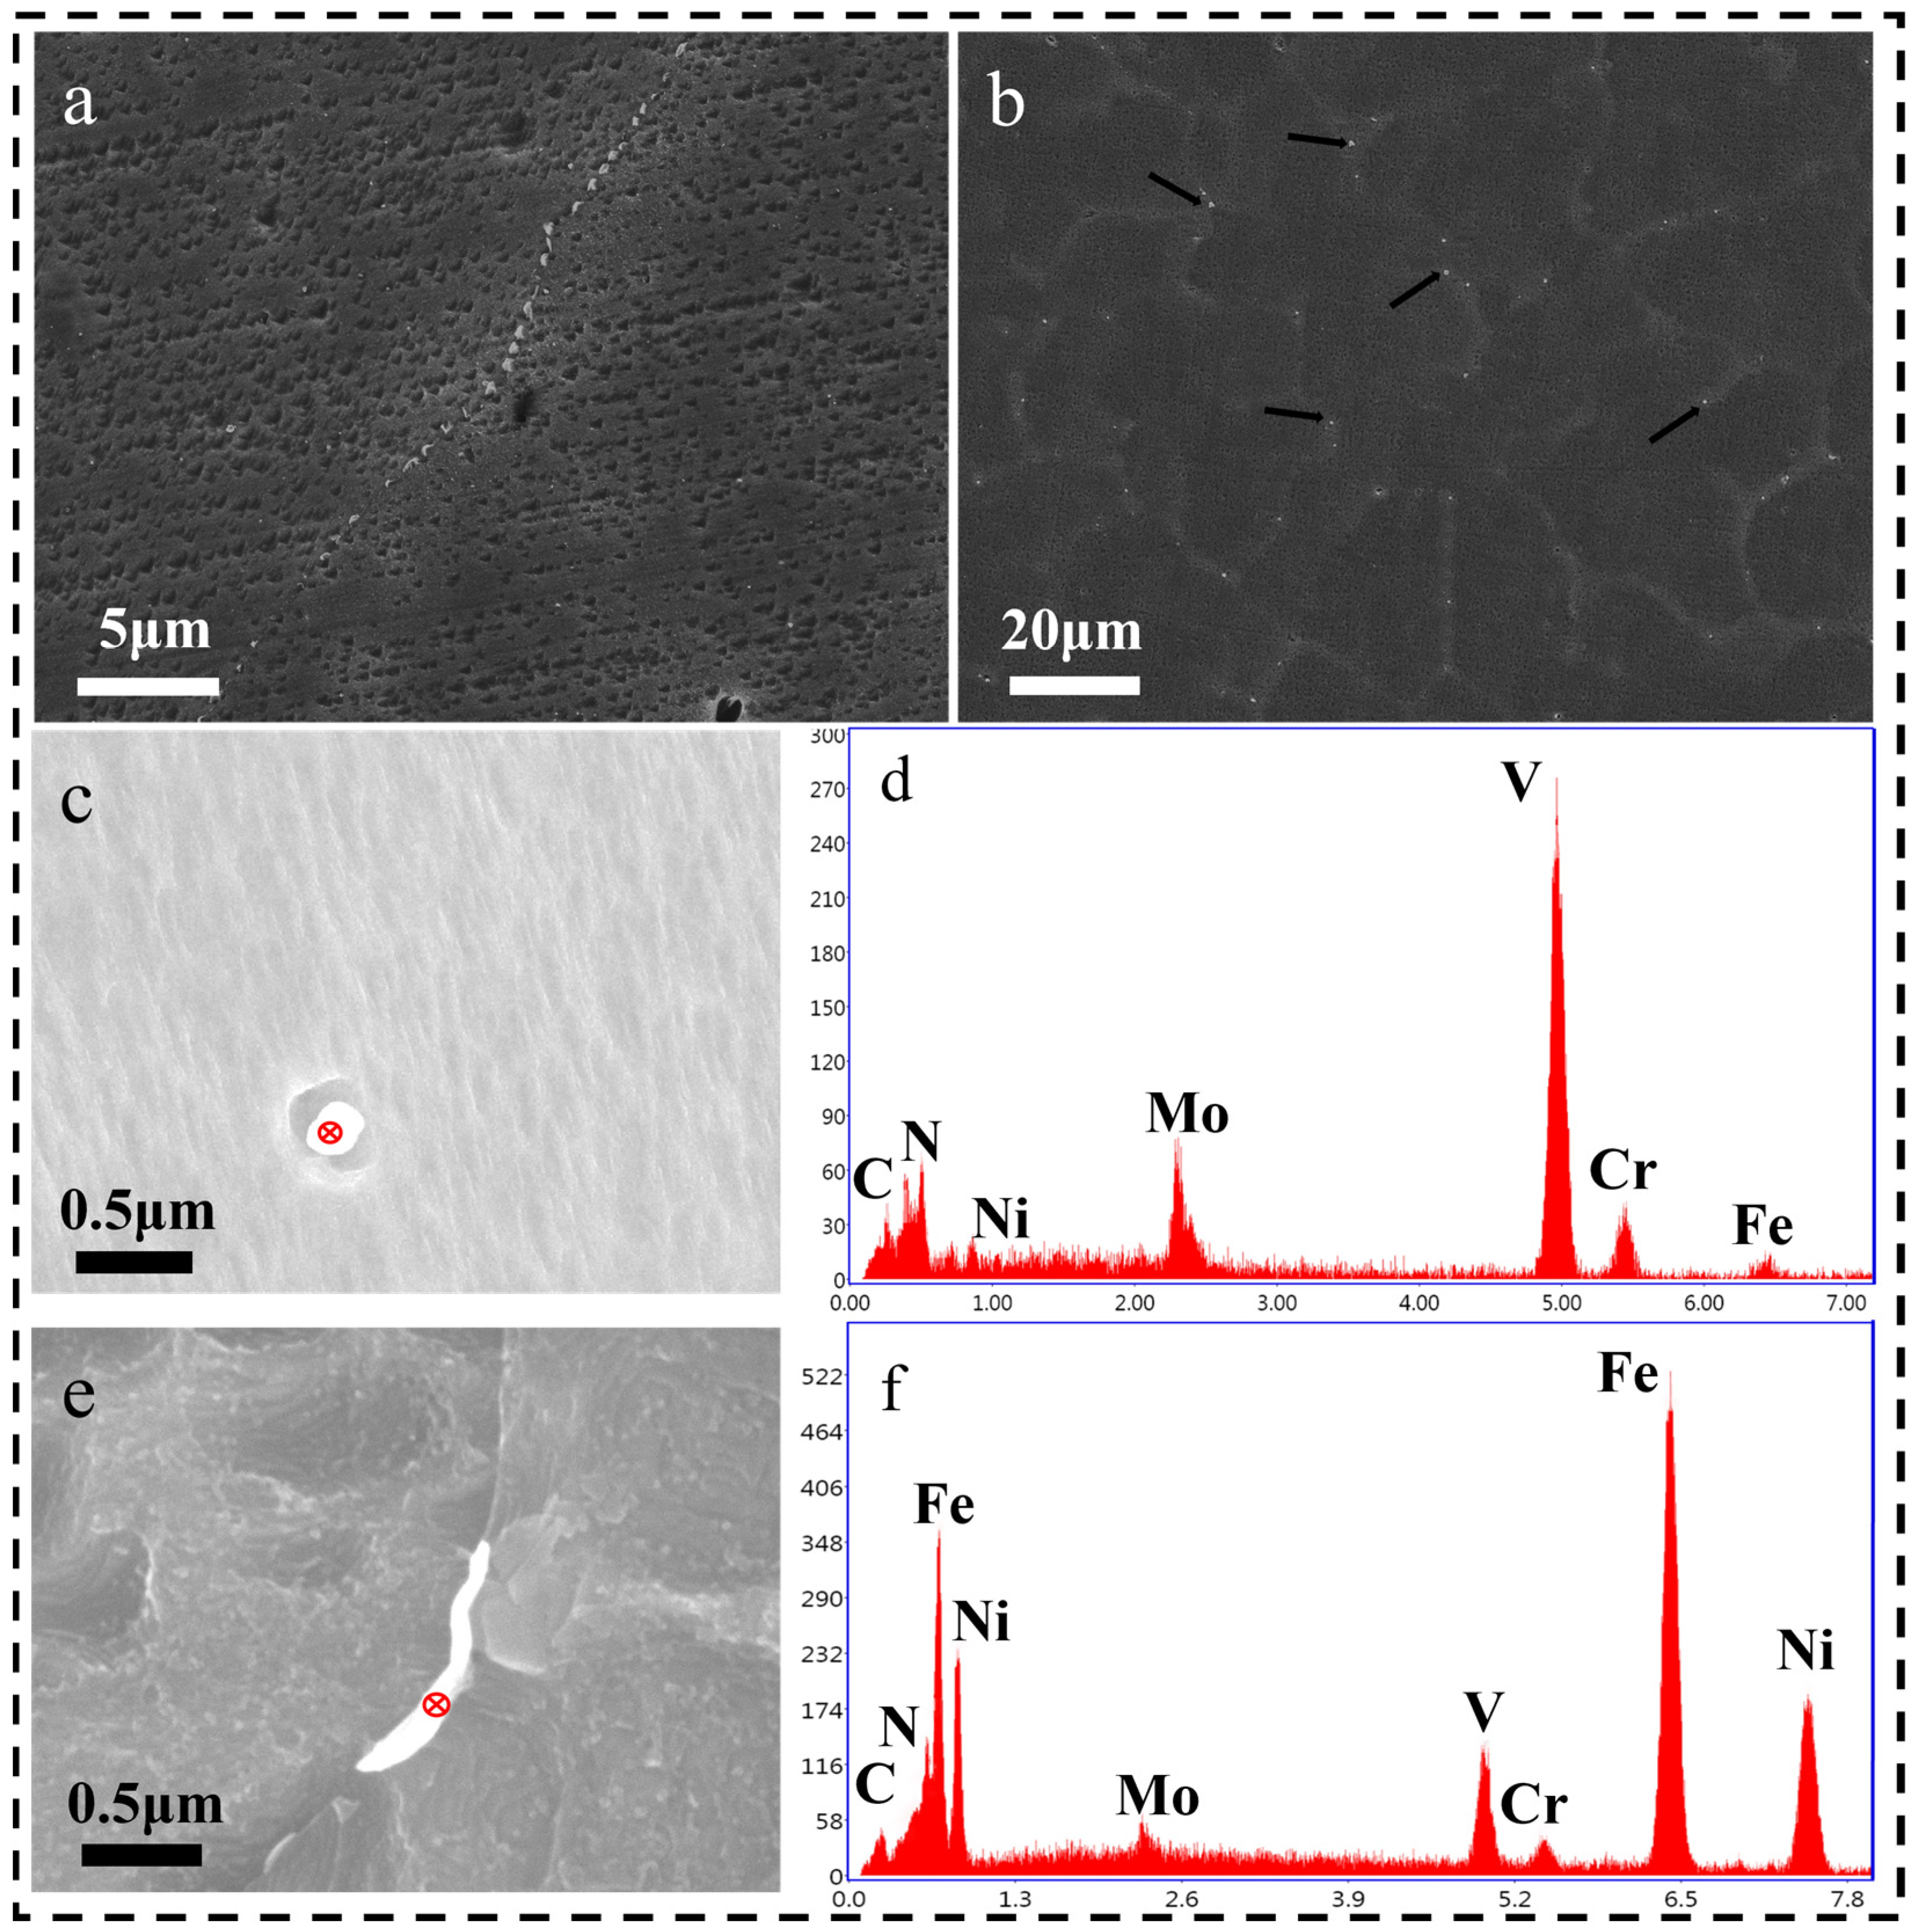
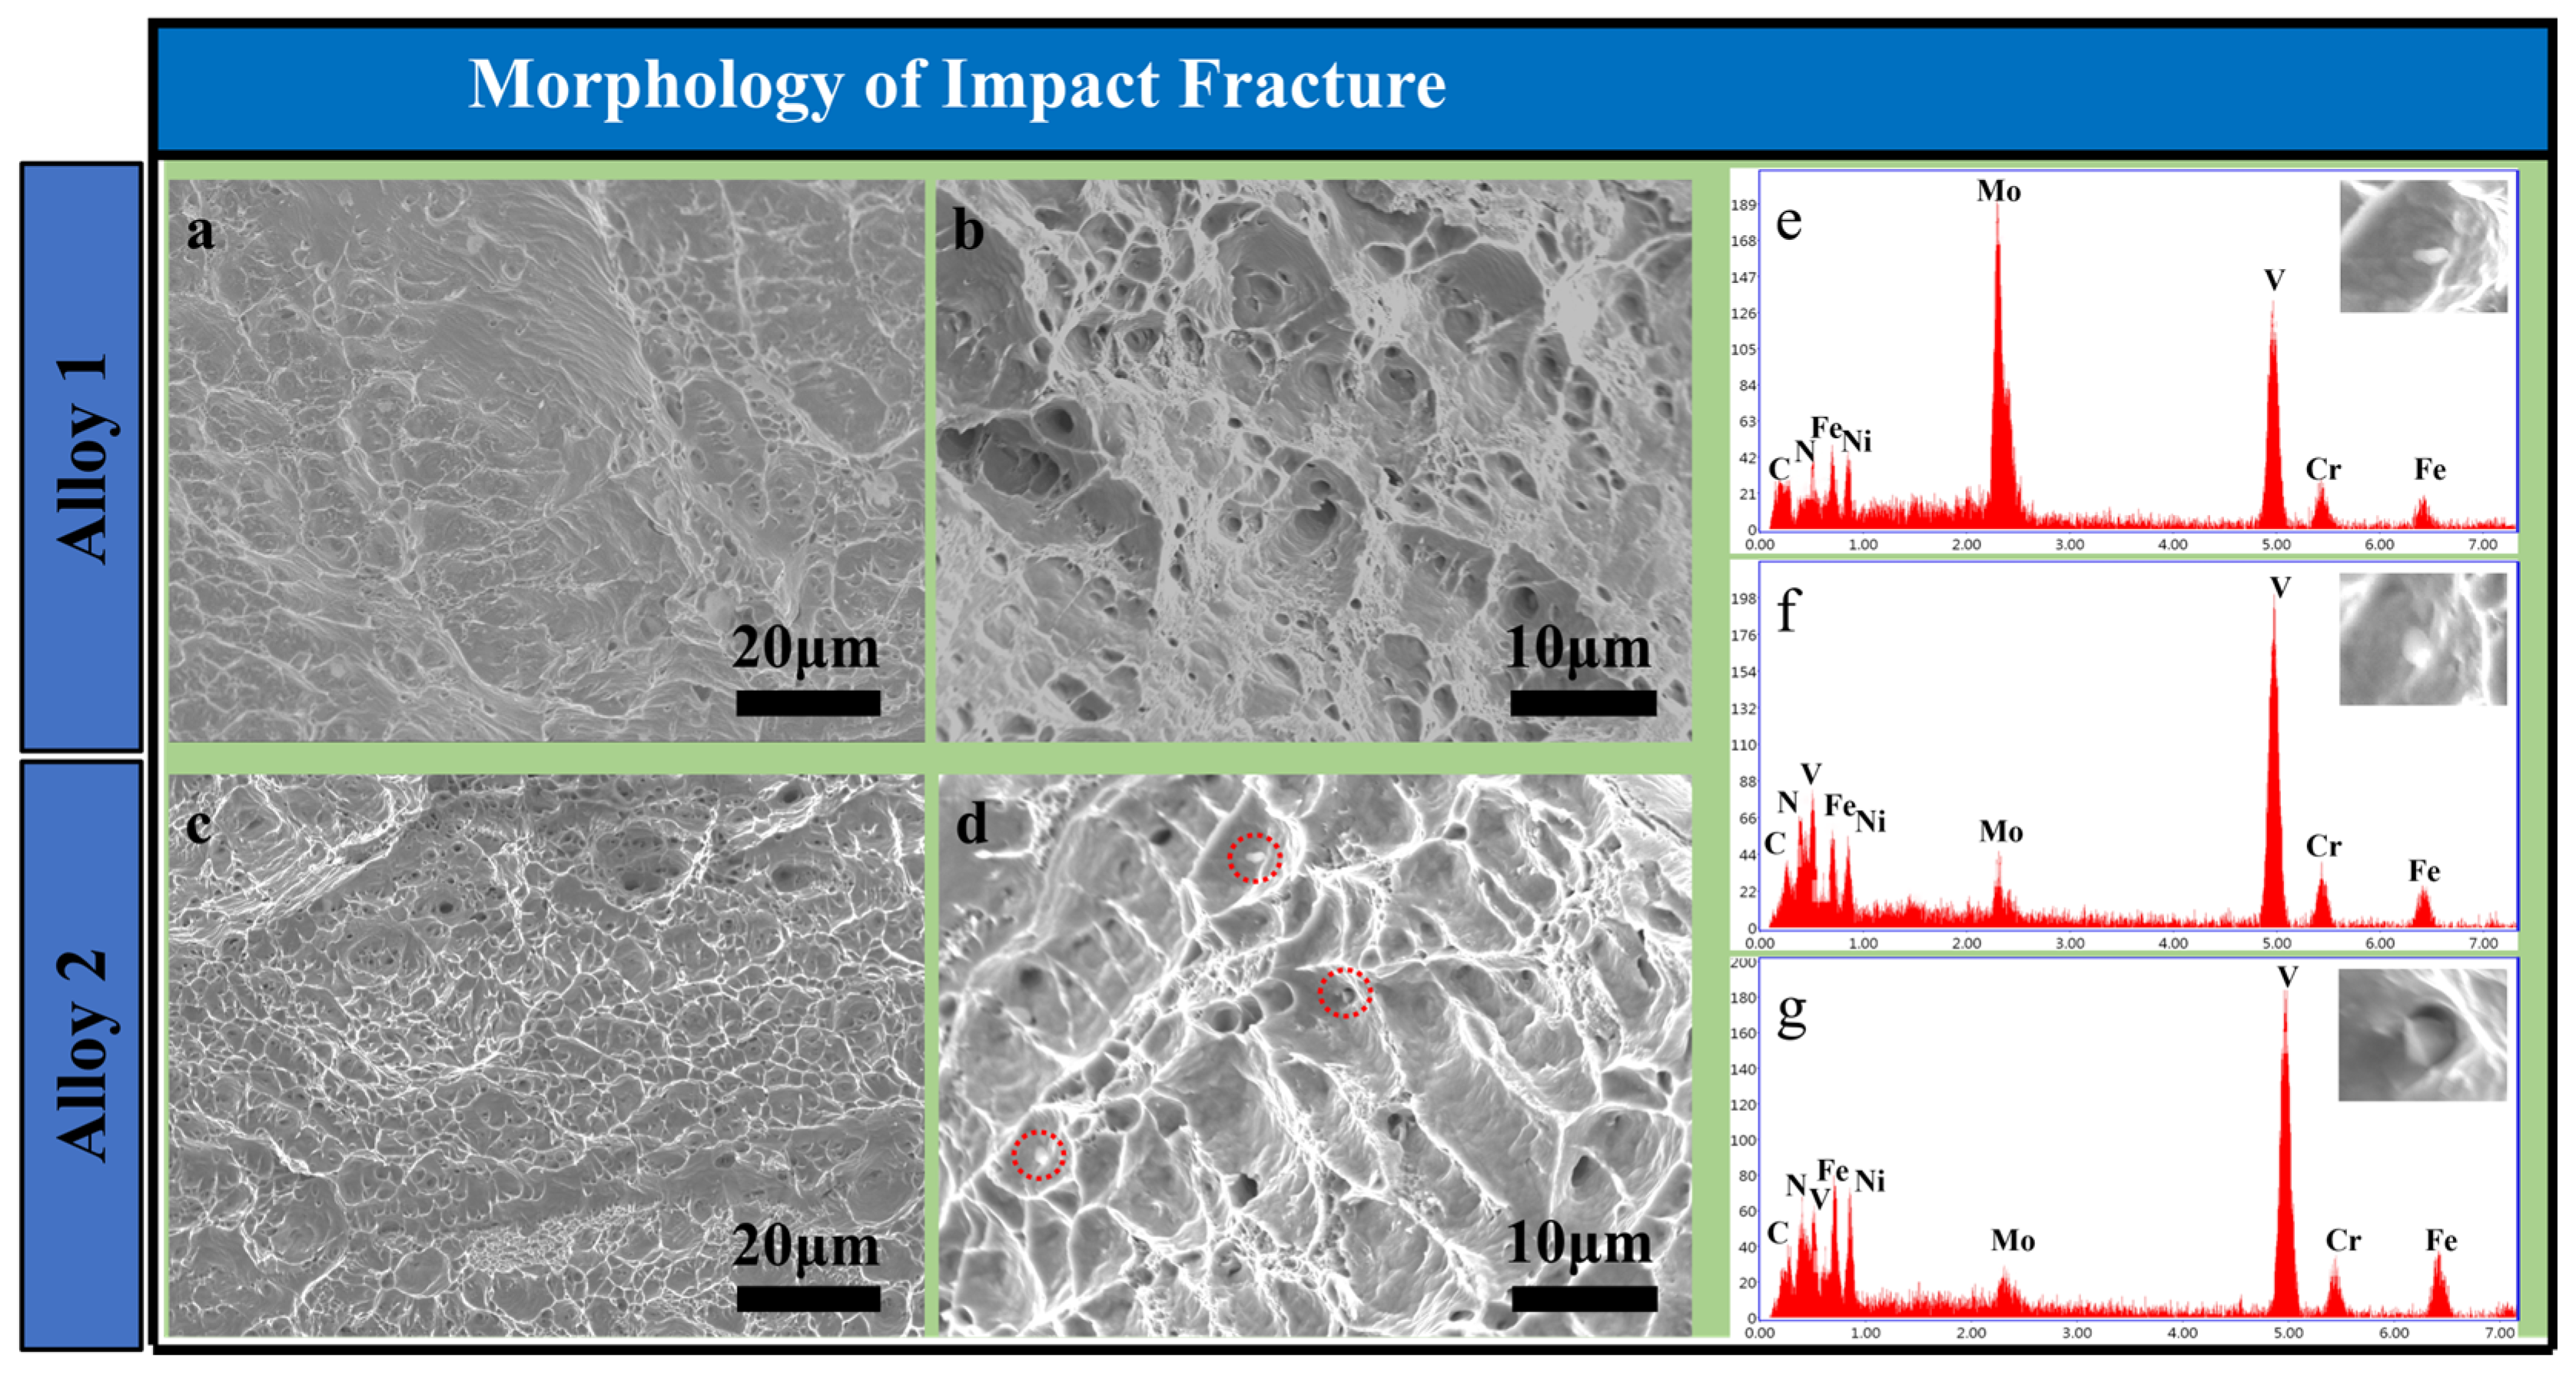
3.2. Morphology and Elemental Composition of Precipitated Phases

According to previous studies, different types of precipitated phases are formed when alloying elements are added to steel. In addition to being the core of heterogeneous nucleation or as the particle point pinning the grain boundary to hinder the grain growth and achieve the purpose of refining the microstructure, these precipitated phases can also be distributed near the grain boundary to hinder the movement of dislocations and achieve the effect of strengthening the alloy [27]. Figure 10a,b shows that there are two forms in the precipitated phase of the alloy 2 specimen. One type forms in a “chain-like” pattern along the grain boundaries, while the other type appears as irregularly shaped spheres inside the grains. These carbides and nitrides distributed within grain boundaries and grains can effectively refine the microstructure of the invar alloy specimen, as shown in Figure 8. The EDS analyses of Figure 10d and Table 2 show that the main chemical composition in the precipitated phase inside the grains is Cr-Mo-V-N-C. V is a strong carbide-forming element, which is easy to combine with C to form VC. Moreover, there is a strong chemical affinity between N and V. Therefore, V can react with C and N to form carbon and nitrogen composite phases (NC, VC) [28,29]. Cr and Mo are also carbide-forming elements and, therefore, can also react with C to form some carbides [30]. As can be seen from the EDS analysis in Figure 10f and Table 3, the precipitation phase at the grain boundaries contains a low content of Cr-Mo-V-C-N, indicating a low number of carbides and nitrides at the distributed grain boundaries. The reasons for this phenomenon include two main aspects: (1) Strong carbide-forming elements such as Cr, Mo, and V in the distributed grains have a strong trapping effect on C, which inhibits the diffusion of C, resulting in C elements that are not easy to aggregate at grain boundaries. (2) The precipitated phases at the cell wall of the cellular substructure inside the grain cause a certain degree of dislocation blockage, which also slows down the diffusion rate of the alloying elements (mainly C) to some extent.
Figure 11 displays the element distribution inside the grain. In Figure 11a–e, the segregation of Cr, Mo, and Ni elements along the cell wall of the cellular substructure, and most of the precipitated phases within the grains are also distributed on the cell wall of the cellular substructure. In Figure 11k,l, the distribution position of V elements in the cell wall of the cellular substructure is highly coincident with C and N elements, indicating that V elements react with C and N elements to form some carbides and nitrides. In addition, the distribution positions of Cr and Mo basically coincide with C elements, and combined with the thermodynamic calculations in Figure 12, it can be seen that these carbides and nitrides are mainly VC, VN, Mo2C, Fe20Mo3C6, and Cr20Mo3C6. According to previous studies, there are high-density dislocations in the cell walls of the cellular substructure inside the austenitic steel grains. The elemental segregation and precipitation phases at the cell wall of the cellular substructure can effectively hinder the movement of dislocations, thereby improving the strength of the material [31,32]. This is consistent with the results of the EBSD analysis in Figure 9.

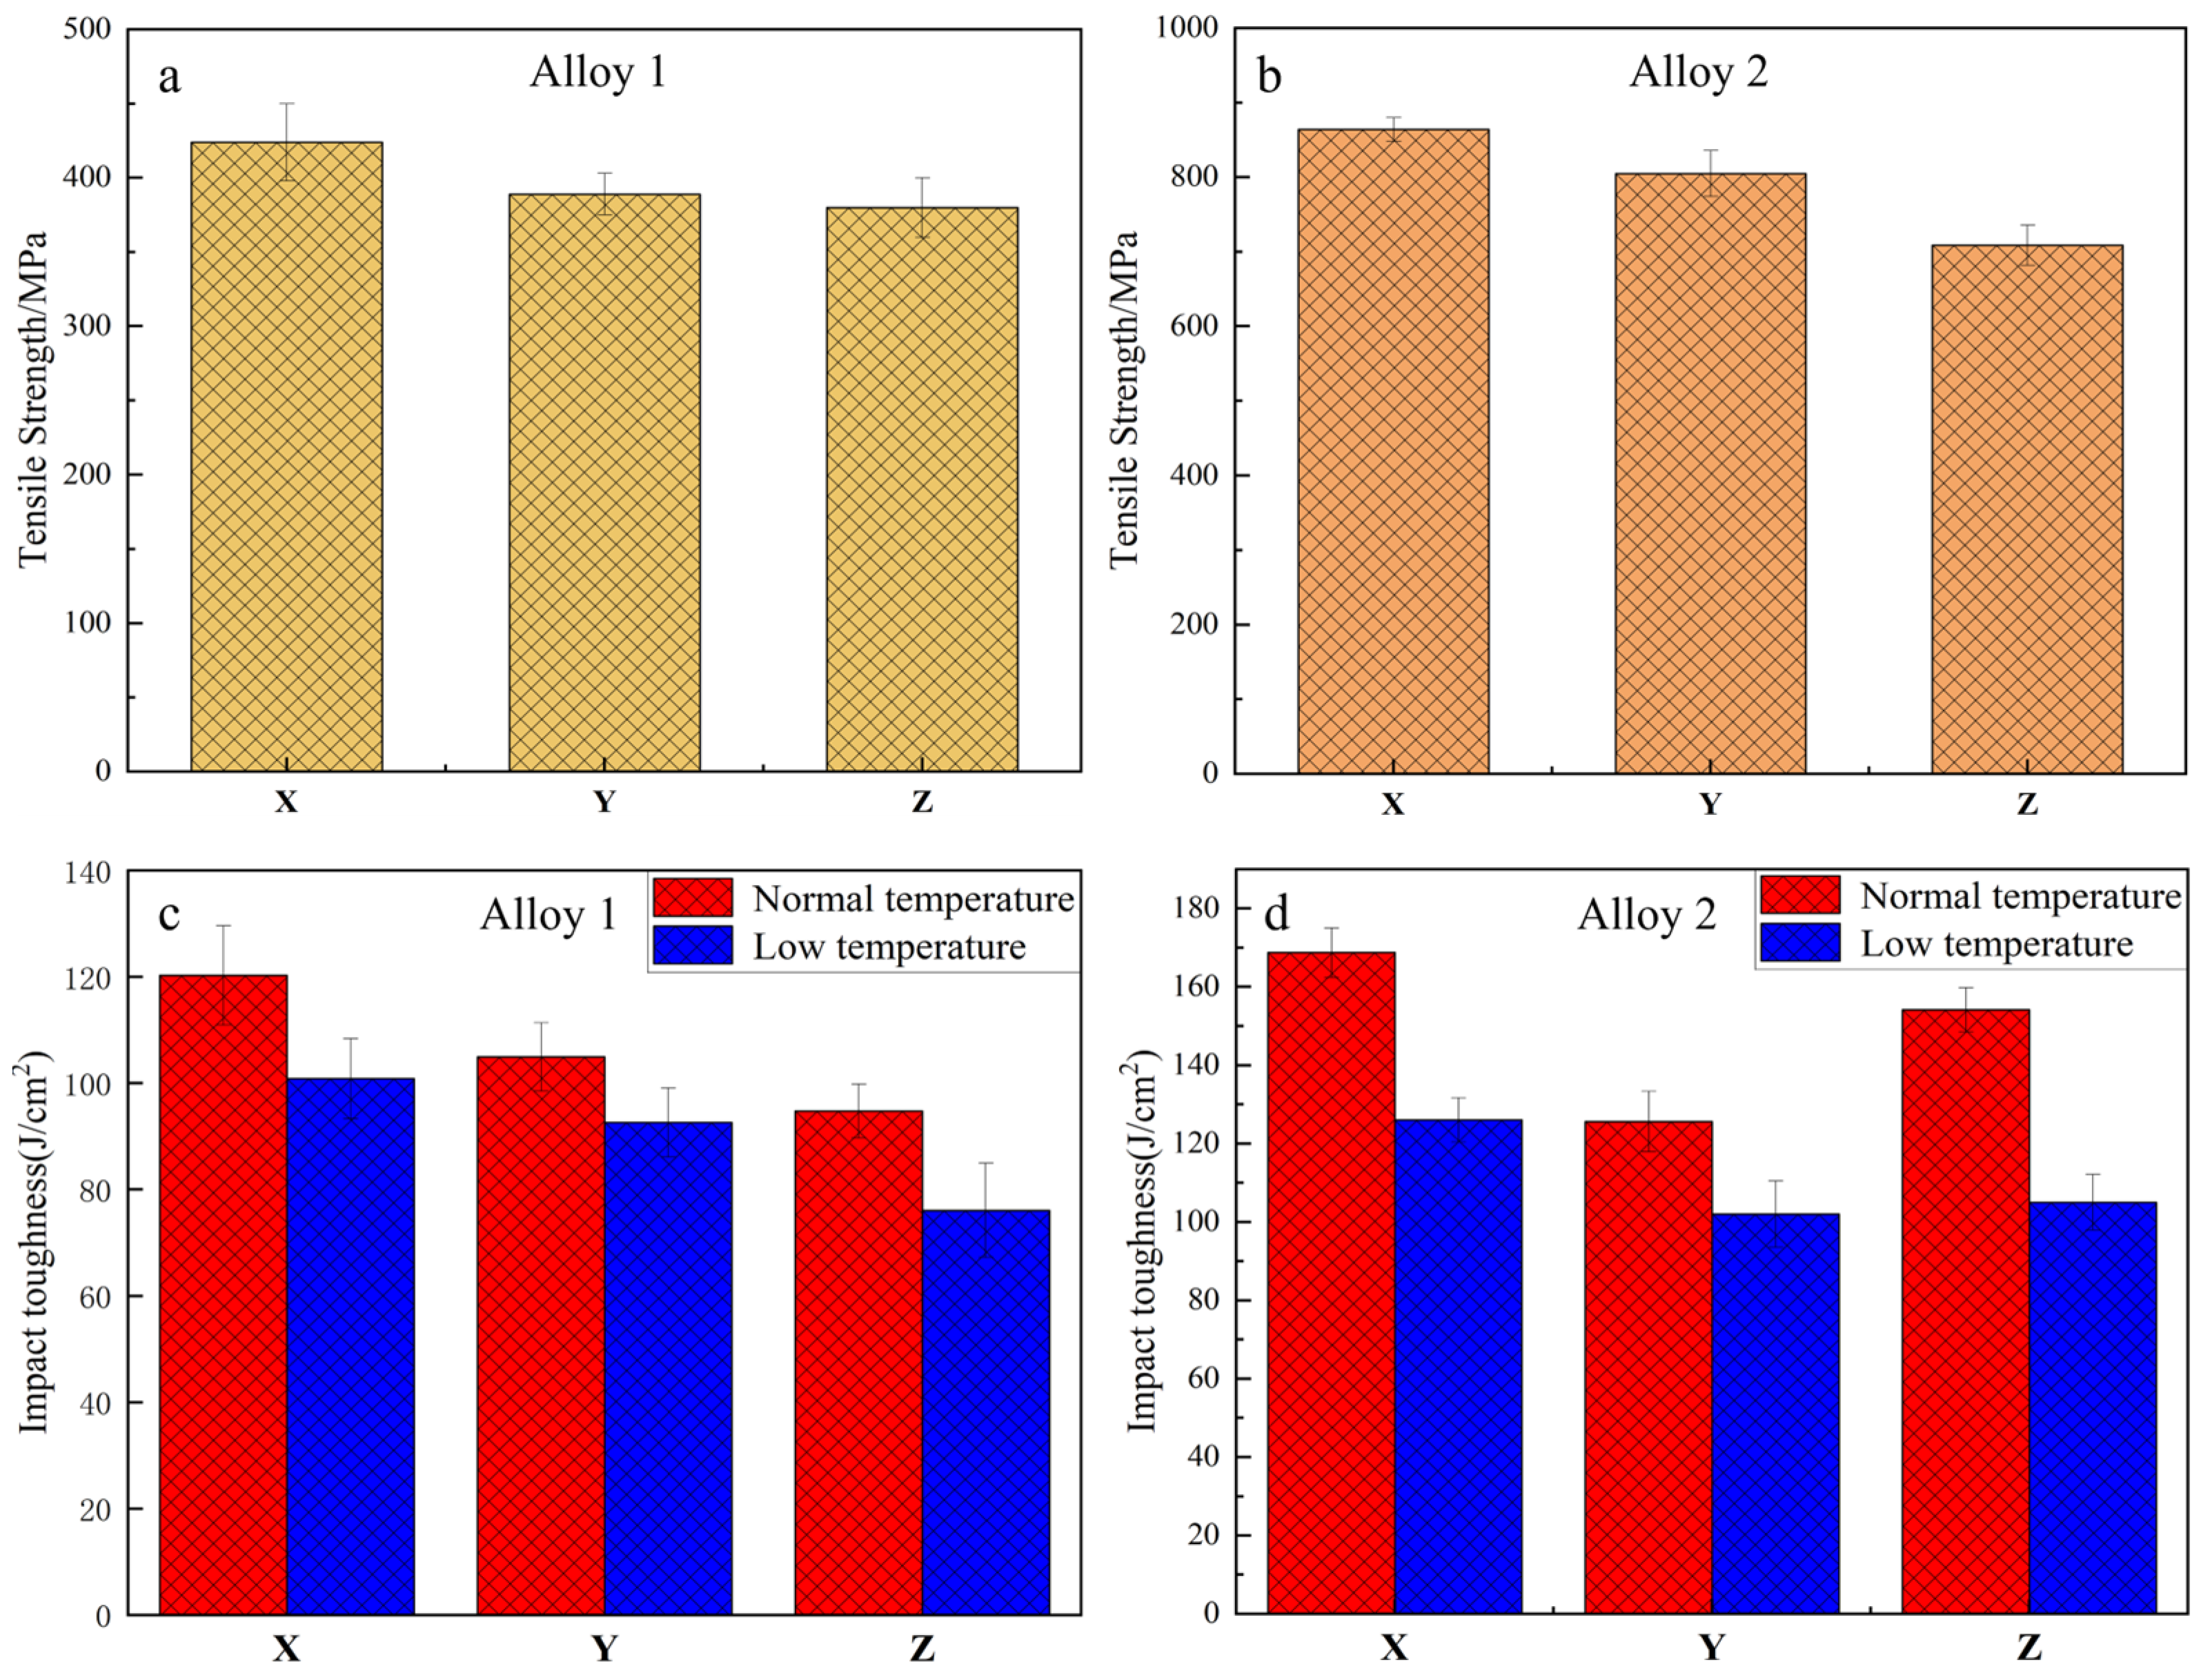
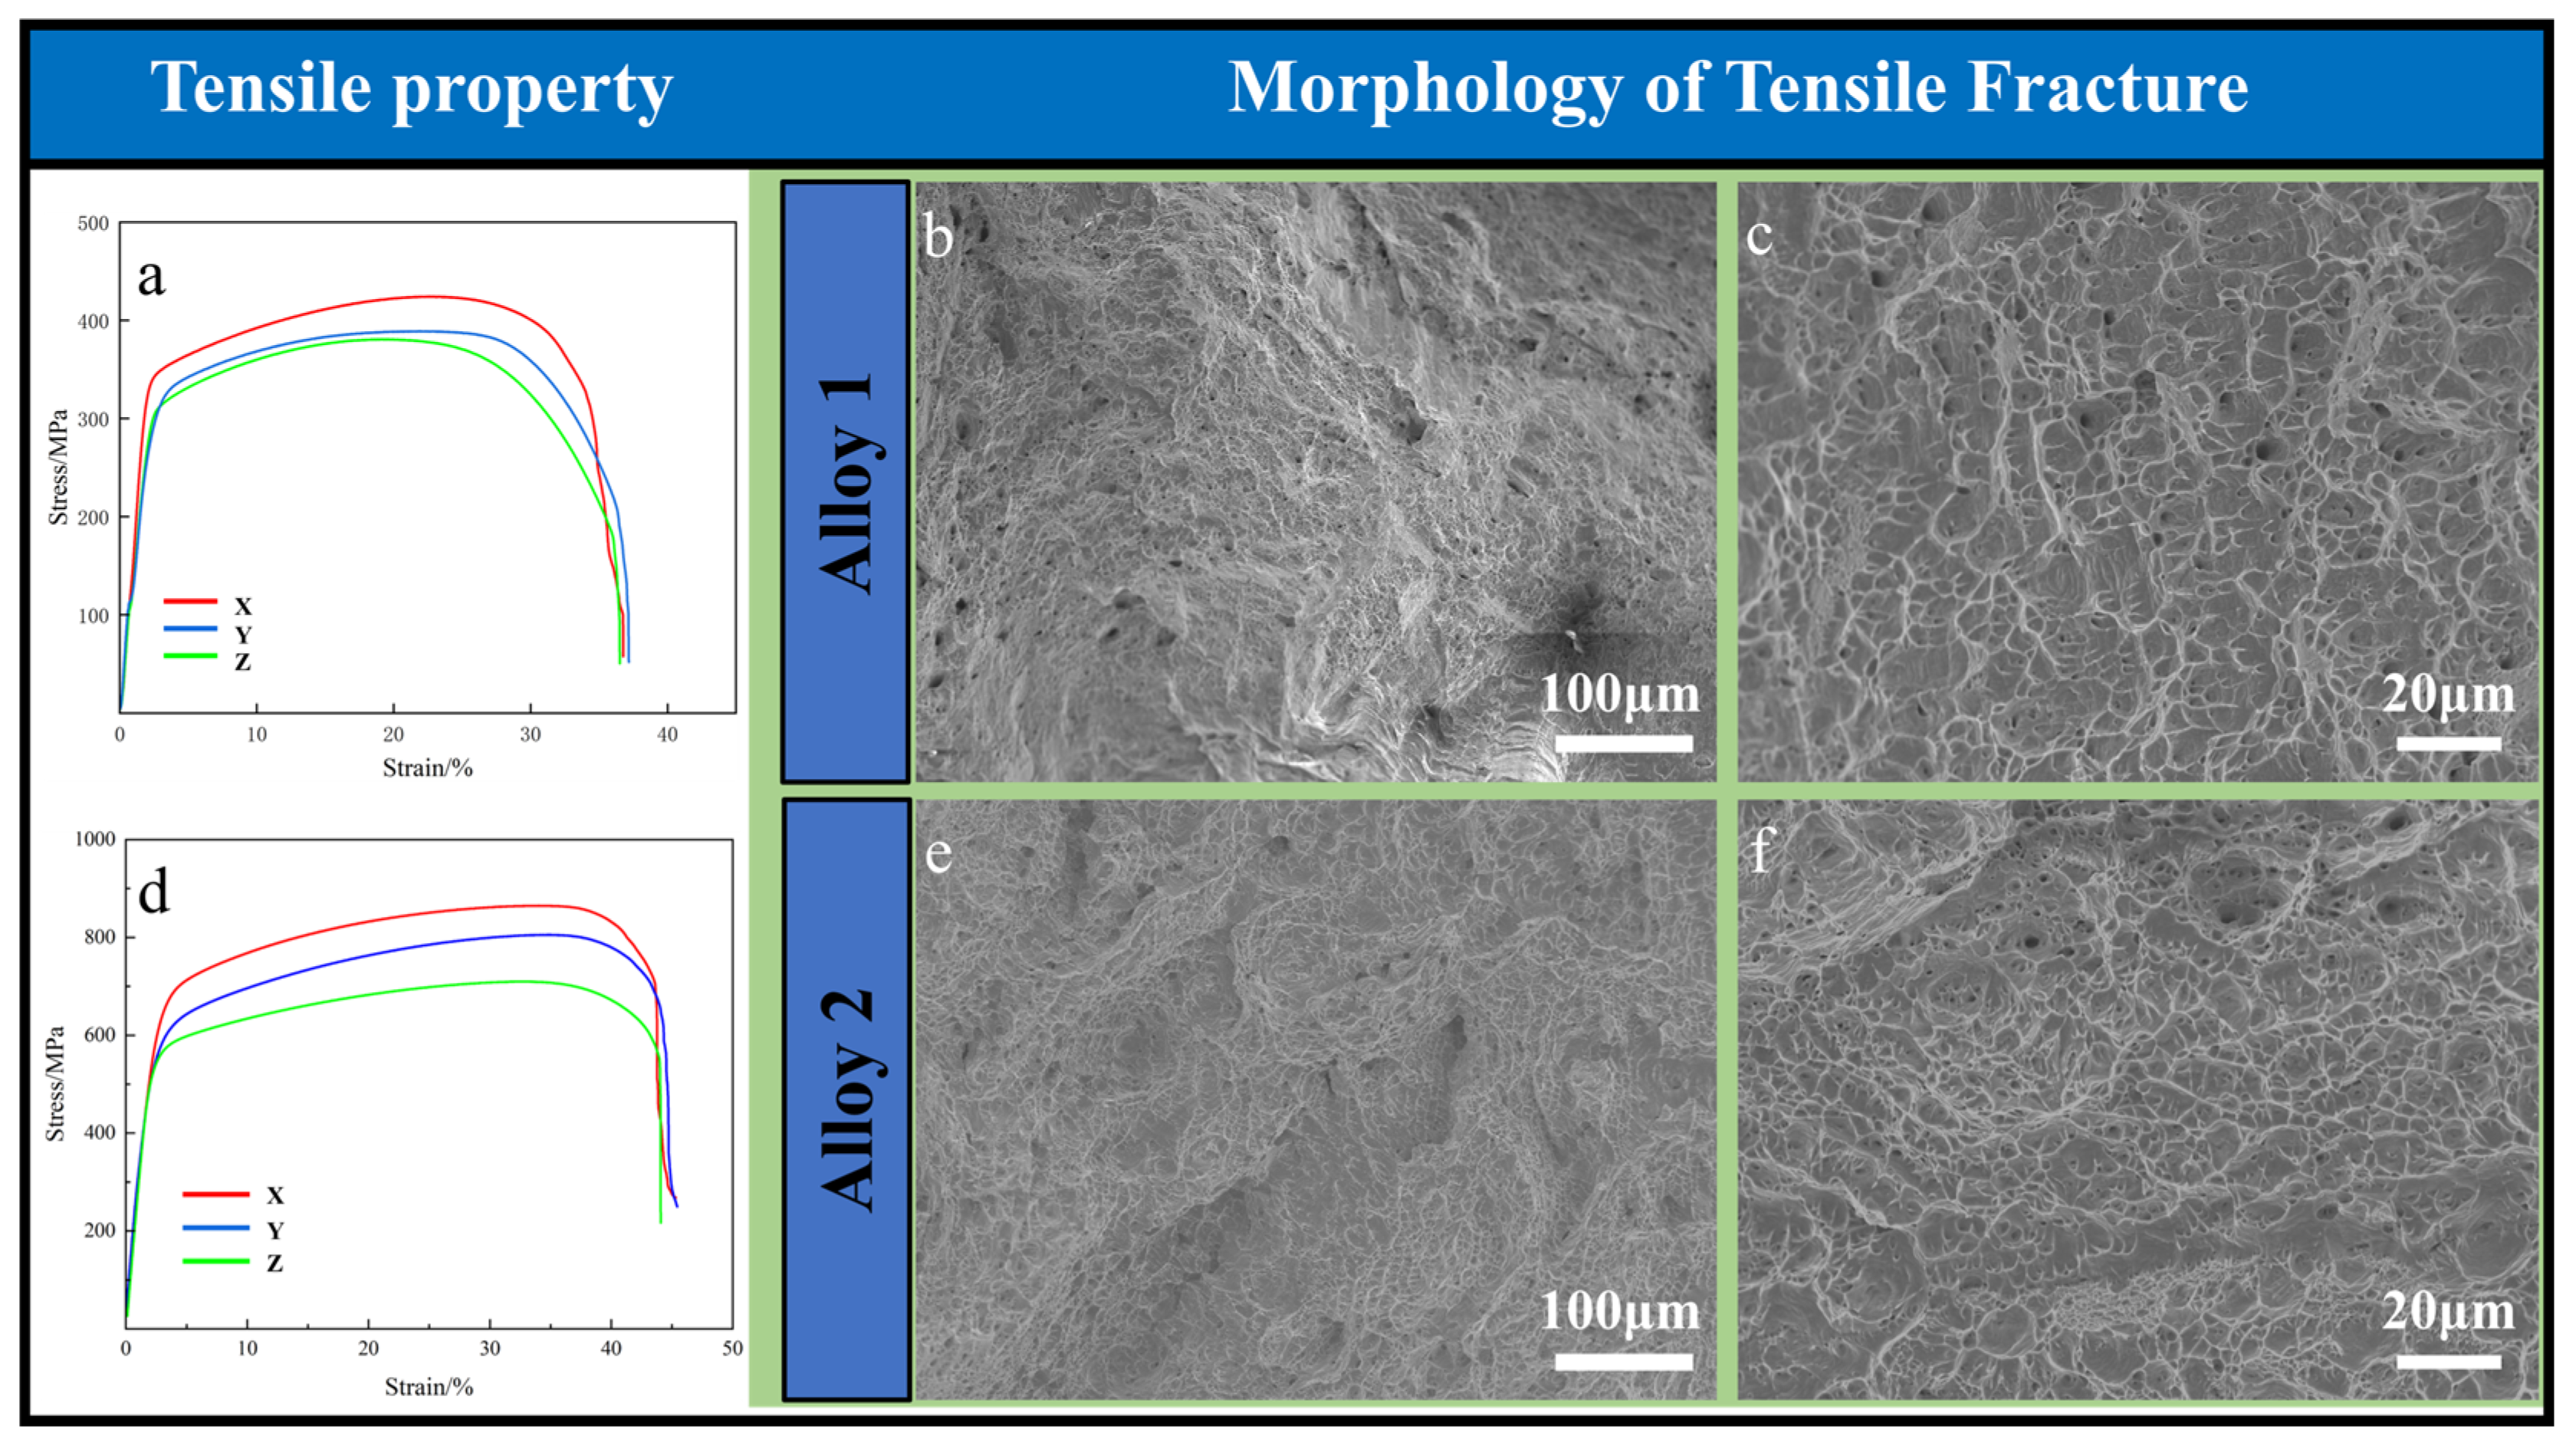
3.3. Mechanical Properties

It can be seen from Figure 13 that the alloy 1 specimen and alloy 2 specimen have common characteristics of tensile and impact properties. The mechanical properties of alloy 1 specimen and alloy 2 specimen in the X direction are better than those in the Y and Z directions. During deposition, since the X direction is parallel to the direction of the deposited weld bead, the microstructural distribution in the X direction is relatively simple, and there is no cyclic alternation of fine grain zones, columnar crystal zones, and HAZ, so the mechanical properties in this direction are optimal [33]. In Figure 13a, the tensile strength of the alloy 1 specimen in the X, Y, and Z direction is 424 MPa, 389 MPa, and 380 MPa, respectively, with an average tensile strength of 398 MPa. In Figure 13b, the tensile strengths of the alloy 2 specimen in the X, Y, and Z directions were 864 MPa, 805 MPa, and 709 MPa, respectively, with an average tensile strength of 793 MPa. The average tensile strength of the alloy 2 specimen increased by about 99% compared with that of the alloy 1 specimen. However, the difference in tensile strength between the X and Z directions of the alloy 2 specimens is more significant. In the Z direction of the alloy 2 specimen, the HAZ, columnar zone, and fine grain zone are cyclically distributed, where some of the low melting point second-phase particles in the HAZ are dissolved in the matrix due to multiple thermal cycles, which weakens the pinning effect of the second phase particles in the HAZ to the grain boundaries and dislocations. Therefore, the HAZ in the Z direction of the alloy 2 specimen is prone to become the area of crack initiation and propagation during the tensile process, which leads to a decrease in tensile strength in the Z direction. The distribution of the microstructure and precipitated phase in the X direction of the alloy 2 specimen is relatively uniform, and the tendency to produce stress concentrations in the X direction is lower during the tensile process; therefore, the difference in tensile strength between the X and Z directions of the alloy 2 specimen is more significant. Figure 13c,d show the impact toughness of the alloy 1 specimen and alloy 2 specimen at room temperature and low temperature (−196 °C), respectively. The average impact toughness of the alloy 1 specimen at room temperature and low temperature is 107 J/cm2 and 90 J/cm2, respectively, and the impact toughness of the alloy 2 specimen at room temperature and low temperature (−196 °C) is 151 J/cm2, 111 J/cm2. The average impact toughness of the alloy 2 specimen was 39% and 23% higher than that of the alloy 1 specimen at room temperature and low temperature, respectively.
Figure 14a,d show the stress–strain curves of the two specimens, where the average yield strengths of the alloy 1 specimen and alloy 2 specimen are 316 MPa and 603 MPa, respectively, and the average fracture elongation is 36.8% and 44.3%, respectively. According to the yield strength and tensile strength of the material, the yield ratio of the material can be calculated, and the yield ratio of the alloy 1 specimen and the alloy 2 specimen are 0.794 and 0.761, respectively, and the yield ratio of the alloy 2 specimen is smaller, indicating that the plastic reserve of the alloy 2 specimen is larger, and the risk of brittle fracture is lower. In addition, the tensile strength and fracture elongation of the alloy 2 specimen are higher than those of the alloy 1 specimen, which indicates that the comprehensive mechanical properties of the strength and plasticity of the alloy 2 specimen are higher. As can be seen from Figure 14b,c,e,f, there are a large number of dimples distributed on the tensile fractures of the alloy 2 and alloy 1 specimens, and there are no cleavage facets, which belong to the typical plastic fracture. The dimples on the tensile fractures of alloy 2 are deeper and more numerous, which indicates that the internal structure has been significantly refined.
LNG storage represents a significant application area for invar alloy, where the low-temperature working environment imposes stringent requirements on the ability of invar alloy to absorb impact energy and resist fracture. The addition of Cr-Mo-V-N to invar alloy can effectively refine its microstructure and improve its impact toughness. As can be seen from Figure 15, both the alloy 1 specimen and the alloy 2 specimen have dimples and tearing edges distributed on the impact fracture. Tearing edges are usually found around the dimples and are the edges that form during crack extension when material fractures under impact loading. In Figure 15d, the second-phase particles in the alloy 2 specimen can change the crack propagation pathway, dissipate more energy, and thus improve the impact toughness of the material. As can be seen from Figure 15a–d, there is an increase in the number of tearing edges on the impact fracture of the alloy 2 specimen, which is consistent with the results of impact toughness.
In Figure 16, the average hardness of the alloy 1 specimen is 150 HV. The average hardness of the alloy 2 specimen is about 34% higher than that of the alloy 1 specimen, reaching 201 HV. The hardness distribution within the deposition unit has a corresponding rule due to the influence of the thermal cycle during the additive manufacturing process. The fine grain zone at the bottom of the deposition unit has a higher level of hardness due to the higher density of grain boundaries and greater resistance to plastic deformation. The columnar crystal zone and the heat-affected zone are more affected by the cyclic heat input, so the hardness level is lower in these areas and lowest in the heat-affected zone. The addition of V, N in the alloy 2 specimen can promote the generation of the V (C, N) composite phase, which has a high precipitation temperature, can effectively refine the grain, and is conducive to improving the hardness of the material. In addition to being in the form of carbides, Mo and Cr can also be dissolved in the matrix to play the role of solution strengthening, which is also conducive to the improvement of material hardness.

4. Conclusions

In this work, an invar alloy wire modified by the Cr-Mo-V-N alloy was used as raw material, a high-strength invar alloy specimen was fabricated by wire arc additive manufacturing, and its microstructure and mechanical properties were characterized. The main conclusions are presented as follows:
(1)
In the WAAM-fabricated invar alloy, there are generally three regions in each deposition unit: the heat-affected zone at the top, the columnar grain region in the middle, and the fine-grain region at the bottom.
(2)
The precipitates in the WAAM-fabricated high-strength invar alloy specimen are composite phases consisting of VC, VN, Mo2C, Fe20Mo3C6, and Cr20Mo3C6 and are mainly distributed along grain boundaries and the cell wall of the cellular substructure. These precipitation phases can refine the grain and the cellular substructure within grains and can also effectively hinder the movement of dislocation, which contributes to the strength of the material.
(3)
The average tensile strength of the WAAM-fabricated high-strength invar alloy specimen is 793 MPa, an increase of about 99%, and the impact toughness at low temperature (−196 °C) is 111 J/cm2, an increase of about 23%. However, the thermal interaction of adjacent deposition units will cause the mechanical properties of the invar alloy specimen to exhibit anisotropy.

Author Contributions

C.C.: methodology, investigation, writing—original draft, formal analysis, writing—review and editing; C.Z. (Chenyu Zhao): methodology, investigation, formal analysis; Z.S.: methodology, investigation; J.H.: investigation, methodology; W.G.: investigation, methodology; H.X.: methodology; B.L.: methodology; C.Z. (Caidong Zhang): visualization; H.Z.: visualization. All authors have read and agreed to the published version of the manuscript.

Funding

This work was supported by the Natural Science Foundation of Hebei Province, China (E2022202199 and E2023202233), the High-level Talents Foundation of Hebei Province, China (B20231016), and the Central Guided Local Science and Technology Development Funding Program (236Z1023G and 22281007Z).

Institutional Review Board Statement

Not applicable.

Informed Consent Statement

Not applicable.

Data Availability Statement

Data are contained within the article.

Acknowledgments

The authors thank Hebei Iron and Steel Technology Research Institute (HBIS) for providing 4J36 welding wire (φ1.6 mm) and technical support.

Conflicts of Interest

The authors declare no conflicts of interest.

Abbreviations

The following abbreviations are used in this manuscript:
WAAMWire Arc Additive Manufacturing
GMAW Gas Metal Arc Welding
PAWPlasma Arc Welding

References

  1. Guillaume, C. Invar and its applications. Nature 1904, 71, 134–139. [Google Scholar] [CrossRef]
  2. Kim, B.; Lee, D. The design of an optical sensor arrangement for the detection of oil contamination in an adhesively bonded structure of a liquefied natural gas (LNG) ship. Meas. Sci. Technol. 2009, 20, 6. [Google Scholar] [CrossRef]
  3. Li, S.; Yue, X.; Li, Q.; Peng, H.; Dong, B.; Liu, T.; Yang, H.; Fan, J.; Shu, S.; Qiu, F.; et al. Development and applications of aluminum alloys for aerospace industry. J. Mater. Res. Technol. 2023, 27, 944–983. [Google Scholar] [CrossRef]
  4. Davis, R. The story of Invar [Basic Metrology]. IEEE Instru. Meas. Mag. 2017, 20, 27–29. [Google Scholar] [CrossRef]
  5. Barka, L.; Balat-Pichelin, M.; Sans, J.-L.; Bêche, E. Oxidation and emissivity of Invar 36 alloy in air plasma at high temperatures. J. Alloy Compd. 2019, 772, 1003–1006. [Google Scholar] [CrossRef]
  6. He, G.; Peng, X.; Zhou, H.; Huang, G.; Xie, Y.; He, Y.; Liu, H.; Huang, K. Superior Mechanical Properties of Invar36 Alloy Lattices Structures Manufactured by Laser Powder Bed Fusion. Materials 2023, 16, 4433. [Google Scholar] [CrossRef]
  7. Eissel, A.; Engelking, L.; Gustus, R.; Treutler, K.; Wesling, V.; Schroepfer, D.; Kannengiesser, T. Alloy modification for additive manufactured Ni alloy components—Part I: Effect on microstructure and hardness of Invar alloy. Weld. World. 2023, 67, 1049–1057. [Google Scholar] [CrossRef]
  8. Kim, S.H.; Choi, S.G.; Choi, W.K.; Yang, B.Y.; Lee, E.S. Pulse electrochemical machining on Invar alloy: Optical microscopic/SEM and non-contact 3D measurement study of surface analyses. Appl. Surf. Sci. 2014, 314, 822–831. [Google Scholar] [CrossRef]
  9. Kim, S.-H.; Choi, S.-G.; Choi, W.-K.; Lee, E.-S. Surface characteristics of Invar alloy according to micro-pulse electrochemical machining. Mater. Tehnol. 2017, 51, 745–749. [Google Scholar] [CrossRef]
  10. Liu, J.; Xu, M.; Zhang, R.; Zhang, X.; Xi, W. Progress of Porous/Lattice Structures Applied in Thermal Management Technology of Aerospace Applications. Aerospace 2022, 9, 827. [Google Scholar] [CrossRef]
  11. Gil Del Val, A.; Cearsolo, X.; Suarez, A.; Veiga, F.; Altuna, I.; Ortiz, M. Machinability characterization in end milling of Invar 36 fabricated by wire arc additive manufacturing. J. Mater. Res. Technol. 2023, 23, 300–315. [Google Scholar] [CrossRef]
  12. Kumar, N.; Bhavsar, H.; Mahesh, P.; Srivastava, A.K.; Bora, B.J.; Saxena, A.; Dixit, A.R. Wire Arc Additive Manufacturing—A revolutionary method in additive manufacturing. Mater. Chem. Phys. 2022, 285, 126144. [Google Scholar] [CrossRef]
  13. Zhao, Y.; Wu, A.P.; Ren, J.L.; Sato, Y.S.; Kokawa, H.; Miyake, M.; Yan, D.Y. Temperature and force response characteristics of friction stir welding on Invar 36 alloy. Sci. Technol. Weld. Joi. 2013, 18, 232–238. [Google Scholar] [CrossRef]
  14. Jiang, Z.; Chen, X.; Li, H.; Lei, Z.; Chen, Y.; Wu, S.; Wang, Y. Grain refinement and laser energy distribution during laser oscillating welding of Invar alloy. Mater. Des. 2020, 186, 108195. [Google Scholar] [CrossRef]
  15. Veiga, F.; Suarez, A.; Aldalur, E.; Artaza, T. Wire arc additive manufacturing of invar parts: Bead geometry and melt pool monitoring. Measurement 2022, 189, 110452. [Google Scholar] [CrossRef]
  16. Veiga, F.; Suárez, A.; Artaza, T.; Aldalur, E. Effect of the Heat Input on Wire-Arc Additive Manufacturing of Invar 36 Alloy: Microstructure and Mechanical Properties. Weld. World. 2022, 66, 1081–1091. [Google Scholar] [CrossRef]
  17. Sood, A.; Schimmel, J.; Ferreira, V.M.; Bosman, M.; Goulas, C.; Popovich, V.; Hermans, M.J. Directed energy deposition of Invar 36 alloy using cold wire pulsed gas tungsten arc welding: Effect of heat input on the microstructure and functional behaviour. J. Mater. Res. Technol. 2023, 25, 6183–6197. [Google Scholar] [CrossRef]
  18. Aldalur, E.; Suárez, A.; Veiga, F. Thermal expansion behaviour of Invar 36 alloy parts fabricated by wire-arc additive manufacturing. J. Mater. Res. Technol. 2022, 19, 3634–3645. [Google Scholar] [CrossRef]
  19. Jiao, G.; Fang, X.; Chen, X.; Xi, N.; Zhang, M.; Liu, Y.; Wu, H.; Huang, K. The origin of low thermal expansion coefficient and enhanced tensile properties of Invar alloy fabricated by directed energy deposition. J. Mater. Process. Technol. 2023, 317, 117994. [Google Scholar] [CrossRef]
  20. Chen, Y.; Xu, M.; Zhang, T.; Xie, J.; Wei, K.; Wang, S.; Yin, L.; He, P. Grain refinement and mechanical properties improvement of Inconel 625 alloy fabricated by ultrasonic-assisted wire and arc additive manufacturing. J. Alloy Compd. 2022, 910, 164957. [Google Scholar] [CrossRef]
  21. Sui, Q.; He, J.; Zhang, X.; Sun, Z.; Zhang, Y.; Wu, Y.; Zhu, Z.; Zhang, Q.; Peng, H. Strengthening of the Fe-Ni Invar Alloy Through Chromium. Materials 2019, 12, 1297. [Google Scholar] [CrossRef] [PubMed]
  22. Vinogradov, A.; Hashimoto, S.; Kopylov, V. Enhanced strength and fatigue life of ultra-fine grain Fe–36Ni Invar alloy. Mater. Sci. Eng. A 2003, 355, 277–285. [Google Scholar] [CrossRef]
  23. Dilip, J.; Ram, G.J.; Starr, T.L.; Stucker, B. Selective laser melting of HY100 steel: Process parameters, microstructure and mechanical properties. Addit. Manuf. 2017, 13, 49–60. [Google Scholar] [CrossRef]
  24. Huang, G.; He, G.; Liu, Y.; Huang, K. Anisotropy of microstructure, mechanical properties and thermal expansion in Invar 36 alloy fabricated via laser powder bed fusion. Addit. Manuf. 2024, 82, 104025. [Google Scholar] [CrossRef]
  25. Gardner, L.; Kyvelou, P.; Herbert, G.; Buchanan, C. Testing and initial verification of the world’s first metal 3D printed bridge. J. Constr. Steel Res. 2020, 172, 106233. [Google Scholar] [CrossRef]
  26. Fan, H.; Shi, G.; Peng, T.; Wang, Q.; Wang, L.; Wang, Q.; Zhang, F. N-induced microstructure refinement and toughness improvement in the coarse grain heat-affected zone of a low carbon Mo–V–Ti–B steel subjected to a high heat input welding thermal cycle. Mater. Sci. Eng. A 2021, 824, 141799. [Google Scholar] [CrossRef]
  27. Liu, K.; Chen, C.; He, J.; Liu, B.; Ma, B.; Xue, H.; Yang, B.; Wang, S.; Liu, H. Microstructure, corrosion behavior and rust resistance of Ti and Ce added invar alloys. Mater. Res. Express. 2021, 8, 096518. [Google Scholar] [CrossRef]
  28. Nakama, K.; Sugita, K.; Shirai, Y. Effect of MC Type Carbides on Age Hardness and Thermal Expansion of Fe–36 wt%Ni–0.2 wt%C Alloy. Metallogr. Microstruct. Anal. 2013, 2, 383–387. [Google Scholar] [CrossRef]
  29. Nakama, K.; Furuya, S.; Sugita, K.; Inoue, K.; Shirai, Y. Lattice Defects of Cold-drawn and Aged Fe-36wt%Ni Alloys and Effects of Additions of C and V on Hardness and Thermal Expansion. Tetsu-to-Hagane 2013, 99, 380–389. [Google Scholar] [CrossRef]
  30. Liu, H.; Sun, Z.; Wang, G.; Sun, X.; Li, J.; Xue, F.; Peng, H.; Zhang, Y. Effect of aging on microstructures and properties of Mo-alloyed Fe–36Ni invar alloy. Mater. Sci. Eng. A 2016, 654, 107–112. [Google Scholar] [CrossRef]
  31. Wang, Y.M.; Voisin, T.; McKeown, J.T.; Ye, J.; Calta, N.P.; Li, Z.; Zeng, Z.; Zhang, Y.; Chen, W.; Roehling, T.T.; et al. Additively manufactured hierarchical stainless steels with high strength and ductility. Nat. Mater. 2018, 17, 63–71. [Google Scholar] [CrossRef] [PubMed]
  32. Zhong, Y.; Liu, L.; Wikman, S.; Cui, D.; Shen, Z. Intragranular cellular segregation network structure strengthening 316L stainless steel prepared by selective laser melting. J. Nucl. Mater. 2016, 470, 170–178. [Google Scholar] [CrossRef]
  33. Fang, Q.; Zhao, L.; Liu, B.; Chen, C.; Peng, Y.; Tian, Z.; Yin, F. Microstructure and Mechanical Properties of 800-MPa-Class High-Strength Low-Alloy Steel Part Fabricated by Wire Arc Additive Manufacturing. J. Mater. Eng. Perform. 2022, 31, 7461–7471. [Google Scholar] [CrossRef]
Figure 1. Invar alloy solid core wire preparation process flowchart.
Applsci 15 03351 g001
Figure 2. Thermal expansion curves of alloy 1 and alloy 2.
Applsci 15 03351 g002
Figure 3. (a) WAAM system and macroscopic morphology of (b) alloy 1 specimen, (c) alloy 2 specimen.
Applsci 15 03351 g003
Figure 4. Microstructural characterization of the surfaces with different build orientations of WAAM-fabricated invar alloy.
Applsci 15 03351 g004
Figure 5. Sampling position (a) of impact and tensile specimens, size of tensile specimen (b), and impact specimen (c).
Applsci 15 03351 g005
Figure 6. Deposition unit and its microstructure. (a) Macro-morphology of deposition units. (b) Schematic of the deposition unit enclosed by the fusion line. (c) Schematic of the deposition unit. (df) Microstructure within deposition unit.
Applsci 15 03351 g006
Figure 7. Microscopic morphology of adjacent areas of deposition units: (a) X–Y section; (b) X–Z section.
Applsci 15 03351 g007
Figure 8. Microstructure of grains and cellular substructures in X–Y plane: (a,c) alloy 1 specimen; (b,d) alloy 2 specimen.
Applsci 15 03351 g008
Figure 9. The EBSD image quality mapping (a,d), inverse pole figures (b,e), as well as the grain boundary misorientation distributions (c,f) of the WAAM-fabricated invar alloy specimen: (ac) alloy 1 specimen, (df) alloy 2 specimen.
Applsci 15 03351 g009
Figure 10. (a) Precipitated phases distributed at grain boundary. (b) Precipitated phases distributed inside the grain. (cf) Morphology and elemental composition of the precipitated phase.
Applsci 15 03351 g010
Figure 11. Elemental distribution analysis of precipitated phases inside the grains of alloy 2 specimen. (af) Distribution of elements at the cellular substructure. (gl) Elemental distribution of precipitated phases at cellular substructure.
Applsci 15 03351 g011
Figure 12. Precipitation and transformation of the second phase, as calculated by FactSage.
Applsci 15 03351 g012
Figure 13. Tensile and impact property of alloy 1 specimen (a,c) and alloy 2 specimen (b,d).
Applsci 15 03351 g013
Figure 14. Tensile curve of (a) alloy 1 specimen, (d) alloy 2 specimen, and fracture morphology of (b,c) alloy 1 specimen, (e,f) alloy 2 specimen.
Applsci 15 03351 g014
Figure 15. Morphology of impact fracture: (a,b) alloy 1 specimen, (c,d) alloy 2 specimen, and (eg) element composition of inclusions in the dimple of alloy 2 specimen.
Applsci 15 03351 g015
Figure 16. Microhardness of alloy 1 specimen and alloy 2 specimen. (a) Distribution of microhardness test points. (b,c) The hardness values at different locations in alloy 1 specimen and alloy 2 specimen.
Applsci 15 03351 g016
Table 1. Composition of invar alloy wire (wt.%).
ElementsCNiVMoCrMnNFe
Alloy 10.0636.06///0.023/Bal.
Alloy 20.1536.51.01.50.80.0130.012Bal.
Table 2. Elemental composition of precipitated phases in grains.
ElementsCNVMoCrFeNi
Weight%9.8214.1956.758.892.275.112.97
Atomic%26.9231.5833.252.621.312.741.58
Error%13.6513.5511.2915.3737.6426.9558.97
Table 3. Elemental composition of precipitated phases at grain boundaries.
ElementsCNMoVCrFeNi
Weight%7.853.961.083.280.8953.3929.55
Atomic%26.2611.360.452.590.6938.4220.23
Error%15.0721.6344.1013.2836.993.044.97
Disclaimer/Publisher’s Note: The statements, opinions and data contained in all publications are solely those of the individual author(s) and contributor(s) and not of MDPI and/or the editor(s). MDPI and/or the editor(s) disclaim responsibility for any injury to people or property resulting from any ideas, methods, instructions or products referred to in the content.

