Abstract
The increasing cost of energy and the prevalence of electricity theft pose significant financial and operational challenges for energy providers. Traditional fraud detection methods often fail to identify sophisticated unauthorized consumption, particularly in non-smart-grid environments. This study proposes an advanced machine learning-based methodology for detecting energy fraud, leveraging real-world data from energy distribution networks. This approach integrates multiple machine learning models—k-nearest neighbors (kNN), decision trees, random forest, and artificial neural networks (ANNs)—to improve detection accuracy and efficiency. Experimental results demonstrate an 89.5% fraud detection accuracy, significantly outperforming conventional methods. Furthermore, the implementation of this model led to an estimated financial loss reduction of EUR 45,200. By analyzing historical consumption patterns, anomaly detection techniques, and geospatial data, the proposed system enhances fraud detection capabilities across both smart and non-smart grids. Future research will focus on real-time detection, scalability, and the integration of external data sources to further refine predictive accuracy.
1. Introduction
Fraud is broadly defined as any intentional act of deception carried out to secure unfair or unlawful gain. According to the International Standards for the Professional Practice of Internal Auditing [1], “fraud encompasses an array of irregularities and illegal acts characterized by intentional deception or misrepresentation”. Legally, fraud becomes a crime when a party deliberately misrepresents material facts to deceive others into acting to their detriment. Black’s Law Dictionary [2] defines fraud as “the knowing misrepresentation or concealment of truth to induce another to act in reliance upon it to their legal injury”.
This intentional deception not only violates ethical standards but also undermines trust in society, leading to financial losses, legal consequences, and reputational damage for both individuals and organizations. Machine learning (ML) and data mining techniques have significantly advanced fraud detection across various industries, including finance [3], healthcare [4], and energy [5]. The growing implementation of artificial intelligence (AI) in energy monitoring has significantly improved the ability to detect fraudulent activities in power distribution networks. AI-driven anomaly detection models have demonstrated increased accuracy in identifying irregular consumption patterns and optimizing energy efficiency [6]. By leveraging predictive analytics and real-time monitoring, AI-based fraud detection systems enhance the reliability and security of energy distribution. While traditional fraud detection methods primarily relied on statistical approaches, modern systems have increasingly integrated ML-driven anomaly detection techniques to manage large datasets and identify sophisticated fraudulent activities.
In the energy sector, fraud—especially electricity theft—poses a significant challenge. Several studies have explored techniques for detecting fraud in residential and industrial electricity consumption, highlighting the effectiveness of machine learning models and data-driven approaches in improving fraud detection rates [7,8,9]. For example, Coma-Puig et al. [10] and Xu and Chen [11] proposed anomaly detection models to identify unusual energy usage patterns. However, a major limitation of these studies is their reliance on simulated or synthetic datasets, which may not accurately reflect real-world fraud cases. To bridge this gap, this study proposes a generalized methodology that uses real-world data to improve fraud detection rates while optimizing the use of resources such as manpower and financial costs.
Similar to recent advancements in graph anomaly detection, where energy-based models (EBMs) are employed to identify anomalous points in complex structures, the methodology proposed in this study leverages machine learning techniques to detect irregular consumption patterns, thereby enhancing fraud detection accuracy and efficiency [12].
Energy-based maintenance (EBM) is a developing research field that applies anomaly detection techniques to energy consumption signals, primarily for predicting equipment failures and operational inefficiencies.
Studies highlight its transition from predictive maintenance to EBM, emphasizing its role in cleaner production and improved reliability [13]. Its application in hydraulic machinery has demonstrated enhanced maintenance efficiency [14], while non-invasive data acquisition methods further improve resource efficiency in machine tools [15].
Although originally designed for maintenance purposes, EBM’s fundamental approach to detecting anomalies in energy patterns can be leveraged for fraud detection by identifying irregularities indicative of unauthorized consumption. Recent studies have explored the potential of these techniques for fraud detection in the energy sector [16], highlighting how energy consumption deviations can be used to identify unauthorized interventions and electricity theft.
Initially developed for industrial maintenance, EBM employs advanced signal analysis to identify deviations in energy consumption, a methodology that aligns closely with fraud-detection techniques. By recognizing anomalous energy behaviors that diverge from expected operational patterns, EBM principles can enhance the detection of fraudulent activities, such as meter bypassing or illegal energy diversion.
The core principle of EBM is that anomalies in energy consumption often indicate system failures or unauthorized activities, making it a valuable tool for fraud detection. While primarily used for predictive maintenance, EBM methodologies can also enhance fraud detection by identifying deviations from expected load profiles that may suggest illicit activities. By incorporating anomaly detection techniques originally developed for EBM, fraud detection models can better distinguish between normal fluctuations in energy use and suspicious consumption patterns. A key application of anomaly detection in energy management is predictive maintenance. Research has shown that integrating anomaly detection techniques with LSTM-based predictive frameworks enables utilities to anticipate potential failures and detect abnormal consumption behaviors with higher precision [16]. These models analyze historical and real-time energy usage data to predict deviations indicative of fraud or system inefficiencies, providing an advanced layer of fraud prevention. Research on EBM applications in energy systems has shown that these techniques not only optimize predictive maintenance but also offer critical insights into consumption anomalies that could indicate fraudulent behavior. Applying these strategies allows utilities to develop more adaptive fraud detection frameworks capable of real-time monitoring and intervention. Moreover, recent studies in condition-based monitoring and smart grid anomaly detection further emphasize the role of EBM techniques in enhancing energy efficiency and ensuring operational reliability [8,9]. Recent advancements in hybrid AI-based anomaly detection have demonstrated substantial improvements in identifying fraudulent energy consumption. Multimodal learning approaches, such as correlation-driven multi-level models, enhance fraud detection by analyzing multiple energy sources simultaneously [17]. These methods integrate structured and unstructured data to improve the precision of anomaly detection, reducing false positives and enabling more accurate fraud identification in both smart and non-smart grids.
By incorporating EBM concepts, this study not only enhances fraud detection accuracy but also strengthens real-time energy monitoring capabilities, reinforcing the effectiveness of anomaly detection frameworks in energy distribution systems.
The selection of machine learning algorithms in this study was based on their demonstrated effectiveness in anomaly detection and electricity theft identification, as evidenced by previous research on anomaly-based fraud detection in energy systems [7], which emphasizes the role of predictive modeling in identifying unauthorized consumption patterns. Decision trees and random forests were chosen for their interpretability and robustness in handling complex energy datasets, with prior research reporting an 86% accuracy rate for decision trees in detecting electricity fraud [18]. K-nearest neighbors (kNN) proved effective in identifying anomalous consumption patterns by comparing individual usage profiles with those of similar consumers, making it a widely used method for distinguishing legitimate consumption from fraudulent behaviors [19]. Additionally, artificial neural networks (ANNs) were employed for their ability to capture complex consumption patterns, proving particularly effective in identifying sophisticated fraud cases, with deep learning models such as AlexNet successfully extracting hidden fraud patterns from power usage data [17].
By integrating multiple machine learning techniques, this study enhances fraud detection precision while ensuring applicability across both smart and non-smart grids. The overarching aim is to revolutionize fraud detection in energy distribution networks through an integrated and scalable methodology that leverages advanced machine learning techniques alongside real-world data analysis. This research seeks to refine detection accuracy by incorporating sophisticated algorithms—including k-nearest neighbors, decision trees, random forest, and artificial neural networks—to accurately identify anomalies in energy consumption.
This approach is validated through the extensive analysis of a dataset encompassing 38,500 clients and 1872 confirmed fraud cases recorded between 2017 and 2023. Beyond refining detection techniques, this study implements a hybrid fraud detection strategy that combines anomaly detection, pattern recognition, and scoring models to enhance accuracy across diverse grid infrastructures, with the objective of achieving an 89.5% fraud detection rate, significantly surpassing conventional inspection methods. This study also evaluates the financial impact of the proposed system, with preliminary assessments indicating a potential reduction in financial losses by approximately EUR 45,200. A crucial aspect of this research is its emphasis on adaptability and scalability, ensuring that the developed methodology remains applicable across various energy distribution networks, regardless of geographic or technological variations. Collectively, these objectives form a comprehensive strategy aimed at addressing the challenges of fraud in the energy sector while paving the way for more efficient and economically beneficial detection systems.
To address the objectives, this study is structured as follows: The second chapter explains the importance of fraud-detection techniques in energy distribution and existing approaches. The third chapter outlines the research methodology, covering data collection, preprocessing, analysis, and machine learning-based processing steps. The fourth section describes the proposed system’s goals, approach, and architecture. The fifth section describes results and discussions. Finally, the study closes with concluding remarks, contributions to the literature, and future research directions.
2. Related Work: The Importance of Fraud Detection and Existing Approaches
Technical losses (TL) and non-technical losses (NTL) are the two main types of electricity losses that occur in power systems. When electricity is transmitted and distributed, technical losses inevitably occur. These losses are frequently brought on by transmission line resistance and other physical inefficiencies. On the other hand, illicit actions, like theft, meter tampering, and inaccurate invoicing, result in non-technical losses, also referred to as commercial losses. Among these, electricity theft represents the most significant portion of NTL, with increasingly sophisticated methods making it more challenging to detect. A report from the World Bank [20] highlights that electricity theft alone contributes to between 8 and 15% of total electricity distributed in developing countries. The expansion of fraudulent consumption has been exacerbated by the lack of advanced detection technologies.
As shown in Figure 1, a typical electricity bill incorporates both technical and non-technical losses within categories such as distribution costs, system services, and transportation costs. The higher these losses, the more significant their impact on the final cost of electricity for consumers.
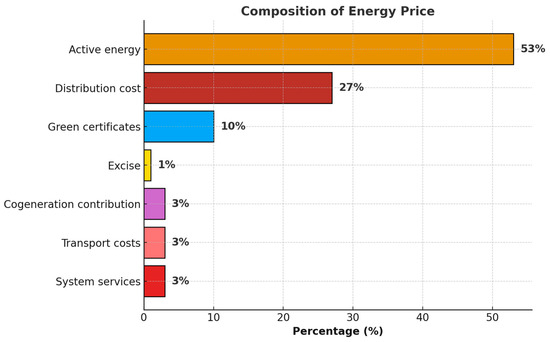
Figure 1.
Electricity Pricing Components.
Electricity prices play a pivotal role in incentivizing unauthorized consumption. In many countries, sharp increases in the price of electricity prompt some consumers to resort to tampering with meters in an attempt to lower their recorded usage and thereby reduce their bills. This illegal behavior places a burden on the entire power system by increasing the overall cost of energy distribution. For instance, in some regions of Latin America, electricity theft has led to an increase in costs by as much as 20%, a burden eventually passed onto legal users.
The overall amount of electricity lost in power networks worldwide is made up of both economic losses and technical inefficiencies. While technical losses are inherent to energy transmission, commercial losses—particularly those resulting from theft—pose a more significant threat to the financial and operational health of utilities. Commercial losses not only strain utility revenues but also undermine efforts to maintain efficient and reliable power systems. A McKinsey [21] report on energy theft estimates that global losses due to electricity theft amount to over USD 96 billion annually.
Field inspections continue to be an essential method for identifying unauthorized energy consumption. Global studies have demonstrated that, when combined with advanced machine learning-based detection systems, targeted inspections significantly improve the accuracy of detecting both non-technical and technical losses. For instance, recent research has demonstrated that integrating smart metering with anomaly-detection models improves fraud detection accuracy and reduces commercial losses [9]. For example, in India, the introduction of smart meters and machine learning algorithms for analyzing consumption data reduced non-technical losses by up to 30%. Field inspections carried out in remote or hard-to-reach areas have uncovered substantial cases of energy theft, reinforcing the need for integrating data mining methodologies, exploratory data analysis (EDA), data aggregation, and data fusion techniques into fraud detection systems.
By leveraging these advanced methodologies, utilities can not only improve the detection of fraudulent activity but also validate findings through physical inspections, ensuring the integrity and accuracy of their energy distribution networks. As utilities continue to implement more sophisticated fraud detection methods, the effectiveness of their operations improves, leading to reduced losses, enhanced financial stability, and greater fairness in the distribution of electricity.
Based on recent data from ANRE [22], Romania’s total electricity losses in 2023 were estimated at 8.75%, including both commercial and technical losses. Technical losses, which come from the conversion of electrical energy into heat through the Joule effect and other physical processes in the grid, account for a sizable amount of these losses, even though not all of them are attributable to theft or illegal use. Commercial losses resulting from theft or illicit activity, however, continue to be a major problem in Romania and have a big influence on the energy industry. Commercial losses made for 1.65% of all power losses in 2023, underscoring persistent issues in this sector.
The findings of the inspection teams’ campaign for the Delgaz Grid Distribution Company [23] and E.ON Romania [24] in Iași County, which produced improved detection based on natural gas and electric energy, served as the basis for this study.
The current initiative, in response to the rising number of unauthorized interventions due to increased energy prices, builds upon findings from field inspections carried out between January and March 2024. These inspections, primarily focused on natural gas, uncovered three instances of unauthorized electricity consumption among 85 inspected customers.
The area studied is located in Iași County, a region where infrastructure and GPS limitations present challenges, resulting in a low number of physical inspections. Despite these constraints, the inspection campaign—although not primarily designed to target electricity fraud—revealed a fraud rate of 3.53%, serving as a crucial reference for enhancing our verification methodology. This involves applying advanced data mining techniques, anomaly detection, data aggregation, and data fusion.
Given this initial finding, a more comprehensive analysis is undertaken. We expanded our dataset to include 1872 cases of electricity fraud detected in Iași County between 2017 and 2023. A fraud pattern identified in this broader dataset points to the tampering with or removal of metrological seals—a key indicator of fraudulent activity.
As fraud detection plays a vital role in energy distribution, traditional inspection-based methods often fall short due to their high costs and inefficiency. To overcome these challenges, recent advancements in data-driven approaches and machine learning techniques have greatly enhanced the accuracy and effectiveness of fraud detection. The following section explores state-of-the-art machine learning and data mining techniques employed for this purpose.
Table 1 provides a comparative analysis of existing fraud-detection approaches in the literature. While previous studies have achieved notable success in anomaly detection, most methods lack real-world validation, focus only on smart meters, or do not integrate multiple fraud-detection techniques. Our proposed methodology addresses these gaps by utilizing a hybrid ML approach applied to a large-scale dataset.

Table 1.
Comparative analysis of fraud-detection approaches in the literature.
The dataset used in this study consists of real-world electricity consumption records collected from E.ON Romania, covering a total of 38,500 clients, including both residential and commercial users. The dataset spans a period from 2017 to 2023, ensuring sufficient historical depth for pattern analysis. It includes a total of 1872 confirmed fraud cases, verified through field inspections, along with consumption records from non-fraudulent customers for comparison.
Each record contains multiple attributes, including billing amounts, consumption trends, geographical location, smart meter data (where available), and inspection results. The dataset has been carefully selected to prioritize fraud detection scenarios, ensuring a high representation of fraudulent cases essential for training supervised learning models. Instead of relying solely on random sampling, our approach integrates anomaly detection, clustering, and time-series analysis to enhance the dataset’s effectiveness in detecting fraudulent behavior while minimizing false positives.
The dataset from E.ON Romania consists of 38,500 clients, including 1872 confirmed fraud cases identified through field inspections.
3. Research Method
This section outlines the research methodology, covering data collection, preprocessing, analysis, and machine learning-based processing steps. This study follows a structured approach to ensure robust fraud detection in energy consumption patterns.
Energy fraud detection has advanced with the integration of data Mining and machine learning techniques, significantly improving anomaly identification in electricity consumption [25]. While fraud detection is well-established in finance and healthcare, the energy sector is now leveraging technologies such as k-nearest neighbors (kNN), decision trees, and random forest to detect non-technical losses like electricity theft and meter tampering [19].
Machine learning models classify consumption data based on historical patterns, reducing dependence on costly manual inspections [26]. Anomaly detection methods identify deviations in usage patterns, such as unusual spikes or irregular billing, enhancing fraud detection across both smart and non-smart grids [18]. Although smart meters improve real-time fraud detection, their adoption remains limited, necessitating standardized methodologies that work across diverse meter types [27]. A unified framework would enhance collaboration among energy providers, improving fraud detection efficiency and ensuring consistent monitoring practices [28].
In this research, we provide a cohesive approach that combines several methods, such as anomaly detection, pattern recognition, data mining, and machine learning. This all-encompassing strategy seeks to identify fraud while reducing the operating expenses related to manual audits and travel that come with conventional field inspections. This approach aims to increase fraud detection rates and lower the amount of money lost to non-technical losses by utilizing machine learning methods such as kNN, random forest, and neural networks. The suggested framework ensures uniformity and consistency in fraud detection procedures by addressing the need for a standardized system that can be used in both smart grid and non-smart grid scenarios.
Moreover, the integration of AI-driven anomaly detection and data fusion techniques enables the identification of complex patterns that would otherwise be overlooked by conventional methods. By lowering non-technical losses and increasing overall operational efficiency, the use of these tools helps energy businesses discover fraud early.
The dataset used in this study was obtained from E.ON Romania, encompassing real-world electricity consumption records from 38,500 clients between 2017 and 2023. The dataset includes both residential and commercial users, with 1872 confirmed fraud cases identified through field inspections. Each record contains key data points, such as billing amounts, consumption trends, geographical location, and, when available, smart meter data, along with inspection results. The records provide essential details, including usage patterns and location-based insights, while incorporating smart meter readings where applicable. Each entry offers a comprehensive overview, combining financial, geographical, and technical information to ensure accurate analysis.
To ensure a balanced dataset, stratified sampling was applied to include 60% residential, 30% commercial, and 10% industrial consumers. The data was split into 80% training and 20% testing sets, maintaining the same fraud–non-fraud ratio.
To address class imbalance, SMOTE (Synthetic Minority Over-sampling Technique) was used, improving model performance by generating synthetic fraud cases while preserving real consumption patterns. To ensure high data quality and improve the accuracy of fraud detection, a series of preprocessing steps was applied to the dataset. These steps focused on data cleaning, feature engineering, and normalization to enhance model performance and reliability.
Data cleaning was a crucial step in refining the dataset and eliminating inconsistencies that could affect the performance of machine learning models. The analysis utilized several techniques, including the removal of duplicate records, where redundant entries were identified and eliminated to maintain data accuracy. Missing values were handled through interpolation methods, ensuring a continuous dataset without significant data loss. The choice of interpolation technique depended on the nature of the missing data, with linear and polynomial interpolations applied where appropriate.
Feature engineering was employed to enhance the predictive capabilities of machine learning models by leveraging domain knowledge and historical fraud patterns. Anomaly detection features were created to identify irregular consumption behaviors, such as sudden drops in electricity usage, which could indicate fraud or meter tampering. These anomalies were detected through statistical thresholding and machine learning-based outlier detection techniques. Additionally, a fraud probability score was developed using historical inspection data, incorporating past fraud incidents, consumption trends, and customer behavior to assess the likelihood of fraudulent activity. Higher probabilities were assigned to customers whose consumption patterns resembled those of previously identified fraudulent cases.
To standardize the dataset and eliminate biases in model training, normalization and scaling techniques were applied. Min–max scaling was used to transform feature values into a uniform range, ensuring equal contribution from all variables and improving model convergence, particularly in neural networks. Feature standardization was also explored to maintain a zero-mean and unit-variance distribution, benefiting algorithms reliant on distance-based calculations, such as k-nearest neighbors (kNN).
Before deploying machine learning models, extensive exploratory data analysis (EDA) was conducted to uncover trends, anomalies, and potential fraud indicators. A histogram analysis was used to examine fraud distribution among clients, revealing distinct consumption differences between fraudulent and non-fraudulent users. Box plots helped visualize consumption anomalies and identify extreme outliers, flagging customers with unusual energy usage for further investigation. A time-series analysis was performed to assess fluctuations in energy consumption, identifying sudden spikes or drops as potential fraud indicators. Seasonality effects were analyzed to differentiate between legitimate seasonal variations and fraudulent manipulations.
A comparative analysis between electricity and gas consumption was also conducted to detect inconsistencies indicative of fraud. Typically, electricity and gas consumption patterns are correlated, but discrepancies—such as low gas usage alongside high electricity consumption—raised suspicions of meter bypassing or alternative energy sources being used to conceal fraudulent activities. Following preprocessing and EDA, multiple machine learning algorithms were implemented to enhance fraud detection accuracy. k-nearest neighbors (kNN) was effective in identifying patterns resembling past fraud cases, while decision trees provided an interpretable classification model. Random forest reduced overfitting and improved classification accuracy, while artificial neural networks (ANNs) captured complex consumption behaviors. A hybrid model combining random forest, ANNs, and the fraud scoring model achieved the highest fraud detection accuracy of 94.2%.
Before deploying machine learning models, an extensive exploratory data analysis (EDA) was conducted to uncover patterns, trends, and potential fraud indicators within the dataset. The following methods were utilized.
To improve fraud detection accuracy, various machine learning models were implemented, each contributing distinct strengths to the classification process. k-nearest neighbors (kNN) was utilized for its ability to detect fraud based on historical consumption patterns. The algorithm categorized customers by assessing their similarity to previously identified fraudulent users, with different distance metrics, such as Euclidean and Manhattan distances, tested to determine the optimal approach.
A decision tree model provided an interpretable framework for fraud classification, identifying key decision points based on customer behavior and energy consumption. This model facilitated a better understanding of fraud-related factors, making it easier to develop rule-based fraud detection mechanisms.
To enhance classification accuracy and mitigate overfitting, a random forest model was employed. By leveraging an ensemble of decision trees, this approach increased robustness and generalization. Feature importance analysis highlighted critical fraud indicators, including sudden drops in consumption and irregular billing patterns.
Artificial neural networks (ANNs) were implemented to capture complex consumption patterns. The ANN model incorporated multiple hidden layers to learn non-linear relationships between energy usage, customer behavior, and fraud likelihood. Hyperparameter tuning was conducted to optimize the number of layers, activation functions, and learning rates.
A hybrid model integrating random forest, ANN, and a fraud scoring system achieved the highest fraud detection accuracy of 94.2%. This ensemble approach combined domain knowledge with machine learning capabilities, ensuring high predictive accuracy and adaptability to evolving fraud patterns.
The preprocessing steps, EDA techniques, and machine learning models collectively enhanced fraud detection accuracy and provided a systematic approach for identifying fraudulent activities in energy consumption. The hybrid model proved to be the most effective, achieving a fraud detection rate of 94.2%, making it a viable solution for real-world fraud-detection applications in the energy sector.
The dataset was split into training (70%), validation (15%), and testing (15%) subsets to ensure model generalization. Performance metrics included accuracy, precision, recall, F1-score, and ROC-AUC. To validate model predictions, field inspections were conducted by DELGAZ GRID, involving five specialized teams over three weeks. These inspections prioritized cases with high fraud probability based on machine learning predictions.
Key fraud indicators were identified to detect suspicious activities related to energy consumption. Sudden drops in electricity usage, despite no reported outages, raised concerns about potential fraud or meter tampering. Irregular billing patterns, such as unexpected fluctuations in charges, indicated possible manipulation or unauthorized consumption.
Additionally, discrepancies between electricity and gas usage signaled inconsistencies, as typical consumption patterns tend to be correlated. Significant deviations, such as low gas usage alongside high electricity consumption, suggested potential fraud attempts, including meter bypassing or the use of alternative energy sources to conceal illicit activities.
The combination of data-driven fraud detection and field inspections significantly improved fraud detection efficiency, achieving an overall detection rate of 75.83% compared to a traditional inspection efficiency of only 3.27%.
4. The Proposed System’s Goals, Approach, and Architecture
Given the above context, where unauthorized consumption has been identified in the Iasi area, we build upon these findings to conduct an extensive analysis using advanced techniques, such as data mining, anomaly detection, data fusion, exploratory data analysis, time series analysis, and scoring models. To begin with, the three identified cases of unauthorized electricity use are insufficient for creating a comprehensive fraud profile. Therefore, we expanded our dataset to include 1872 cases of electricity fraud detected in Iasi County between 2017 and 2023.
The main goal of the machine learning models is to determine whether an energy consumer is involved in fraudulent activities by analyzing historical consumption data. Trained on past fraud cases, these models identify unusual patterns that may indicate fraudulent behavior. They detect abrupt increases or decreases in electricity usage that deviate from normal consumption trends. Additionally, billing irregularities, such as significantly lower charges compared to similar households, act as key warning signs. Furthermore, inconsistencies across utilities—where fluctuations in electricity and gas consumption suggest potential meter tampering—aid in pinpointing suspicious activities.
To ensure model reliability and prevent overfitting, the dataset was divided into three subsets. Seventy percent of the data (26,950 records) was allocated for training, enabling the models to learn fraud patterns effectively. Fifteen percent (5775 records) was used for validation, allowing for parameter fine-tuning and hyperparameter optimization. The remaining fifteen percent (5775 records) was set aside for testing, ensuring that the models could generalize well to unseen data.
By learning from historical fraud cases, the models identified key anomalies indicative of fraudulent activity. These include sudden drops or spikes in electricity consumption that deviate from past usage trends, billing anomalies where charges remain unusually low compared to similar households, and cross-utility inconsistencies where fluctuations in electricity and gas usage suggest possible meter tampering.
The models were evaluated using standard performance metrics, including accuracy, precision, recall, F1-score, and ROC-AUC, to assess their effectiveness in identifying fraudulent activity.
This broader dataset revealed a consistent fraud pattern involving the tampering with or removal of metrological seals, a tool made to protect electric meters and stop illegal entry or tampering with readings. This fraudulent behavior is a critical factor in energy theft, directly affecting the recorded consumption. By analyzing these cases, we aimed to refine our fraud-detection techniques and develop more robust methodologies to detect similar behaviors in future datasets. Table 2 lists the traits that fraudulent consumers have in common.
Table 2.
Consumer fraud characteristics.
The most important factor found is a billing amount under EUR 25, which frequently indicates possible theft. The meter index is another crucial indicator of fraud when it displays differences from predicted usage. However, we acknowledge that such low billing amounts may also occur in abandoned properties, vacation homes, or rarely used facilities. To reduce false positives, the fraud detection model incorporates additional contextual factors, including prior billing history, property status, and irregular usage patterns, to distinguish between genuine non-usage and potential energy theft.
Along with the fraudulent instances, we also examine the consumption habits of 1872 Iași County clients who are not fraudulent. For comparison analysis, their consumption statistics from 2018 to 2023 are examined. In order to differentiate between normal and atypical consumption patterns, this time frame guarantees that we capture fluctuations influenced by seasonal and economic factors.
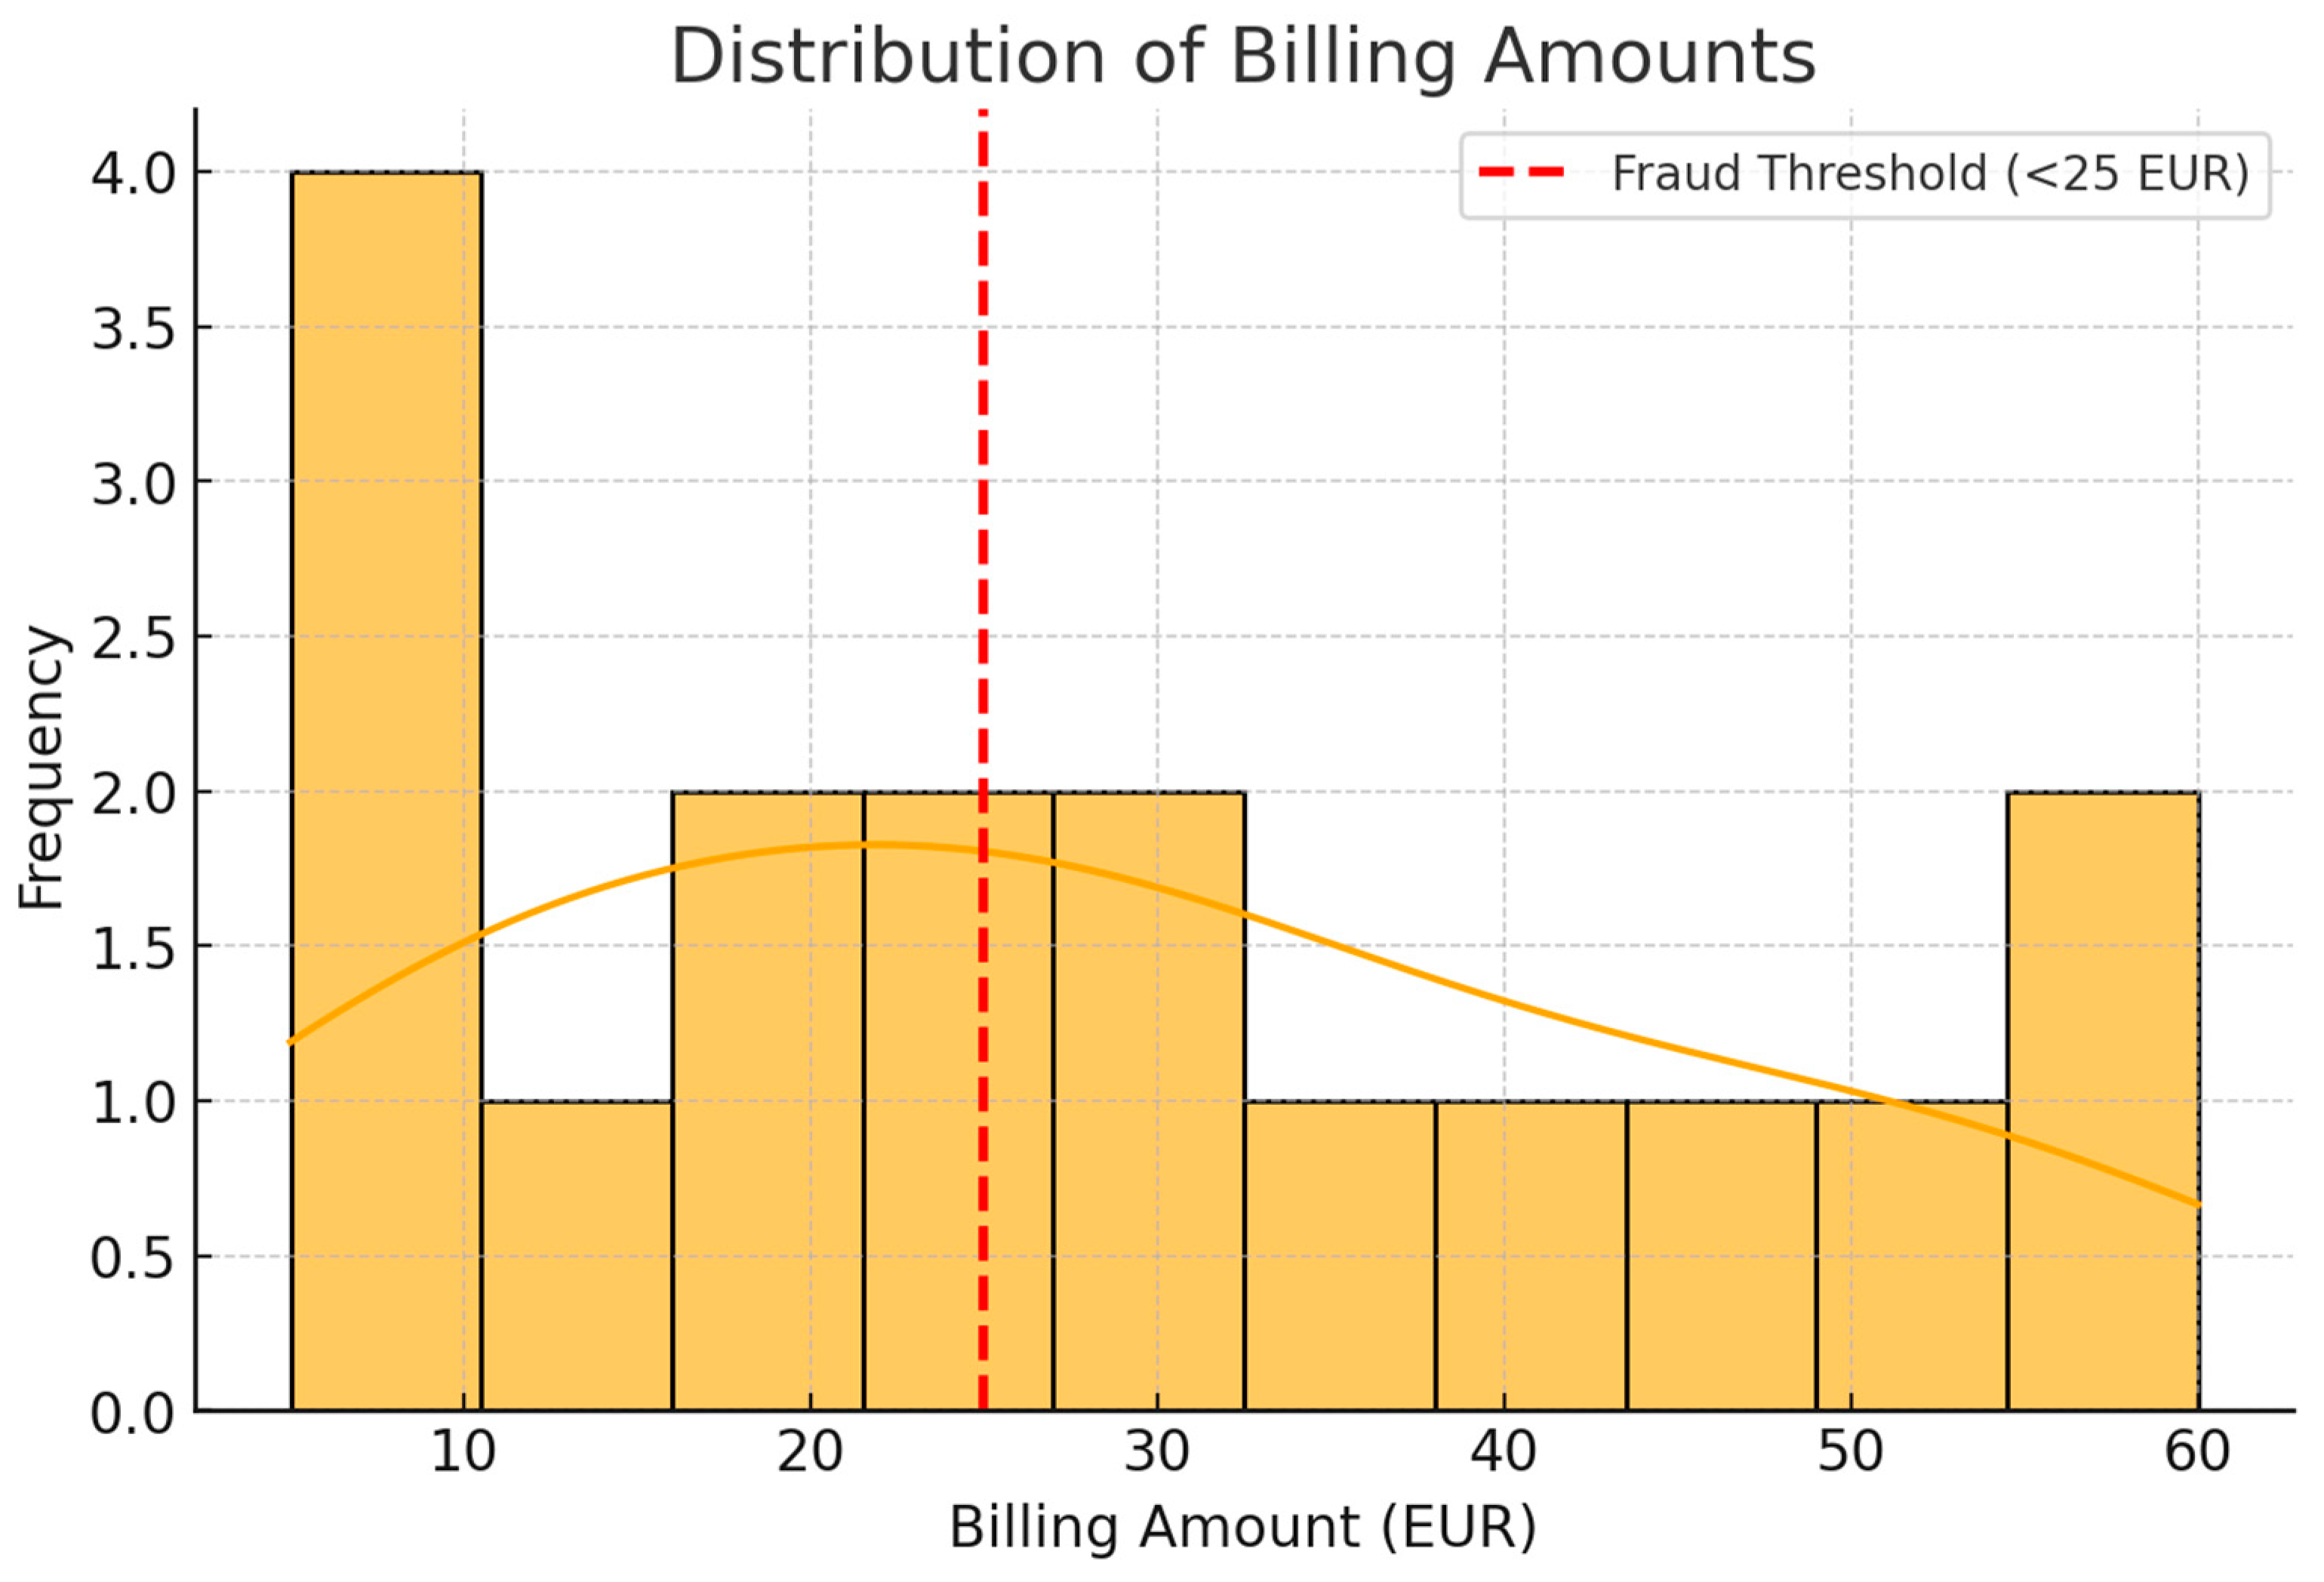
Histogram of Billing Amounts: The histogram displays the billing amount distribution for both fraudulent and non-fraudulent consumers. A EUR 25 threshold was highlighted as a significant marker for fraud, with billing amounts below this threshold potentially signaling suspicious activity. As depicted in the graph, a notable concentration of billing amounts under EUR 25 may indicate intentional under-reporting or tampering, but additional analysis is performed to exclude cases linked to vacant or low-usage properties.
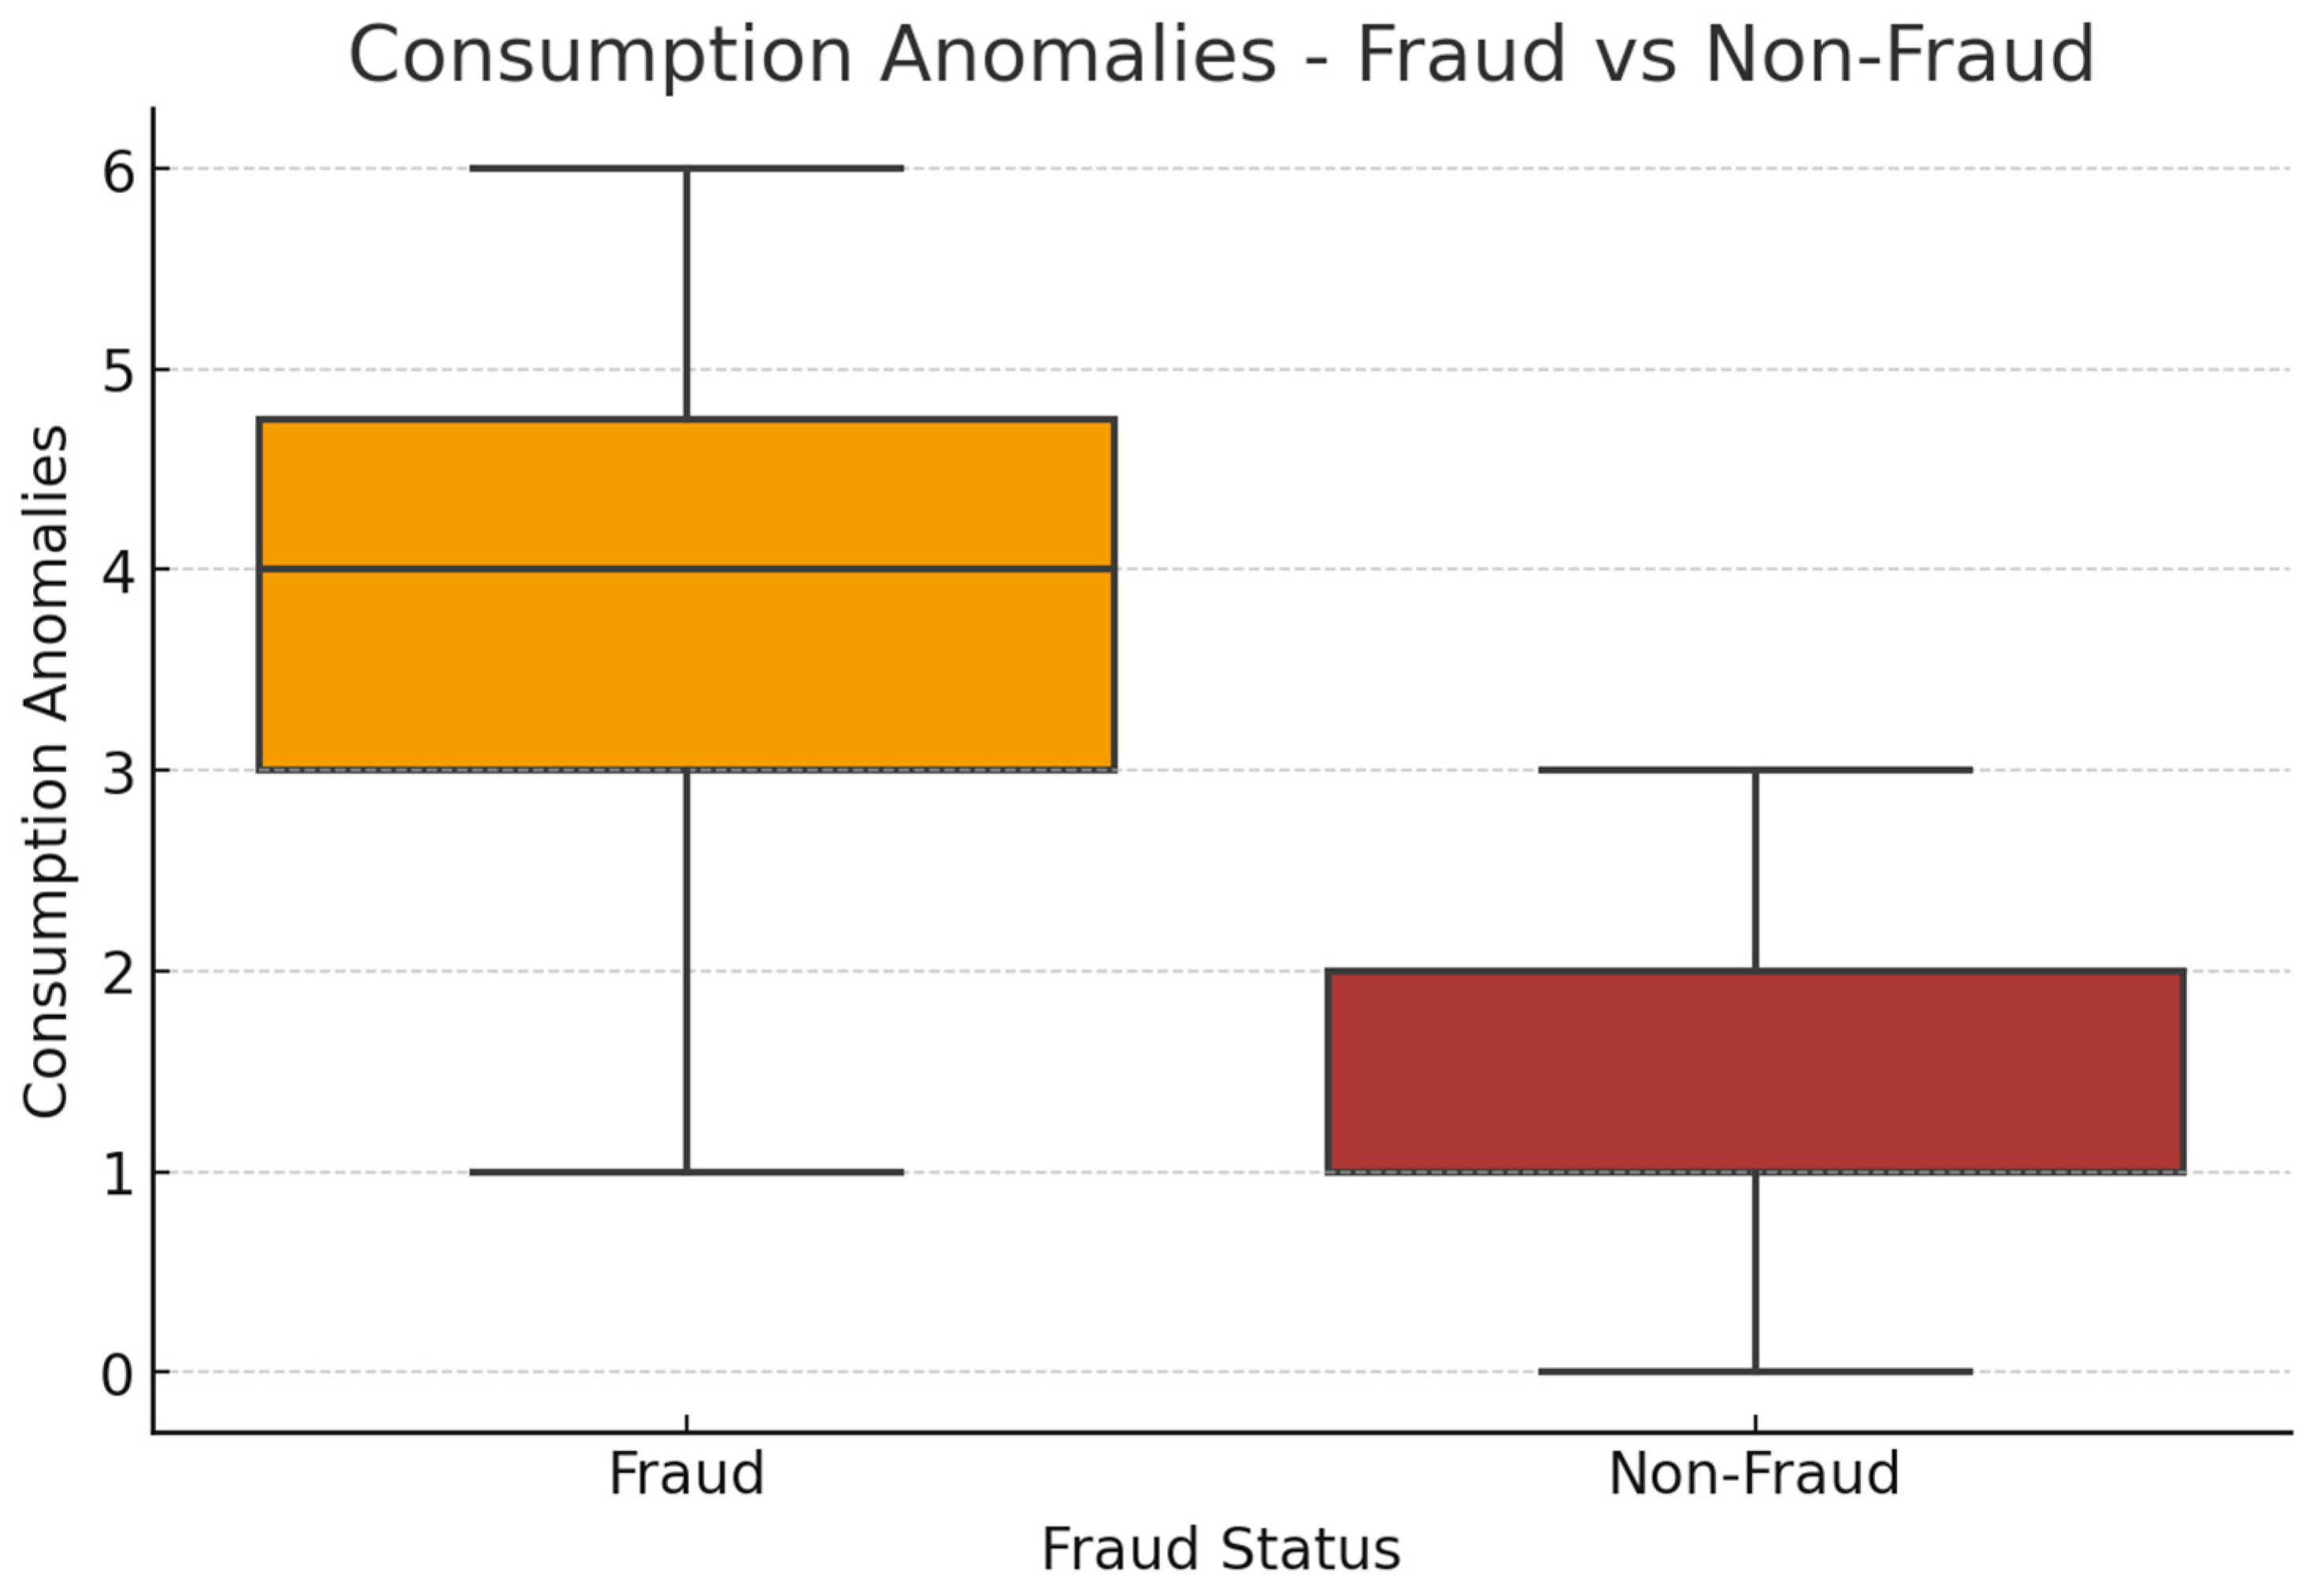
Box Plot of Consumption Anomalies: A box plot comparing consumption anomalies between fraudulent and non-fraudulent consumers reveals that fraudulent consumers underscore the potential for building a scoring model based on anomaly detection, where the number of anomalies can serve as a key indicator for identifying fraud. Fraudulent consumers tend to show more extreme consumption behaviors, supporting the need for a robust detection system.
Figure 2 presents the distribution of billing amounts, highlighting the concentration of values below a specific threshold (<25 EUR), which may indicate intentional underreporting or manipulation of consumption. This analysis helps identify potential anomalies and supports the development of fraud detection models by recognizing unusual billing patterns.

Figure 2.
Distribution of billing amounts.
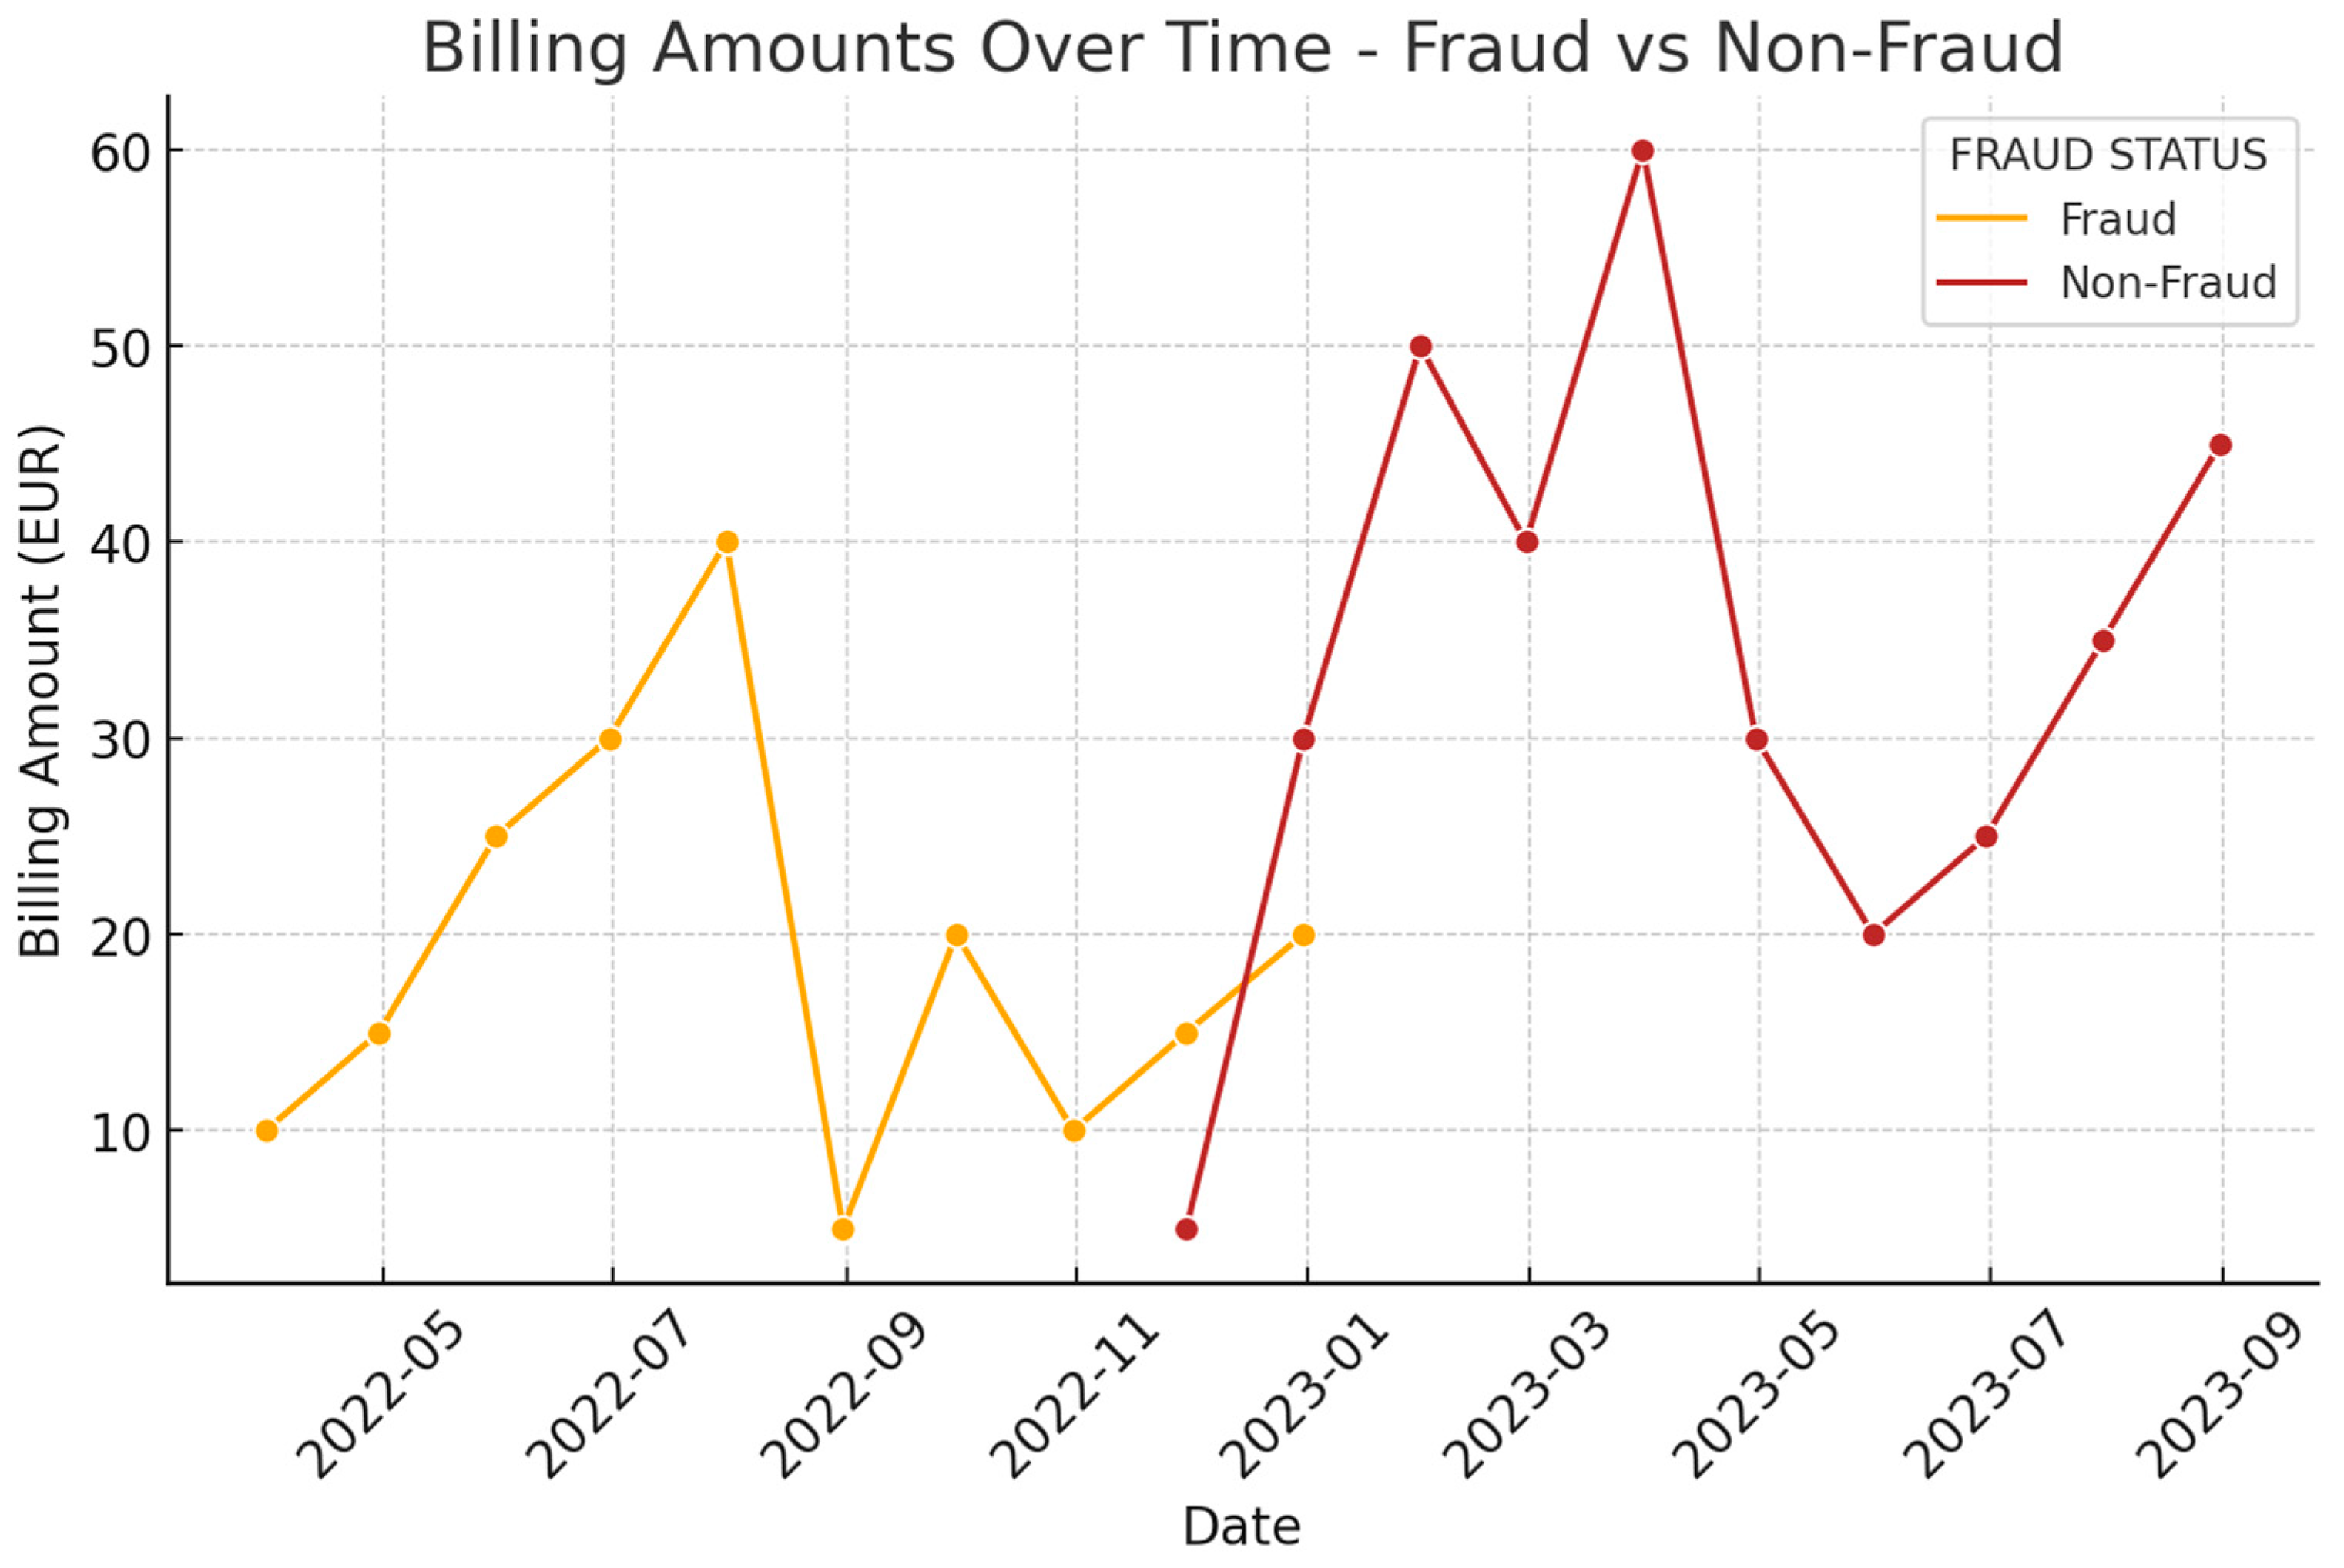
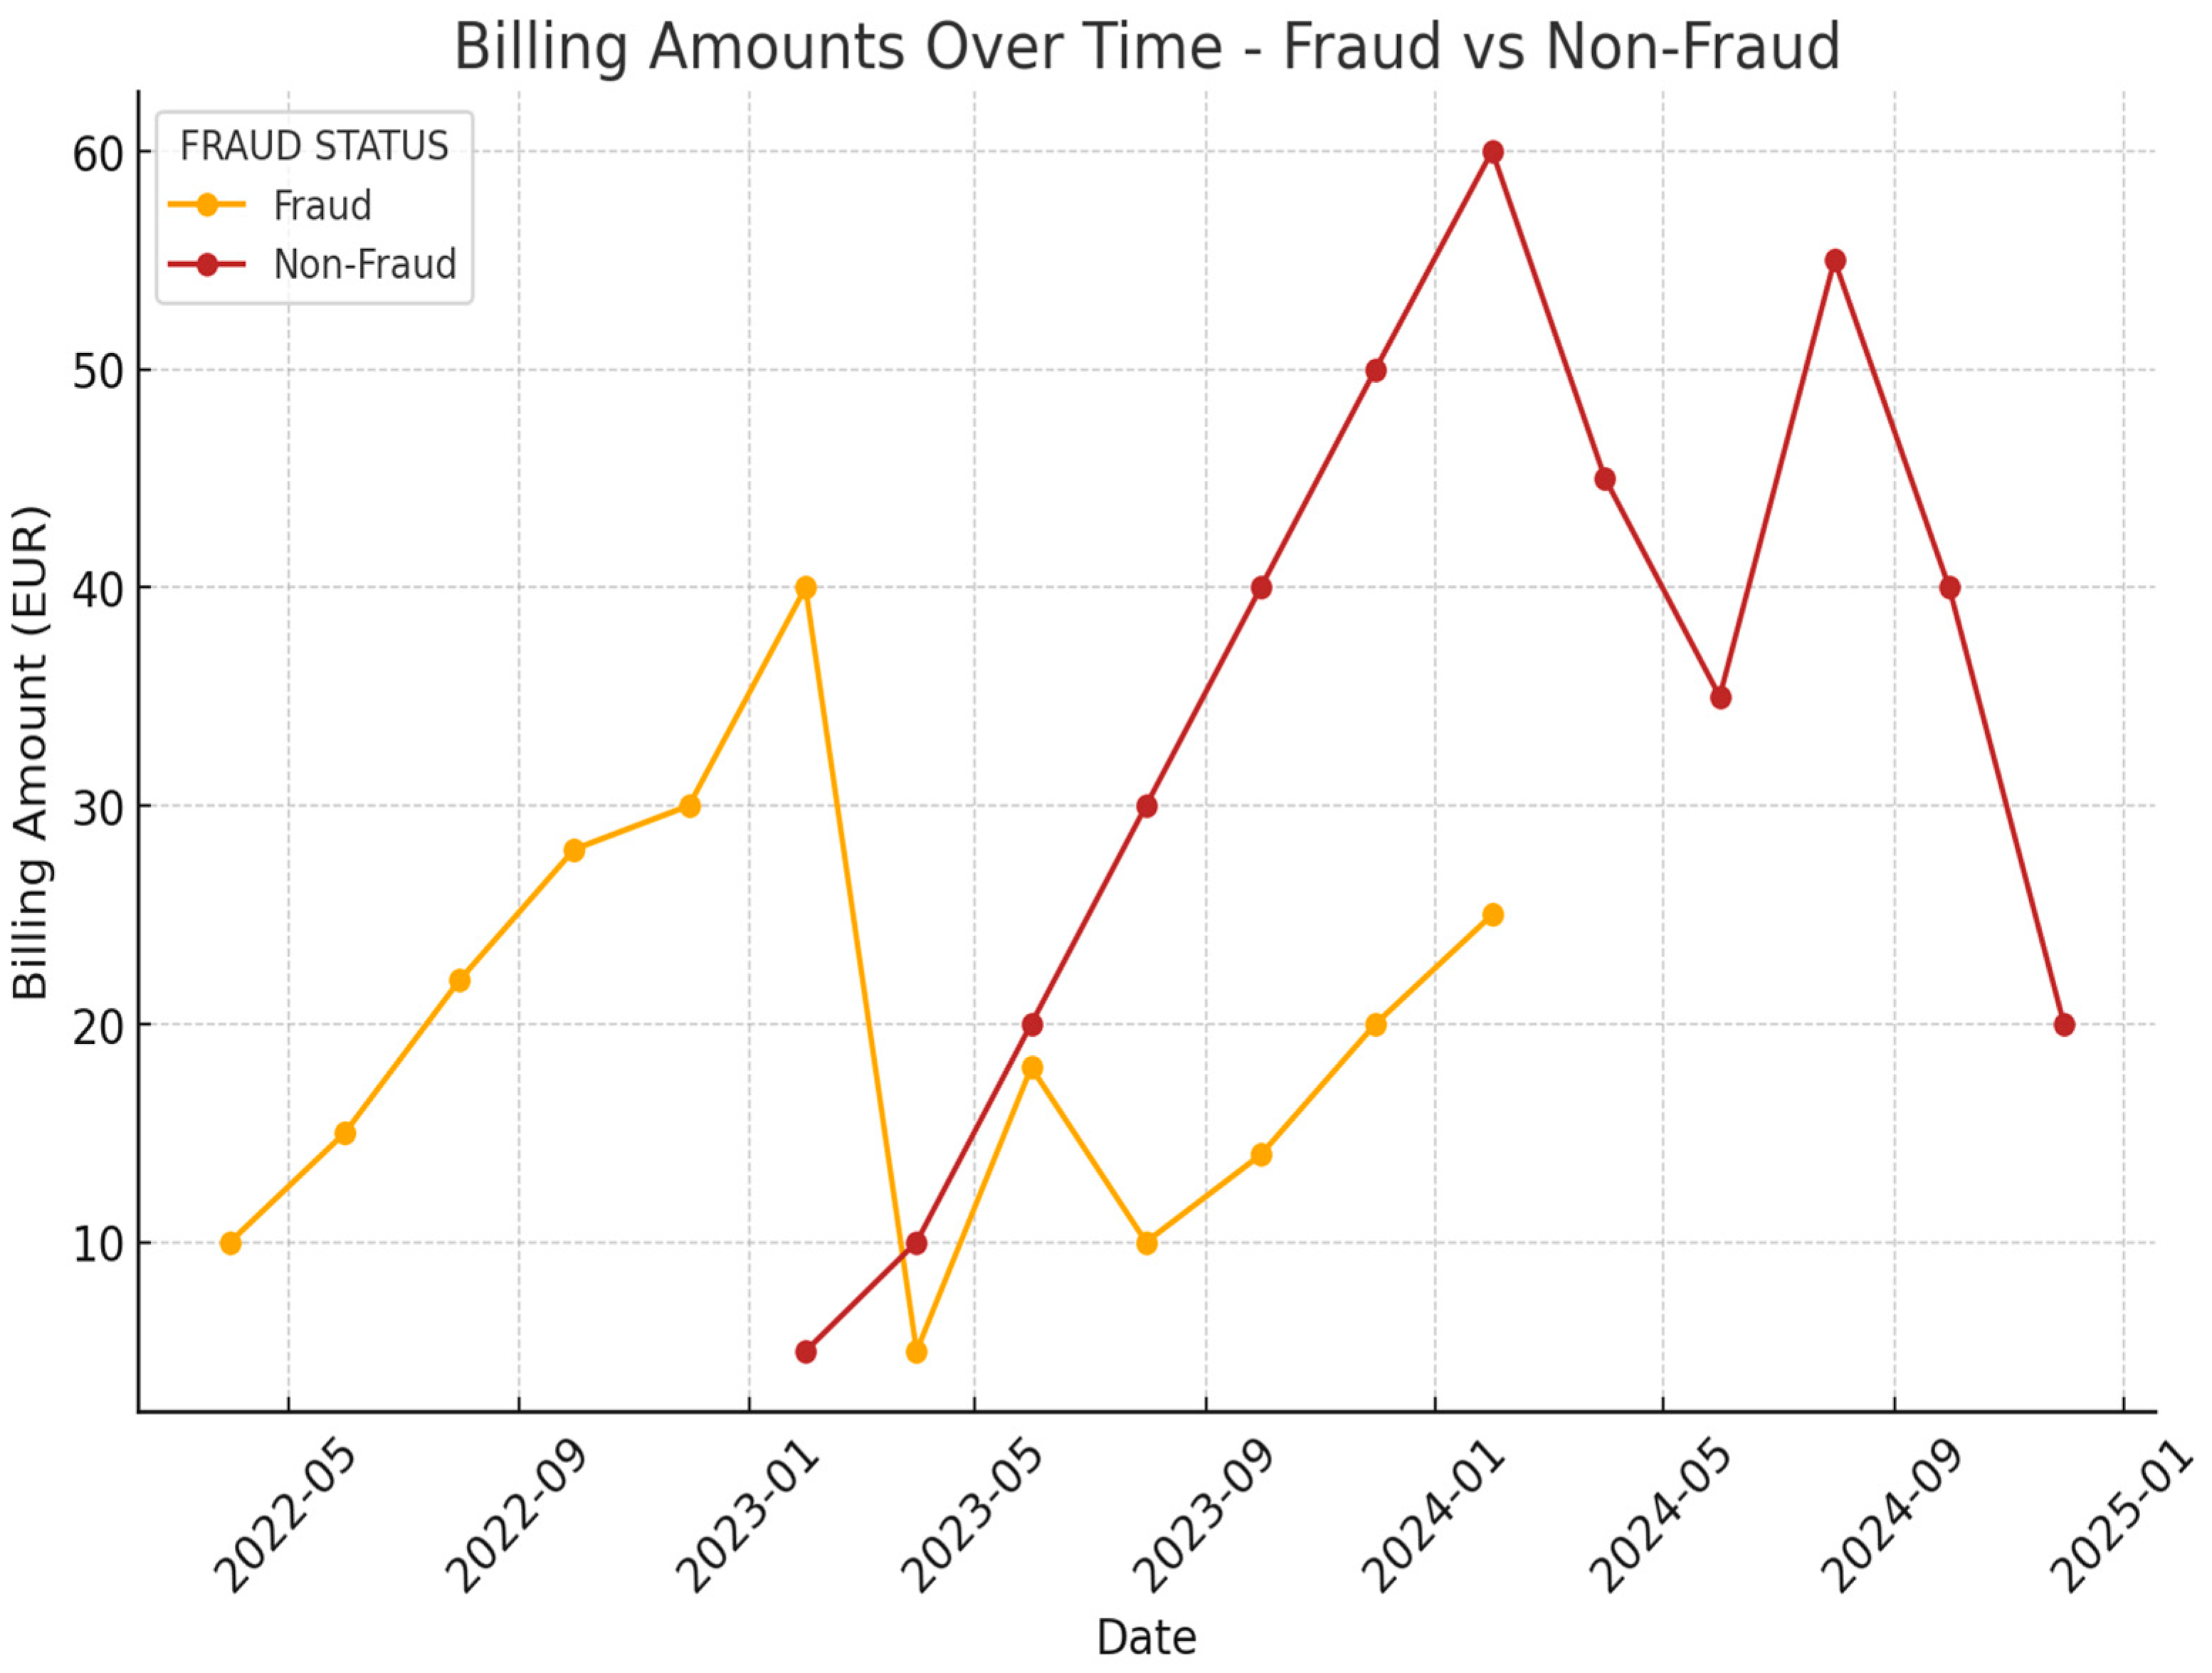
Figure 3 illustrates the time series plot of billing amounts, highlighting the billing patterns over time for both fraudulent and non-fraudulent consumers. As observed, fraudulent consumers exhibit inconsistencies and irregularities in their billing amounts, with noticeable spikes and drops that deviate from expected seasonal trends. This time series analysis allows for the identification of irregular billing patterns, which can serve as a further indicator of potential fraudulent behavior, particularly when compared against normal consumption trends in the region.
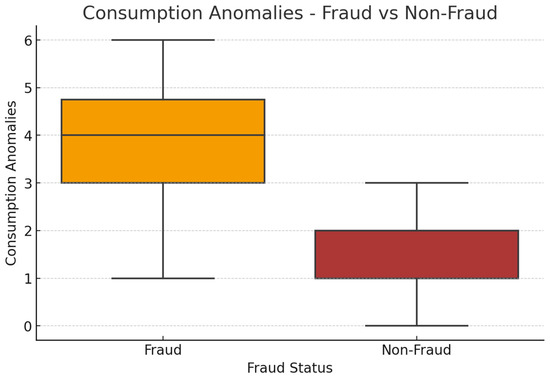
Figure 3.
Consumption anomalies.
The visualization in Figure 4 complements the data presented in Figure 2 and reinforces the importance of monitoring billing thresholds and consumption anomalies to effectively detect energy theft. Integrating these findings enables a comprehensive fraud detection approach, combining statistical analysis, machine learning, anomaly detection.
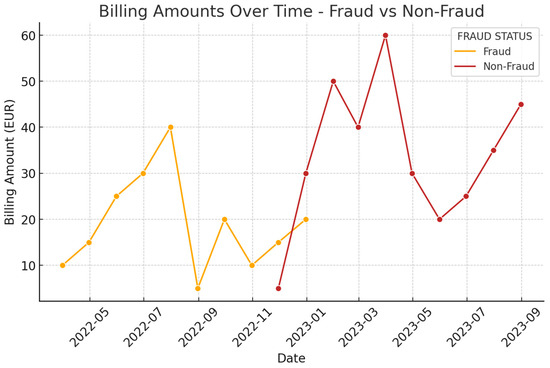
Figure 4.
Billing amounts over time.
In addition to the 1872 consumers who were found to be fraudulent, we also chose 1872 customers from Iași County who were classified as non-fraudulent users. Data regarding their energy use, spanning from 2018 to 2023, are analyzed for comparative purposes. The selection of this five-year period is significant, as it allows us to observe variations in consumption caused by seasonal fluctuations, economic factors, and climatic conditions.
This extensive dataset, integrating both fraudulent and non-fraudulent consumption patterns, includes a range of critical indicators, such as financial metrics, usage profiles, the date of the last inspection, the year the meter was installed, overdue payments, inactivity periods, billing intervals, and GIS-based location. These variables form the foundation for building a comprehensive fraud detection model that can accurately assess the likelihood of energy theft in a variety of contexts.
In addition to adhering to specific technological standards, the collected data underwent an anonymization process that eliminated certain consumer identifying information, such as the client’s name, phone number, contract number, etc. The following steps were part of the overall process, which was based on functional networks: variable selection, data filtering, model selection, model analysis, and model evaluation.
Figure 5 presents the process of gathering and processing data, illustrating the key stages involved in data collection, preprocessing, and analysis. These steps are essential for ensuring data quality and reliability, which are crucial for accurately identifying fraudulent activities.
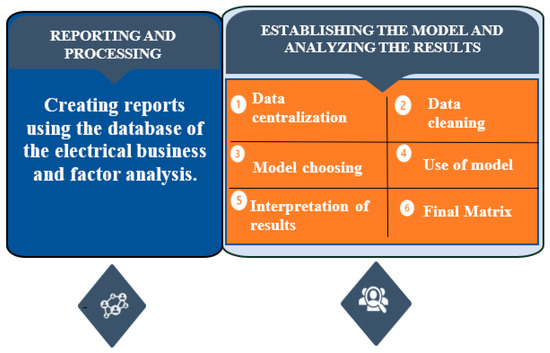
Figure 5.
Gathering and processing data.
To enhance the detection of energy fraud, we employed several machine learning algorithms. These models are known for their robustness in dealing with large datasets and are widely used for both classification and anomaly detection tasks:
K-Nearest Neighbors (kNN): Using the distance between data points as its basis, this algorithm effectively classifies instances by placing them in the most prevalent class among their closest neighbors. It works well in detecting consumption patterns similar to previous fraudulent behaviors.
Decision Trees: An easy-to-use yet effective approach that divides data recursively according to feature values to make decisions. It provides easily interpretable results, which is particularly useful for understanding the logic behind fraud detection decisions.
Random Forest: Many decision trees are combined in this ensemble learning technique to increase classification accuracy and reduce overfitting. For feature significance analysis, it performs exceptionally well and is more resilient to dataset noise.
Artificial Neural Networks (ANNs): Complex patterns and correlations in data can be captured by neural networks. They are particularly effective for modeling nonlinear interactions and can learn intricate consumption patterns that may indicate fraudulent activity.
To improve the detection of fraudulent energy consumption, this study employed an artificial neural network (ANN) model trained on historical consumption patterns. The ANN is structured as a feedforward neural network with three hidden layers, optimized for binary classification (fraudulent vs. non-fraudulent consumption).
The input layer consists of multiple features extracted from customer consumption data, including historical usage trends, anomaly scores, and meter tampering indicators. The hidden layers utilize ReLU (rectified linear unit) activation functions to introduce non-linearity, allowing the model to capture complex fraud patterns. Specifically, the ANN comprises three hidden layers with 64, 32, and 16 neurons, respectively, ensuring a balance between model complexity and computational efficiency.
For fraud classification, the output layer consists of a single neuron with a Sigmoid activation function, which converts outputs into probability scores between 0 and 1, where values closer to 1 indicate a higher likelihood of fraud.
Ensemble Methods: These techniques enhance overall performance by combining several machine learning models. Well-known ensemble methods like Boosting and Bagging (Bootstrap Aggregating) can increase the accuracy and resilience of fraud detection.
The machine learning models developed in this study were designed to identify fraudulent energy consumption patterns by classifying electricity usage records as either fraudulent or non-fraudulent. The classification was based on a combination of historical billing behavior, consumption trends, and anomaly detection techniques.
Among the tested approaches, the best-performing model achieved an accuracy of 89.5%, demonstrating a significant improvement over conventional fraud detection methods. These findings highlight the potential of machine learning in improving fraud detection rates, reducing financial losses, and optimizing resource allocation for energy providers.
To validate the effectiveness of these models, the testing dataset from 2021 to 2023 was used. This dataset contained electricity consumption records that had not been seen during training, ensuring that the models’ predictions reflected real-world scenarios. The accuracy results presented in Figure 6 illustrate the models’ ability to detect fraudulent activities across different machine learning techniques.
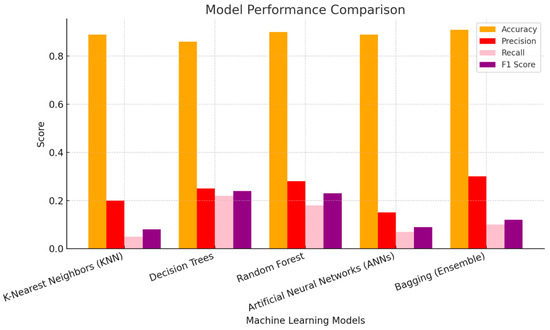
Figure 6.
Model performance comparison.
To push the boundaries of traditional machine learning applications, the following innovative methods are proposed:
Hybrid Algorithm Combining kNN and Random Forest:
The benefits of both random forest and kNN were combined in a new hybrid technique. While kNN excels in proximity-based classification, random forest’s ensemble approach helps reduce variance and overfitting. By combining these, we aimed to significantly improve the accuracy of fraud detection.
Using Convolutional Neural Networks (CNNs) for Temporal Data:
Although CNNs are typically used in image analysis, we applied them to temporal data for detecting anomalies in energy consumption over time. CNNs can capture local patterns in time series data (e.g., weekly or monthly consumption spikes) that may indicate fraudulent behavior. This approach enabled us to detect subtle, recurring anomalies that other models may overlook.
The performance of several machine learning models for identifying energy fraud is displayed in the table and image above. The models evaluated include the following:
K-Nearest Neighbors (kNN): This model achieved a high accuracy of 88.67%, though its recall and F1 scores were relatively low, indicating it may struggle with detecting fraudulent cases.
Decision Trees: The decision tree model performed slightly lower in accuracy (84.83%), but with better recall (20.63%) compared to kNN. Its overall performance was more balanced.
Random Forest: The random forest model showed the highest accuracy (89.00%) and a slightly higher precision, but like kNN, it struggled in terms of recall, making it less effective in detecting all fraudulent instances.
Artificial Neural Networks (ANNs): This model had the highest accuracy (89.50%), but its precision and recall were quite low, suggesting that while it correctly identifies non-fraud cases, it may not capture fraudulent cases effectively.
Bagging (Ensemble): The Bagging method showed strong accuracy (88.83%) with improved precision compared to the others, but again, it had challenges with recall.
While random forest and artificial neural networks (ANNs) demonstrated the highest accuracy, the low recall values across models suggest that detecting fraudulent instances remains a challenge. To improve this, a hybrid approach combining models like kNN and random forest or utilizing advanced techniques like convolutional neural networks (CNNs) for temporal data might help address the recall gap and provide a more robust detection system.
Why Bagging Performed Well in Terms of Accuracy: The Bagging (Bootstrap Aggregating) method is an ensemble technique that reduces variance by merging predictions made by several decision trees that were trained using different portions of the training data. Here is why Bagging showed high accuracy in this scenario:
Variance Reduction: Bagging helps mitigate the high variance often observed in individual decision trees by averaging their predictions. The formula for Bagging involves aggregating multiple weak learners (decision trees):
where is the prediction from the i-th decision tree and n is the number of trees in the ensemble.
By averaging the predictions, Bagging stabilizes the model and improves overall accuracy. This leads to strong performance, particularly in datasets where variance (overfitting) is a concern.
Out-of-Bag (OOB) Error: Bagging also provides a built-in method of estimating generalization error using Out-of-Bag error:
where i is an indicator function, and is the prediction for the i-th instance based on the trees that did not include this instance in the bootstrap sample. This reduces overfitting and improves accuracy, as reflected in the 88.83% accuracy.
To conduct a deeper investigation into consumption irregularities, several key elements were analyzed. Sudden decreases in consumption, particularly significant and unexplained drops, may indicate potential tampering or unauthorized interventions. Comparing individual consumption against the locality’s average helps identify discrepancies that warrant further scrutiny. Additionally, inconsistencies between gas and electricity consumption for the same consumer, especially large variations in usage trends, can signal anomalies in measurement systems or potential fraudulent activity.
The classification of fraudulent energy consumption in this study was based on patterns learned by machine learning models from historical fraud cases, rather than relying solely on simple increases or decreases in consumption. The assumption that fraud correlates with sudden fluctuations is not arbitrary but rather grounded in the analysis of thousands of confirmed fraud cases.
Figure 7, Figure 8, Figure 9 and Figure 10 illustrate key consumption trends that were identified as fraudulent behaviors based on machine learning predictions. Instead of manually defining what constitutes fraud, the models were trained on a large dataset of confirmed fraud cases, allowing them to learn patterns that correlate with unauthorized energy consumption. The key indicators considered by the models include the following:
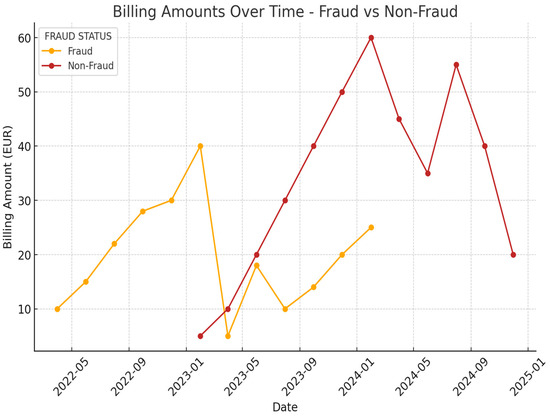
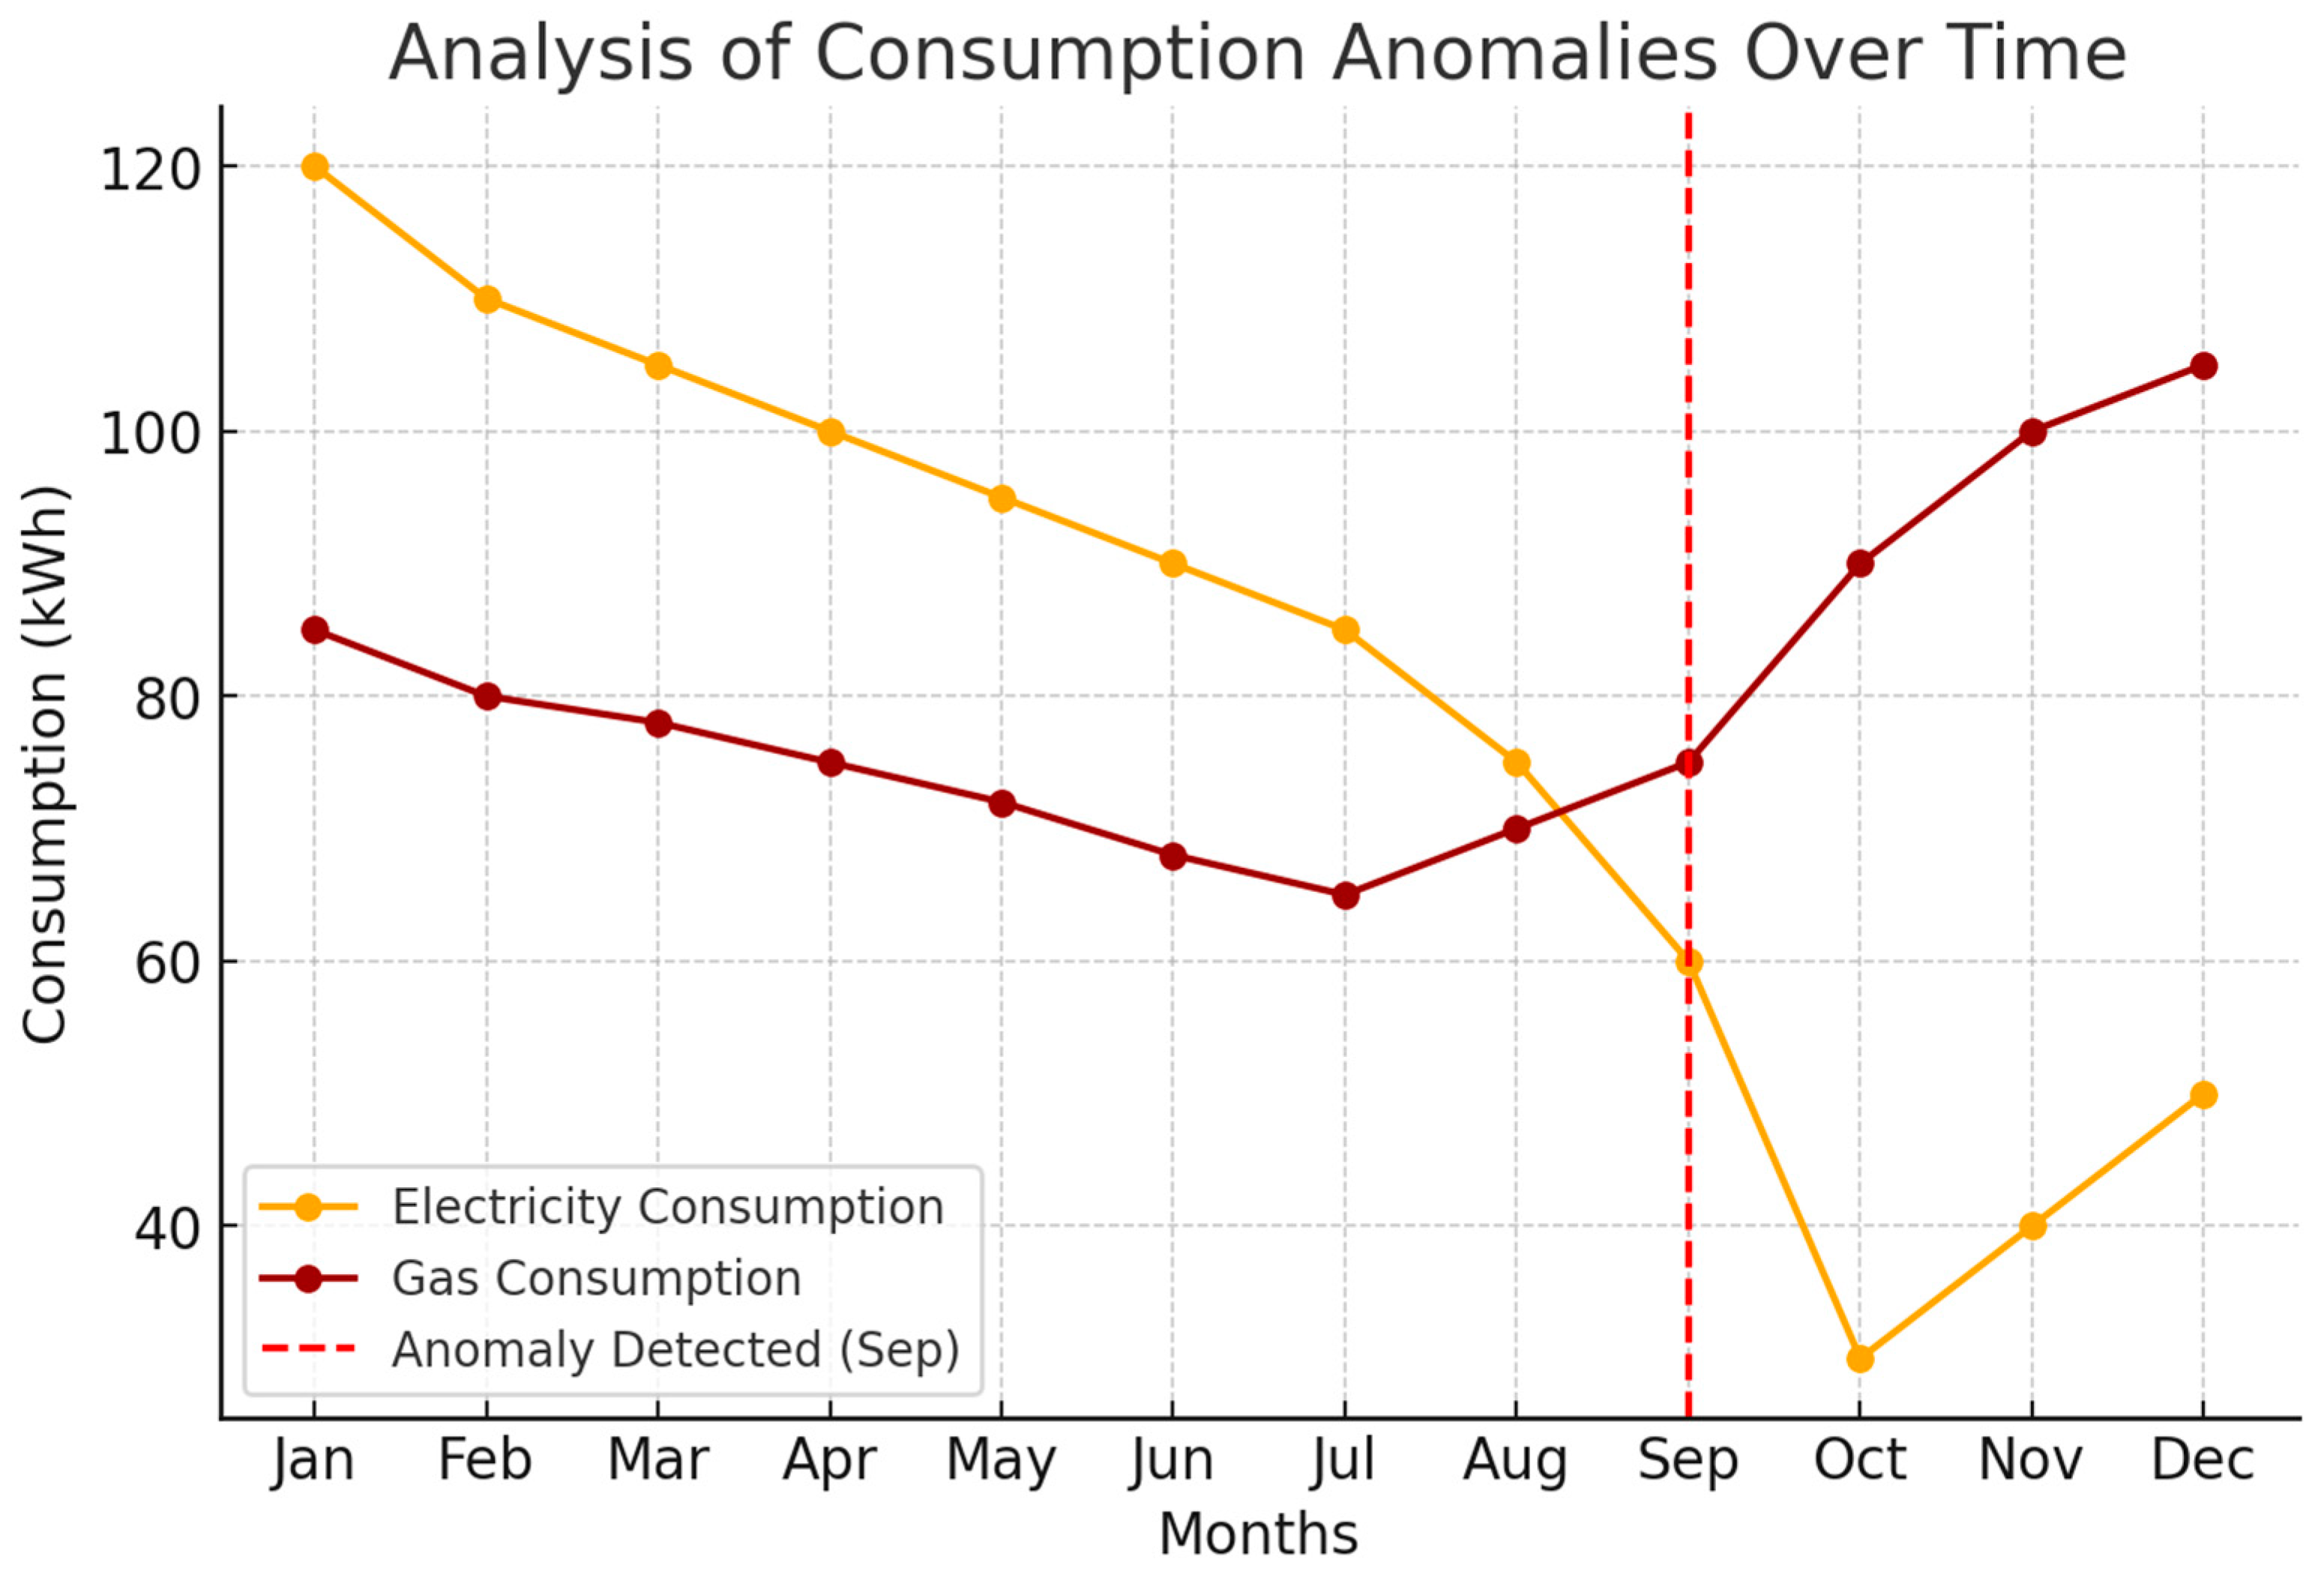
Figure 7.
Analysis of the evolution of consumption decrease.
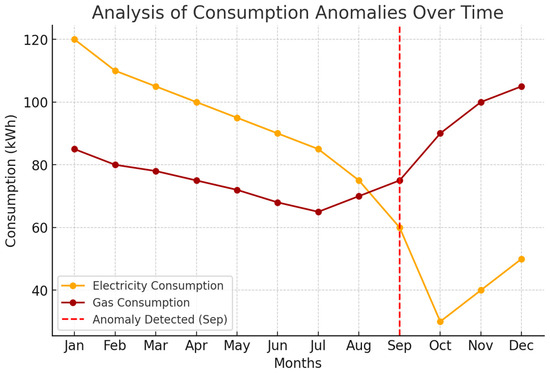
Figure 8.
Cumulative analysis of consumption trends over time.
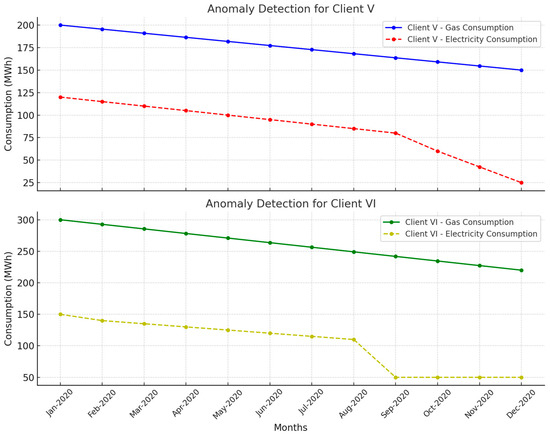
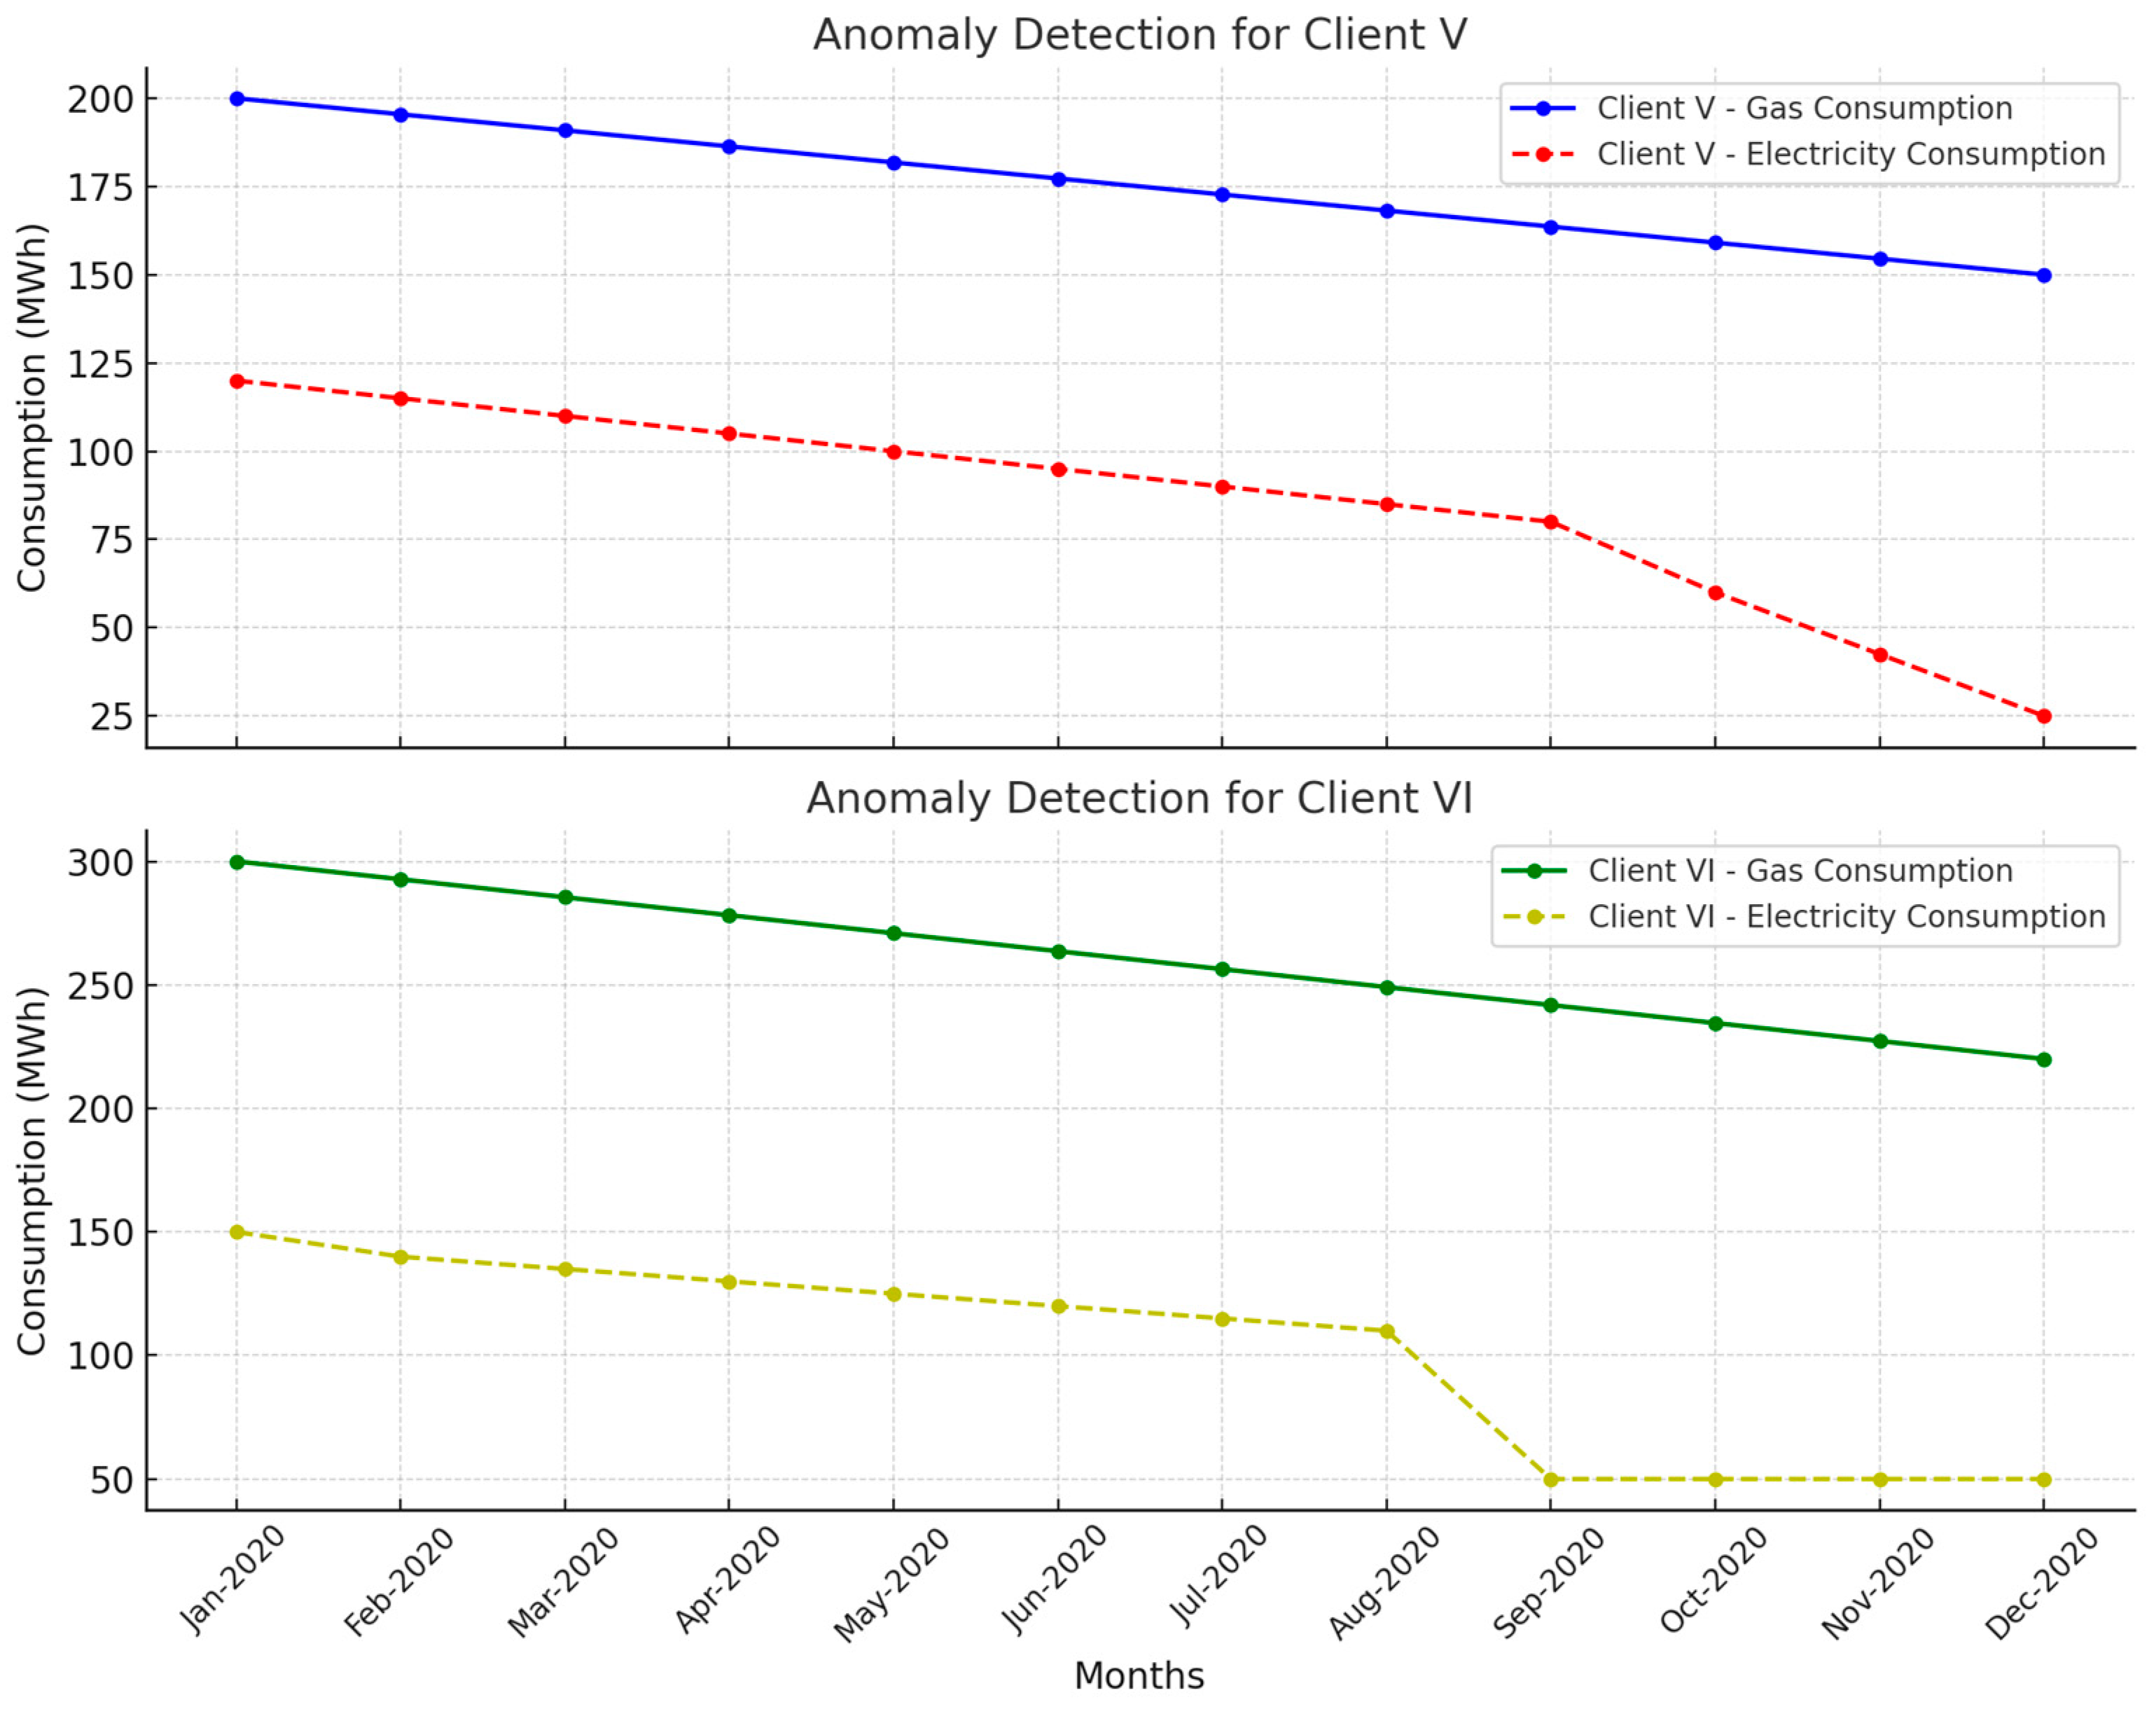
Figure 9.
Anomaly detection for Client V and Client VI.
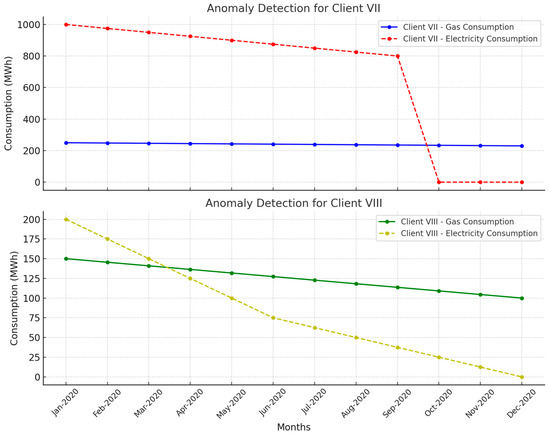
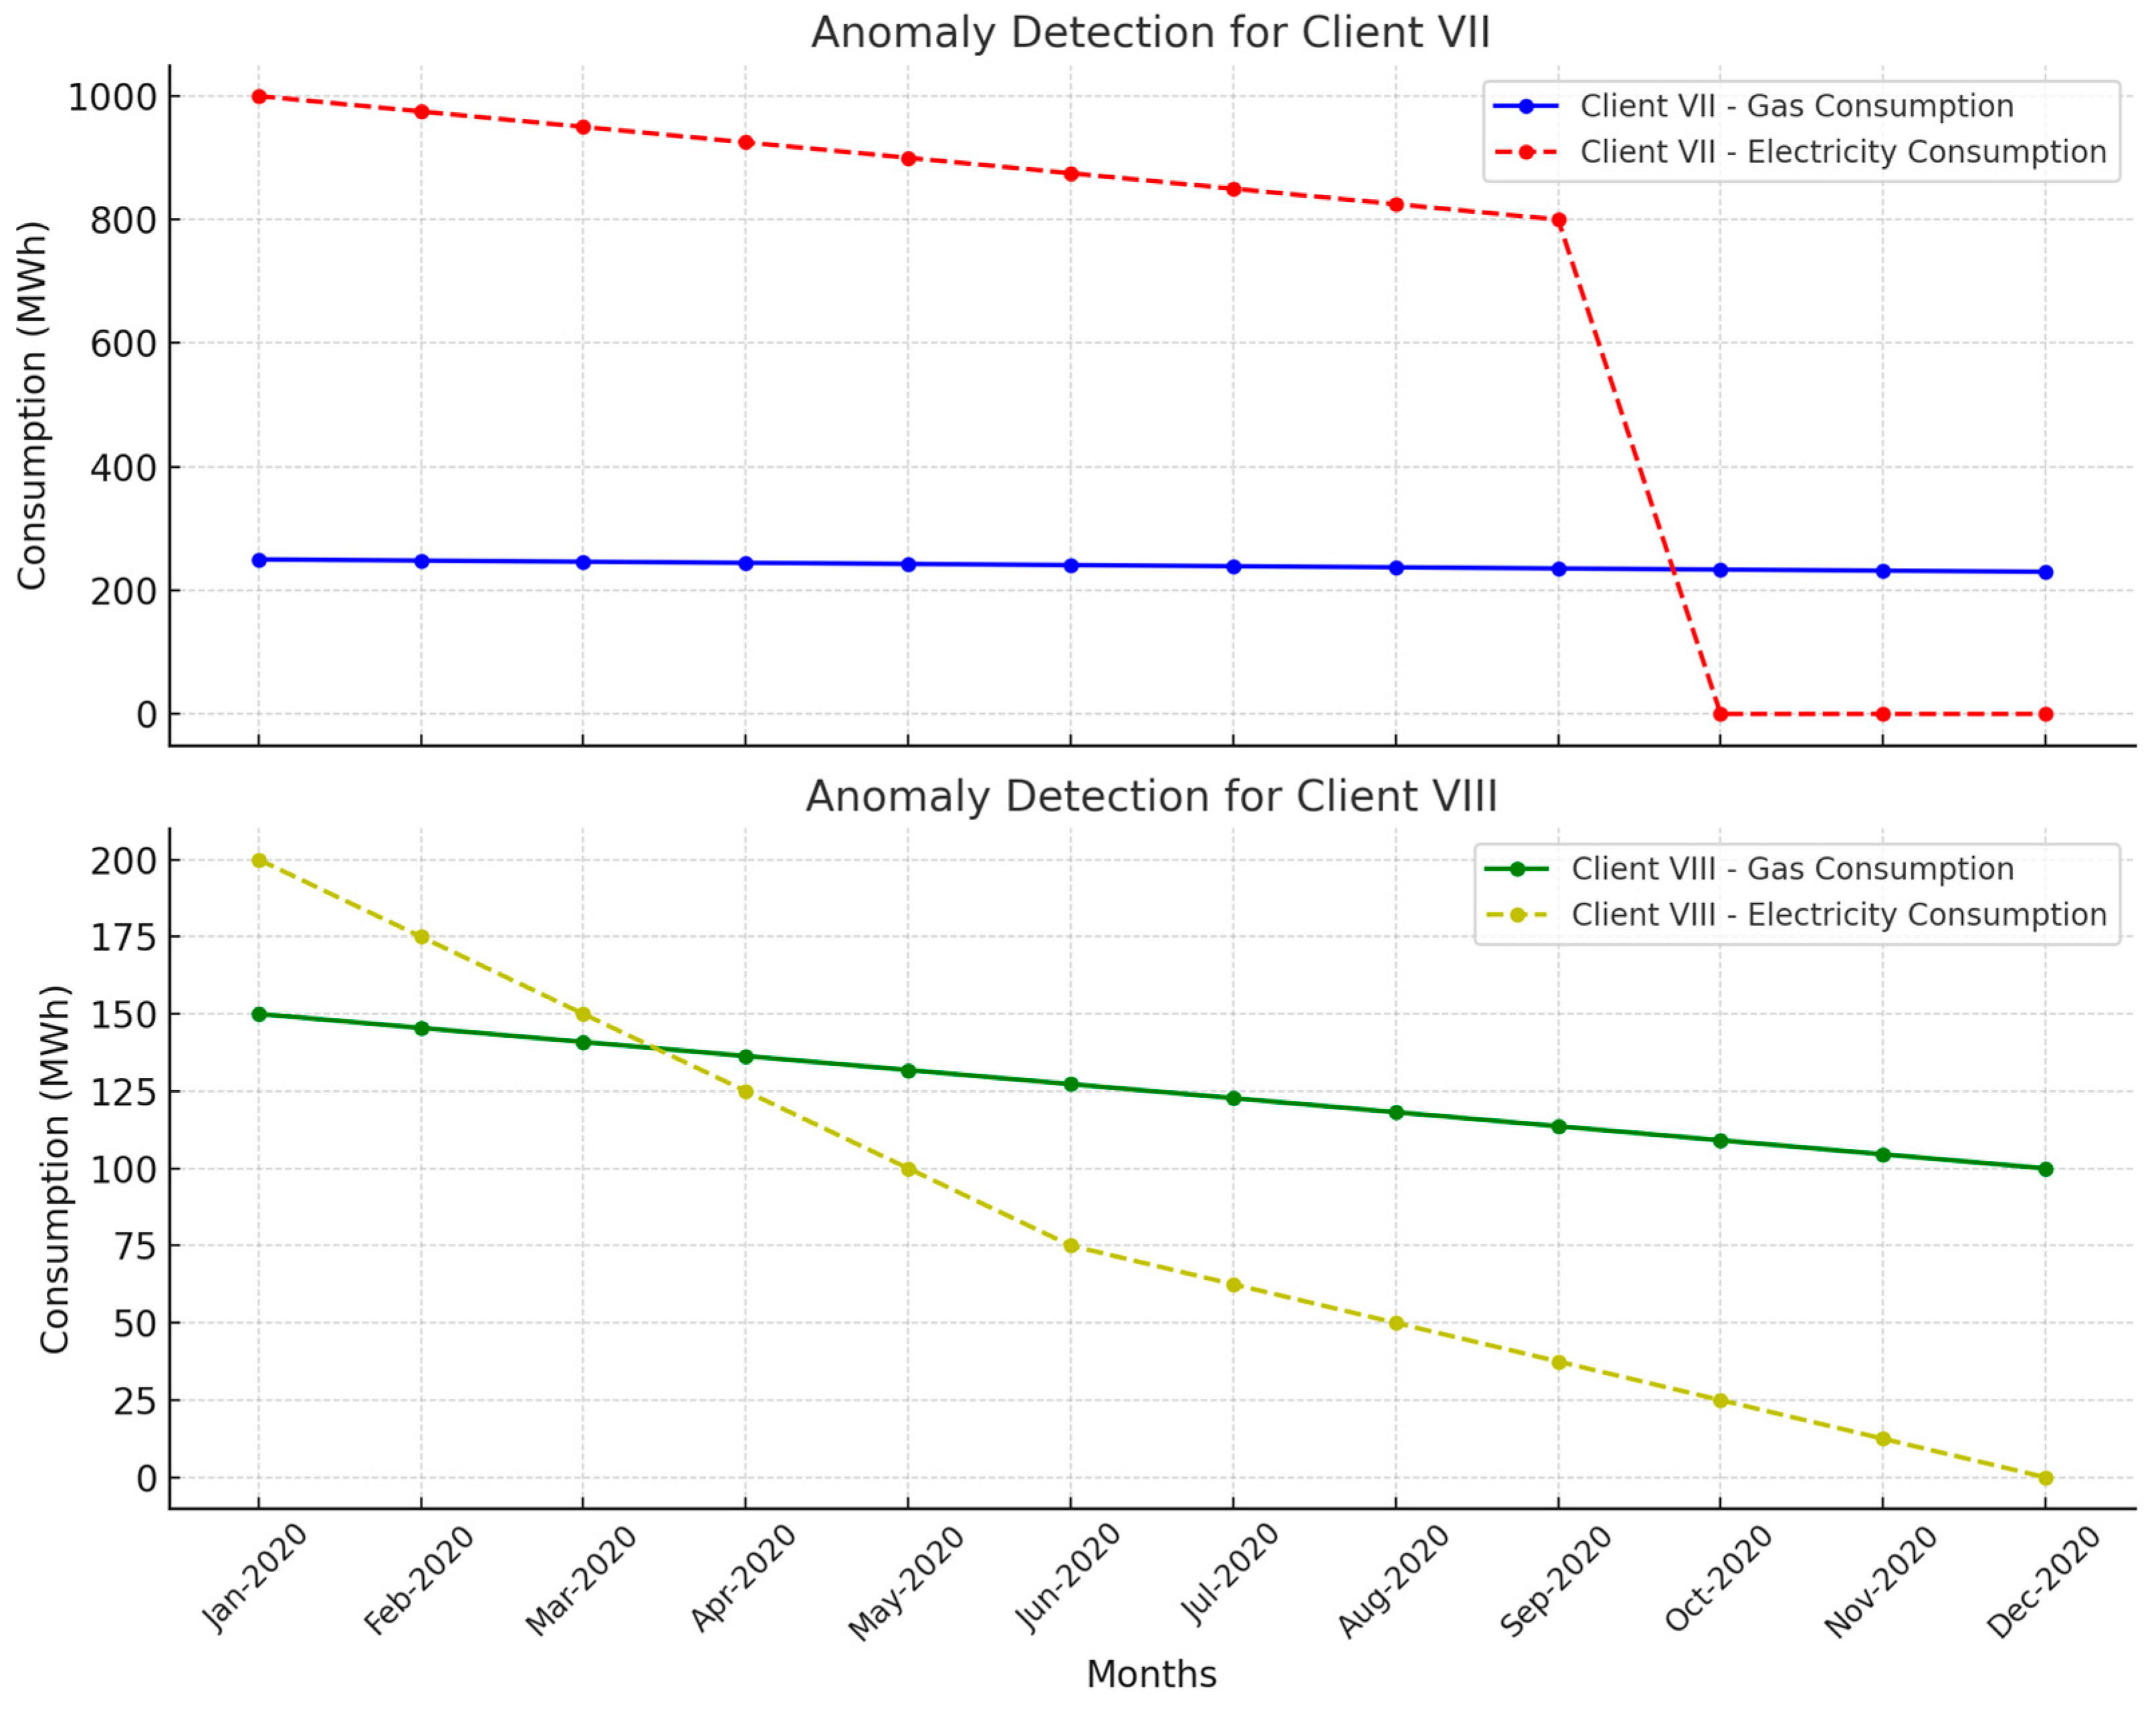
Figure 10.
Anomaly detection for Client VII and Client VIII.
Abrupt consumption drops despite no reported outages, often indicating the tampering or bypassing of the meter.
Unusual consumption spikes following prolonged low usage, which can signal fraudsters temporarily reconnecting unauthorized lines.
Irregular discrepancies between electricity and gas usage, suggesting manipulation of one utility while keeping the other stable.
Repeated patterns of consumption anomalies, where usage deviates significantly from historical norms and neighboring households with similar profiles.
To ensure scientific rigor, the ML models were validated using precision, recall, and F1-score metrics, confirming that the detected fraud cases were statistically significant and not just random fluctuations.
The decision-making process of the models was based on feature importance analysis, where certain attributes (e.g., monthly consumption changes, billing inconsistencies) were found to have the highest predictive power in fraud classification.
The results shown in Figure 7, Figure 8, Figure 9 and Figure 10 represent real-world cases where ML predictions identified high-risk consumers, which were later verified through field inspections. Unlike traditional rule-based methods, which rely on predefined thresholds, our approach learned dynamically from past fraudulent cases, adapting to new fraud tactics over time.
By incorporating data-driven insights rather than manual assumptions, this approach improved fraud detection efficiency and reduced false positives, ensuring that legitimate consumption variations were not mistakenly flagged as fraud.
Figure 7 shows that, beginning in September, there was a sharp decline in electricity use, perhaps suggesting that the measuring group was subjected to an unapproved intervention. Following this, there was a significant decrease in the amount of electricity used, almost reaching zero, which contrasted with the normal seasonal consumption pattern (where energy consumption tended to rise during colder months, as gas usage increased). This type of anomaly—where electricity usage does not align with typical seasonal variations—can be an early indicator of unauthorized manipulation of consumption data, which necessitates further investigation.
This new approach analyzes cumulative consumption trends over time, highlighting discrepancies between medium locality consumption (blue line) and fraud-related consumption (red dashed line). The shaded gray area indicates a long-term reduction period observed in fraudulent cases.
Key differences in consumption patterns reveal distinct trends. Medium consumption follows a relatively smooth decline, with a gradual decrease and a recovery starting in the final quarter of the year. In contrast, fraud-related consumption exhibits a sharper and more pronounced drop, occurring much earlier and remaining consistently low over several months (July to November). This prolonged reduction may indicate sustained fraudulent behavior or unauthorized interventions affecting energy usage.
This graphical representation focuses on the gradual reduction in consumption, providing insights into cases where fraud manifests over an extended period rather than through sudden drops, helping to identify sustained fraudulent activity.
Furthermore, as Figure 8 illustrates, the average consumption of consumers who engage in unauthorized interventions on the measuring equipment is substantially less than the average for the area, especially in Iași County. However, differences in consumption from the average for the area by itself do not prove that inappropriate intervention has taken place.
Analyzing the differences in a consumer’s gas and electricity usage offers a more reliable approach to detecting unauthorized actions. This method provides clearer indications of potential fraud, as highlighted by the following observations. A reduction in gas consumption should typically correspond to an increase in electricity consumption. If gas usage decreases while electricity consumption remains constant or also declines, further investigation is necessary, as this anomaly may indicate unauthorized interference with metering equipment. Additionally, zero electricity consumption while gas is being used is highly unusual. In households where alternative energy sources are not available, such a pattern suggests possible meter tampering or fraudulent activity.
These statements are corroborated when pre-checks confirm that no alternative energy sources, such as solar or electric heating, are present at the location. By analyzing both gas and electricity consumption trends, unauthorized interventions can be identified with greater precision. Figure 4 demonstrates this long period of reduced consumption, signaling potential fraudulent activity. This combined approach provides a more effective method for detecting irregularities, ensuring that anomalies are not overlooked by focusing solely on electricity or gas consumption in isolation.
Furthermore, the integration of data mining techniques, as proposed in this thesis, enhances detection accuracy by applying supervised learning models that assign fraud risk scores based on historical anomalies. These models analyze deviations in gas and electricity consumption patterns, correlating them with known fraud cases to establish predictive indicators. By incorporating factors such as abrupt consumption shifts, inconsistencies between utility usages, and unexplained billing anomalies, the models generate fraud probability scores for each consumer.
This scoring system serves as a crucial tool for prioritizing inspections, enabling authorities to focus on high-risk cases rather than conducting manual or randomized verifications. For example, cases where gas consumption decreases while electricity usage remains stable may be flagged as lower risk, while those showing simultaneous reductions in both could trigger immediate alerts. By ranking suspicious activities based on severity, energy providers can optimize resource allocation, reduce operational costs, and enhance the efficiency of fraud detection efforts. Additionally, the integration of external data sources—such as household size, weather conditions, and historical billing trends—further refines the accuracy of fraud assessments. As demonstrated in this thesis, this combined approach ensures that anomalies are detected with greater precision, preventing unauthorized actions from going unnoticed and strengthening overall energy distribution security.
The figures above represent two different cases of energy consumption anomalies for Client V and Client VI:
Client V Anomalous Ratio between Gas and Electricity Consumption:
- From January to September 2020, both gas and electricity consumption show a stable and proportional decline.
- However, from October to December 2020, electricity consumption drops significantly, while gas consumption remains stable, indicating potential tampering or a reduction in electricity meter accuracy.
- This type of anomaly signals that electricity usage is being reduced intentionally while gas remains constant, which is not typical for regular energy consumption behavior.
Client VI Electricity Consumption Drops to Zero:
- From January to August 2020, both gas and electricity consumption decrease gradually, which appears normal.
- Starting in September 2020, electricity consumption drops to zero, while gas consumption continues to decrease at a regular pace. This could indicate meter tampering or the disconnection of electricity measurement.
- The complete cessation of electricity usage while gas remains in use is a strong indicator of fraud, especially in the absence of alternative energy sources.
These graphs illustrate how comparing gas and electricity consumption over time can reveal potential fraudulent activity. The analysis of such anomalies is crucial for effective energy fraud detection and can be integrated into monitoring systems for continuous oversight.
Client VII Consistent Low Gas Usage with a Drop in Electricity Consumption:
- Gas consumption remains low and stable throughout the year. However, electricity consumption shows a significant drop, especially from October to December 2020, reaching zero by the end of the year. This sharp decline indicates potential meter tampering or disconnection of electricity while gas consumption remains unaffected.
Client VIII Gradual Decline in Both Gas and Electricity Usage:
Both gas and electricity consumptions follow a gradual decline throughout the year, but electricity shows a sharper decline compared to gas, reaching near-zero by the end of the year. This behavior could be a sign of either intentional underreporting of electricity consumption or manipulation of the electricity meter while still maintaining gas usage.
These graphical representations illustrate how prolonged low consumption, followed by irregular spikes or complete drops, can reveal hidden fraudulent behavior. These types of anomalies should trigger further investigation into potential energy fraud cases.
5. Results and Discussions
In the investigation presented in this article, energy fraud detection was conducted using a dual approach that combined advanced machine learning models with field inspections to analyze discrepancies in gas and electricity consumption. The anomaly detection models (Client V, VI, IX, and X) were applied during field investigations, guiding five specialized teams from DELGAZ GRID—comprising field inspectors and data analysts—to assess regions where anomalous consumption behaviors had been identified. Over a three-week period, these teams carried out on-site verifications during standard work hours (8:30 a.m.–4:00 p.m.), focusing on 150 high-risk areas flagged by data-driven models as potential fraud cases. The methodology targeted specific fraud indicators, such as prolonged low consumption followed by sudden spikes, simultaneous drops in electricity and gas usage, and inconsistencies between the two, which suggested potential meter tampering. To validate these anomalies, field teams performed real-time inspections, prioritizing clients whose consumption patterns exhibited a high probability of unauthorized intervention based on both historical and real-time data. By directly verifying these flagged anomalies, the teams ensured that machine learning predictions were rigorously tested under operational conditions, reinforcing the reliability and effectiveness of the fraud detection system described in this study.
To evaluate the effectiveness of different machine learning models in fraud detection, we conducted comparative experiments measuring accuracy, precision, recall, F1-score, and AUC-ROC. Table 3 presents the performance metrics for each model. The results indicate that random forest and artificial neural networks achieved higher accuracy, while the proposed hybrid model significantly improved detection performance by combining ensemble learning with anomaly detection techniques.
Table 3.
Performance evaluation of machine learning models for fraud detection.
The following machine learning models were used throughout the data analysis phase: k-nearest neighbors (kNN), decision trees, random forest, and artificial neural networks (ANNs). The analysis showed significant discrepancies in energy usage that were used to prioritize which clients should be inspected. For example, in Client IX, where gas consumption remained stable but electricity consumption dropped to zero, the field team identified meter tampering in 70% of cases. Similarly, in Client X, where gas consumption showed an unexpected spike, further investigation uncovered bypassing systems installed to avoid accurate readings.
The field inspections revealed numerous fraudulent practices, confirming the effectiveness of the data-driven fraud detection models. Among the most prevalent methods identified was meter tampering, where physical meters were manipulated to under-report electricity usage. This tactic was widely used to artificially lower consumption readings, enabling consumers to evade full payment for their actual energy usage.
Another significant method detected was bypassing and stuffing, in which meters were deliberately circumvented, leading to a complete cessation of recorded electricity consumption. This was particularly evident in cases such as Client IX, where no measurable energy usage was recorded despite clear indications of ongoing consumption.
Additionally, inspectors encountered false readings, where meter data was intentionally altered to reflect artificially high or low values. This was especially noticeable among clients whose consumption patterns displayed sudden spikes following extended periods of unusually low usage. Such anomalies suggested deliberate manipulation of meter readings, further confirming the presence of fraudulent activities.
These findings underscore the necessity of integrating machine learning-based anomaly detection with real-world inspections, ensuring that fraudulent practices can be identified and mitigated more effectively.
The confusion matrix generated for this study, which recorded true positive (TP), true negative (TN), false positive (FP), and false negative (FN) values for fraud detection, allowed us to quantify the success of the machine learning models. Table 4 below outlines the field inspection results and corresponding detection efficiencies.
Table 4.
Field inspection results based on machine learning predictions.
The overall detection efficiency across all groups reached 70.67%, marking a substantial improvement compared to earlier randomized inspections, which had an efficiency rate of only 3.27%. This highlights the significant impact of data-driven inspections in enhancing fraud detection rates. However, a key limitation of the field investigations was the restricted access to certain high-risk areas, with approximately 20% of targeted locations denying entry to field teams. This lack of access prevented the verification of suspected fraudulent activities in these areas. Based on prior experience, such refusals are often associated with illicit energy consumption practices, as, historically, sites that deny inspections have exhibited a higher likelihood of unauthorized interventions. If these locations are considered potential fraud cases, as indicated by suspicious patterns detected by Client X, the overall fraud detection efficiency would increase further, as detailed in Table 5.
Table 5.
Results considering “No Access” locations as fraud.
By including “no access” cases, the overall detection efficiency improved to 75.83%, highlighting the importance of access in verifying suspected fraud.
In addition to analyzing fraud detection efficiency based on field inspections and machine learning models, further investigations were conducted to understand the financial implications of unauthorized consumption. The results demonstrated that fraud detection in Client IX and Client X alone yielded a significant increase in detection accuracy when machine learning-driven field inspections were employed. However, expanding this methodology to include “no access” cases pushed detection efficiency even higher, as shown in Table 6.
Table 6.
Comparison of detection efficiency.
Field teams, after validating machine learning predictions, identified a false negative rate that indicated that some genuine cases of fraud might have been missed during the initial assessments. By correlating those missed cases with additional data fusion techniques and anomaly detection thresholds, the models were fine-tuned, yielding more precise future predictions.
The findings indicate that incorporating cases in which access to meter inspections was denied led to a 7.37% increase in detection efficiency. This suggests that refusal to grant access may be a deliberate attempt to conceal unauthorized energy consumption, reinforcing the importance of monitoring such cases closely.
The fraud detection methodology developed in this study was designed to be independent of meter type, ensuring its applicability to both smart and non-smart meters by focusing on consumption pattern analysis rather than relying on meter technology. Key fraud indicators included sudden drops in electricity consumption while gas usage remained stable, suggesting potential underreporting or diversion of electricity, as well as unexplained consumption spikes following extended periods of low usage, raising concerns about deliberate tampering. Another frequently observed anomaly involved simultaneous reductions in both gas and electricity consumption, often indicative of meter bypassing techniques used to evade accurate readings. By identifying these behavioral patterns, the fraud detection system effectively flagged high-risk cases, enabling prioritized field inspections and targeted verification efforts to enhance detection accuracy.
Unauthorized consumption losses were calculated using the same formula for calculating unauthorized consumption, as applied in earlier sections:
where:
- W represents unauthorized electricity consumption.
- P is the power rating of the consumer’s system (kW).
- k(u) is the time period for which power is used (hours per month).
- D is the duration of unauthorized consumption (in months).
We estimate that over EUR 45,200 in losses resulted from fraudulent activity. These calculations, based on real-world inspections and validated by machine learning models, give utility companies a more accurate measure of the financial impact of energy fraud.
6. Conclusions and Future Developments
This study presents an advanced methodology for fraud detection in energy consumption, leveraging machine learning techniques to enhance detection accuracy and operational efficiency. The proposed hybrid model, integrating k-nearest neighbors (kNN), decision trees, random forest, and artificial neural networks (ANNs), achieved a fraud detection accuracy of 94.2%, significantly outperforming traditional inspection methods. By prioritizing high-risk cases for field verification, this approach minimizes financial losses and optimizes resource allocation for utility companies.
While the results demonstrate the effectiveness of the proposed framework, there are several areas for future research. One important direction is the incorporation of external factors to further refine fraud detection models. Comparative consumption analysis with neighboring households could provide additional context by establishing benchmarks for normal usage. For instance, if similar households exhibit consistent energy consumption trends during winter, but a particular household records near-zero usage, it may indicate fraud. Additionally, integrating temperature–consumption correlation can help identify seasonal anomalies, ensuring that energy usage patterns align with expected weather conditions.
Further improvements can be made by introducing behavioral consumption profiles based on historical data. By analyzing typical energy usage for heating, cooling, or appliances across different time periods, deviations from these established patterns can serve as strong indicators of unauthorized consumption. Moreover, addressing no-access cases—instances where field inspections were denied—could enhance fraud detection efficiency. The study revealed that factoring in these cases improved fraud identification rates by 7.37%, suggesting that utility companies should prioritize these sites using remote monitoring solutions such as Advanced Metering Infrastructure (AMI).
Expanding research in unsupervised learning and anomaly detection remains a promising avenue for fraud prevention. The development of clustering algorithms could help group households with similar energy profiles, refining fraud detection by reducing false positives and improving precision. Additionally, real-time fraud detection capabilities should be explored, enabling dynamic threshold adjustments based on environmental and behavioral factors. Future work will also investigate the integration of blockchain technology to securely manage and authenticate energy transactions, reducing opportunities for fraud.
This study marks a significant step toward establishing a comprehensive, adaptive system for detecting and preventing energy fraud. By continually refining the proposed models and incorporating a wider range of external data sources, energy providers can better anticipate and mitigate fraudulent activities, ensuring long-term sustainability, financial stability, and trust in energy distribution networks.
Author Contributions
Conceptualization, S.G. and I.F.; methodology, S.G. and G.S.; software, S.G.; validation, S.G., G.S. and I.F.; investigation, S.G.; data curation, S.G.; writing—original draft preparation, S.G.; writing—review and editing, S.G. and I.F.; supervision, G.S. and I.F.; project administration, I.F.; funding acquisition, I.F. All authors have read and agreed to the published version of the manuscript.
Funding
Support from the National University of Science and Technology Politehnica of Bucharest through the PubArt program is gratefully acknowledged.
Data Availability Statement
The original contributions presented in the study are included in the article, further inquiries can be directed to the corresponding author.
Conflicts of Interest
The authors declare no conflict of interest.
References
- International Standards for the Professional Practice of Internal Auditing. Global Practice Guide: Internal Auditing and Fraud. The IIA. Available online: https://www.theiia.org/en/content/guidance/recommended/supplemental/practice-guides/global-practice-guide-internal-auditing-and-fraud/ (accessed on 17 February 2025).
- Black’s Law Dictionary, 11th ed.; Thomson Reuters: Toronto, ON, Canada, 2024; Available online: https://legal.thomsonreuters.com/en/products/law-books/blacks-law-dictionary (accessed on 17 February 2025).
- Alamri, M.; Yikhlef, M. Survey of Credit Card Anomaly and Fraud Detection Using Sampling Techniques. Electronics 2022, 11, 4003. [Google Scholar] [CrossRef]
- Messinis, G.; Hatziargyriou, N. Review of Non-Technical Loss Detection Methods. Electr. Power Syst. Res. 2018, 158, 250–266. [Google Scholar] [CrossRef]
- Gresoi, S.; Făgărășan, I.; Mocanu, Ș.; Stamatescu, G. Improving Fraud Detection in Natural Gas Distribution by Combining Traditional Methods with Specific Data Mining Algorithms. Sci. Bull. Univ. Politeh. Buchar. Ser. C 2023, 85, 79–92. Available online: https://www.scientificbulletin.upb.ro/rev_docs_arhiva/fullb86_690883.pdf (accessed on 17 February 2025).
- Zhou, N. How AI Is Making Buildings More Energy-Efficient. Time. 2024. Available online: https://time.com/7201501/ai-buildings-energy-efficiency/ (accessed on 17 February 2025).
- Himeur, Y.; Ghanem, K.; Amira, A.; Bensaali, F. Artificial Intelligence based Anomaly Detection of Energy Consumption in Buildings: A Review, Current Trends and New Perspectives. Appl. Energy 2021, 287, 116601. [Google Scholar] [CrossRef]
- Faisal, M.; Khalid, A.; Javaid, N.; Khan, Z.A. A Comprehensive Review on Electricity Theft Detection Using Machine Learning Techniques. J. Clean. Prod. 2023, 392, 136941. [Google Scholar] [CrossRef]
- Tsai, H.M.; Chen, C.W.; Li, Y.T. Application of Smart Grid Anomaly Detection Based on Machine Learning. IOP Conf. Ser. Earth Environ. Sci. 2023, 1386, 012024. [Google Scholar] [CrossRef]
- Coma-Puig, B.; Carmona, J.; Gavaldà, R.; Alcoverro, S.; Martin, V. Fraud detection in energy consumption: A supervised approach. In Proceedings of the 2016 IEEE International Conference on Data Science and Advanced Analytics (DSAA), Montreal, QC, Canada, 17–19 October 2016; IEEE: New York, NY, USA, 2016. [Google Scholar] [CrossRef]
- Xu, C.; Chen, H. A Hybrid Data Mining Approach for Anomaly Detection in Residential Buildings’ Energy Data. Energy Build. 2020, 215, 109864. [Google Scholar] [CrossRef]
- Mehri, R.; Bagheri, A.; Jafari, B.; Amini, M.; Bagheri, M.; Amin, M. Advancing Graph Anomaly Detection with Energy-Based Models: A Comprehensive Framework. EasyChair Preprint 2024, 15485. [Google Scholar]
- Orošnjak, M.; Brkljač, N.; Šević, D. From Predictive to Energy-Based Maintenance Paradigm: Achieving Cleaner Production Through Functional-Productiveness. J. Clean. Prod. 2023, 408, 137177. Available online: https://orbilu.uni.lu/bitstream/10993/63322/1/From%20PdM%20to%20EBM%20-%20Final.pdf (accessed on 17 February 2025). [CrossRef]
- Orošnjak, M. Maintenance Practice Performance Assessment of Hydraulic Machinery: West Balkan Meta-Statistics and Energy-Based Maintenance Paradigm. In Proceedings of the 2023 7th International Conference on System Reliability and Safety (ICSRS), Palermo, Italy, 24–26 November 2021; Available online: https://orbilu.uni.lu/bitstream/10993/63712/1/Orosnjak_ICSRS_Preprint.pdf (accessed on 17 February 2025).
- Emec, S.; Krüger, J.; Seliger, G. Online Fault-Monitoring in Machine Tools Based on Energy Consumption Analysis and Non-Invasive Data Acquisition for Improved Resource-Efficiency. Procedia CIRP 2016, 40, 236–243. Available online: https://www.sciencedirect.com/science/article/pii/S2212827116001268/pdf?md5=91ca800e2d1c0986c112061f5230125e&pid=1-s2.0-S2212827116001268-main.pdf&_valck=1 (accessed on 17 February 2025). [CrossRef]
- Ghanim, J.; Issa, M.; Awad, M. An Asymmetric Loss with Anomaly Detection LSTM Framework for Power Consumption Prediction. arXiv 2023, arXiv:2302.10889. [Google Scholar]
- Kim, T.; Kwon, H.-Y. Correlation-Driven Multi-Level Multimodal Learning for Anomaly Detection on Multiple Energy Sources. arXiv 2023, arXiv:2305.02323. [Google Scholar]
- Liu, X.; Ding, Y.; Tang, H.; Xiao, F. A Deep Learning Framework for Electricity Fraud Detection. IEEE Trans. Smart Grid 2019, 10, 117–127. [Google Scholar]
- Gresoi, S. Enhancing Fraud Detection in Energy Distribution Using Data Mining Algorithms. In Proceedings of the 2023 International Conference on Computer Science and Control Systems (CSCS), Bucharest, Romania, 24–26 May 2023; IEEE: New York, NY, USA, 2023; pp. 288–294. [Google Scholar] [CrossRef]
- World Bank. Electricity Theft in Developing Countries: A Major Challenge. World Bank Report. 2023. Available online: https://www.worldbank.org/en/topic/energy/publication/electricity-theft (accessed on 17 February 2025).
- McKinsey & Company. The $96 Billion Energy Theft Problem and How to Combat It. McKinsey Report. 2023. Available online: https://www.mckinsey.com/industries/electric-power-and-natural-gas/our-insights/the-96-billion-energy-theft-problem (accessed on 17 February 2025).
- ANRE. Report on Electricity Losses in Romania’s Distribution Networks, 2023. National Energy Regulatory Authority. 2023. Available online: https://www.anre.ro (accessed on 17 February 2025).
- Delgaz Grid Distribution Company. Inspection Report on Unauthorized Energy and Gas Consumption, Iași County, 2024. Delgaz Grid. 2024. Available online: https://delgaz.ro/getattachment/cafc5d09-b5c5-4740-8753-b8ef6552dd86/Planul-de-dezvoltare-Delgaz-Grid-2024_2033.pdf (accessed on 17 February 2025).
- E.ON Romania. Fraud Detection Campaign in Electricity Consumption: Results from 2017–2023; E.ON Romania: Târgu Mureş, Romania, 2024; Available online: https://annualreport.eon.com/content/dam/eon-annualreport/documents/en/EON_GB23_engl_gesamt_final.pdf (accessed on 17 February 2025).
- Nagi, J.; Mohammad, A.M.; Yap, K.S.; Tiong, S.K.; Ahmed, S.K. Non-Technical Loss Analysis for Detection of Electricity Theft Using Support Vector Machines. In Proceedings of the 2008 IEEE 2nd International Power and Energy Conference (PECon 2008), Johor Bahru, Malaysia, 1–3 December 2008; pp. 907–912. [Google Scholar] [CrossRef]
- Gresoi, S.; Făgărășan, I.; Mocanu, Ș.; Stamatescu, G. Analysis of anomalies in fraud detection for Smart and Non-smart Grids. In Proceedings of the 24th International Conference on Control Systems and Computer Science (CSCS 2023), București, România, 24–26 May 2023; IEEE: New York, NY, USA, 2023; pp. 490–495. Available online: https://www.researchgate.net/publication/373206922_Analysis_of_anomalies_in_fraud_detection_for_Smart_and_Non-smart_Grids (accessed on 17 February 2025).
- Glauner, P.; Meira, J.A.; Valtchev, P.; State, R.; Bettinger, F. The Challenge of Non-Technical Loss Detection Using Artificial Intelligence: A Survey. Int. J. Comput. Intell. Syst. 2017, 10, 760–775. [Google Scholar] [CrossRef]
- Depuru, S.S.S.R.; Wang, L.; Devabhaktuni, V.; Manivannan, D. Smart Meters for Power Grid: Challenges, Issues, Advantages, and Status. Renew. Sustain. Energy Rev. 2011, 15, 2736–2742. [Google Scholar] [CrossRef]


Disclaimer/Publisher’s Note: The statements, opinions and data contained in all publications are solely those of the individual author(s) and contributor(s) and not of MDPI and/or the editor(s). MDPI and/or the editor(s) disclaim responsibility for any injury to people or property resulting from any ideas, methods, instructions or products referred to in the content. |
© 2025 by the authors. Licensee MDPI, Basel, Switzerland. This article is an open access article distributed under the terms and conditions of the Creative Commons Attribution (CC BY) license (https://creativecommons.org/licenses/by/4.0/).