Article

Assessment of Structural Integrity Through On-Site Decision-Making Analysis for a Jacket-Type Offshore Platform

by
Rodrigo Daniel Álvarez Bello Martínez
,
Juan Antonio Álvarez-Arellano
and
Youness El Hamzaoui
*
Facultad de Ingeniería, Universidad Autónoma del Carmen, Campus III, Avenida Central S/N, Esq. con Fracc. Mundo Maya, Ciudad del Carmen C.P. 24115, Campeche, Mexico
*
Author to whom correspondence should be addressed.
Appl. Sci. 2025, 15(7), 3418; https://doi.org/10.3390/app15073418
Submission received: 4 January 2025 / Revised: 28 February 2025 / Accepted: 8 March 2025 / Published: 21 March 2025

Abstract

:
This paper presents a comprehensive on-site decision-making framework for assessing the structural integrity of a jacket-type offshore platform in the Gulf of Mexico, installed at a water depth of 50 m. Six critical analyses—(i) static operation and storm, (ii) dynamic storm, (iii) strength-level seismic, (iv) seismic ductility (pushover), (v) maximum wave resistance (pushover), and (vi) spectral fatigue—are performed using SACS V16 software to capture both linear and nonlinear interactions among the soil, piles, and superstructure. The environmental conditions include multi-directional wind, waves, currents, and seismic loads. In the static linear analyses (i, ii, and iii), the overall results confirm that the unity checks (UCs) for structural members, tubular joints, and piles remain below allowable thresholds (UC < 1.0), thus meeting API RP 2A-WSD, AISC, IMCA, and Pemex P.2.0130.01-2015 standards for different load demands. However, these three analyses also show hydrostatic collapse due to water pressure on submerged elements, which is mitigated by installing stiffening rings in the tubular components. The dynamic analyses (ii and iii) reveal how generalized mass and mass participation factors influence structural behavior by generating various vibration modes with different periods. They also include a load comparison under different damping values, selecting the most unfavorable scenario. The nonlinear analyses (iv and v) provide collapse factors (Cr = 8.53 and RSR = 2.68) that exceed the minimum requirements; these analyses pinpoint the onset of plasticization in specific elements, identify their collapse mechanism, and illustrate corresponding load–displacement curves. Finally, spectral fatigue assessments indicate that most tubular joints meet or exceed their design life, except for one joint (node 370). This joint’s service life extends from 9.3 years to 27.0 years by applying a burr grinding weld-profiling technique, making it compliant with the fatigue criteria. By systematically combining linear, nonlinear, and fatigue-based analyses, the proposed framework enables robust multi-hazard verification of marine platforms. It provides operators and engineers with clear strategies for reinforcing existing structures and guiding future developments to ensure safe long-term performance.

1. Introduction

The primary function of fixed offshore platforms in the Gulf of Mexico is hydrocarbon extraction, producing approximately 1.718 million barrels of oil daily [1]. These production volumes position Mexico as a significant oil-producing country, with crude oil exports reaching 831 thousand barrels per day, valued at 1.715 billion dollars [2,3].
Mexico faced a decline in oil production, which was halted in 2019. To counteract this trend, Pemex’s General Strategy for Oil and Gas Exploration and Production established strategic objective 3.1, aimed at accelerating the development of newly discovered fields, with an expected liquid production of 554 thousand barrels per day. Additionally, objective 2.3 focused on enhancing the recovery of mature and new wells, targeting a total hydrocarbon production of 2.319 million barrels per day by 2027 [4]. Consequently, the need to install new drilling platforms in both existing and future fields has emerged. From a civil engineering perspective, designing and constructing structures that support exploration and production activities remains a critical challenge, balancing cost-effectiveness and safety.
The analysis, design, and construction of offshore platforms demand specialized expertise due to their exposure to harsh marine environments. These structures must withstand extreme loads, including hurricanes with wave heights of up to 16 m, seismic events, drilling equipment loads exceeding 5000 tons, hydrostatic collapse due to pressure, and fatigue in tubular joints induced by wave action over time. Given the continued necessity for offshore installations in Mexico and globally, literature resources such as Ageing and Life Extension of Offshore Structures [5] provide valuable insights into structural durability and maintenance.
Regarding the structural performance of tubular joints, various experimental studies have been conducted to assess their strength under different loading conditions. For instance, Murilo A. Vaz [6] examined the ultimate compressive strength of perforated offshore tubular members, demonstrating that resistance assessments remain consistent under different loading scenarios, while penetration capacity varies with applied loads. Experimental studies concluded that the high strength of core concrete is beneficial for the durability of thin-walled CFST stub columns [7]. Furthermore, fatigue analysis plays a crucial role in predicting the lifespan of tubular joints. Probabilistic methods have been implemented to optimize inspection planning for offshore structures, including fixed and floating platforms as well as jack-up drilling rigs [8]. Fatigue analysis, based on S–N curves, allows for the prediction of crack initiation and propagation. Notably, DNV GL has conducted a joint industry project to develop probabilistic methods for in-service inspection planning for fatigue cracks, the findings of which are now incorporated into recommended practices [9]. Additionally, extending the service life of existing platforms remains a growing challenge in the oil industry, necessitating advanced fatigue analysis models that incorporate precise corrosion parameters [10].
Fatigue behavior has also been extensively studied in various marine structures at different depths. Researchers have proposed models characterizing damage as either a Gaussian or narrow-band process, depending on the variable amplitude loading induced by waves [11]. Moreover, advanced 3D finite element (FE) fatigue analysis, based on constitutive equations and continuum damage mechanics, has been shown to be an effective tool for evaluating large and complex structures before installation, ensuring their safety and stability [12]. Elliptical surface cracks have been analyzed in finite elements [13].
Beyond offshore platforms, fatigue effects have been investigated in other steel structures, such as ship hulls and hydropower pipelines. Studies have explored ship service life extension strategies by assessing the structural condition and remaining design life [14]. Similarly, analytical models considering stress concentration in welded joints with angular distortions have been developed to estimate fatigue life in hydropower pipelines, incorporating the effects of water hammer damping [15].
Current research also emphasizes the importance of structural integrity assessment in offshore jacket structures, recognizing the complexities beyond initial assumptions. Challenges such as nonlinear effects in structural monitoring methods, particularly those based on principal component analysis, have been identified. A stochastic autoregressive moving average with exogenous input (ARMAX) models has been employed to address these challenges [16]. Additionally, stress concentration factors (SCFs) in ring-stiffened tubular KT-joints have been studied, leading to new SCF parametric formulas for fatigue design [17,18]. Indirect damage detection methods, such as wavelet packet transform analysis, have demonstrated high accuracy in predicting damage locations in offshore jacket platforms [19]. Furthermore, recent developments include time-domain fatigue analysis methods that require fewer sea state simulations while maintaining accuracy in offshore jacket platform assessments [20]. The Damage Submatrices Method, which focuses on stiffness degradation, has also been effectively applied for damage detection in offshore jacket structures with limited modal information [21].
Another area of research involves assessing the structural integrity of aging offshore platforms for life extension, incorporating structural degradation simulations, loading history, and fatigue strength considerations for corroded components [22]. Some studies have analyzed tubular K-joints under fire-induced elevated temperatures using nonlinear regression methods to determine their ultimate strength under axial loading [23].
Moreover, risk assessment methodologies have been applied to floating production platforms to evaluate structural integrity loss due to gross errors [24], as well as to offshore mooring systems using reliability- and integrity-based design principles [25]. Risk-based structural integrity management frameworks have been developed specifically for offshore jacket platforms [26]. Despite these advancements, a comprehensive comparative analysis of different methodologies—linear, nonlinear, and fatigue analysis—has not been conducted. The present study aims to address this gap by providing a comparative assessment of these methods.
Additionally, probabilistic wave analysis frameworks have been proposed to improve structural integrity assessment in offshore platforms, accounting for uncertainties in nonlinear dynamic time-domain modeling [27]. Large-scale experimental investigations on wave slam phenomena have contributed to the development of global slamming force models for offshore wind jacket structures [28]. Furthermore, grouted connection repair systems for offshore structures have been experimentally validated [29].
Given the increasing emphasis on renewable energy sources, researchers have highlighted the necessity of designing offshore structures for oil and gas exploration, wind energy generation, and other industries while minimizing environmental impact [30]. Surveys conducted among industry experts identified three critical factors influencing offshore platform inspections: environmental conditions, structural design, and defects/anomalies, with varying significance depending on professional perspectives [31].
The findings of this research enable continuous monitoring of platform behavior under different loading scenarios, ensuring compliance with the current regulations and verifying the structural integrity. Ultimately, this assessment confirms that offshore platforms meet safety and reliability standards throughout their service life.
In addition, research has been conducted to obtain meteorological data related to wave conditions by comparing satellite-derived information to data from specific locations in the Arabian Gulf [32]. This experimental study presents the development of a global slamming force model to predict wave-induced loads on offshore wind jacket structures, utilizing statistical analyses of experimental data from the WaveSlam project [33].
A recent study incorporated site-specific meteorological and oceanographic parameters into the analysis process, including wave data simulated via WAVEWATCH III (version 4.18), with uncertain parameters accounted for in the input data. Long-term load distribution parameters were localized to determine the platform’s Probability of Failure (PoF) due to extreme wave loading. Additionally, the structural damage rate was evaluated based on the most recent underwater inspection conducted in the oilfield under study [34].
Despite the extensive body of research, a notable gap remains: no studies have explicitly applied six distinct analytical methods—including three linear analyses, two nonlinear analyses, and spectral fatigue analysis—to evaluate the structural integrity of jacket-type offshore platforms based on in situ data. In Mexico, no research has yet examined structural behavior under different loading conditions, such as hurricanes, earthquakes, and fatigue, using a drilling platform installed at a 50 m water depth. Therefore, the primary contribution of this study is to propose a methodology for conducting six on-site analyses (static operation and storm analysis, dynamic storm analysis, strength-level seismic analysis, ductility-level seismic analysis, ultimate wave resistance analysis, and spectral fatigue analysis) to determine the structural integrity of jacket-type offshore drilling platforms in Mexican waters.

2. Materials and Methods

For the development of this study, a comprehensive review of previous research on jacket-type fixed offshore platforms, as well as the current regulations applicable to the Gulf of Mexico, was conducted. To define the case study, a drilling platform was considered, featuring a 50,400 m tie-back and the capacity to accommodate 12 conductors. These conductors will be drilled using fixed equipment, and the platform will include two decks for production and drilling operations. The structural components of fixed offshore platforms comprise piles, the jacket, and the topside. The primary loads acting on these structures include gravity and environmental loads, as illustrated in Figure 1 and detailed in Table 1.
Environmental loads are dependent on the meteorological and oceanographic conditions of the region, with waves, currents, and wind being the most significant factors. The characteristics of these loads are defined according to the guidelines provided in API RP 2A-WSD 22nd Edition [35] and supplemented by the environmental parameters established in the Pemex technical specification P.2.0130.01-2015 [36]. The generated loads are static forces applied to the structure in eight directions, spaced at 45° intervals. Table 2 presents the environmental parameters considered for operational and storm conditions, as well as for ultimate surge resistance.
The values in Table 2 are based on the selection of an appropriate stream function, which is generally assumed according to the stream function defined by Equation (1).
ψ ( x , y ) = C z + n = 1 N x n s i n h n k z + d z + d c o s ( n k x )
where N represents the order of the stream function and k denotes the wave number. In the case of regular stream function theory, the input parameters include wave height, period, and water depth, similar to other wave theories. Conversely, for irregular stream function theory, the free surface profile over a single wave cycle serves as a constraint.
Specific solutions to Equation (1) are employed depending on the analytical approach. Linear wave theory is applied to steady-state wave analysis, fatigue assessments, and conditions involving regular and uniform waves, particularly for floating and fixed structures where inertial effects predominate. Second-order Stokes theory is recommended for analyzing tendons in Tension Leg Platform (TLP) structures, while stream function theory or fifth-order Stokes theory is applicable to storm wave conditions. Further discussions on specific solutions and their applicability are provided in references [37,38,39]. The appropriate order of the stream function theory for a given application should be selected based on the data presented in Figure 5.3 of API RP 2A WSD 22nd Edition [35].
Furthermore, additional parameters such as drag coefficients, blockage factors, marine growth, and shape coefficients were considered, as detailed in Table 3.
To assess the structural integrity of the platform, six on-site analyses are required, categorized into three groups: (1) Linear analyses, including operational and static storm conditions, dynamic storm conditions, and earthquake resistance levels; (2) Nonlinear analyses, covering ultimate surge resistance and earthquake ductility levels; and (3) Spectral fatigue analysis, as summarized in Figure 2.
The operational and static storm analysis is conducted in a single step, whereas the dynamic storm, seismic resistance level, and spectral fatigue analyses follow a stepwise process to obtain the results. The ultimate wave resistance and seismic ductility-level analyses are performed using the pushover method. The results of these assessments are illustrated in Figure 3 and detailed in Table 4.

3. Linear Analysis

3.1. Linearization of the Foundation (Applicable to Dynamic Storm, Seismic Resistance, and Fatigue Analysis)

Since the analyses are dynamic in nature and performed using SACS V16 software, it is essential to model the soil–pile interaction in a linear manner, despite its inherently nonlinear behavior. Consequently, the foundation must be linearized. This process involves the creation of fictitious “super-elements” at the head of each pile, designed to approximate the equivalent nonlinear behavior of each pile head through a linear stiffness matrix. These matrices are obtained using SACS software.
It is important to note that this linearization is exclusively applied for modal extraction analysis (i.e., periods and mass participation factors). However, for final results, the soil–pile interaction is explicitly considered.

3.2. Determination of Dynamic Properties (Applicable to Dynamic Storm, Seismic Resistance, and Fatigue Analysis)

To determine the dynamic properties of the structure, a dynamic analysis was executed within the Dynpac module of SACS software. This module employs a set of master nodes with user-assigned degrees of freedom to extract dynamic characteristics, including Eigenvalues (natural periods) and Eigenvectors (mode shapes), using the standard Householder–Givens extraction technique. The stiffness and mass matrices are reduced to master nodes via standard matrix condensation and Guyan reduction methods under the assumption that stiffness and mass are similarly distributed. Non-inertial degrees of freedom (i.e., those without mass) must be classified as slave nodes. In this study, master nodes were assigned within the structural model at intersection points of the alphabetic and numerical axes at each bracing level. These nodes define the system configuration and mass distribution, ensuring that all stiffness and mass properties associated with slave nodes are included in the Eigen extraction procedure.
Several studies have been conducted on the dynamic behavior of platforms, comparing the periods obtained from scaled models to those from computational models [40,41,42,43], as well as instrumentation for damage detection [44] and vibration studies in offshore marine turbines. However, these studies do not address the potential variations in results based on the definition of master nodes.
Master nodes play a crucial role in mass concentration within the structural model, affecting the calculation of natural periods, mode shapes, and mass participation factors. This study evaluates three structurally identical models with different master node configurations, highlighting their influence on the results:
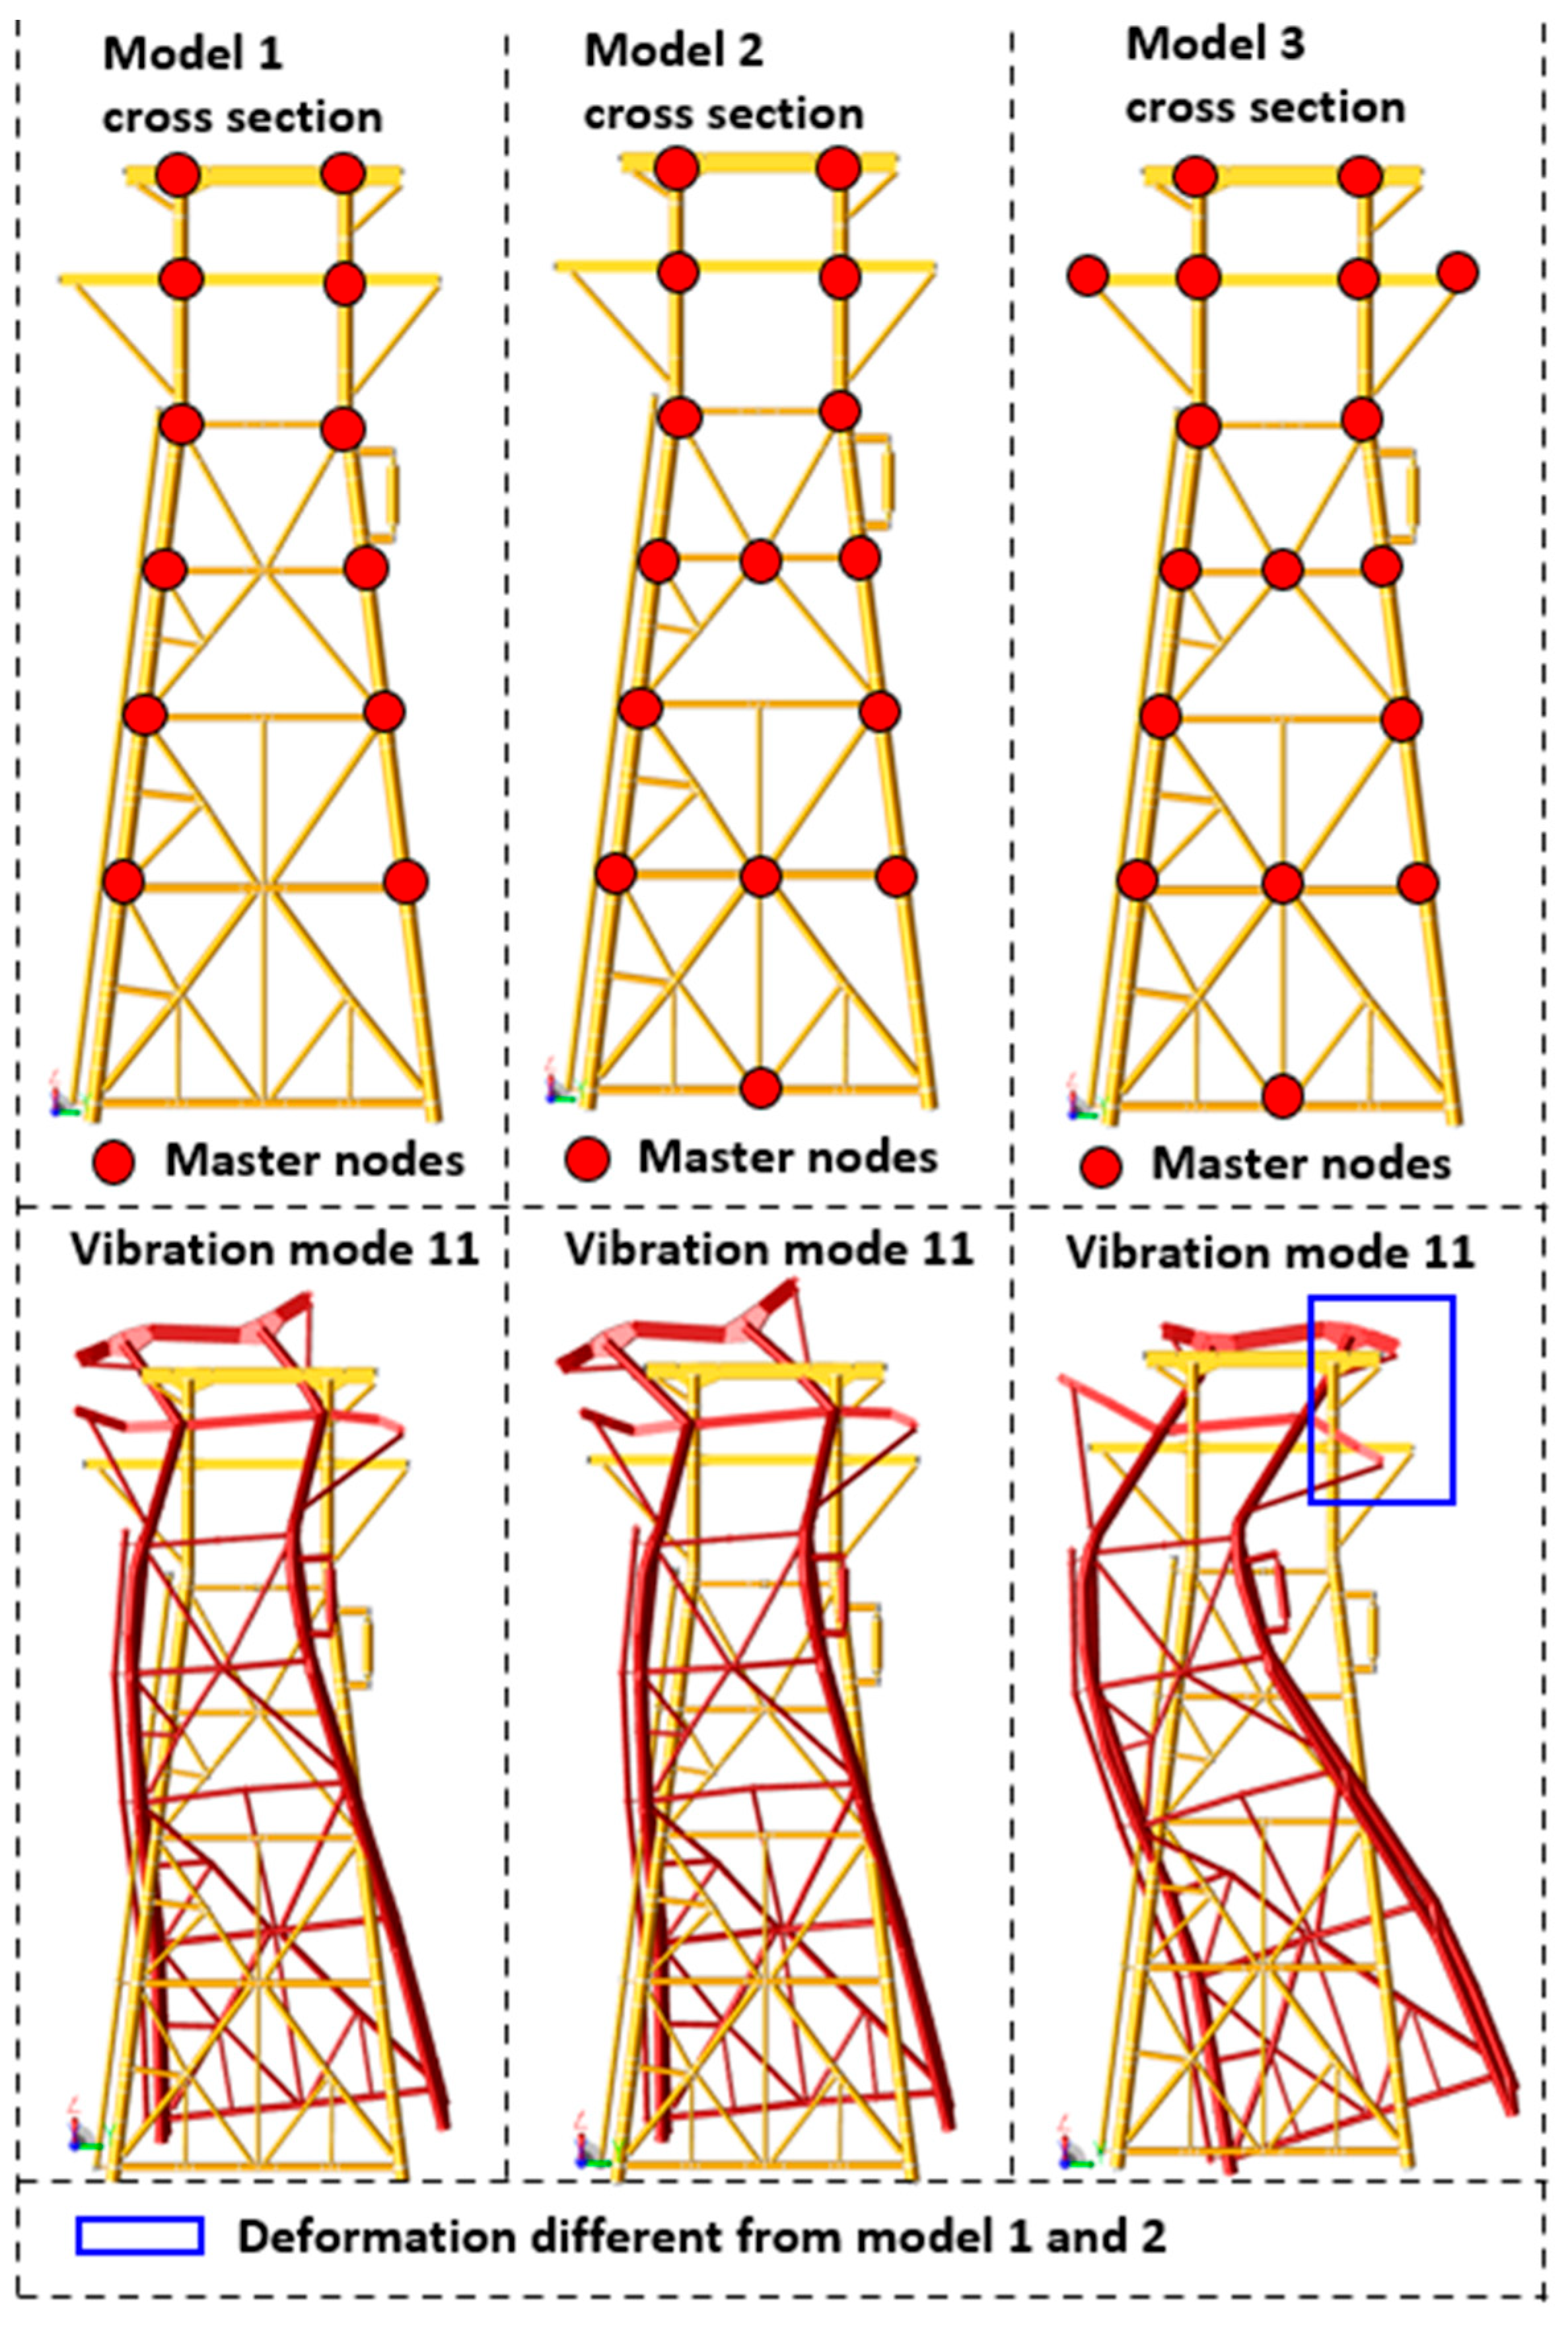
  • Model 1: Masses concentrated solely at axis intersections.
  • Model 2: Masses concentrated at axis intersections and x-brace connections of the jacket.
  • Model 3: Similar to Model 2, but with additional mass concentrations on diagonal members supporting cantilevers in the topside (see Figure 4). This figure also illustrates the platform deformation in mode 11, revealing similar deformation patterns across models.
Table 5 presents the periods and mass participation factors for the first 30 modes across all three master node configurations. Key observations include the following:
  • The highest natural period across all models is 2.70 s along the X-axis, with mass participation factors exceeding 83%.
  • Along the Y-axis, the highest period is approximately 2.5 s, with mass participation factors around 79%.
  • In the Z-axis, the maximum mass participation factor occurs in mode 11 for Models 1 and 2, whereas for Model 3, it occurs in mode 12. These variations influence the final results, as detailed in Section 5.3.

3.3. Structural Evaluation Under Dynamic and Spectral Loading Conditions

3.3.1. Dynamic Storm Analysis—Wave Response

To evaluate the dynamic response to forces induced by water particle velocity and acceleration due to wave and current action, equivalent static loads are generated to represent these hydrodynamic effects. These loads encompass both hydrodynamic and inertial components:
  • Inertia loads are derived from modal accelerations.
  • Hydrodynamic loads account for forces exerted by fluid motion and platform interaction.
The equivalent loads are determined using the “equivalent static load” method within the “Wave Response” module of SACS software. This module generates a file containing equivalent static loads for each wave and current incidence angle under storm conditions specified in the on-site analysis. These loads are subsequently combined with gravity and wind loads for the final static analysis.

3.3.2. Resistance-Level Analysis—Spectral Modal Seismic Analysis

SACS’ dynamic response module computes the structural response to base motion excitation, such as seismic activity, by generating equivalent static seismic forces. In this study, 20 different seismic directions were analyzed at 18° intervals to determine the most critical loading directions.
The Response Spectrum Method was applied using the design spectrum outlined in Table 6. Modal responses were combined using the complete quadratic combination (CQC) method and the square root of the sum of the squares (SRSS) method. The spectrum was applied simultaneously in two orthogonal horizontal directions and at 50% in the vertical direction. According to the Pemex technical specification “P.2.0130.01-2015” [36], the resistance-level analysis was conducted using acceleration spectrum loads.
Damping factors significantly influenced the analysis results. A 5% structural critical damping was considered, as prescribed in API RP-2A-WSD (Section 5.3.6.3.2) [35]. Table 7 compares load results for 5% damping (as per Pemex specifications) and 2% damping, revealing that vertical loads at 2% damping (1314.98 tons) are lower than those at 5% damping (1509.55 tons). Consequently, structural analysis was performed using the more conservative 5% damping results.

3.3.3. Spectral Fatigue Analysis—Transfer Functions

A transfer function characterizes the relationship between stress range cycles and wave height as a function of frequency for each wave direction. The stress range, defined as the difference between maximum and minimum stress in each cycle, was determined for 18 wave incidence directions at 22.5° intervals (see Figure 5).
Transfer function values were obtained by dividing stress amplitudes by the corresponding wave height, linking sea states (wave and period) to critical stress amplitudes. Wind-induced cyclic loading was also considered, with mechanical transfer functions defined per mode. The transfer function H(f) quantifies the stress range as a function of wind frequency and natural mode frequency, given by Equation (2).
H f = 1 K i 1 f f n 2 2 + 2 c f f n 2 1 2
where:
  • H ( f ) is the frequency-dependent transfer function.
  • K i is the generalized stiffness.
  • f is the excitaion frequency.
  • f n is the natural frequency of the system.
  • c is the damping ratio.
The transfer functions were computed at increments of 22.5° and correspond to the total vectors of the oceanographic information provided in Table C.9 of the Pemex specification [36], which includes areas such as May, Yum, and Coastal. It is essential to determine the structural response to wave loads for each direction. Consequently, 16 independent transfer functions were required, each corresponding to a specific wave propagation direction. For this purpose, the orientation of the structure relative to both the North direction and the X–Y coordinate system of the model was taken into account.
A total of 40 wave cases were considered, beginning with six waves characterized by a period of 12.5 s, followed by period decrements of 1.0 s. Subsequently, four additional waves were introduced, starting at 6.5 s and separated by 0.5 s intervals. To capture the dynamic behavior of the structure near its natural frequencies, a refined distribution of wave periods was applied. This includes 4, 7, 7, 6, and 6 waves, with period decrements of 0.2, 0.15, 0.05, 0.1, and 0.2 s, respectively. The corresponding starting periods for these waves are 4.5, 3.7, 2.75, 2.35, and 1.7 s. This approach ensures a comprehensive evaluation of the structural response to wave-induced loading, particularly in the frequency ranges that may induce resonance phenomena.

4. Nonlinear Analysis (Pushover)

The analysis was conducted by incrementally applying a load until the platform reached its collapse mechanism, utilizing the nonlinear pushover method. This approach was implemented through the “Collapse” module of the SACS program, which accounts for structural and foundation nonlinearity. The primary outcome of this analysis is the determination of the Resistance Reserve Factor (RSR), which quantifies the relationship between the lateral base shear at structural failure (ultimate design wave resistance) and the reference shear derived from the design wave. The RSR must be evaluated for eight different wave incidence directions, with increments of 45°. In all cases, the computed RSR must exceed the minimum threshold specified in Standard [36] The methodology applied in each of the eight analyses is detailed below.

4.1. Ultimate Wave Resistance Analysis

The Reference Basal Shear was obtained from the analysis conducted under both Operational and Static Storm conditions, considering the eight directions of incidence for storm scenarios included in this study. The gradual application of gravity loads, including self-weight, dead loads, and live loads, was implemented in a stepwise manner. Typically, this is executed in 10 incremental steps, each corresponding to a 10% load increase.
For the ultimate strength analysis, meteorological loads were progressively applied. The initial load increments were set to 2%, requiring 40 steps to reach 80% of the design load. Subsequently, a refined analysis was performed in the critical range, using 140 additional steps with a 0.5% load increase per step, starting from 80% and extending to 150%, at which point structural collapse occurred. The 100% load level corresponds to the magnitude specified in Table A.1.1 of the Pemex standards [36] for ultimate strength assessment.
This study also involves the identification of the platform’s collapse mechanisms in each direction. Finally, the basal shear and the Reserve Strength Ratio (RSR) were determined for the meteorological conditions leading to platform failure.

4.2. Seismic Analysis by Ductility

The ductility analysis should be conducted using an ultimate strength approach, specifically employing an incremental load (pushover) method. The resistance coefficient Cr is defined as the ratio between the ultimate lateral load capacity of the platform prior to collapse determined through this analysis and the reference lateral load, which is calculated based on seismic resistance analysis. This evaluation was performed for 20 different directional occurrences. The analysis procedure is structured as follows:
  • The gravity load is incrementally applied in steps of 10% until reaching the total design gravity load (100%).
  • The seismic load is then applied in 5% increments until reaching 100% of the prescribed seismic load. Subsequently, the incremental application of the seismic load continues at 5% intervals until the collapse mechanism of the structure is fully developed.
This methodology ensures a systematic assessment of the platform’s ductile behavior, providing critical insights into its ultimate capacity and failure mechanisms under seismic excitation.

5. Results and Discussion

5.1. Operational and Static Storm Analysis

This analysis aims to verify the structural integrity of the offshore platform, ensuring compliance with all applicable regulations regarding loads and stress distributions in both the substructure and superstructure, as well as in the pile foundation system. The results are presented in terms of unity checks (UC), which represent the inverse of the factor of safety, defined as the ratio of the maximum design load to the allowable load. This is also referred to as the utilization ratio, where a UC value below 1.0 indicates that the component meets the required design criteria, as specified in Section 6.2 of API RP 2A WSD 22nd Edition [35].
The present analysis was conducted using the Structural Analysis Computer System (SACS), evaluating mechanical behavior in structural elements, stress ratios (UCs), pile foundation performance—including nonlinear soil–pile interaction, hydrostatic collapse, and joint strength assessments (both penetration-based and resistance-based). The evaluation adheres to API RP 2A WSD 22nd Edition [35], AISC, and IMCA standards. The results of the operational and static storm analyses are presented below, with a summarized overview in Figure 6.
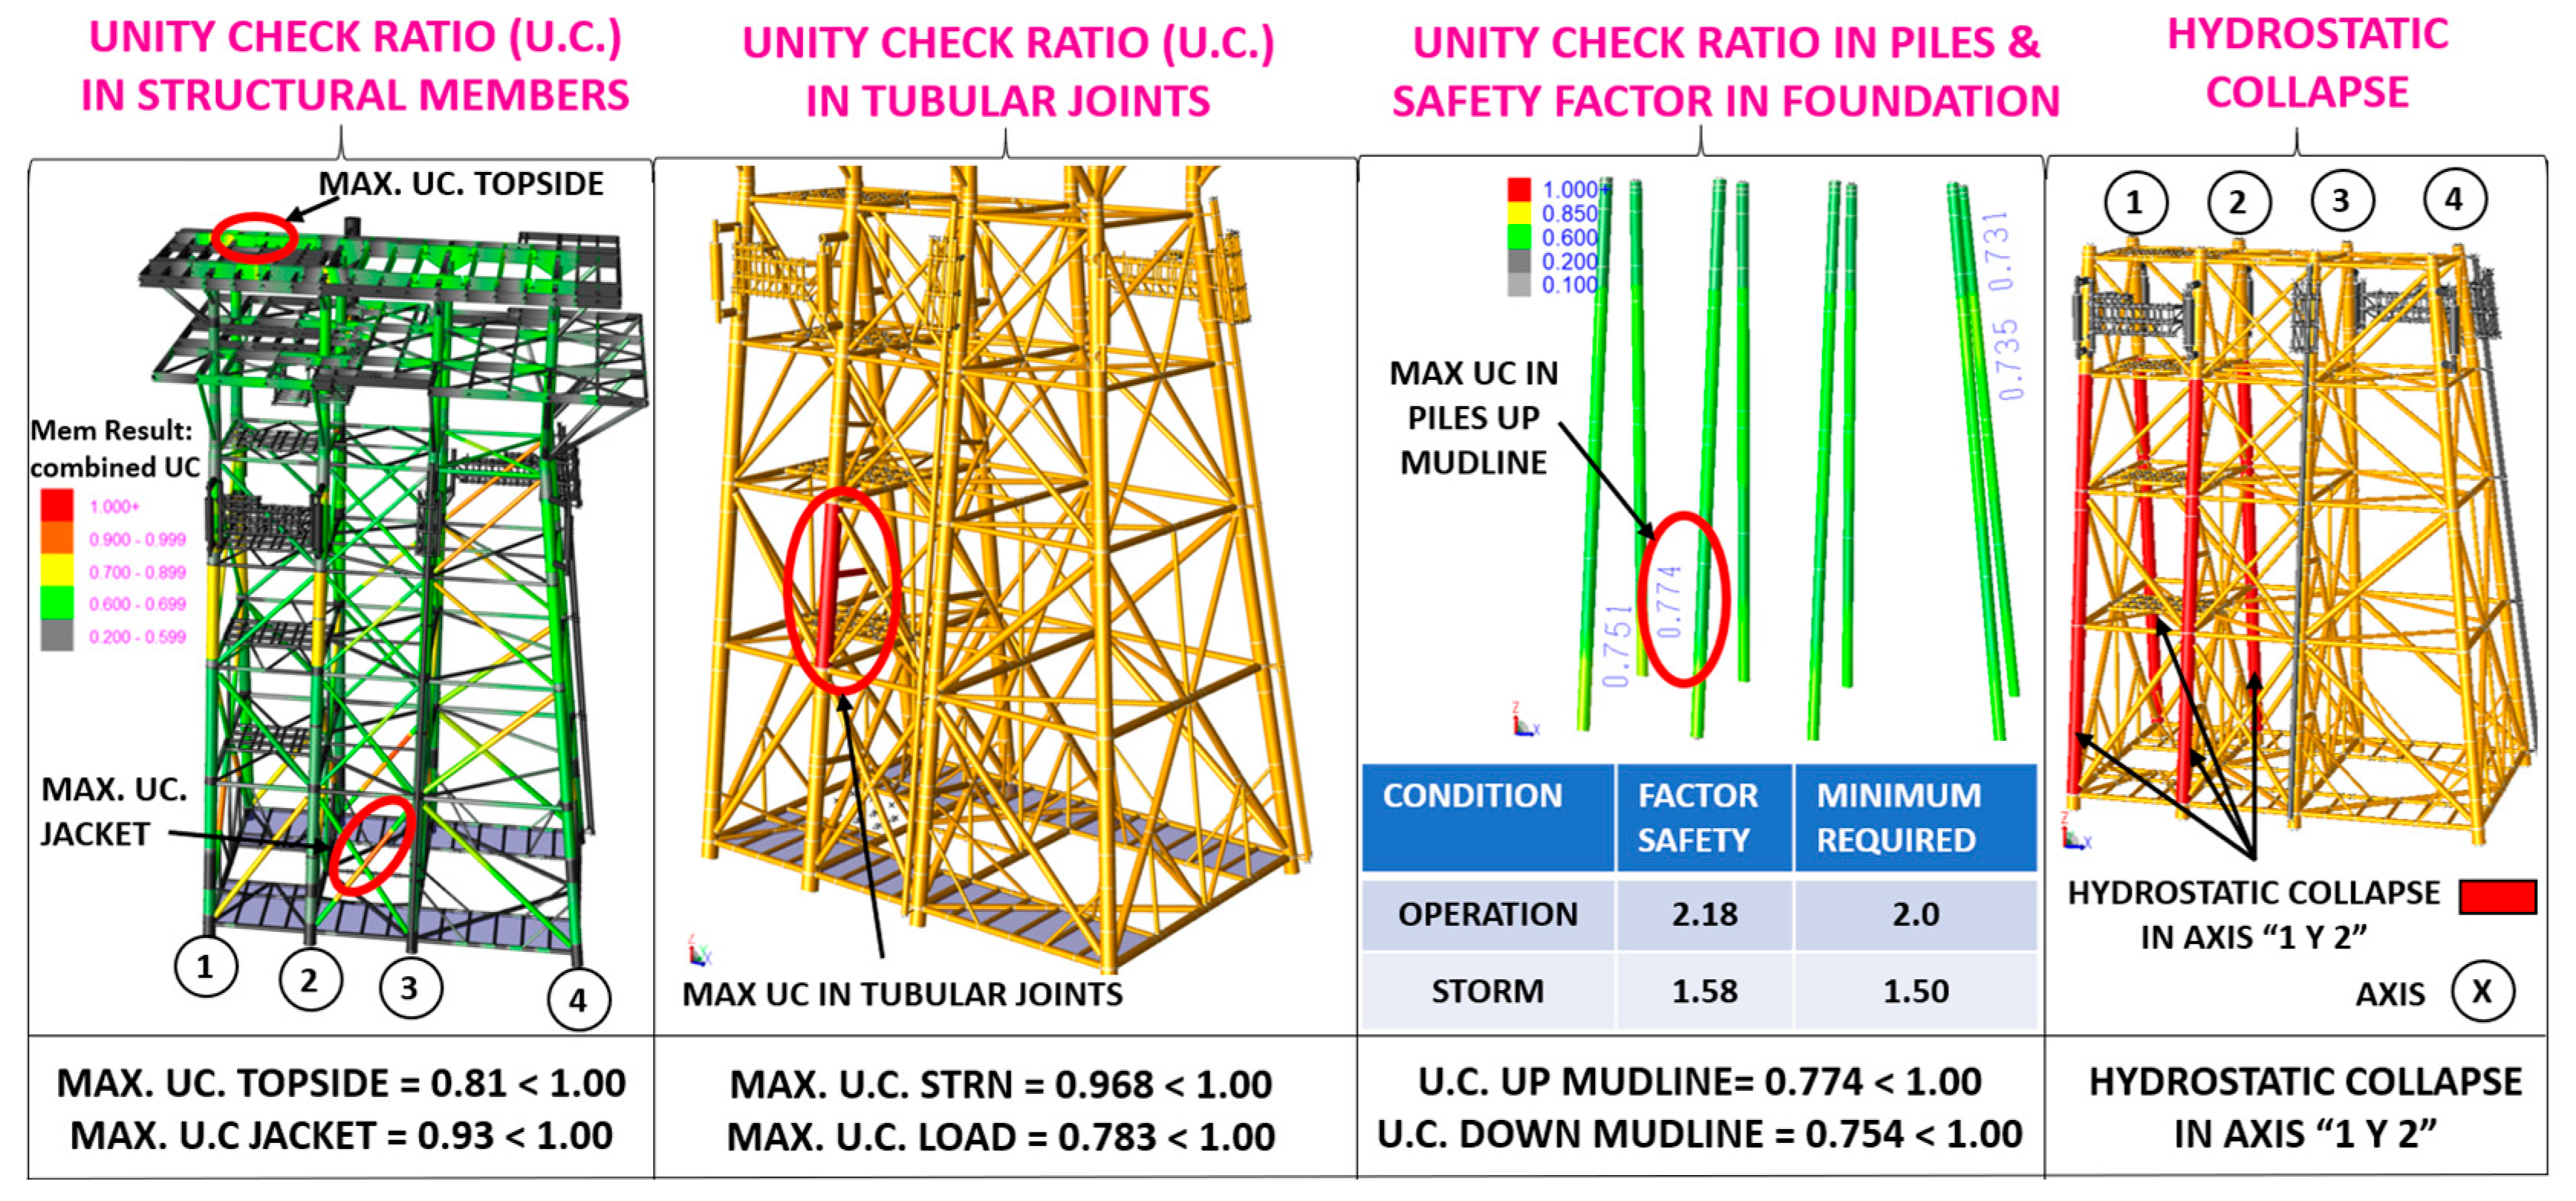
  • Stress Interaction and Unity Check (UC) Analysis. The maximum UC in the substructure (jacket) was found to be 0.93, while the maximum UC in the superstructure (topside) was 0.81, both of which are below the threshold value of 1.0, ensuring compliance with regulatory standards.
  • Tubular Joint Penetration Analysis. Tubular joints were evaluated for penetration load and structural resistance (STRN), with results of 0.968 and 0.783, respectively. Since both values are below unity, they comply with the current standards.
  • Pile Stress Interaction and Load Safety Factors. The maximum UC for piles above the seabed (mudline) was 0.774, whereas for piles below the seabed, it was 0.754, both within the acceptable range. The axial load safety factors in the foundation exceeded the minimum regulatory requirements, with an operational value of 2.18 (>2.00 required) and storm condition value of 1.58 (>1.50 required), confirming compliance with industry standards.
  • Hydrostatic Collapse Assessment and Mitigation Strategies. Localized overstress was identified in the columns along axes 1 and 2, necessitating corrective measures. The following solutions are recommended based on platform status:
    -
    For pre-installed but uninstalled structures: Reinforcement using 1.00-inch (25.4 mm) thick rings with a 12-inch (305 mm) spacing, as guided by SACS redesign recommendations. However, this approach may be impractical for installed structures due to the high cost of underwater welding.
    -
    For structures in the design phase: Modifications include increasing pipe thickness or incorporating anchor bolts to enhance structural resistance.
    -
    For installed structures: Cementing the affected elements can enhance structural properties and mitigate hydrostatic collapse risks.
It is important to note that this document presents a structural assessment and potential solutions. The final decision on the optimal technical and economic approach will be determined by the structural engineering team. In this case study, the implementation of hydrostatic collapse rings was selected as the preferred solution.

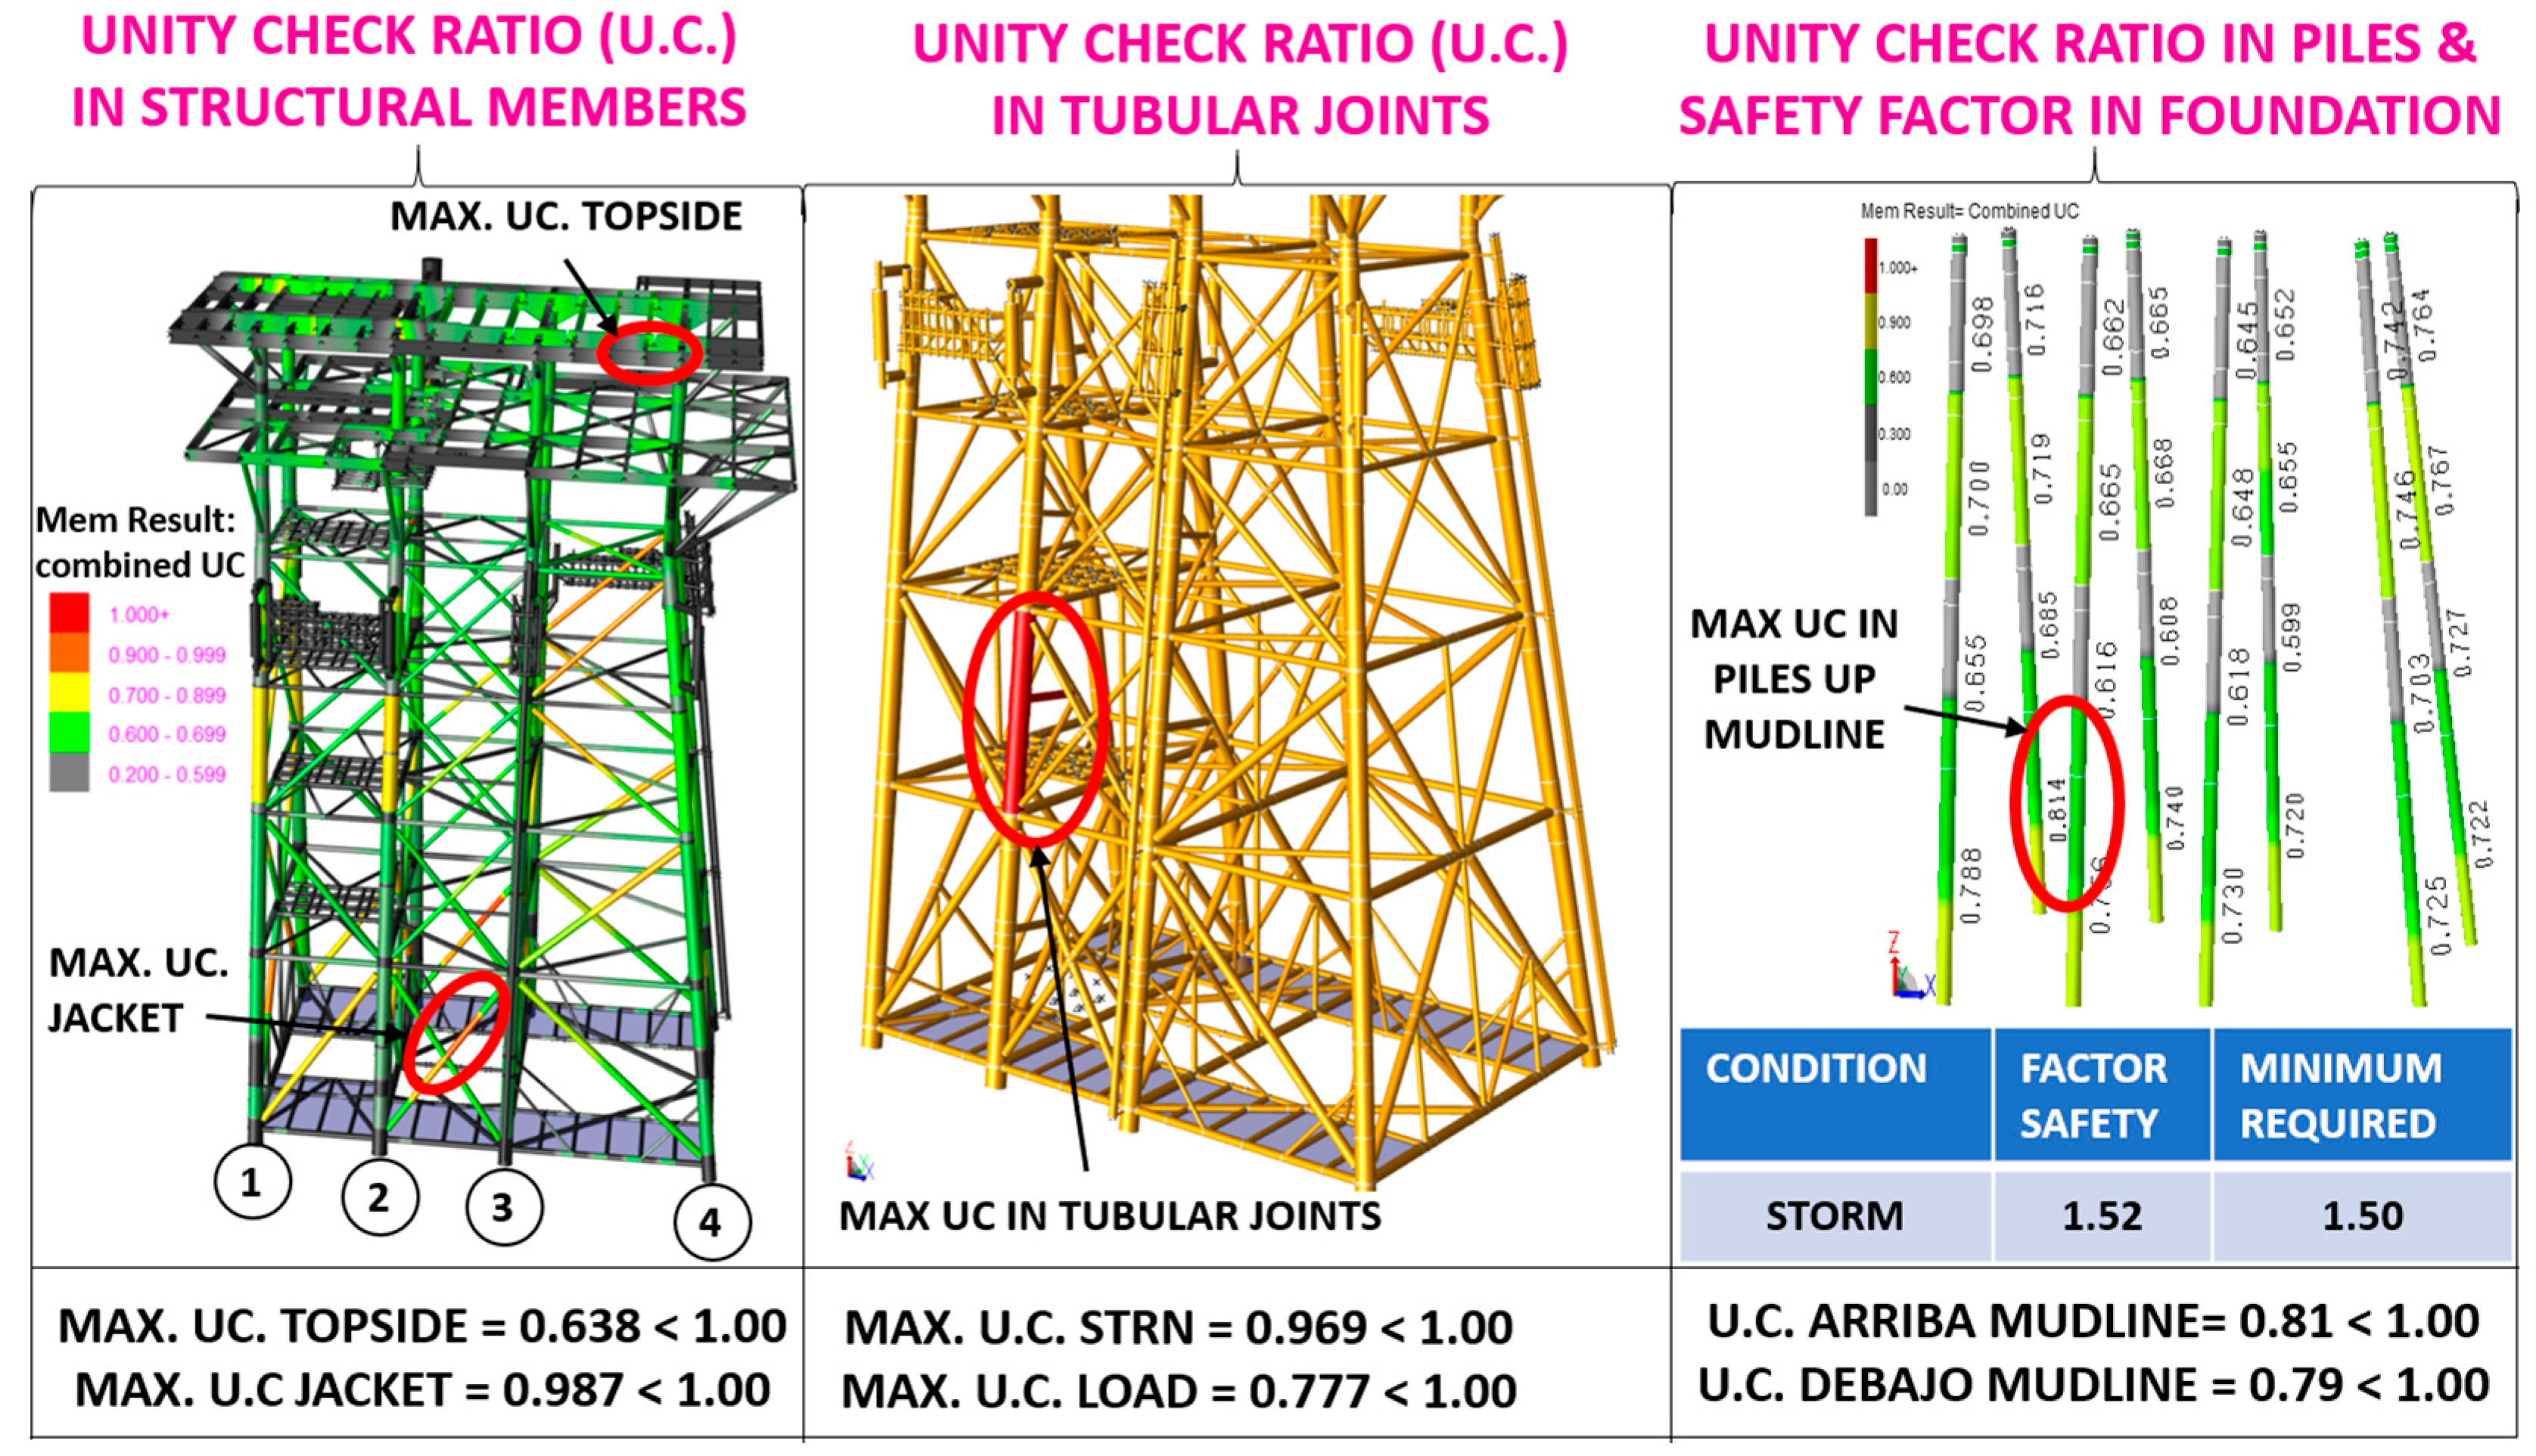
5.2. Dynamic Storm Analysis

Due to the height of the structure, as well as its stiffness and mass distribution, it can be classified as an “inverted pendulum” system, meaning that a significant portion of its mass is concentrated at the top. Consequently, its dynamic behavior exhibits a pronounced tendency to “pitch” when subjected to wave loads. When waves impact the structure, it deforms in the same direction as the wave propagation.
The Utilization Coefficient (U.C.) stress interaction ratios were assessed across different structural components. The maximum U.C. in the substructure (jacket) was found to be 0.987, while in the superstructure, it reached 0.638. In both cases, the U.C. values remain below unity, thereby demonstrating compliance with the applicable regulatory requirements (Figure 7).
Regarding tubular joint penetration, evaluations were performed for both penetration under loading conditions and structural resistance (STRN). The corresponding U.C. values were 0.777 and 0.969, respectively. Since these values remain below unity, the tubular joints conform to the current design standards.
For piles and load safety factors in the foundation, structural analyses were conducted to verify compliance. The maximum U.C. for piles above the seabed (mudline) was 0.81, while for piles below the seabed, it was 0.79. Both values are below unity, indicating that the pile system operates within safe stress limits. Additionally, the safety factor for axial load during storm conditions was determined to be 1.52, which exceeds the minimum required value of 1.50, further ensuring that the foundation meets the criteria established by the current design codes. The results are summarized in Figure 7.
The results indicate that the dynamic analysis yields more critical conditions compared to static operational and storm analyses. This discrepancy arises from the explicit consideration of the platform’s dynamic response, including its vibration modes and natural periods.

5.3. Seismic Resistance Analysis

The strength-level analysis is essential to ensure that the platform exhibits adequate strength and stiffness, thereby preventing significant structural damage during seismic events. The proposed seismic design acceleration spectra correspond to the envelope of the expected mean values of the maximum accelerations in the zone of interest, rather than the envelope of the absolute maximum accelerations. This condition necessitates an ultimate strength analysis to verify sufficient safety factors (reliability indices). At the strength level, the seismic design acceleration spectra are defined for a return period of 20 years. In this study, the most common reinforcement solutions for structural strengthening are presented as illustrative recommendations rather than exhaustive prescriptions.
Three identical models were developed, each differing in the configuration of master nodes (see Figure 4). The results indicate that the second model represents the most critical case for seismic design, with the following key findings:
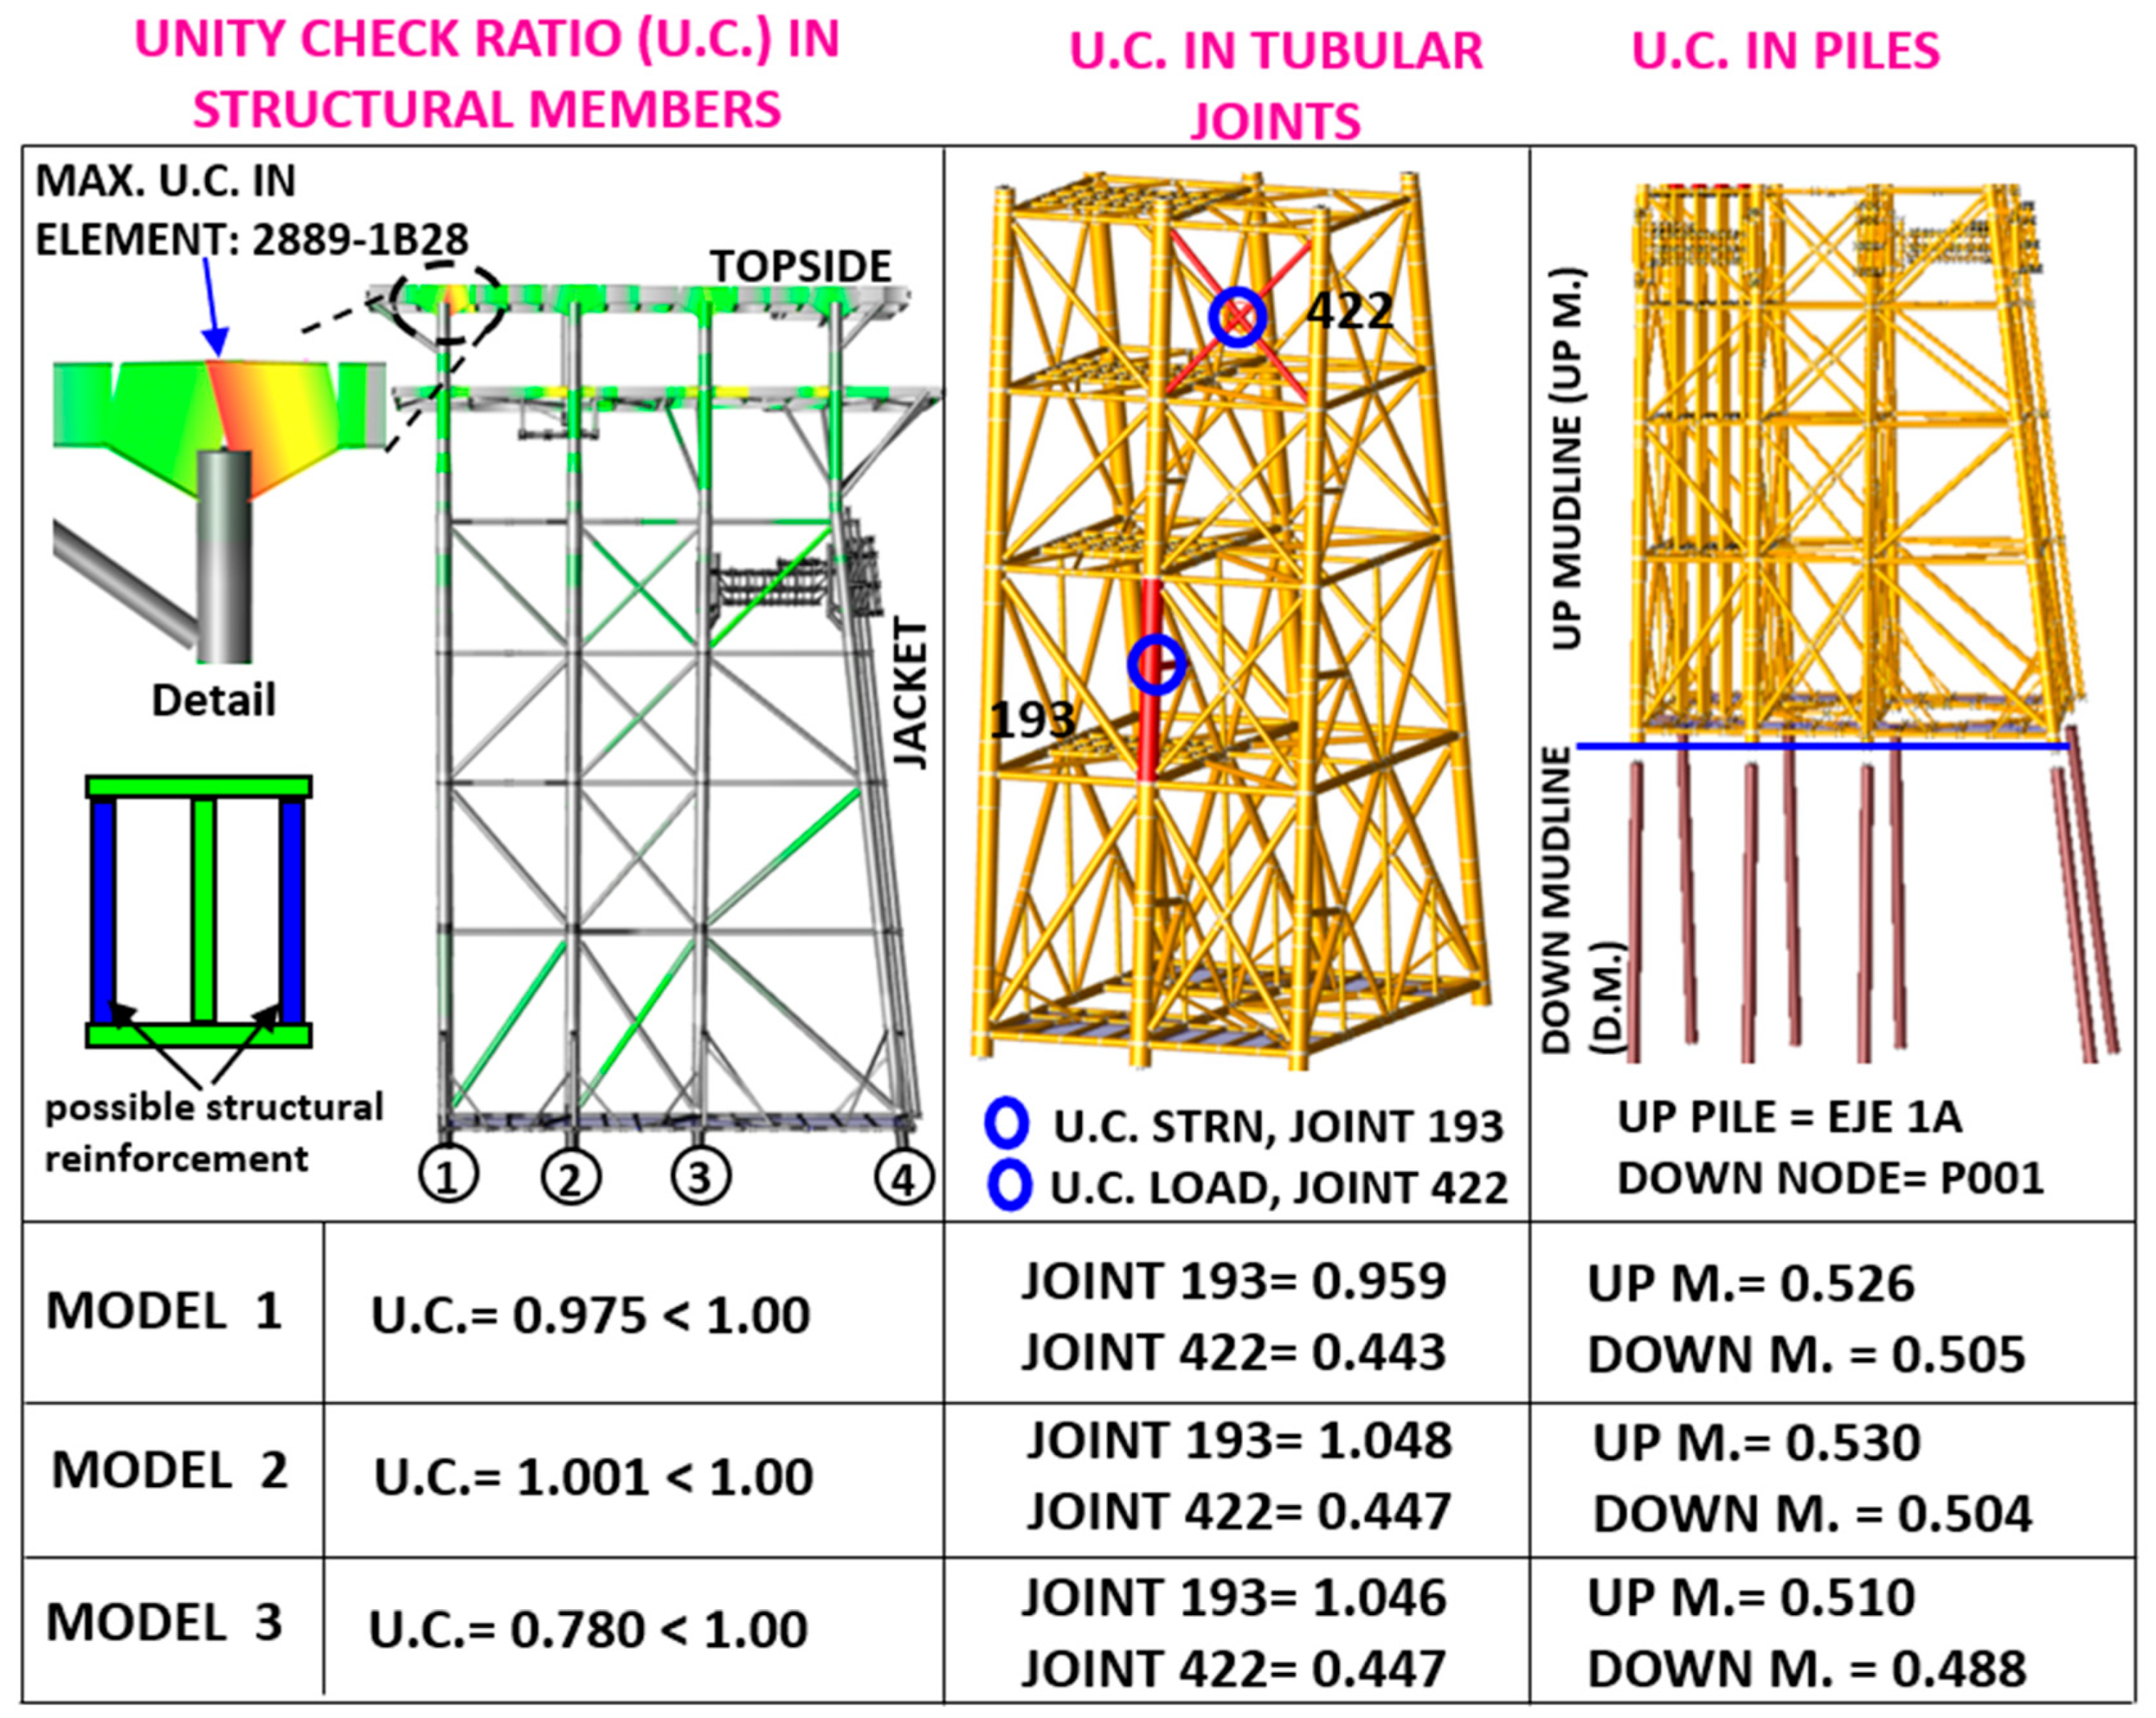
  • The maximum unity check (UC) occurs in element 2289-1B28, with a value of 1.001 > 1.00 (exceeding the allowable limit). To address this, the following reinforcement strategies are proposed:
    Increasing the thickness of the web or flange.
    Encasing the section with lateral plates to form secondary and tertiary webs at the extremities.
    Enhancing the yield strength of the material.
  • Regarding the assessment of tubular joints, joint 193 exhibits a U.C. of 1.048 > 1.00 (exceeding the allowable limit). The following strengthening solutions are recommended:
    Increasing the tube thickness.
    Reinforcing with stiffener plates.
    Injecting cementitious material inside the tube for additional stiffness and load-bearing capacity.
  • U.C. in Piles and Load Safety Factors in the Foundation. The piles were assessed to ensure compliance with design requirements. The maximum U.C. for piles above the seabed (mudline) was 0.530, whereas for those below the seabed, it was 0.504, with both values being within acceptable limits. Furthermore, the safety factor for axial load in the piles was 2.04 > 2.00 (meeting the minimum required threshold). These results confirm that the foundation adheres to the parameters established in the applicable design standards, as illustrated in Figure 8.

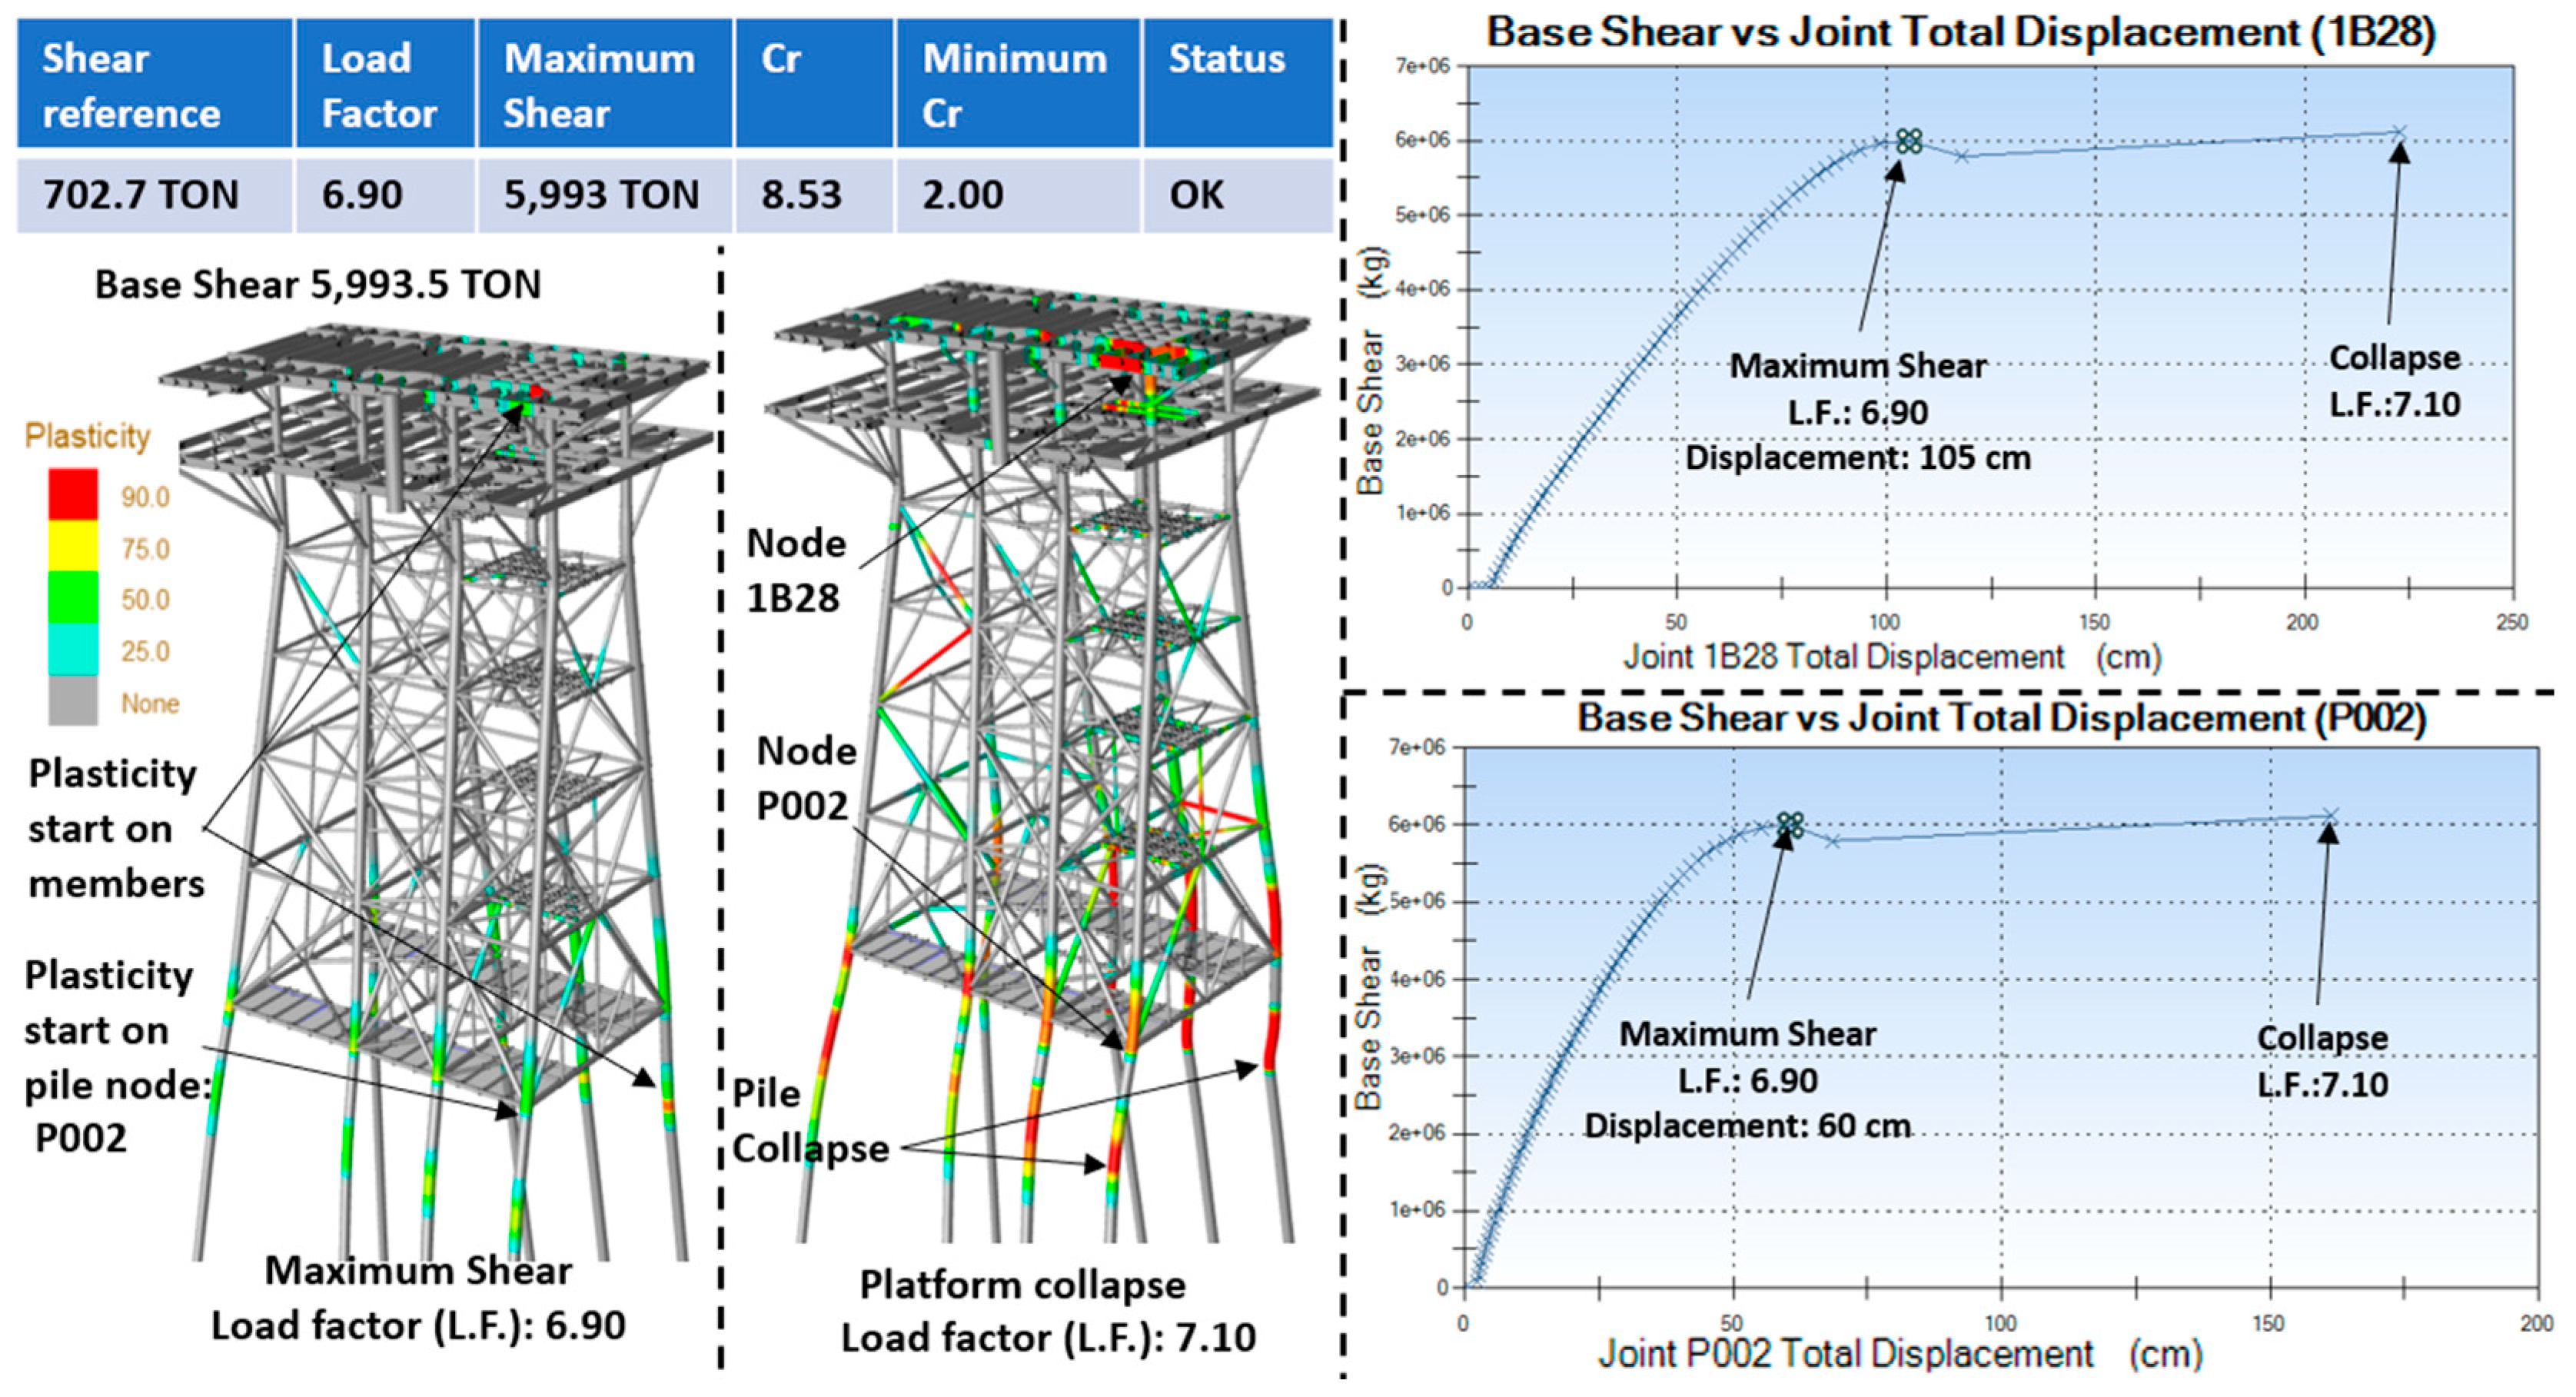
5.4. Results of Seismic Ductility Analysis

Seismic analysis by ductility is required to guarantee that the platform and its foundations can resist the equivalent of an earthquake of exceptional intensity; the aim is to determine the seismic reserve capacity factor (Cr) by an incremental analysis of gravity and seismic loads (pushover), which must comply with the current regulations (Table 11.3 [45]). The collapse mechanism that will occur in the structure can be known by applying incremental pushover analysis in the gravity and seismic loading conditions.
The seismic reserve capacity factor (Cr) represents the capacity of a structure to sustain ground motions due to an earthquake beyond the reference level. It is defined as the ratio of spectral acceleration that causes structural collapse or catastrophic failure of the system to the spectral acceleration. For fixed steel offshore structures, the representative value of Cr can be estimated from the general design characteristics of a structure according to Table 11.3-1 [45]. The analysis was performed for each of the 20 incident directions.
The maximum shear (load) is reached by applying a load of 6.90 to the earthquake. This value is divided by the reference shear obtained in the earthquake resistance analysis (see Equation (3)), with the most unfavorable direction being 270° and the other directions obtaining higher factors.
C r = s h e a r   m a x i m u m s h e a r   r e f e r e n c e
C r = 5993.6   t o n 702.2   t o n = 8.31
8.31 > 2.0   ( m i n i m u n   r e q u i r e d )
It is observed in Figure 9 that by applying a load factor of 6.90, the earthquake reaches the maximum shear (5993 tons); this is because in this step, some elements in the topside near node 1B28 and the pile with node P002 begin to present plasticization, which causes the collapse mechanism to start. After applying a load factor of 7.10, the platform collapses due to the plasticization of elements. On the other hand, the behavior of the foundation and piles is as follows: the maximum load capacity of the piles for node P008 (axis B4) = 65.6% in tension and compression at node P001 (axis A1) = 72.8%; in both cases, they are less than 100% of their load capacity.
The nodes P002 (at the base of the piles) and 1B28 (in the beam–column connection at the second level) were graphed, in which the behavior in terms of force–deformation is shown. The graphs have a stable behavior up to a load factor of 6.90, reaching a displacement of 60 cm for node P002 and 105 cm for node 1B28, followed by the displacement increasing very drastically until reaching structural collapse by applying a load factor of 7.10.

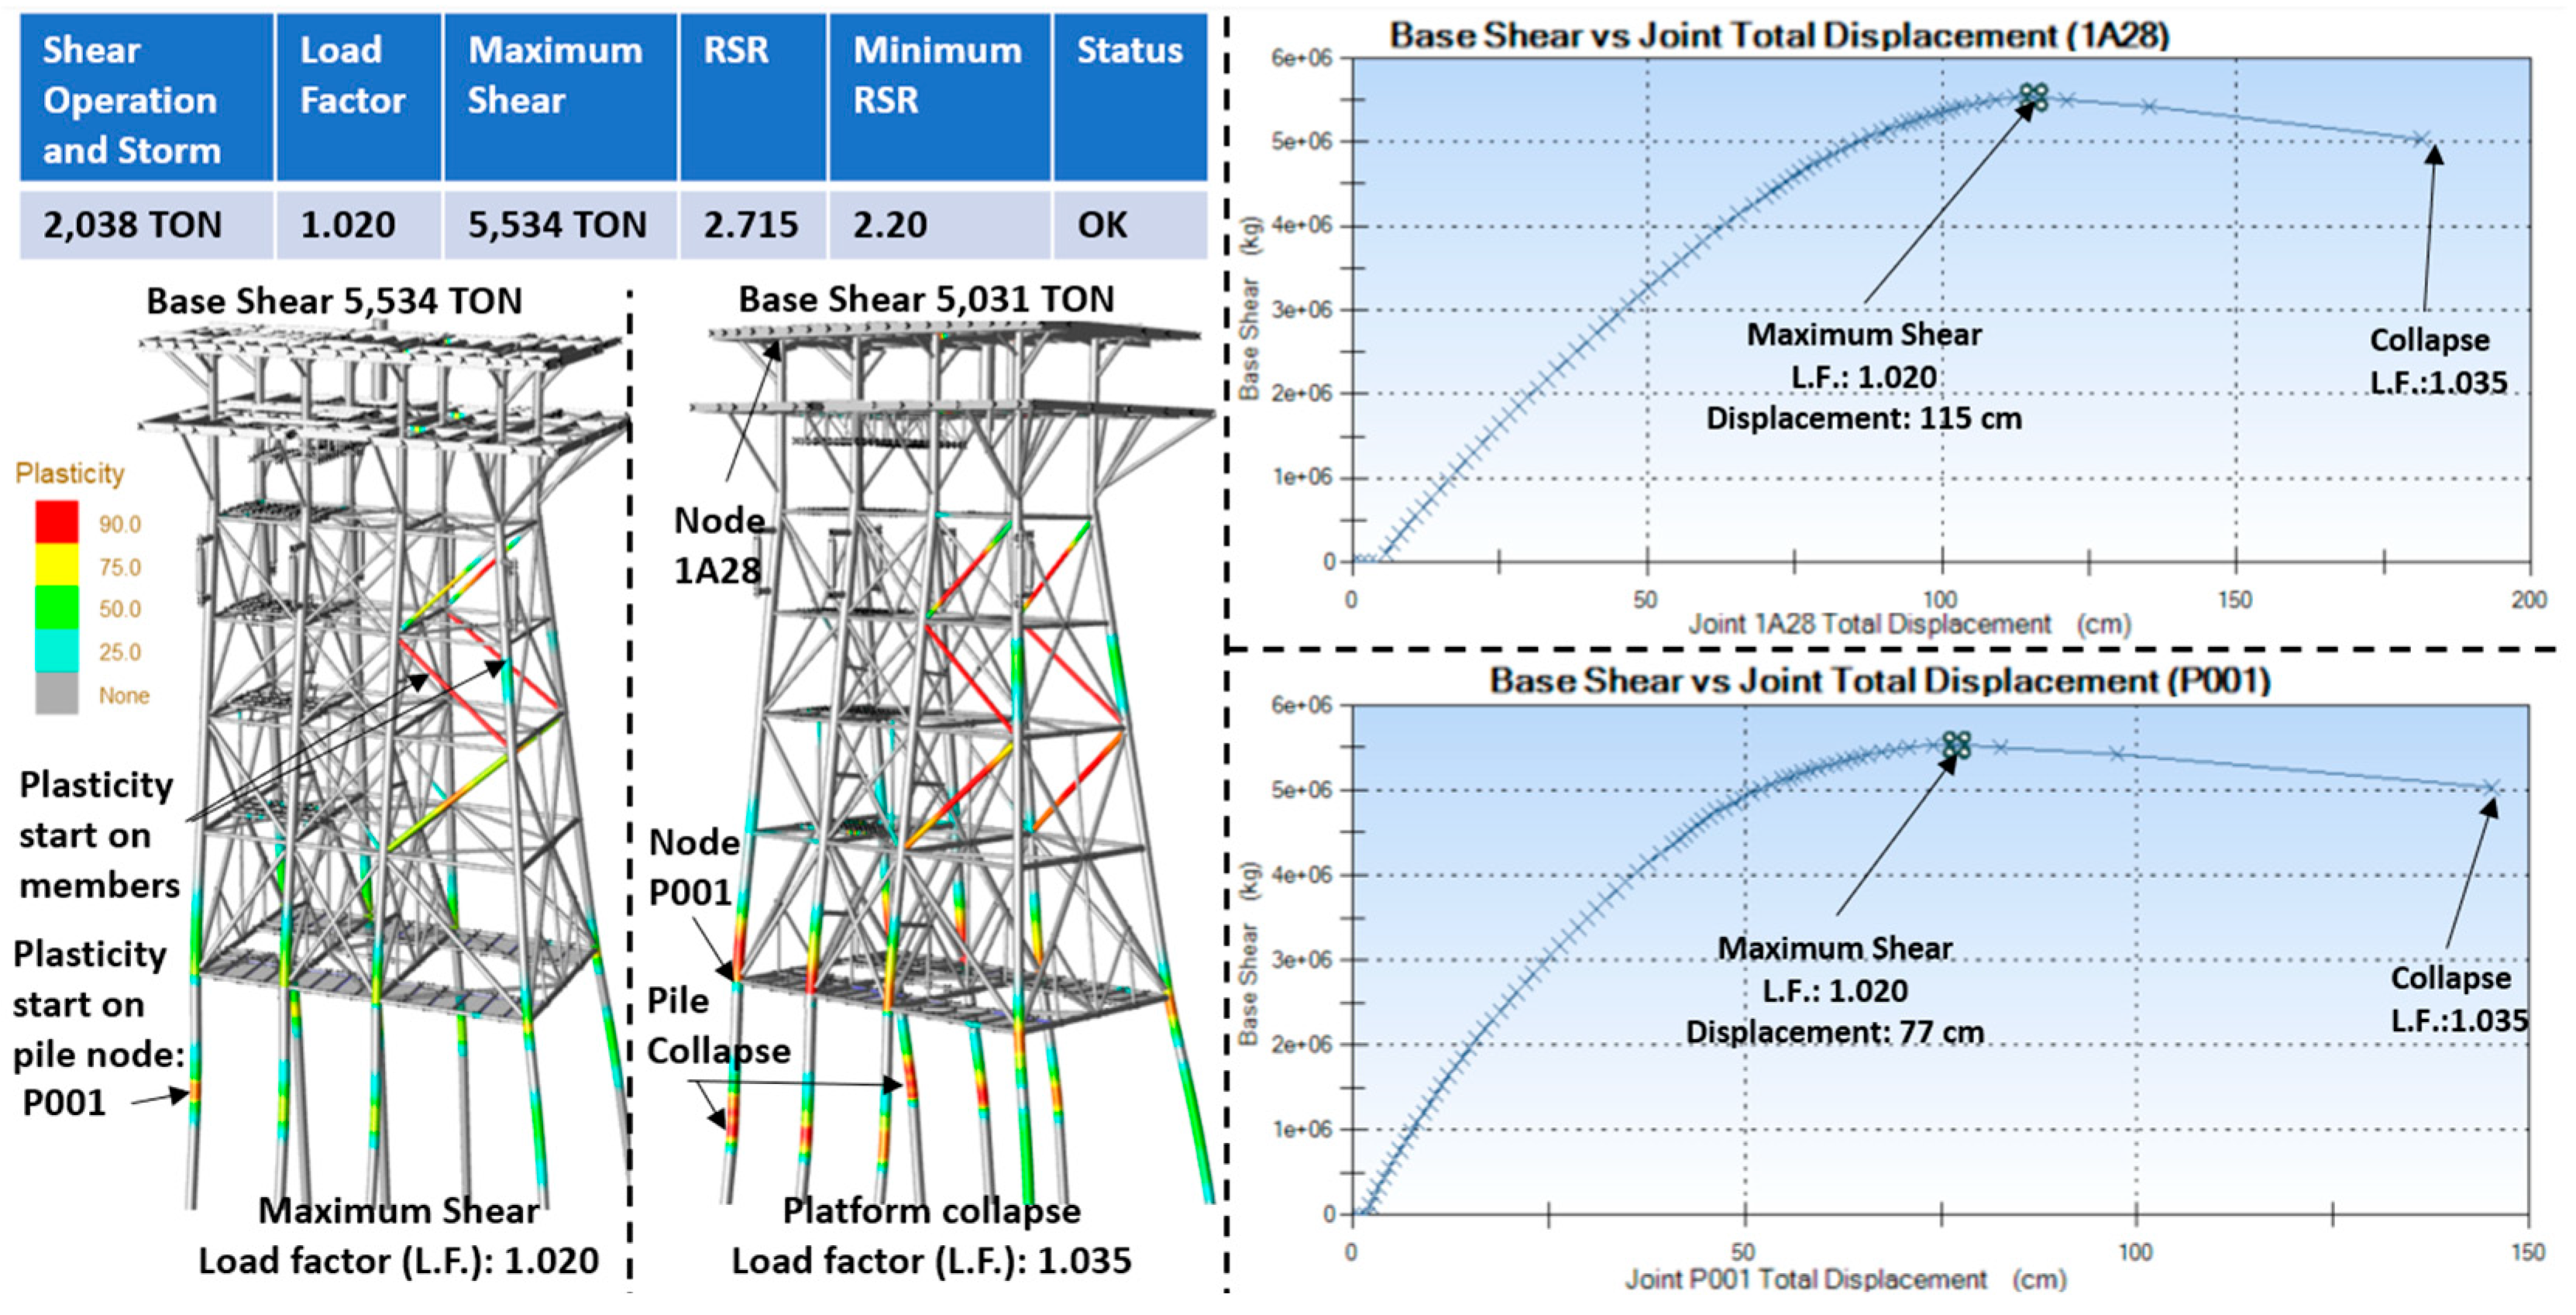
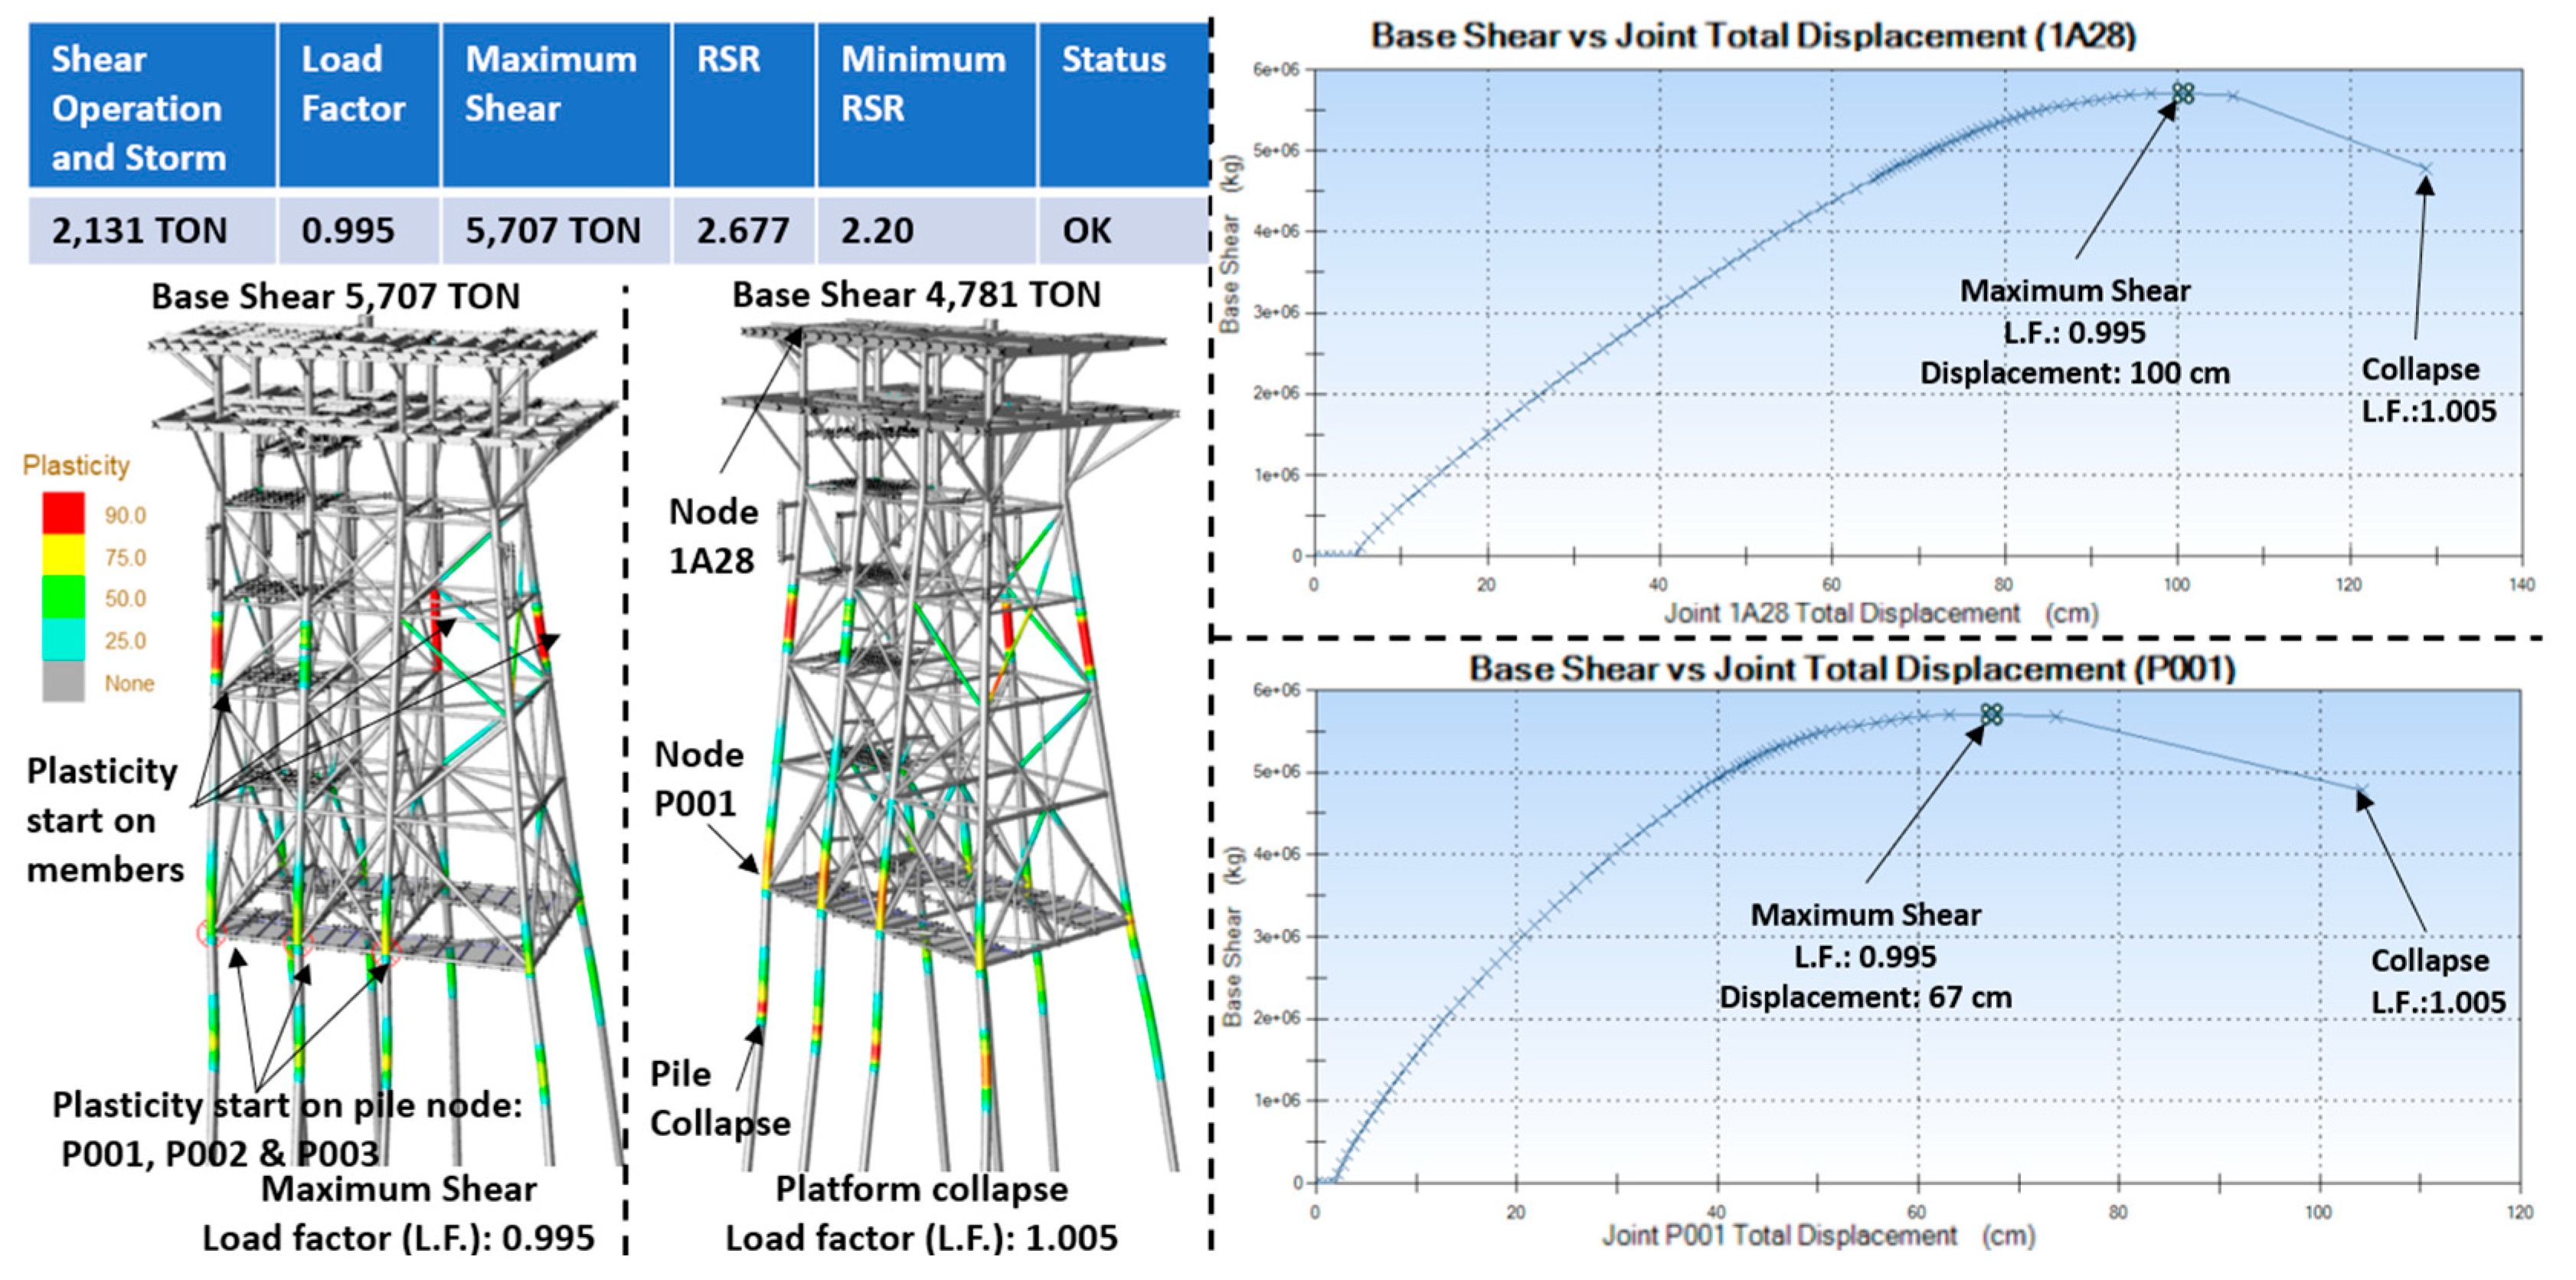
5.5. Results of Ultimate Resistance Analysis for Wave Loads

The ultimate wave resistance was assessed by incrementally applying a load until the platform reached its collapse mechanism, utilizing the nonlinear pushover analysis method. This analysis was conducted using the “Collapse” module of the SACS (Structural Analysis Computer System) program, which accounts for both structural and foundation nonlinearity. As a result, the Resistance Reserve Factor (RSR) was determined, quantifying the relationship between the lateral base shear at structural collapse (ultimate wave design resistance) and the reference shear from the design wave.
The RSR was calculated by dividing the maximum shear before platform collapse by the shear obtained from operational and storm analyses. An example of the RSR computation for the 225° direction is provided in Equation (4).
R S R = s h e a r   m a x i m u m s h e a r   r e f e r e n c e
R S R = 5677   t o n 2132   t o n = 2.66
2.66 > 2.2   ( m i n i m u n   r e q u i r e d )
Table 8 presents the RSR results for all directions, indicating that the collapse mechanism in all cases is governed by the plasticization of structural elements. Moreover, the piles exhibit sufficient load capacity as none reach 100% utilization. Figure 10 and Figure 11 illustrate the platform’s maximum shear state, followed by its collapse configuration. Additionally, the lateral graphs depict the load–displacement response, with key nodes located at the platform base and the beam–column connection at the second level.
Figure 10 shows that at a load factor of 1.020, the maximum shear (5534 tons) is reached. This occurs as plasticization initiates in certain jacket elements and pile node P001, triggering the collapse mechanism. When the load factor increases to 1.035, the platform undergoes complete collapse due to extensive plasticization. Regarding foundation performance, the maximum pile load capacity is observed at node P007, reaching 63.1% in tension—well below the failure threshold of 100%.
The force–deformation behavior of nodes P001 (pile base) and 1A28 (beam–column connection at the second level) was also analyzed. The corresponding graphs indicate stable behavior up to a load factor of 1.020, where displacement reaches 77 cm at node P001 and 115 cm at node 1A28. Beyond this point, displacement increases drastically until structural collapse occurs at a load factor of 1.035.
It is observed in Figure 11 that applying a load factor of 0.995 results in the maximum shear (5707 tons); this is because in this step, some elements in the jacket and the piles with nodes P001, P002, and P003 begin to present plasticization, which causes the collapse mechanism to start. Applying a load factor of 1.005 causes the platform to collapse due to the plasticization of elements. On the other hand, the behavior of the foundation and piles is as follows: the maximum load capacity of the pile for node P008 = 84.6% in tension, less than 100% of their load capacity.
The nodes P001 (at the base of the piles) and 1A28 (in the beam–column connection at the second level) were graphed, in which the behavior in terms of force–deformation is shown. The graphs have a stable behavior up to the load factor of 0.995, reaching a displacement of 67 cm for node P001 and 100 cm in node 1A28, followed by the displacement increasing very drastically until reaching structural collapse by applying a load factor of 1.035.

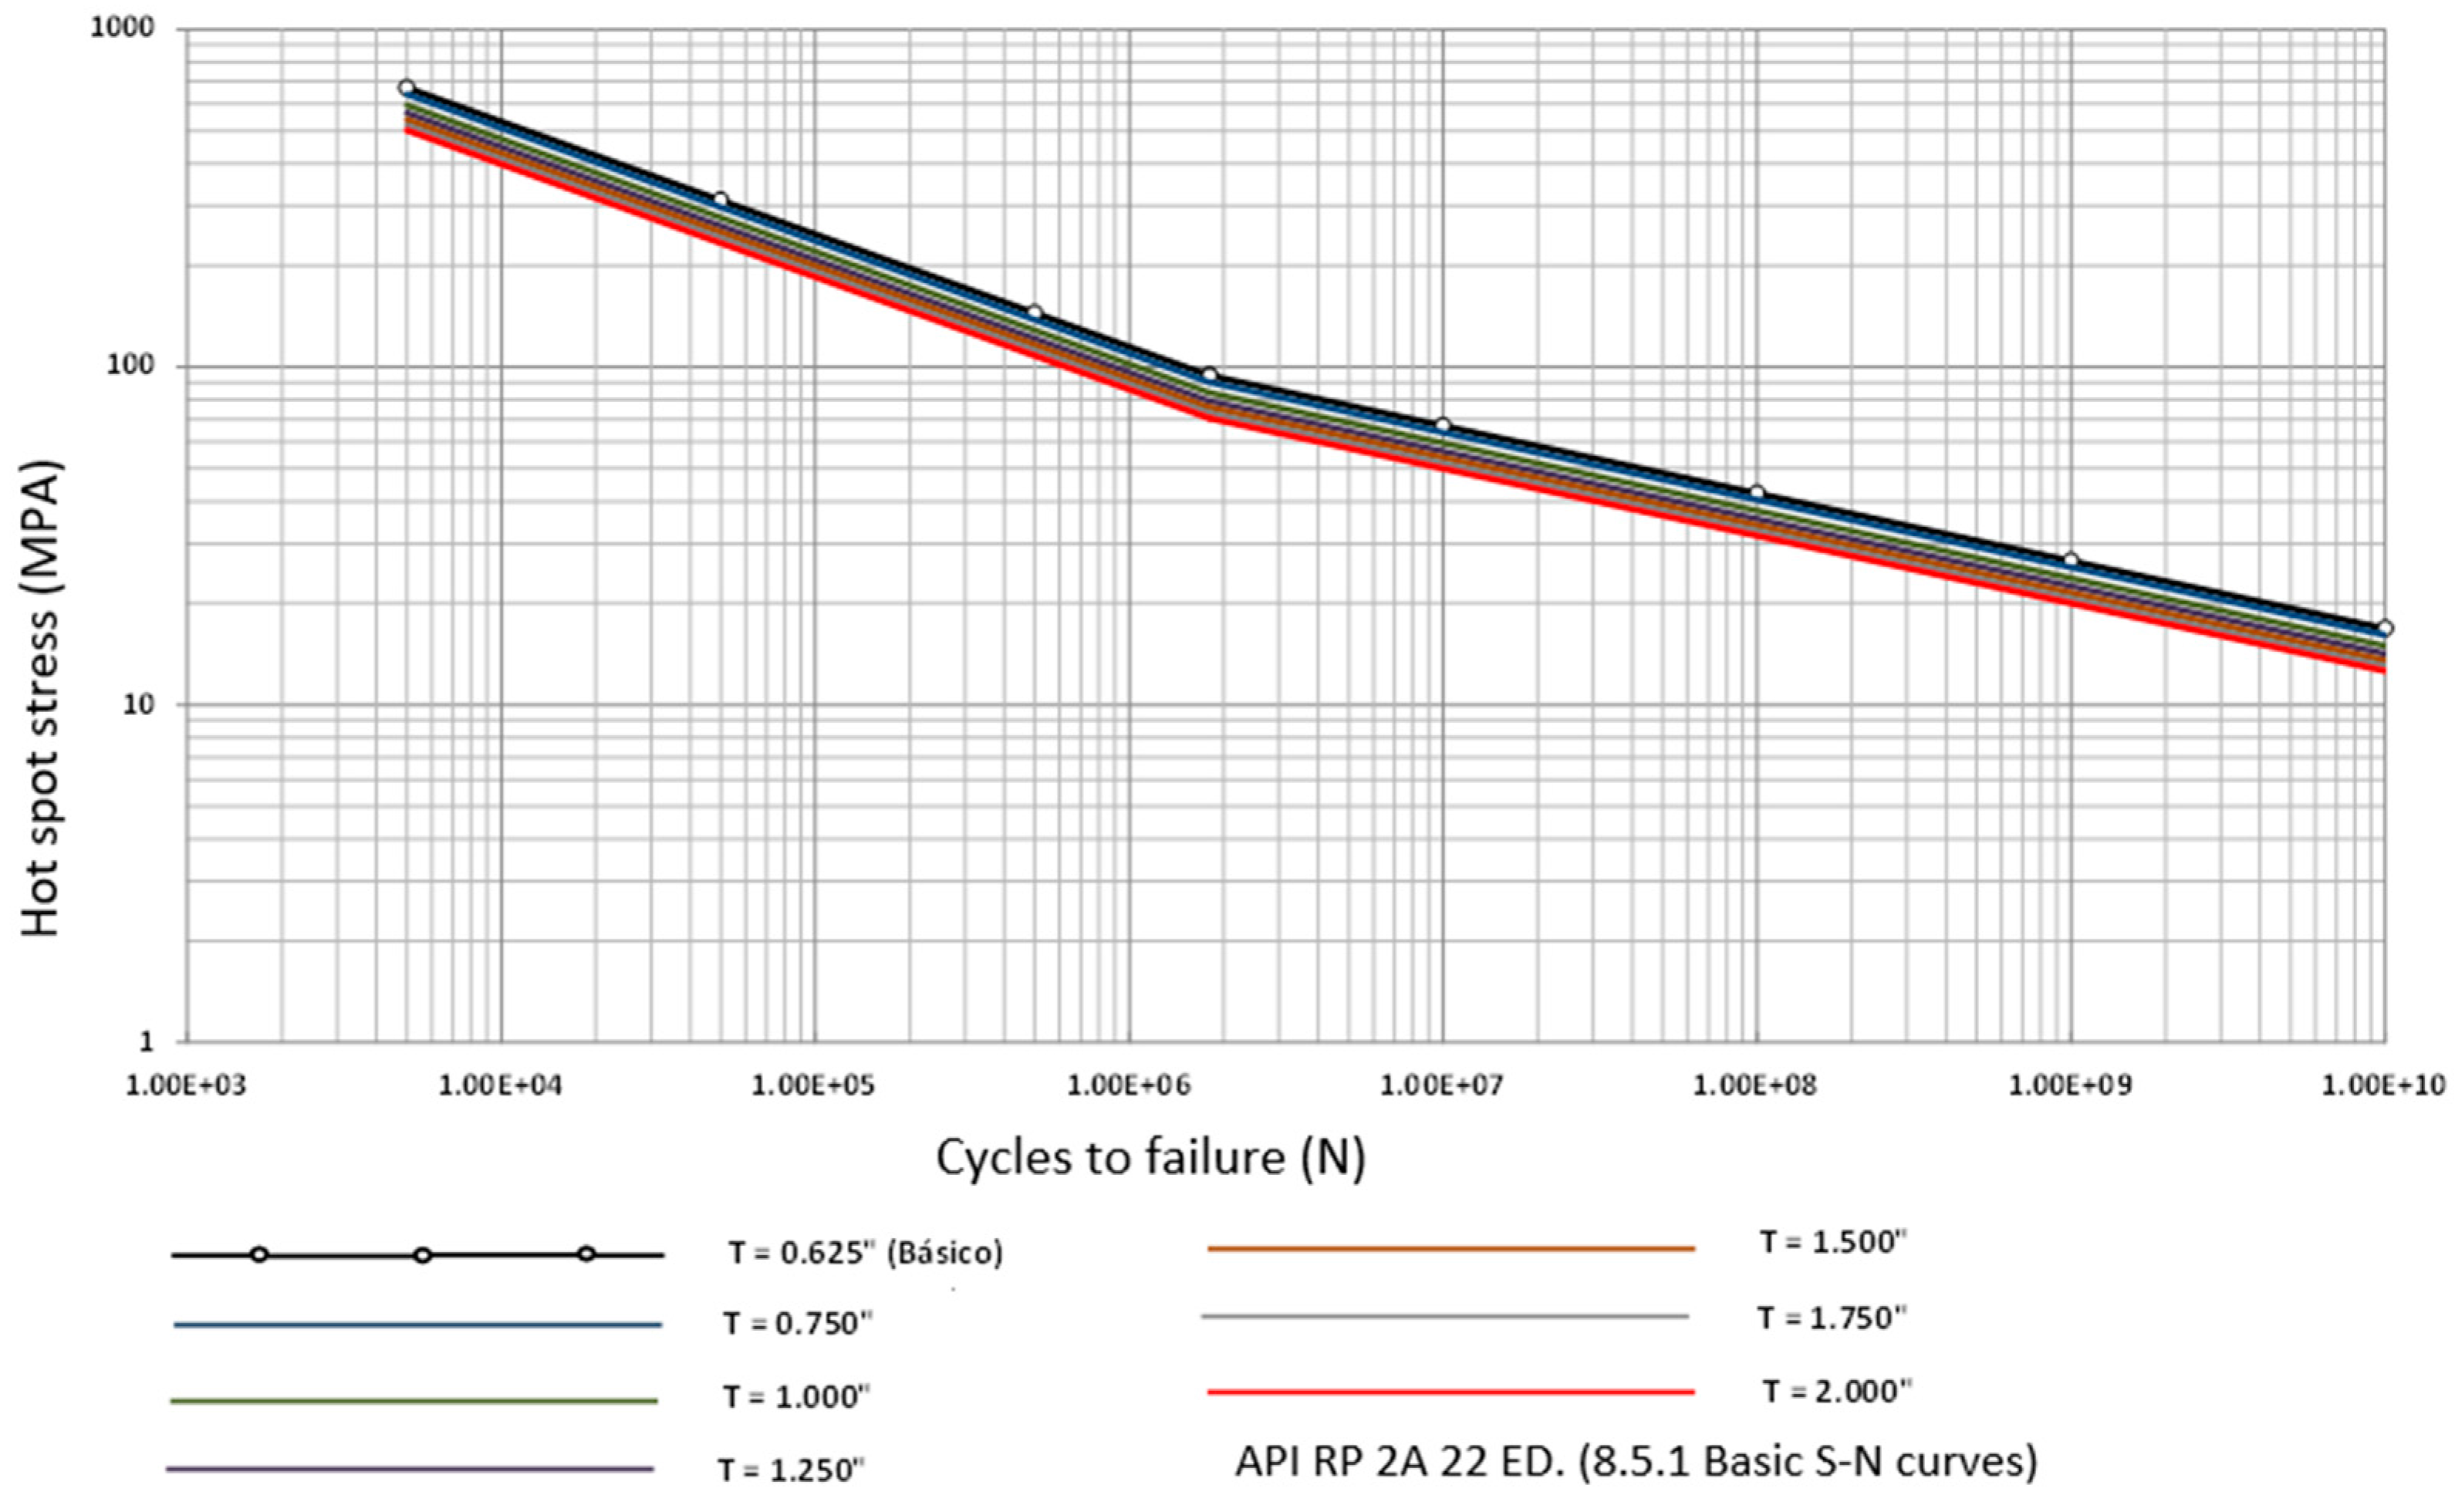
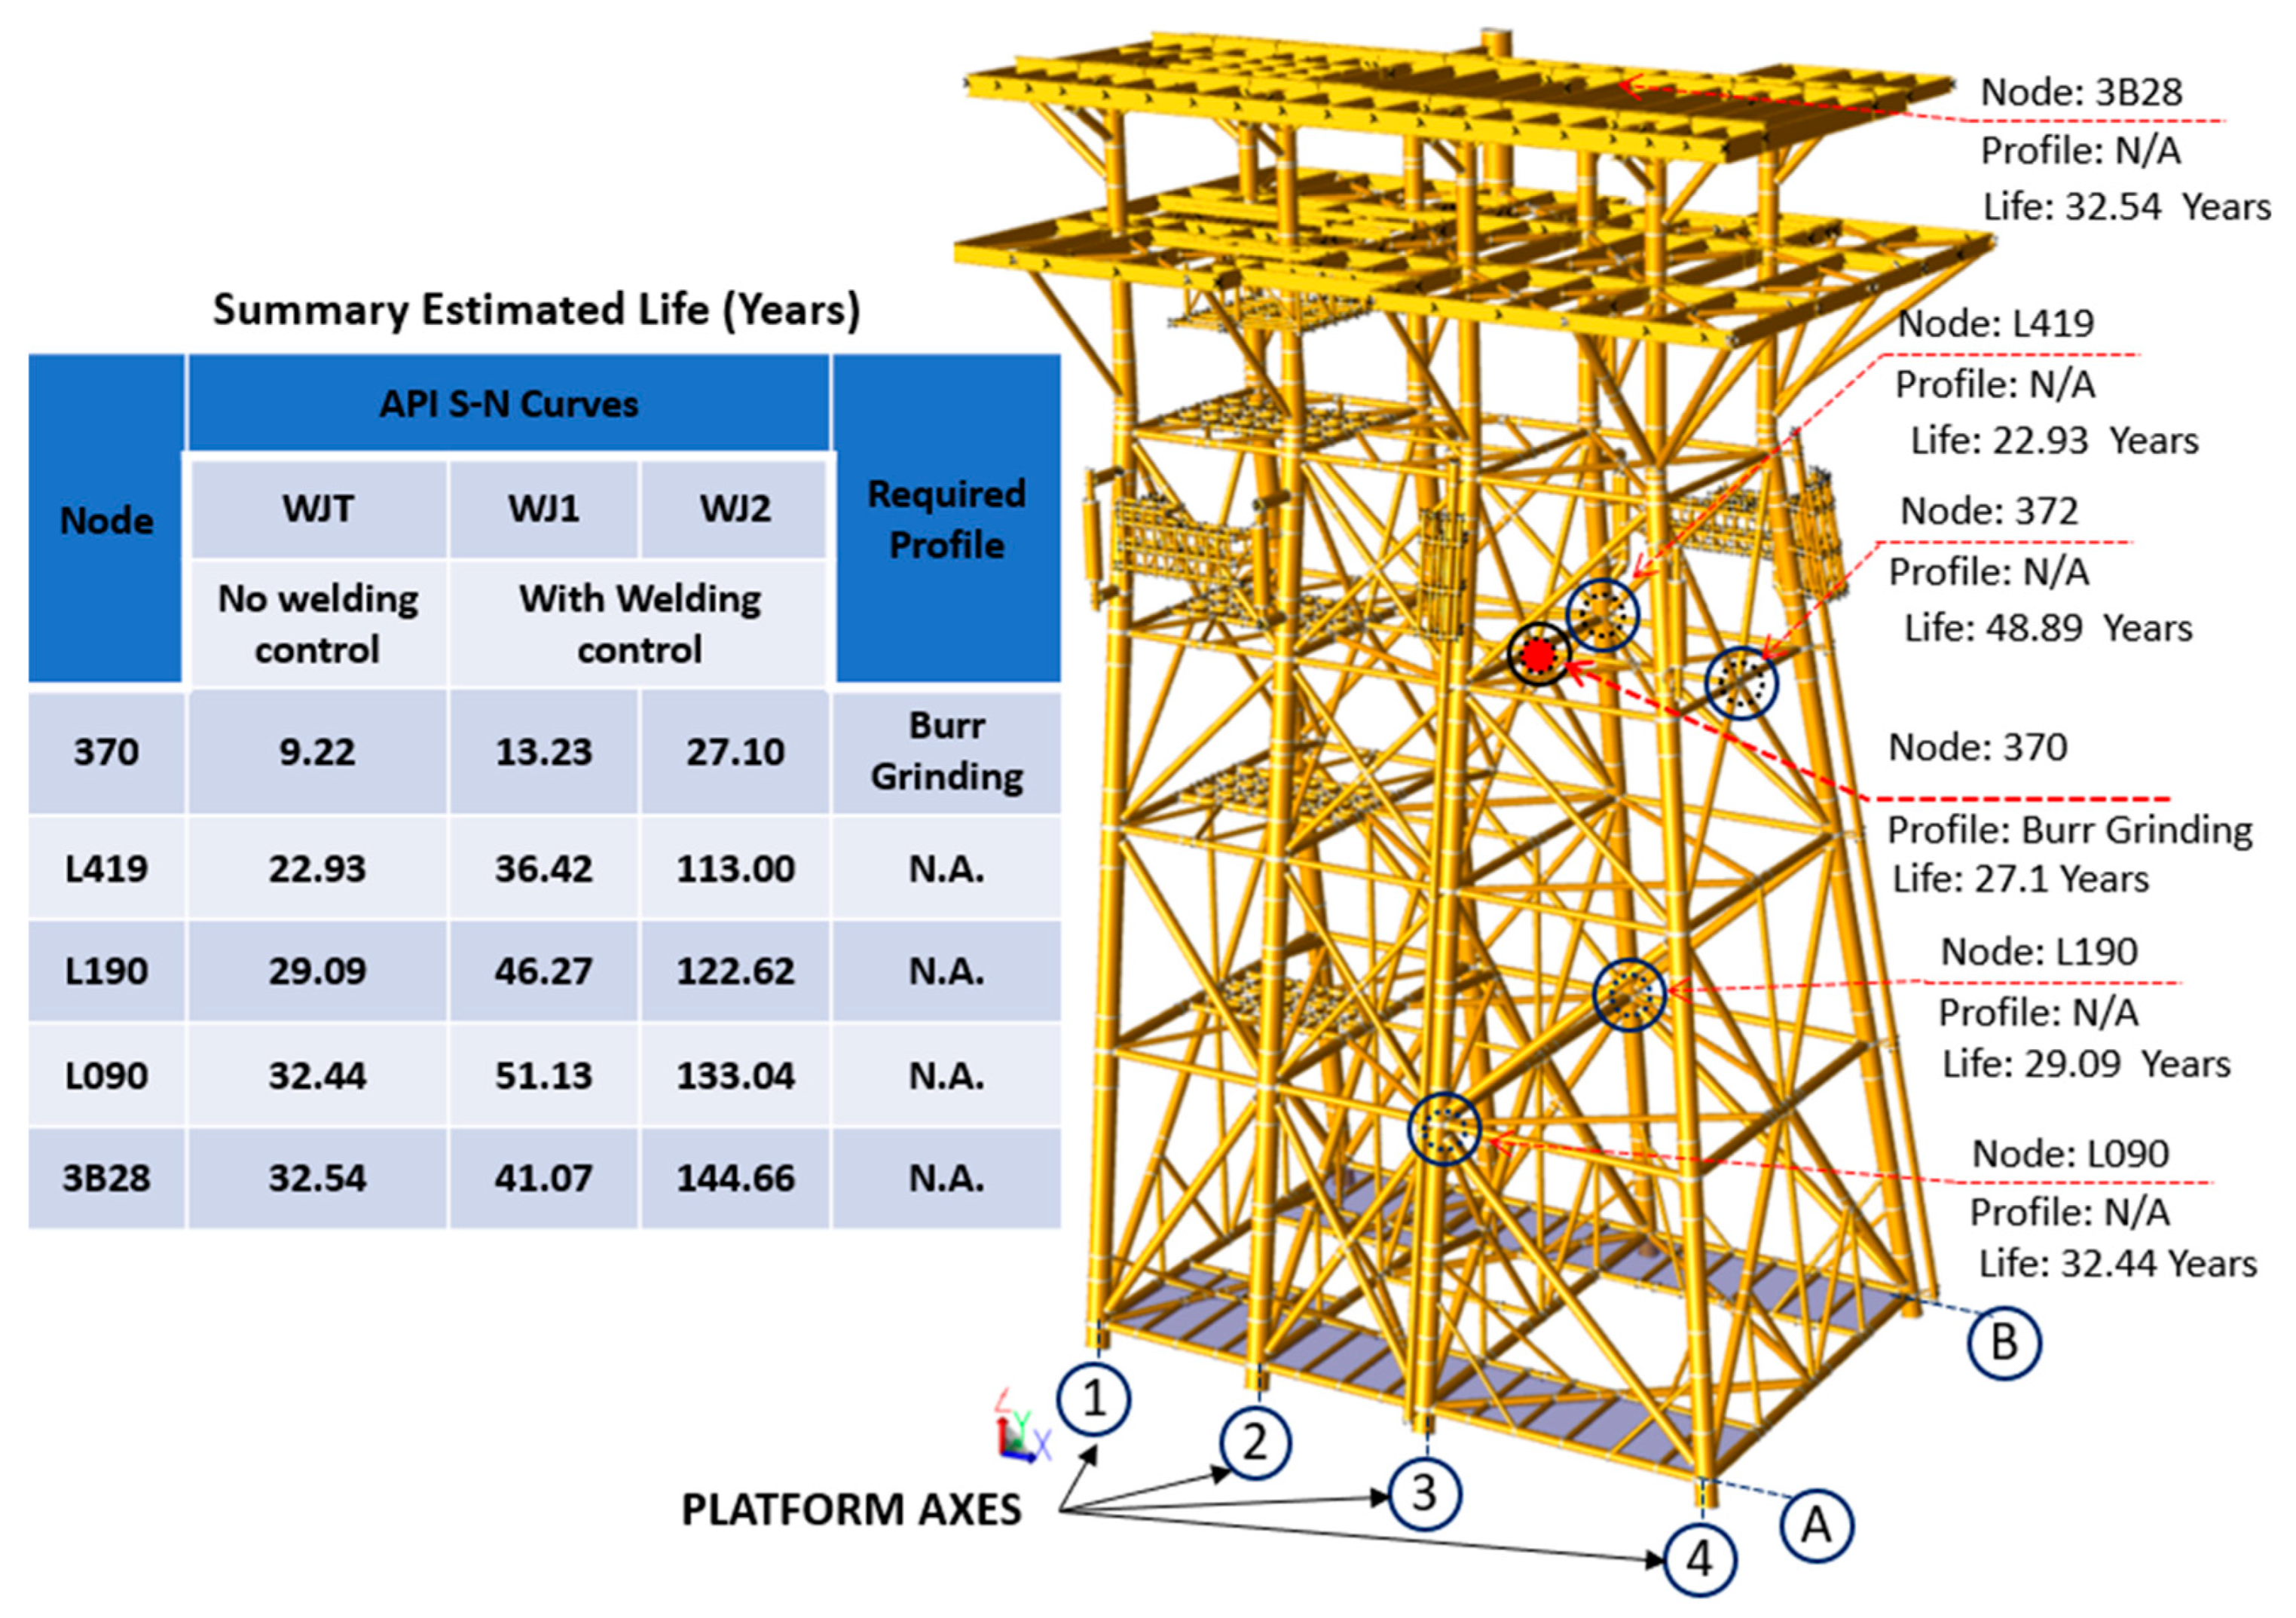
5.6. Spectral Fatigue Analysis

Spectral fatigue analysis aims to evaluate the stresses induced by repeated or cyclic loads acting on the connections of tubular elements comprising the structure. These loads arise due to gravitational and environmental forces experienced throughout the service life of the structure. The primary objective is to determine the design fatigue life of each joint and member, ensuring that it is not less than the expected service life of the structure multiplied by an appropriate safety factor.
The analysis is based on Palmgren–Miner’s fatigue damage accumulation theory, which states that fatigue damage (D) is determined by the ratio of the number of cycles n(s) at a specific stress range acting on the structure to the corresponding number of cycles to failure N(s) for the same stress range. When the cumulative damage across all stress ranges reaches or exceeds unity, fatigue failure occurs.
The spectral fatigue method incorporates wave incidence probability to define stress intervals and their corresponding cycle counts affecting the welds of the tubular joints. Once the number of cycles within each stress interval is established, the resulting fatigue damage can be assessed by comparing these values with the allowable cycles defined in S–N curves (stress range vs. number of cycles).
Fatigue life estimations were derived from the S–N curves specified in API RP 2A-WSD, 22nd edition [35]. Specifically, the WJT curve was used for tubular connections fabricated from steel with a yield strength below 72 ksi (Figure 12).
For welded joints, improvement factors related to fatigue performance can be achieved through several methods, including controlled burr grinding of the weld toe (WJ1), hammer peening (WJ2), or as-welded profile control to generate a smooth concave profile that transitions seamlessly into the parent metal (WJ3). Table 9 presents the improvement factors that can be applied [35].
The results of the spectral fatigue analysis are illustrated in Figure 13. By utilizing the S–N curve from API (2014) [35] (see Figure 12), it is observed that node 370 exhibits a service life of 9.22 years, which is below the minimum design life of 20 years. Consequently, the following solutions are proposed: increasing the tube thickness or diameter, enhancing the yield strength, or applying a weld profile control technique, as detailed in Table 9. The application of the WJ1 technique extends the joint’s life to 13.23 years; however, this remains below the required threshold. Further analysis was conducted using the weld toe burr grinding technique (WJ2), which significantly increased the service life to 27.10 years, thereby meeting the minimum requirement of 20 years. These findings demonstrate that implementing weld profile control techniques can enhance the service life of tubular joints without altering their geometric profiles (thickness or diameter). However, proper cathodic protection is necessary for the effective application of these techniques.
A summary of the analyses is presented below, highlighting the differences in structural behavior under various scenarios that the platform may encounter throughout its service life, as detailed in Table 10.
In the linear analysis stage, which includes (i) operation and storm conditions, (ii) dynamic storm response, and (iii) seismic resistance level, unity checks on elements, tubular joints, and piles demonstrate compliance with regulatory requirements in cases (i) and (ii). However, under seismic loading, overstressing is observed in a beam, necessitating potential solutions such as increasing the web or flange thickness, adding a second or third web plate, or enhancing the yield strength. For the tubular sections, proposed reinforcement measures include increasing thickness, adding stiffeners, or injecting cement.
Furthermore, hydrostatic collapse is observed across all three linear analyses. This phenomenon is attributed to the depth at which the element is submerged. To mitigate hydrostatic collapse, the commonly employed solutions in Mexico include the following:
  • For structures in the design phase: Increasing thickness, diameter, or yield strength, as well as reinforcing with internal plates or external ring-shaped stiffeners.
  • For already constructed but uninstalled structures: Reinforcement using external ring plates.
  • For installed offshore structures: The most frequently utilized method involves cement injection within the tubular section.
These solutions are indicative rather than exhaustive, and a comprehensive analysis should be conducted to evaluate their cost-effectiveness and installation feasibility.
In the nonlinear analysis, a high safety factor is observed for seismic loading compared to ultimate wave resistance. This finding confirms that wave loading governs the design of offshore platforms in Campeche Bay, indicating that seismic activity is not the most critical condition for the structural design of these platforms.
In the predictive fatigue analysis, initial evaluations using the first S–N curve (without considering weld control in the most unfavorable scenario) indicate that all joints meet the minimum service life requirement, except for joint 370. Two additional analyses were conducted by modifying the S–N curves, following API [35] guidelines. The results confirm that joint 370 meets the minimum design life when a profiling control method known as “burr grinding” is applied.
Based on these findings, the results can be deemed satisfactory, underscoring the necessity of performing six fundamental analyses to assess the structural behavior of offshore platforms throughout their operational lifespan and ensure their structural integrity. Finally, this study highlights the importance of installing offshore platforms in new exploration fields to enhance resource exploitation.

6. Conclusions

This study proposes that integrity analysis should be conducted through six distinct assessments: (i) static operation and storm, (ii) dynamic storm, (iii) strength-level seismic, (iv) seismic ductility (pushover), (v) maximum wave resistance (pushover), and (vi) spectral fatigue.
  • The static operation and storm analysis includes the evaluation of unity checks (UCs) in structural elements, tubular joints, piles, and safety factors to ensure compliance with the design criteria.
  • The dynamic storm analysis considers the influence of vibration modes and periods on the platform’s response. The findings indicate that this analysis results in more unfavorable conditions compared to the static operation and storm analysis.
  • For the strength-level seismic analysis, different master node configurations were evaluated, highlighting their impact on U.C. assessments in structural elements, tubular joints, and piles. This study proposes reinforcement solutions for elements that do not meet the regulatory requirements.
  • The seismic ductility analysis reveals that the collapse mechanism initiates in the topside structure, reaching the Cr factor in all analyzed directions.
  • In the ultimate wave resistance analysis, the collapse mechanism is observed to originate in the jacket structure, with the platform meeting the required reserve strength ratio (RSR) in all eight analyzed directions.
  • The spectral fatigue analysis provides insights into the behavior of tubular joints under different S–N curves. The results indicate that the fatigue life of all tubular joints is reached within the expected operational period.
  • Through the execution of these analyses, the structural behavior of the platform under both linear and nonlinear static conditions can be assessed, allowing for the identification of critical zones requiring reinforcement. Furthermore, compliance with regulatory standards is verified to ensure the structural integrity and performance of the platform under various loading scenarios throughout its service life.

Author Contributions

R.D.Á.B.M. led the development of the model, including its approach, analysis, design, and interpretation of the results. J.A.Á.-A. provided significant input to the mathematical framework, while Y.E.H. carried out a thorough review. Ultimately, all authors collaborated in formulating the conclusions derived from the research findings. All authors have read and agreed to the published version of the manuscript.

Funding

This research was supported by internal funding provided by the Universidad Autónoma del Carmen (UNACAR), Ciudad del Carmen, Campeche, Mexico. No external funding was received for this study.

Institutional Review Board Statement

Not applicable.

Informed Consent Statement

Not applicable.

Data Availability Statement

Data are contained within the article.

Acknowledgments

The authors, Rodrigo Daniel Alvarez-Bello Martínez, Juan Antonio Álvarez-Arellano, Youness El-Hamzaoui, express their gratitude for the support provided by the Secretaría de Ciencia, Humanidades, Tecnología e Innovación (SECHTI), the Programa para el Desarrollo Profesional Docente (PRODEP), and the Grupo Disciplinar Ingeniería Estructural Aplicada e Ingeniería de la Construcción y sus Procesos Sustentables through Universidad Autónoma del Carmen (UNACAR).

Conflicts of Interest

The authors declare no conflicts of interest.

Abbreviations

SACSStructural Analysis Computer System
U.C.Unity checks
APIAmerican Petroleum Institute
API RP 2A-WSDPlanning, Designing and Constructing Fixed Offshore Platforms—Working Stress Design
AISCAmerican Institute of Steel Construction
IMCAInstituto Mexicano de la Construcción del Acero
PemexPetroleos Mexicanos
CrRatio between the ultimate lateral load resisting the platform before collapse
RSRResistance Reserve Factor
S–NCurve stress interval vs. number of cycles
DNV GLDNV (Det Norske Veritas) y GL (Germanischer Lloyd)
FEFinite element
ARMAXAutoregressive moving average model with exogenous inputs
SCFsConcentration factors
WAVEWATCH IIIWave data simulator
PoFProbability of Failure
NOrder of the stream function
kWave number
TLPTension Leg Platform
CQCComplete quadratic combination
SRSSSquare root of the sum of the squares
H(f)Mechanical transfer function
KiGeneralized stiffness
fnNatural frequency
cPercent damping
STRNStrength
ISOInternational Organization for Standardization
DFatigue damage

References

  1. Petróleos Mexicanos. (s.f.). Estadísticas Petroleras. Available online: https://www.pemex.com/ri/Publicaciones/Paginas/IndicadoresPetroleros.aspx (accessed on 1 July 2023).
  2. Petróleos Mexicanos. (n.d.). Volumen de las Exportaciones de Petróleo Crudo. Available online: https://www.pemex.com/ri/Publicaciones/Indicadores%20Petroleros/evolexporta_esp.pdf (accessed on 4 November 2024).
  3. Petróleos Mexicanos. (n.d.). Valor de las Exportaciones de Petróleo Crudo. Available online: https://www.pemex.com/ri/Publicaciones/Indicadores%20Petroleros/evalorexporta_esp.pdf (accessed on 4 November 2024).
  4. Petróleos Mexicanos. Plan de Negocios 2023–2027. 2023. Available online: https://www.pemex.com/acerca/plan-de-negocios/Documents/pn_2023-2027_total.pdf (accessed on 4 November 2024).
  5. Ersdal, G.; Sharp, J.V.; Stacey, A. Ageing and Life Extension of Offshore Structures: The Challenge of Managing Structural Integrity, 1st ed.; John Wiley & Sons: Hoboken, NJ, USA, 2019; Available online: https://books.google.com.mx/books/about/Ageing_and_Life_Extension_of_Offshore_St.html?id=tzB6DwAAQBAJ&redir_esc=y (accessed on 4 November 2024).
  6. Vaz, M.A.; Cyrino, C.R.; Hernández, I.D. Experimental and numerical analyses of the ultimate compressive strength of perforated offshore tubular members. Mar. Struct. 2018, 58, 1–17. [Google Scholar] [CrossRef]
  7. Gao, S.; Guo, L.; Zhang, S.; Peng, Z. Performance degradation of circular thin-walled CFST stub columns in high-latitude offshore region. Thin-Walled Struct. 2020, 154, 106906. [Google Scholar] [CrossRef]
  8. Onoufriou, T. Reliability based inspection planning of offshore structures. Mar. Struct. 1999, 12, 521–539. [Google Scholar] [CrossRef]
  9. Lotsberg, I.; Sigurdsson, G.; Fjeldstad, A.; Moan, T. Probabilistic methods for planning of inspection for fatigue cracks in offshore structures. Mar. Struct. 2016, 46, 167–192. [Google Scholar] [CrossRef]
  10. Ramasamy, R.; Ibrahim, Z.; Chai, H.K. Screening method for platform conductor integrity assessment for life extension prioritisation. Mar. Struct. 2018, 58, 136–153. [Google Scholar] [CrossRef]
  11. Jimenez-Martinez, M. Fatigue of offshore structures: A review of statistical fatigue damage assessment for stochastic loadings. Int. J. Fatigue 2020, 132, 105327. [Google Scholar] [CrossRef]
  12. Muzaffer, S.; Chang, K.-H.; Hirohata, M. Fatigue Life Comparison of Tubular Joints in Tripod and Jacket Offshore Support Substructures Using 3D Fatigue FE Analysis. KSCE J. Civ. Eng. 2024, 28, 849–859. [Google Scholar] [CrossRef]
  13. Pachoud, A.J.; Manso, P.A.; Schleiss, A.J. Stress intensity factors for axial semi-elliptical surface cracks and embedded elliptical cracks at longitudinal butt welded joints of steel-lined pressure tunnels and shafts considering weld shape. Eng. Fract. Mech. 2017, 185, 214–238. [Google Scholar] [CrossRef]
  14. Liu, L.; Yang, D.Y.; Frangopol, D.M. Ship service life extension considering ship condition and remaining design life. Mar. Struct. 2021, 78, 102940. [Google Scholar] [CrossRef]
  15. Adamkowski, A.; Lewandowski, M.; Lewandowski, S. Fatigue life analysis of hydropower pipelines using the analytical model of stress concentration in welded joints with angular distortions and considering the influence of water hammer damping. Thin-Walled Struct. 2021, 159, 107350. [Google Scholar] [CrossRef]
  16. Mojtahedi, A.; Lotfollahi Yaghin, M.A.; Ettefagh, M.M.; Hassanzadeh, Y.; Fujikubo, M. Detection of nonlinearity effects in structural integrity monitoring methods for offshore jacket-type structures based on principal component analysis. Mar. Struct. 2013, 33, 100–119. [Google Scholar] [CrossRef]
  17. Ahmadi, H.; Zavvar, E. Stress concentration factors induced by out-of-plane bending loads in ring-stiffened tubular KT-joints of jacket structures. Thin-Walled Struct. 2015, 91, 82–95. [Google Scholar] [CrossRef]
  18. Ahmadi, H.; Mohammadi, A.H.; Yeganeh, A. Probability density functions of SCFs in internally ring-stiffened tubular KT-joints of offshore structures subjected to axial loading. Thin-Walled Struct. 2015, 94, 485–499. [Google Scholar] [CrossRef]
  19. Asgarian, B.; Aghaeidoost, V.; Rahman Shokrgozar, H. Damage detection of jacket type offshore platforms using rate of signal energy using wavelet packet transform. Mar. Struct. 2016, 45, 1–21. [Google Scholar] [CrossRef]
  20. Mohammad, S.F.; Galgoula, N.S.; Starossek, U.; Videiro, P.M. An efficient time domain fatigue analysis and its comparison to spectral fatigue assessment for an offshore jacket structure. Mar. Struct. 2016, 49, 97–115. [Google Scholar] [CrossRef]
  21. Pérez, R.; Rodríguez, R.; Vázquez-Hernández, A.O. Damage detection in offshore jacket platforms with limited modal information using the Damage Submatrices Method. Mar. Struct. 2017, 55, 78–103. [Google Scholar] [CrossRef]
  22. Aeran, A.; Siriwardane, S.C.; Mikkelsen, O.; Langen, I. A framework to assess structural integrity of ageing offshore jacket structures for life extension. Mar. Struct. 2017, 56, 237–259. [Google Scholar] [CrossRef]
  23. Dodaran, N.A.; Ahmadi, H.; Lotfollahi-Yaghin, M. Parametric study on structural behavior of tubular K-joints under axial loading at fire-induced elevated temperatures. Thin-Walled Struct. 2018, 130, 467–486. [Google Scholar] [CrossRef]
  24. Lotsberg, I.; Olufsen, O.; Solland, G.; Dalane, J.I.; Haver, S. Risk assessment of loss of structural integrity of a floating production platform due to gross errors. Mar. Struct. 2004, 17, 551–573. [Google Scholar] [CrossRef]
  25. Mousavi, M.; Gardoni, P. A simplified method for reliability- and integrity-based design of engineering systems and its application to offshore mooring systems. Mar. Struct. 2014, 36, 88–104. [Google Scholar] [CrossRef]
  26. Guédé, F. Risk-based structural integrity management for offshore jacket platforms. Mar. Struct. 2019, 63, 444–446. [Google Scholar] [CrossRef]
  27. Zeinoddini, M.; Yaghubi Namin, Y.; Nikoo, H.M.; Estekanchi, H.; Kimiaei, M. An EWA framework for the probabilistic-based structural integrity assessment of offshore platforms. Mar. Struct. 2018, 59, 60–79. [Google Scholar] [CrossRef]
  28. Leheta, H.W.; Badran, S.F.; Elhanafi, A.S. Ship structural integrity using new stiffened plates. Thin-Walled Struct. 2015, 94, 545–561. [Google Scholar] [CrossRef]
  29. Hüsken, G.; Shamsuddoha; Pirskawetz, S.; Hofmann, D.; Baeßler, M.; Kühne, H.-C. Potential of a repair system for grouted connections in offshore structures: Development and experimental verification. Mar. Struct. 2021, 77, 102934. [Google Scholar] [CrossRef]
  30. Amiri, N.; Shaterabadi, M.; Reza Kashyzadeh, K.; Chizari, M. A comprehensive review on design, monitoring, and failure in fixed offshore platforms. J. Mar. Sci. Eng. 2021, 9, 1349. [Google Scholar] [CrossRef]
  31. Sidiq, R.B.; Utomo, C.; Silvianita. Determining Factors of Fixed Offshore Platform Inspections in Indonesia. Appl. Sci. 2023, 13, 737. [Google Scholar] [CrossRef]
  32. Kazeminezhad, M.H.; Ghavanini, F.A. Operational wave forecasting for extreme conditions in the Arabian Sea—A comparison with buoy and satellite data. Ocean Eng. 2023, 275, 114152. [Google Scholar] [CrossRef]
  33. Tu, Y.; Cheng, Z.; Muskulus, M. A global slamming force model for offshore wind jacket structures. Mar. Struct. 2018, 60, 201–217. [Google Scholar] [CrossRef]
  34. Alizadeh, A.; Siriwardane, S.C.; Mikkelsen, O.; Mikkelsen, O.; Kazeminezhad, M.H. A framework for implementing structural integrity management of an aging fixed offshore platform using wave modeling for risk-based underwater inspection provision. Ocean Eng. 2024, 309, 118368. [Google Scholar] [CrossRef]
  35. API. American Petroleum Institute, Recommended Practice for Planning, Designing and Constructing Fixed Offshore Platforms–Working Stress Design, API RP 2A-WSD, Twenty-Second Edition, November 2014. Available online: https://store.accuristech.com/api/standards/api-rp-2a-wsd-r2020?product_id=1886617 (accessed on 1 July 2023).
  36. Diseño y Evaluación de Plataformas Marinas Fijas en el Golfo de México, Especificación Técnica Interna para Proyecto de Obras, “P.2.0130.01:2015” Segunda Edición, Agosto de 2015. Available online: https://es.scribd.com/document/389186286/P-2-0130-01-2015-CLASIFICADO (accessed on 1 December 2023).
  37. Fenton, J.D. A high-order cnoidal wave theory. J. Fluid Mech. 1979, 94, 129–161. [Google Scholar] [CrossRef]
  38. Atkins Engineering Services. Fluid Loading on Fixed Offshore Structures, OTH 90 322. 1990. Available online: https://core.ac.uk/download/pdf/237397122.pdf (accessed on 1 September 2023).
  39. Chakrabarti, S.K. Handbook of Offshore Engineering, 1st ed.; Elsevier: Plainfield, IL, USA, 2005; Available online: https://www.amazon.com.mx/Handbook-Offshore-Engineering-Subrata-Chakrabarti/dp/0080443818 (accessed on 1 November 2023).
  40. Tabeshpour, R.; Fatemi, M. Optimum arrangement of braces in jacket platform based on strength and ductility. Mar. Struct. 2020, 71, 102734. [Google Scholar] [CrossRef]
  41. Asgarian, B.; Shokrgozar, H.R.; Shahcheraghi, D.; Ghasemzadeh, H. Effect of soil pile structure interaction on dynamic characteristics of jacket type offshore platforms. Coupled Syst. Mech. 2012, 1, 381–395. [Google Scholar] [CrossRef]
  42. Serrano-Antoñanazas, A.; Serrano-Antoñanazas, M.; Sierra-Antoñanazas, S.; Sierra-Antoñanazas, A. Identification of Vibration Modes in Floating Offshore Wind Turbines. J. Mar. Sci. Eng. 2023, 11, 1893. [Google Scholar] [CrossRef]
  43. Xu, T.; Li, Y.; Leng, D. Mitigating jacket offshore platform vibration under earthquake and ocean waves utilizing tuned inerter damper. Bull. Earthq. Eng. 2023, 21, 1627–1650. [Google Scholar] [CrossRef]
  44. Viero, P.F.; Roitman, N. Application of some damage identification methods in offshore platforms. Mar. Struct. 1999, 12, 107–126. [Google Scholar] [CrossRef]
  45. ISO 19902; INTERNATIONAL STANDARD Petroleum and Natural Gas Industries—Fixed Steel Offshore Structures, Twenty-Second Edition. International Organization for Standardization: Geneva, Switzerland, November 2014. Available online: https://www.iso.org/standard/65688.html (accessed on 1 July 2023).
Figure 1. Components and loads of a jacket-type marine platform.
Applsci 15 03418 g001
Figure 2. Basic analysis to determine structural integrity.
Applsci 15 03418 g002
Figure 3. Sequence of execution of analyses in SACS software.
Applsci 15 03418 g003
Figure 4. Distribution of stiffness and mass.
Applsci 15 03418 g004
Figure 5. Method used to obtain the range of stress.
Applsci 15 03418 g005
Figure 6. Summary of static storm and operation analysis results.
Applsci 15 03418 g006
Figure 7. Summary of dynamic storm analysis results.
Applsci 15 03418 g007
Figure 8. Summary of resistance-level seismic analysis results.
Applsci 15 03418 g008
Figure 9. Summary of ductility-level seismic analysis results (270°). Note: The symbol “E” denotes scientific notation, representing multiplication by 10 raised to the indicated power. For example, 1.5E3 indicates 1.5 × 10³.
Applsci 15 03418 g009
Figure 10. Results of the ultimate wave resistance analysis for a direction of 180°. Note: The symbol “E” denotes scientific notation, representing multiplication by 10 raised to the indicated power. For example, 1.5E3 indicates 1.5 × 10³.
Applsci 15 03418 g010
Figure 11. Results of the ultimate wave resistance analysis for a direction of 225°. Note: The symbol “E” denotes scientific notation, representing multiplication by 10 raised to the indicated power. For example, 1.5E3 indicates 1.5 × 10³.
Applsci 15 03418 g011
Figure 12. API S–N curves. Note: The symbol “E” denotes scientific notation, representing multiplication by 10 raised to the indicated power. For example, 1.5E3 indicates 1.5 × 10³.
Applsci 15 03418 g012
Figure 13. Summary of estimated life (in years) using API S–N curves.
Applsci 15 03418 g013
Table 1. Loads of a jacket-type marine platform.
Load CaseLoad Case DescriptionWeight
“Ton”
1Self-weight structure (Does not include flotation or marine growth)3574.90
2Dead load on the jacket 263.96
3Dead load on the topside (deck)405.92
4Live load on the topside (deck)1065.13
5Dead load of empty equipment on the topside (deck)464.69
6Live load of equipment on the topside (deck)274.57
7Piping, electrical, and instrumentation load on the topside36.30
8Dead load of equipment drilling2069.69
9Dead load of drilling tower at “Position 1”944.00
10Dead load of drilling tower at “Position 2”944.00
11Dead load of drilling tower at “Position 3”944.00
12Live load of equipment drilling 1687.53
13Load increase per operation of drilling tower at “Position 1”796.00
14Load increase per operation of drilling tower at “Position 2”796.00
15Load increase per operation of drilling tower at “Position 3”796.00
16–23Wave, current, and wind @45°—operation
24–31Wave, current, and wind @45°—extreme storm
R001–R008Wave, current, and wind @45°—ultimate resistance to waves
S000–S342Seismic environmental loads
Table 2. Environmental parameters.
DescriptionOperationExtremePushover
ParameterReferenceParameterReferenceParameterFactorTotal
Maximum wave height (m):7.60* Figure 2016.20* Figure 1316.201.3822.36
Wave period (s):8.20* Table 1712.18* Section A.1.112.181.1213.64
Astronomical tide (m):0.76* Table 170.76* Section A.1.10.761.000.76
Tide storm (m):0.30* Table 170.62* Figure 150.621.510.94
Water depth (m):50.40 50.40 50.40 50.40
Water depth including tides (m):51.46 51.78 51.78 52.10
Wave theorysteam function 3steam function 5steam function 7
Current speed (cm/s):
At 0% depth:30.00* Figure 17125.00* Figure 16125.002.04255.00
At 50% depth:25.00112.00112.002.04228.48
At 95% depth:18.00100.00100.002.04204.00
Maximum wind speed at 10 m SNMM (m/s), 1 h average:14.00* Figure 1731.00* Figure 1431.001.4043.40
* Values taken from the Specification of Pemex “P.2.0130.01:2015” [36].
Table 3. Coefficient parameters.
Coefficients
Wave kinematics coefficient:1.00* Section 8.3.2.2
Drag coefficient (Cd):1.05
Coefficient of inertia (cm.):1.20
Marine Growth
Elevation Interval Regarding NMM (m)Hard Marine Growth Thickness (cm)
(+)1.00A(−)20.007.50* Table 3
(−)20.00A(−)50.005.50
(−)50.00A(−)80.003.50
Blocking Factor for Currents
# ColumnsDirectionFactor
8Longitudinal0.80** Table 5.2
Diagonal0.85
Crossover0.80
Wind Shape Coefficients
AreaShape Coefficients
Beams1.50** Tabla 5.4
Module Surfaces1.50
Cylindrical Sections 0.50
Total Platform Area1.00
* Values taken from the Specification of Pemex “P.2.0130.01:2015” [36]. ** Values taken from “API RP 2A WSD 22ed” [35].
Table 4. Types of analysis.
ItemDescriptionLinear AnalysisNonlinear AnalysisPredictive
5.1
Operational and Static Storm
5.2
Dynamic Storm
5.3
Seismic
Resistance
5.4
Ultimate Wave
5.5
Seismic Ductility
5.6
Spectral Fatigue
3.0Analysis staticX
3.1.Pile supper element XX X
3.2.Obtaining dynamic properties XX X
3.3.1Dynamic wave X
3.3.2Seismic spectrum response X
3.3.3Transfer function X
4.0 Analysis pushover XX
5.0 ResultsXXXXXX
Table 5. Period and frequencies, platform, and Models 1, 2, and 3.
ModeFrequencies and Generalized MassMass Participation Factor Report
Based on Expanded Degrees of Freedom
FREQ. (CPS)Period (SECS)Mass Participation FactorsCumulative Factors
XYZXYZ
Model 110.36982.70450.8379 *0.00030.00050.83790.00030.0005
20.39472.53360.00040.7951 **0.00000.83820.79540.0005
30.47902.08770.00160.00070.00000.83980.79610.0005
41.05980.94360.00010.18030.00020.83990.97640.0008
51.12570.88830.14050.00030.00140.98050.97680.0021
61.29750.77070.00130.00320.00000.98180.98000.0021
71.45720.68620.00010.00020.00030.98190.98020.0025
81.66180.60170.00000.00000.00000.98190.98020.0025
92.38350.41950.00110.00140.10390.98300.98150.1064
102.40750.41540.00000.01240.00840.98300.99400.1148
112.41450.41420.00720.00040.4464 ***0.99030.99440.5613
122.54650.39270.00400.00010.35640.99430.99440.9177
133.28800.30410.00010.00000.00160.99440.99440.9192
143.47410.28780.00090.00000.00550.99520.99450.9247
153.74160.26730.00000.00040.00040.99520.99490.9251
304.15670.24060.00000.00000.00001.00000.99820.9254
Model 210.36982.70450.838 *0.0000.0010.83840.00030.0005
20.39472.53360.0000.795 **0.0000.83880.79540.0005
30.47902.08770.0020.0010.0000.84040.79610.0005
41.05980.94360.0000.1800.0000.84050.97640.0008
51.12570.88830.1400.0000.0010.98080.97670.0021
61.29750.77070.0010.0030.0000.98210.98000.0021
71.45720.68620.0000.0000.0000.98220.98010.0025
81.66180.60170.0000.0000.0000.98220.98010.0025
92.38350.41950.0020.0010.1370.98380.98150.1396
102.40750.41540.0000.0130.0020.98390.99410.1416
112.41450.41420.0070.0000.393 ***0.99090.99430.5350
122.54650.39270.0040.0000.3820.99450.99440.9172
133.28800.30410.0000.0000.0020.99460.99440.9189
143.47410.28780.0010.0000.0050.99550.99440.9241
153.74160.26730.0000.0000.0000.99550.99480.9245
304.15670.24060.0000.0000.0000.99890.99810.9249
Model 310.36972.70480.8382 *0.00040.00050.83820.00040.0005
20.39402.53790.00050.7934 **0.00000.83870.79380.0005
30.47542.10340.00160.00130.00000.84030.79510.0005
41.05700.94610.00010.18050.00020.84040.97560.0008
51.12550.88850.14020.00040.00130.98060.97600.0021
61.28980.77530.00140.00380.00000.98210.97980.0021
71.45530.68710.00010.00020.00040.98220.98000.0025
81.54840.64580.00000.00000.00010.98220.98000.0026
92.08320.48000.00000.00000.00070.98220.98000.0032
102.38970.41850.00380.00700.33910.98600.98710.3423
112.40120.41650.00420.00710.21970.99030.99420.5620
122.54330.39320.00410.00010.3475 ***0.99430.99430.9095
132.95450.33850.00000.00000.00130.99430.99430.9108
143.21590.31100.00020.00000.00290.99450.99430.9137
153.31190.30190.00070.00010.00940.99520.99440.9231
304.14780.24110.00000.00000.00000.99890.99790.9245
* Maximum value in “X”, ** maximum value in “Y”, *** maximum value in “Z”.
Table 6. Numerical data of the acceleration spectrum.
Campeche Bay
Period (second “s”)Acceleration “α” (g’s)
0.010–0.0500.100
0.125–0.5040.250
100.013
Numerical data of the acceleration spectrum for a return period of 200 years and a critical damping coefficient of 5%. Values taken from the Specification of Pemex “P.2.0130.01:2015” [36].
Table 7. Shear and moment versus direction: damping 2% vs. damping 5%.
Angle DegDamping 2%Damping 5%
Base ShearOverturning MomentVertical LoadBase ShearOverturning MomentVertical Load
TonTon-MTonTonTon-MTon
0679.4422,125.671314.98687.6222,511.321509.55
18684.5823,456.371314.98696.1924,285.961509.55
36691.1425,278.761314.98704.3426,822.541509.55
54696.2927,093.881314.98708.5329,189.431509.55
72698.0028,528.011314.98706.6530,995.491509.55
90698.5228,694.711314.98702.7231,175.571509.55
108700.2728,380.621314.98708.2030,864.821509.55
126697.4026,880.031314.98709.1729,026.761509.55
144691.0424,578.741314.98704.2126,117.741509.55
162684.7622,247.351314.98696.7323,031.731509.55
180679.4422,125.671314.98687.6222,511.321509.55
198684.5823,456.371314.98696.1924,285.961509.55
216691.1425,278.751314.98704.3426,822.541509.55
234696.2927,093.871314.98708.5329,189.421509.55
252698.0028,528.011314.98706.6530,995.491509.55
270698.5228,694.711314.98702.7231,175.571509.55
288700.2728,380.621314.98708.2030,864.821509.55
306697.4026,880.031314.98709.1729,026.761509.55
324691.0424,578.751314.98704.2126,117.741509.55
342684.7622,247.351314.98696.7323,031.731509.55
maximum700.27 *28,694.71 **1314.98709.17 *31,175.57 **1509.55
* Maximum Base Shear, ** Maximum Overturning Moment.
Table 8. Resistance Reserve Factor (RSR).
Resistance Reserve Factor (RSR)Collapse Mechanism
DirectionLoad FactorMaximum Shear
(Ton)
Shear
(Ton)
RSRRSR
Minimum
StatusCollapse ByPile Capacity
Plasticization of ElementsPile
Collapse
%PileType
1.0205517.152022.392.7282.20OKYESNO81.7%P008Compression
451.0055809.172130.642.7262.20OKYESNO92.3%P008Compression
901.0906596.932350.792.8062.20OKYESNO71.8%P008Compression
1351.0055665.082080.092.7232.20OKYESNO81.9%P007Tension
1801.0205534.182038.552.7152.20OKYESNO63.1%P007Tension
2250.9955707.432131.812.6772.20OKYESNO84.6%P008Tension
2701.0856573.622347.362.8002.20OKYESNO71.2%P005Compression
3151.0355907.952062.582.8642.20OKYESNO90.5%P007Compression
Table 9. Factors related to fatigue life for weld improvement techniques.
Weld Improvement TechniqueImprovement Factors for “S”Improvement Factors for “N”Type
Profile (see 14.1.3.4) * τ 0.1   a variesWJ1
Weld toe burr grinding1.252WJ2
Hammer peening1.564WJ3
Chord side only
* Values taken from “API RP 2A WSD 22ed” [35].
Table 10. Summary results of the structural analysis.
Revision(i) Operation and Static Storm(ii) Dynamic Storm(iii) Seismic Resistance(iv) Seismic Ductility(v) Ultimate Wave Resistance(vi) Spectral FatigueStatus
Reference valueUC < 1.00UC < 1.00UC < 1.00Cr > 2.0RSR > 2.20Life > 20 years
Unity check (UC) ratio in structural membersTOPSIDE:
UC = 0.81
TOPSIDE:
UC = 0.64
TOPSIDE:
* UC = 1.001
OK
JACKET:
UC = 0.93
JACKET:
UC = 0.99
JACKET:
UC = 0.631
OK
PILES:
UP = 0.77
Down = 0.75
PILES:
UP = 0.81
Down = 0.79
PILES:
UP = 0.530
Down = 0.504
OK
Unity check (UC) ratio in tubular membersLOAD = 0.783
STR = 0.968
LOAD = 0.777
STRN = 0.969
LOAD = 0.447
* STRN = 1.048
OK
Safety factorOperation = 2.18 > 2.00
Storm = 1.58 > 1.50
Storm = 1.52 > 1.50Seismic = 2.04 > 2.00OK
Hydrostatic collapse* YES
(strengthen)
* YES
(strengthen)
* YES
(strengthen)
Reinforce with Rings
RSR
Cr (Seismic)
“Cr”:
8.53
“RSR”
2.68
OK
Minimum life in years
Node 370
WJ0 = 9.2
WJ1 = 13
WJ2 = 27
Apply
Burr Grinding
in Node 370
* Elements experiencing overstress are recommended for reinforcement
Disclaimer/Publisher’s Note: The statements, opinions and data contained in all publications are solely those of the individual author(s) and contributor(s) and not of MDPI and/or the editor(s). MDPI and/or the editor(s) disclaim responsibility for any injury to people or property resulting from any ideas, methods, instructions or products referred to in the content.

