Article

Numerical Analysis on the Performance of a Heat Pump Powered by Surface Water Freezing

School of Environmental and Municipal Engineering, Lanzhou Jiaotong University, Lanzhou 730070, China
*
Author to whom correspondence should be addressed.
Appl. Sci. 2025, 15(7), 3421; https://doi.org/10.3390/app15073421
Submission received: 12 February 2025 / Revised: 9 March 2025 / Accepted: 13 March 2025 / Published: 21 March 2025
(This article belongs to the Section Applied Thermal Engineering)

Abstract

:
To better use surface water resources to heat buildings in cold regions, the direct surface water solidification heat source heat pump system is proposed in this paper. With the help of Simulink software R2021a, a numerical model of the heat pump is built and the effects of evaporation temperature and water velocity and temperature at the evaporator inlet on its performance are numerically studied. The results show that, when the evaporation temperature is −3~−5 °C, the surface water inlet temperature is 1~3 °C, and the inlet water flow rate is 0.1~0.5 m/s. With a decrease in the evaporation temperature, increase in the inlet water temperature, and increase in the inlet water flow rate, the heating capacity of the surface water solidified heat pump is gradually increased and eventually stabilized, and the COP of the system is gradually decreased and eventually maintained at the same level. During the stable operation of the system, when the evaporation temperature is −3 °C, the evaporator inlet water velocity is 0.1 m/s and the evaporator inlet water temperature is 1 °C. The COP has maximum values of 3.02, 3.72, and 3.86, respectively. The optimal deicing time is about 15 min.

1. Introduction

As environmental problems are exacerbated and the deadlines for the “double carbon” goals approach [1], clean heating based on heat pumps has been popularized, but in cold regions, they have performance shortcomings. The air source heat pump system has limited use in regions with low outdoor temperatures due to the contradiction between heat supply and demand and frosting problems. References [2,3] showed the frost effect on the performance of the air source heat pump in different areas of China. The performance decreases year by year with a shallow ground source heat pump system, and the huge investment it requires limits people’s desire to install one in cold areas. Because of the potential impact on groundwater resources, the groundwater source heat pump system is not the first choice for clean heating. Papers [4,5] analyze the blocking problem affecting the heat exchanger in a sewage source heat pump system. Utilizing rivers and lakes, the traditional surface water source heat pump system has been widely used in areas with mild temperatures due to its low cost and relatively stable performance; its COP is usually 3.0–3.5 and its positive effect on the environment is significant. But, in cold areas, its application is limited because the surface water temperature is usually lower than 5 °C and the water is often frozen in some periods [6]. Although there may be nearby rivers or lakes, the heating solutions in these cold areas usually depend on fossil fuels, such as coal and natural gas. If the evaporator of the heat pump can adopt a lower evaporation temperature and directly extract the solidification latent heat, of about 336 kJ/kg, from the surface water, the heating demand in cold areas with rivers or lakes could be met. The practical significance of this development is great.
The heating feasibility of the surface water solidification heat source heat pump system in cold areas is addressed by existing research and real-world projects. Reference [7] showed that the solidification heat source heat pump system can be used in China’s water source environment. Reference [8] put forward a theoretical relationship between the cold water temperature and the heating load to support the design and operation of the surface water solidification heat source heat pump system. Reference [9] provided a project case of the solidification heat source heat pump system in Qingdao City and quantitatively compared its energy consumption, initial investment, and operating cost with the traditional water source heat pump.
Usually, the heat exchanger is used to supply the intermediate (often liquid alcohol), heated by low-temperature water to the heat pump evaporator, in which the surface water from rivers or lakes flows in a tube and freezes, while the intermediate flows outside the tube [10,11,12,13,14,15,16,17,18,19,20]. The deicing methods for the heat exchanger include built-in mechanical scraper deicing [7], impact deicing [16], mechanical spiral deicing [21,22], and ring deicing [23]. Reference [11] designed a kind of external ice brush rotary scraping deicing device. Reference [17] used the condenser heat to deice the heat exchanger by hot melting. Reference [24] used the elastic structure of regular micro-deformation to break the thin ice on the wall regularly. It is clear that heat pump systems and their deicing methods mentioned above are complex, have low efficiency, and easily fail. So, a solidification heat source heat pump with simpler and more efficient characteristics is needed.
In addition, Simulink software has been widely used in the design and research into refrigeration systems, because it can accurately show complex energy-exchange processes [25,26]. In view of the above considerations, this paper innovatively proposes a heat pump system that can directly collect the solidification heat of water using its shell–tube evaporator, in which water flows outside a tube and freezes, while refrigerant flows in the tube. Using Simulink software, a numerical model of the surface water heat pump system with a solidification heat evaporator is firstly built, and prediction of the system performance follows, including the effects of the evaporation temperature, inlet water temperature, and flow rate on system performance and COP. This paper fills a gap in the literature and paves the way for the application of the new type of heat pump system proposed in this paper in cold areas.

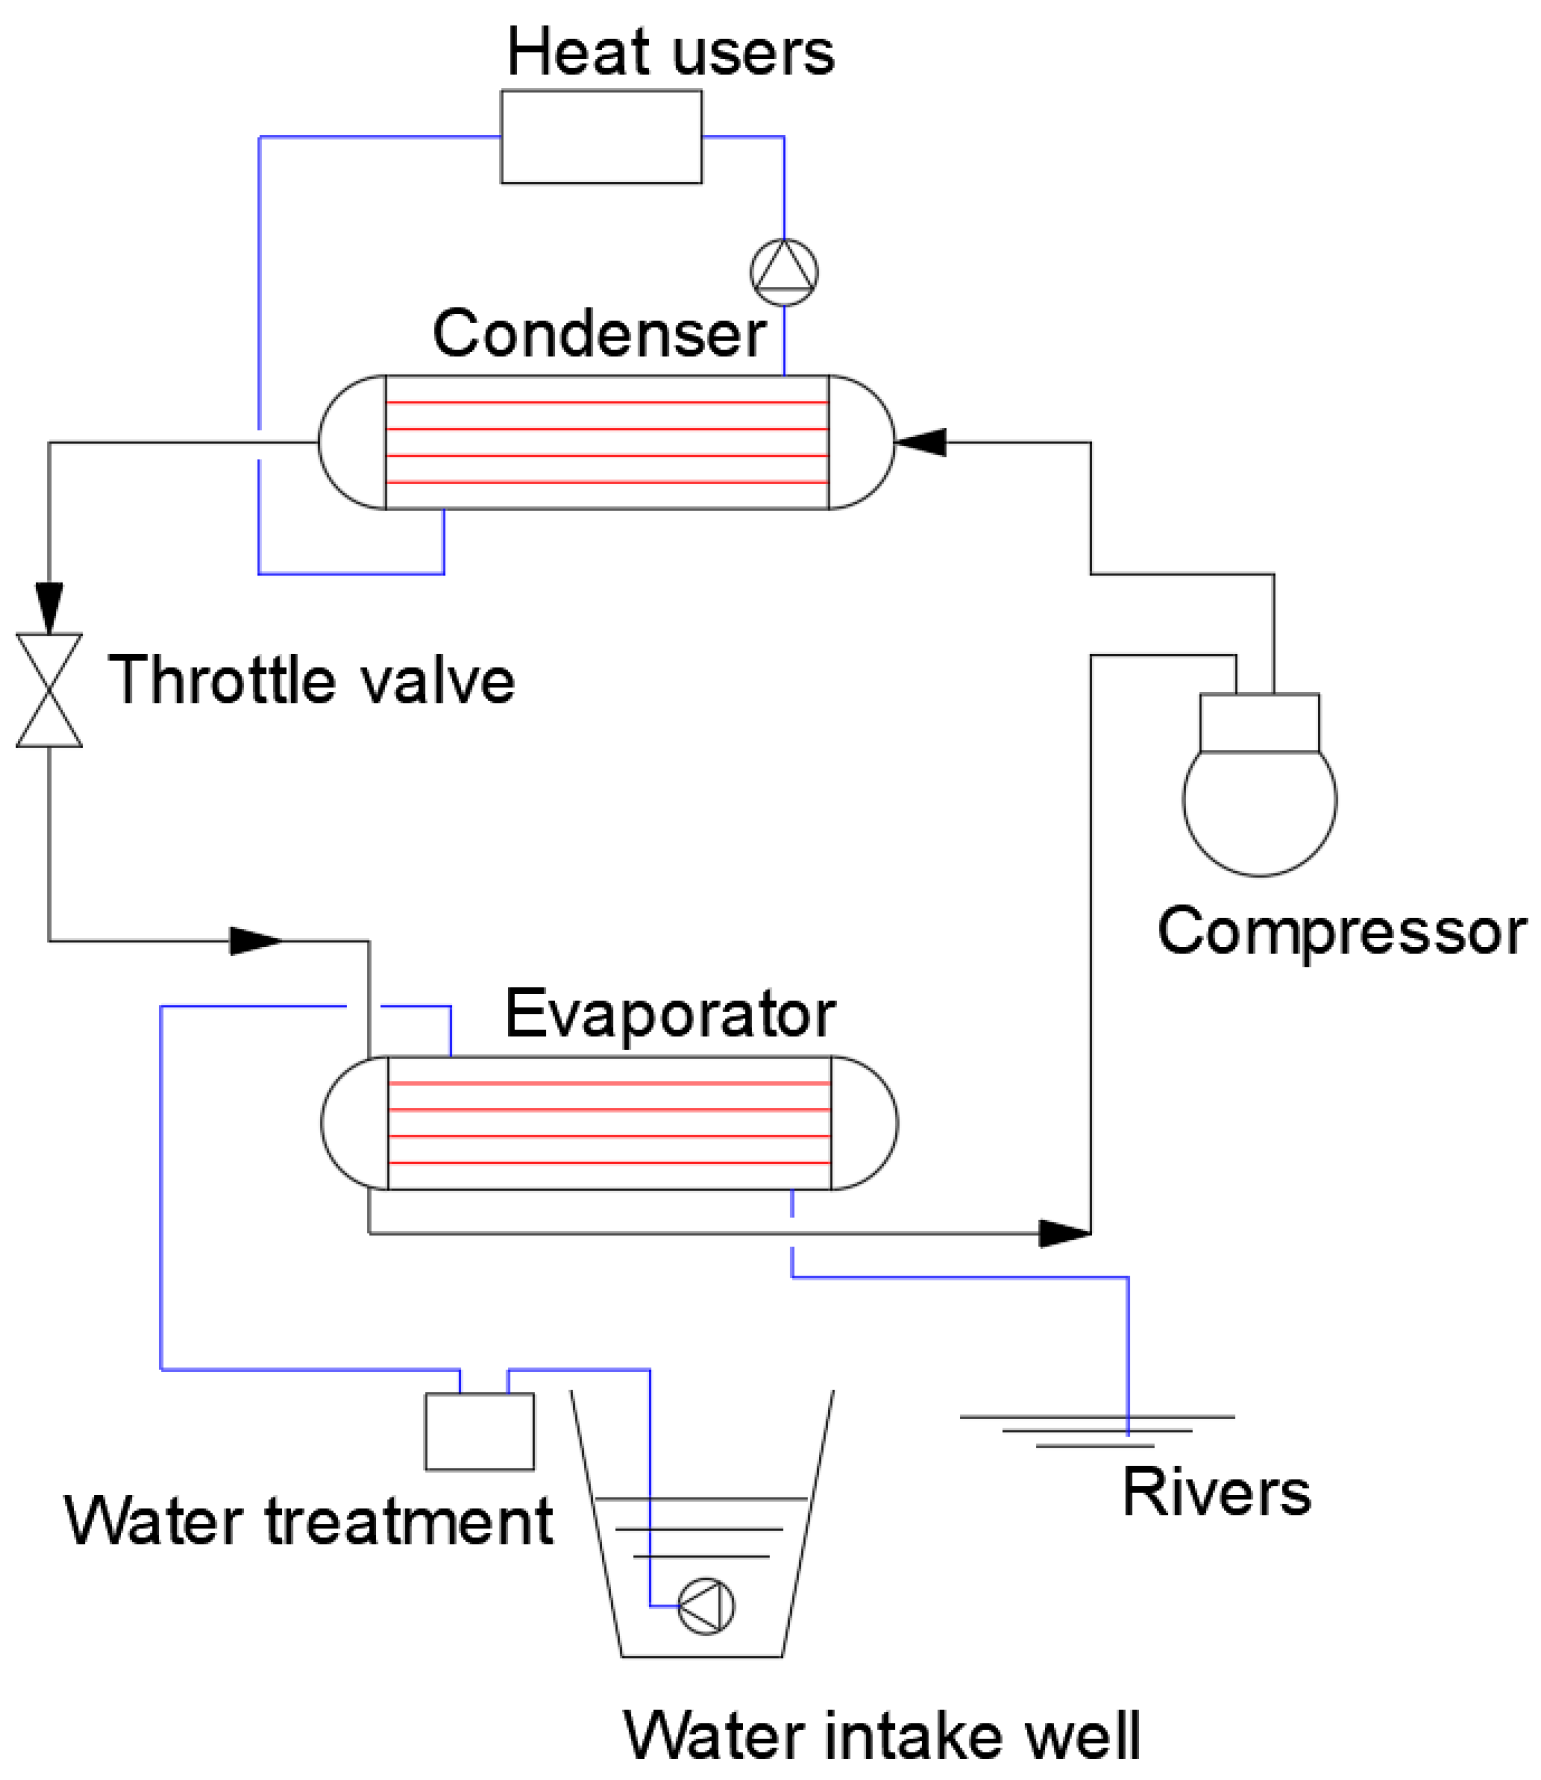
2. The Heat Pump System and Its Numerical Model

Figure 1 shows the direct surface water solidification heat source heat pump (WSHP) heating system, including the surface water circulation system, the refrigerant circulation system, and the user heating circulation system. The heat pump mainly includes a shell–tube solidification heat evaporator, shown in Figure 2, condenser, compressor, and expansion valve and the specific structural parameters of the evaporator are shown in Table 1. Firstly, the filtered low-temperature surface water in the riverbed wells is forced by the submersible pump to flow past the shell side of the evaporator and back to the river. In this process, some ice is formed along the tube’s external surface, and so deicing is often needed. Then, the refrigerant is circulated by the compressor along the route 1–2–3–4–5–6–1 shown in Figure 3, which gives a pressure–enthalpy diagram. At point 1 of the evaporator outlet and the compressor inlet, the refrigerant is a superheated gas of low temperature and low pressure; at point 2 of the compressor outlet and the condenser inlet, the refrigerant is also a gas of high temperature and high pressure; at point 5 of the condenser outlet and the expansion valve inlet, the refrigerant is a subcooled liquid of low temperature and high pressure; and at point 6 of the expansion valve outlet and the evaporator inlet, the refrigerant is a liquid with a little gas of low temperature and low pressure. Finally, the water circulated by the circulation pump obtains the heat in the heat pump condenser, and by doing so, it provides heating for the user.
In this section, simulation models of the evaporator, compressor, condenser, and throttle valve in a heat pump are built, respectively, and then four unit models are numerically connected to obtain the simulation model of the heat pump. Following this, the dependence of the heat pump system performance on the inlet water velocity, the inlet water temperature, and the evaporation temperature of the evaporator is numerically analyzed.

2.1. Evaporator Model

Based on ref. [27], the simulation model of the shell–tube direct solidification heat evaporator is built as shown in Figure 2, which has 4 tube processes in total including 64 copper tubes. In order to prevent blocking in the evaporator, the tube diameter is 10 mm and the tube pitch is 80 mm [27].
When the low-temperature water flows into the evaporator, its sensible heat is firstly released, and then its latent heat follows and the ice is formed, including fixed ice attached to the tube wall and the flowing ice in the water. Reference [27] shows that a larger water flow can take more flowing ice. Under stable operating conditions in the evaporator, the heat released by the low-temperature water Qd is equal to the heat absorbed by the refrigerant Qr,ev, which can be calculated by Equation (1) and Equation (2), respectively.
Q d = Q s + Q l = A ev l ev h d ( t d 1 t i ) + I P F s × m g × r
Q r , ev = m r ( h ev , sg h ev , in ) + m r ( h ev , out h ev , sg )
By inputting boundary conditions including freezing time, evaporation temperature, superheat degree, inlet water temperature, inlet water velocity, and freezing characteristics on the water side into the model, simulation calculation of the direct freezing heat evaporator is carried out. The heat exchange amount of the freezing heat evaporator and the refrigerant flow required by heat pump system can be obtained. In the calculation, the flowing ice fraction is assumed to be 20%, 25%, and 30% of ice corresponding to the inlet water velocity of 0.1 m/s, 0.3 m/s, and 0.5 m/s, respectively.

2.2. Compressor Simulation Model

The working process of the compressor is regarded as isentropic compression described by Equations (3)–(5). By inputting boundary conditions including evaporation temperature, condensation temperature, superheated degree, and refrigerant mass flow into the model, the compressor discharge temperature and isentropic power are obtained by simulation. During the modeling process, the following assumptions are applied:
(1)
The compression process is regarded as adiabatic compression, ignoring the heat exchange between the compressor shell and the surrounding environment.
(2)
Regardless of the pressure loss of the refrigerant at the inlet and outlet of the compressor, the evaporator outlet pressure is equal to the compressor suction pressure, and the condenser inlet pressure is equal to the compressor discharge pressure.
(3)
Do not consider the friction power consumption in the compressor, the influence of lubricating oil, etc.
P d P r = ( v r v d ) k
T d T r = ( P d P r ) k 1 k
w = k k 1 P r v r [ 1 ( P d P r ) k 1 k ]

2.3. Condenser Simulation Model

In the condenser, the heating water flows outside the tubes and obtains heat for heating, and the heat transfer process of refrigerant along the tubes can be divided into the superheated zone, two-phase zone, and subcooled zone. The relationships between the heats released by refrigerant Qr,c, Qr,tp, Qr,sc and the heats absorbed by the high-temperature heat source water Qg,c, Qg,tp, Qg,sc are shown as Equations (6), (7), and (8), respectively [27], when the heat loss is neglected.
Q r , c = m r ( h c , in h c , out ) = Q g , c = m g c p ( t c , out t c , in ) = K c A co l c Δ t m , c
Q r , tp = m r ( h c , out h sc , in ) = Q g , tp = m g c p ( t c , in t sc , out ) = K tp A co l tp Δ t m , tp
Q r , sc = m r ( h sc , in h sc , out ) = Q g , sc = m g c p ( t sc , out t sc , in ) = K sc A co l sc Δ t m , sc
In the simulation, the tube inner diameter of the condenser is 24 mm and the tube outer diameter is 25 mm, the tube total length is 120 m, the tube spacing is 50 mm, and the inlet water flow rate is 3 kg/s. By inputting the condensation temperature, condensation pressure, compressor discharge temperature, refrigerant mass flow rate and subcooled degree, inlet water temperature of the two-phase region, and inlet water temperature of the subcooled region into the model, the simulation calculation of the condenser is carried out. The results include the heat exchange amount and heat exchange tube length of the superheated region, inlet water temperature, heat exchange amount and heat exchange tube length of the subcooled region, and outlet water temperature.

2.4. Simulation Modeling of Expansion Valve

By the expansion valve, the pressure of the liquid refrigerant is decreased and accompanied by a small amount of vaporization. If the heat exchange between the refrigerant and the external environment is neglected during the expansion process, the enthalpy at point 4 is equal to the enthalpy at point 5, which can be obtained by inputting boundary conditions such as refrigerant mass flow rate and enthalpy at the inlet of the expansion valve.

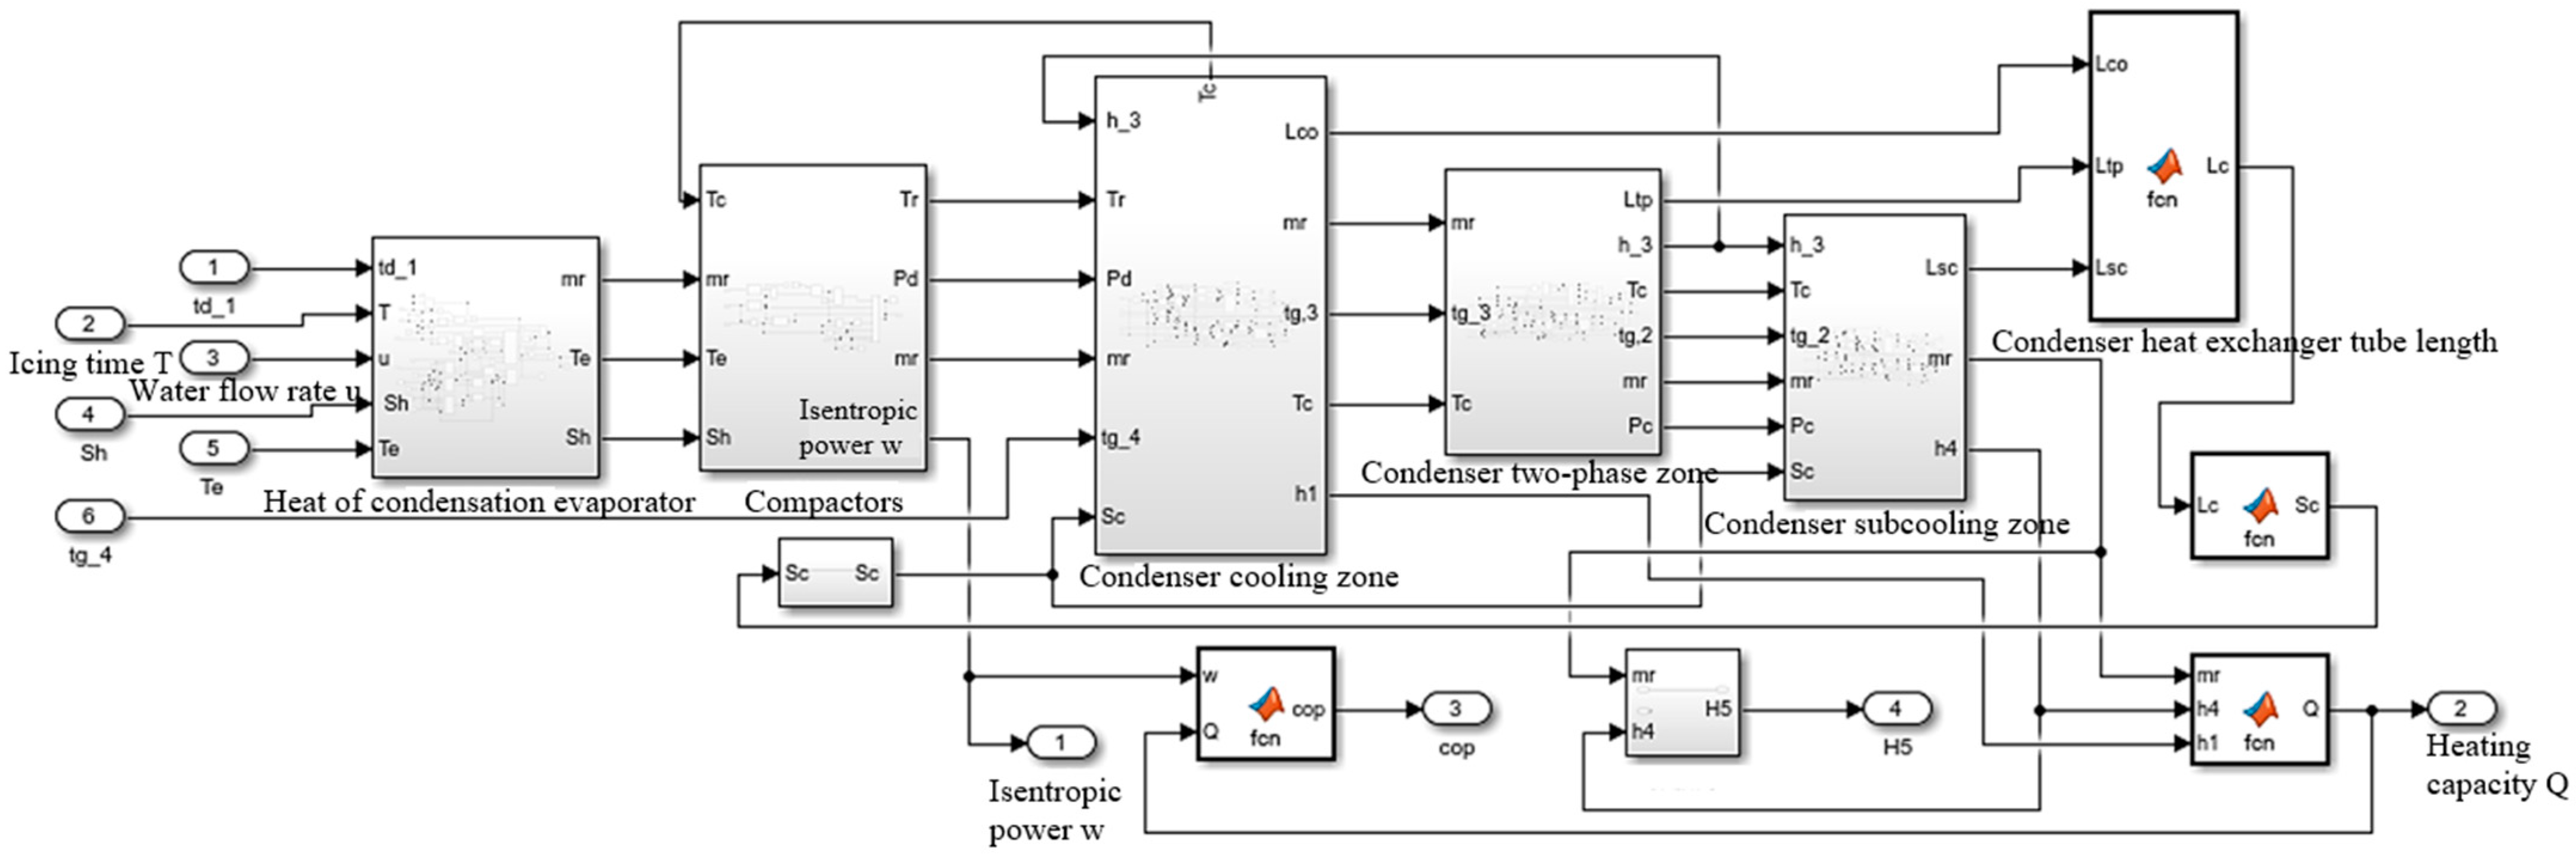
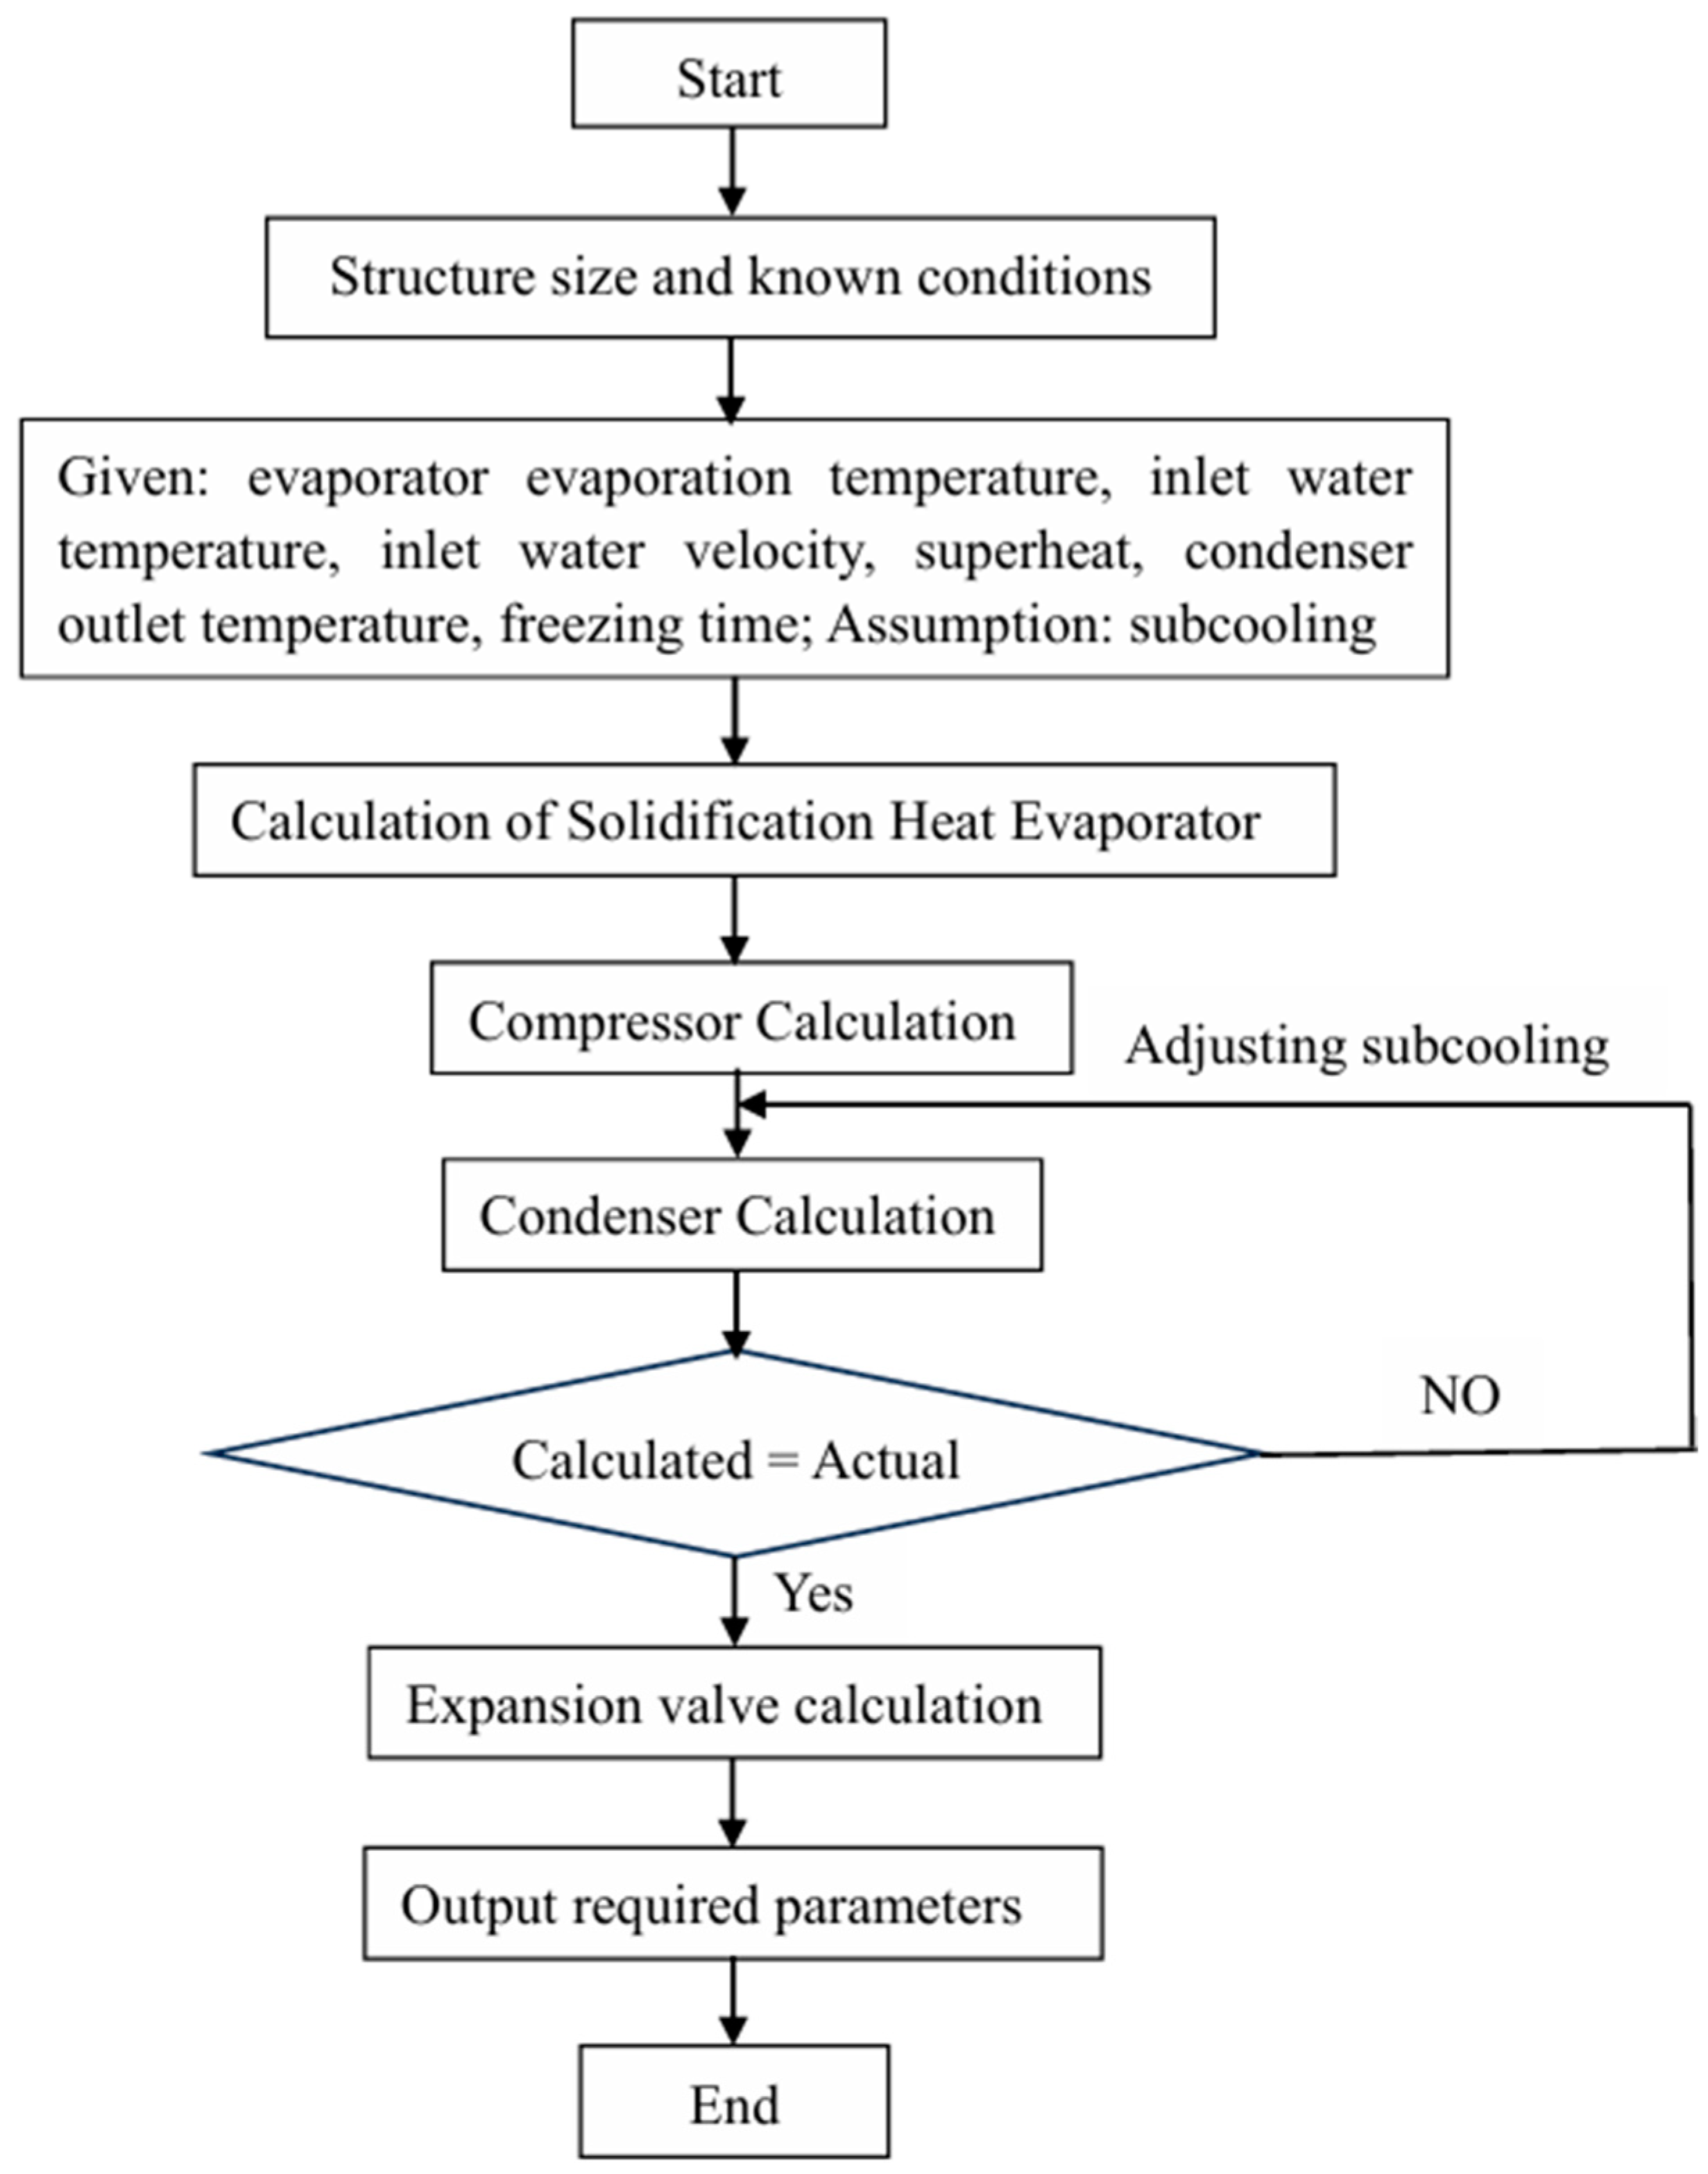
2.5. Simulation Model and Method of Heat Pump System

If the heat loss and the resistance of the refrigerant along the pipeline are neglected, the simulation model of the direct surface water solidification heat source heat pump shown in Figure 4 is obtained by connecting the above four component models.
After inputting the freezing time, superheat degree, evaporation temperature, inlet water flow rate, inlet water temperature, and time-by-time change value of ice content rate under corresponding working conditions of the freezing heat evaporator, as well as boundary conditions such as condenser supercooling degree, heating water flow rate, and outlet water temperature, simulation calculation is carried out. The calculation process is shown in Figure 5.

2.6. Validation of Simulation Models and Methods

The experimental data of reference [28] shown in Figure 6 are selected to verify the numerical model and method of the indirect system. The temperature of the intermediate medium at the evaporator outlet is considered equivalent to the evaporation temperature. When the evaporation temperature (intermediate medium temperature at the outlet) is −4 °C and −6 °C, respectively, the terminal water supply temperature is 43~50 °C, and the simulated COP of the heat pump system is shown in Figure 6.
Because the larger compression ratio of the compressor resulting from the larger temperature difference between the evaporator and the condenser, COP of the heat pump decreases when the heating water temperature increases, and COP at the evaporation temperature of −4 °C is higher than that of −6 °C. The change trends of COP are the same between the simulation and experiment, but simulated COP is higher. Under evaporation temperatures of −4 °C and −6 °C, the maximum errors between simulation results and experimental data are 5.7% and 8.7%, respectively. The reasons for the error may be [28] (1) the heat transfer efficiency of the system in this paper is higher, (2) the heat loss of the unit is not considered in the simulation process, (3) the system and its components are idealized in the simulation process.

3. Results and Analysis

The simulation calculation is carried out under seven conditions shown in Table 2. When the heat pump starts to work, the water at low temperature enters into the evaporator, and the ice is formed on the outside tube of the evaporator and thickens over the working time till a balance state is reached.

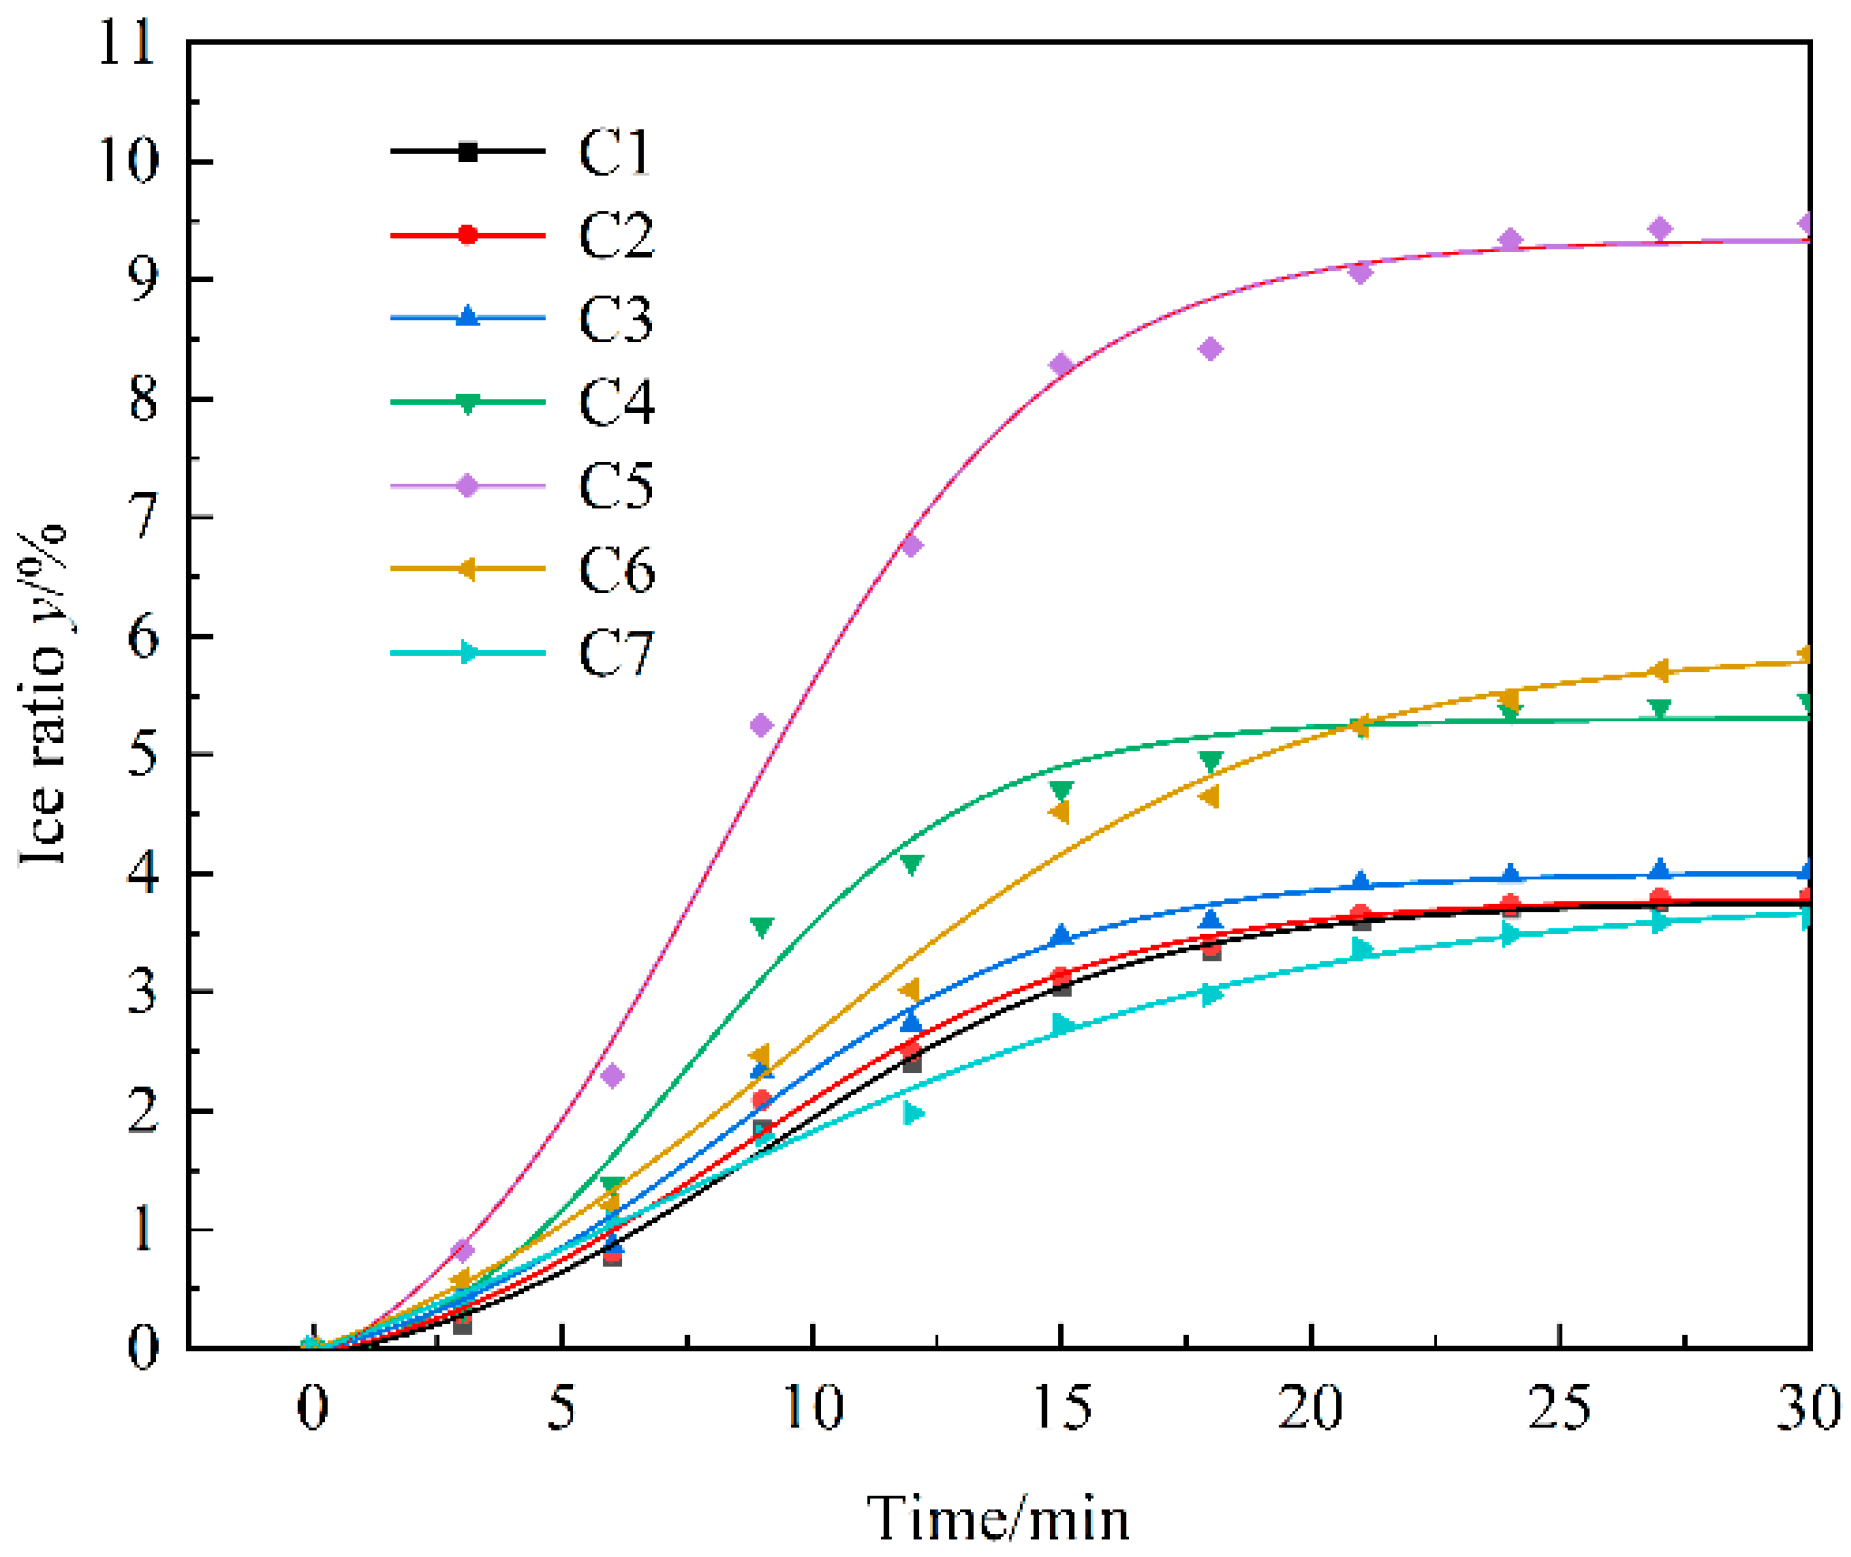
3.1. Analysis of Ice Rate of Water in Evaporator

In order to indicate the evaporator performance during the freezing process, it is necessary to firstly analyze the ice rate of water in the evaporator. With the help of software, the numerical results of the ice rate in the seven operating conditions and their fitting curves are indicated in Figure 7. According to the Boltzmann model and Figure 7, prediction Equation (9) of the ice ratio y in water is fitted. The coefficients of A1 and A2 and the initial time of t0 and time step of dx are given in Table 2.
y = A 2 + A 1 A 2 1 + e x x 0 d x
When the water at low temperature flows into the evaporator, its sensible heat is firstly released. Then, its latent heat follows and the ice is formed. The ice rates in the evaporator under various conditions sharply increase firstly with time. Then, they tend to smooth, of which the change in the ice rate in the C5 condition is the most obvious.

3.2. Effect of Evaporation Temperature

Figure 8a shows the effect of evaporation temperatures on the exhaust temperature Tr from the compressor. Because the water freezing and its latent heat released increase in the evaporator at a lower evaporation temperature, the heat exchange between water and refrigerant and the evaporation capacity of the refrigerant also increase, which results in a larger evaporation pressure and Tr. The lower the evaporation temperature, the higher Tr is. During working time, on the one hand, the freeze contributes to increasing heat exchange and refrigerant evaporation in the evaporator. On the other hand, the thermal resistance due to the ice layer tends to decrease heat exchange. Finally, the quasi-equilibrium state is obtained when both trends intersect. In the same evaporation temperature condition, Tr sharply increases at first. Then, Tr is almost constant after 15 min due to approaching a stable state. In the stable state, Tr values are about 102.7 °C, 103.9 °C, and 105.1 °C, corresponding to the evaporation temperatures of −3 °C, −5 °C, and −7 °C.
Because the ice and its latent heat increase in the evaporator with working time and lower evaporation temperature, the evaporation capacity increases, which results in a larger isentropic power w consumed by the compressor. Figure 8a also shows the effects of evaporation temperatures on w, which are similar to those on Tr. The lower the evaporation temperature, the higher the isentropic power w is. In the same evaporation temperature conditions, during working time, w sharply increases at first. Then, w is almost constant in the stable state after 15 minutes. In the stable state, w is about 144.65, 155.45, and 166.50, corresponding to the evaporation temperatures of −3 °C, −5 °C, and −7 °C.
Figure 8b shows the effect of evaporation temperatures on the heating capacity Q. The lower the evaporation temperature, the higher Q is. This is because the evaporation capacity in the evaporator increases due to more water being iced and its latent heat released at lower evaporation temperatures. As working time progresses and the more heat obtained and refrigerant evaporated in the evaporator, the Q of the condenser sharply increases at first. Then, the Q is almost constant after 15 minutes due to approaching the stable state. In the stable state, Q is about 435.32 kW, 454.83 kW, and 475.87 kW, corresponding to the evaporation temperatures of −3 °C, −5 °C, and −7 °C.
Figure 8b also shows the effect of evaporation temperatures on the system heating performance coefficient COP. The higher the evaporation temperature, the greater the COP is. This is because the w of the compressor decreases. Although a higher evaporation temperature means a larger heating capacity, w is also larger and its increase rate is higher than that of Q. As the working time progresses, in the same evaporation temperature conditions, COP sharply decreases at first. Then, COP is almost constant in the stable state after 15 minutes, which depends on the change in w and Q. In the stable state, COP is about 3.02, 2.94, and 2.86, corresponding to the evaporation temperatures of −3 °C, −5 °C, and −7 °C, respectively. The COP of the heat pump recommended in this paper is a little lower than that of the traditional surface water source heat pump because COP is positively correlated with the evaporative temperature.
Based on the analysis above, the optimal time to deice the evaporator should be about 15 min.

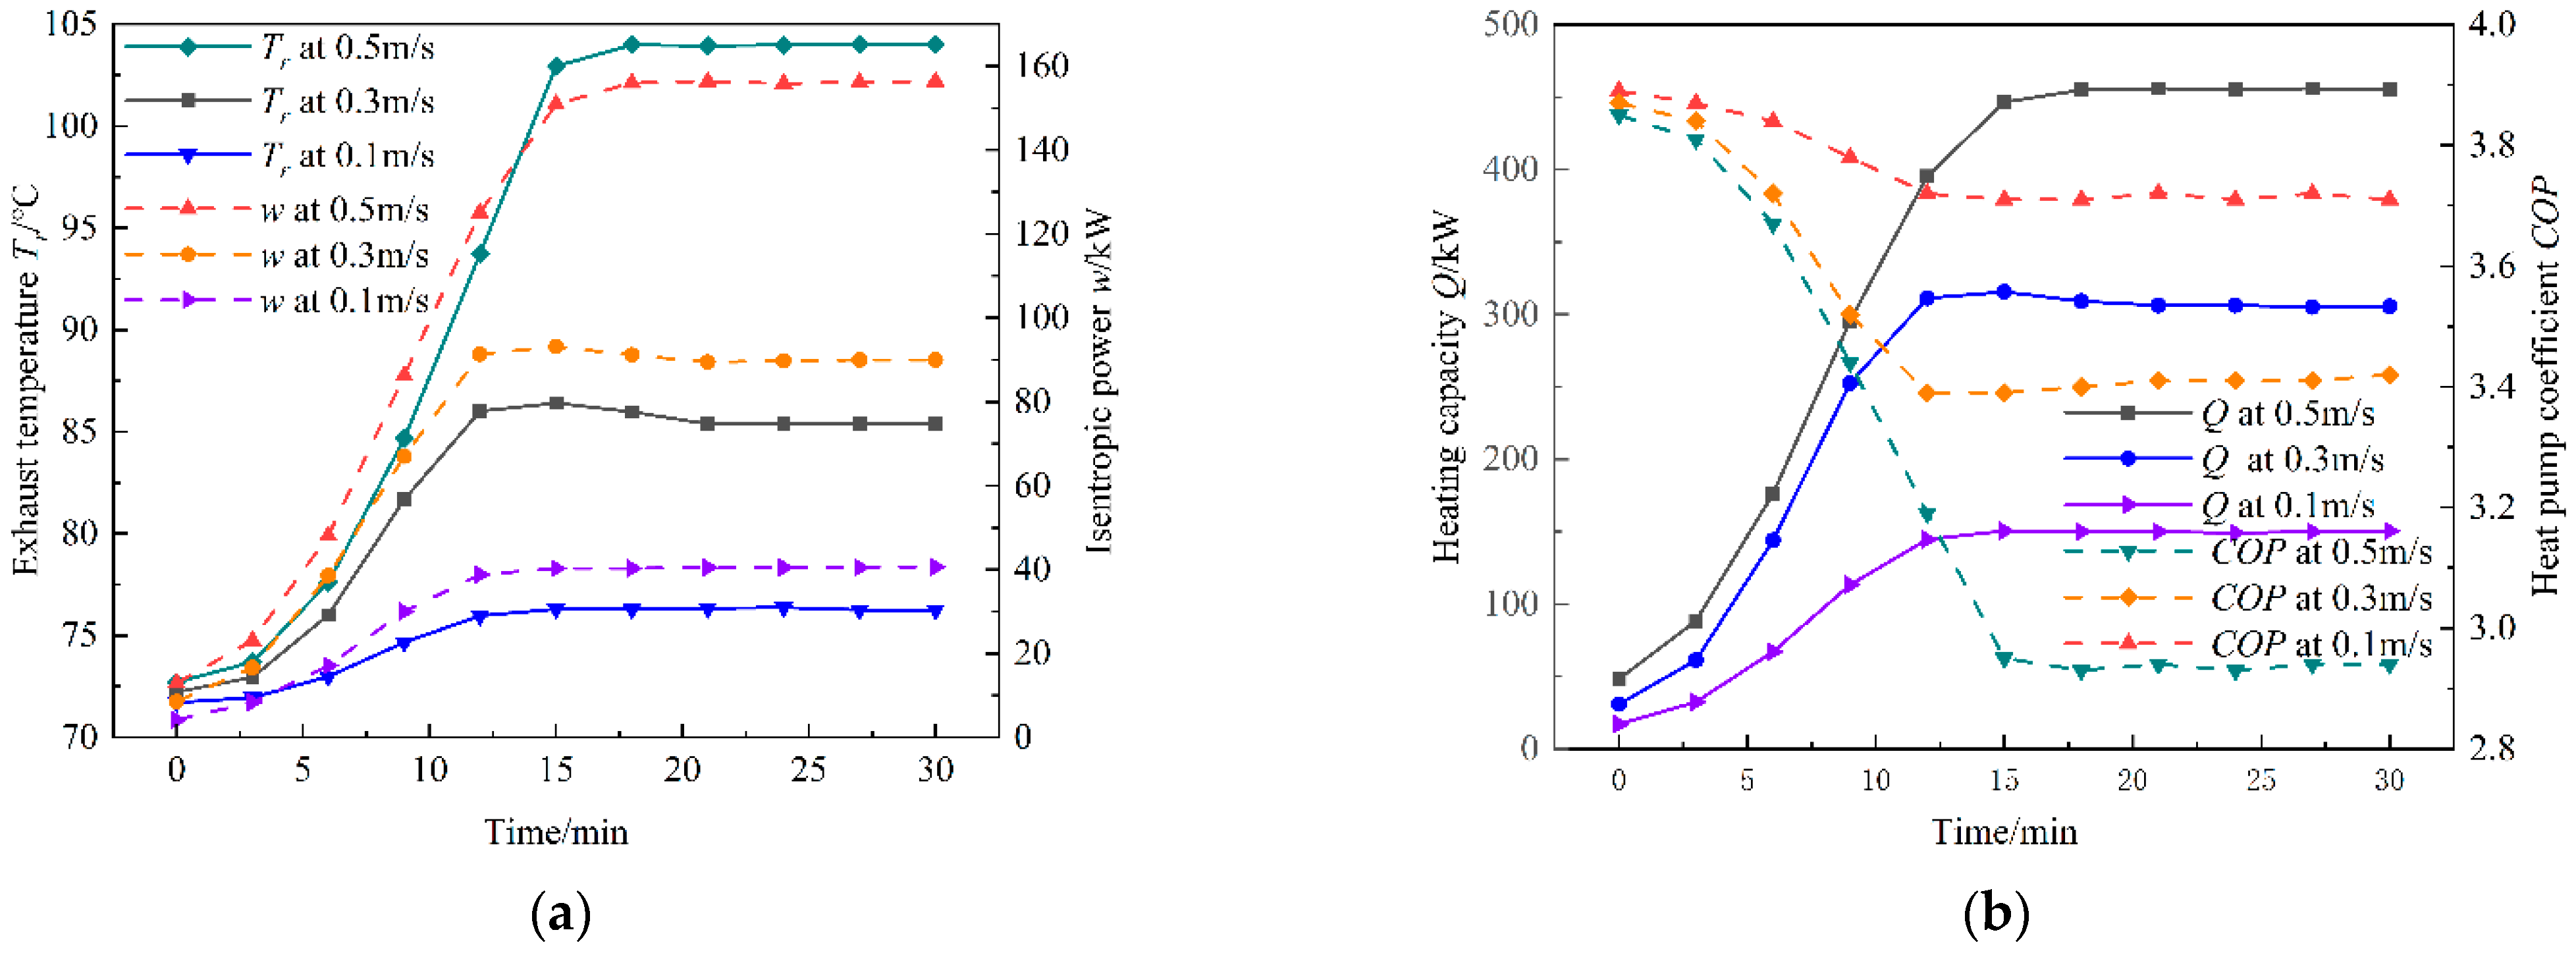
3.3. Effect of Water Velocity at Evaporator Inlet

Figure 9a shows the effect of water velocity at the evaporator inlet on the compressor exhaust temperature Tr. The higher the inlet water flow rate, the higher Tr is, and its effect increases as the inlet water velocity increases. This is because the higher inlet water velocity contributes to more ice formed and greater heat absorbed by the refrigerant, which results in more refrigerant evaporation and a higher Tr. In the same velocity condition, as working time progresses, Tr sharply increases at first. Then, Tr is almost constant after 15 minutes due to approaching a stable state. In the stable state, Tr is about 76.3 °C, 85.4 °C, and 104 °C, corresponding to the inlet water velocities of 0.1 m/s, 0.3 m/s, and 0.5 m/s.
Figure 9a also shows the effect of inlet water velocity on the isentropic power w consumed by the compressor. The greater the inlet water velocity, the higher w is, for the same reason as for Tr, and the more evaporation. In the same way, as working time progresses, w sharply increases at first. Then, w is almost constant after 15 minutes due to approaching a stable state. When the stable state is reached, w is about 40.5 kW, 90 kW, and 156 kW, corresponding to the inlet water velocities of 0.1 m/s, 0.3 m/s, and 0.5 m/s.
Figure 9b shows effects of the inlet water velocity on the heating capacity Q. The higher the inlet water flow rate in the evaporator, the higher Q is, for the same reason as for w, and the more evaporation. As working time progresses, Q sharply increases at first. Then, Q is almost constant after 15 minutes due to approaching a stable state. When the stable state is reached, Q is about 151 kW, 307 kW, and 457 kW, corresponding to the inlet water velocities of 0.1 m/s, 0.3 m/s, and 0.5 m/s.
Figure 9b shows effects of the inlet water velocity on the performance of coefficient COP. Although the higher the flow rate, the higher Q is, w also has a larger increase, which results in a greater inlet water flow rate in the evaporator, and the smaller the COP of the system. After stabilization, COP is about 3.72, 3.39, and 2.94, corresponding to the inlet water velocities of 0.1 m/s, 0.3 m/s, and 0.5 m/s.
It is indicated once more that the optimal deicing time of the system under the discussed conditions is about 15 minutes.

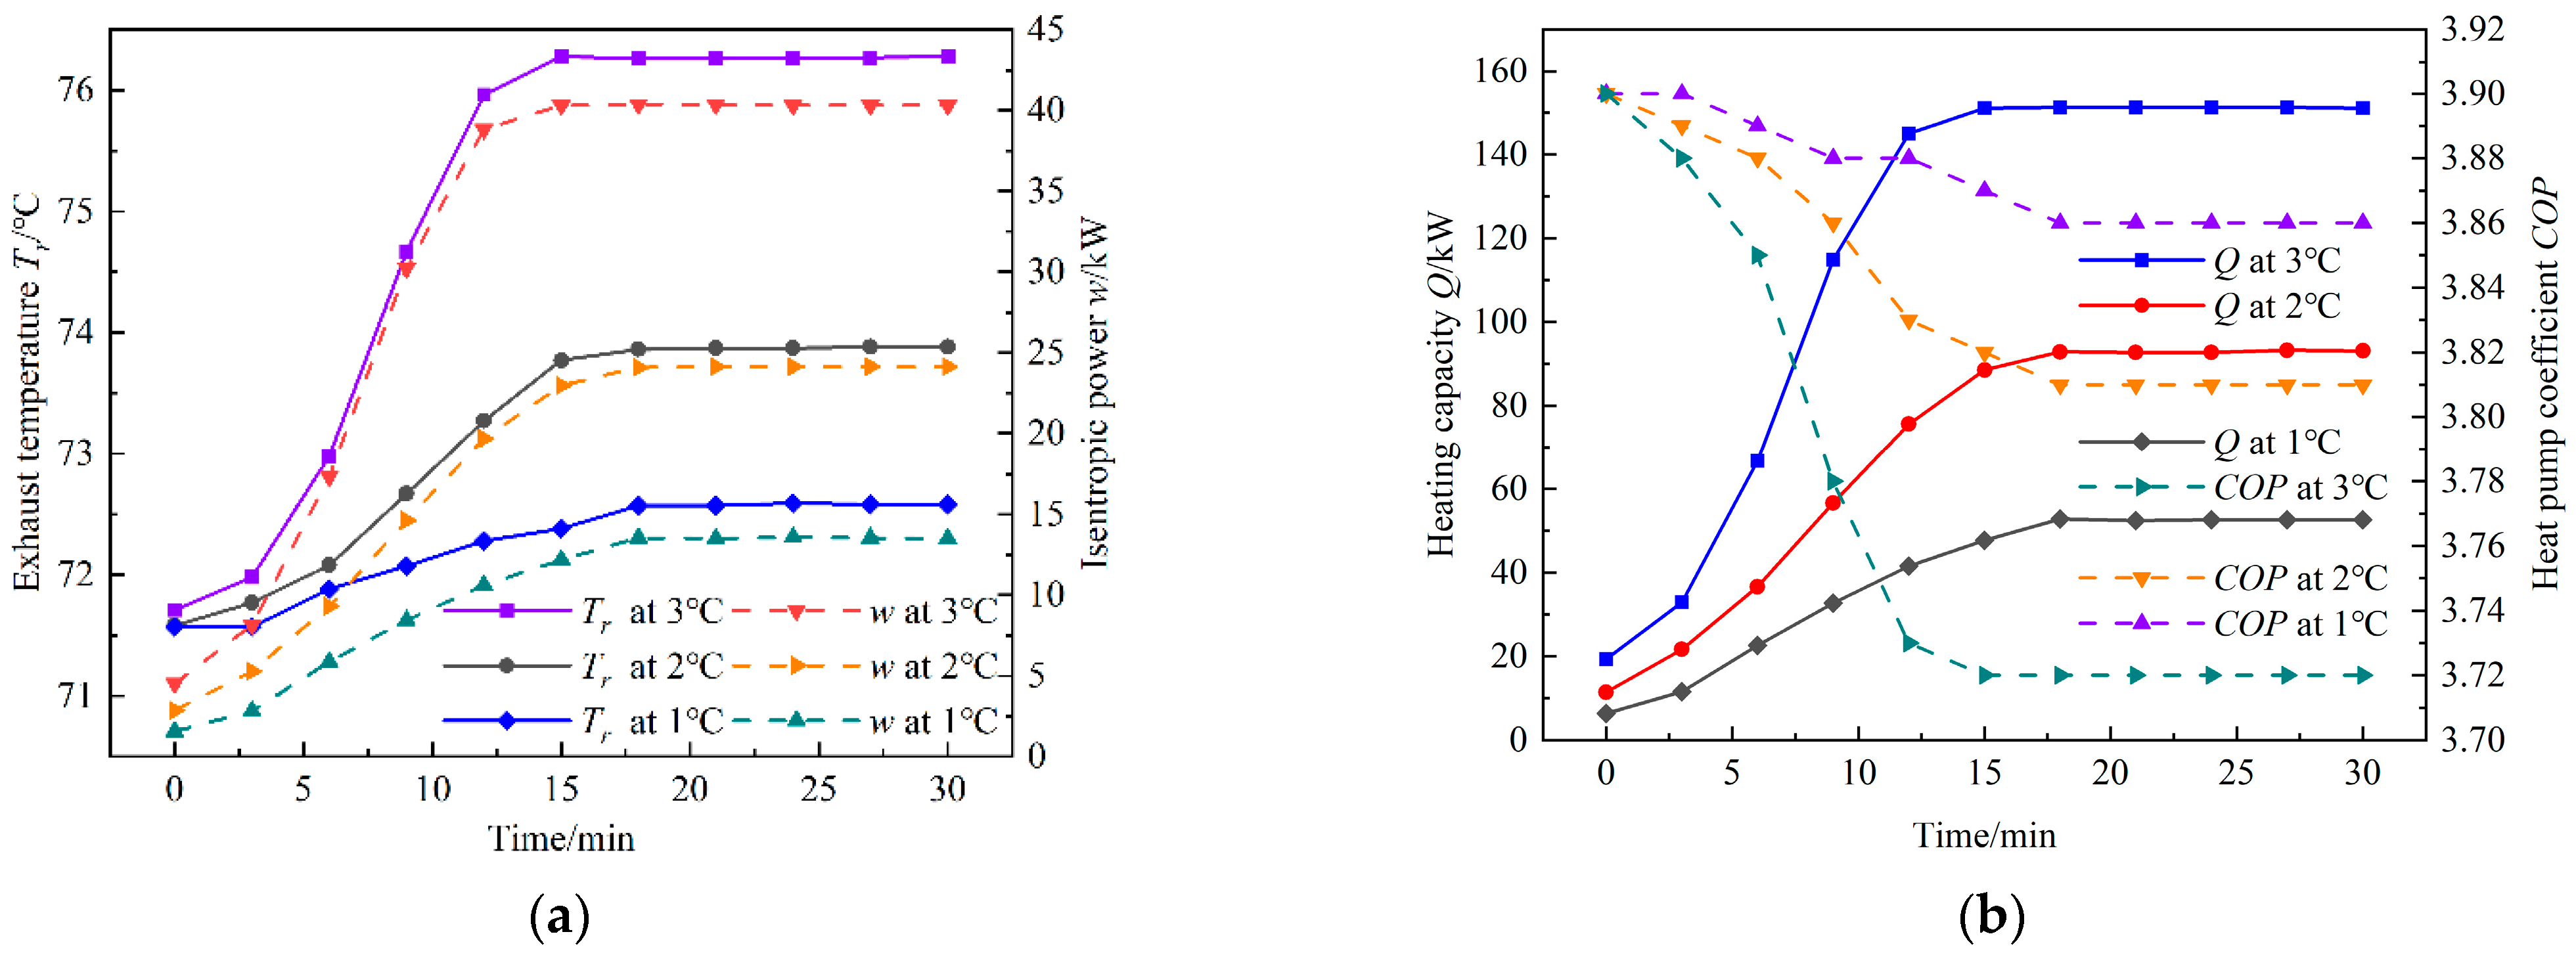
3.4. Influence of Water Temperature at Evaporator Inlet

Figure 10a shows the curves of exhaust temperature and isentropic power changing with time under different inlet water temperatures of the solidification heat evaporator. It can be seen from the figure that, when other conditions are fixed, the higher the inlet water temperature of the evaporator, the higher the exhaust temperature, and it increases first and then remains unchanged with time. The reason for the above results is that the higher the inlet water temperature, the larger the evaporator heat transfer temperature difference, the more heat transfer, the higher the icing rate, the larger the required refrigerant flow rate, and the higher the exhaust temperature. The exhaust temperature changes with time following the same trend as in the previous analysis.
It can also be seen from Figure 10a that, when other conditions are fixed, the higher the evaporator inlet water temperature, the higher the isentropic power, which is also related to the required mass flow rate. The analytical reason is the same as the previous one. After the system reaches stability, the isentropic power of condition 5 is 40.5 kW, the isentropic power of condition 6 is 24.3 kW, and the isentropic power of condition 7 is 13.7 kW.
Figure 10b shows the curves of the system heating capacity and the heating performance coefficient changing with time under different evaporator inlet water temperatures. It can be seen from the figure that, when other conditions are fixed, the higher the inlet water temperature is and the more the heating capacity is. The analytical reason is the same as that mentioned above. When the system is running stably, the heating capacity of condition 5 is the highest, which is 151 kW. The heating capacity of condition 6 is the second, which is 93 kW. The heating capacity of condition 7 is the lowest, which is 53 kW.
It can also be seen from Figure 10b that, under the same conditions, the higher the inlet water temperature, the lower the system COP, and the system COP decreases first and then remains unchanged with time. The reasons for the above results are the same as those analyzed above. The optimal deicing time of the system under three operating conditions is about 15 minutes after operation. The average COP and COP after stabilization are the largest in operating condition 7, which are 3.88 and 3.86, respectively. The second largest COP values are in operating condition 6, which are 3.86 and 3.81, respectively. The third largest COP values are in operating condition 5, which are 3.81 and 3.37, respectively.

4. Conclusions

In this paper, the direct solidification heat source heat pump is suggested and the effects of several factors on its performance are studied by the numerical method, including the evaporation temperature and the water velocity and temperature at the evaporator inlet. The following conclusions can be drawn as follows.
(1)
The direct solidification heat source heat pump provided in this paper is simpler and more efficient, but its run-time should be about 15 min before once again deicing. Although its COP during the cold period is a little lower than that of the traditional surface water source heat pump due to a lower evaporative temperature, it can be used in all winter.
(2)
Based on Simulink software, the numerical model and method shown in this paper are verified and practicable.
(3)
The evaporation temperature is negatively correlated with the exhaust temperature, isentropic power, and heating capacity and positively correlated with COP. The water velocity at the evaporator inlet is negatively correlated with the exhaust temperature, isentropic power, and heating capacity and positively correlated with COP. The water temperature at the evaporator inlet is negatively correlated with the exhaust temperature, isentropic power, and heating capacity and positively correlated with COP. During the stable operation of the system, when the evaporation temperature is −3 °C, the evaporator inlet water velocity is 0.1 m/s, and the evaporator inlet water temperature is 1 °C, the COP has a maximum value, and the maximum values are 3.02 and 3.72 and 3.86, respectively.

Author Contributions

Conceptualization, Y.C.; methodology, W.M.; software, X.C.; validation, Y.C., W.Z.; formal analysis, S.H.; investigation, X.L.; resources, W.Z.; data curation, X.C.; writing—original draft preparation, W.M.; writing—review and editing, Y.C. and W.Z.; visualization, W.M.; supervision, Y.C. and W.Z.; project administration, Y.C.; funding acquisition, W.Z. All authors have read and agreed to the published version of the manuscript.

Funding

This research received no external funding.

Institutional Review Board Statement

Not applicable.

Informed Consent Statement

Not applicable.

Data Availability Statement

The original contributions presented in this study are included in the article. Further inquiries can be directed to the corresponding author.

Conflicts of Interest

The authors declare no conflict of interest.

Nomenclature

KTotal heat transfer coefficient/W/(m2·°C)
hdLow-temperature heat source water-side convection heat transfer coefficient/W/(m2·°C)
QgHigh-temperature heat source water heat absorption/kJ/s
QrRefrigerant heat gain/kJ/s
QlLatent heat release from low-temperature heat source water/kJ/s
QsApparent heat release from low-temperature heat source water/kJ/s
QdWater-side heat release from surface heat sources/kJ/s
hEnthalpy of refrigerant/kJ/kg
tTemperature of high-temperature heat source water/°C
ΔtmLogarithmic mean temperature difference between refrigerant and water/°C
td1Evaporator inlet heat source water temperature/°C
tiLiquid–solid surface temperature, take 0 °C
lLength of heat exchanger tubes, m
AHeat transfer area per unit length of heat transfer tube/m2
cpSpecific heat capacity of water at constant pressure, take 4.2 kJ/(kg·°C)
kMultivariate index of the compression process, take 1.15
xTime/min
yIce content/%
vdCompressor inlet volume flow rate/m3/kg
vrCompressor outlet volume flow rate/m3/kg
TrCompressor discharge temperature/°C
TdCompressor suction temperature/°C
PdCompressor suction pressure/Pa
PrCompressor discharge pressure/Pa
rLatent heat of freezing of ice/kJ/kg
mrMass flow rate of refrigerant/kg/s
mgMass flow rate of low-temperature heat source water/kg/s
IPFsIce content of mobile ice/%
Subscripts
scSupercooled zone
cCooling zone
tpTwo-phase zone
inInlet
outOutlet
evEvaporator
sgSaturated gaseous state
coCondenser

References

  1. Li, G. Anchoring the “dual carbon” goal and accelerating innovation. Workers’ Daily, 21 March 2023. [Google Scholar]
  2. Xu, X.; Fang, Z.; Wang, Z. Climatic division based on frosting characteristics of air source heat pumps. Energy Build. 2020, 224, 110219. [Google Scholar] [CrossRef]
  3. Tang, R.; Wang, F.; Wang, Z.; Yang, W. Division of Frosting Type and Frosting Degree of the Air Source Heat Pump for Heating in China. Front. Energy Res. 2021, 9, 708478. [Google Scholar]
  4. Shen, C.; Lei, Z.; Wang, Y.; Zhang, C.; Yao, Y. A review on the current research and application of wastewater source heat pumps in China. Therm. Sci. Eng. Prog. 2018, 6, 140–156. [Google Scholar]
  5. Shen, C.; Lei, Z.; Lv, G.; Ni, L.; Deng, S. Experimental performance evaluation of a novel anti-fouling wastewater source heat pump system with a wastewater tower. Appl. Energy 2019, 236, 690–699. [Google Scholar]
  6. Zhang, J. Development status and problems of surface water source heat pump. Refrig. Air Cond. Electr. Mach. 2007, 6, 73–77. [Google Scholar]
  7. Sun, D.; Zhang, C.; Wu, R.; Qian, J. Heat pump system and device using cold water to solidify heat. HVAC 2006, 7, 41–44. [Google Scholar]
  8. Qian, J.; Sun, D.; Meng, J. A simplified model of water temperature and heat load in winter for surface water source collection and solidification heat pump system. Energy Technol. 2007, 6, 483–485+521. [Google Scholar]
  9. Wu, X.; Wu, R.; Wu, H. Economic and energy consumption analysis of cold water phase change energy heat pump system. J. Qingdao Univ. (Atural Sci.) Ed. 2018, 2, 138–142. [Google Scholar]
  10. Xu, C.; Zhang, C.; Luo, J. Experimental research on casing phase change solidification heat exchange device and heat pump heating system for coal mines. Coal Eng. 2022, 12, 152–156. [Google Scholar]
  11. Zhen, Y.; Wu, Y.; Zhang, J. Experimental study on the performance of the extraction of solidification heat device. J. Harbin Univ. Commer. (Nat. Sci.) Acad. Ed. 2019, 35, 710–714. [Google Scholar]
  12. Wu, X.; Wu, R.; Wu, H. Experimental analysis of performance of chilled water phase change energy heat pump system. J. Qingdao Univ. (Eng. Technol. Ed.) 2019, 34, 105–110. [Google Scholar]
  13. Liu, Z.; Yue, Y.; Wu, R. Cold water phase change energy heat pump system and its heat transfer performance. HVAC 2020, 50, 94–98. [Google Scholar]
  14. Luo, D.; Zhou, M.; Tang, J. Simulation study on the influence of intermediate heat exchanger on COP of surface water source heat pump unit. Build. Therm. Energy Vent. Air Cond. 2022, 3, 62–64. [Google Scholar]
  15. Qian, J.; Sun, D.; Zhang, J. Novel Harvesting and Solidification Heat Pump Technology and System Comprehensive Heating Performance Analysis. Dalian J. Polytech. Univ. 2011, 51, 244–249. [Google Scholar]
  16. Zheng, J.; Wu, R. Technical scheme of heat pump system for extracting cold water solidification heat. HVAC 2016, 46, 140–142. [Google Scholar]
  17. Shi, Y. Technical scheme of heat pump system for extracting cold water solidification heat. Mod. Manuf. Technol. Equip. 2018, 5, 140–141. [Google Scholar]
  18. Liu, Z.; Wu, R.; Yu, H. Operation test of aqueous phase change energy heat pump heating system. HVAC 2019, 49, 96–100. [Google Scholar]
  19. Yue, Y. Operational Characteristics and Engineering Experimental Research of Cold Water Phase Change Energy Heat Pump System. Master’s Thesis, Qingdao University, Qingdao, China, 2020. [Google Scholar]
  20. Zhang, Y. Research on Unstable Working Conditions of Low-Temperature Phase Change Heat Source of Water Source Heat pump. Master’s Thesis, Yanshan University, Qinhuangdao, China, 2021. [Google Scholar]
  21. Qian, J.; Zhang, C.; Sun, D. Study on Enhanced Heat Transfer by Laminar Flow Condition of Acquisition and Solidification Heat Pump Technology. Fluid Mech. Eng. 2007, 35, 70–74. [Google Scholar]
  22. Qian, J.; Guo, Y.; Li, J. Analysis of Parameters and Conditions for Continuous Heat Intake in Acquisition and Solidification Heat Pump System. Harbin Commer. J. Chin. Univ. (Nat. Sci. Ed.) 2011, 27, 630–632. [Google Scholar]
  23. Zhang, C. Theory and Device of Heat Exchange for Extracting Latent Heat of Cold Water Solidification. Ph.D. Thesis, Harbin Institute of Technology, Harbin, China, 2008. [Google Scholar]
  24. Zhang, Y.; Shang, D. Research on core technology of ice water source heat pump. Sci. Technol. Innov. Appl. 2020, 8, 155–159. [Google Scholar]
  25. Han, S. Research on Modeling and Simulation of Direct Heating System of Wind Energy Heat Pump. Master’s Thesis, University of Chinese Academy of Sciences (CASA Engineering Heat Institute of Physics), Beijing, China, 2018. [Google Scholar]
  26. Yang, Z. Simulation Research on High-Temperature Heat Pump System Based on Waste Heat Utilization. Master’s Thesis, Harbin Institute of Technology, Harbin, China, 2020. [Google Scholar]
  27. Zhu, S. Study on Performance of Heat Pump Evaporator for Surface Water Solidification Heat Source. Master’s Thesis, Lanzhou Jiaotong University, Lanzhou, China, 2022. [Google Scholar]
  28. Wu, X. Simulation and Experimental Study of Cold Water Phase Change Energy Heat Pump System. Master’s Thesis, Qingdao University, Qingdao, China, 2019. [Google Scholar]
Figure 1. The heat pump heating system.
Applsci 15 03421 g001
Figure 2. Evaporator structure diagram.
Applsci 15 03421 g002
Figure 3. Pressure–enthalpy diagram of refrigerant cycle.
Applsci 15 03421 g003
Figure 4. Simulation model of heat pump system.
Applsci 15 03421 g004
Figure 5. Simulation flow of heat source heat pump for surface water solidification.
Applsci 15 03421 g005
Figure 6. Curve of COP varying with terminal water supply.
Applsci 15 03421 g006
Figure 7. Curve of ice content fitting.
Applsci 15 03421 g007
Figure 8. Effect of evaporation temperature with time (a) on Tr and w, (b) on Q and COP.
Applsci 15 03421 g008
Figure 9. Effect of inlet water velocity with time (a) on Tr and w, (b) on Q and COP.
Applsci 15 03421 g009
Figure 10. Effect of inlet water temperature with time (a) on Tr and w, (b) on Q and COP.
Applsci 15 03421 g010
Table 1. Evaporator structure parameters.
Evaporator Structure Parameters
Number of Round Tubes16Tube Length4ArrangementCrossbar
Pipe spacing80 mmPipe diameter10 mmTotal length of heat exchanger tube110 m
Table 2. Seven operating conditions for heat pump simulation.
ConditionEvaporation Temperature/°CInlet Water Temperature/°CInlet Water Velocity/(m/s)A1A2x0dx
C1−330.5−0.44 ± 0.193.77 ± 0.063.81 ± 0.389.01 ± 0.47
C2−530.5−0.49 ± 0.313.79 ± 0.098.41 ± 0.733.80 ± 0.57
C3−730.5−0.43 ± 0.364.01 ± 0.108.21 ± 0.793.57 ± 0.62
C4−530.3−0.53 ± 0.445.31 ± 0.137.55 ± 0.672.86 ± 0.52
C5−530.1−0.92 ± 0.519.35 ± 0.158.17 ± 0.483.32 ± 0.37
C6−520.1−0.86 ± 0.575.90 ± 0.199.68 ± 0.965.00 ± 0.82
C7−510.1−1.27 ± 0.723.81 ± 0.157.16 ± 1.836.35 ± 1.20
Disclaimer/Publisher’s Note: The statements, opinions and data contained in all publications are solely those of the individual author(s) and contributor(s) and not of MDPI and/or the editor(s). MDPI and/or the editor(s) disclaim responsibility for any injury to people or property resulting from any ideas, methods, instructions or products referred to in the content.

