Article

A New Ground-Motion Prediction Model for Shallow Crustal Earthquakes in Türkiye

1
Earthquake Department, Disaster and Emergency Management Presidency, Ministry of Interior, 06800 Ankara, Türkiye
2
Department of Geophysical Engineering, Faculty of Engineering, Kocaeli University, 41001 Kocaeli, Türkiye
3
Department of Civil Engineering, Faculty of Engineering, Munzur University, 62000 Tunceli, Türkiye
*
Author to whom correspondence should be addressed.
Appl. Sci. 2025, 15(7), 3442; https://doi.org/10.3390/app15073442
Submission received: 14 January 2025 / Revised: 14 March 2025 / Accepted: 15 March 2025 / Published: 21 March 2025
(This article belongs to the Special Issue Soil Dynamics and Earthquake Engineering)

Abstract

:
The recent expansion of the strong-motion observation network, along with the increase in data obtained during major earthquakes and efforts to create consistent metadata for source, path, and site effects for both old and new records, has significantly improved the quality of data and the level of modeling in Türkiye. The mainshock and aftershock records of the 6 February 2023 Kahramanmaraş earthquake doublet (MW 7.8 and 7.7), which are among the most destructive earthquakes in world history, constitute an up-to-date and important data source for this study. In this study, we present new ground-motion prediction models (GMPMs) for shallow crustal earthquakes using strong-motion data recorded in Türkiye. Our GMPMs are calibrated using 20,173 strong-motion records from 1565 shallow crustal earthquakes with depths of less than 35 km that occurred in Türkiye and its vicinity between 1976 and 2023. Our model is valid for magnitudes ranging from 4.0 to 7.8 (MW), and for the time-averaged 30 m shear wave velocity (VS30) values of 975 stations, which ranged from 131 to 1862 m/s. In the analyses performed, using the recently developed site amplification model, we calculated the model coefficients using the mixed-effects regression algorithms used by the GMPM developers. Additionally, a heteroscedastic model was created for aleatory variability as a function of MW. The closest distance to the surface projection of the fault plane (RJB) is between 0 and 350 km. Using the metadata prepared according to these criteria, we derived up-to-date ground-motion prediction models for horizontal-component peak ground velocity (PGV), peak ground acceleration (PGA), and 5% damped pseudo-spectral acceleration (PSA) response spectra, at 36 periods ranging from 0.01 to 10 s. The variability in the predictions was decomposed into within-event, between-event, and site-to-site deviations to determine the total standard deviations (σ). Compared to previous models, the proposed GMPMs were developed using a much richer database with recent major earthquakes, and the consistent estimates and lower residuals in the comparisons support the reliability of the models.

1. Introduction

Türkiye is located in one of the most active seismic regions in the world. Therefore, the country has been the scene of many destructive earthquakes throughout history due to three major neotectonic structures [1]: the North Anatolian Fault (NAF), the East Anatolian Fault (EAF), and the Aegean Graben Systems. Some of these earthquakes (1939 Erzincan, 1999 Kocaeli and Düzce, 2011 Van, 2020 Elazığ, 2023 Kahramanmaraş) are among the most devastating ever recorded and caused significant loss of life in the earthquake area. These events also show the extent of the seismic activity and seismic hazards of the Anatolian plate. Seismic hazards must be thoroughly determined for safe engineering structural design and urban development plans. Utilizing reliable ground-motion prediction models (GMPMs) plays an important role in determining seismic hazards. GMPMs are fundamental tools used in various engineering applications such as seismic hazard maps, seismic risk assessments, and microzonation studies for seismically active regions or countries. Typically, predictions are made for the peak ground acceleration (PGA), peak ground velocity (PGV), and 5% damped pseudo-spectral acceleration (PSA). The GMPMs are developed as a function of observed strong-motion amplitudes against a set of variables, such as event magnitude, source-to-site distance, style-of-faulting, and local site conditions. Over the past half-century, numerous predictive models have been developed for different regions and countries from around the world, taking into account up-to-date data, various factors, and new techniques. According to the report by Douglas (2024) [2], between 1964 and 2023, 505 different models were proposed for PGA, 155 for PGV, and 324 for 5% damped PSA. GMPMs are derived by combining observed data from different countries, as well as by adapting datasets specific to a particular region or country.
Variations in the quantity and quality of the input data used in prediction models worldwide have led to the development of different models. Some researchers have developed GMPMs (ground-motion prediction models) using only country-based (local) datasets [3,4,5,6,7,8,9], while others have used data obtained from specific regions [10,11,12,13]. A third group has presented models using a combination of global-scale data [14,15,16,17,18,19]. Local and regional model examples aim to predict site-specific source, path, and site effects on strong-motion intensity values without causing data contamination from different regions. Researchers who prefer to use global-scale data are of the opinion that data from countries with similar tectonic regime characteristics will also exhibit similar characteristics. Additionally, while most GMPM developers focus on shallow crustal earthquakes, some propose models for deep-focus subduction earthquakes. This is because subduction events exhibit different characteristics to shallow crustal earthquakes, driven by factors such as the earthquake’s source, depth, wave propagation, frequency characteristics, and energy release.
Since the model proposed in this study is specific to Türkiye, some previously developed models that are specific to Türkiye are briefly reviewed here. The estimation parameters of ground-motion prediction equations (GMPEs) proposed for Türkiye generally use different criteria for the magnitude scale, source-to-site distance, and site effect categorization. Kalkan and Gülkan [3] developed model for PGA and PSA with a total of 100 strong-motion records of 47 events, and according to the fault types of normal slip (NS) (12 events, 14 records), strike slip (SS) (33 events, 81 records), and reverse slip (RS) (2 events, 5 records), magnitude MW ≥ 4.0, source-site distance Rcl < 100 km, and associated with site class VS. Ulusay et al. [20] derived a model only for PGA using 221 records of 122 events with earthquake magnitude MW ≥ 4.0, without considering fault types, and using an epicenter distance (Repi) < 100 km. Özbey et al. [10] proposed models for PGA and PSA based on a database that considered the geometric mean of two horizontal components from 195 acceleration records of 17 earthquakes (MW ≥ 5.0) that occurred in Northwestern Türkiye. The dataset included records with source-to-site distances RJB < 100 km, and site classifications were determined based on Vs values. Akyol and Karagöz [12] proposed equations for PGA and PSA using a dataset consisting of 168 strong-motion records belonging to 49 earthquakes (MW 4.0–6.4) that occurred in the Western Anatolia Region, with a focal distance (Rhyp) of 15–200 km and the horizontal–vertical spectral ratio (HVSR) for the site class. These GMPMs are derived from old catalogues of Turkish data and tend to overestimate ground motions, which can be attributed to assumptions made by their developers due to inadequate database information (i.e., estimated ground conditions, source –site distance measurements, and hybrid magnitude scaling; Akkar et al. [21]) about the time they were derived. Akkar and Çağnan [4] developed models for PGA and PSA using 1259 horizontal component records of 573 events in the magnitude range of 3.5 ≤ MW ≤ 7.6, a source-to-site distance 0 ≤ Rjb ≤ 200 km, associated with ground class VS30, and categorized according to SoF (SS: 70%, NS: 28%, and RS: 2%).
For the reliability of GMPMs, comprehensive metadata consisting of correctly calculated seismological parameters, well-defined source-site metrics, in situ measured VS30 values, and high-quality recorded and processed strong-motion records with appropriate procedures come to the fore. The reliability of the estimated ground motion directly depends on the characteristics of the dataset. The errors and uncertainties (epistemic and aleatory) in the dependent and independent variables should ideally be kept to a minimum. Epistemic uncertainties are factors that need to be considered in prediction equations, and they arise from insufficient knowledge of seismic-source mechanisms, wave spreading paths, and site effects. Aleatory uncertainty is attributed to outcomes that cannot be predicted, whereas epistemic uncertainty is attributed to missing information. To account for epistemic uncertainties when determining the seismic hazard level of a region, both regional and global GMPEs may be used [4]. For reliable seismic hazard studies in different countries or regions, appropriate GMPMs need to be developed and used. In recent years, international projects have been initiated due to the need for access to and the improvement of strong-motion data for earthquake engineering and engineering seismology applications. The primary aim of these projects is to collect significant ground-motion records on a global scale, ensure the consistent and reliable processing of all data, and create comprehensive metadata describing source, path, and site effects for these records, making them accessible to everyone. One of the comprehensive projects developed for this purpose is the two-phase Next-Generation Attenuation (NGA) Ground Motion Project, supported by PEER, comprising the NGA-West1 and NGA-West2 projects [22,23]. Another good example is the Engineering Strong-Motion (ESM) dataset developed by the European Plate Observing System (EPOS) project. Within the scope of the ESM program, it has established a standard for the dissemination of metadata and parameters for engineering seismology applications in Europe, similar to NGA-West in the USA [24]. Similarly, the first comprehensive compilation and processing of the strong ground-motion dataset in Türkiye was carried out by Akkar et al. [21] for 4671 strong-motion records between 1976 and 2007. Additionally, records obtained during some medium and large earthquakes that occurred after 2007 were compiled under the RESORCE project [25].
In Türkiye, the National Strong-Motion Network (TR-NSMN) is operated by the Earthquake Department of AFAD (Disaster and Emergency Management Presidency). The observation activities of TR-NSMN, which started with 76 analog instruments in the early 1970s, experienced a significant increase in capacity after the major Kocaeli (MW 7.6). and Düzce (MW 7.2) earthquakes in 1999. Over the past decade, hundreds of new modern digital instruments and high-standard free-field strong-motion stations have been installed throughout Türkiye. The replacement of analog devices with digital ones, the installation of numerous new stations, and the transition of all stations to free-field conditions have significantly enhanced both the quantity and quality of the data. Especially after 2010, the number of stations in TR-NSMN has increased significantly, reaching 1103 (887 active and 216 passive) as of 2024. In recent years, there has been a significant increase in the acceleration record archive due to the increasing number of stations and major earthquakes in Türkiye. In particular, thousands of new acceleration records, obtained from near sources and representing rare examples on a global scale, were added to the data archive during the main shocks and aftershocks of the Van earthquake on 23 October 2011 (MW 7.1), the Sivrice-Elazığ earthquake on 24 January 2020 (MW 6.8), the Aegean Sea earthquake on 30 October 2020 (MW 7.0), the Düzce earthquake on 23 November 2022 (MW 5.9), and the Pazarcık (MW 7.8) and Elbistan (MW 7.7) earthquakes centered in Kahramanmaraş on 6 February 2023 [26,27,28]. AFAD has developed the web-based TADAS (Turkish Accelerometric Database and Analysis System) platform to enable the querying, analysis, and sharing of all data from past to present over the Internet. All data are available to researchers through this portal (TADAS, https://tadas.afad.gov.tr). The strong-motion data archive of Türkiye, which is constantly gaining more high-quality data, provides a wide dataset for shallow crustal earthquakes, enabling the development of up-to-date GMPMs.

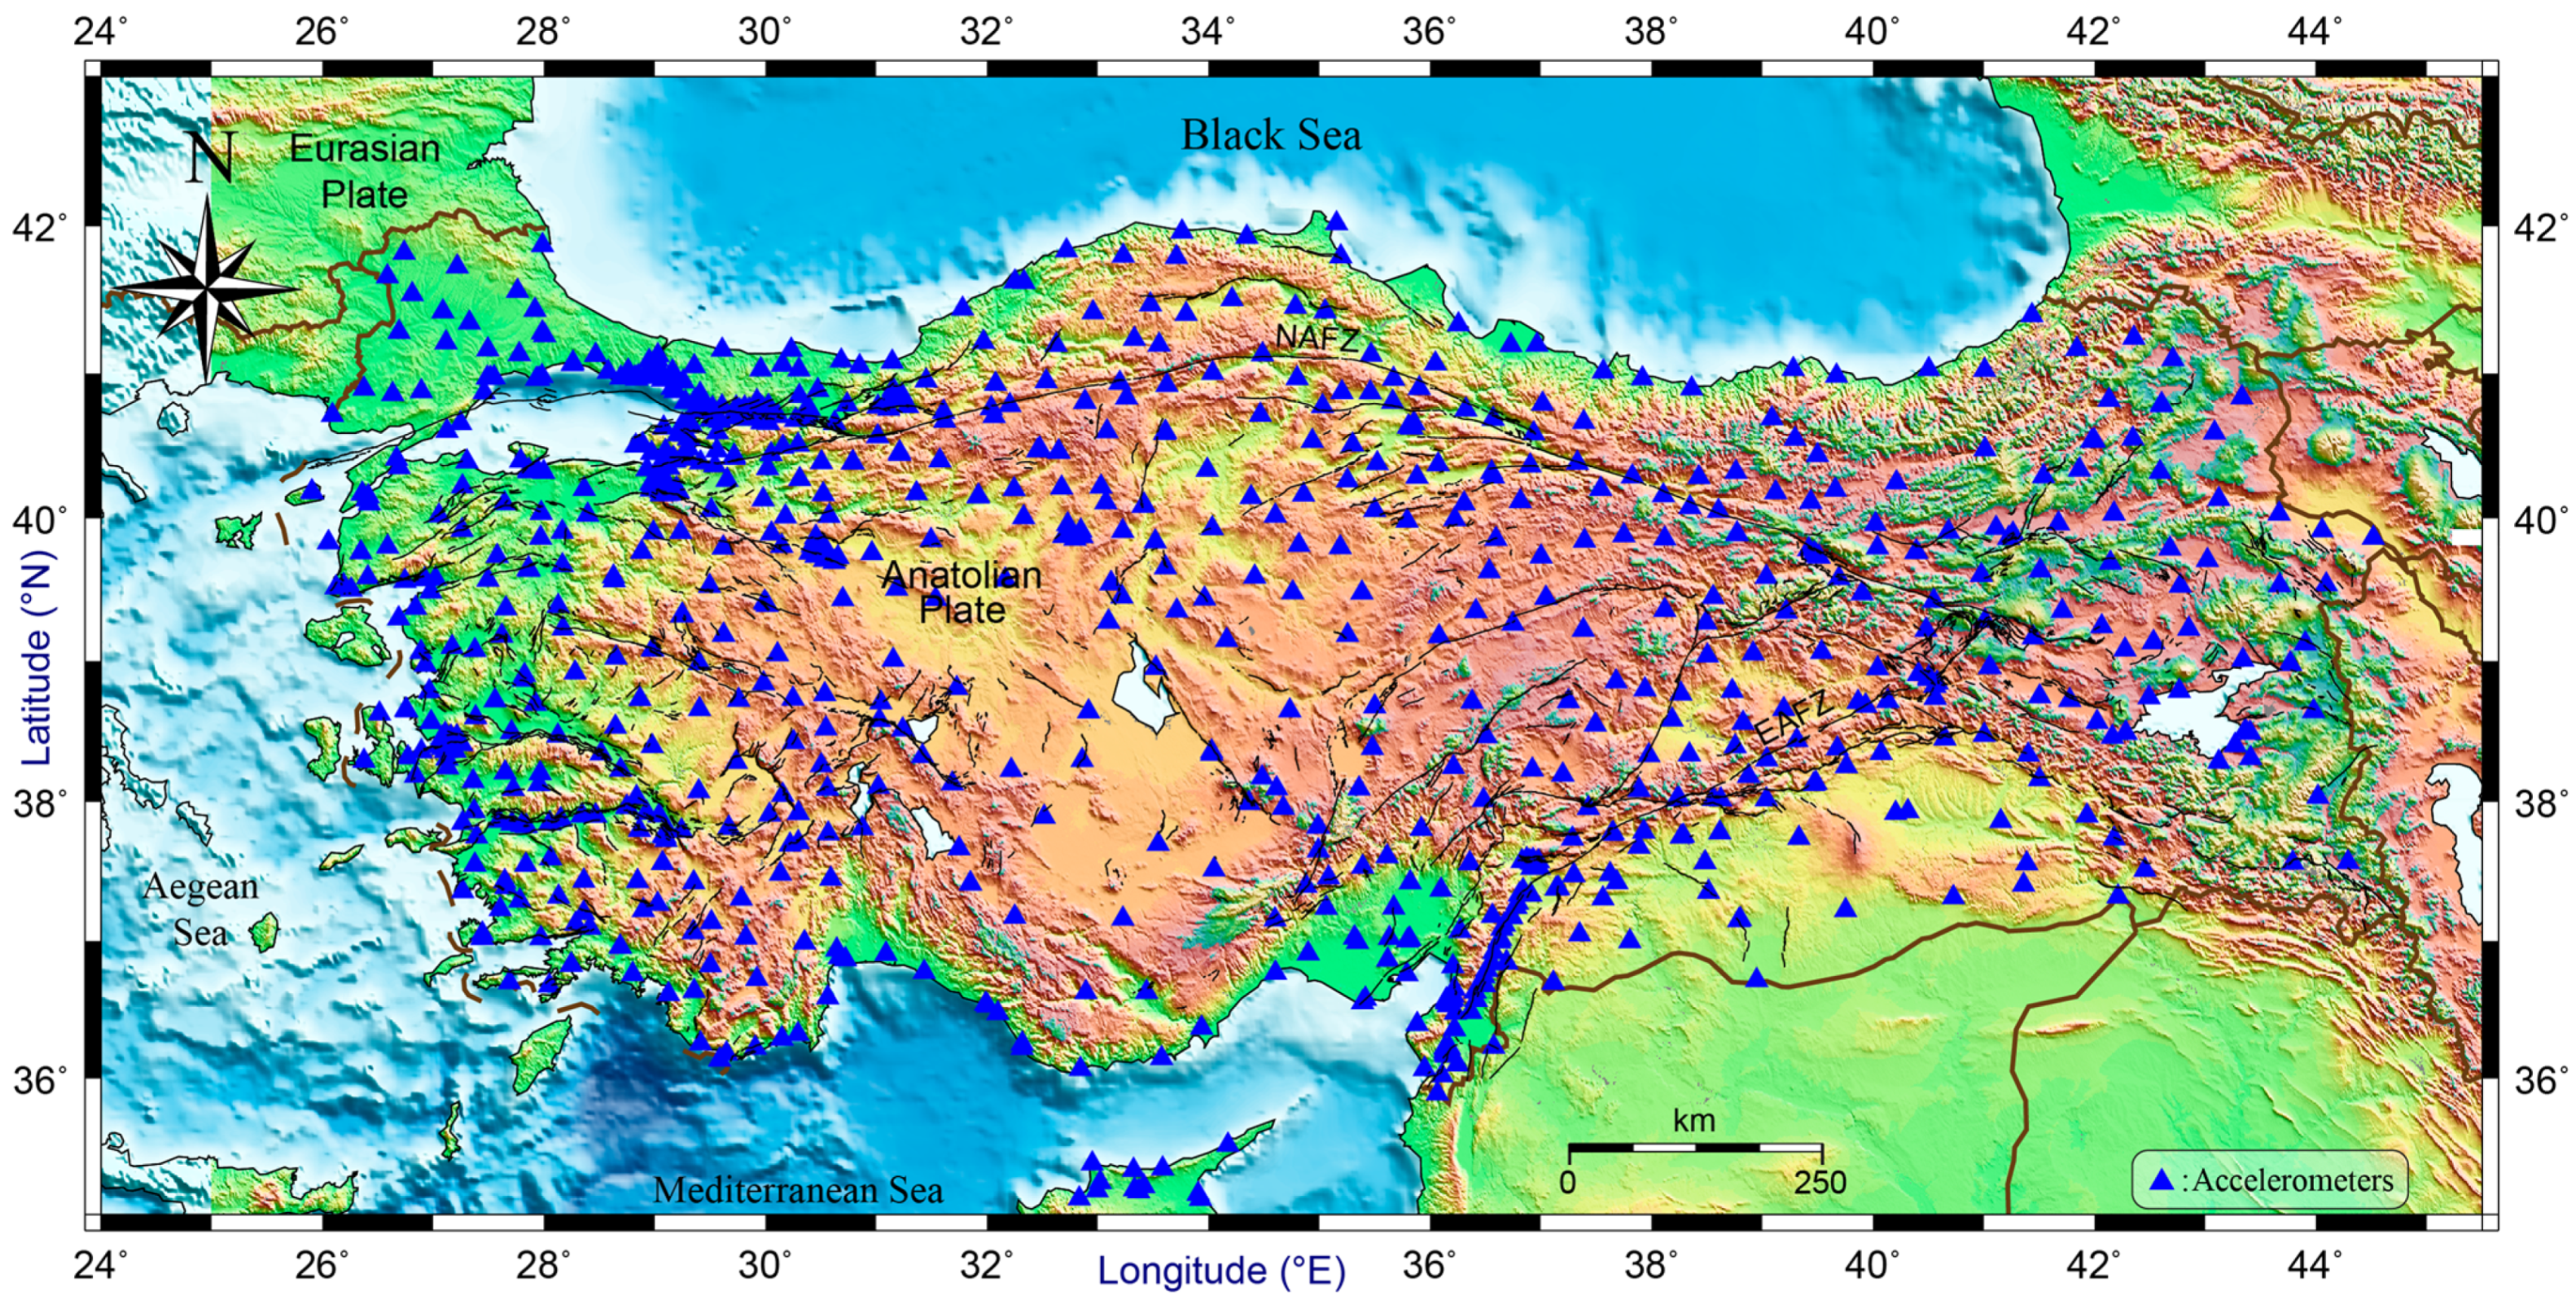
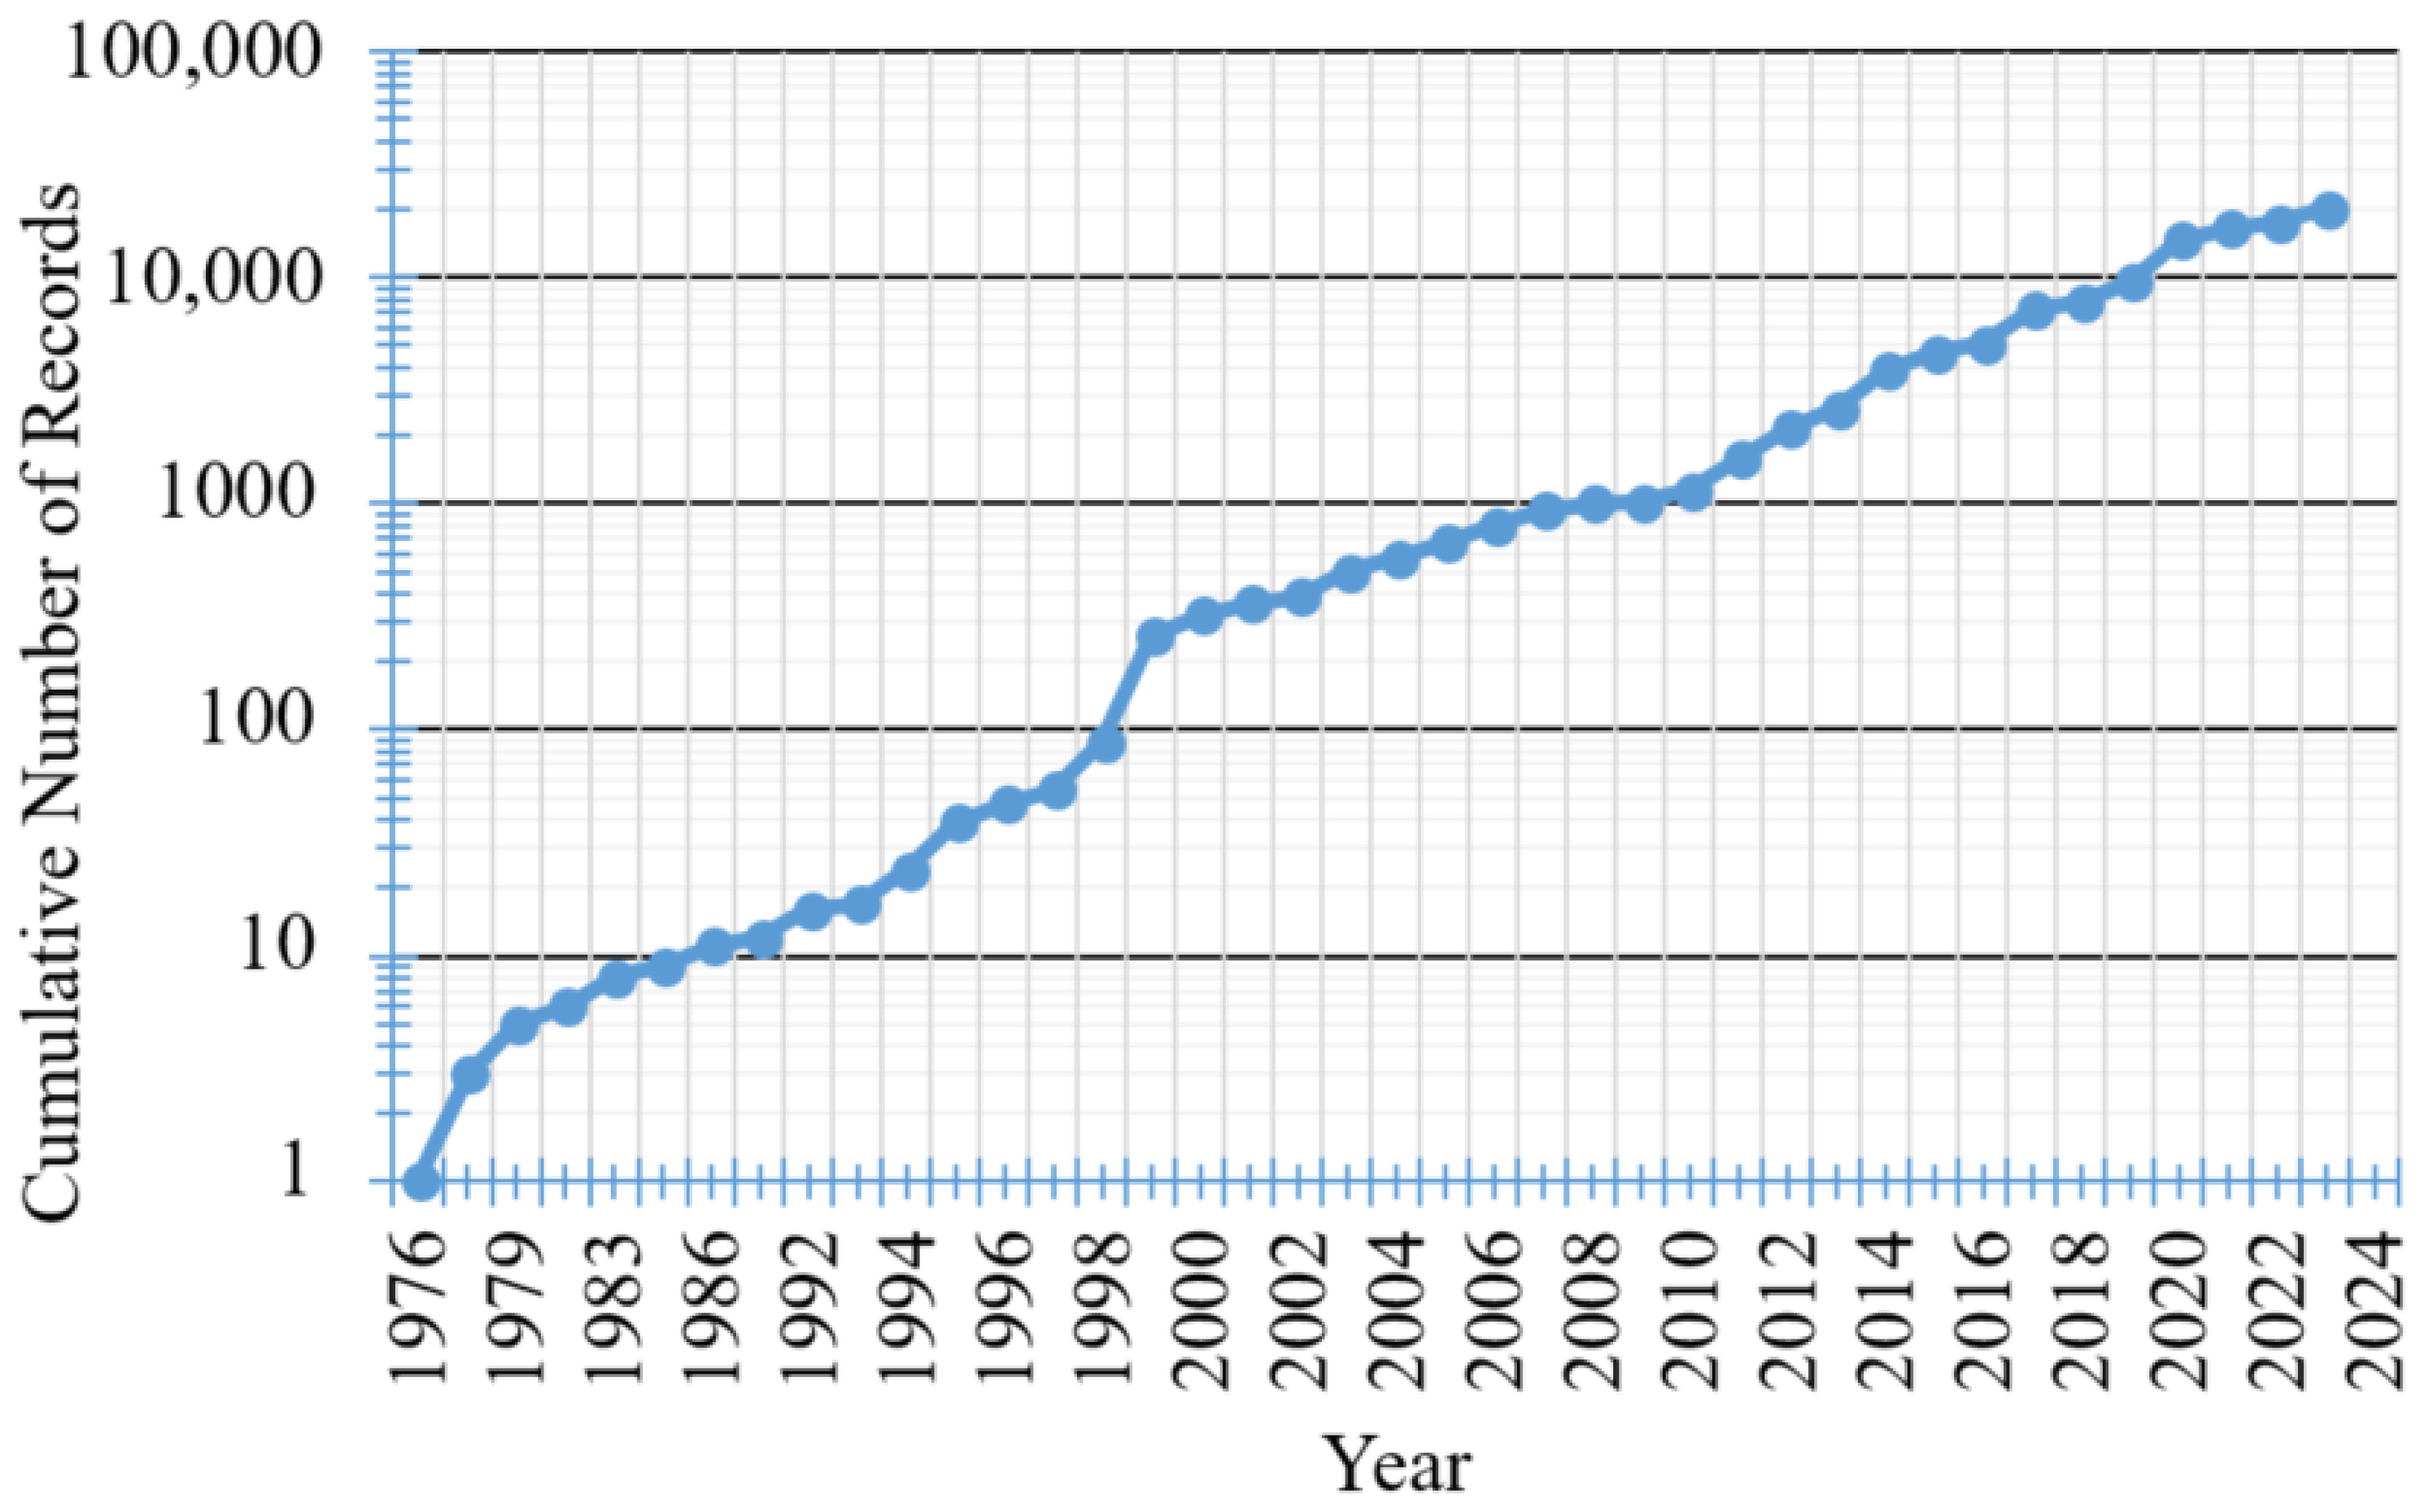
2. Database and Selection Criteria

One of the most critical decisions in developing GMPMs is determining which data to include or exclude from the regression analysis. The accuracy of the estimated ground motion is directly influenced by the characteristics of the database. Ideally, uncertainties (both epistemic and aleatory) in the dependent and independent variables should be minimized. However, due to the nature of earthquakes, it is not possible to completely eliminate these errors and uncertainties. Sometimes, the required parameters may be missing or not of the desired quality. For example, the absence of an in situ measured VS30 profile for the site classification of the stations is a common problem. Limiting the study to stations with only the measured VS30 may cause the dataset and sample to be reduced, which may also affect the representativeness of the prediction models. As in this example, a good balance should be established between filling in the gaps with alternative methods (e.g., spectral ratios, field observations, topography, etc.) and being restrictive by eliminating data.
The data used in this study were sourced from two different ground-motion databases. The first dataset was obtained from the ESM (https://esm-db.eu/#/home) database [24], which was supported by the EPOS EU project (Grant Agreement 676564) in which AFAD is involved; it was developed under the coordination of the ORFEUS strong-motion management committee. This database comprises strong-motion waveforms from earthquakes with MW ≥ 4.0, recorded in the European–Mediterranean region since 1969. The acceleration time series in the ESM database were processed following the general procedure scheme described by [29]. In this database, the data recorded in Türkiye only include the years between 1976 and 2016. The second database we used is the Updated Strong Motions Database of Türkiye (SMD-TR) [30]. The database is provided by the portal compiled and shared under the research-oriented website (DesignSafe, last accessed, 12 August 2024, https://doi.org/10.17603/ds2-f21x-s189). It was regularly updated until 2025 with funds provided by TÜBİTAK (last accessed, 20 November 2024). This database consists of 9244 earthquakes with magnitudes of 3.0 ≤ M ≤ 7.8 that occurred between 1976 and 2023. The data source consists of 95,890 three-component waveforms recorded exclusively by the 1022 stations of TR-NSMN. The published version covers events up to 28 February 2023, including the main shocks and the majority of the aftershocks of the 6 February 2023 Kahramanmaraş earthquakes. A data-processing algorithm is developed to apply appropriate filters to eliminate low- and high-frequency noise from the records and to calculate strong-motion parameters. A manual processing scheme is preferred for waveforms recorded from large events, while an automatic processing algorithm is used for events with small magnitudes (M < 5.5) [29]. The data-processing scheme applied here follows the same procedure as outlined by [25]. The flatfile used in the study is extracted from these two data sources (ESM and SMD-TR). To ensure that records from both the ESM and SMD-TR databases (1976–2016) were not counted twice, a rigorous and controlled merging process was implemented. First, the datasets were standardized, color-coded, and assigned unique Record IDs. A “Record-Name” column was defined using timestamps and station codes to facilitate sorting. After merging, records were sorted chronologically, and overlapping entries from the same station were identified. When duplicate records existed, preference was given to ESM, as its data were manually processed. This meticulous approach ensured accuracy and eliminated redundancy. It is confirmed that, during the 2006–2016 overlap period, SMD-TR contained 3333 records, whereas ESM had only 1065, further validating the selection process. A summary of the two databases is given in Table 1. The prepared flatfile consists of metadata related to distance parameters and strong-motion waveforms, along with seismic source and site information. The locations of the strong-motion stations (957) of TR-NSMN, whose data were used in the present study, are shown in Figure 1.
The combined database contains the parameters of 1565 earthquakes with magnitudes ranging from 4.0 to 7.8 (MW) that occurred in Türkiye and its vicinity between 1976 and 2023. The earthquakes are typically characterized by shallow crustal events with focal depths of up to 35 km. To minimize the inclusion of intermediate-depth subduction earthquakes, which are prevalent in the Eastern Mediterranean, 557 records from earthquakes with focal depths exceeding 35 km were excluded from the analyses. Moderate-magnitude events in the dataset generally occurred in the western part of Türkiye. Seismic events in these regions occur along the strike-slip NAF and the extensional regime (normal faults) of Western Anatolia. Large-magnitude earthquakes occurring on the EAF, where strike-slip events dominate, are generally events that have occurred in the last 20 years. The distribution of the epicenters of earthquakes with available focal mechanism (moment tensor) solutions used in the study is shown in Figure 2. In recent years, with the increase in the number of accelerometer stations in Türkiye and the occurrence of many major earthquakes, there has been a significant rise in the number of acceleration records. The cumulative increase in the strong-motion records between 1976 and 2023 (February) is given in Figure 3. For the seismic events used in the study, information from both national and international seismological organizations, as well as literature data, is checked, and earthquakes are classified according to the tectonic regime. Records were grouped into three fault types (SoF) based on focal mechanism solutions. In the database, there are 9410 records (47%) for strike-slip (SS) events, 9713 records (48%) for normal-slip (NS) events, and 1050 records (5%) for reverse-slip (RS) events (Figure 4). The data distribution shows a similar number for SS and NS events; however, both are significantly greater than the number of RS events.
As source-to-site metrics, for earthquakes with magnitudes MW ≥ 5.5, and a real fault geometry (with fault plane solutions), we used the closest horizontal distance to the surface projection of the fault plane (RJB), calculated using finite-fault distance metrics. However, the epicentral distance (Repi) was calculated for each record. For smaller events (MW < 5.5), since the differences between Repi and RJB are negligible, the point source distance was considered. The source-to-site metrics are limited to a maximum of 350 km according to the RJB criterion. The histogram distribution of selected strong-motion records according to distance (RJB) intervals is shown in Figure 5.
The data used to develop our GMPEs consist of 20,173 records from 1565 shallow crustal earthquakes and 957 stations. The dependent variables include the horizontal component PGA, and PGV and PSA values with 5% damping for 36 different periods ranging from 0.01 to 10.0 s, converted to RotD50 [31]. The MWRJB distribution of the data used in study, categorized by fault types, is shown in Figure 6. The 17 station data points located at a distance of zero (RJB 0.0 km) on the surface rupture of the Kahramanmaraş earthquake (MW 7.8) have been shown with negligible values assigned between 0.11 and 0.27 km (with a 0.01 increment) to make them visible on the logarithmic plot without overlapping. As seen in the data, the magnitude range is broadest for SS and NS events and narrowest for RS earthquakes.
The governing variable for the site term is VS30, which is the average shear-wave velocity of a site in the uppermost 30 m. This parameter was also adopted for soil category assignment in the Turkish Building Earthquake Code (TBEC-2018) [32], National Earthquake Hazards Reduction Program (NEHRP; Building Seismic Safety Council [BSSC], 2009) [33], and European Seismic Code [34]. The site term in GMPMs expresses the effect of shallow site conditions on ground-motion intensity measurements (GMIMs) as a function of VS30. The data used in the study were obtained from accelerometer stations with VS30 values ranging from 131 to 1862 m/s. The soil classification of about 905 stations belonging to AFAD was determined through in situ geophysical measurements. Active MASW (multi-channel analysis of surface waves) and passive REMI field test techniques were used in the measurements undertaken for various projects [35,36]. Additionally, field characterization studies were carried out with active seismic measurements performed by AFAD’s own engineering team using seismic equipment at the station sites, and soil information for the stations was obtained. According to the VS30 information of the TR-NSMN stations, the strong-motion data are classified based on the site categories defined in NEHRP-2009 and TBEC-2018 as follows: Class A: VS30 ≥ 1500 m/s, Class B: VS30 = 760–1500 m/s, Class C: VS30 = 360–760 m/s, Class D: VS30 = 180–360 m/s, and Class E: VS30 < 180 m/s. However, for approximately 52 stations without direct VS30 data based on geophysical measurements, site classifications were determined using the accepted methods reported in the literature (dominant period, spectral shapes, slope, field observations, etc.). The histogram of the strong-motion data used in the study categorized by site classes is shown in Figure 7. Most of the data correspond to soil and soft rock sites (NEHRP and TBEC categories C and D).
Figure 8 shows GMIMs with a distance (RJB) of PGA, PGV, and 5% damped response spectra (PSA) for four periods (T = 0.2, 1.0, 3.0, 6.0 s) and color-coded magnitude ranges (4.0 ≤ MW < 5.0, 5.0 ≤ MW < 6.0, 6.0 ≤ MW < 7.0, and 7.0 ≤ MW < 8.0). These plots show the decrease in motion (ordinate values) with distance, as well as the dependence of the distance decay on magnitude. The rate of decrease at larger distances (RJB > 80 km) is higher for shorter periods than for longer periods. The curvature in the distance-dependent decay function is addressed by adding an anelastic term to the path function. Similarly, the magnitude scaling of the observed GMIMs (PGA, PGV, and PSA at T = 0.2 s and T = 3.0 s) for different distance group ranges is shown in Figure 9. In the magnitude scaling, a linear trend is observed with relatively wide scatter in PGA and short-period (T = 0.2 s) PSA. In the long-period (T = 3.0 s) PSA ordinates, there is less scatter, and a notable slope break occurs, particularly for moderate magnitudes in the range of 5.5 to 6.0. For PGV values, a more pronounced increase in slope at larger magnitudes is observed with lower scatter across nearly all ranges. That is, after a certain magnitude, it is observed that GMIMs do not increase with magnitude (the slope decreases).
A summary of the criteria for the variables used in our GMPMs is as follows:
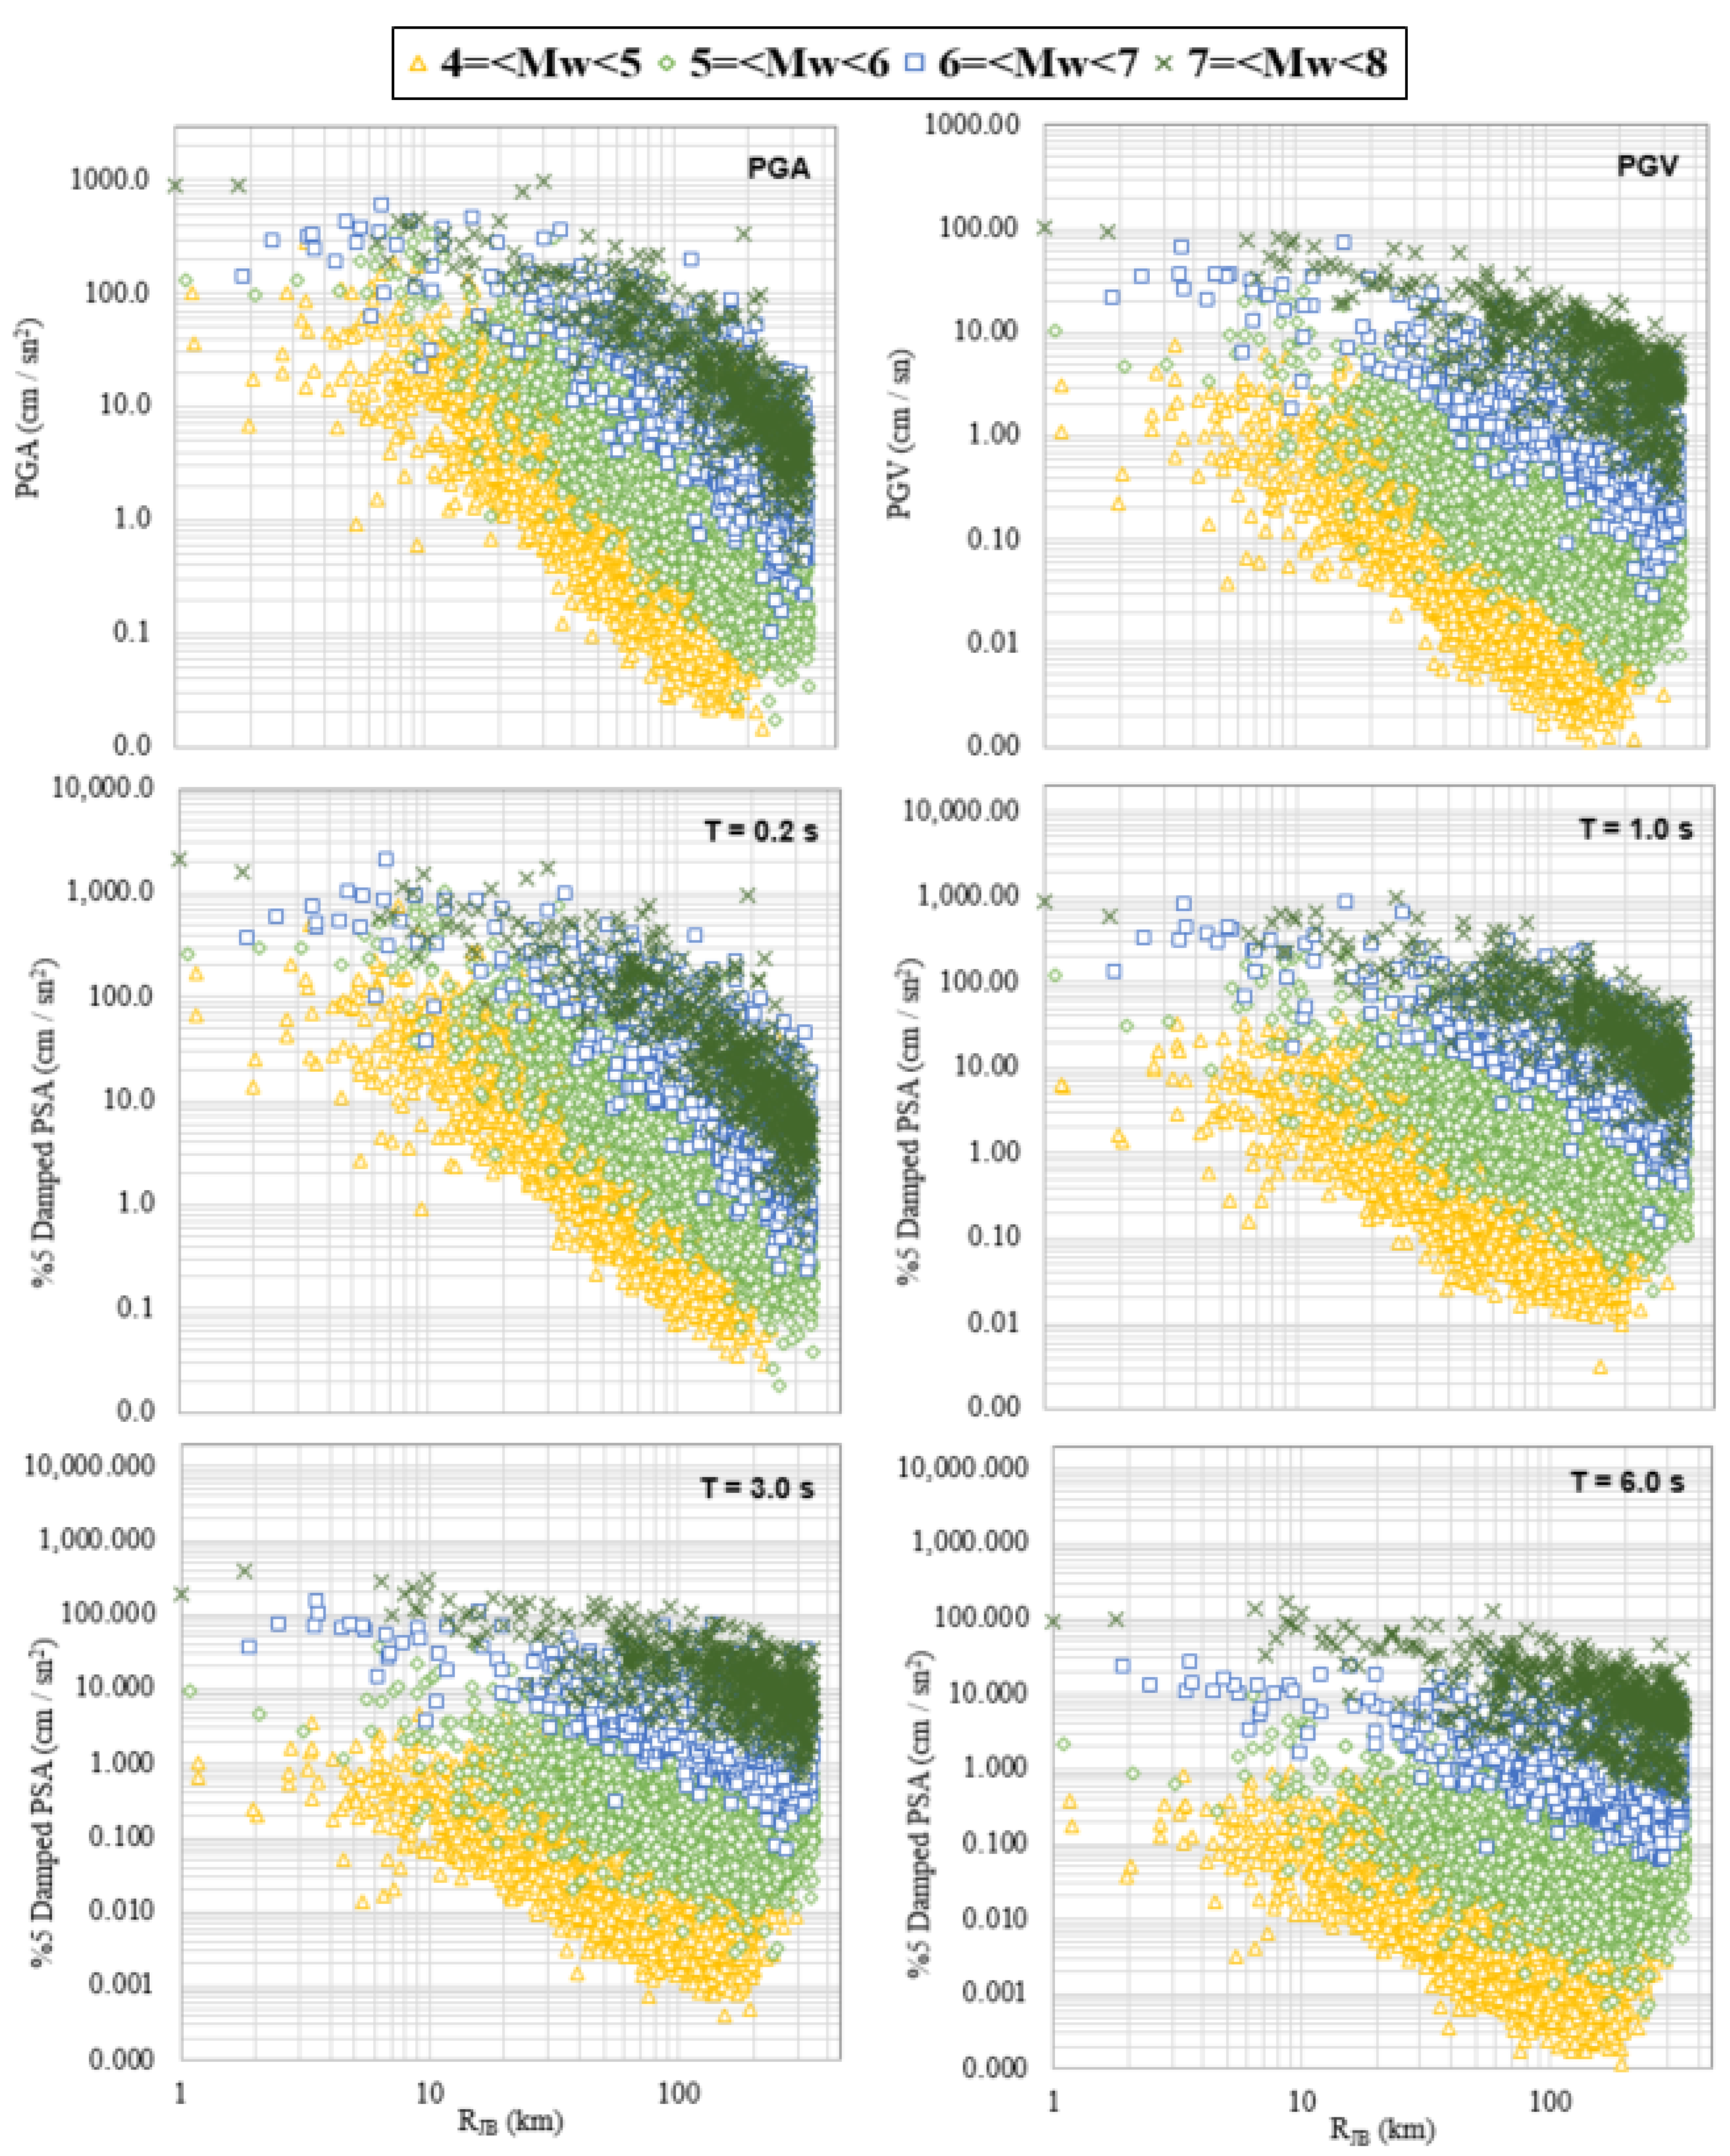
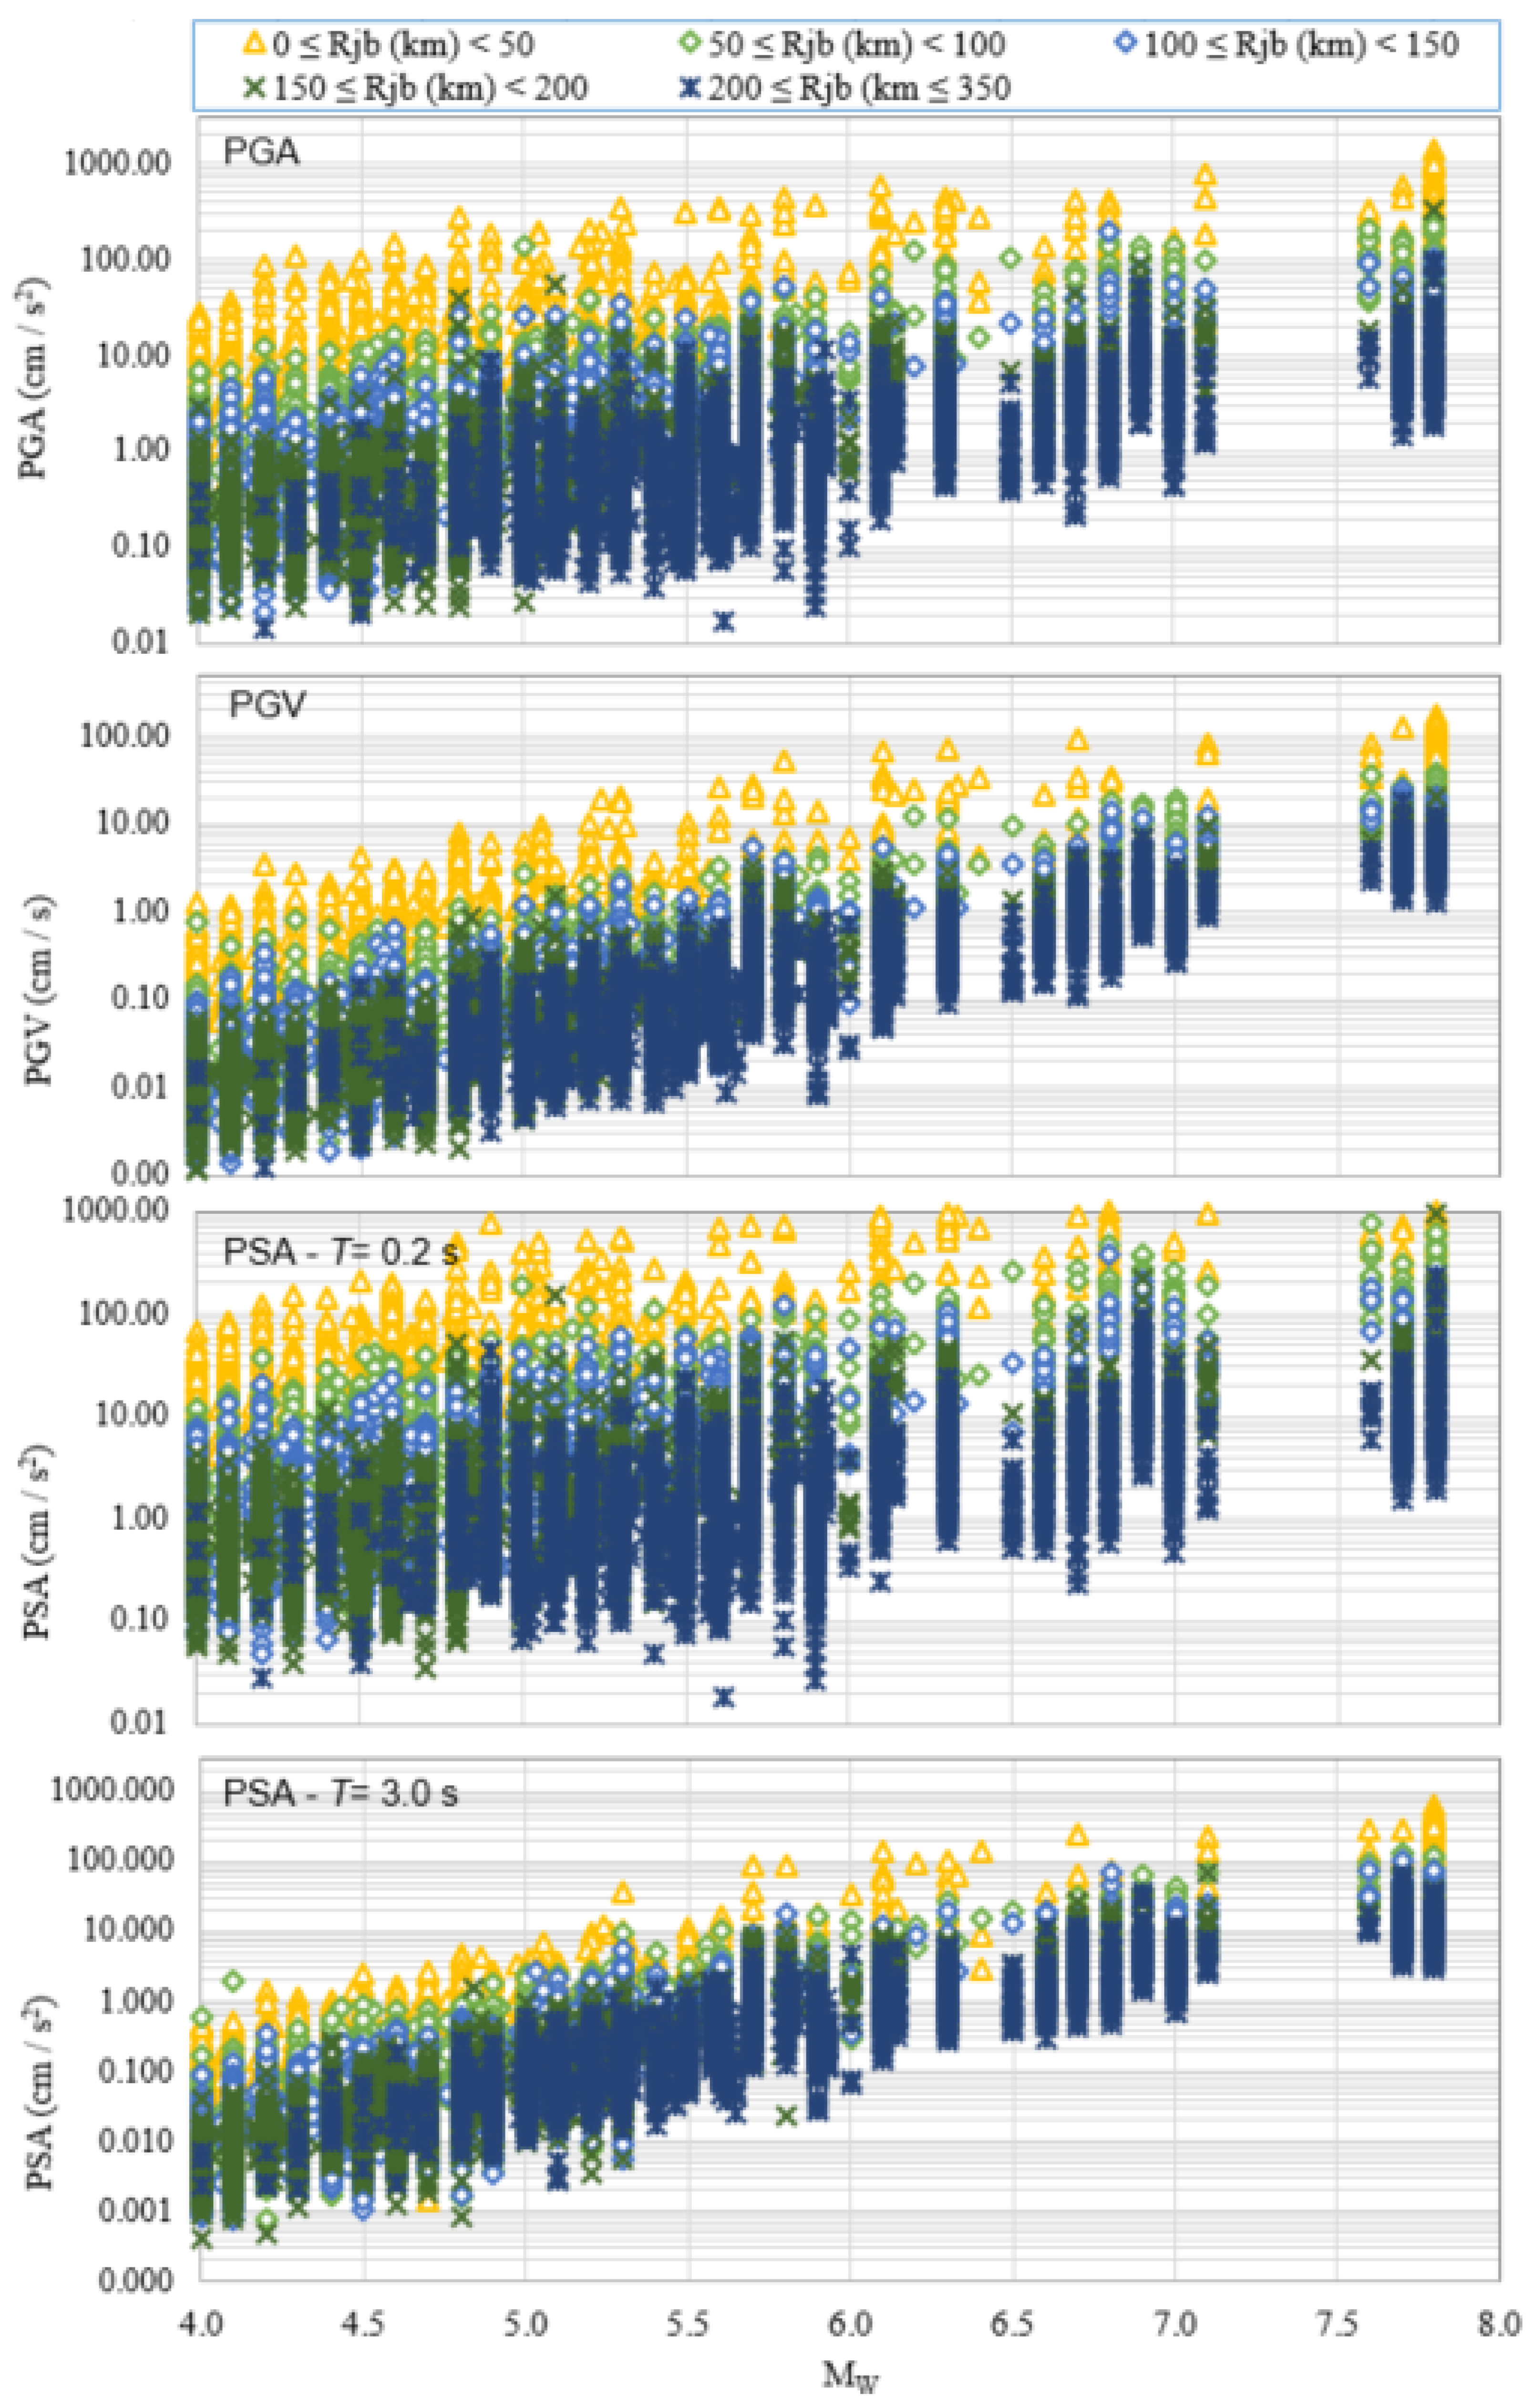
  • Moment magnitude (MW) ranging from 4.0 to 7.8 for shallow crustal earthquakes,
  • Mainshock and aftershock events with focal depths ≤ 35 km,
  • A source-to-site distance (RJB) ranging from 0 to 350 km,
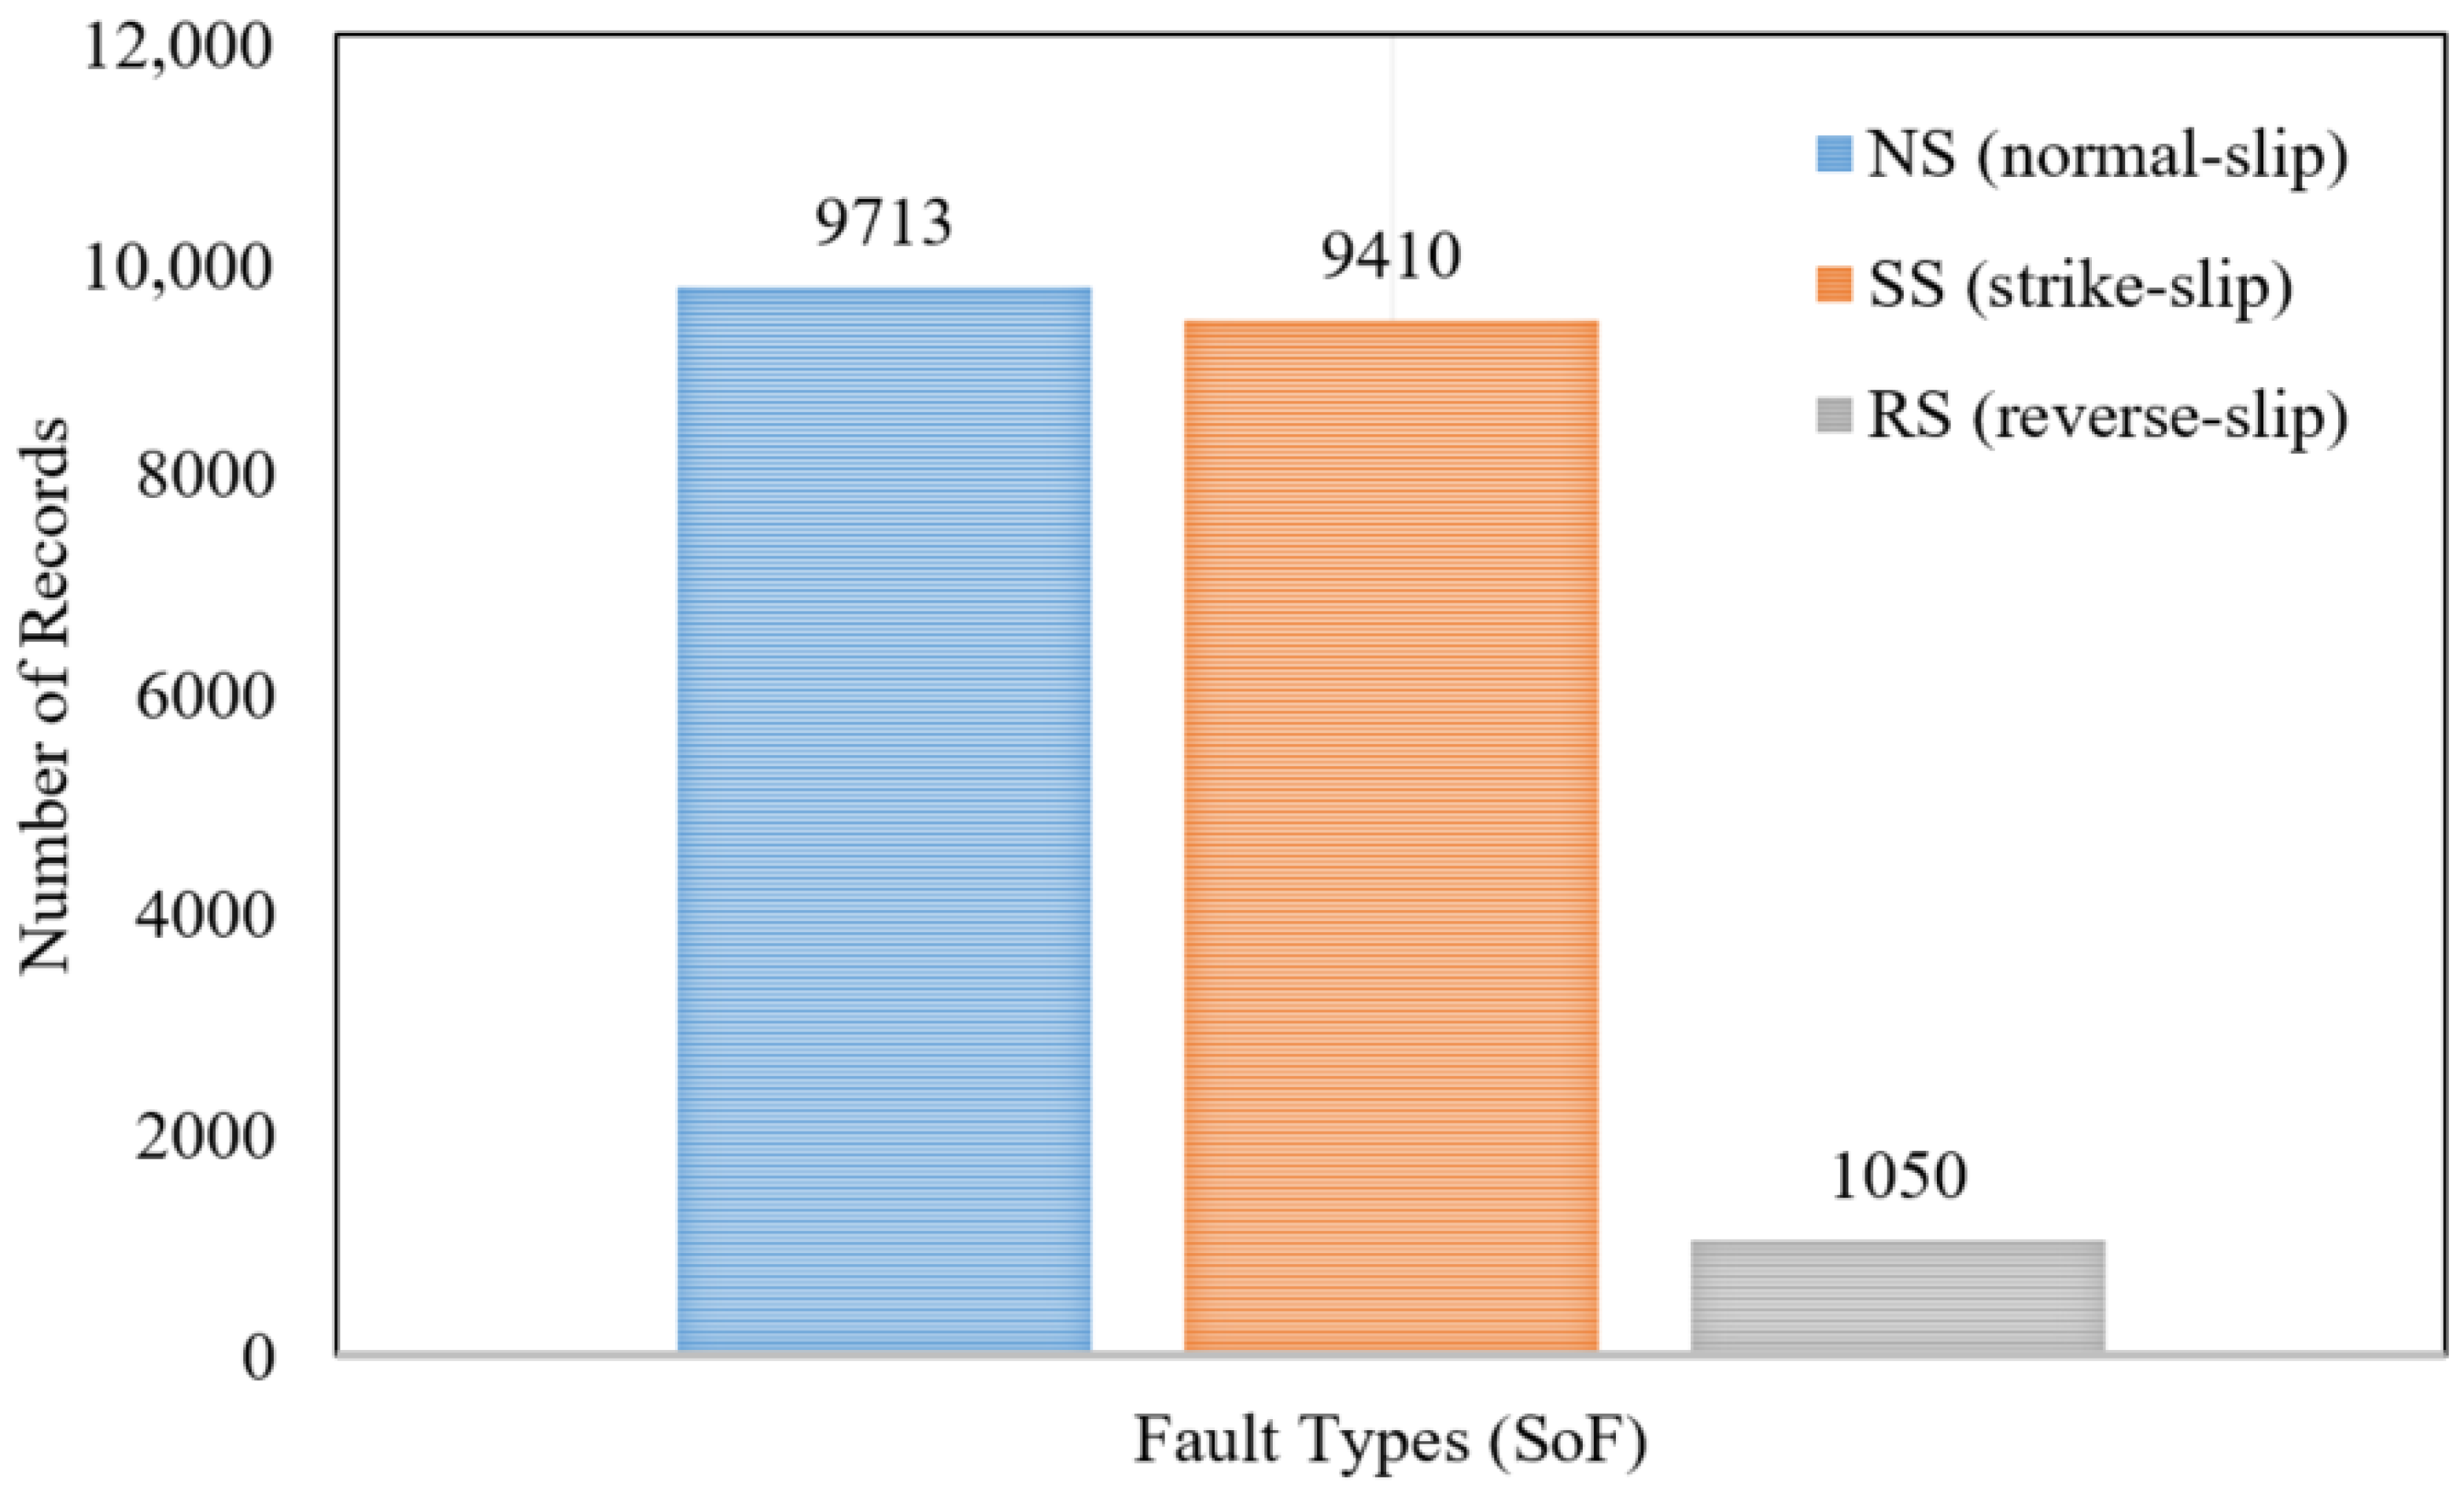
  • The used records are characterized by SS (9410), NS (9713), and RS (1050) fault types,
  • The ground-motion data, obtained from the databases, consist of horizontal-component recordings that have been processed and converted to RotD50 [31]. The dataset includes PGA, PGV, and 5% damping PSA values for 36 different periods ranging from 0.01 to 10.0 s.
  • Time-averaged 30 m shear-wave velocities of VS30 = 131 to 1862 m/s,
  • The strong-motion records controlling our equations are derived principally only from Türkiye and were mostly obtained from high-resolution digital recorders in free-field stations, while a limited number of records before 2000 were provided from single-story buildings and analog instruments,
  • Records with low resolution, noise, anormal peaks, or with S-triggers, and those containing consecutive earthquakes in the same series, have been excluded.

3. Ground-Motion Prediction Models (GMPMs)

The GMPM functional forms used in this study are composed of a set of GMPEs. The basic formulation of GMPEs is presented by defining the selected model components and their associated variables. The functional form includes the variables’ moment magnitude MW, style-of-faulting (SoF), shear wave velocity (VS30), distance (RJB), and PSA value at the reference rock site condition (PSAr).
The function chosen for our GMPMs is given in Equation (1):
ln Y = f M M w + f D Z h y p + f S o F S o F + f R M w , R + f S V S 30 , P S A r + σ
In the ground-motion model, ln is the natural logarithm, Y is ground-motion intensity measure (PGA, PGV and 5%-damped PSA). Y has units of cm/s for PGV and cm/s2 for PGA and PSA, fM(Mw) represents the magnitude scaling of ground motion, fD(ZHYP) is the depth function, fSoF(SoF) is the style of faulting, fR(Mw, RJB) includes both geometric spreading and anelastic attenuation and scales the ground motion with distance, fS(VS30, PSAr) is site effect for the PSA at a reference rock site (Vref), and, finally, σ is the total standard deviation of residual distribution.
The general expression adopted for the magnitude scaling is adapted from Abrahamson et al. [37]. It involves trilinear magnitude scaling with a quadratic component. The regression coefficients (c1, c2, c3, c4 and c5) are calculated using mixed-effect regression. M is the moment magnitude (Mw) predictor variable, and M1 and M2 are the hinge magnitudes and are assumed to be 6.75 and 5.5 for M1 and M2, respectively. The magnitude function fM(M) is defined in Equation (2):
f M M = c 1 + c 2 M 2 M 1 + c 3 M M 2 + c 4 8.5 M 2 2   f o r   M < M 2 c 1 + c 2 M M 1 + c 4 8.5 M 2                         f o r   M 2 M < M 1 c 1 + ( c 5 ) M M 1 + c 4 8.5 M 2                                   f o r   M M 1
For the depth effect, we used the functional form adapted from Campbell and Bozorgnia [38]. We used hypocentral depth (ZHYP) as a variable to represent the depth dependency of the function. The use of hypocentral depth instead of depth to the top of rupture (ZTOR) is due to sparsity of data with ZTOR. The depth dependency function fD(ZHYP) is given by Equation (3):
f D Z H Y P = c 6 0 ,                               Z h y p 7 ( Z h y p 7 ) ,             7 < Z h y p 20 13 c 6 ,                           Z h y p > 20
where c6 is the regression coefficient.
One of the key predictive variables used in our regression analysis is the style-of-faulting (SoF) term. Fault type refers to the categorization of events as SS, NS, or RS. The SoF effect is addressed in the reference model using multiplicative coefficients on dummy variables. We did not assess the magnitude dependence for scaling with SoF. The fault type function is given in Equation (4), where c7 and c8 are coefficients that depend on the model and the fN and fR dummies for the NS and RS events, respectively. The style-of-faulting function is given by:
f S o F S o F = ( c 7 ) f N + ( c 8 ) f R
Distance scaling consists of two components: geometric spreading and anelastic attenuation. The geometrical spreading effect increases with the earthquake magnitude. Moreover, for a large earthquake, the attenuation of ground motion with distance decreases more slowly than for a smaller earthquake. Therefore, the geometrical spreading term, as expressed in Equation (5a), is represented as a linear function dependent on the magnitude. The path function is given by:
f R M w , R J B = f R , G S M w , R J B + f R , A A R
f R , G S M w , R J B = d 1 + d 2 ( M w 6.75 ) ln ( R )
in which the first term represents magnitude-dependent geometrical spreading (d2) and is computed through regression, while the second term accounts for anelastic attenuation. d1 and d2 are the regression coefficients. We used the anelastic attenuation term and, since it is assumed to be more significant at longer distances, we decided to use this effect at long distances (RJB > 80). d3 is period-dependent model coefficient for the anelastic attenuation. The functional expression for distance scaling is provided for R < 80 and R > 80; R is calculated as R J B 2 + h 2 where, RJB indicates the Joyner–Boore distance. h is the pseudo-depth term (km) and is estimated by the regression.
f R , A A R = 0                                       f o r   R 80   k m ( d 3 ) ( R 80 )                   f o r   R > 80   k m
The site function (fS) is represented by the addition of linear (Flin) and nonlinear (Fnl) site amplification functions:
f S V S 30 , P S A r = F l i n + F n l
In this study, we used linear scaling and soil nonlinearity to represent site amplification behavior. We primarily used the site amplification function from İçen and Sandıkkaya [19]. The nonlinear site amplification model coefficients were also adapted, and the linear term was calculated. The functional form for the linear site amplification is:
ln ( F l i n ) = ( s 1 ) ln V s 30 V r e f ,     V s 30 < V c ( s 1 ) ln V c V r e f ,     V s 30 V c
where s1 is the regression coefficient, Vref is the reference shear-wave velocity at which site amplification reaches unity (Vref = 760 m/s), and VC is the shear-wave velocity at which we observe that ground-motion intensity no longer scales with VS30.
The nonlinear site amplification function is:
ln ( F n l ) = s 2 e s 3 ( min V s 30 , 760 360 ) e s 3 ( 400 ) ln e x p ( l n ( P S A r ) ) + s 4 s 4
where s2, s3 and s4 are regression coefficients and PSAr is the PSA for a reference rock site (Vref), obtained by evaluating Equation (1).

3.1. Aleatory Variability Model

Al Atik et al. [39] describe total residuals as the difference between observed ground motions and the intensity measures forecasted by GMPE. These residuals can be divided into two components: between-event (δBe) and within-event (δWes) terms.
Δ = δ B e + δ W e s
The subscript e denotes the event, while the subscript s refers to the site. τ and ϕ correspond to the standard deviations for the between-event and within-event residuals, respectively. The within-event standard deviation can be separated into two terms, where δWSes and δS2S. δS2S denotes the systematic deviation of the observed ground motion at site s from the median-event-corrected ground-motion prediction. δWSes denotes the site- and event-corrected residual. The standard deviation of the residuals describing the variability from earthquake to earthquake and from record to record is denoted as ϕS2S and ϕSS, respectively. The total standard deviation ( σ -sigma) can be written as follows:
σ = τ 2 + ϕ s s 2 + ϕ S 2 S 2
The trilinear magnitude-dependent between-event standard deviation model used in this study is presented below:
τ = τ 1                                                     M W 5.5 τ 1 + τ 2 τ 1 ( M W 5.5 ) 1.25         5.5 < M W   6.75 τ 2                                                 M W > 6.75
In the equation above, τ1 and τ2 define the between-event variability for MW ≤ 5.5 and MW > 6.75, respectively.

3.2. Regression Analysis

We employed a two-stage regression method, starting with a linear mixed-effects regression analysis using the lme4 package in R [40,41]. In the first stage, model coefficients were calculated, followed by a residual analysis with homoscedastic assumptions. In the second step, we relaxed the assumption of homoscedastic variance and applied a heteroscedastic variance model, where variance was dependent on magnitude.
In the first stage, we regressed the coefficients of the model. The model included coefficients for earthquake event characteristics such as magnitude (c1, c2, c3, c4 c5), depth (c6), and style of faulting (c7, c8). Terms for geometric spreading (d1, d2), anelastic attenuation (d3) to account for GMIM decay with distance, and site amplification (s1) were also estimated using mixed-effects regression. Nonlinear site amplification terms were adapted from Icen and Sandıkkaya [19]. For distance scaling, we adjusted the RJB parameter by adding a pseudo-depth term (h), set to 7 km for this analysis. Due to a strong trade-off between the magnitude-dependent geometric spreading term and the magnitude term, we first estimated the d 2 term and constrained this coefficient. The regression was then repeated to estimate the style-of-faulting terms. Estimating these terms together led to unreliable coefficients due to tradeoff between magnitude and style-of-faulting terms. Once the style-of-faulting term was constrained, nonlinear site effects were excluded in this step. After constraining the h, d 2 and c 7 ,   c 8 terms, we applied the nonlinear site amplification model from Icen and Sandıkkaya [19]. High magnitudes tend to be underestimated because the database is dominated by low-to-moderate earthquakes. To address this, we first computed the c 2 and c 3 coefficients using the full database. Then, we computed the c 5 coefficient using a limited database restricted to earthquakes with MW > 6. Finally, we calculated the c 1 coefficient using the full database. In this step, we represented the geometrical spreading and anelastic attenuation terms using the d 1 , d 2 , and d 3 parameters. It is observed that distance scaling primarily affects shorter distances, where geometric spreading is more significant, while, at greater distances (RJB > 80), anelastic attenuation becomes more important. Anelastic attenuation is more prominent at higher frequencies and gradually decreases as frequency drops, eventually reaching zero.
An initial analysis of variances under the assumption of homoscedasticity showed that ground-motion variability within and between events strongly depends on magnitude. To address this, a trilinear heteroscedastic variance model, which varies with both magnitude and period, was introduced to estimate ground-motion variability.

3.3. Regression Coefficients and Residuals

The full set of GMPE coefficients (variable names starting with the letter c or others) obtained from the regression analysis is listed in Table 2 and Table 3. Residual plots are shown in Figure 10 to help us to explore the degree of agreement between the ground-motion estimates of our GMPE and the empirical observations obtained from the Türkiye dataset. The distributions are displayed in the left, middle, and right panels for periods of 0.01 s, 0.2 s, and 1 s, respectively. However, the residuals are separated into between-events, single-site, and site-to-site terms plotted versus MW, RJB, and VS30, respectively. In Figure 10, each parameter is divided into specific intervals, with the means and standard deviations of each interval represented by the error bars. The between-event residuals, located at the top of the figure, generally show no significant trend; however, it is observed that the records of the Van earthquake (MW 7.1) fall below the median. This inconsistency can be explained as the possible interaction of the variable stress drop and the kappa term [16,17,18,19,20,21,22,23,24,25,26,27,28,29,30,31,32,33,34,35,36,37,38,39,40,41,42]. The Van earthquake exhibits very weak ground motions that are inconsistent with finite-fault distance metrics. The means of the site-to-site residuals and single-site within-event residuals suggest that the proposed model accurately represents the observed data without any bias. These plots show that the model fits the data well and there are no significant trends in the residuals.
A trilinear model dependent on magnitude is established for the between-event component (see Figure 11). This model remains constant below M11) and above M22), with M1 and M2 set at 5.5 and 6.75, respectively. Fixed thresholds were selected to ensure simplicity in the calculations and were determined to be applicable across a broad range of periods from T = 0.01 to 10 s. Additionally, the standard deviation decreases in a linear fashion as magnitude increases.

3.4. Comparisons

Figure 12 shows the comparison between the observed data and the predictions proposed in this study for two magnitudes (MW 5.5 and 7.2, which are close to the lower and upper limits of the dataset) and strike-slip faulting; the comparison is made for PGA, PGV, and PSA (at T = 0.2 s and 1.0 s). This comparison is made for VS30 = 760 m/s, which represents rock sites. A visual inspection of the plots shows that our prediction curves are generally in agreement with the observed data.
The median 5%-damped response spectra of our proposed model are compared with some of the most commonly used local and global GMPMs, which are based on similar parameters and developed for shallow crustal earthquakes (Figure 13). In the comparisons, MW 6.0 and RJB 100 km, and MW 7.2 and RJB 15 km are used for magnitude and distance attenuation curve combinations, respectively. In both cases, a strike-slip fault scenario is considered for VS30 = 760 m/s.
The selected GMPMs for this comparison were partially developed using the NGA-West2 database (ASK14; BSSA14; CY14; CB14; I14), while the others were developed using the Pan-European datasets (ASB14; Beal14; KAAH15; Leal19; Keal20; B21; IS23). While California and Taiwan earthquakes dominate in the NGA-West2 models, the records from Türkiye, Greece, Italy, and Iran are predominant in the Pan-European predictive models [4]. Figure 13 shows the comparisons with five NGA-West2 and seven European models for moderate-magnitude (MW = 6.0) and RJB 100 km and large-magnitude (MW = 7.2) and RJB 15 km scenarios. Overall, the predictions of the model we recommended are close to those of the other selected GMPMs. However, for the large-magnitude (MW = 7.2) scenario, the proposed model gives somewhat lower estimates in the 0.2 to 1.0 second period range compared to the selected models. Similar prediction values are also observed in the B21 local model developed by Boore et al. [9] using earthquake records from Greece. Here, the variation in the compared prediction models may be influenced by the quantity and quality of the databases used, as well as by local seismotectonic characteristics.

4. Results and Discussion

Using ground-motion data recorded in Türkiye, we present a set of GMPMs derived from recordings of shallow earthquakes in active crustal regions and for application in Türkiye. While developing the prediction model, a thorough review of the existing literature was conducted to focus on the parameters and determine the functional form that could facilitate the analyses. Subsequently, the applicability of the selected form was examined, and the model coefficients were calculated for the chosen model with the existing dataset. The proposed models are developed for horizontal-component PGA, PGV, and 5%-damped PSA response spectra, at 36 periods ranging from 0.01 to 10 s. The new models provide a reliable description of horizontal ground-motion amplitudes for shallow (<35 km) crustal earthquakes in highly active tectonic regions such as Türkiye over a wide range of magnitudes, distances, and site conditions. Compared with other models, the GMPM model obtained from this study constitutes up-to-date and unique near-source data that include recent main shocks and aftershocks of the Van (23.10.2011, MW 7.1), Sivrice–Elazığ (24.01.2020, MW 6.8), Aegean Sea (30.10.2020, MW 7.0), and Düzce (23.11.2022, MW 5.9) earthquakes and the Kahramanmaraş earthquake doublet (Pazarcık, Mw 7.8 and Elbistan, MW 7.7) on 6 February 2023. Therefore, our model uses a well-defined new large dataset (20,173 records, 1565 events, 957 stations) and represents a rare example on a regional scale. It is calibrated using data with moment magnitudes ranging from 4.0 to 7.8, distances from 0 to 350 km, and VS30 values between 131 and 1862 m/s. Ground-motion intensity measures (GMIMs) are preferred as the median of the orientation-independent amplitudes (RotD50), and the source-to-site metrics are defined based on the closest distance to the surface projection of the fault plane (RJB). Events are categorized according to style of faulting (SoF) as strike-slip (SS), normal-slip (NS) and reverse-slip (RS) events. To reduce epistemic uncertainties as much as possible, strong-motion records with moment magnitude, faulting style, in situ measured VS30, and well-calculated distance information are included in the dataset.
In this study, we calculated each coefficient using mixed-effects regression. A two-stage regression analysis was used to derive the model coefficients. In the first stage, the model coefficients were estimated, followed by a residual analysis under the assumption of homoscedasticity. In the second stage, we relaxed this assumption and applied a heteroscedastic variance model, where variance depended on magnitude. Consistent predictions observed in comparisons with global or local GMPMs support the reliability of the proposed model. To increase the confidence interval of the standard deviations calculated from statistical studies, the data sets need to be further improved. The most significant reductions in standard deviation can be achieved by defining site conditions using only in-situ measured VS30 values and using events with moment magnitudes based solely on moment tensor solutions. Another important criterion for reducing standard deviation is the preference for distance metrics that are closest to the fault rupture (such as RJB, Rrup) instead of epicentral (Repi) or hypocentral (Rhyp) distances for large-magnitude events (MW > 5.5).
The proposed GMPMs emphasize ground-motion amplitudes with independent predictor variables consisting of magnitude, faulting style, distance, and site scaling.
The results of the study are summarized below:
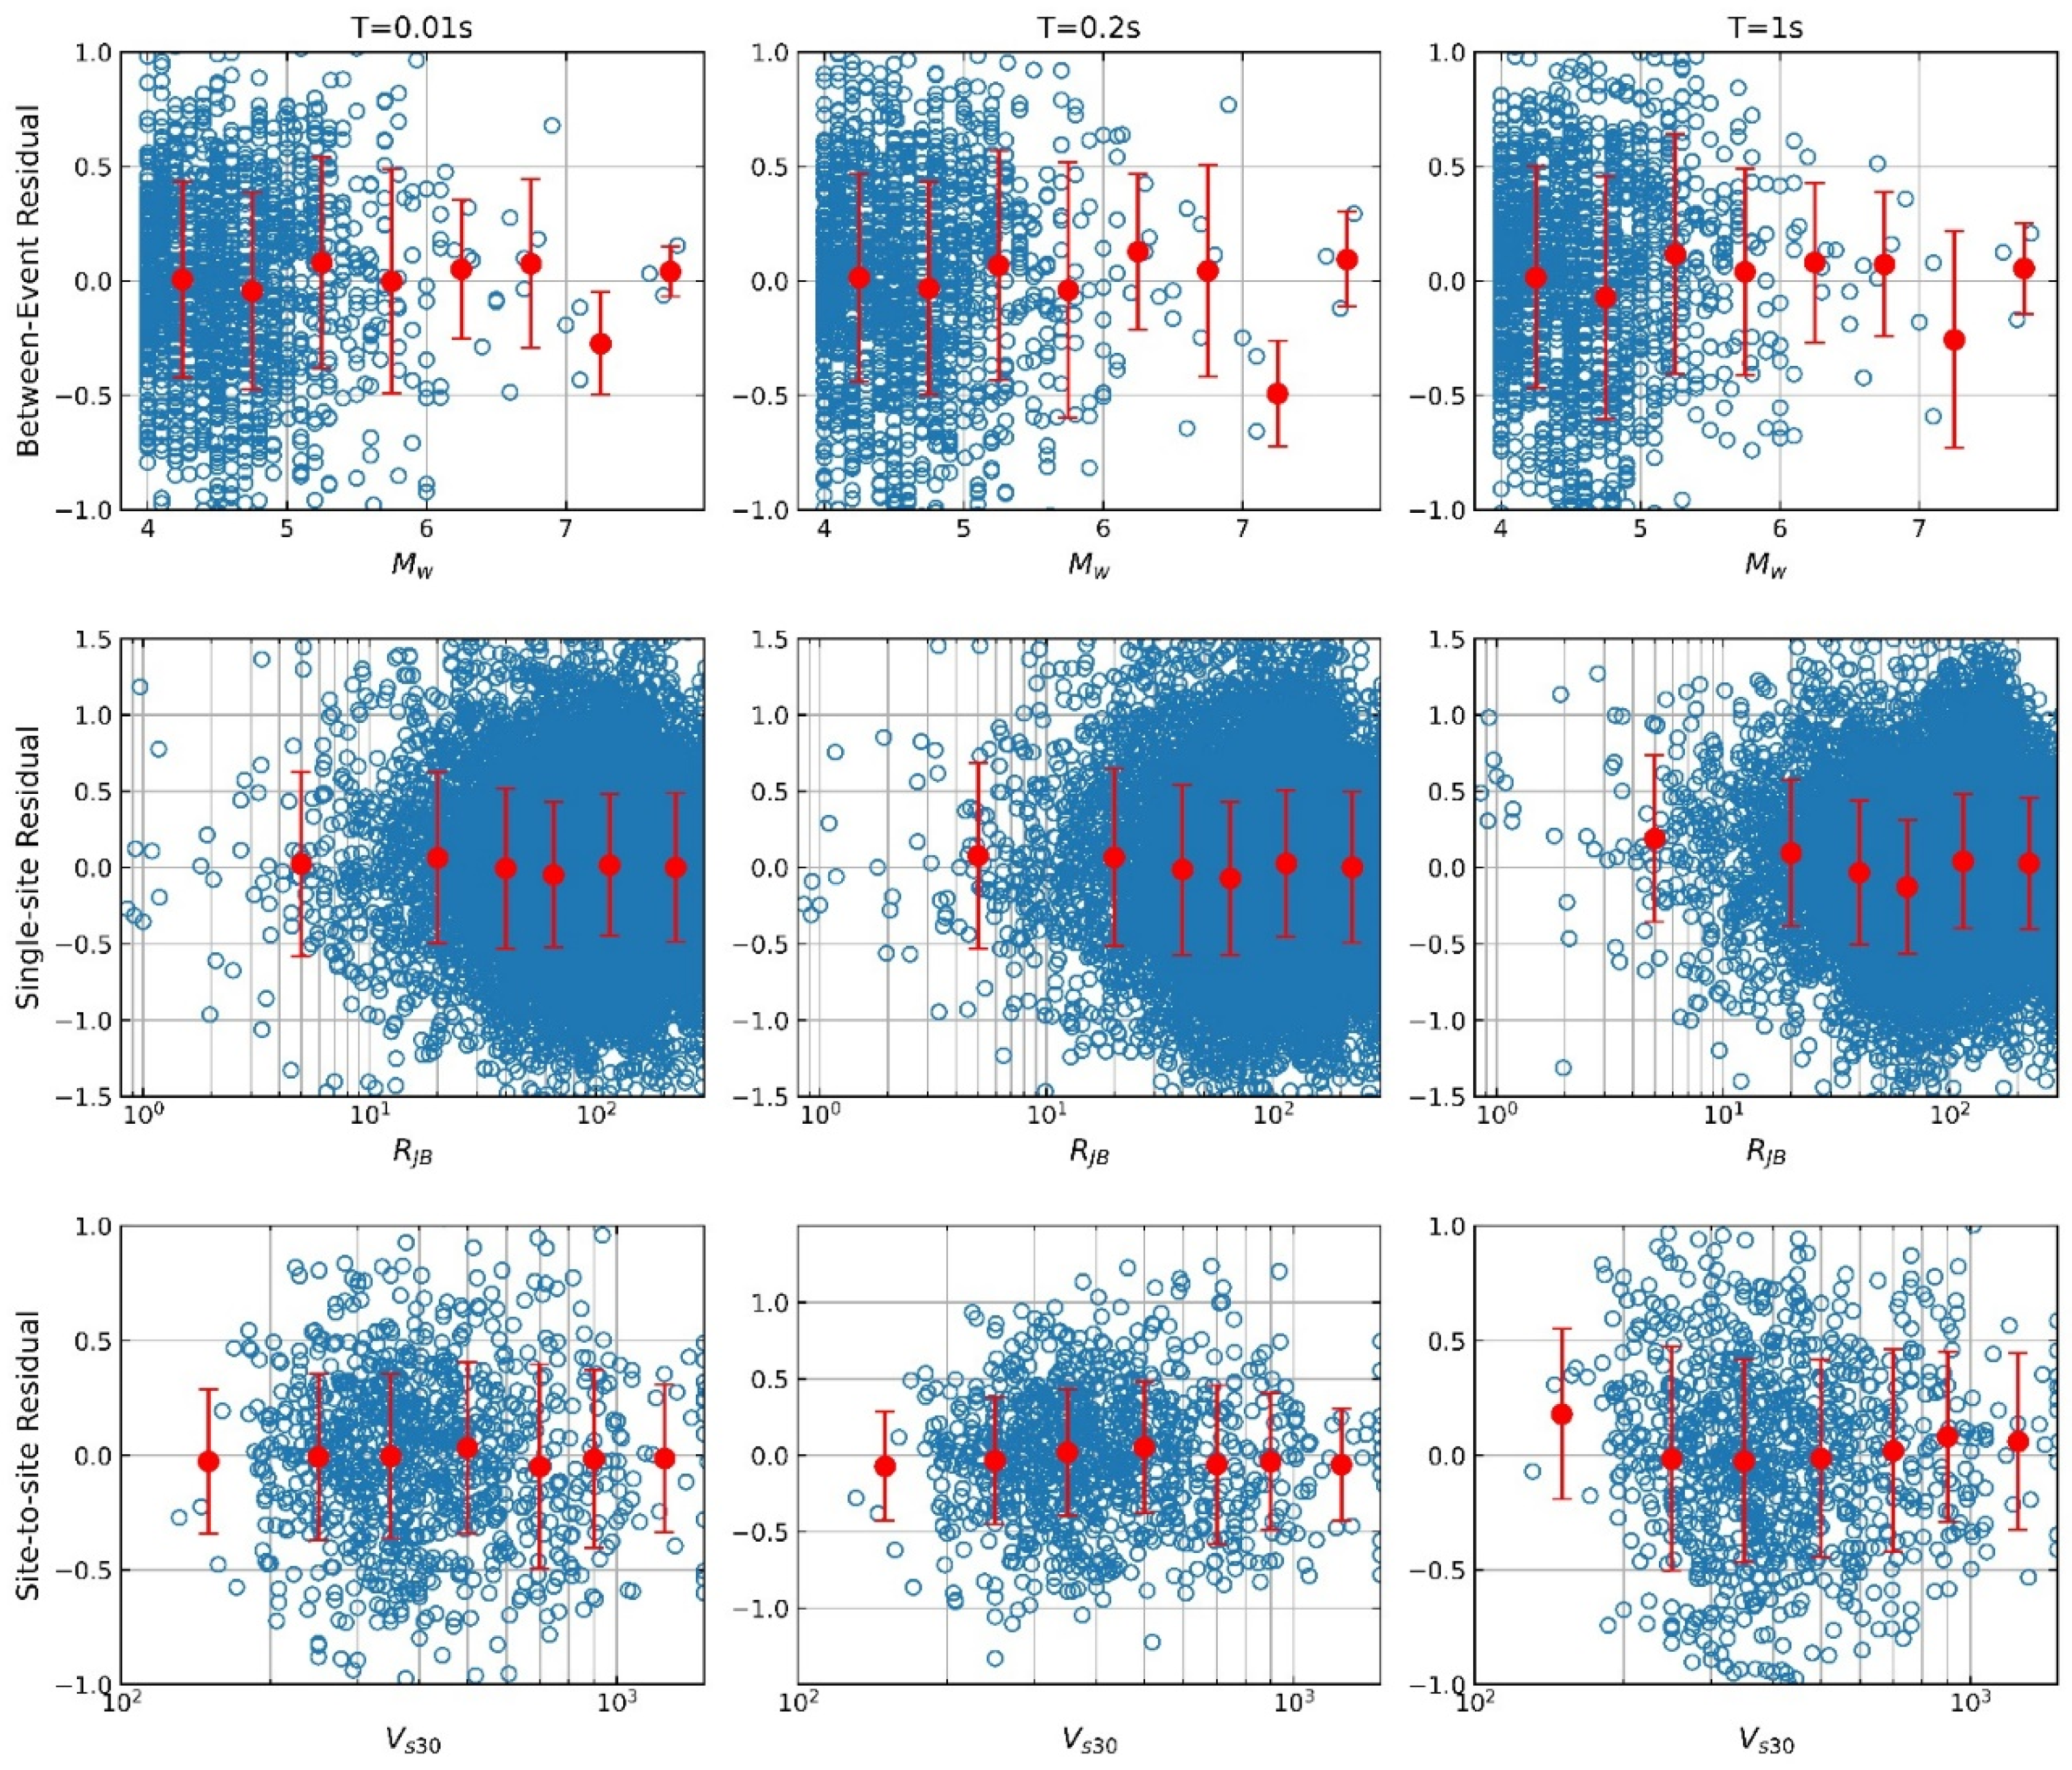
  • The between-event residuals show no significant trends, though records from the Van earthquake (MW 7.1) fall below the median. This discrepancy is likely due to the interaction between the variable stress drop and the kappa term. The weak ground motions from the Van earthquake are inconsistent with finite-fault distance metrics.
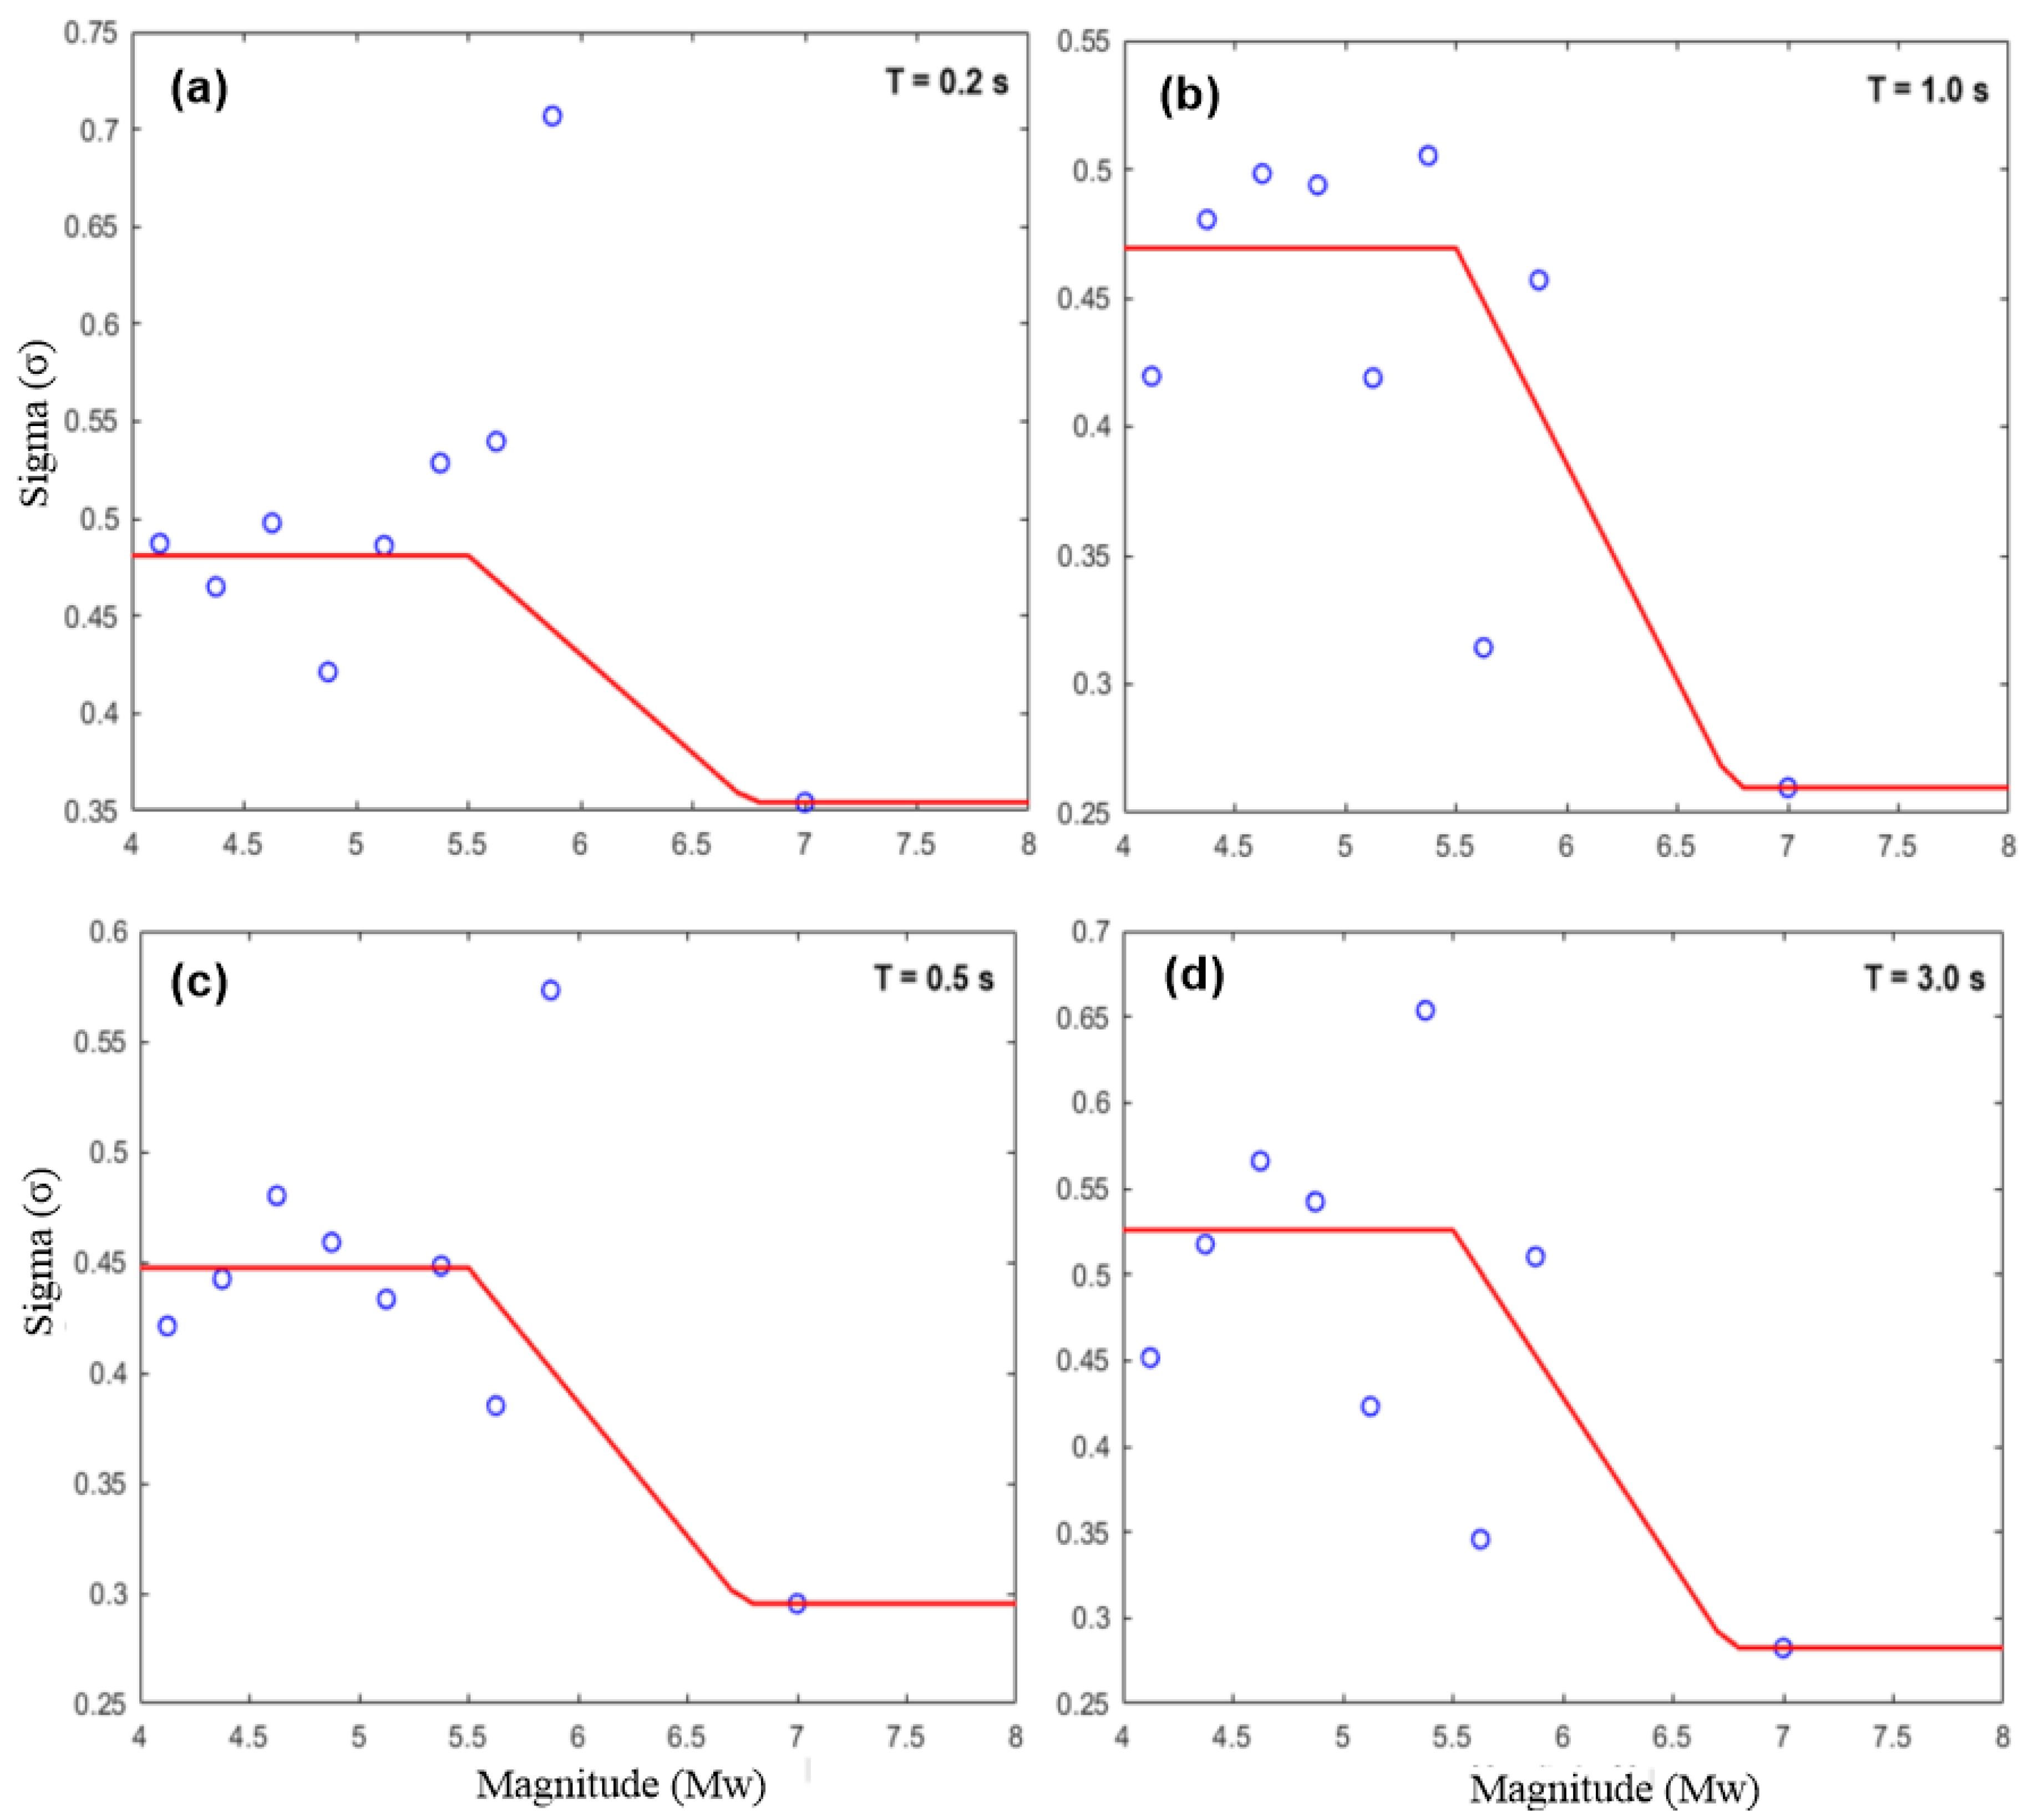
  • A strong correlation was found between one component of the standard deviation (between-event standard deviations) and magnitude. As the magnitude increases, τ decreases, and this pattern is independent of the period.
  • By incorporating a heteroscedastic model for between-event variability, the GMPMs address the magnitude-dependent nature of ground-motion variability, particularly for large events (MW > 6.5).
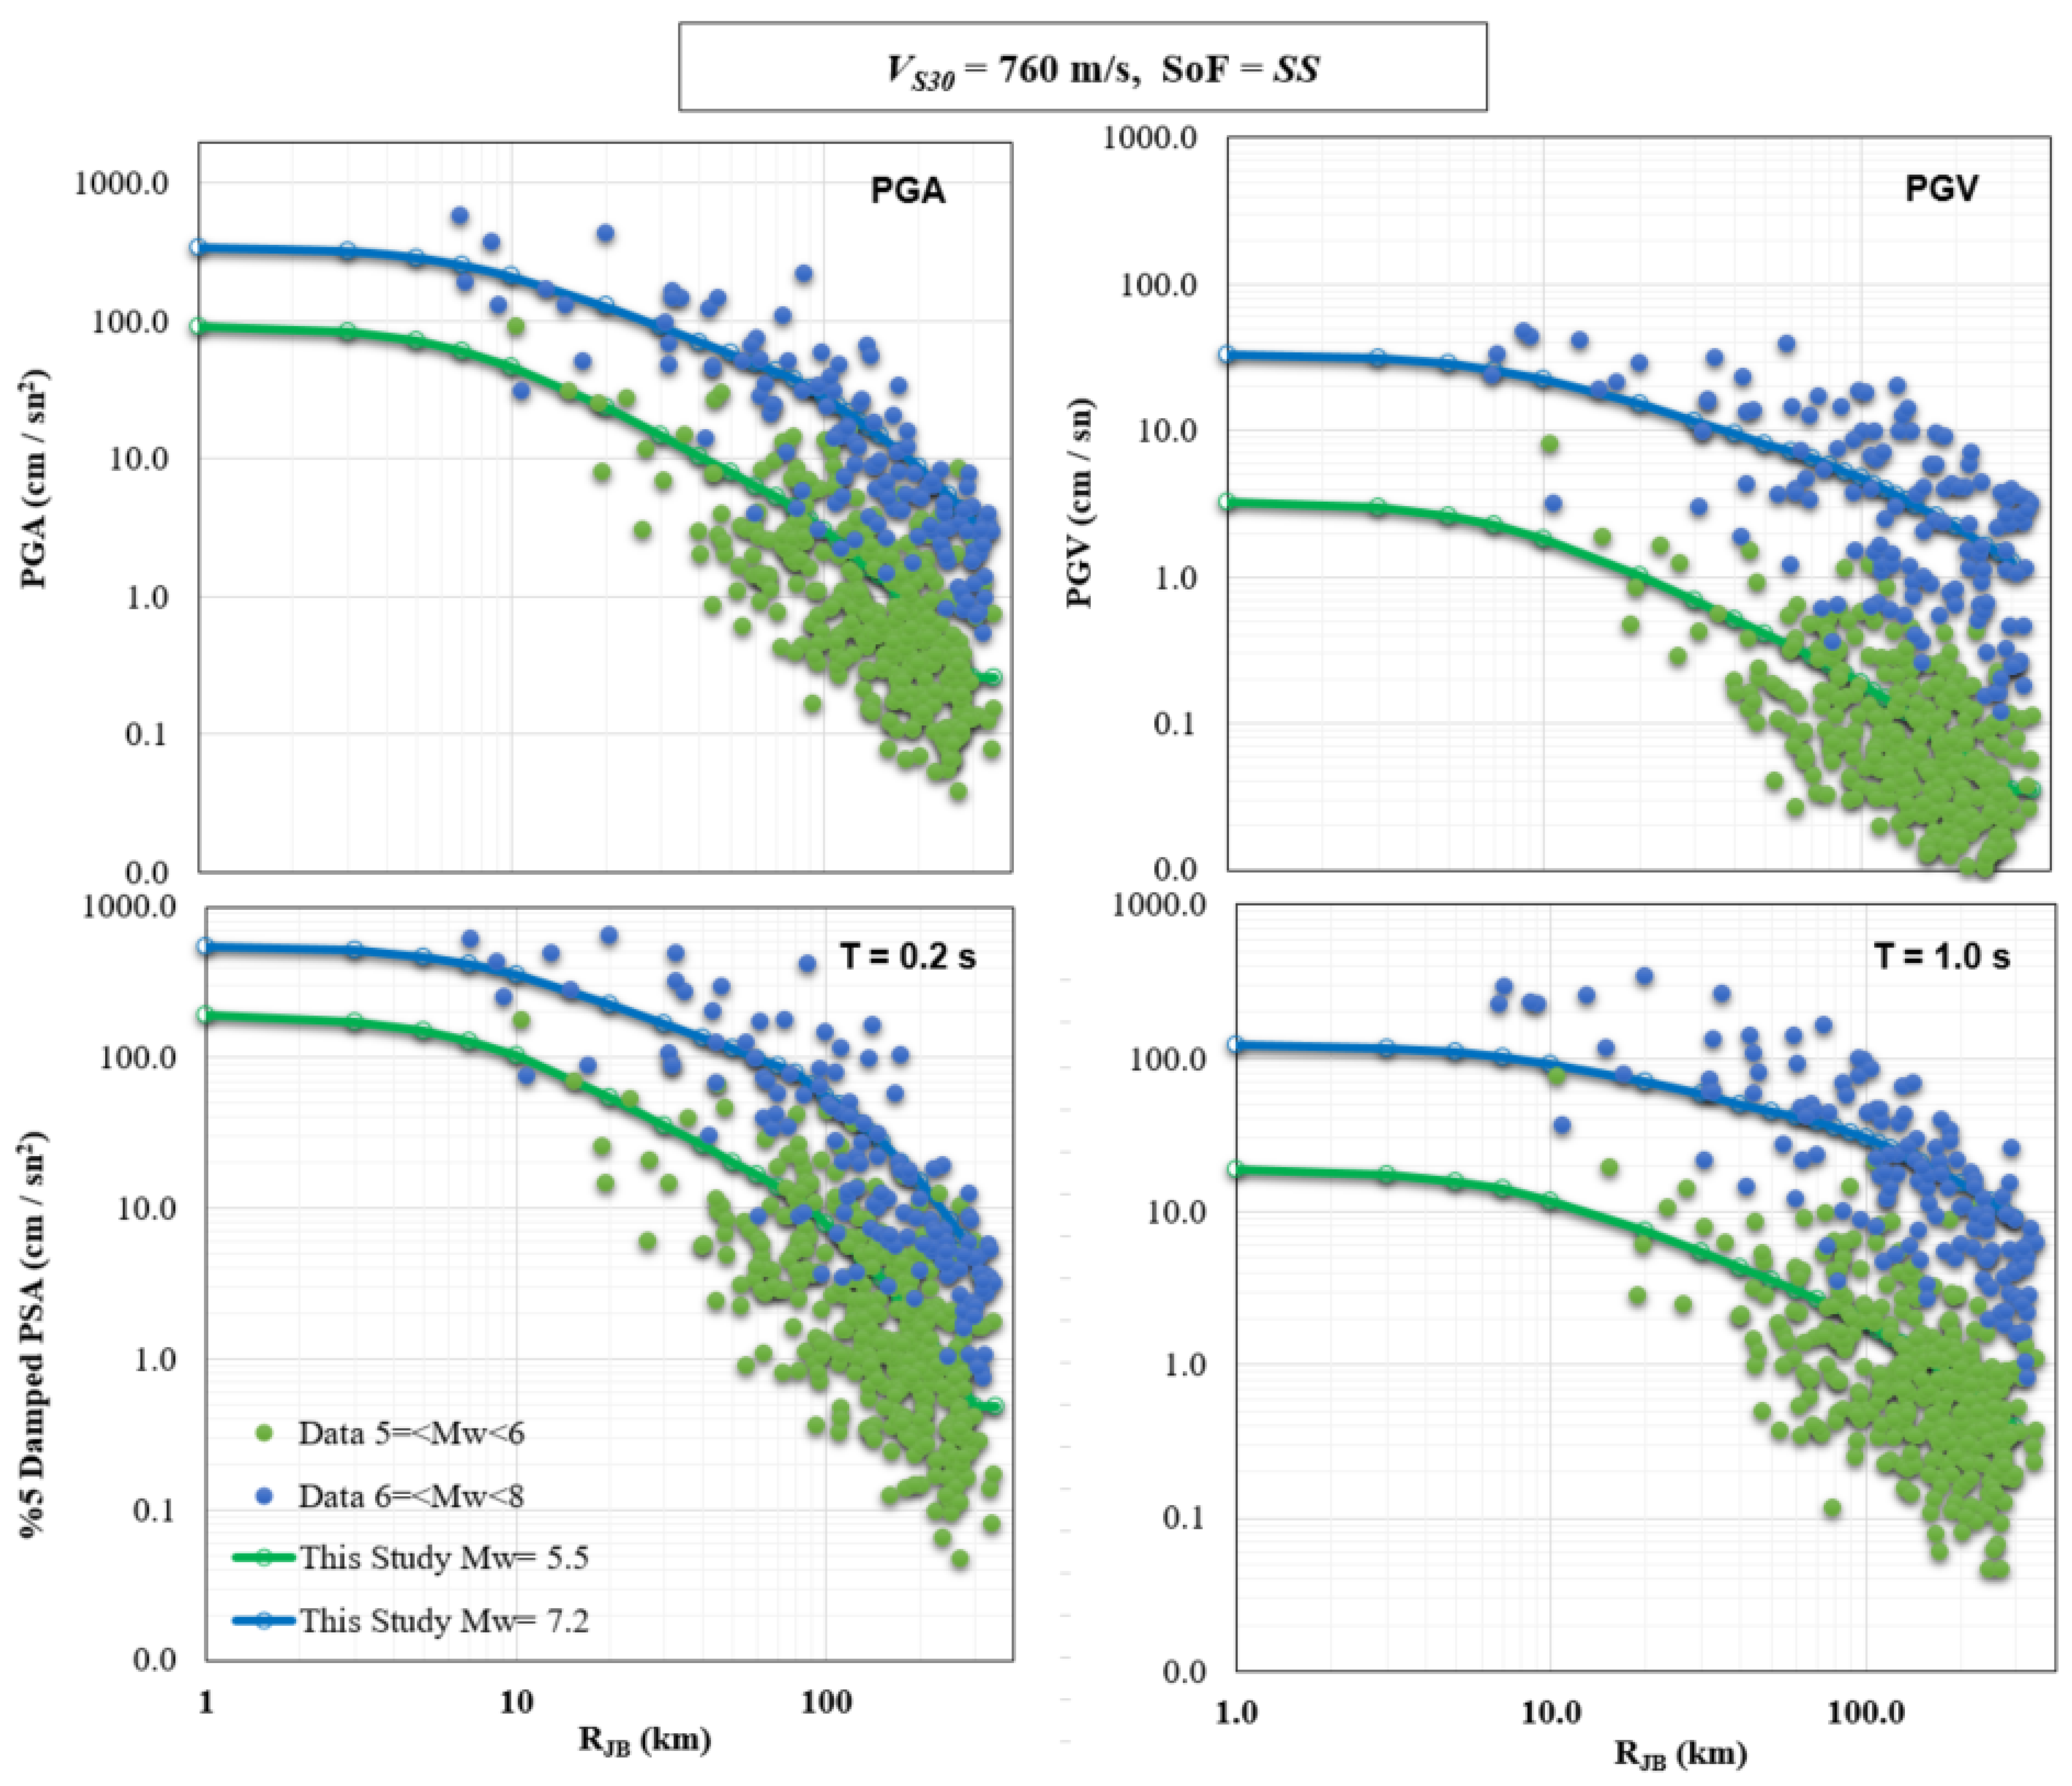
  • The inclusion of non-linear site amplification terms ensures accurate predictions for high-amplitude ground motions, particularly for soft soil conditions (low VS30 values).
  • The models are validated for events ranging from MW 4.0 to 7.8 and source-to-site distances up to 350 km. These limits ensure their applicability for a wide range of engineering and seismic hazard scenarios.
Here are the suggested limits for the predictor variables applied in our GMPMs:
  • Magnitude (MW) range: 4.0–7.8,
  • Events: mainshocks and aftershocks,
  • Distance (RJB) range: 0–350 km,
  • Event depth: shallower than 35 km,
  • Style of faulting (SoF): SS, NS, and RS,
  • Range of applicable site conditions (VS30): 131–1862 m/s,
  • GMIMs (RotD50): PSA at 5% damping for 36 periods in the 0.01–10 s range, PGA and PGV.
Our GMPEs were developed for application in tectonically active shallow crustal regions and should not be used for other tectonic regimes unless their applicability can be verified.

Author Contributions

Conceptualization, U.Ç; data curation, U.Ç.; methodology, U.Ç. and A.İ.; software, U.Ç. and A.İ.; validation, U.Ç. and A.İ.; resources, U.Ç.; writing—original draft, U.Ç.; writing—review & editing, U.Ç., A.İ. and F.S.; visualization, U.Ç.; supervision, F.S. All authors have read and agreed to the published version of the manuscript.

Funding

No funding was received to support this research or manuscript.

Institutional Review Board Statement

Not applicable.

Informed Consent Statement

Not applicable.

Data Availability Statement

The strong-motion dataset used in this article are published in the following databases: The Turkish strong-motions are obtained from the web site (TADAS, https://tadas.afad.gov.tr/login last accessed August 2024) operated and maintained by the Earthquake Department of the Turkish Disaster and Emergency Management Authority, Engineering Strong-Motion (ESM, https://www.orfeus-eu.org/data/strong, last accessed, 15 April 2023), An Updated Strong-Motion Database of Türkiye (SMD-TR) (DesignSafe-CI. https://doi.org/10.17603/ds2-f21x-s189 last accessed 12 August 2024).

Acknowledgments

This publication is a part of doctoral dissertation by the first author in the Academic Program of Geophysical Engineering, Faculty of Engineering, Kocaeli University. We also thank anonymous reviewers for their valuable comments. The strong-motion data used in this article provided by Disaster and Emergency Management Presidency (AFAD). AFAD’s data sharing policy is greatly appreciated and therefore AFAD and the Earthquake Department staff deserve the biggest thanks. The authors would also like to thank the team who prepared the Engineering Strong-Motion (ESM) Database supported by the European Plate Observing System (EPOS, GA 676564) project and the team of the an Updated Strong-Motion Database of Türkiye (SMD-TR). Generic Mapping Tools (GMT) was used to plot some figures (Wessel et al. [44]).

Conflicts of Interest

The authors declare no conflict of interest.

References

  1. Bozkurt, E. Neotectonics of Turkey—A synthesis. Geodin. Acta 2001, 14, 3–30. [Google Scholar] [CrossRef]
  2. Douglas, J. Ground Motion Prediction Equations 1964–2023. 2024. Available online: https://figshare.com/authors/John_Douglas/4052182 (accessed on 19 March 2025).
  3. Kalkan, E.; Gülkan, P. Site-dependent spectra derived from ground motion records in Turkey. Earthq. Spectra 2004, 20, 1111–1138. [Google Scholar] [CrossRef]
  4. Akkar, S.; Cagnan, Z. A local ground-motion predictive model for Turkey and its comparison with other regional and global ground-motion models. Bull. Seismol. Soc. Am. 2010, 100, 2978–2995. [Google Scholar] [CrossRef]
  5. Zhao, J.X.; Zhou, S.; Zhou, J.; Zhao, C.; Zhang, H.; Zhang, Y.; Gao, P.; Lan, X.; Rhoades, D.; Fukushima, Y.; et al. Ground-motion prediction equations for shallow crustal and upper-mantle earthquakes in Japan using site class and simple geometric attenuation functions. Bull. Seismol. Soc. Am. 2016, 106, 1552–1569. [Google Scholar] [CrossRef]
  6. Bindi, D.; Massa, M.; Luzi, L.; Ameri, G.; Pacor, F.; Puglia, R.; Augliera, P. Pan-European ground-motion prediction equations for the average horizontal component of PGA, PGV, and 5%-damped PSA at spectral periods up to 3.0 s using the RESORCE dataset. Bull. Earthq. Eng. 2014, 12, 391–430. [Google Scholar] [CrossRef]
  7. Kale, Ö.; Akkar, S.; Ansari, A.; Hamzehloo, H. A ground-motion predictive model for Iran and Turkey for horizontal PGA, PGV and 5%-damped response spectrum: Investigation of possible regional effects. Bull. Seismol. Soc. Am. 2015, 105, 963–980. [Google Scholar]
  8. Lanzano, G.; Luzi, L.; Pacor, F.; Felicetta, C.; Puglia, R.; Sgobba, S.; D’Amico, M. A revised ground-motion prediction model for shallow crustal earthquakes in Italy. Bull. Seismol. Soc. Am. 2019, 109, 525–540. [Google Scholar] [CrossRef]
  9. Boore, D.M.; Stewart, J.P.; Skarlatoudis, A.A.; Seyhan, E.; Margaris, B.; Theodoulidis, N.; Scordilis, E.; Kalogeras, I.; Klimis, N.; Melis, N.S. A ground-motion prediction model for shallow crustal earthquakes in Greece. Bull. Seismol. Soc. Am. 2021, 111, 857–874. [Google Scholar]
  10. Özbey, C.; Sarı, A.; Manuel, L.; Erdik, M.; Fahjan, Y. An empirical attenuation relationship for northerwestern Turkey ground motion using a random effects approach. Soil Dynam. Earthq. Eng. 2004, 24, 115–125. [Google Scholar]
  11. Luzi, L.; Morasca, P.; Zolezzi, F.; Bindi, D.; Pacor, F.; Spallarossa, D.; Franceschina, G. Ground motion models for Molise region (southern Italy). In Proceedings of the First European Conference on Earthquake Engineering and Seismology (a Joint Event of the 13th ECEE & 30th General Assembly of the ESC, Geneva, Switzerland, 3–8 September 2006; p. 938. [Google Scholar]
  12. Akyol, N.; Karagöz, Ö. Empirical Attenuation Relationships for Western Anatolia, Turkey. Turk. J. Earth Sci. 2009, 18, 2. [Google Scholar] [CrossRef]
  13. Lanzano, G.; Luzi, L. A ground motion model for volcanic areas in Italy. Bull. Earthq. Eng. 2020, 18, 57–76. [Google Scholar] [CrossRef]
  14. Akkar, S.; Bommer, J.J. Empirical Equations for the Prediction of PGA, PGV, and Spectral Accelerations in Europe, the Mediterranean Region, and the Middle East. Seismol. Res. Lett. 2010, 81, 195–206. [Google Scholar] [CrossRef]
  15. Boore, D.M.; Stewart, J.P.; Seyhan, E.; Atkinson, G.A. NGA-West2 equations for predicting PGA, PGV, and 5% damped PSA for shallow crustal earthquakes. Earthq. Spectra 2014, 30, 1057–1085. [Google Scholar] [CrossRef]
  16. Chiou, B.S.-J.; Youngs, R.R. Update of the Chiou and Youngs NGA model for the average horizontal component of peak ground motion and response spectra. Earthq. Spectra 2014, 30, 1117–1153. [Google Scholar]
  17. Akkar, S.; Sandıkkaya, M.A.; Bommer, J.J. Empirical ground-motion models for point-and extended-source crustal earthquake scenarios in Europe and the Middle East. Bull. Earthq. Eng. 2014, 12, 359–387. [Google Scholar]
  18. Kotha, S.R.; Weatherill, G.; Bindi, D.; Cotton, F. A regionally-adaptable ground-motion model for shallow crustal earthquakes in Europe. Bull. Earthq. Eng. 2020, 18, 4091–4125. [Google Scholar] [CrossRef]
  19. İçen, A.; Sandikkaya, M.A. Region Specific Ground-Motion Predictive Models for Shallow Active Regions. J. Earthq. Eng. 2023, 27, 4449–4468. [Google Scholar] [CrossRef]
  20. Ulusay, R.; Tuncay, E.; Sönmez, H.; Gökçeoğlu, C. An attenuation relationship based on Turkish strong motion data and iso-acceleration map of Turkey. Eng. Geol. 2004, 74, 265–291. [Google Scholar]
  21. Akkar, S.; Çagnan, Z.; Yenier, E.; Erdogan, Ö.; Sandıkkaya, M.A.; Gülkan, P. The recently compiled Turkish strong-motion database: Preliminary investigation for seismological parameters. J. Seismol. 2010, 14, 457–479. [Google Scholar]
  22. Power, M.; Chiou, B.; Abrahamson, N.; Bozorgnia, Y.; Shantz, T.; Roblee, C. An overview of the NGA project. Earthq. Spectra 2008, 24, 3–21. [Google Scholar] [CrossRef]
  23. Ancheta, T.D.; Darragh, R.B.; Stewart, J.P.; Seyhan, E.; Silva, W.J.; Chiou, B.S.J.; Wooddell, K.E.; Graves, R.W.; Kottke, A.R.; Boore, D.M.; et al. NGA-West2 database. Earthq. Spectra 2014, 30, 989–1005. [Google Scholar]
  24. Luzi, L.; Puglia, R.; Russo, E.; D’Amico, M.; Felicetta, C.; Pacor, F.; Lanzano, G.; Çeken, U.; Clinton, J.; Costa, G.; et al. The Engineering Strong-Motion Database: A Platform to Access Pan-European Accelerometric Data. Seismol. Res. Lett. 2016, 87, 987–997. [Google Scholar] [CrossRef]
  25. Akkar, S.; Sandıkkaya, M.A.; Şenyurt, M.; Sisi, A.A.; Ay, B.Ö.; Traversa, P.; Douglas, J.; Cotton, F.; Luzi, L.; Hernandez, B.; et al. Reference Database for Seismic Ground-Motion in Europe (RESORCE). Bull. Earthq. Eng. 2014, 12, 311–339. [Google Scholar]
  26. Dogan, G.G.; Yalciner, A.C.; Yuksel, Y.; Ulutas, E.; Polat, O.; Güler, I.; Şahin, C.; Tarih, A.; Kânoğlu, U. The 30 October 2020 Aegean Sea Tsunami: Post-Event Field Survey Along Turkish Coast. Pure Appl. Geophys. 2021, 178, 785–812. [Google Scholar] [CrossRef] [PubMed]
  27. Ozer, C. 4-D tomographic change of Vp and Vp/Vs structure before destructive earthquakes: A case study of the Sivrice-Elazığ earthquake (MW = 6.8), Eastern Turkey. Nat. Hazards 2021, 108, 1901–1917. [Google Scholar] [CrossRef]
  28. Öztürk, S.; Alkan, H. Multiple parameter analysis for assessing and forecasting earthquake hazards in the Lake Van region, Turkey. Baltica 2023, 36, 133–154. [Google Scholar] [CrossRef]
  29. Paolucci, R.; Pacor, F.; Puglia, R.; Ameri, G.; Cauzzi, C.; Massa, M. Record processing in ITACA, the new Italian strong-motion database, in Earthquake Data in Engineering Seismology. In Geotechnical, Geological and Earthquake Engineering; Akkar, S., Gulkan, P., Van Eck, T., Eds.; Springer: Dordrecht, The Netherlands, 2011; Volume 14, pp. 99–113. [Google Scholar]
  30. Sandıkkaya, M.A.; Güryuva, B.; Kale, Ö.; Okçu, O.; İçen, A.; Yenier, E.; Akkar, S. An Updated Strong-Motion Database of Türkiye (SMD-TR). Earthq. Spectra 2024, 40, 847–870. [Google Scholar] [CrossRef]
  31. Boore, D.M. Orientation-independent, nongeometric-mean measures of seismic intensity from two horizontal components of motion. Bull. Seismol. Soc. Am. 2010, 100, 1830–1835. [Google Scholar]
  32. TBEC-2018; (Turkish Building Earthquake Code), Specifications for Buildings to be Built in Seismic Areas. Ministry of Public Works and Settlement: Ankara, Turkey.
  33. NEHRP. Recommended Provisions for Seismic Regulations for New Buildings; NEHRP: Gaithersburg, MD, USA, 2003; Fema450. [Google Scholar]
  34. Eurocode-8. Design Provisions for Earthquake Resistance of Structures. Seismic Actions and General Requirements of Structures; ENV 1998-1-1; European Committee for Standardization (CEN): Brussels, Belgium, 2002; CEN/TC 250, Draft. [Google Scholar]
  35. Sandıkkaya, M.A.; Yılmaz, M.T.; Bakır, B.S.; Yılmaz, O. Site classification of Turkish national strong-motion stations. J. Seismol. 2010, 14, 543–563. [Google Scholar]
  36. Kurtuluş, C.; Sertçelik, F.; Sertçelik, İ.; Kuru, T.; Tekin, K.; Ateş, E.; Apak, A.; Kökbudak, D.; Sezer, S.; Yalçın, D. Determination of site characterization in Turkey strong motion recording stations. J. Fac. Eng. Archit. Gazi Univ. 2020, 35, 1829–1846. [Google Scholar]
  37. Abrahamson, N.A.; Silva, W.J.; Kamai, R. Summary of the ASK14 ground motion relation for active crustal regions. Earthq. Spectra 2014, 30, 1025–1055. [Google Scholar]
  38. Campbell, K.W.; Bozorgnia, Y. NGA-West2 ground motion model for the average horizontal components of PGA, PGV, and 5% damped linear acceleration response spectra. Earthq. Spectra 2014, 30, 1087–1115. [Google Scholar]
  39. Al Atik, L.; Abrahamson, N.A.; Bommer, J.J.; Scherbaum, F.; Cotton, F.; Kuehn, N. The variability of ground-motion prediction models and its components. Seismol. Res. Lett. 2010, 81, 794–801. [Google Scholar]
  40. Bates, D.M.; Maechler, M.; Bolker, B. Lme4: Linear Mixed-Effects Models Using S4 Classes, R Manual. 2013. Available online: https://CRAN.R-project.org/package=lme4 (accessed on 10 December 2024).
  41. Pinheiro, J.; Bates, D.; DebRoy, S.; Sarkar, D.; R Core Team. nlme: Linear and Nonlinear Mixed Effects Models. R Package Version 3.1-155. 2022. Available online: https://CRAN.R-project.org/package=nlme (accessed on 10 December 2024).
  42. Abrahamson, N.A.; Gülerce, Z. Summary of the Abrahamson and Gulerce NGA-SUB ground-motion model for subduction earthquakes. Earthq. Spectra 2022, 38, 87552930221114374. [Google Scholar] [CrossRef]
  43. Idriss, I.M. An NGA-West2 empirical model for estimating the horizontal spectral values generated by shallow crustal earthquakes. Earthq. Spectra 2014, 30, 1155–1177. [Google Scholar] [CrossRef]
  44. Wessel, P.; Luis, J.F.; Uieda, L.A.; Scharroo, R.; Wobbe, F.; Smith, W.H.; Tian, D. The generic mapping tools version 6. Geochem. Geophys. Geosystems 2019, 20, 5556–5564. [Google Scholar]
Figure 1. A map of Türkiye showing the distribution of strong-motion stations that provided the data for this study. Digital elevations are from the EMODnet Digital Terrain Model (last accessed, 21 February 2025, http://www.emodnet-bathymetry.eu) and the shuttle radar topography mission (SRTM, doi:10.5066/F7K072R7).
Applsci 15 03442 g001
Figure 2. A map of Türkiye showing the locations of events used in calibration with focal mechanism (beach ball) solutions. The color of the beach balls denotes the faulting type: red, black, and blue beach balls correspond to normal-slip, thrust-slip, and strike-slip faulting types, respectively.
Applsci 15 03442 g002
Figure 3. The cumulative number of records used in this study between 1976 and 2023.
Applsci 15 03442 g003
Figure 4. Histogram of the number of records used to develop GMPEs, categorized by fault types.
Applsci 15 03442 g004
Figure 5. Histogram of the number of records by distance (RJB) intervals.
Applsci 15 03442 g005
Figure 6. Magnitude (MW)–distance (RJB) distribution of observed records used to develop the GMPMs, categorized by focal mechanism (SS, NS, and RS are strike-slip, normal-slip, and reverse-slip events, respectively).
Applsci 15 03442 g006
Figure 7. Histogram of the number of records by site classes (following NEHRP-2009 and TBEC-2018).
Applsci 15 03442 g007
Figure 8. Ground-motion intensity measures plotted versus distance (RJB) and color-coded by magnitude ranges.
Applsci 15 03442 g008
Figure 9. Magnitude scaling of observed GMIMs (PGA, PGV, and PSA with T = 0.2 s and T = 3.0 s periods) for different distance group ranges.
Applsci 15 03442 g009
Figure 10. Residual distributions for between-event, single-site, and site-to-site variations in the developed model across three different periods. The error bars represent the mean and standard deviation of the binned residuals.
Applsci 15 03442 g010
Figure 11. Magnitude-dependent heteroscedasticity between events for (a) T = 0.2 s, (b) T = 1.0 s, (c) T = 0.5 s, and (d) T = 3.0 s.
Applsci 15 03442 g011
Figure 12. Comparisons of observations for PGA, PGV (top row), and PSA at T = 0.2 s and T = 1.0 s (bottom row) for MW 5.5 and 7.2 events from strike-slip faulting at rock sites (VS30 = 760 m/s), as estimated by the predictive models used in this study.
Applsci 15 03442 g012
Figure 13. Comparison of median 5%-damped response spectral acceleration (PSA) from the predictive model of this study with respect to some local and global GMPMs. The comparisons are made for a SS events and rock site (VS30 = 760 m/s) representing two different magnitude–distance scenarios: MW 6.0 and RJB 100 km (top), and MW 7.2 and RJB 15 km (bottom). Abbreviations: Abrahamson et al. [37], ASK14; Boore et al. [15], BSSA14; Campbell and Bozorgnia [38], CB14; Chiou and Youngs [16], CY14; Idriss [43]; I14; Akkar et al. [17]; ASB14; Bindi et al. [6]; Beal14; Kale et al. [7]; KAAH13; Lanzano et al. [8]; Leal19; Kotha et al. [18]; Keal20; Boore et al. [9]; B21; Içen and Sandıkkaya [19], IS23.
Applsci 15 03442 g013
Table 1. The statistics of the database according to ESM and SMD-TR.
Database SourceAbbr.Event RangeNumber of EventsNumber of RecordsMagnitude Range (MW)Distance Range (RJB) (km)SoF
Engineering Strong-Motion DatabaseESM1976–2016
(1976–2006)
(2006–2016)
5541736
(671)
(1065)
4.0–7.60–349SS: 938
NS: 664
RS: 134
Updated Strong Motions Database of TürkiyeSMD-TR2006–2023
(2006–2016)
(2016–2023)
114918,437
(3333)
(15,104)
4.0–7.80–350SS: 8472
NS: 9049
RS: 916
Table 2. Period-dependent regression coefficients of the GMPMs.
Period (s)c1c2c3c4c5c6c7c8d1d2d3
PGV7.4200−4.11591.0709−1.0385−1.13490.0108−0.01200.0200−0.81830.2000−0.0026
PGA2.4717−2.79270.7180−0.6765−0.96150.0163−0.01200.0200−1.01080.2000−0.0054
0.012.4722−2.76710.7171−0.6708−0.94630.0163−0.01200.0200−1.01380.2000−0.0054
0.032.5008−2.69160.6982−0.6520−0.88530.0161−0.01200.0200−1.03050.2000−0.0053
0.042.8840−2.77790.6495−0.6660−0.89360.0163−0.01200.0200−1.09800.2000−0.0051
0.053.2209−2.85970.6079−0.6822−0.92340.0163−0.01200.0200−1.14880.2000−0.0051
0.073.5751−2.87160.5338−0.6851−0.93050.0167−0.01200.0200−1.19310.2000−0.0057
0.103.3146−2.36860.5264−0.5778−0.72520.0184−0.01200.0200−1.16050.2000−0.0067
0.152.5614−1.76740.6121−0.4494−0.55010.0189−0.01200.0200−1.01560.2000−0.0077
0.202.0036−1.52340.7226−0.3983−0.50400.0193−0.01200.0200−0.90220.2000−0.0080
0.251.5687−1.35440.8164−0.3640−0.44650.01820.00000.0200−0.82330.2000−0.0078
0.301.6805−1.89300.8951−0.4798−0.72520.01700.00000.0200−0.77640.2000−0.0074
0.351.6229−2.13420.9499−0.5340−0.84410.01670.00000.0200−0.73920.2000−0.0070
0.401.6496−2.51151.0038−0.6139−0.99760.01590.00000.0170−0.71060.2000−0.0066
0.451.6080−2.69321.0443−0.6569−1.07000.01500.00000.0130−0.68600.2000−0.0063
0.501.6051−2.94061.0893−0.7118−1.18610.01430.00000.0100−0.66480.2000−0.0060
0.601.7622−3.48351.1674−0.8365−1.45120.01330.00000.0000−0.64240.2000−0.0054
0.701.7293−3.79621.2278−0.9071−1.54720.01160.00000.0000−0.62020.2000−0.0049
0.751.7602−3.89861.2494−0.9373−1.62840.01020.00000.0000−0.61490.2000−0.0047
0.801.7332−3.90581.2728−0.9485−1.67210.00950.00000.0000−0.60680.2000−0.0045
0.901.9534−4.53221.3179−1.0848−1.94090.00890.00000.0000−0.59500.2000−0.0042
1.002.1180−4.98211.3566−1.1867−2.13770.00900.00000.0000−0.58670.2000−0.0039
1.202.1639−5.29641.4327−1.2667−2.27650.00800.00000.0000−0.58620.2000−0.0032
1.402.1964−5.56811.4907−1.3350−2.37540.00790.00000.0000−0.58810.2000−0.0027
1.602.0974−5.62271.5441−1.3566−2.36450.00740.00000.0000−0.58640.2000−0.0024
1.802.2356−6.04181.5792−1.4514−2.55010.00670.00000.0000−0.59310.2000−0.0019
2.002.0771−5.91851.6095−1.4335−2.45130.00610.00000.0000−0.60260.2000−0.0016
2.502.1419−6.33431.6567−1.5360−2.50180.00470.00000.0000−0.62340.2000−0.0012
3.002.1283−6.60051.7053−1.6062−2.52940.00330.00000.0000−0.62660.2000−0.0008
3.501.9908−6.59811.7334−1.6241−2.48240.00260.00000.0000−0.62030.2000−0.0005
4.002.0597−6.88991.7536−1.7011−2.60620.00110.00000.0000−0.61430.20000.0000
5.002.0970−7.05471.7703−1.7478−2.67820.00170.00000.0000−0.62040.20000.0000
6.001.9158−6.87831.7855−1.7233−2.53270.00060.00000.0000−0.62560.20000.0000
7.001.8140−6.95701.8022−1.7555−2.45940.00020.00000.0000−0.64430.20000.0000
8.001.5010−6.66091.8011−1.7085−2.2424−0.00080.00000.0000−0.66030.20000.0000
9.001.2469−6.46061.7966−1.6775−2.1087−0.00050.00000.0000−0.67680.20000.0000
10.000.9173−6.18401.7716−1.6269−1.94170.00000.00000.0000−0.69380.20000.0000
Units of estimated PGV is (cm/s), PGA and PSA (t) are estimated in (g).
Table 3. Model coefficients for VS30 based site response and aleatory variability.
Period (s)s1s2s3s4VCτ1τ2Φs2sΦssτσ
PGV−0.6153−0.0660−0.00905.000014180.42300.23480.47060.46800.35530.7528
PGA−0.5400−0.1780−0.00800.146014180.45460.28420.49300.51070.41080.8201
0.01−0.5379−0.1780−0.00800.146014180.44830.28390.49300.51140.41130.8208
0.03−0.5234−0.1910−0.00800.171014070.44780.28410.49090.52050.41080.8250
0.04−0.4952−0.2190−0.00800.181013950.45180.28270.49230.53350.42310.8403
0.05−0.4799−0.2560−0.00700.192013880.45800.28550.49860.54290.44370.8604
0.07−0.4672−0.2967−0.00700.228013730.47030.30010.51260.54280.48310.8892
0.10−0.4664−0.3210−0.00700.271013520.48640.32560.52680.53610.48930.8969
0.15−0.4970−0.3097−0.00700.308713180.48550.34970.53430.53490.48270.8970
0.20−0.5556−0.2900−0.00700.290012560.48110.35430.52850.53160.46880.8841
0.25−0.6022−0.2700−0.00800.250012000.46500.35280.51770.53320.45390.8708
0.30−0.6487−0.2460−0.00800.215011380.46140.34320.51420.53400.44110.8627
0.35−0.6774−0.2255−0.00800.189010850.45410.32950.50640.53120.43520.8533
0.40−0.7142−0.2050−0.00800.163010470.45090.31920.50660.52770.43170.8494
0.45−0.7327−0.1845−0.00850.152010160.44820.30810.50600.52260.43410.8471
0.50−0.7634−0.1640−0.00900.14109890.44740.29540.50710.51860.43410.8453
0.60−0.7854−0.1373−0.00900.12509450.44550.29880.51070.51080.43870.8451
0.70−0.8053−0.1137−0.00900.11109120.45250.28590.51940.50130.43900.8449
0.75−0.8140−0.1033−0.00900.10508990.45720.28170.52430.49450.44500.8471
0.80−0.8171−0.0930−0.00900.09908880.46070.27740.52910.48730.45130.8492
0.90−0.8363−0.0795−0.00900.09008720.46520.26990.54110.48150.46560.8610
1.00−0.8393−0.0660−0.00900.08108620.46940.25980.54960.47600.47740.8698
1.20−0.8342−0.0513−0.00830.06638550.47550.28090.57150.46610.49980.8909
1.40−0.8266−0.0393−0.00770.05278500.48830.26440.59340.45510.51180.9062
1.60−0.8023−0.0300−0.00700.04008450.49500.25550.60210.44950.51690.9120
1.80−0.7865−0.0250−0.00550.03358400.50070.26770.60750.44460.52090.9154
2.00−0.7652−0.0200−0.00400.02708350.50690.27080.61670.43890.52370.9205
2.50−0.7115−0.0130−0.00300.01908300.51660.27760.63800.42960.51170.9238
3.00−0.6757−0.0080−0.00200.01508100.52570.28250.65290.42660.48830.9202
3.50−0.6478−0.0040−0.00200.01158000.53800.28500.66420.42510.47420.9202
4.00−0.62530.0000−0.00200.00807800.54670.30260.67240.42420.45910.9181
5.00−0.60080.0000−0.00100.00707600.55010.32710.67420.42380.44540.9125
6.00−0.58260.00000.00000.00637600.54990.34910.67090.42700.43010.9041
7.00−0.55100.00000.00000.00577600.54160.41300.65690.43690.40000.8845
8.00−0.52420.00000.00000.00507600.53100.42930.64430.44590.37750.8697
9.00−0.50940.00000.00000.00457600.52150.42160.63240.45650.36380.8606
10.00−0.50160.00000.00000.00407600.51260.42000.62340.46300.35250.8528
Disclaimer/Publisher’s Note: The statements, opinions and data contained in all publications are solely those of the individual author(s) and contributor(s) and not of MDPI and/or the editor(s). MDPI and/or the editor(s) disclaim responsibility for any injury to people or property resulting from any ideas, methods, instructions or products referred to in the content.

