Article

Shaping and Characterization of Additively Manufactured Geopolymer Materials for Underwater Applications

by
Anton Frederik Becher
1,
Henning Zeidler
1,
Szymon Gądek
2 and
Kinga Korniejenko
2,*
1
Institut für Maschinenkunde und Fertigungstechnik, Technische Universität Bergakademie Freiberg, Gustav-Zeuner-Straße 7, 09599 Freiberg, Germany
2
Faculty of Materials Engineering and Physics, Cracow University of Technology, 37 Jana Pawła II Street, 31864 Cracow, Poland
*
Author to whom correspondence should be addressed.
Appl. Sci. 2025, 15(7), 3449; https://doi.org/10.3390/app15073449
Submission received: 13 February 2025 / Revised: 18 March 2025 / Accepted: 20 March 2025 / Published: 21 March 2025

Abstract

:

Featured Application

Underwater 3D printing infrastructure.

Abstract

Additive manufacturing brings many benefits to the building industry, one of them being automatization and the possibility to work in harsh environments, including underwater applications. In addition, this technology enables faster infrastructure repairs and adjustments to the scope of work to specific damage caused by, for example, biocorrosion processes. The main aim of this article is to investigate the development of geopolymers as a printable material for civil engineering, including underwater applications. For that purpose, the process of the material extrusion will be modified, and material properties will be improved. In the first step, the raw materials were investigated (SEM, EDS, XRF, particle size analysis) and the proper additives were selected based on literature analysis. Next, geopolymer paste was synthesized and fresh paste properties were investigated, including time for curing samples and workflow. The mixture composition was modified to obtain the required printable parameters through the application of different additives and the modification of the proportion of components, especially alkali solution. Finally, small-scale additive manufacturing trials were conducted in the air and with submerged containers. Additionally, samples were prepared using the casting method to compare the mechanical properties and microstructure. The obtained results show that additives such as xanthan gum and superplasticizer improve the rheological properties of the paste efficiently. With the help of additive manufacturing, geopolymer samples with compressive strengths of up to 7.5 MPa and flexural strengths of up to 4.15 MPa after 28 respectively were achieved. Compared to the average of the cast samples, the compressive strength of the printed samples was at least 5% lower, while the flexural strength was at least 38% lower for printed samples. The 3D-printed samples showed strong anisotropy between the tested orientations of the flexural strength samples.

1. Introduction

Efforts in recent years to use materials more sparingly and achieve more sophisticated geometries, especially in the construction sector, have required state-of-the-art production techniques. For geopolymers to establish themselves as a modern material, their processability using additive manufacturing is of great use [1]. As with concrete, additive manufacturing of geopolymers ultimately promises the same improvements compared to conventional manufacturing methods [2,3]. Additive manufacturing brings many benefits to building industries, including lowering the cost of investment in the building industry and lowering the environmental burden for construction [2,4]. Additive manufacturing reduces the amount of used materials in comparison to traditional casting technology [2]. Moreover, it does not need a framework for construction, which additionally reduces the amount of materials. Another benefit is connected with automation and the possibility to work in harsh environments, including in space or underwater [5,6]. However, this technology is relatively new and, in addition to its benefits, also brings challenges. The additive manufacturing of a pasty material differs in many respects from working with conventional methods such as molding [2,7]. The properties of the paste must support uniform extrusion, good bonding to existing layers, minimal deformation after deposition, rapid curing, and other parameters [1,8]. The process and material behavior are also completely different than traditional 3D printing for polymers [9,10,11,12,13].
With additive methods, geopolymers are mainly processed using extrusion-based techniques and less with the aid of binder jetting [14]. However, binder jetting gives more aesthetic products and better accuracy on a small scale [15,16]. The extrusion technologies are more widely applied on a large scale and for prototype constructions, such as houses or bridges [1,2]. Extrusion-based AM methods require the presence of geopolymer in a mixed, paste-like form and convey it through a nozzle using force. A continuous material flow at the nozzle can be achieved by either using a pump, a driven piston, or an extruder screw. The use of pumps or piston units for material feed is particularly suitable for larger printer systems. On the largest scale, the nozzle is guided by a structural framework (gantry) or a robotic arm [2,17]. The gantry enables the construction of large cross-sections in a cartesian coordinate system, whereas the robotic arm operates on a polar coordinate system and is mostly used for slightly smaller prints [18]. In both cases, the geopolymer mix is pumped through a hose before reaching the nozzle. In contrast, systems are also used where the material supply is positioned just above the nozzle and a feed is achieved using extruder screws instead of direct force input. This principle is mainly used to develop and manufacture smaller components and has become established due to its ease of handling [1,16].
The flow behavior of materials can be summarized under the term rheology. By testing the material with a rheometer, it can be divided into different fluid registers, each of which has different properties [19,20]. Especially for systems in which the material is pumped, it is important that the paste behaves like an easily pumpable liquid under pressure while increasing its viscosity as stress decreases. This behavior can be described as shear-thinning. When viscosity decreases not only under shear strain but also as time progresses, about the material exhibits thixotropy [20]. The activator solution plays a vital role in determining the viscosity of geopolymer mixes. Sodium-based activators lead to higher viscosities and their molarity is an important regulator for flowability [21].
Another necessary property for clean processing is the good extrudability of the paste. A low plastic viscosity and optimal yield stress help to convey a material string that neither tears off nor leads to lumping. Zhang et al. [22] investigated the effect of Si/Na ratio of the activator on the extrudability of geopolymer and found that decreasing this ratio leads to better results in terms of paste structure [22]. The workability of a material is characterized by how little resistance it offers to processing by conventional methods. This property is greatly influenced by the particle size and shape of the raw materials. Particle size reduction, for example with fly ash, generally improves the workability of the mixture and the even particle shape also enhances machinability compared to slag-based geopolymer [8,23]. The irregular particle shape and compact structure of slag-based geopolymers lower their workability. It can be improved by replacing ground granulated blast furnace slag (GGBFS) with metakaolin to prevent early polymerization and by adding additives such as superplasticizer to the mix [24,25].
The open time of the material, i.e., how long it remains workable, is closely related to buildability. Because fresh properties can change over time, it is important to know the time window during which the paste has optimal characteristics for extrusion. For geopolymers, this typically ranges up to 30 or 60 min [21,26]. However, variations in precursors, temperature, and additives have retarding or accelerating effects on the material [21,27,28].
Several studies have been conducted to test the effects of different additives on paste rheology, which is extremely important to ensure good flowability through the printer and the other factors mentioned above. Table 1 provides an overview of the most common ones and their function regarding the paste.
The level of knowledge and experience in the field of additive manufacturing with geopolymers is still limited due to the short history of the topic. However, there has been a strong increase in interest in this area in recent years [36], largely due to a shift in thinking in the construction industry. It is important to point out that geopolymer materials are not yet economically competitive. In most cases, they are still more expensive than the ordinary cement option, mainly because the activators are produced with a high degree of purity, which is not completely necessary for their use in geopolymers [37]. While extrusion-based additive manufacturing with concrete is increasingly being used to produce houses and public buildings [38], long approval procedures are delaying the use of new materials. The material in combination with the manufacturing method has not yet been established for any official application, and most of the results available on additive manufacturing of geopolymers come from research studies.
There is still limited knowledge about the ideal composition of a printable geopolymer paste and how the use of additives influence its properties. An ideal dosage for a printable geopolymer varies depending on many factors, such as the precursors used, so a standard dosage for all geopolymers is not feasible. Additionally, the type of equipment used has a great influence. The role of printer characteristics parameters in component generation by material extrusion is also important for enabling quick adjustments and scability in the future. This work addresses this gap. The main aim of this research is to focus on these problems and provide insights into possible additives, printer properties, and the structure of additively manufactured geopolymer bodies. This aim is addressed by using an experimental approach. Currently, in the literature, there is a lack of articles on 3D printing of geopolymers in underwater conditions, which is a main novelty aspect of this article.

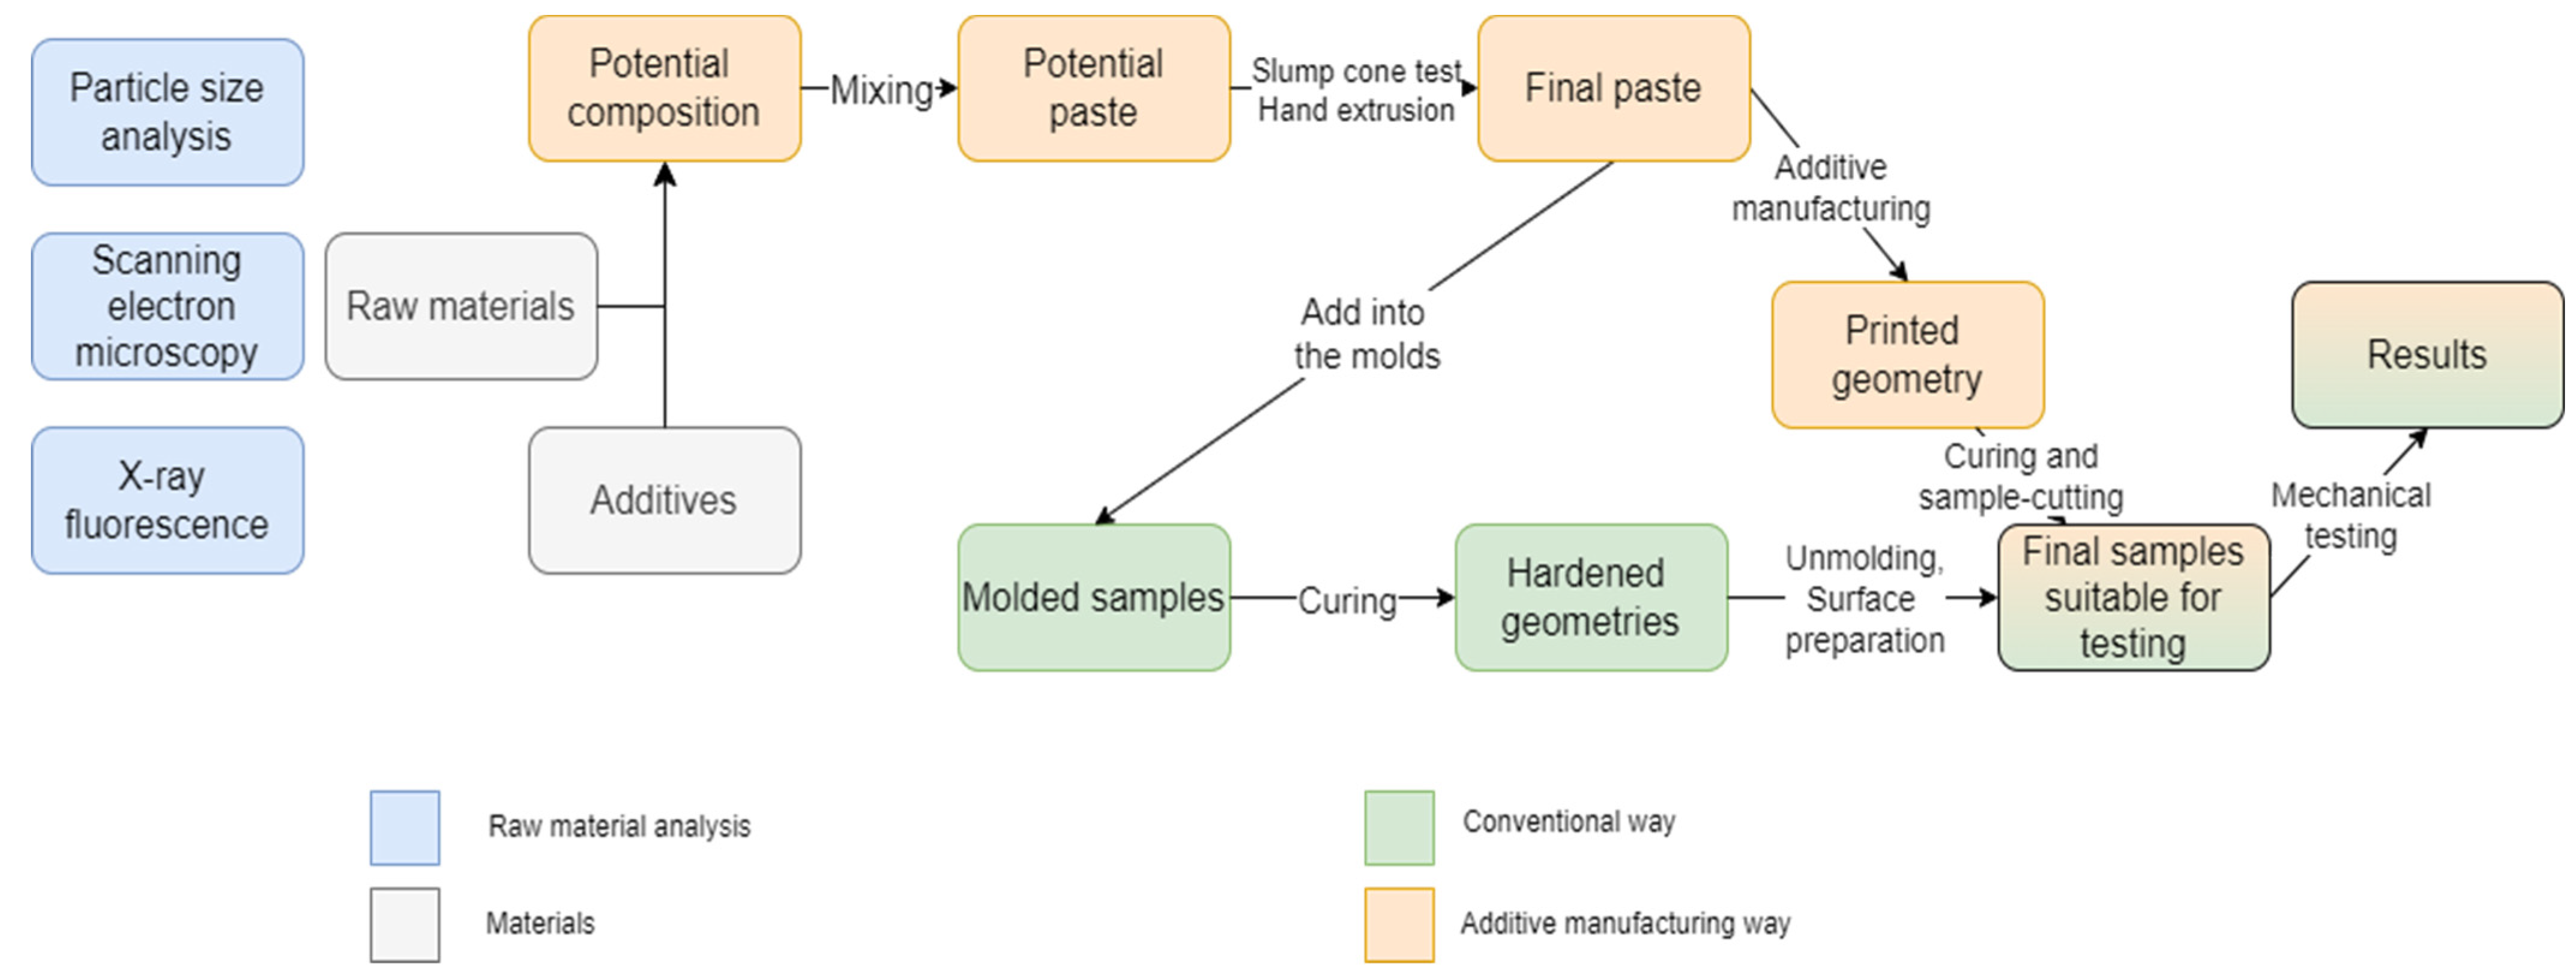
2. Materials and Methods

2.1. Materials

For the experiments, fly ash from a coal-fired power plant (Skawina, Poland) was used as a supplier of aluminosilicate precursors. Fly ash particles are driven out of the boiler with flue gases and extracted via electrostatic precipitators or other ways of filtering [39]. The composition of fly ash varies strongly depending on the type of coal that is being burned, as well as its elemental and oxide composition and physical properties [40]. Because of this, the raw material was analyzed as the first step. The results are presented in Section 3.1. The loss on irrigation of the fly ash is 2.44%.
River sand (IVERSO, Iwiny, Poland) is used as aggregate in the geopolymer mix. Due to the mechanical requirements of the print head, it had to be ensured by sieving that the grain size of the sand was not larger than 2 mm. River sand is often used in geopolymers context as a fine aggregate for enhancement of mechanical properties [41].
To achieve properties such as rapid curing, low flow of the paste after extrusion, and the desired rheology, several additives are investigated (Table 2). Attempts were made to isolate their effects individually or in combination.

2.2. Sample Preparation

The solution is a mixture of 10 M of sodium hydroxide (NaOH), water, and water glass (a compound containing sodium oxide, Na2O, and silicon dioxide, SiO2). The proportions are presented in Table 3. The proportions of the individual components of the alkaline activator are predetermined and are not changed.
The activator solution is a mixture of 10 M sodium hydroxide (NaOH), tap water, and water glass. After the sodium hydroxide is weighed out in a container, tap water gets poured in and the dissolution process is accelerated by stirring. After complete dissolution, the water glass solution is added and stirred again. As the reaction is highly exothermic, the solution can only be used after cooling to room temperature to rule out possible thermal influences.
All pastes were mixed according to the same procedure. The exact compositions investigated can be found in Table 4.
First, the solid ingredients were weighed and placed in a bucket, where the mixture was homogenized using a stick blender at low speed. Then, the liquid additives, such as the waterproofer, and finally the solution were added. First, 3/4 of the solution was added and mixed with the solids at medium speed for 3 min so that uniform coating occurred. The last quarter of the solution was then added, and the paste was mixed at high speed for another 5 min. Eventually, the mixture was used for 3D printing or casting technology.

2.3. Experimental Program

The main task was to find a printable paste composition and to use it to produce test specimens, which are compared with conventionally molded specimens. Furthermore, the suitability of the paste for setting and printing underwater was tested. As the printing process results in directional dependence of properties (anisotropy), the test specimens were tested in different orientations, Figure 1.
To obtain this overall aim, several steps were needed. To modify the properties of the geopolymer paste so that it c be processed by additive manufacturing, the effects of various additives were investigated. By specifically isolating the effects of the individual materials and additives, positive influences were iteratively retained, and negative influences were eliminated. The results of these iteration steps are recorded in the form of mixing ratios in Table 4.
Next, pastes were tested for suitability using the slump cone test and hand extrusion with a cartridge press. The workflow is described in Figure 2.
The pastes, which had achieved promising results in the preliminary tests, were mixed on a larger scale and used in the 3D printer. The prints were evaluated according to the following criteria.
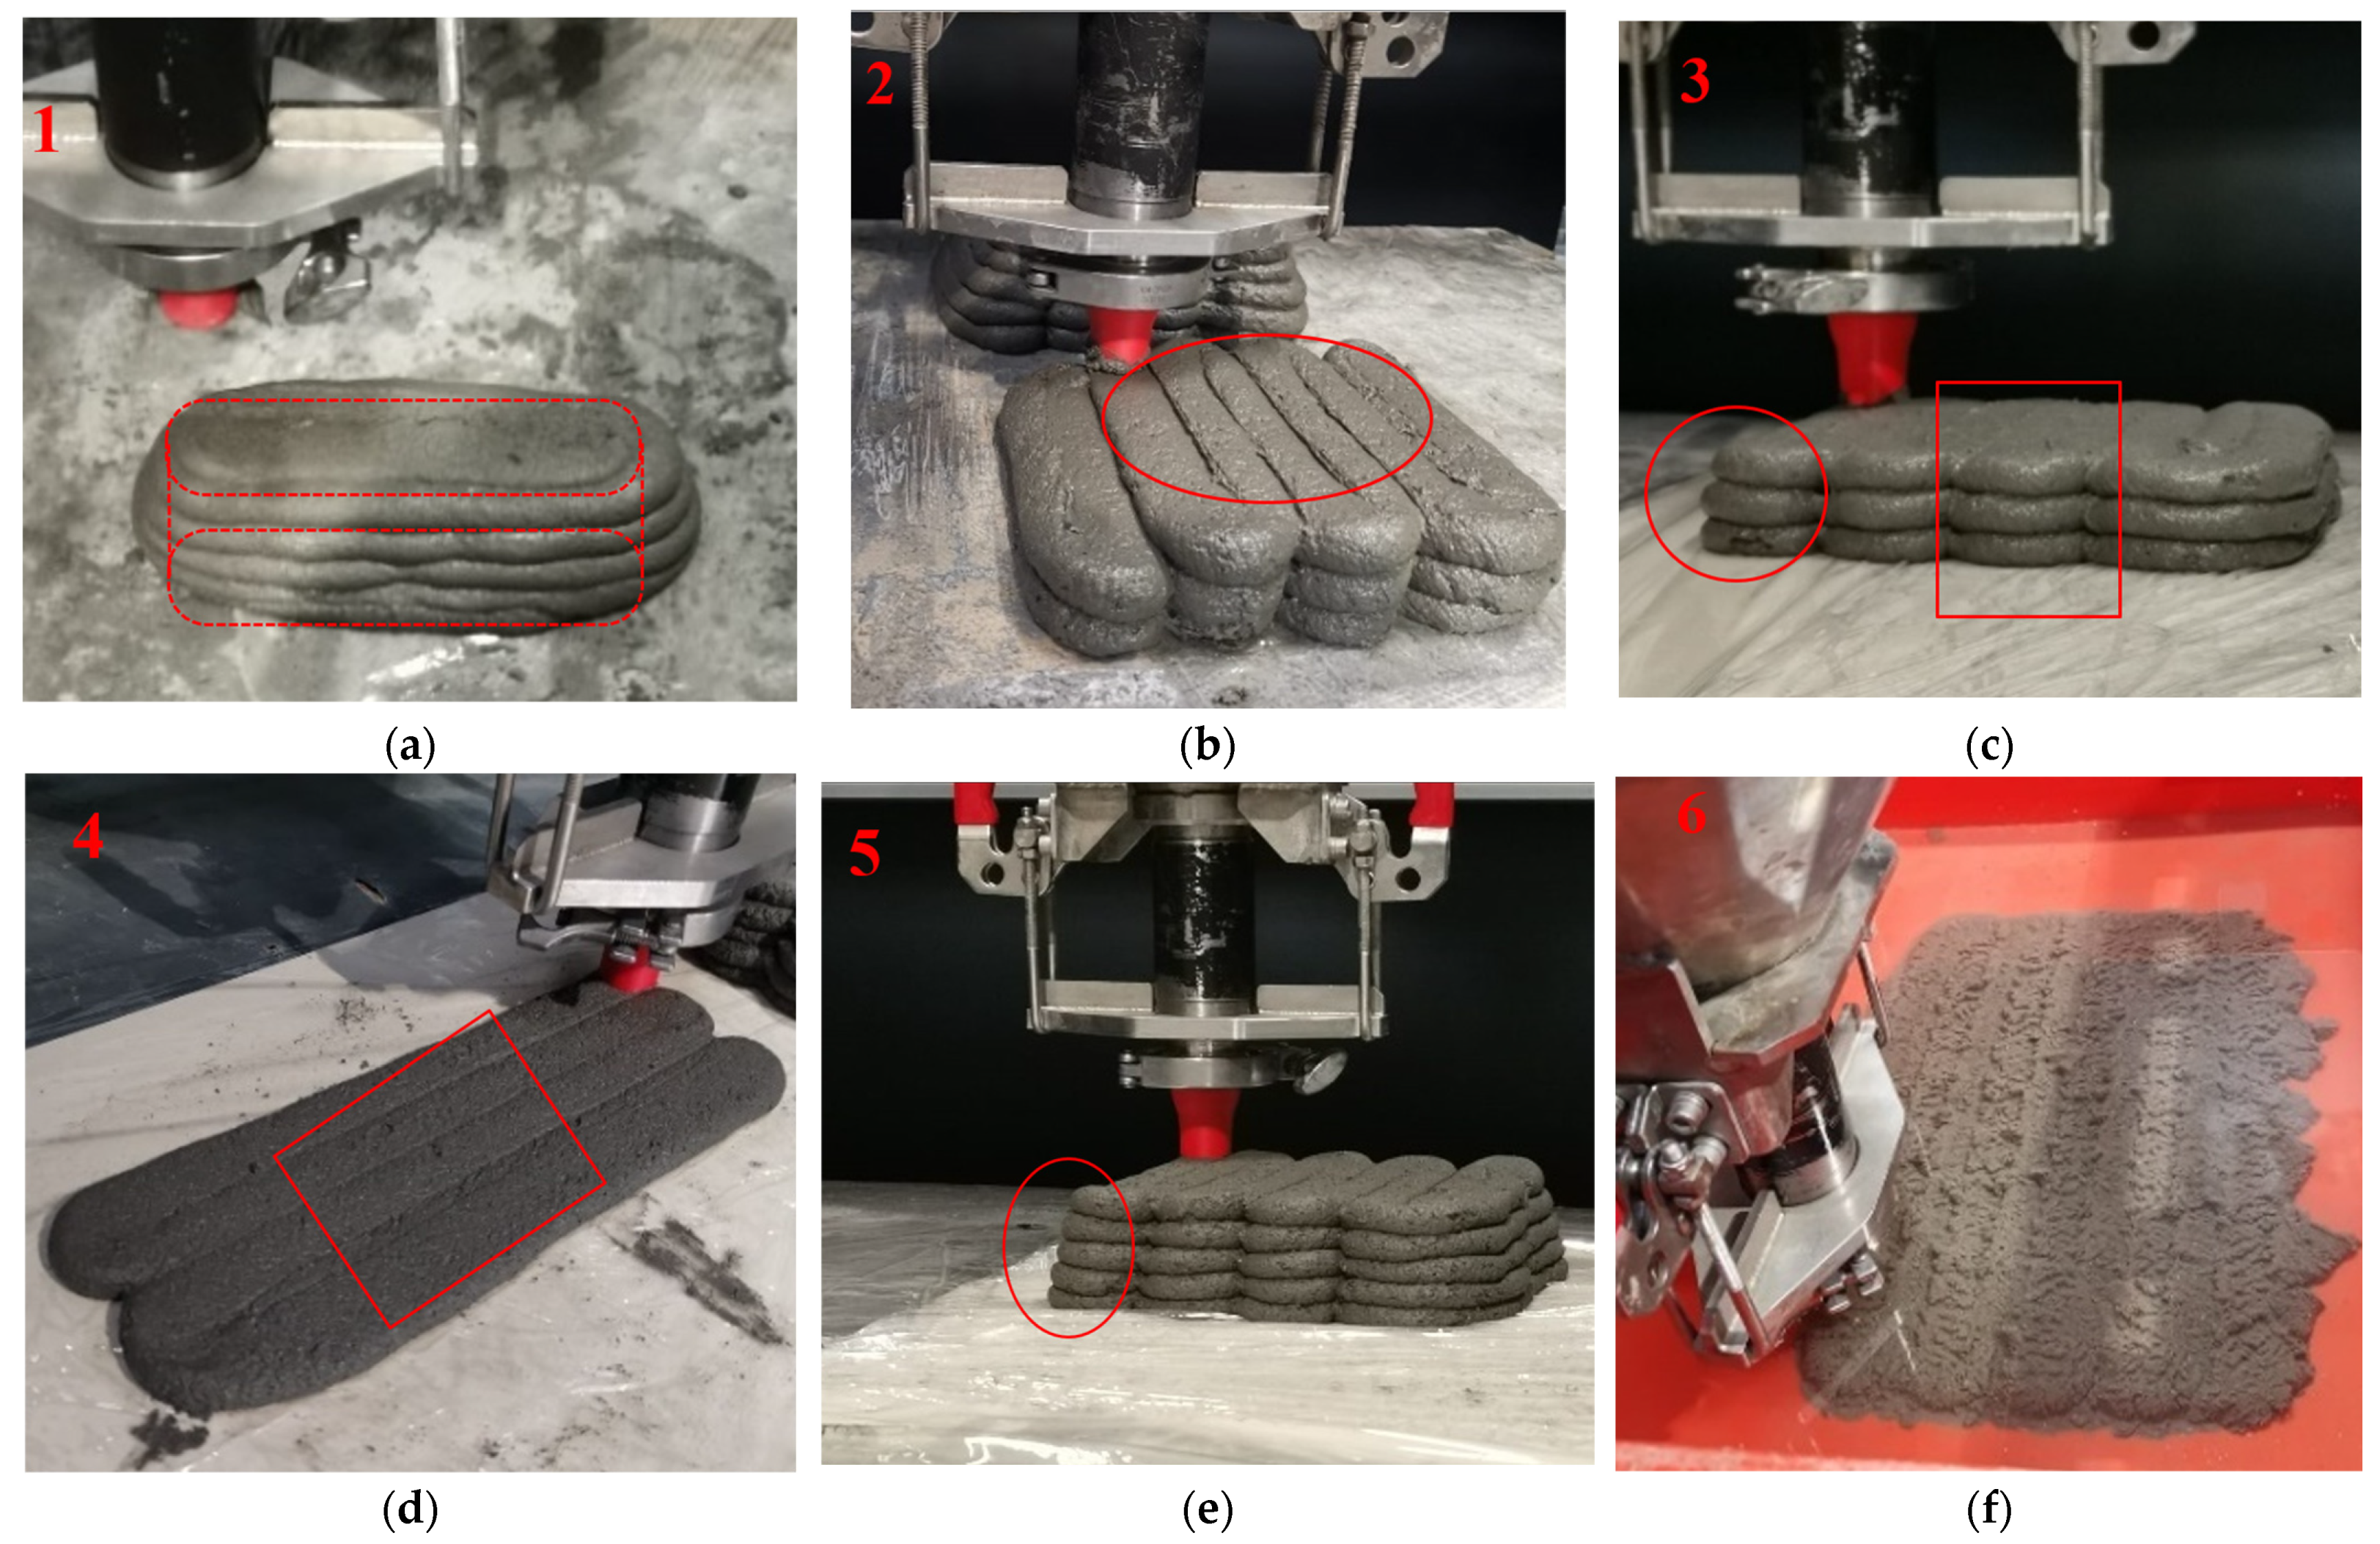
  • Extrusion behavior—Extrusion should be as homogeneous as possible, without over- or under-extrusion and material loss.
  • Material positioning—The material string should be deposited cleanly in conjunction with the printing speed and, if possible, should not create any voids in the component.
  • Geometric accuracy—One layer should correspond to the cross-section created in the slicer. After all layers are applied, the component must not change its geometry significantly (no sagging) and should not deviate significantly from the target geometry.
Finally, with the help of molds, comparative samples were produced and left to harden at ambient (ca. 20 °C) or elevated temperatures (75 °C). The printed bodies were cut into the shape of the test geometries after 14 days using a circular saw. After the samples were analyzed for compressive and flexural strength, the macro- and microstructure were examined.

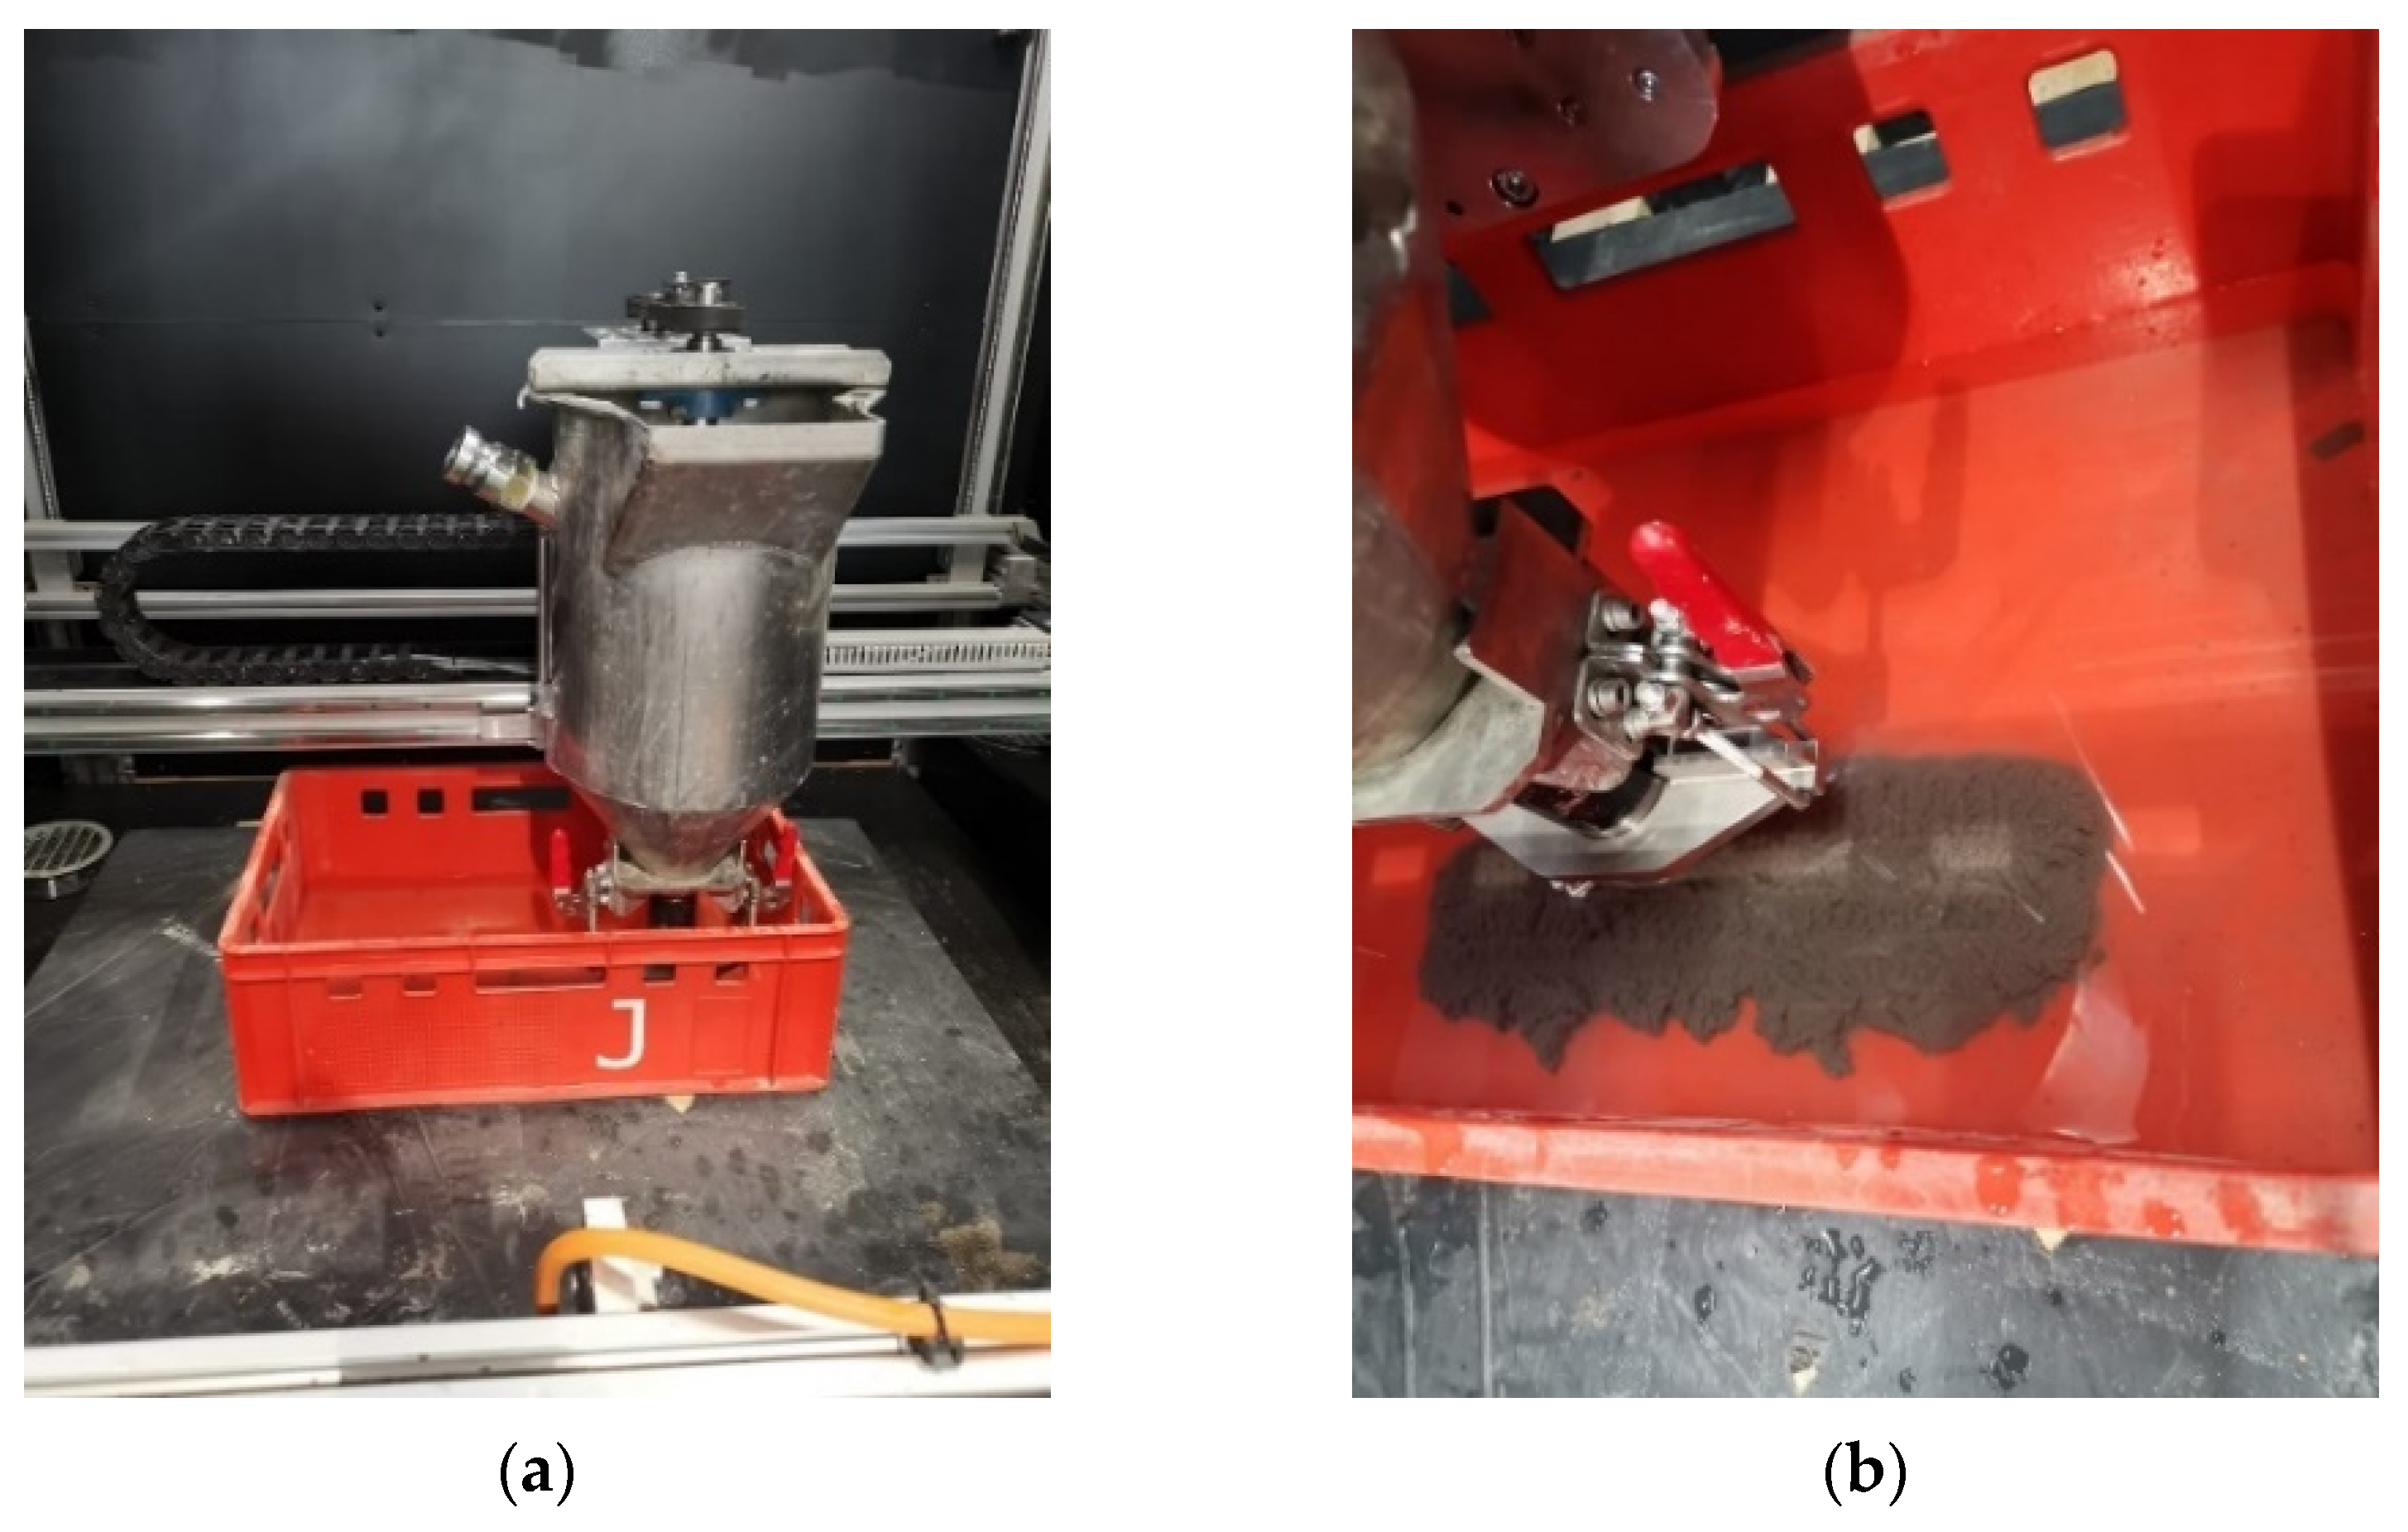
2.4. Additive Manufacturing

Printing was performed using an Atmat Saturn printer (Atmant Sp. z o.o., Cracow, Poland), modified for the extrusion of paste materials. The printer has a build volume of 1100 mm in width and 1000 mm in depth, and it can print objects that are up to 750 mm high. Instead of the nozzle used for filament extrusion, a print head was installed, consisting of a material container, a belt-driven mixer, and an extrusion screw powered in the same way (Figure 3a).
The print head can be filled with up to 15 kg of material or, alternatively, fed via a hose (Figure 3b). A belt is used to drive an axle, which is responsible for mixing the material in the container and drives the extrusion screw in the lower section. The mixing of the material is therefore always linked to extrusion and vice versa. To guarantee precise positioning of the material, a 3D-printed nozzle was attached after the extruder screw using a clamp.
The printer can be controlled via a display, and printing parameters can be adjusted in addition to manual control of coordinates and calibrations. For example, the material flow, printing speed, and temperature can be modified during printing, and the build chamber can heat up to 60 °C if required.
The print head was attached to the holder, as shown in Figure 3a. A detailed image of the individual parts of the print head, including the nozzle, can be found in Appendix AFigure A1.
The main task was the extrusion of blocks, from which the test specimens were cut out. These blocks were designed with a slight oversize to compensate for any shrinkage or geometric deviations (Table 5 and Figure 4). The models were created with the software Fusion360 version 2.0.16009x86_64, and Cura version 5.5 was used to slice the STL data.
To test the specimens in the directions described in Figure 4, the printed geometries were cut into 9 cuboids and 9 cubes. Blocks A, C, and D each consisted of 5 layers of 10 mm and were intended to produce the cuboids (oversize of 10 mm instead of the actual height of 40 mm). The cubes were cut out of block B after it had hardened. It consisted of 6 layers of 10 mm each so that the 50 mm high cubes could be safely produced. To optimize printing, the settings in the slicer were adjusted, so that the print head followed a continuous path during generation. Table 6 shows an overview of the most important process parameters.
The layer height is the amount by which the print head rises in the z-direction after each layer has been applied. It was set to 10 mm. As the nozzle had a diameter of 20 mm, the Line Width was also 20 mm. To achieve as few extrusion interruptions as possible, the entire body was printed as infill. This meant that breaks between the wall and infill could be avoided, and the machine path simplified by the zig-zag pattern.
Since the main purpose of the underwater extrusion experiment was to collect observations on behavior, the same slicer settings and paste composition were used. In a standard stacking box measuring 600 × 400 × 200 mm, 10 L of tap water at ambient temperature was added. As the print head had to be moved into the box from above, it was positioned in the installation space in such a way that its walls did not touch the print head at any time (Figure 5).
The prints (apart from the UW3DP) were generated on 10 mm high tiles, which could easily be removed from the build chamber. During printing, the “Flow” and “Print Speed” parameters were modified on the machine. While the “Print Speed” was set from 20 to 30% of the value specified in the slicer, the “Flow” varied between 300 and 500%. This allowed the extrusion behavior to be kept constant regardless of external influences.

2.5. Casting

To classify and compare the mechanical properties of the additively manufactured test specimens, blocks were molded using conventional methods. The dimensions of these molds determined the dimensions for the cut-outs of the additively manufactured volumes. The cube dimensions were 50 mm on each side, with the cuboids measuring 40 × 40 × 160 mm. After the material were mixed, the side walls of the molds were coated with mineral oil to make it easier to unmold the later hardened test body. This was particularly important for the cuboid molds, as they cannot be dismantled like the cube molds. The paste was then added while trying to avoid trapped air, ensuring tight filling, especially in the corners. After leveling, the molds were placed on a vibrating plate for a minute to drive out the remaining bubbles. They were then wrapped in plastic film, which was removed after two days. Half of the samples were stored in a drying cabinet at an elevated temperature (75 °C) for the first 24 h after production. After 14 days, the test specimens were removed from their molds and stored for a further 2 weeks.

2.6. Methods

Particle size analysis was conducted using an Anton Paar PSA 1190 LD (Anton Paar GmbH, Graz, Austria). The dry method was used to analyze the sand and the more precise wet method was used for the significantly smaller fly ash particles. After carrying out three measurements to increase accuracy, the results were obtained.
Samples were analyzed using scanning electron microscopy (SEM) to determine the structure and shape of both the sand and the fly ash, as well as the xanthan gum particles. The device used was the JSM-IT200 InTouchScope™ (JEOL, Tokyo, Japan). The samples were prepared by placing on a carbon pot and coating the surface with a thin layer of gold in the JEOL Smart Coater (JEOL, Tokyo, Japan).
The elemental and oxide analyses were carried out using an EDX-7200 from SHIMADZU (SHIMADZU EUROPA GmbH, Duisburg, Germany). Fly ash and sand were both investigated regarding their elemental and oxide composition. The analyses were conducted on powdered samples using polypropylene foil for covering. The analysis was made in air using the software PCEDX Navi (Version: EDX-7000P).
A slump cone test, defined by the EN 12350-5 [42] standard, was performed to ensure the dimensional stability of the printed bodies. To test the shape holding of a paste, it was filled into an oiled truncated cone. After compacting and leveling the surface, the weight was removed, and the metal mold was pulled away upwards. The free-standing paste was then subjected to impact with its platform by rotating a shaft on the underside of the apparatus. By rotating it 15 times within 15 s, the test body was subjected to several hard impacts, each of which caused deformation. At the end of the test, the new dimensions were measured, i.e., how the cone deformed/slumped.
The results of the initial shape retention tests were used to design pastes, which were then extruded by hand. Commercially available cartridge presses were filled with around 1000 g of paste, and by operating the gun as evenly as possible, layers could be deposited on top of each other, and the first extrusions were carried out.
To investigate and compare the mechanical properties of both printed and conventionally produced samples, the prepared cubes/cuboids were tested regarding compressive and flexural strength. To achieve more representative results, three samples of each configuration were tested. Compressive strength can be described as the maximum stress that can be endured by a material before failure occurs. The tests were carried out following the EN 12390-3 [43] standard. Flexural strength was measured on a beam or slab-shaped sample, which rested on supports and was centrally loaded by a single fin, following EN 12390-5 [44]. Calculations were performed according to Formula (1).
σ = 3   · F   · l 2   ·   d 1   ·   d 2 2
With:
σ —Flexural strength, MPa
F—Maximal load, N
l—Space between supporting points, mm (140 mm)
d1, d2—Sample dimensions, mm
The tests were carried out with a 3000 kN compression machine from Matest (Matest, Treviolo, Italy). To contribute to the accuracy of the results, the contact surfaces of the samples were made to be as smooth and parallel as possible. This was achieved by sanding before measurement. The dimensions of the bodies were used to calculate the final values, and also to determine the densities. The specimens were loaded with a continuous constant rate of 0.5 MPa/s, whereas for compressive strength, the starting force was 0.500 kN, and for flexural strength, it was 0.001 kN. The machine stops automatically when the maximum force applied to a sample drops by a certain percentage. This value was set at 30% for the compressive strength test and 10% for the flexural strength test. The test was considered successful if the sample failed according to a known pattern.

3. Results and Discussion

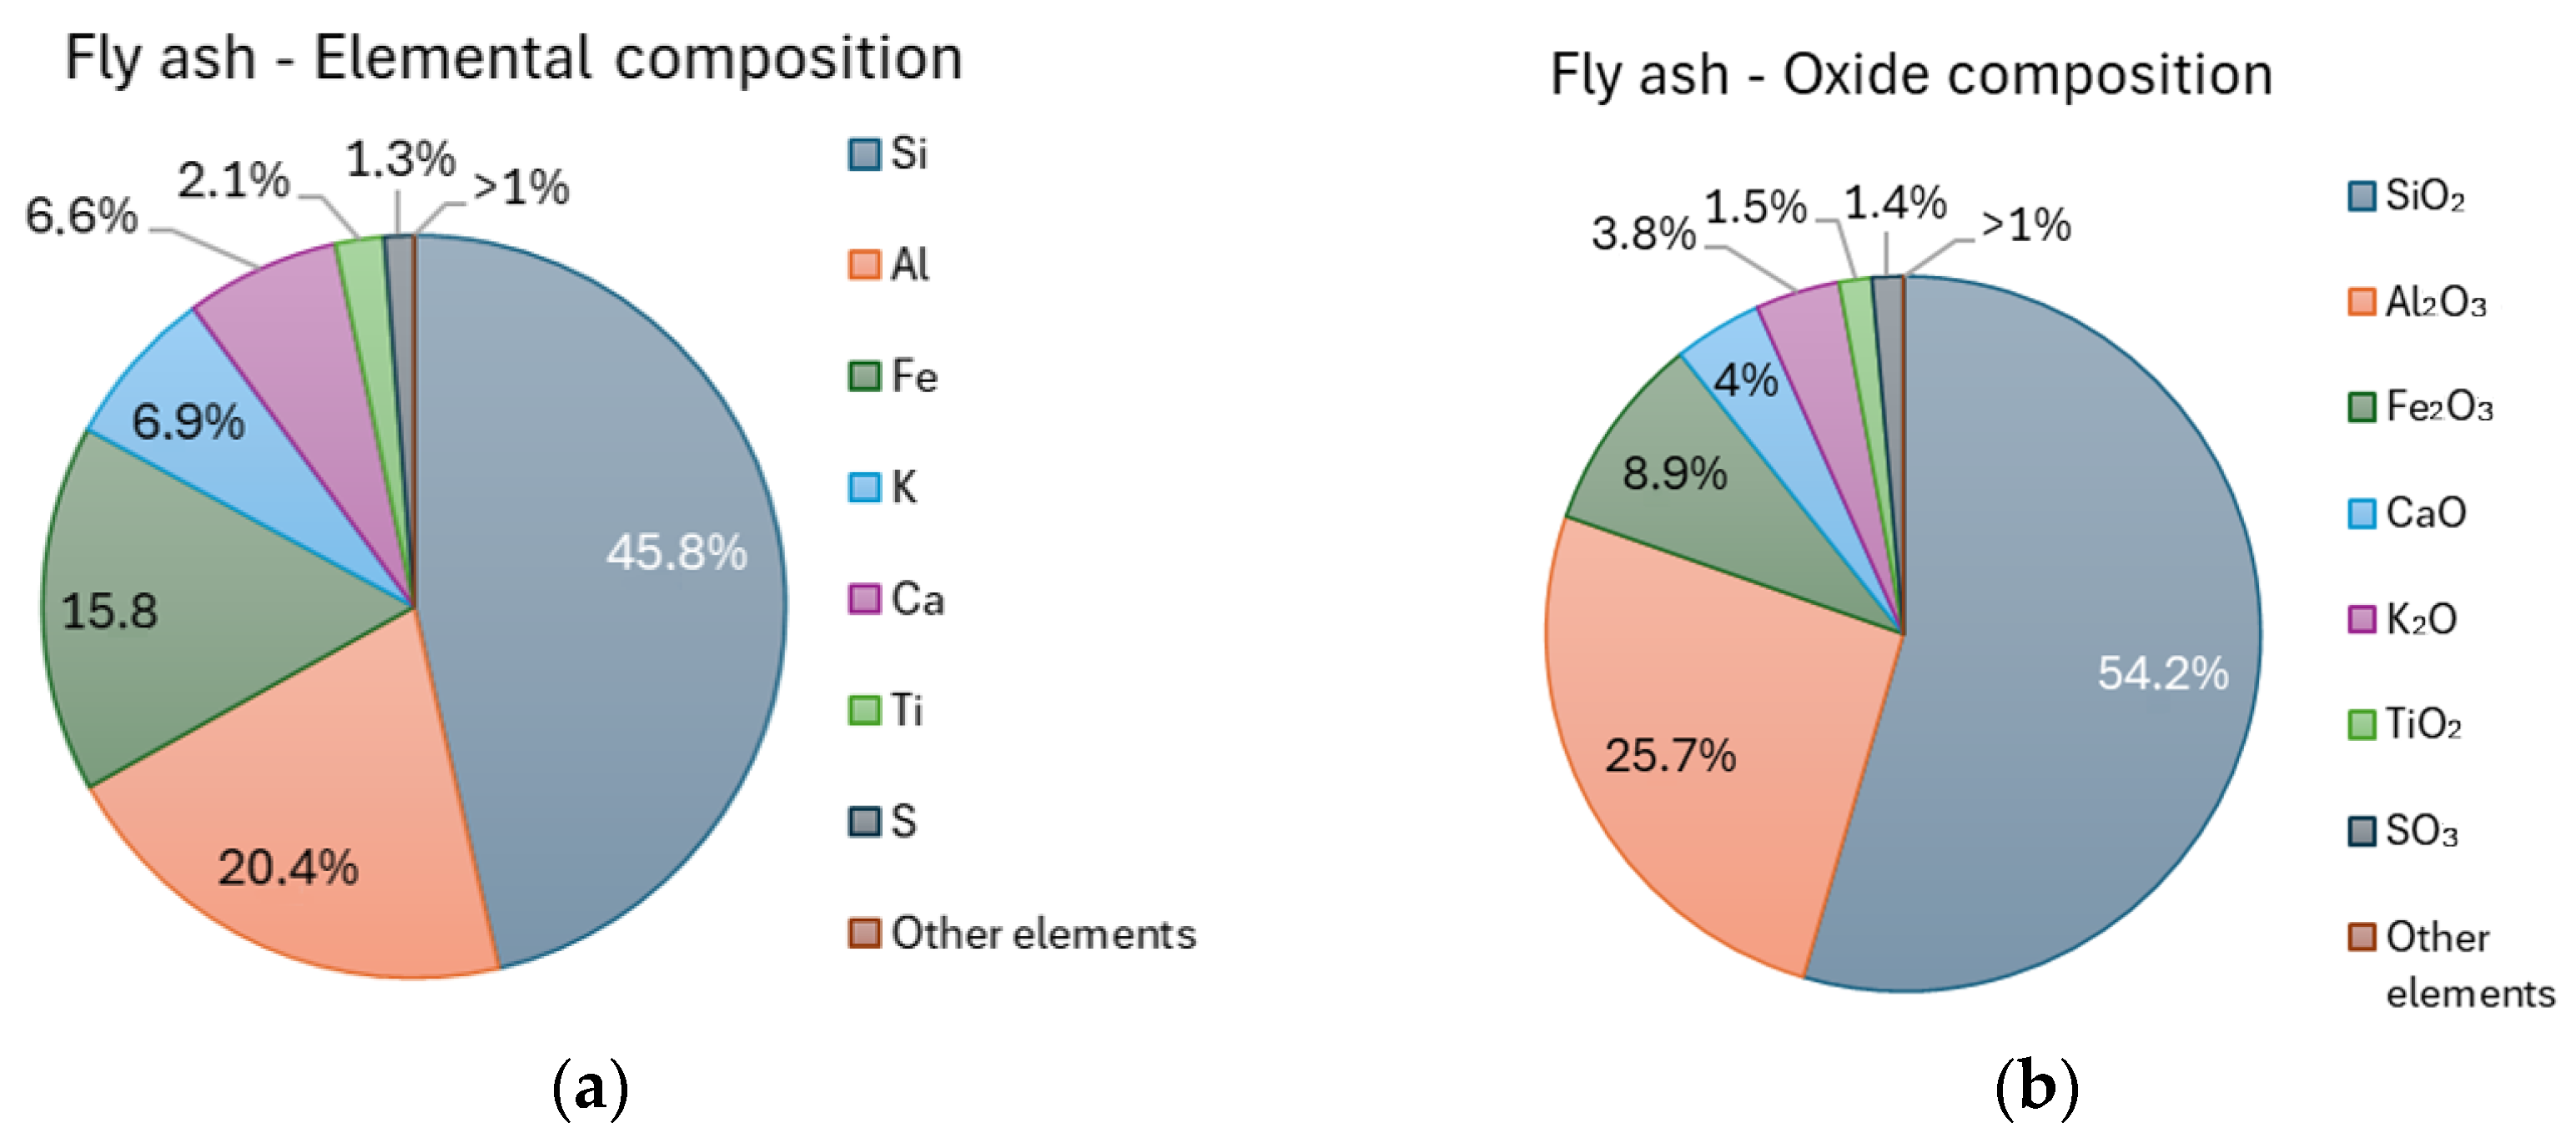
3.1. Raw Materials Investigation

The results of the particle size analysis are presented in Table 7 and Figure 6.
The results for sand show average particle sizes in the range of 420.626 µm to 423.788 µm. We can also see a slight bimodality based on the two peaks of the particle size distribution. Fly ash particles are significantly smaller, with an average mean size ranging from 25.186 µm to 27.782 µm. The size of the fly ash particles can be classified as average compared to other literature results. Ziehl et al. [45] found that finer particles improve compressive strength, and a smaller particle size distribution improves the geopolymerization process and reduces pores and cracking [45].
All three materials are analyzed at SEM with different magnifications. Images showing the shape of individual particles and surface properties are shown in Figure 7.
The analyzed fly ash particles have a high degree of roundness, and satellite-like deposits of smaller particles on larger ones can often be observed. The particle surface is mostly smooth except for deposits or fusions of several individuals. The sand shows particles with high similarity and surfaces that can be described as rough under higher magnification. Xanthan gum is characterized by small particles, some with extremely low roundness. The surface is rough to flaky. Because there is no particle size analysis for xanthan gum, an optical measurement is carried out under the electron microscope to provide insight into the rough measurements and dimensions. The maximum Feret diameters range from 161.3 μm to 238.8 μm for a typical grain.
The results of the elemental XRF analysis show the sand consists mainly of silicon (94.3%), as SiO2. The results for fly ash are much more complex and are presented are presented in Figure 8. Fly ash can be classified as class F fly ash (SiO2 + Al2O3 > 70% and CaO < 10%) [46].
The evaluation of the analysis shows that the proportion of silicon and aluminum oxides in the fly ash is 80%. These oxides are the most important ones as they are needed for the formation of the geopolymer. The CaO content is also important, as too high a proportion prevents the formation of the three-dimensional geopolymer structure [46,47].

3.2. Fresh Paste Properties

The results of the slump test and initial shape retention tests provide important knowledge about the effect of the additives used. Low deformation of the paste cylinder in the slump cone test promises good dimensional stability and qualifies the composition of the paste for extrusion by hand. Here, particular attention has to be paid to ensuring that there is a uniform flow of material and that the individual layers/strands do not deform after deposition. Results are checked visually according to the criteria above and are used to improve the composition of the pastes. These preliminary tests enable the material to be tested on a small size and prevent it from being wasted by mixing unsuitable pastes on a large scale. The underwater printing is also simulated by hand. To observe the increase in strength over time, a penetration test is carried out with a pen at intervals of several days. Table 8 describes the effects of the tested additives on the behavior of the paste. The mass proportions and how the percentage values are calculated can be found in Table 4.
Several other studies confirm the suitability of different additives for AM of fly ash-based geopolymers. Panda et al. used microglass fiber and attalpurite clay [48], as well as actigel and cellulose [49]. These additives are often used in combination with GGBFS and silica fume (SF). Since both SF and GGBFS are geopolymer precursors and react actively, they are added up to 6%, while pure thixotropic additives account for 0.5 to 0.8%. It is noticeable that in this work with superplasticizer and xanthan gum, more additives are used in percentage terms. In the printable paste mixtures, 1.1 to 1.5% additives are present in relation to the total weight. A high proportion of additives can lead to a deterioration in mechanical strength [29].
In the next steps, particular attention was given to printable compositions: #20AB and #21AB. The slump cone test confirmed that paste mixtures #20AB and #21AB have very good dimensional stability. As can be seen from the top perspective, the cone widens uniformly by 0.45 to 0.55 cm in each direction. Figure 9 shows the changes compared to the original basic diameter of 10 cm.
A low slump rate is desirable as it guarantees high dimensional accuracy of the subsequently printed body. It also makes it easier to place the individual layers precisely on top of each other. However, it must be ensured that the paste remains extrudable, otherwise, lumpy behavior can occur with insufficient bonding between individual layers.
The slump cone test confirmed the dependence of the “stability” of the paste on additives and liquid admixtures. Variations in the amount of solution added, of as little as 2%, lead to considerable differences in slumping behavior, which determines the extrusion and shape retention properties of the paste. This is consistent with findings from other studies [50].

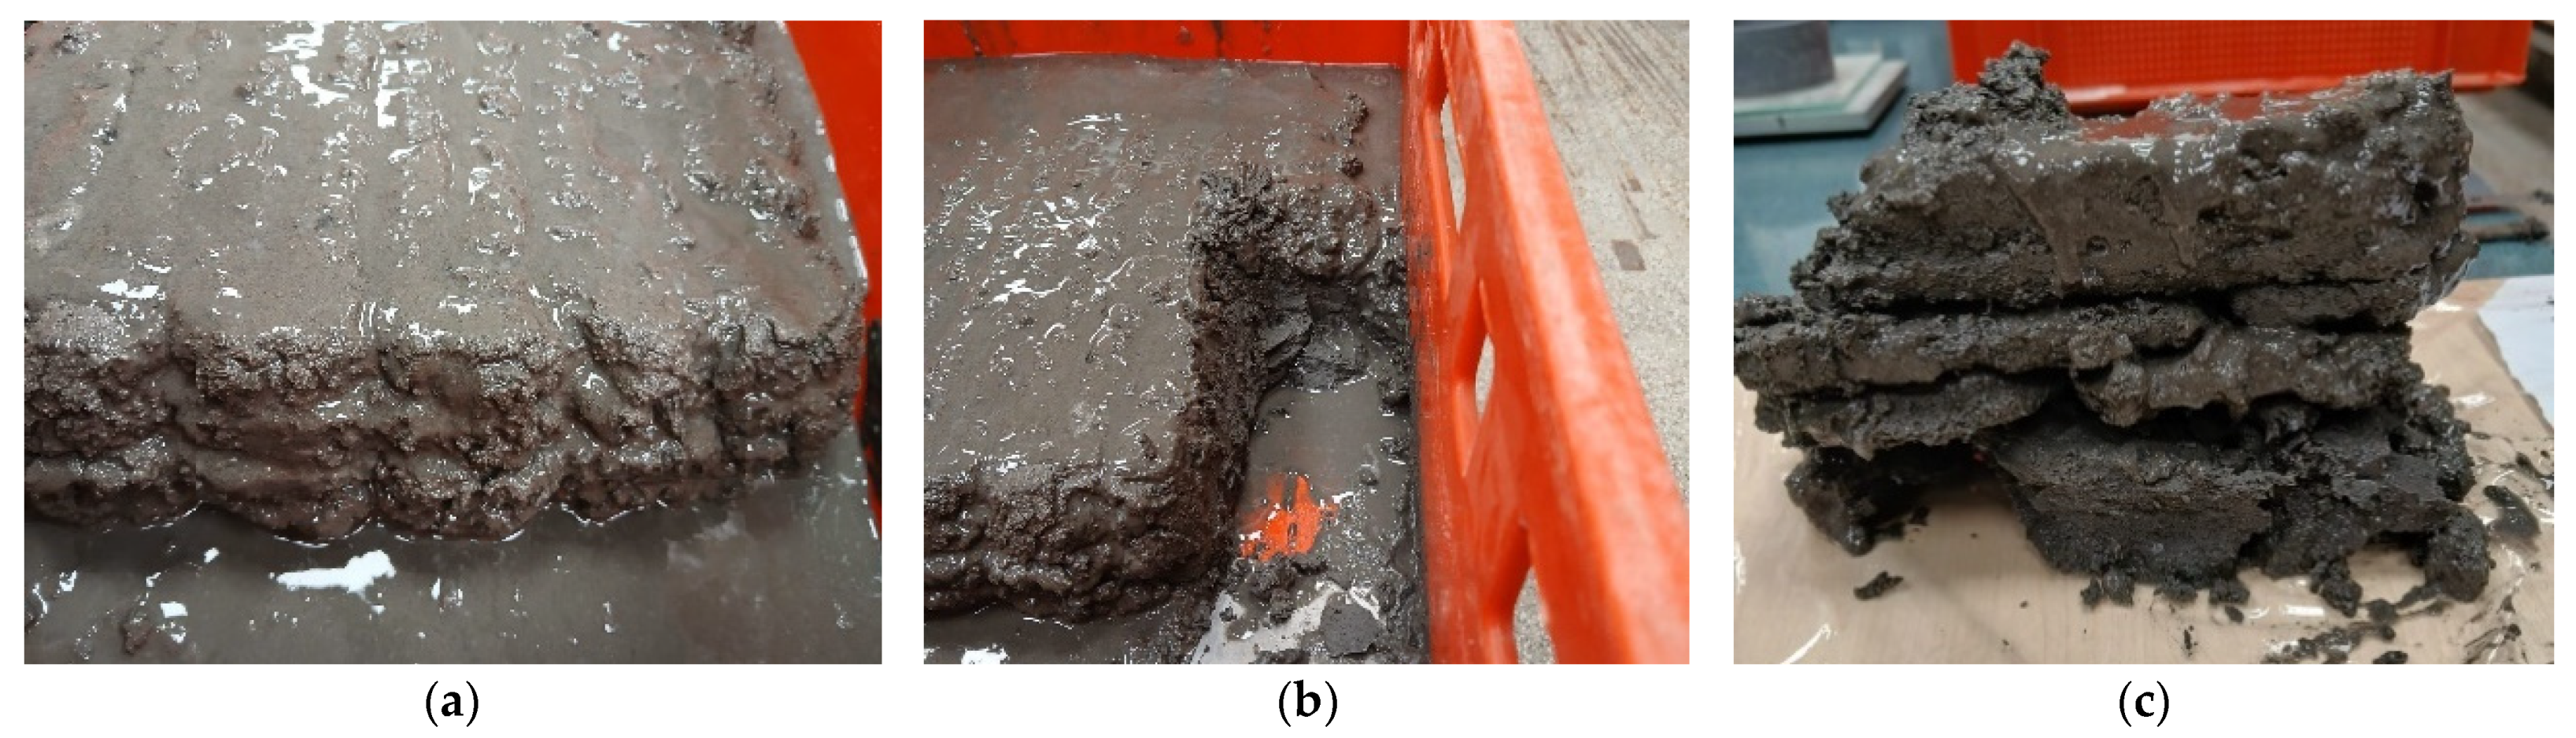
3.3. 3D Printing Process

The printing of the two paste mixtures (#20AB and #21AB) and the underwater printing produced results that are compared with each other and with outcomes from other sources, including printing in air—Figure 10.
Figure 11a shows the extrusion test of a paste that is too liquid. It can be clearly seen that the lower layers collapse under the weight of the upper ones, and visible irregular extrusion occurs on the sides. Both individual layers and the entire volume collapse. The reason for the slow curing is the insufficient use of additives. As the geometric error is considered too high, especially after curing, the printed bodies are not used for subsequent experiments.
After adjusting the paste composition, new prints are carried out (#20AB). A very homogeneous, slight over-extrusion can be seen in picture 2 compared to the results achieved before. The individual layers are neatly laid over each other and few geometric differences are visible between the layers (Figure 11c). The lower layers remain stable, and the printed object does not sag even after multiple layers have been applied. There are gaps on the upper side of the extrusion (Figure 11c), which could cause cavities inside the component.
After adjusting the previous mix, the final prints are made with paste composition #21AB. This results in very precise extrusion and high reproducibility of the individual layers (Figure 11e). The material appears drier than #20AB and there is less over-extrusion and wrinkling on the top of the component. This can be seen when Figure 11c,d are compared. The print image is not ideally smooth, and there are often cracks on the surface of the strand, which lead to imperfections, particularly on the top of the object.
When printing underwater, the visibility of the results is sometimes limited. Nevertheless, it became apparent that the material tends to tear during extrusion and that it is not possible to create smooth surfaces and edges. The behavior is the same between the layers, and the deposition of another layer shifts the existing one considerably. By increasing the flow, more material could be added to close potential gaps. After completion of the printing process, the outlines of a relatively true-to-shape body can be guessed, but the poor visibility in the water prevents any statement on the placement of the lower layers.
The most important printer components are the gentry system and the feed- and positioning units of the print head. The latter consists of the driven mixer with a connected progressive cavity pump and the nozzle. The four-axis system proves to be suitable for the applications. It is also the more common system in the literature compared to robotic solutions. However, Panda et al. [49] used a six-axis Denso robot to generate cuboids from geopolymer [49]. The lack of geometric complexity of the previously printed components makes a gantry system more attractive.
A progressive cavity pump is used as the primary pumping unit in this study. Its utility is unique among comparable experiments and has advantages and disadvantages. It enables precise material extrusion and very low flow rates are also possible. However, extrusion breakage and air entrapment often occur. A round nozzle with a diameter of 20 mm is attached. In addition to round nozzles, square nozzles with 20 × 20 mm or 30 × 10 mm [29] dimensions are also used and can result in smoother wall finishes. The components in combination with the printing parameters are suitable for printing the blocks that are later cut to size. However, they should be questioned for other geometries.

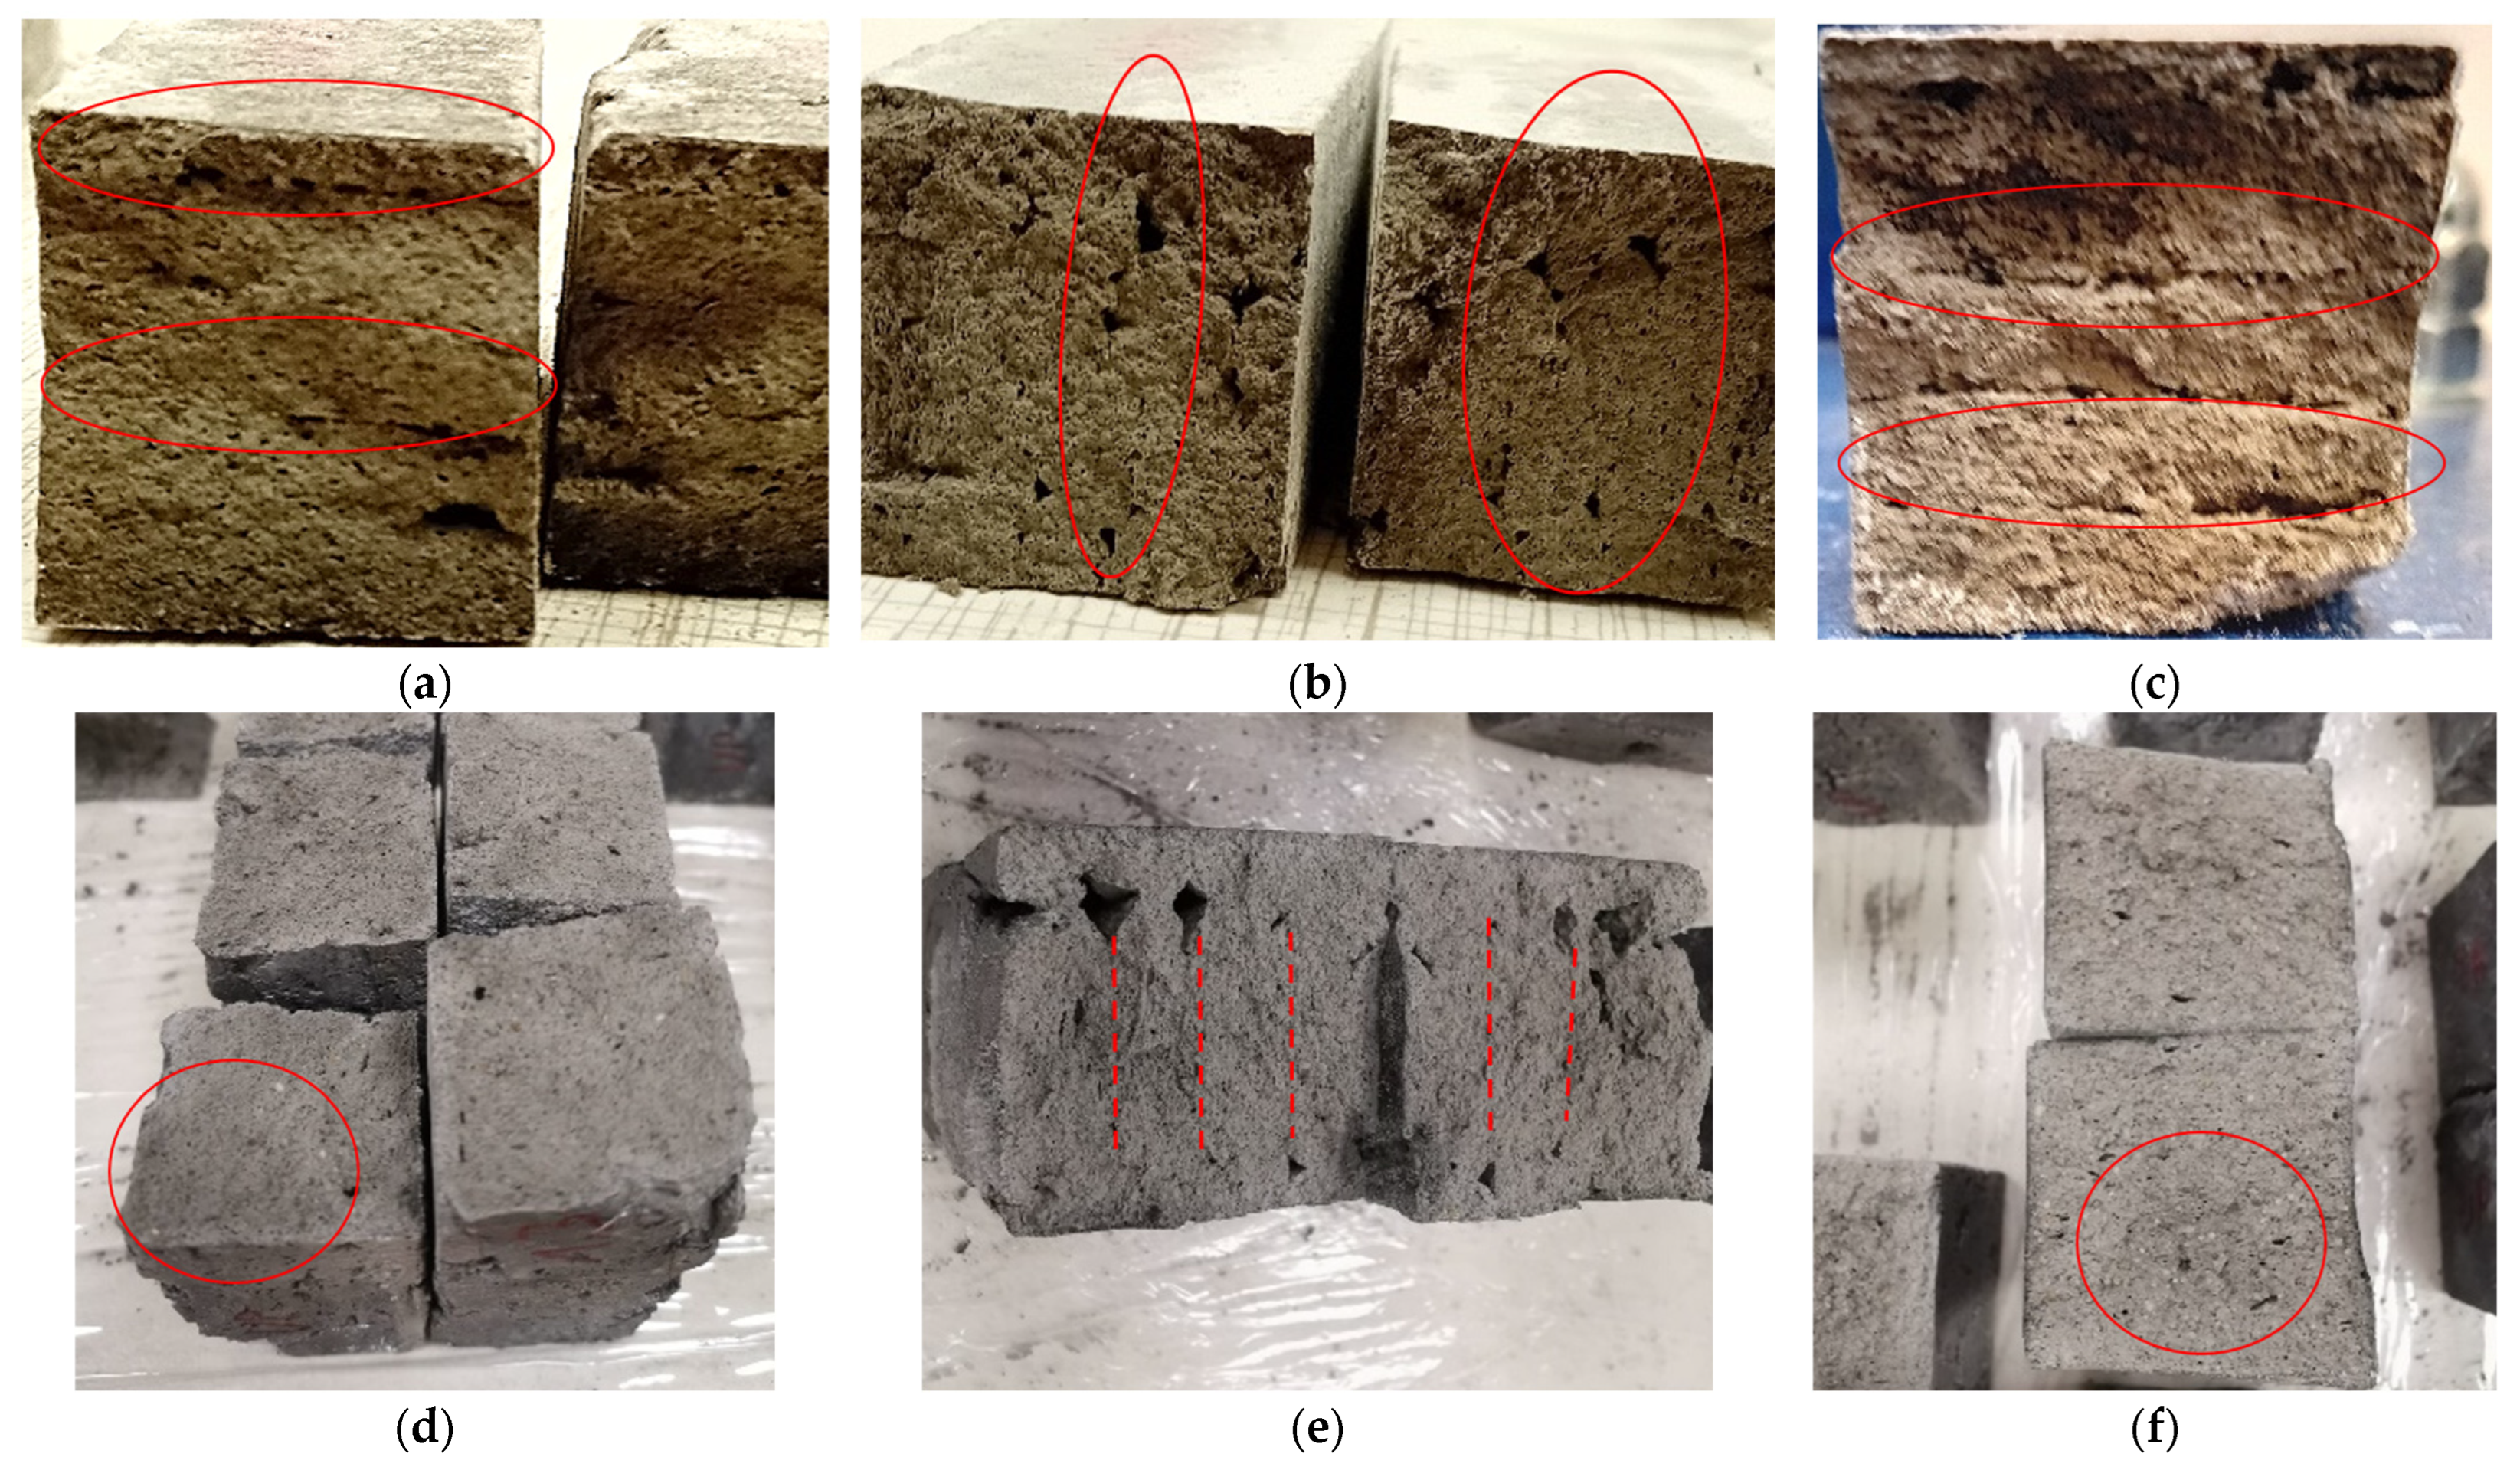
3.4. Comparison of the Properties of the Samples Made by Different Methods of Manufacturing

The various specimens are tested for compressive strength and flexural strength after 28 days (#20AB) and 35 days (#21AB). To better classify the results, the densities are calculated. The results are presented in Figure 12 and Figure 13 for the samples from material #21AB and #20AB, for compressive strength (Figure 12) and flexural strength (Figure 13). CC (CB) stands for casted cubes (casted blocks), CCHT for casted cubes heat treated (analogous to CBHT), and 3DPC1–3 for the printed samples in the corresponding orientation.
The average values for compressive strength are between 1.58 and 9.16 MPa. The casted samples made from #21AB that are heat treated, have the highest compressive strength, and the samples printed with #20AB that are tested in orientation 3 have the lowest. Material #21AB has more than three times higher compressive strength values, compared to #20AB. Both the density and the test values achieved are clustered and can be easily separated visually. The only exception is sample #21AB CCHT, which has the second-lowest density and the highest fracture strength. At 1.55 g/cm3, the density is far below the average value of 1.86 g/cm3 for the other samples of the same material. The lower density of the test series #20AB compared to #21AB of 12% on average, can be attributed to the increased water content in the activator. The lower values of samples marked as CCHT in both groups can be caused by loss of water during the heat treatment process.
Additional water in the mixture is released during hydrolysis, geopolymerization, and condensation. The decrease in density as the curing temperature increases is also consistent with the findings of other studies [51].
The flexural strengths are between 0.533 and 4.154 MPa, with the value of the sample printed from #21AB in the second orientation being seven times higher than the rest. Apart from this exception, material #20AB has a higher flexural strength than #21AB. The same densities as in the compressive strength test are used, but the test series #21AB CBHT is not carried out.
Even after 49 days, the cuboid printed under water has not yet hardened to the point where it can be removed from the tub. The volume does not offer enough resistance to the penetration of a small stick, so the performance of mechanical stress tests is perceived as impossible.
The different densities of the individual sample specimens can be attributed to the difference in water content between the test series and the type of curing. Wan et al. [52] confirmed a correlation between increasing water content and decreasing mechanical properties. The formation of pores and a decrease in the degree of polymerization due to water in the network leads to a strong reduction in strength [52]. The values achieved in the work for compressive and flexural strength are significantly lower than those of comparable documented studies. Panda et al. found compressive strength values around 35 MPa for printed and cast cubes of fly ash-based geopolymers, with flexural strength from 4 to 10 MPa [49]. Other works also show the possibility of obtaining compressive strength up to 55 MPa using 3D printing technology [47,53]. The reduced properties of the samples tested here can be attributed to the use of other additives. These require a high addition of water (total water content 21% in #20AB and 12% in #21AB), which inhibits strength-forming processes and promotes destructive pore formation.

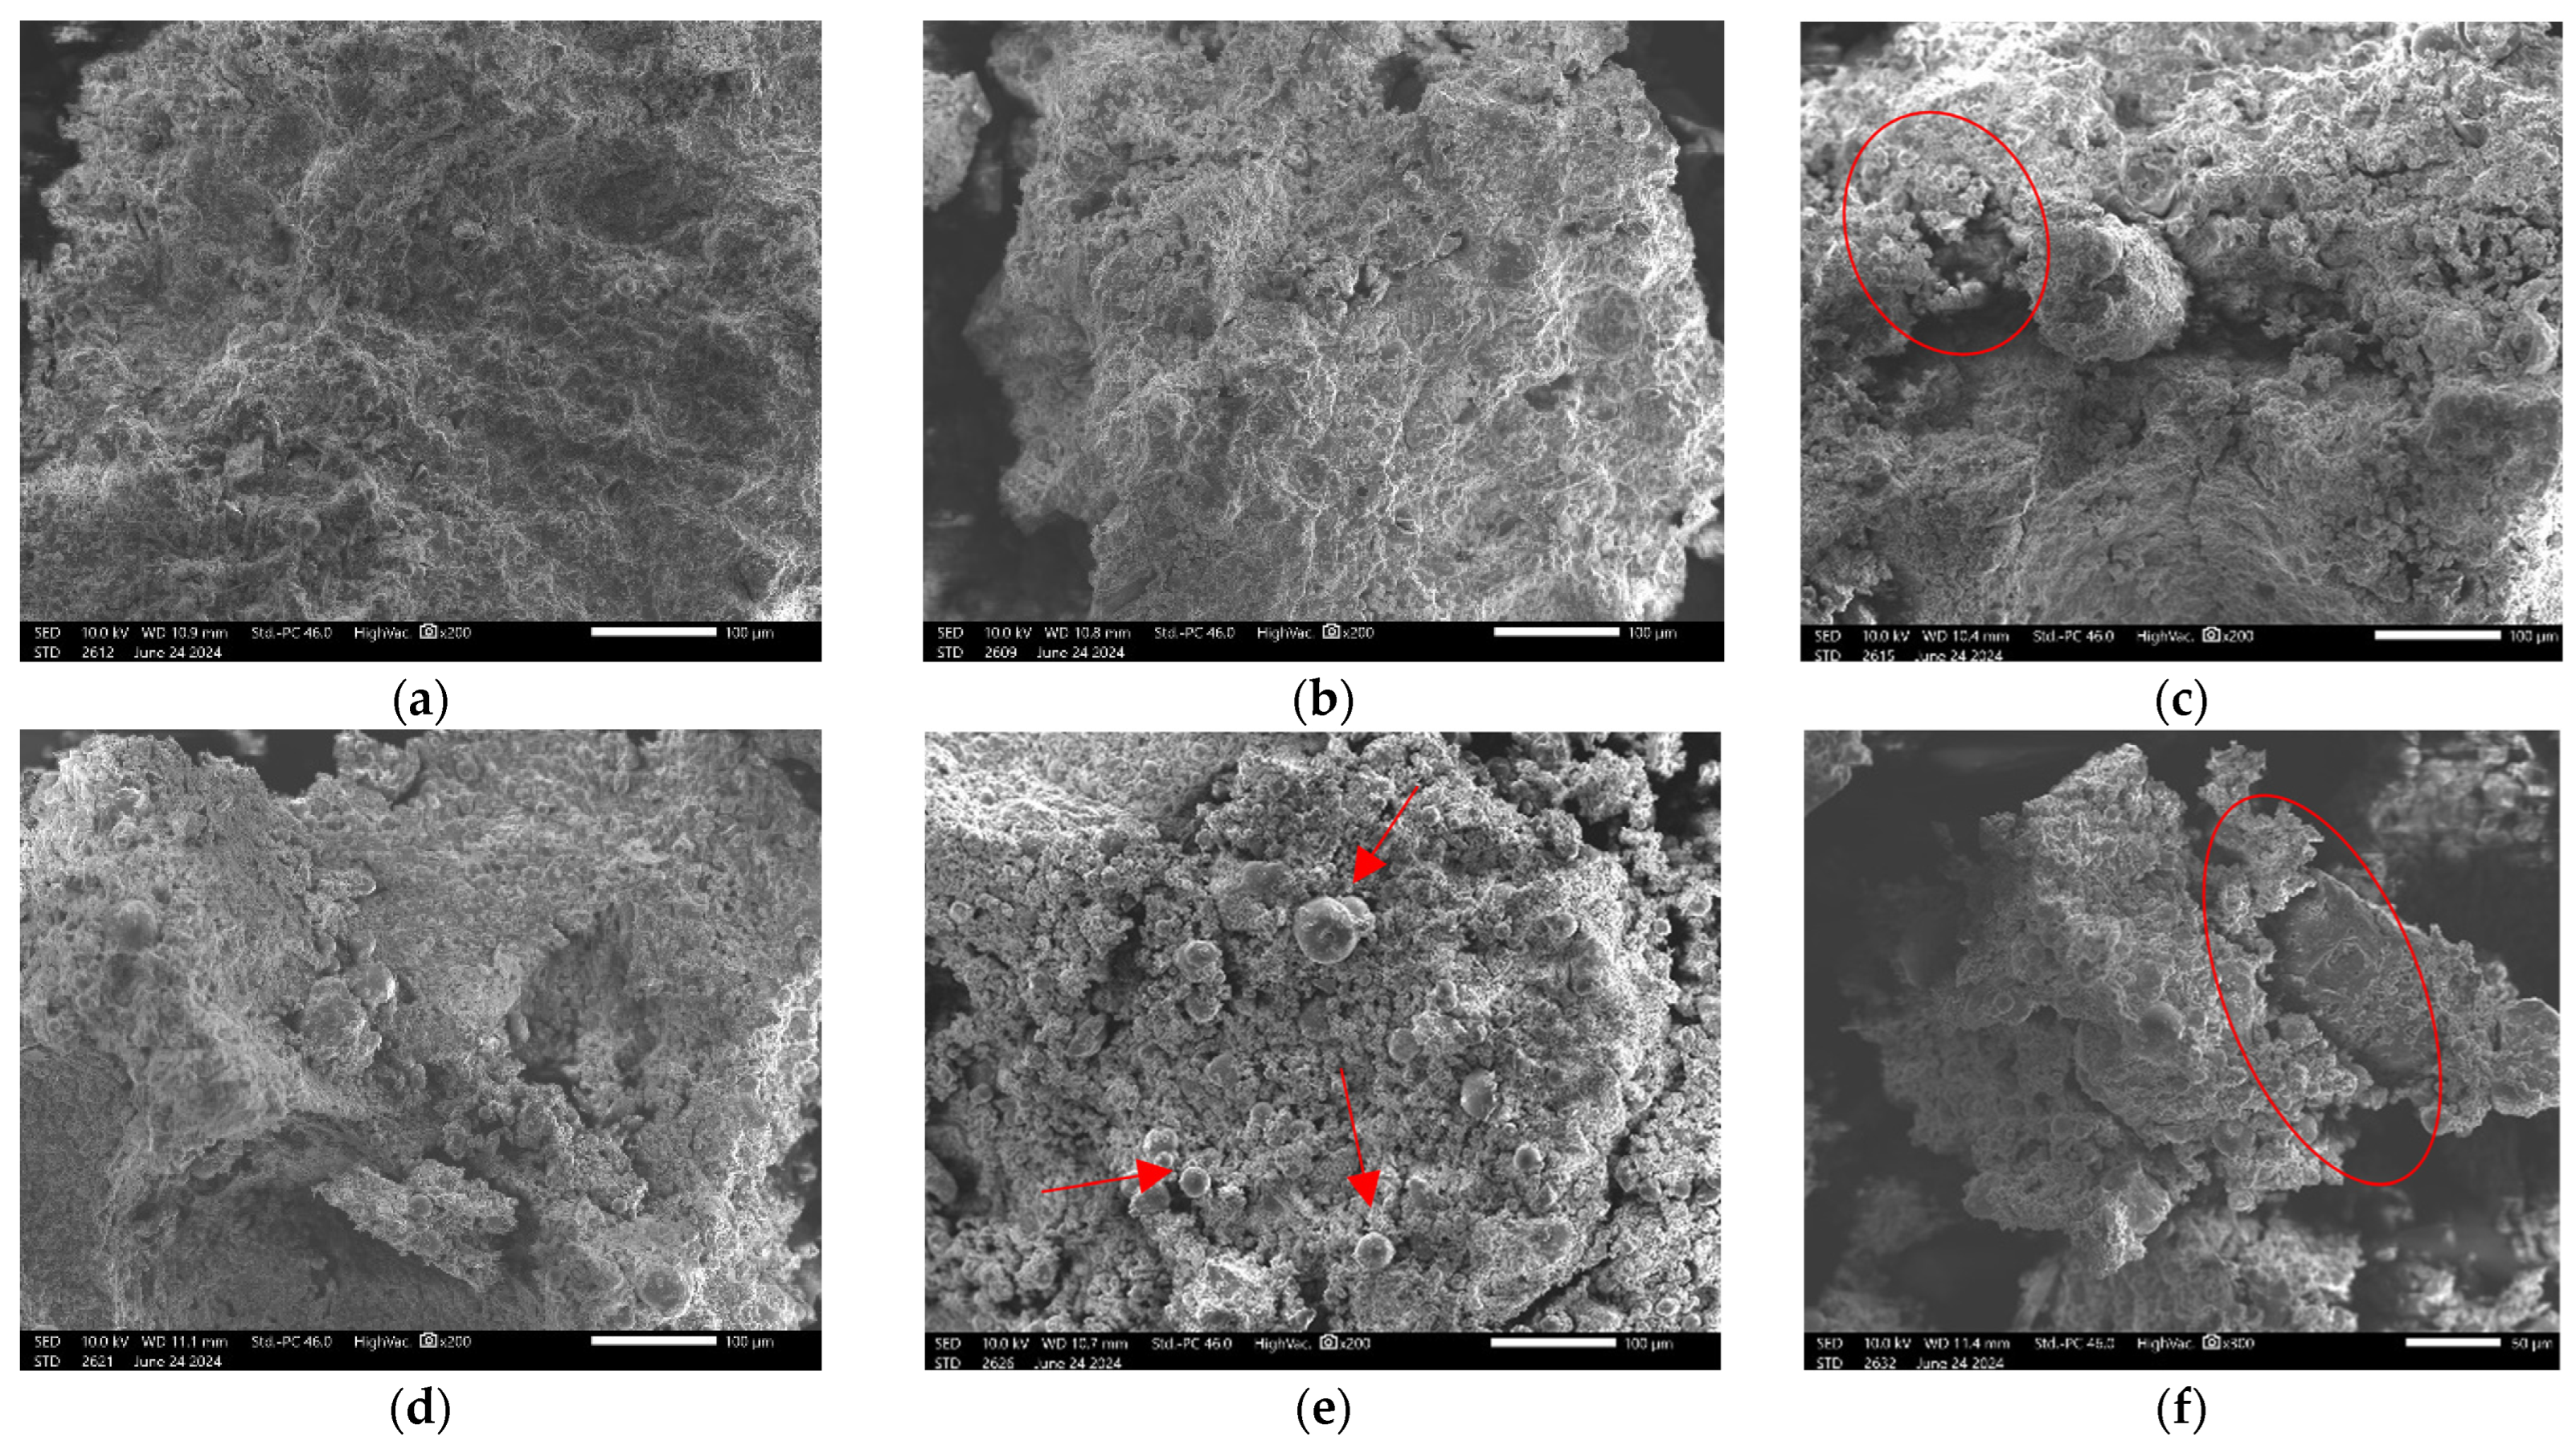
3.5. Structural Analysis

To better assess the results and explain the causes of the material properties, the structure of the samples is analyzed. This is done before and after the load tests, based on the macrostructure (Figure 14, Figure 15 and Figure 16), and with SEM to visualize microstructural features (Figure 17 and Figure 18).
Figure 14 shows different geopolymer samples at different times. Figure 14b shows how the cast samples deviate from the ideal geometry due to voids and cavities. These deviations can be observed equally in all cast samples but are more pronounced in material #20AB and the heat-treated samples. This can be explained by the reduced processability of pastes specialized for extrusion and the higher early shrinkage from heat curing.
Figure 14c,d show specimens that developed significant efflorescence after a certain time. Efflorescence results from the reaction of alkalis present in the geopolymer and atmospheric carbon dioxide. Free alkalis like Na+ or K+ travel through the pore network of the geopolymer until they reach the surface [54,55]. Efflorescence has a negative effect on the mechanical properties of the samples [54]. This phenomenon occurred in all specimens, although it was most noticeable in the casted, not heat-treated specimens and in the ones cut from the printed volumes. Leaching also occurred in the samples produced underwater, causing the water to become cloudy and forming a white layer between the component and the water.
The dimensions of the body printed underwater do not deviate excessively from those printed in the air (Figure 15). The individual layers and contours on the sides and on the top are clearly recognizable. However, there are gaps between the different layers, resulting in poor or no bonding between them. Although the paste is extruded and placed according to the g-code, the composition is not suitable for producing mechanically resistant test specimens. Despite additives, the mix is not adapted to the conditions of underwater printing. Since there is no literature on underwater 3D printing of geopolymers, it is not possible to compare the results.
When looking at the fracture surfaces (Figure 16), the layer bonding within a component is differently defined. For example, a significantly poorer homogeneity can be observed in the bodies printed from material #21AB compared to those from #20AB. Discoloration on the fracture surface, which indicates incomplete drying, is also particularly evident in #20AB samples. Since the structure of the specimens in #20AB is homogeneous, the values are close to each other. The anisotropies in the #21AB specimens did not affect the strength values of the beam oriented in position 2, whereas they significantly weakened the other orientations. The results of the mechanical tests can be explained in part by the macrostructure of the samples. When loaded parallel to the direction of pressure (orientation 1 and 3), a large part of the forces acting on the material is transmitted through the interlayer bond strength, which is a weak point in additively manufactured components. Although the difference between the tested orientations in #21AB is extreme, the process-related phenomenon is consistent with other results from the literature [56].
The fracture behavior of the compressive strength is more difficult to investigate based on internal sample structures. No unusual similarities could be found between specimens tested in the same orientation, as there was generally a high degree of resemblance. The compressive strength test shows similar values for the tested samples within a material, and the differences can mostly be attributed to differences in density and paste composition.
The comparison shows the microstructure of the different sample types. Figure 17a–c show good resolution of all reactants and the formation of a solid matrix; only in picture 3 is partial resolution of the fly ash particles visible. In comparison, the dissolution of the fly ash particles in the samples made from material #20AB is significantly poorer, as seen in Figure 17d,e. The connectivity of the sand grains is also less pronounced in Figure 17f. The images show characteristics of the microstructure of the tested solids.
The microstructural properties significantly influence the qualities of the manufactured bodies. Some of the material imperfections can be observed in Figure 18. The low reaction of the fly ash (Figure 18d,f), the weak bonding of the gel to the sand grains (Figure 18a–c), as well as the formation of pores and microcracks (Figure 18c,e,f), explain the poor mechanical strength.
In the samples printed with material #20AB, a poorer dissolution of the fly ash particles is present and a resulting weaker bonding of the matrix to the sand grains, compared to #21AB. Although pores and incomplete dissolution of the fly ash can be observed in both compositions, they are more pronounced in material #20AB. There is little difference between the microstructures of the different manufacturing methods within a material. The features mentioned above can be found equally in cast, cast and heat-treated, and 3D printed samples.
The reason for the imperfections is the different composition of the liquid phase in the mixture. The addition of water reduced the amount of reactive solution, and this water formed pores in the specimen. Compared to other microstructure analyses of fly ash-based, additively manufactured geopolymer, these experiments show significantly more unreacted fly ash particles and less gel formation.

4. Conclusions

This article deals with the investigation of raw materials and the examination of paste properties and the additive manufacturing of geopolymers in different environments. Additionally, printed samples are compared with conventionally manufactured ones in terms of mechanical strength and structural properties. The utilized production methods include manual extrusion with a cartridge press, casting in molds, and paste extrusion modeling in air and underwater. Based on this research, the following findings have been formulated:
  • Paste extrusion modeling can be used to generate solid bodies from fly ash-based geopolymer.
  • By adding additives such as xanthan gum and superplasticizer, the rheological properties of the paste are modified to retain shape while being well extrudable.
  • With the help of additive manufacturing, geopolymer samples with compressive strengths of up to 7.5 MPa and flexural strengths of up to 4.15 MPa after 28 and 35 days, respectively, have been produced. Compared to the average of the cast samples, the compressive strength of the printed samples was 5% (#21AB) and 9% (#20AB) lower. The flexural strength was, on average, 38% (#20AB) and 64% (#21AB) lower for printed samples.
  • The sample series #21AB showed strong anisotropy between the tested orientations of the flexural strength samples. Values achieved for the “favorable” orientation (4.15 MPa) were almost 7.5 times as high as those for the other orientations (0.56 MPa). For a reliable prediction of strength, anisotropies that occur during the printing process must be avoided.
  • The addition of more water (20% total in #20AB versus 11% in #21AB) resulted in better layer bonding and less anisotropy in sample series #20AB. Excessively adding water leads to pore formation and insufficient development of the gel phase and should, therefore, be avoided.
  • The 3D-printed samples showed strong anisotropy, including the samples 3D printed underwater.
  • The extrusion of layers under water is possible with the tested paste, but the desired hardening did not occur after 7 weeks of immersion in water.
  • One of the problems was the printer’s discontinuous process path. In the future, directly generated and optimized process paths should be used instead of sliced solids. Such g-codes can be created using the program Rhinoceros and the Grasshopper plug-in.
Based on this work, key topics for subsequent experiments are derived. To test the effect of the extrusion device on the used printer, it is advisable to replace the progressive cavity pump with an auger. The findings on the compositions of the printable pastes can also be used as a starting point for further optimizations regarding the strength and water resistance of printed components. Finally, the influence of nozzle geometries and an intensified search for additives for underwater 3D printing should be considered for further optimization.

Author Contributions

Conceptualization, A.F.B., H.Z. and K.K.; methodology, A.F.B. and K.K.; software, A.F.B. and S.G.; validation, H.Z. and K.K.; formal analysis, A.F.B.; investigation, A.F.B. and S.G.; resources, K.K.; data curation, A.F.B.; writing—original draft preparation, A.F.B. and K.K; writing—review and editing, H.Z. and S.G.; visualization, A.F.B.; supervision, H.Z. and K.K.; project administration, K.K.; funding acquisition, K.K. All authors have read and agreed to the published version of the manuscript.

Funding

This research was funded by the project titled “Development of geopolymer composites as a material for protection of hazardous wrecks and other critical underwater structures against corrosion” under the M-ERA.NET 3 program by the Polish National Centre for Research and Development, grant number M-ERA.NET3/2021/71/MAR-WRECK/2022, and co-financed with tax funds based on the budget passed by the Saxon State Parliament (SAB).

Institutional Review Board Statement

Not applicable.

Informed Consent Statement

Not applicable.

Data Availability Statement

The original contributions presented in this study are included in the article. Further inquiries can be directed to the corresponding author.

Conflicts of Interest

The authors declare no conflicts of interest. The funders had no role in the design of the study; in the collection, analyses, or interpretation of data; in the writing of the manuscript; or in the decision to publish the results.

Abbreviations

The following abbreviations are used in this manuscript:
3DThree Dimensional
CADComputer-Aided Design
SEMScanning Electron Microscopy
STLStandard Tessellation Language
UW3DPUnderwater 3D printing
XRFX-Ray Fluorescence

Appendix A

Figure A1. The elements of the printhead.
Figure A1. Printhead.
Applsci 15 03449 g0a1

References

  1. Krishna, R.S.; Rehman, A.U.; Mishra, J.; Saha, S.; Korniejenko, K.; Rehman, R.U.; Salamci, M.U.; Sglavo, V.M.; Shaikh, F.U.A.; Qureshi, T.S. Additive Manufacturing of Geopolymer Composites for Sustainable Construction: Critical Factors, Advancements, Challenges, and Future Directions. Prog. Addit. Manuf. 2025, 10, 1003–1061. [Google Scholar] [CrossRef]
  2. Mierzwiński, D.; Łach, M.; Gądek, S.; Lin, W.-T.; Tran, D.H.; Korniejenko, K. A Brief Overview of the Use of Additive Manufacturing of Con-Create Materials in Construction. Acta Innov. 2023, 48, 22–37. [Google Scholar] [CrossRef]
  3. Yoris-Nobile, A.I.; Slebi-Acevedo, C.J.; Lizasoain-Arteaga, E.; Indacoechea-Vega, I.; Blanco-Fernandez, E.; Castro-Fresno, D.; Alonso-Estebanez, A.; Alonso-Cañon, S.; Real-Gutierrez, C.; Boukhelf, F.; et al. Artificial Reefs Built by 3D Printing: Systematisation in the Design, Material Selection and Fabrication. Constr. Build. Mater. 2023, 362, 129766. [Google Scholar] [CrossRef]
  4. Yousaf, A.; Al Rashid, A.; Koç, M. 3D Printing of Alkali-Activated Geopolymers for Sustainable and Circular Economy Advancements. Circ. Econ. 2024, 3, 100101. [Google Scholar] [CrossRef]
  5. Szechyńska-Hebda, M.; Hebda, M.; Doğan-Sağlamtimur, N.; Lin, W.-T. Let’s Print an Ecology in 3D (and 4D). Materials 2024, 17, 2194. [Google Scholar] [CrossRef]
  6. Korniejenko, K.; Gądek, S.; Dynowski, P.; Tran, D.H.; Rudziewicz, M.; Pose, S.; Grab, T. Additive Manufacturing in Underwater Applications. Appl. Sci. 2024, 14, 1346. [Google Scholar] [CrossRef]
  7. Bassan De Moraes, M.J.; Nagata, E.Y.; Felício Peres Duran, A.J.; Rossignolo, J.A. Alkali Activated Materials Applied in 3D Printing Construction: A Review. Heliyon 2024, 10, e26696. [Google Scholar] [CrossRef]
  8. Ricciotti, L.; Apicella, A.; Perrotta, V.; Aversa, R. Geopolymer Materials for Extrusion-Based 3D-Printing: A Review. Polymers 2023, 15, 4688. [Google Scholar] [CrossRef]
  9. Ahmadifar, M.; Benfriha, K.; Shirinbayan, M.; Fitoussi, J.; Tcharkhtchi, A. Mechanical Behavior of Polymer-Based Composites Using Fused Filament Fabrication under Monotonic and Fatigue Loadings. Polym. Polym. Compos. 2022, 30, 09673911221082480. [Google Scholar] [CrossRef]
  10. Ahmadifar, M.; Benfriha, K.; Shirinbayan, M. Thermal, Tensile and Fatigue Behaviors of the PA6, Short Carbon Fiber-Reinforced PA6, and Continuous Glass Fiber-Reinforced PA6 Materials in Fused Filament Fabrication (FFF). Polymers 2023, 15, 507. [Google Scholar] [CrossRef]
  11. Shakeria, Z.; Benfriha, K.; Zirak, N.; Shirinbayan, M. Optimization of FFF Processing Parameters to Improve Geometrical Accuracy and Mechanical Behavior of Polyamide 6 Using Grey Relational Analysis (GRA). Preprint 2021. [Google Scholar]
  12. Shirinbayan, M.; Benfriha, K.; Tcharkhtchi, A. Geometric Accuracy and Mechanical Behavior of PA6 Composite Curved Tubes Fabricated by Fused Filament Fabrication (FFF). Adv. Eng. Mater. 2022, 24, 2101056. [Google Scholar] [CrossRef]
  13. Zirak, N.; Benfriha, K.; Shakeri, Z.; Shirinbayan, M.; Fitoussi, J.; Tcharkhtchi, A. Interlayer Bonding Improvement and Optimization of Printing Parameters of FFF Polyphenylene Sulfide Parts Using GRA Method. Prog. Addit. Manuf. 2024, 9, 505–516. [Google Scholar] [CrossRef]
  14. Luhar, S.; Luhar, I. Additive Manufacturing in the Geopolymer Construction Technology: A Review. Open Constr. Build. Technol. J. 2020, 14, 150–161. [Google Scholar] [CrossRef]
  15. Xia, M.; Sanjayan, J. Method of Formulating Geopolymer for 3D Printing for Construction Applications. Mater. Des. 2016, 110, 382–390. [Google Scholar] [CrossRef]
  16. Lazorenko, G.; Kasprzhitskii, A. Geopolymer Additive Manufacturing: A Review. Addit. Manuf. 2022, 55, 102782. [Google Scholar] [CrossRef]
  17. Baigarina, A.; Shehab, E.; Ali, M.H. Construction 3D Printing: A Critical Review and Future Research Directions. Prog. Addit. Manuf. 2023, 8, 1393–1421. [Google Scholar] [CrossRef]
  18. Amelia, H. How Does a Concrete 3D Printer Work? Available online: www.3dnatives.com/en/how-does-a-concrete-3d-printer-work-080120215 (accessed on 25 July 2024).
  19. Barve, P.; Bahrami, A.; Shah, S. A Comprehensive Review on Effects of Material Composition, Mix Design, and Mixing Regimes on Rheology of 3D-Printed Geopolymer Concrete. Open Constr. Build. Technol. J. 2024, 18, e18748368292859. [Google Scholar] [CrossRef]
  20. Gasmi, A.; Pélegris, C.; Davidovits, R.; Guessasma, M.; Tortajada, H.; Jean, F. Advanced Refinement of Geopolymer Composites for Enhanced 3D Printing via In-Depth Rheological Insights. Ceramics 2024, 7, 1316–1339. [Google Scholar] [CrossRef]
  21. Zhong, H.; Zhang, M. 3D Printing Geopolymers: A Review. Cem. Concr. Compos. 2022, 128, 104455. [Google Scholar] [CrossRef]
  22. Zhang, D.-W.; Wang, D.; Lin, X.-Q.; Zhang, T. The Study of the Structure Rebuilding and Yield Stress of 3D Printing Geopolymer Pastes. Constr. Build. Mater. 2018, 184, 575–580. [Google Scholar] [CrossRef]
  23. Sando, M.; Stephan, D. The Role of Mixing Sequence in Shaping the 3D-Printability of Geopolymers. Case Stud. Constr. Mater. 2025, 22, e04352. [Google Scholar] [CrossRef]
  24. Cong, P.; Cheng, Y. Advances in Geopolymer Materials: A Comprehensive Review. J. Traffic Transp. Eng. 2021, 8, 283–314. [Google Scholar] [CrossRef]
  25. Fang, G.; Ho, W.K.; Tu, W.; Zhang, M. Workability and Mechanical Properties of Alkali-Activated Fly Ash-Slag Concrete Cured at Ambient Temperature. Constr. Build. Mater. 2018, 172, 476–487. [Google Scholar] [CrossRef]
  26. Paul, S.C.; Tay, Y.W.D.; Panda, B.; Tan, M.J. Fresh and Hardened Properties of 3D Printable Cementitious Materials for Building and Construction. Arch. Civ. Mech. Eng. 2018, 18, 311–319. [Google Scholar] [CrossRef]
  27. Zhang, P.; Zheng, Y.; Wang, K.; Zhang, J. A Review on Properties of Fresh and Hardened Geopolymer Mortar. Compos. Part B Eng. 2018, 152, 79–95. [Google Scholar] [CrossRef]
  28. Nikolov, A.; Karamanov, A. Thermal Properties of Geopolymer Based on Fayalite Waste from Copper Production and Metakaolin. Materials 2022, 15, 2666. [Google Scholar] [CrossRef]
  29. Panda, B.; Unluer, C.; Tan, M.J. Extrusion and Rheology Characterization of Geopolymer Nanocomposites Used in 3D Printing. Compos. Part B Eng. 2019, 176, 107290. [Google Scholar] [CrossRef]
  30. Muthukrishnan, S.; Ramakrishnan, S.; Sanjayan, J. Effect of Alkali Reactions on the Rheology of One-Part 3D Printable Geopolymer Concrete. Cem. Concr. Compos. 2021, 116, 103899. [Google Scholar] [CrossRef]
  31. Sun, C.; Xiang, J.; Xu, M.; He, Y.; Tong, Z.; Cui, X. 3D Extrusion Free Forming of Geopolymer Composites: Materials Modification and Processing Optimization. J. Clean. Prod. 2020, 258, 120986. [Google Scholar] [CrossRef]
  32. Chougan, M.; Hamidreza Ghaffar, S.; Jahanzat, M.; Albar, A.; Mujaddedi, N.; Swash, R. The Influence of Nano-Additives in Strengthening Mechanical Performance of 3D Printed Multi-Binder Geopolymer Composites. Constr. Build. Mater. 2020, 250, 118928. [Google Scholar] [CrossRef]
  33. Shilton, R.; Wang, S.; Banthia, N. Use of Polysaccharides as a Rheology Modifying Admixture for Alkali Activated Materials for 3D Printing. Constr. Build. Mater. 2025, 458, 139661. [Google Scholar] [CrossRef]
  34. Gasmi, A. Additive Manufacturing of Ceramic Type Geopolymer for Complex and Tiny Objects. Available online: www.geopolymer.org/conference/gpcamp-2023 (accessed on 25 July 2024).
  35. Panda, B.; Unluer, C.; Tan, M.J. Investigation of the Rheology and Strength of Geopolymer Mixtures for Extrusion-Based 3D Printing. Cem. Concr. Compos. 2018, 94, 307–314. [Google Scholar] [CrossRef]
  36. Raza, M.H.; Zhong, R.Y. A Sustainable Roadmap for Additive Manufacturing Using Geopolymers in Construction Industry. Resour. Conserv. Recycl. 2022, 186, 106592. [Google Scholar] [CrossRef]
  37. Kriven, W.M.; Leonelli, C.; Provis, J.L.; Boccaccini, A.R.; Attwell, C.; Ducman, V.S.; Ferone, C.; Rossignol, S.; Luukkonen, T.; Van Deventer, J.S.J.; et al. Why Geopolymers and Alkali-activated Materials Are Key Components of a Sustainable World: A Perspective Contribution. J. Am. Ceram. Soc. 2024, 107, 5159–5177. [Google Scholar] [CrossRef]
  38. Valente, M.; Sibai, A.; Sambucci, M. Extrusion-Based Additive Manufacturing of Concrete Products: Revolutionizing and Remodeling the Construction Industry. J. Compos. Sci. 2019, 3, 88. [Google Scholar] [CrossRef]
  39. Ahmaruzzaman, M. A Review on the Utilization of Fly Ash. Prog. Energy Combust. Sci. 2010, 36, 327–363. [Google Scholar] [CrossRef]
  40. Zhuang, X.Y.; Chen, L.; Komarneni, S.; Zhou, C.H.; Tong, D.S.; Yang, H.M.; Yu, W.H.; Wang, H. Fly Ash-Based Geopolymer: Clean Production, Properties and Applications. J. Clean. Prod. 2016, 125, 253–267. [Google Scholar] [CrossRef]
  41. Ponomar, V.; Luukkonen, T.; Yliniemi, J. Revisiting Alkali-Activated and Sodium Silicate-Based Materials in the Early Works of Glukhovsky. Constr. Build. Mater. 2023, 398, 132474. [Google Scholar] [CrossRef]
  42. DIN EN 12350-5; Prüfung von Frischbeton—Teil 5: Ausbreitmaß; Deutsche Fassung EN 12350-5:2019-09. Beuth Verlag GmbH, ICS 91.100.30: Berlin, Germany, 2019.
  43. DIN EN 12390-3; Prüfung von Festbeton—Teil 3: Druckfestigkeit von Probekörpern; Deutsche Fassung EN 12390-3:2019. Beuth Verlag GmbH, ICS 91.100.30: Berlin, Germany, 2019.
  44. DIN EN 12390-5; Prüfung von Festbeton—Teil 5: Biegezugfestigkeit von Probekörpern; Deutsche Fassung EN 12390-5:2019-10. Beuth Verlag GmbH, ICS 91.100.30: Berlin, Germany, 2019.
  45. Assi, L.N.; Eddie Deaver, E.; Ziehl, P. Effect of Source and Particle Size Distribution on the Mechanical and Microstructural Properties of Fly Ash-Based Geopolymer Concrete. Constr. Build. Mater. 2018, 167, 372–380. [Google Scholar] [CrossRef]
  46. Korniejenko, K.; Łach, M.; Mikuła, J. The Influence of Short Coir, Glass and Carbon Fibers on the Properties of Composites with Geopolymer Matrix. Materials 2021, 14, 4599. [Google Scholar] [CrossRef]
  47. Korniejenko, K.; Kejzlar, P.; Louda, P. The Influence of the Material Structure on the Mechanical Properties of Geopolymer Composites Reinforced with Short Fibers Obtained with Additive Technologies. Int. J. Mol. Sci. 2022, 23, 2023. [Google Scholar] [CrossRef] [PubMed]
  48. Panda, B.; Tan, M.J. Experimental Study on Mix Proportion and Fresh Properties of Fly Ash Based Geopolymer for 3D Concrete Printing. Ceram. Int. 2018, 44, 10258–10265. [Google Scholar] [CrossRef]
  49. Panda, B.; Paul, S.C.; Hui, L.J.; Tay, Y.W.D.; Tan, M.J. Additive Manufacturing of Geopolymer for Sustainable Built Environment. J. Clean. Prod. 2017, 167, 281–288. [Google Scholar] [CrossRef]
  50. Nematollahi, B.; Bong, S.H.; Xia, M.; Sanjayan, J. Digital Fabrication of ‘Just-Add-Water’ Geopolymers: Effects of Curing Condition and Print-Time Interval. In Second RILEM International Conference on Concrete and Digital Fabrication; Bos, F.P., Lucas, S.S., Wolfs, R.J.M., Salet, T.A.M., Eds.; RILEM Bookseries; Springer International Publishing: Cham, Switzerland, 2020; Volume 28, pp. 93–102. ISBN 978-3-030-49915-0. [Google Scholar]
  51. Vitola, L.; Pundiene, I.; Pranckeviciene, J.; Bajare, D. The Impact of the Amount of Water Used in Activation Solution and the Initial Temperature of Paste on the Rheological Behaviour and Structural Evolution of Metakaolin-Based Geopolymer Pastes. Sustainability 2020, 12, 8216. [Google Scholar] [CrossRef]
  52. Wan, Q.; Zhang, Y.; Zhang, R. The Effect of Pore Behavior and Gel Structure on the Mechanical Property at Different Initial Water Content. Constr. Build. Mater. 2021, 309, 125146. [Google Scholar] [CrossRef]
  53. Al-Noaimat, Y.A.; Ghaffar, S.H.; Chougan, M.; Al-Kheetan, M.J. A Review of 3D Printing Low-Carbon Concrete with One-Part Geopolymer: Engineering, Environmental and Economic Feasibility. Case Stud. Constr. Mater. 2023, 18, e01818. [Google Scholar] [CrossRef]
  54. Longhi, M.A.; Zhang, Z.; Walkley, B.; Rodríguez, E.D.; Kirchheim, A.P. Strategies for Control and Mitigation of Efflorescence in Metakaolin-Based Geopolymers. Cem. Concr. Res. 2021, 144, 106431. [Google Scholar] [CrossRef]
  55. Simão, L.; Fernandes, E.; Hotza, D.; Ribeiro, M.J.; Montedo, O.R.K.; Raupp-Pereira, F. Controlling Efflorescence in Geopolymers: A New Approach. Case Stud. Constr. Mater. 2021, 15, e00740. [Google Scholar] [CrossRef]
  56. Le, T.T.; Austin, S.A.; Lim, S.; Buswell, R.A.; Law, R.; Gibb, A.G.F.; Thorpe, T. Hardened Properties of High-Performance Printing Concrete. Cem. Concr. Res. 2012, 42, 558–566. [Google Scholar] [CrossRef]
Figure 1. The different orientations in which the bodies were tested after being cut out.
Applsci 15 03449 g001
Figure 2. Complete workflow and order of the practical tests.
Applsci 15 03449 g002
Figure 3. The device used for additive manufacturing—the printer with its external dimensions of 2600 × 2200 × 2500 mm; (a) view into the build chamber; (b) suspension for the print head.
Applsci 15 03449 g003
Figure 4. Visualized sliced volumes.
Applsci 15 03449 g004
Figure 5. The setup for UW3DP: (a) overall view; (b) printing process.
Applsci 15 03449 g005
Figure 6. Size particle distribution: (a) fly ash; (b) sand.
Applsci 15 03449 g006
Figure 7. Size comparison of SEM images (magnification 200×): (a) fly ash; (b) sand; (c) xanthan gum.
Applsci 15 03449 g007
Figure 8. Composition of fly ash: (a) elemental composition; (b) oxide composition.
Applsci 15 03449 g008
Figure 9. Slump cone test results for mix #21AB: (a) from the side; (b) from the top.
Applsci 15 03449 g009
Figure 10. Selected results of the printing tests: (a) Volumes printed using #20AB; (b) Volumes printed using #21AB; (c) Underwater print.
Applsci 15 03449 g010
Figure 11. Comparison of the printing process: (a) #11AB with shape deviation; (b) #20AB showing over extrusion; (c) #20AB homogeneously extruded; (d) #21AB with good flow rate; (e) #21AB with slight sagging; (f) #21AB used for UW3dP.
Applsci 15 03449 g011
Figure 12. Compressive strength.
Applsci 15 03449 g012
Figure 13. Flexural strength.
Applsci 15 03449 g013
Figure 14. Samples: (a) 3DP samples after cutting and measuring (#20AB); (b) #20AB CBHT after 28 days; (c) Efflorescence after 14 days at #20AB CC; (d) Efflorescence at #20AB 3DPB after 14 days.
Applsci 15 03449 g014
Figure 15. Printed volume after 49 days underwater: (a) The appearance of the samples after removing the water; (b) The plate with hole after cut element; (c) The cut element with visible delamination.
Applsci 15 03449 g015
Figure 16. Comparison of the fracture surfaces after the flexural strength test: (a) #21AB—orientation 1; (b) #21AB—orientation 2; (c) #21AB—orientation 3; (d) #20AB—orientation 1; (e) #20AB—orientation 2; (f) #20AB—orientation 3.
Applsci 15 03449 g016
Figure 17. SEM images (magnification 200×): (a) #21AB casted; (b) #21AB casted, heat-treated; (c) #21AB 3D printed; (d) #20AB casted; (e) #20AB casted, heat-treated; (f) #20AB 3D printed.
Applsci 15 03449 g017
Figure 18. Analysis of microstructural details: (a) #20ABCHT, magnification 170×—removal of a sand grain; (b) #20ABCHT, magnification 200×—poor connection sand–matrix; (c) #21ABCHT, magnification 500×—pore with cracks; (d) #20AB3DP, magnification 550×—pores within the matrix; (e) #21AB3DP, magnification 1000×—pore and partially dissolved fly ash; (f) #21AB3DP, magnification 1200×—undissolved fly ash.
Applsci 15 03449 g018
Table 1. Possible additives for 3D-printing of geopolymers.
NoAdditiveFunctionSource
1Attapulgite clayThixotropic thickener; improves yield stress due to particle characteristics[29]
2Magnesium alumino silicateThixotropy enhancer[30]
3Sodium carboxymethyl starchModifies viscosity and has a retarding effect, increases water retention and setting time of the geopolymer paste[31]
4SucroseRetarder that extends the setting time[29]
5Nano grapheneInfluences workability, flowability, and shape stability[32]
6Xanthan gumImproves material adhesion, as well as extrusion and nozzle behavior[33,34]
7Silica FumeControls yield stress and viscosity; its small spherical particles enable smooth extrusion[35]
Table 2. Tested additives.
NoAdditiveDescription
1PlasticizerCommercially available admix from the company Jurga (Zbrudzewo, Polska) is used.
2Burned clayBurned clay is added to bind excess water in the mix.
3Gorkal 70High-alumina cement (Górka Cement Sp. z o.o., Trzebinia, Poland) is mainly used for refractory applications and is characterized by its high Al2O3 content and short bonding time.
4MethylcelluloseMethylcellulose (Instytut Technologii Chemicznej, Warsaw, Poland) is a commonly used thickening and gelling agent that is soluble in water.
5Xanthan gumXanthan gum (Synthetika Sp. z o.o., Łódź, Poland) is used to improve printability and rheology.
6Sealing additive
(Waterproof)
Supports setting underwater; a sealing additive from the company Jurga (Jurga Sp. k., Zbrudzewo, Poland) is utilized. It is present in liquid form.
Table 3. Proportions of the alkaline solution.
ConstituentNaOHH2OWaterglass
Mass [g]62820004900
Vol. [%]8.3426.5765.09
Table 4. Samples designation.
NoDesignationFly Ash [g]Sand [g]Plasticizer [g]Burned Clay [g]Gorkal 70 [g]Metylocellulose [g]Xantan Gum [g]Sealing Additive
(Waterproof) [g]
Solution [g]Additional Water [g]
1#2AB400400------------------196---
2#3AB3503500.28---------------171.5---
3#4AB3503500.56------------8.73171.5---
4#5AB3503500.28------------8.6160.6---
5#6AB2502500.20---100------6.17155---
6#7AB1001000.20------30---2.4665---
7#8AB250250------6015---7.2150---
8#9AB300030002.50---600120---83.41922---
9#10AB2502500.218151515---6.81140---
10#11AB400052505.5115340115---108.42231---
11#12AB3503500.28---30---218.75390---
12#13AB200020002.00---200---150---2750---
13#14AB3003000.24---30---9---250---
14#15AB300030003.00---300---150---3500---
15#16AB400040004.00---160---320---42001000
16#17AB400050004.50---------180---30001500
17#20AB300037503.38---------135---22301000
18#21AB400040004.00---------1301003650---
Table 5. CAD model dimensions.
VolumeWidth [mm]Length [mm]Height [mm]
A18018050
B12028070
C20018050
D10020050
Table 6. Slicing parameters and their values.
NoParameterValue
1Layer Height10 mm
2Line Width20 mm
3Infill Line Width20 mm
4Wall line Count0
5Top/Bottom Thickness10 mm
6Top/Bottom Layers0
7Infill Density100%
8Infill PatternZig Zag [90,90]
9Infill Layer Thickness10 mm
10Print Speed60 mm/s
11Build Plate Adhesionnone
Table 7. Particle size analysis.
Raw Material 1D10 [µm]D50 [µm]D90 [µm]Mean Size [µm]Span
Sand196.794382.365489.673422.6620.766
Fly ash2.86718.82057.53126.6922.907
1 Average for 3 measurements.
Table 8. Evaluation of used additives.
NoAdditiveEffect and ContentSuitability to 3D Printing
1PlasticizerAfter addition, a significantly more resistance-free flow behavior is observed in the paste.
Proportions from 0.04 to 0.1% are tested. The best results are achieved with an addition of 0.05%.
Yes
2Burned clayAn attempt is made to add 1.24 to 3% of burnt clay, but no improvement in the properties can be observed at any proportion.No
3Gorkal 70Between 2 and 20% of Gorkal70 is added. This leads to a significant increase in viscosity and good test results. However, for over 7% added, the effect continued to increase over time, resulting in insufficient workability and the extrusion stopped. Best values seemed to be around 3 to 4%, though significantly more liquid is needed to achieve the desired consistencyYes, in small quantities or with fast processing time
4MethylcelluloseAdding 1.25 to 14% methylcellulose decreases the extrusion properties but considerably accelerates hardening. Although an addition of 3% achieved good results, the additive is unsuitable due to its large particle size. Partial
5Xanthan gumThe addition of 1.5 to 3% results in a strong cohesion in the material and a viscous behavior. By adding solution, the paste becomes extrudable and still retains its shape after extrusion. Significantly more liquid is needed to achieve the desired consistency. Values around 2% provide the best results.Yes
6Sealing additive (waterproof)The sealing additive is added in the amount recommended by the manufacturer (1.23%) and improves the hardening of the paste under water. Although samples to which the additive is added harden more quickly, the strength is not sufficient for mechanical tests after 28 daysPartial
(UW3DP)
Disclaimer/Publisher’s Note: The statements, opinions and data contained in all publications are solely those of the individual author(s) and contributor(s) and not of MDPI and/or the editor(s). MDPI and/or the editor(s) disclaim responsibility for any injury to people or property resulting from any ideas, methods, instructions or products referred to in the content.

