

Research on the Aerodynamic–Propulsion Coupling Characteristics of a Distributed Propulsion System


Abstract
:1. Introduction
2. Materials and Methods
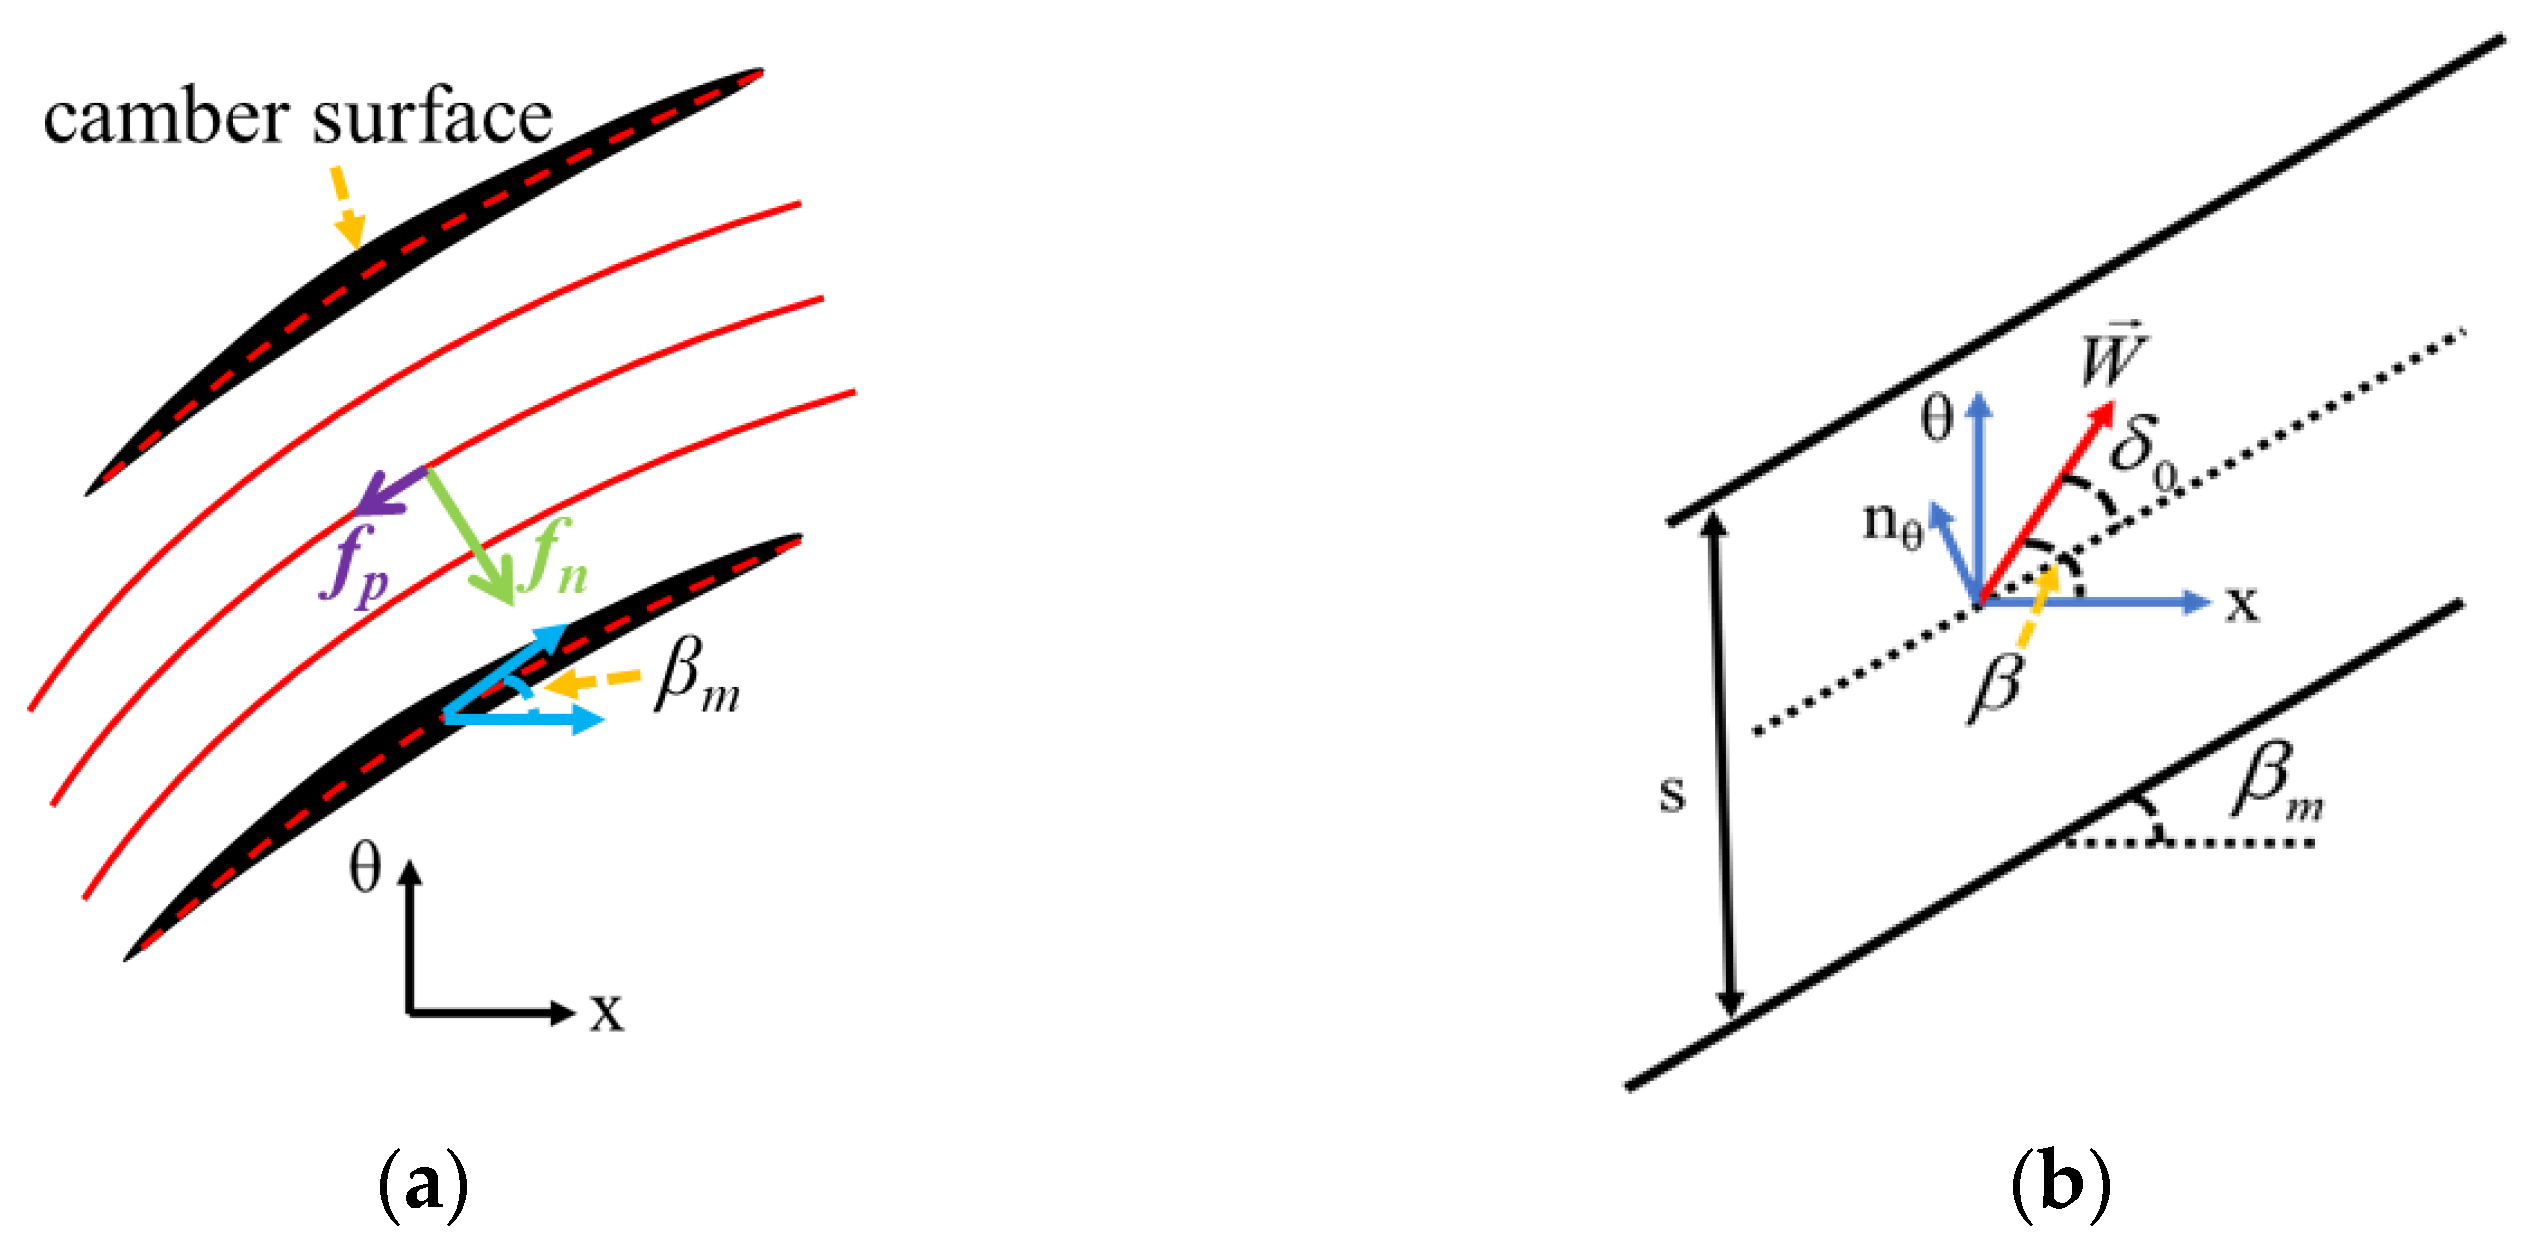
2.1. Development of Body Force Model
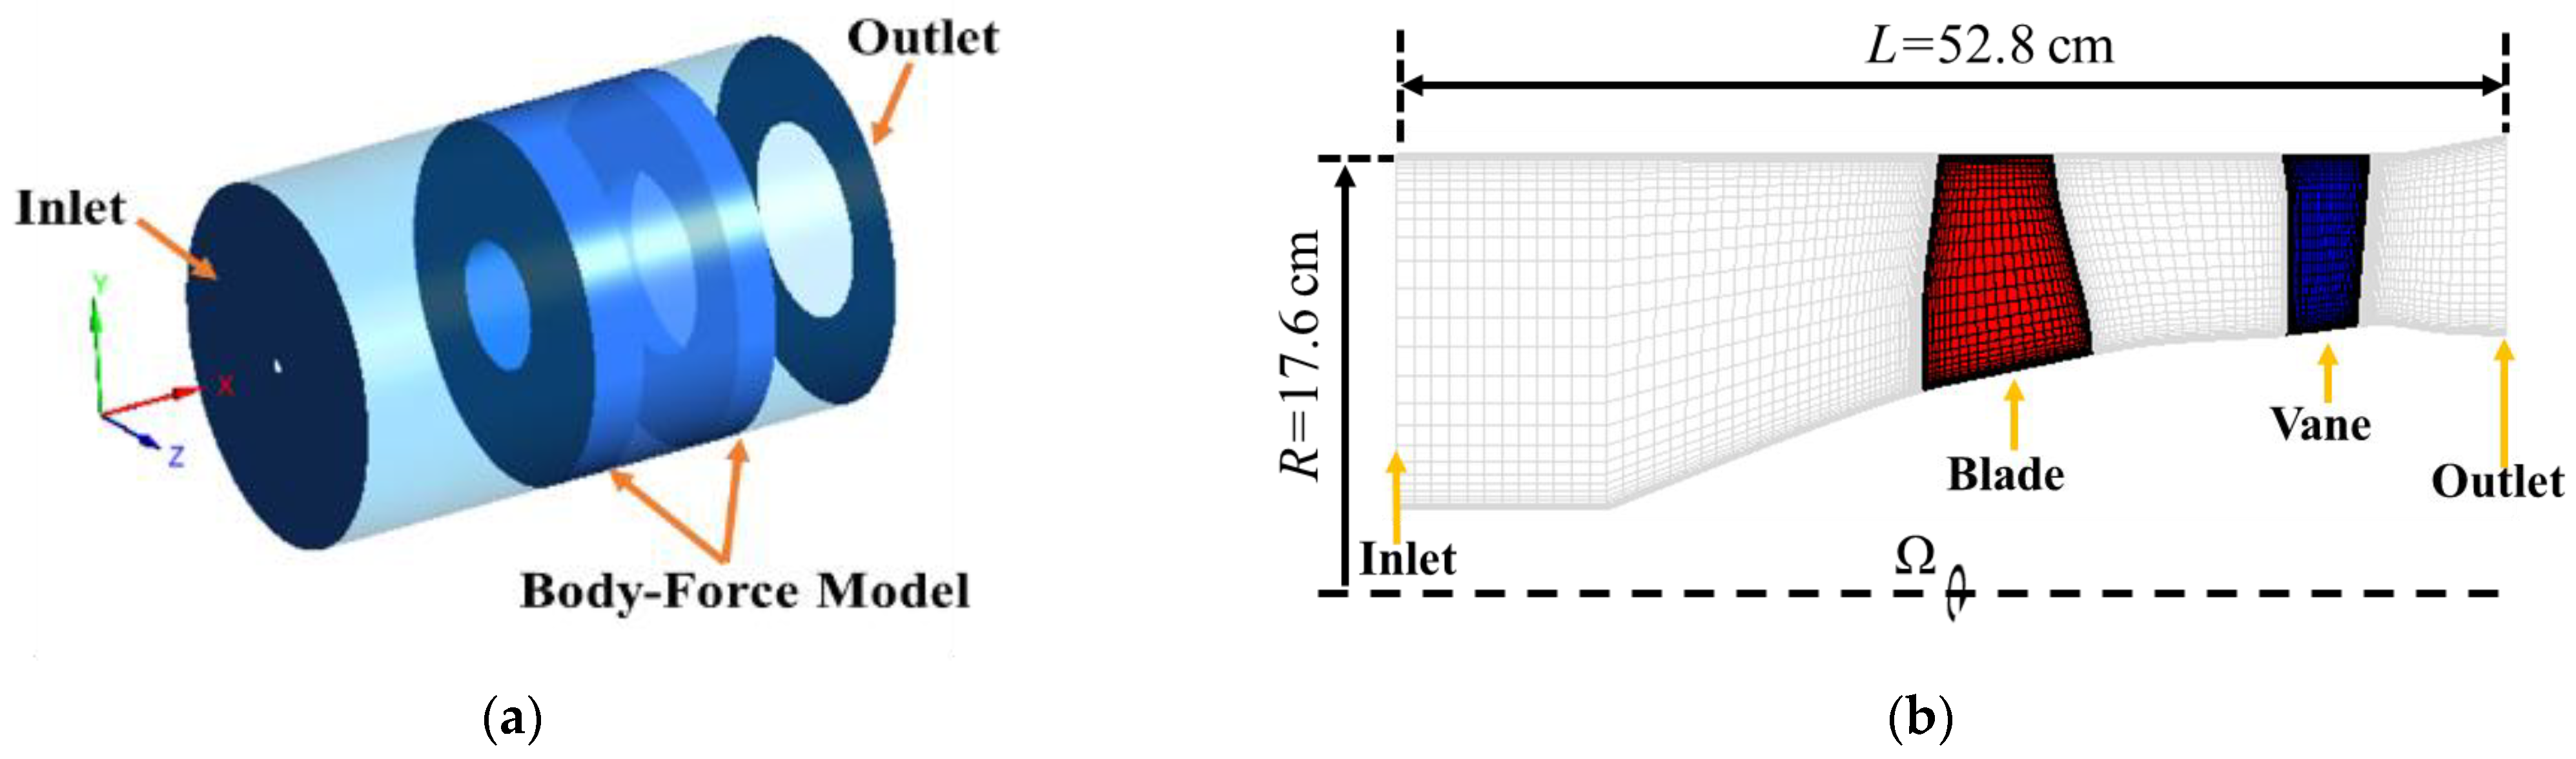
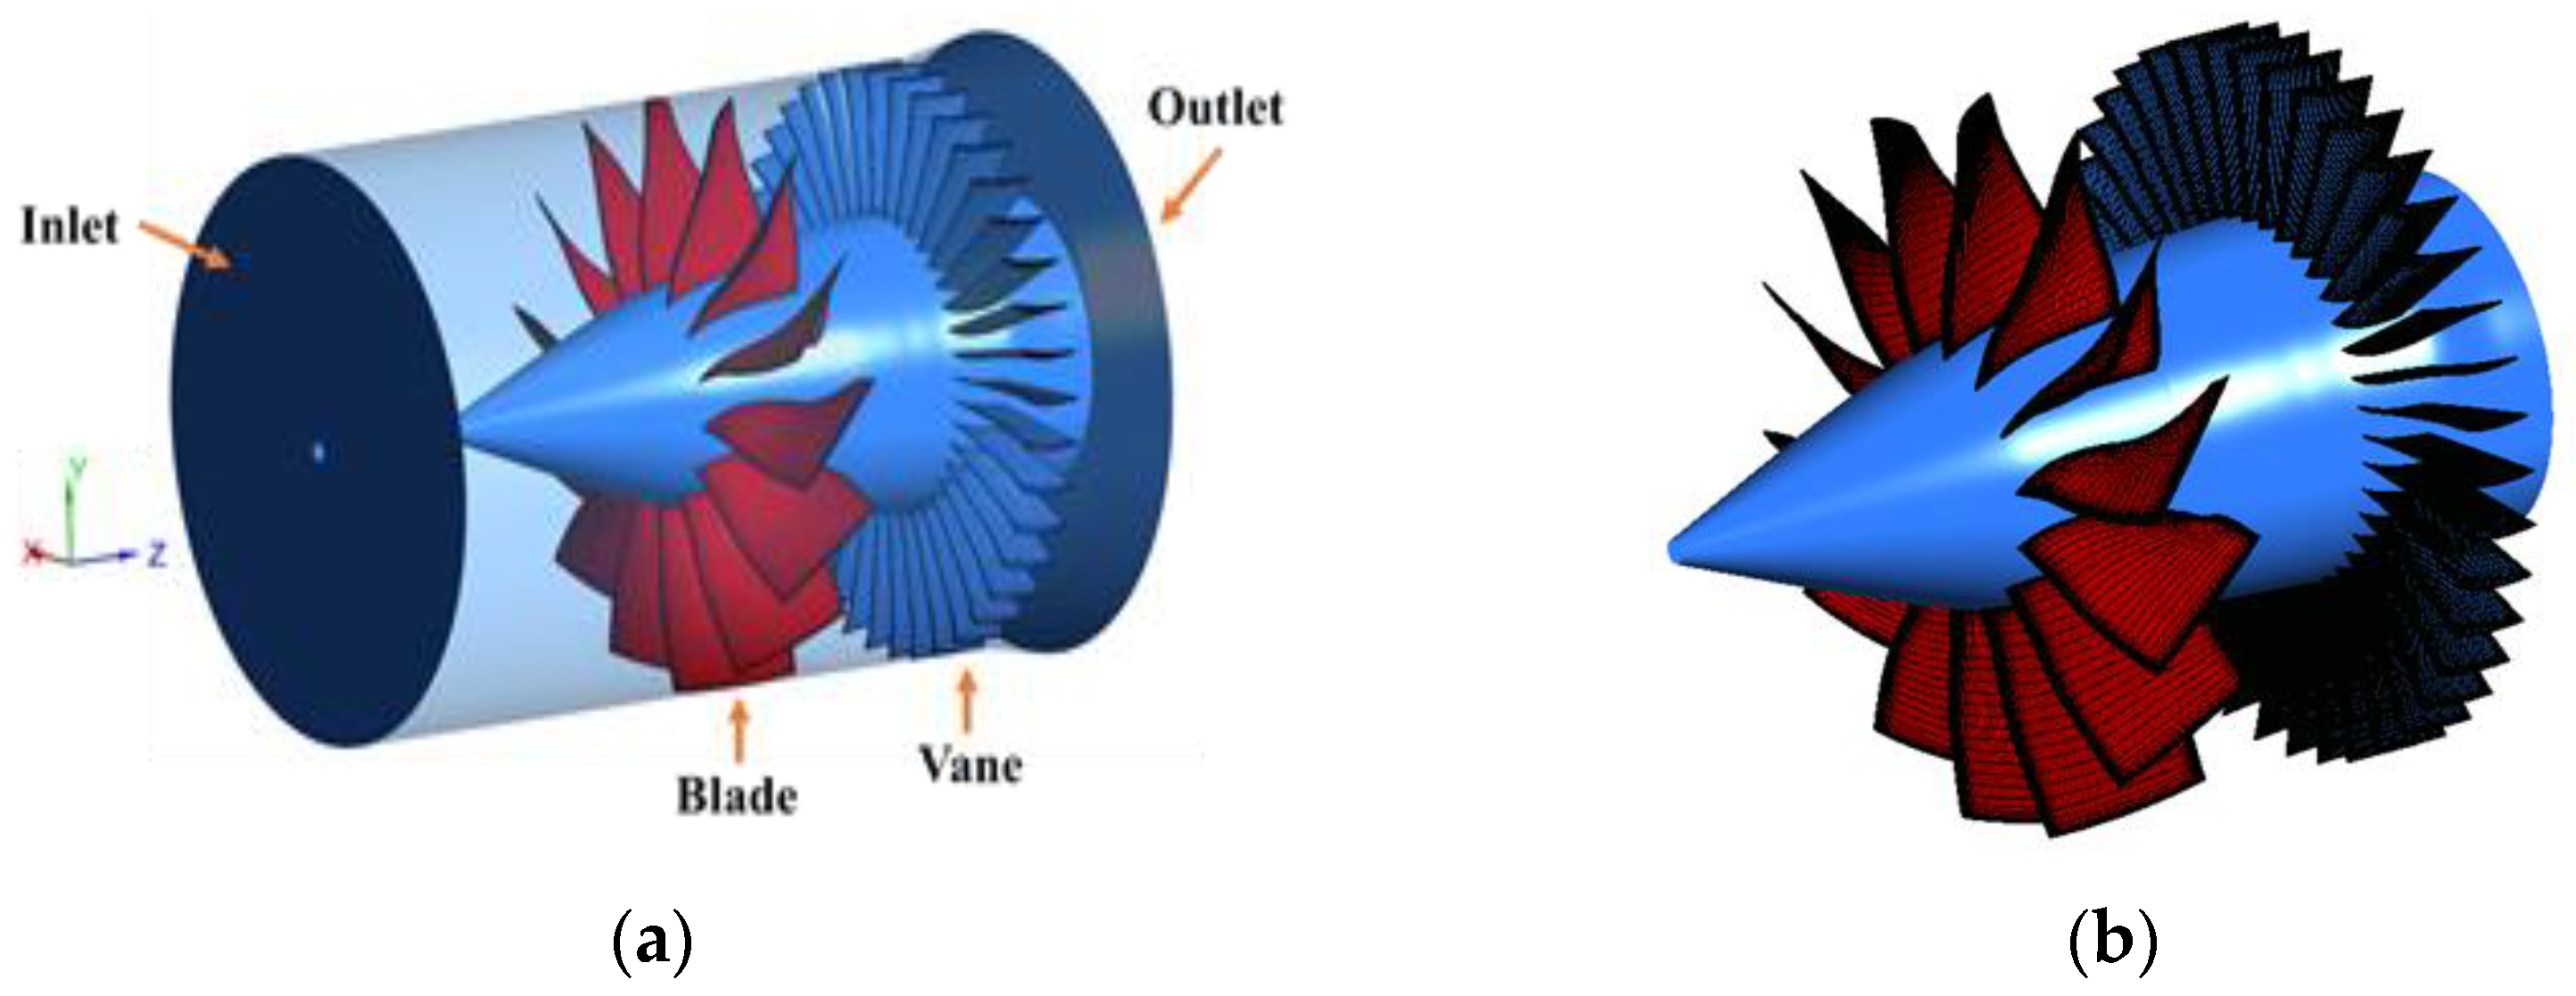
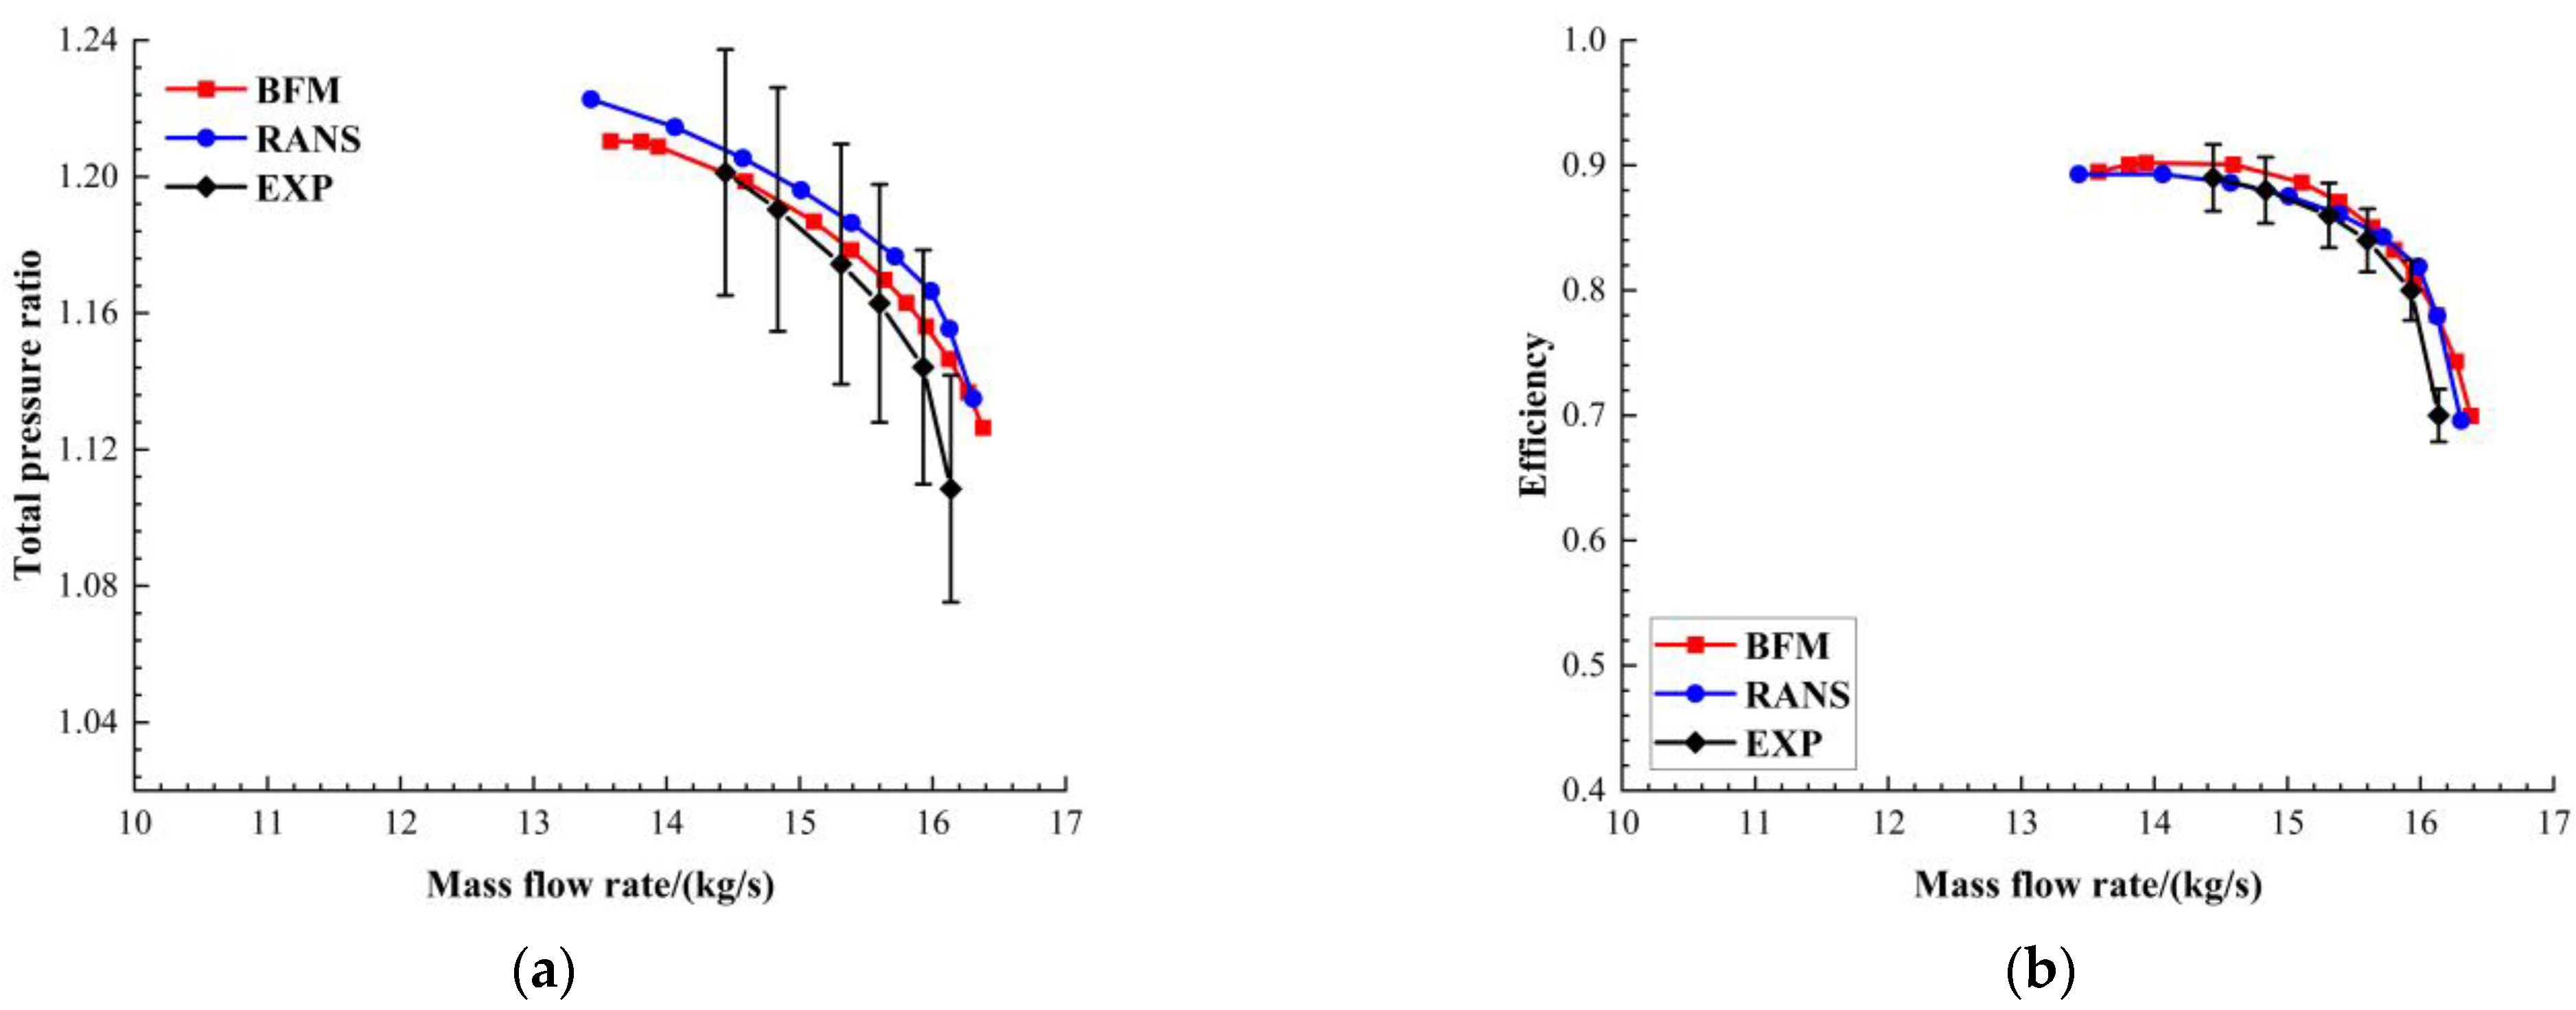
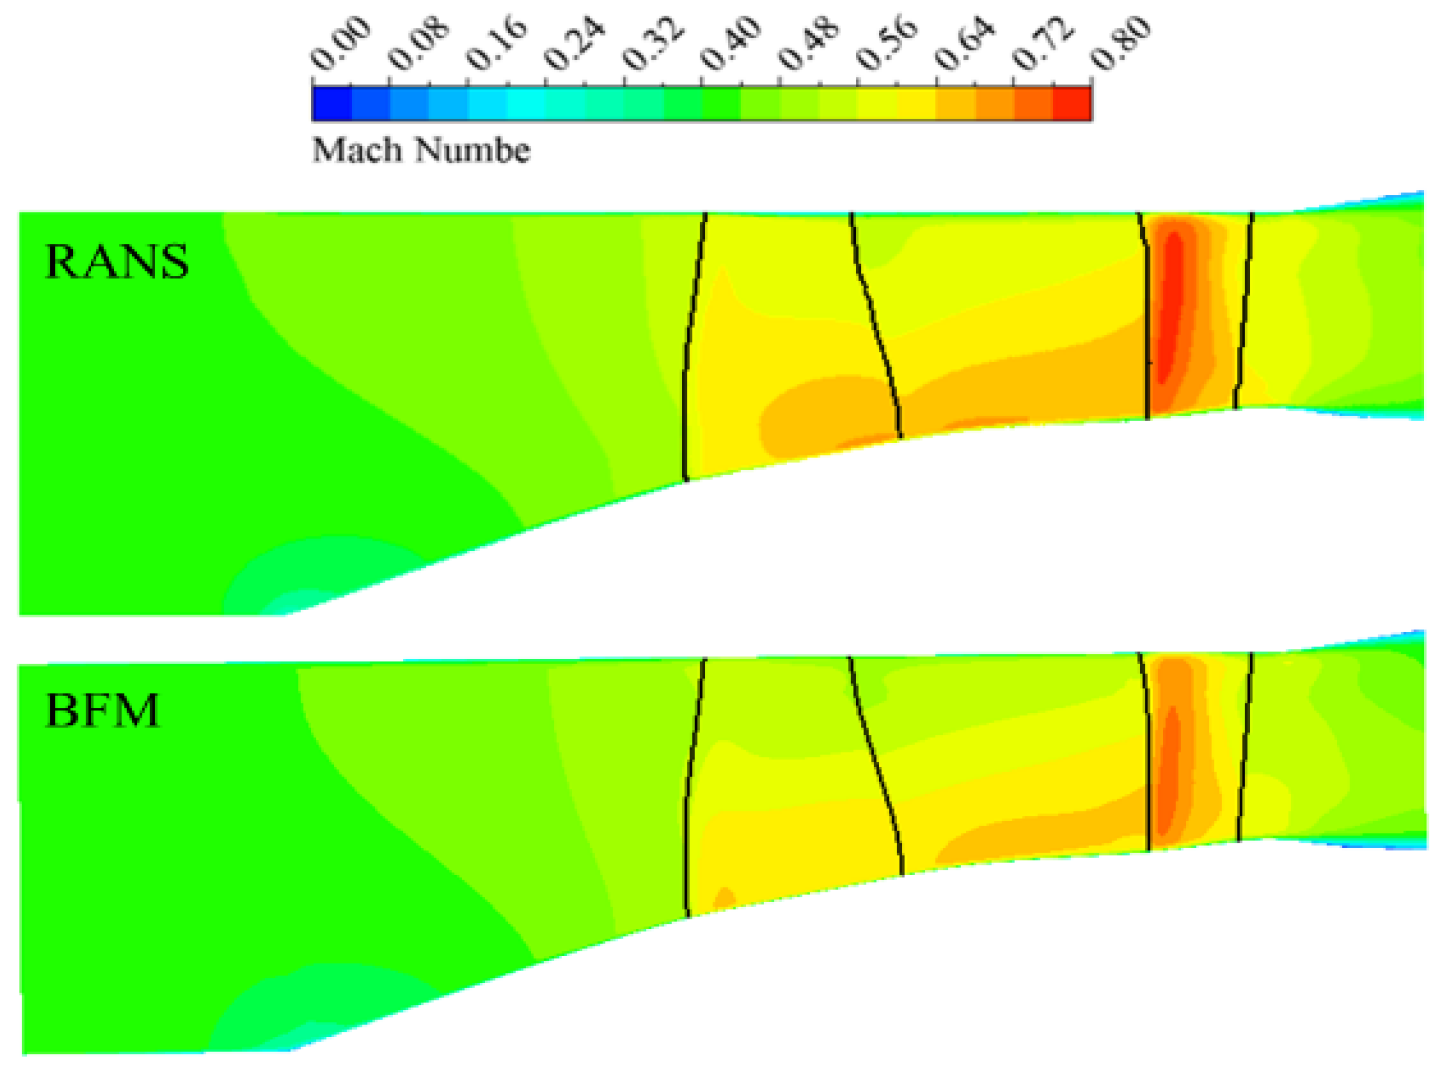
2.2. Validation of Body Force Model
3. Numerical Method Validation and Grid Independence Validation
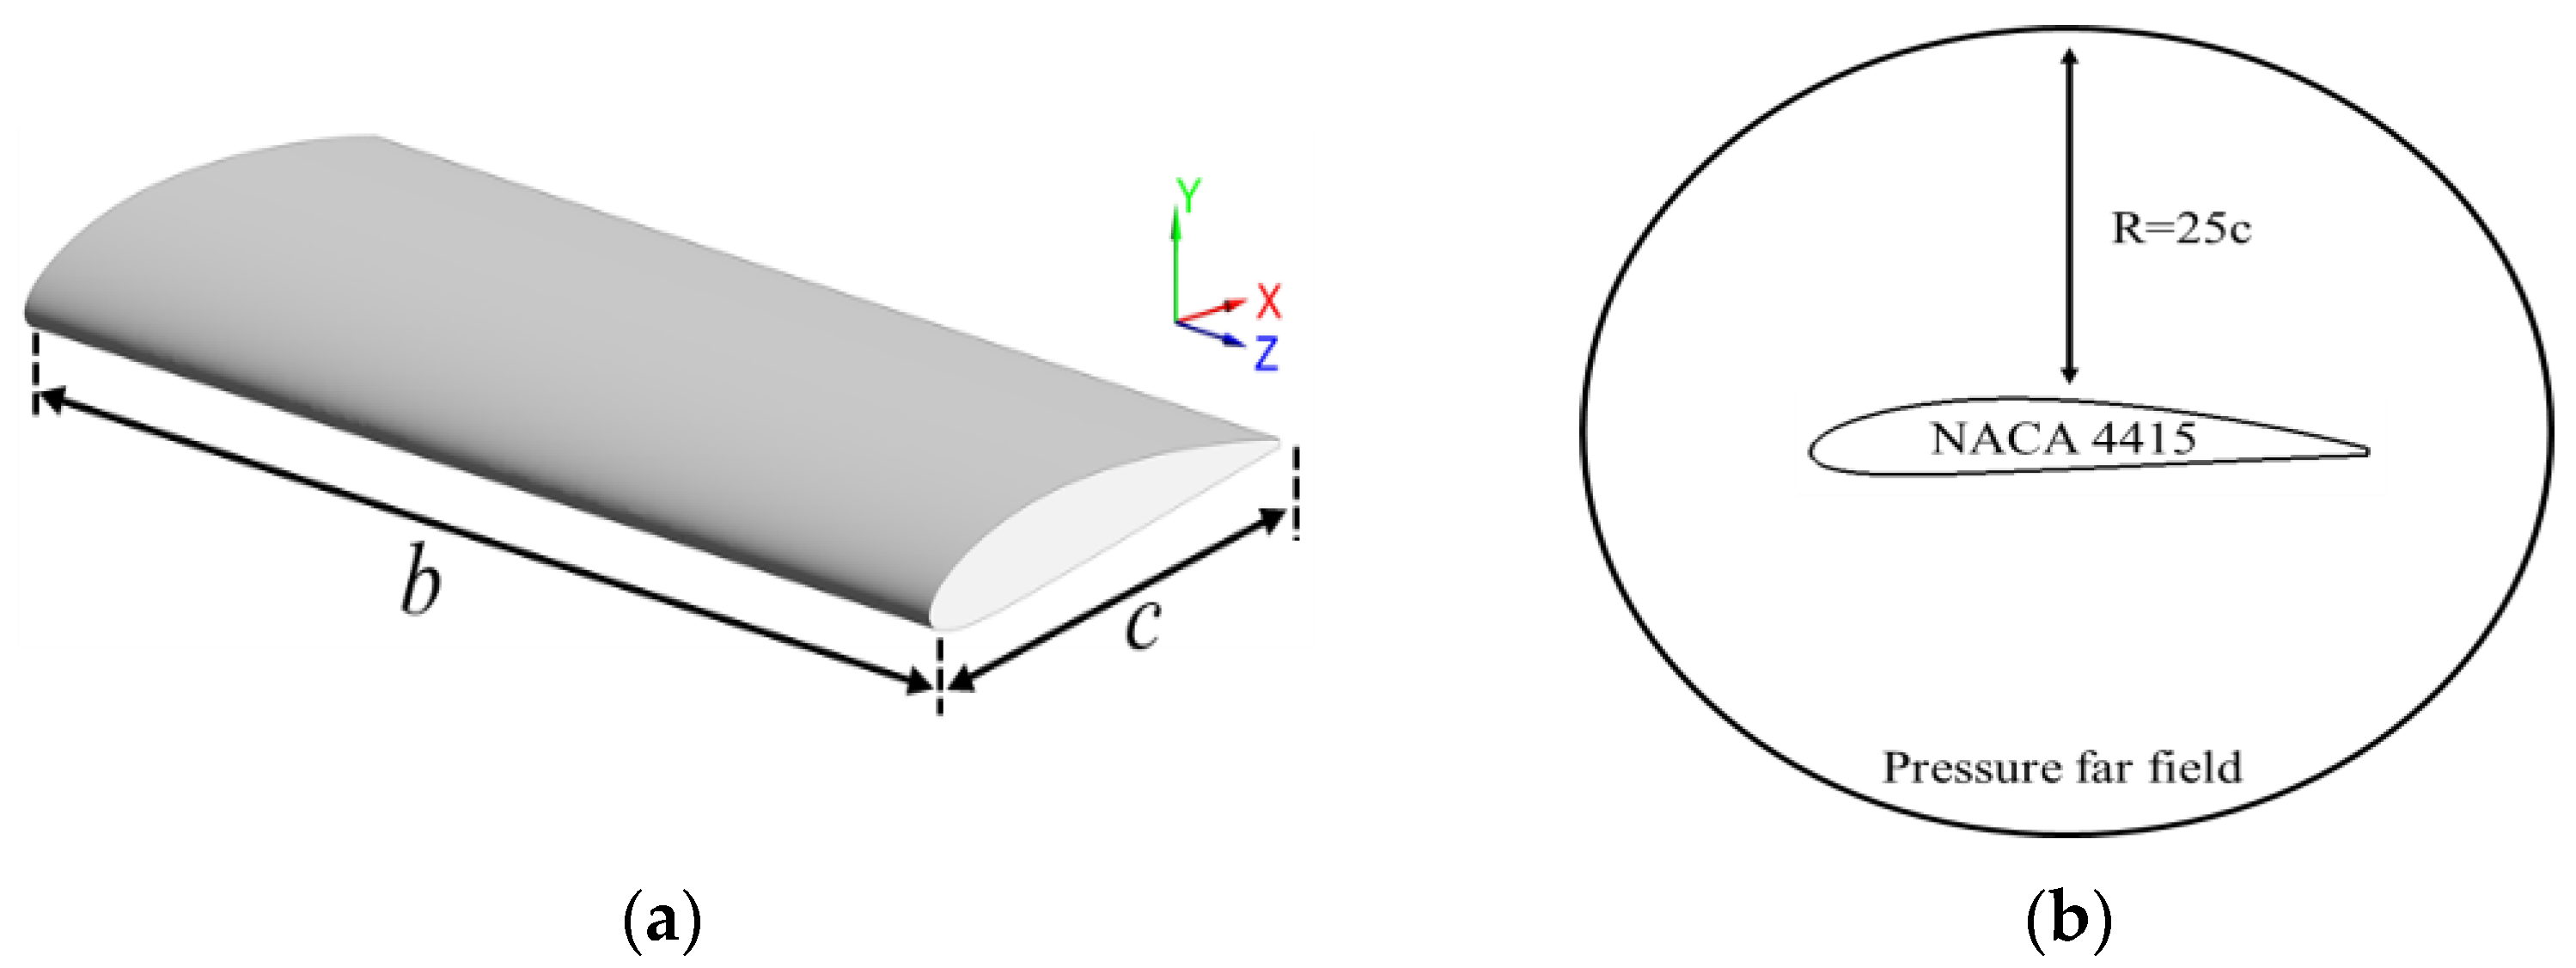
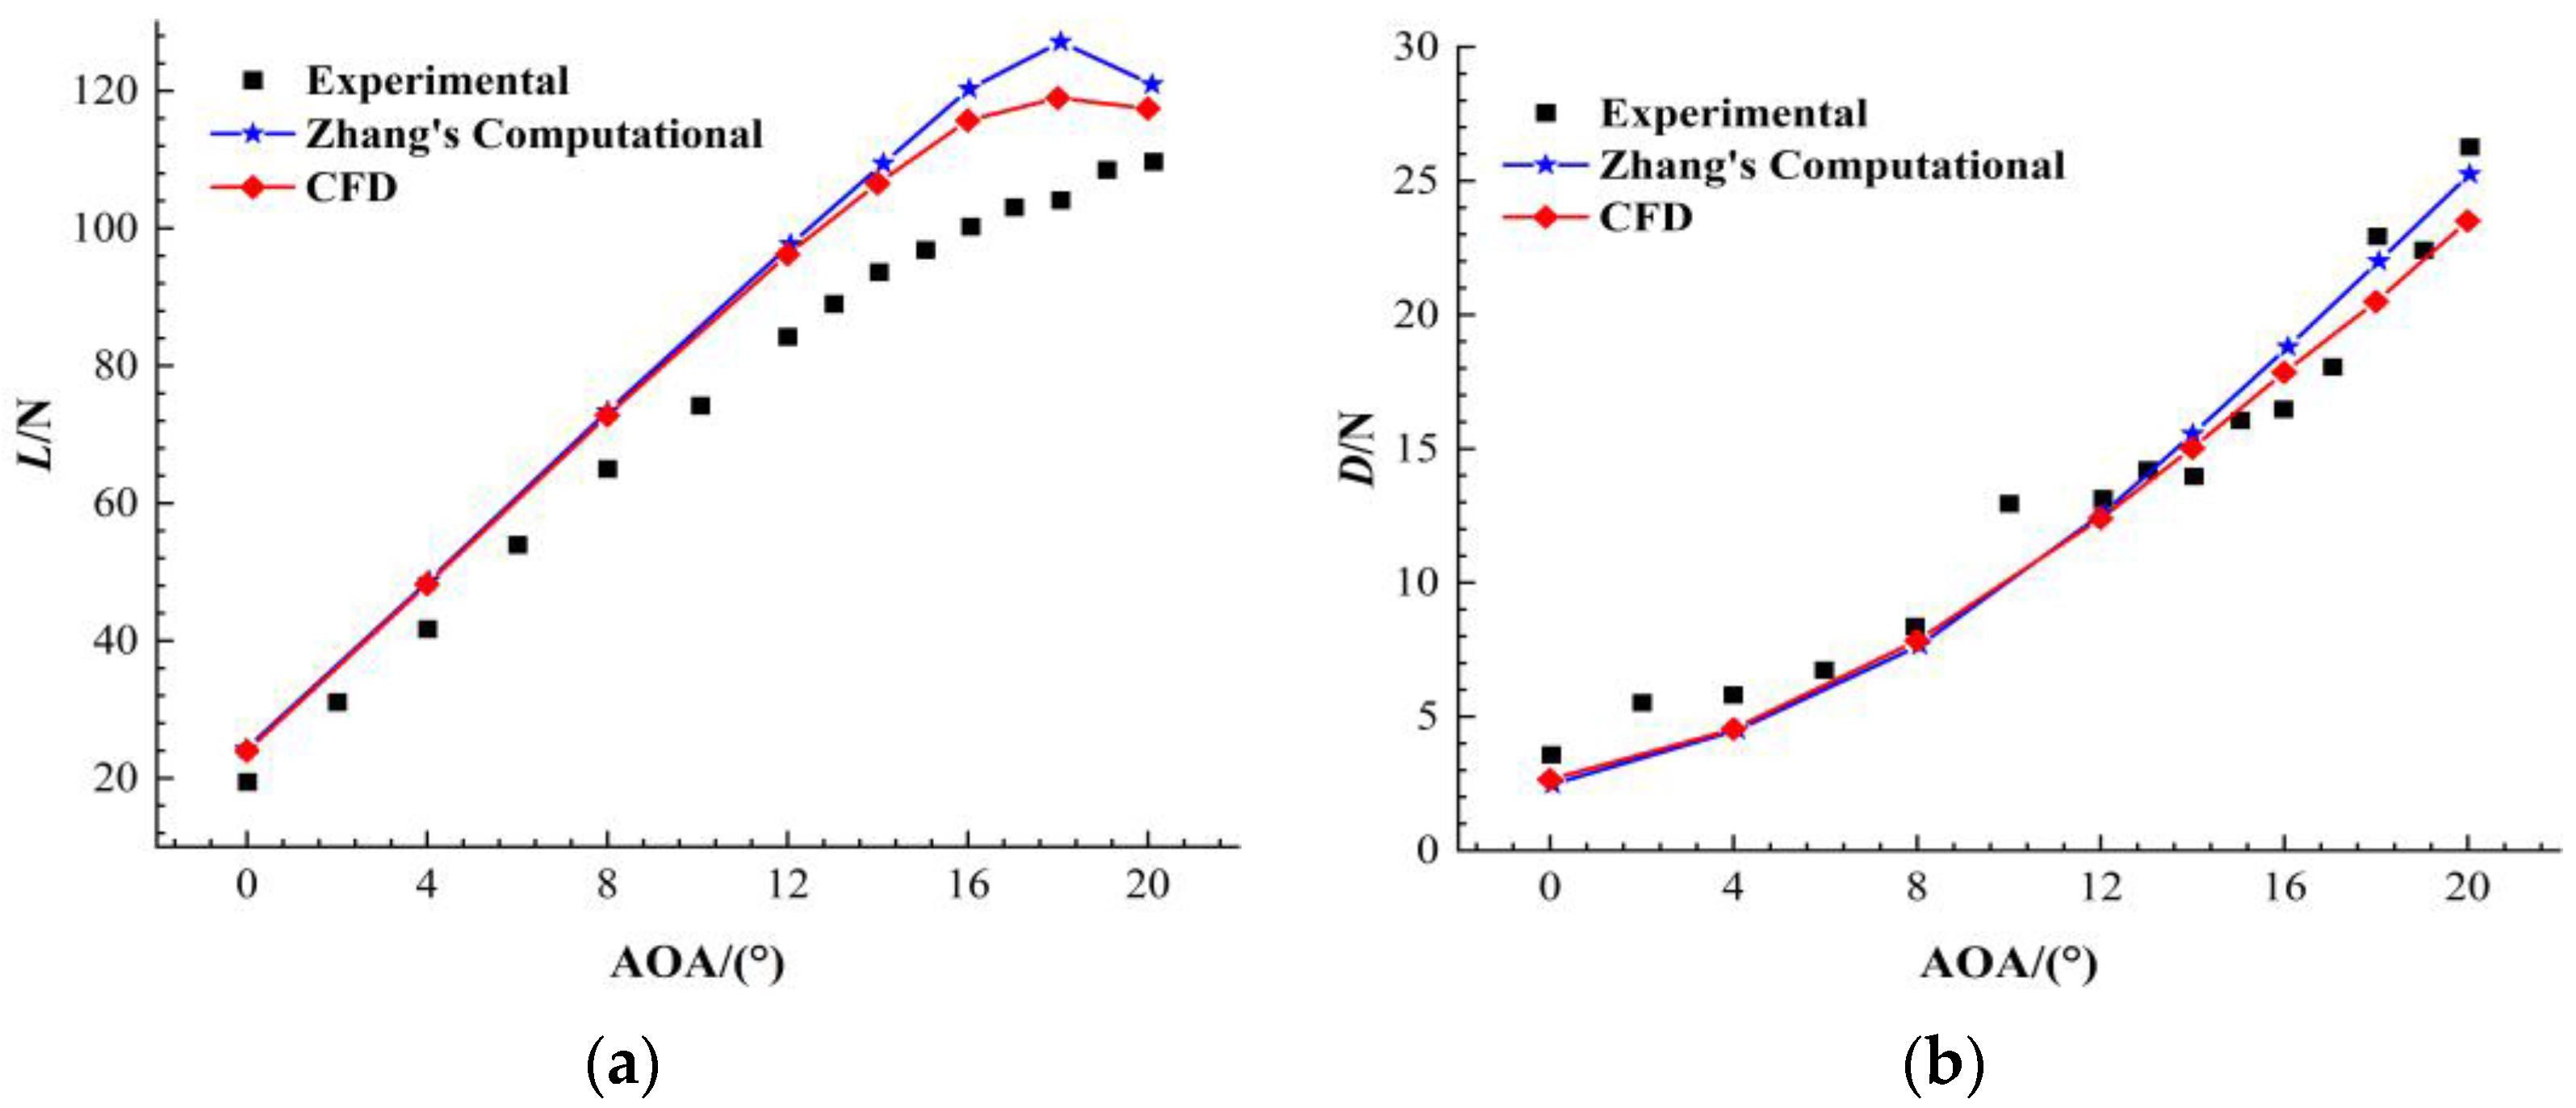
3.1. Validation of Numerical Method
3.2. Grid Independence Verification
4. Results and Discussion
4.1. Wing Aerodynamic Performance
4.2. Influence of the Internal and External Flow Coupling Effect on the Performance of Ducted Fans
4.3. Intake Distortion of Ducted Fans
5. Conclusions
- (1)
- The higher the flight Mach number is, the greater the lift obtained by the wing is. When the Mach number is 0.5, the maximum lift coefficient of the wing increases by 306% compared with that at a Mach number of 0.2. However, the stall angle of attack of the wing during flight decreases as the flight Mach number increases. Under flight Mach numbers ranging from 0.2 to 0.5, the corresponding stall angles of attack are 38°, 32°, 26°, and 23°, respectively. The stall angle of attack at a Mach number of 0.5 decreases by 15° compared with that at a Mach number of 0.2.
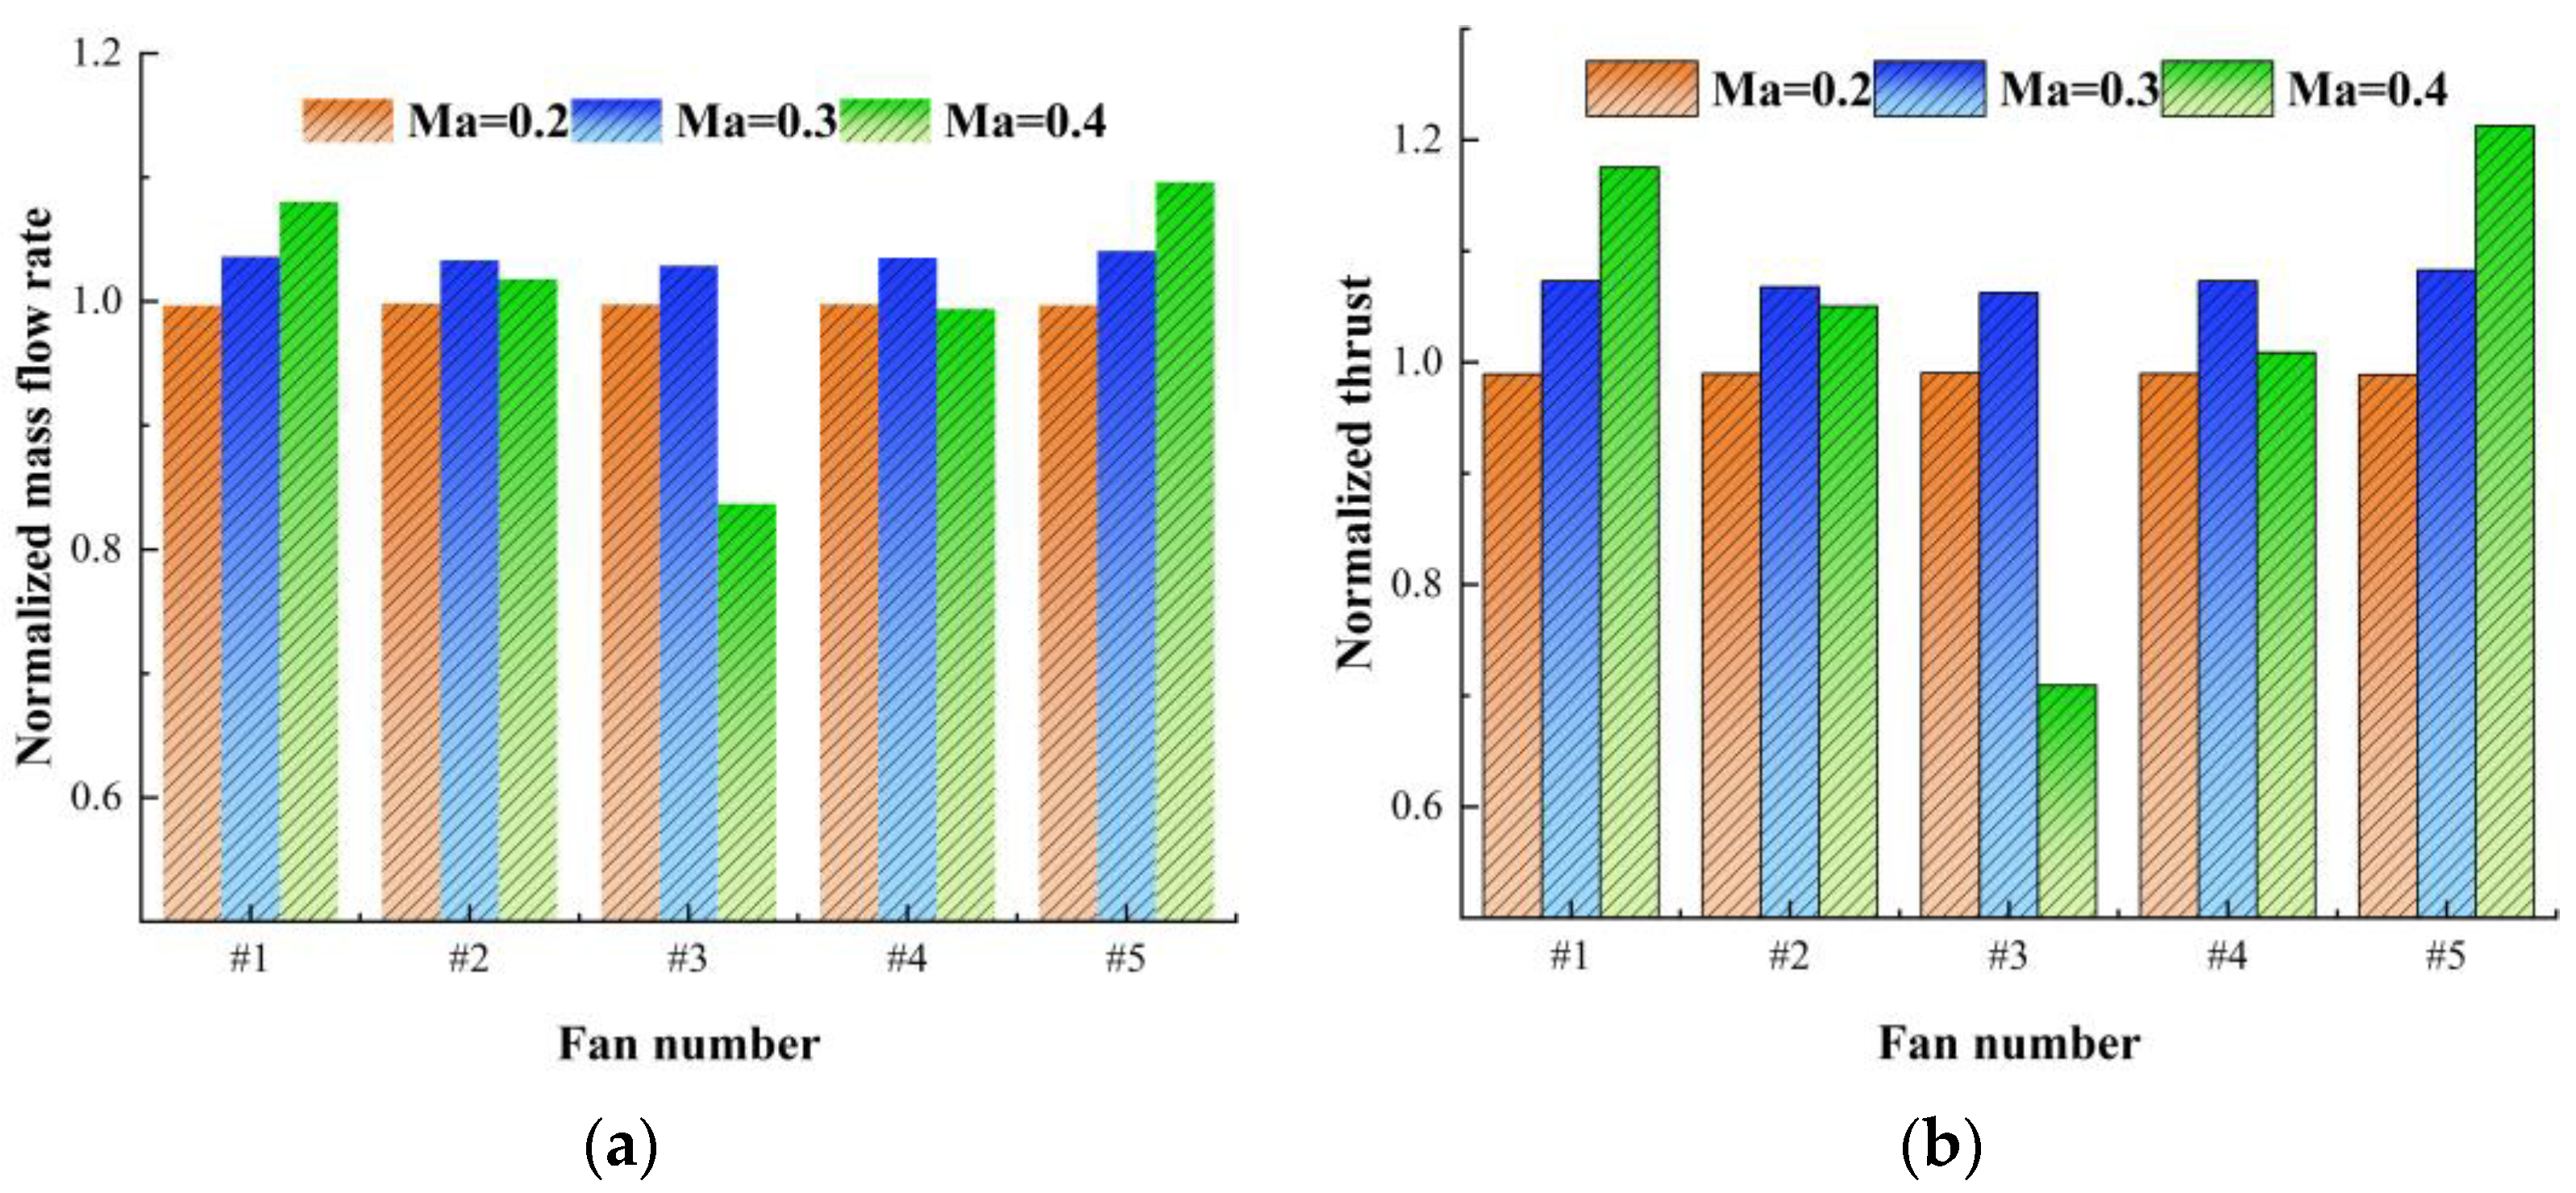
- (2)
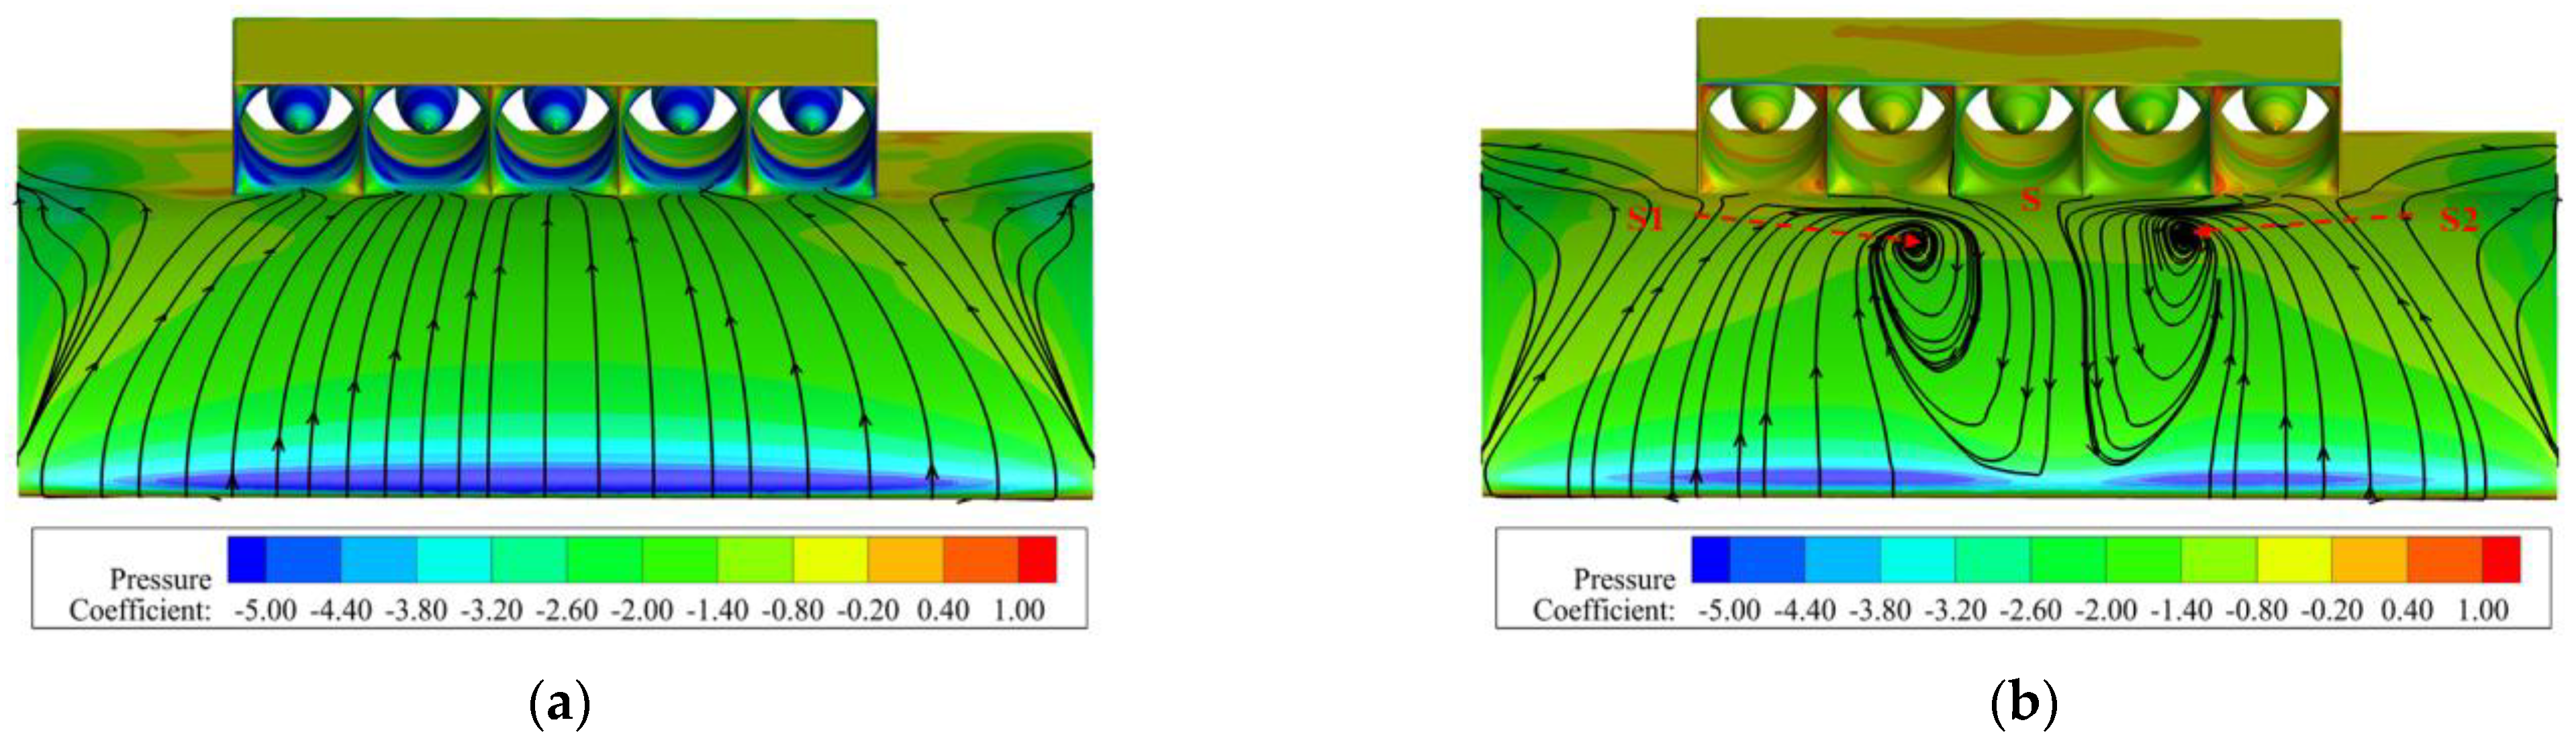
- Fans #1 and #5 have the strongest ability to resist airflow separation, while fan #3 has the weakest ability. When the angle of attack is 26°, the mass flow rate and thrust of fans #1 and #5 increase with the increase in the flight Mach number. However, when the Mach number is 0.4, the mass flow rate and thrust of fan #3 decrease significantly. Compared with those at a Mach number of 0.2, the mass flow rate and thrust of fan #3 decrease by 16% and 28%, respectively.
- (3)
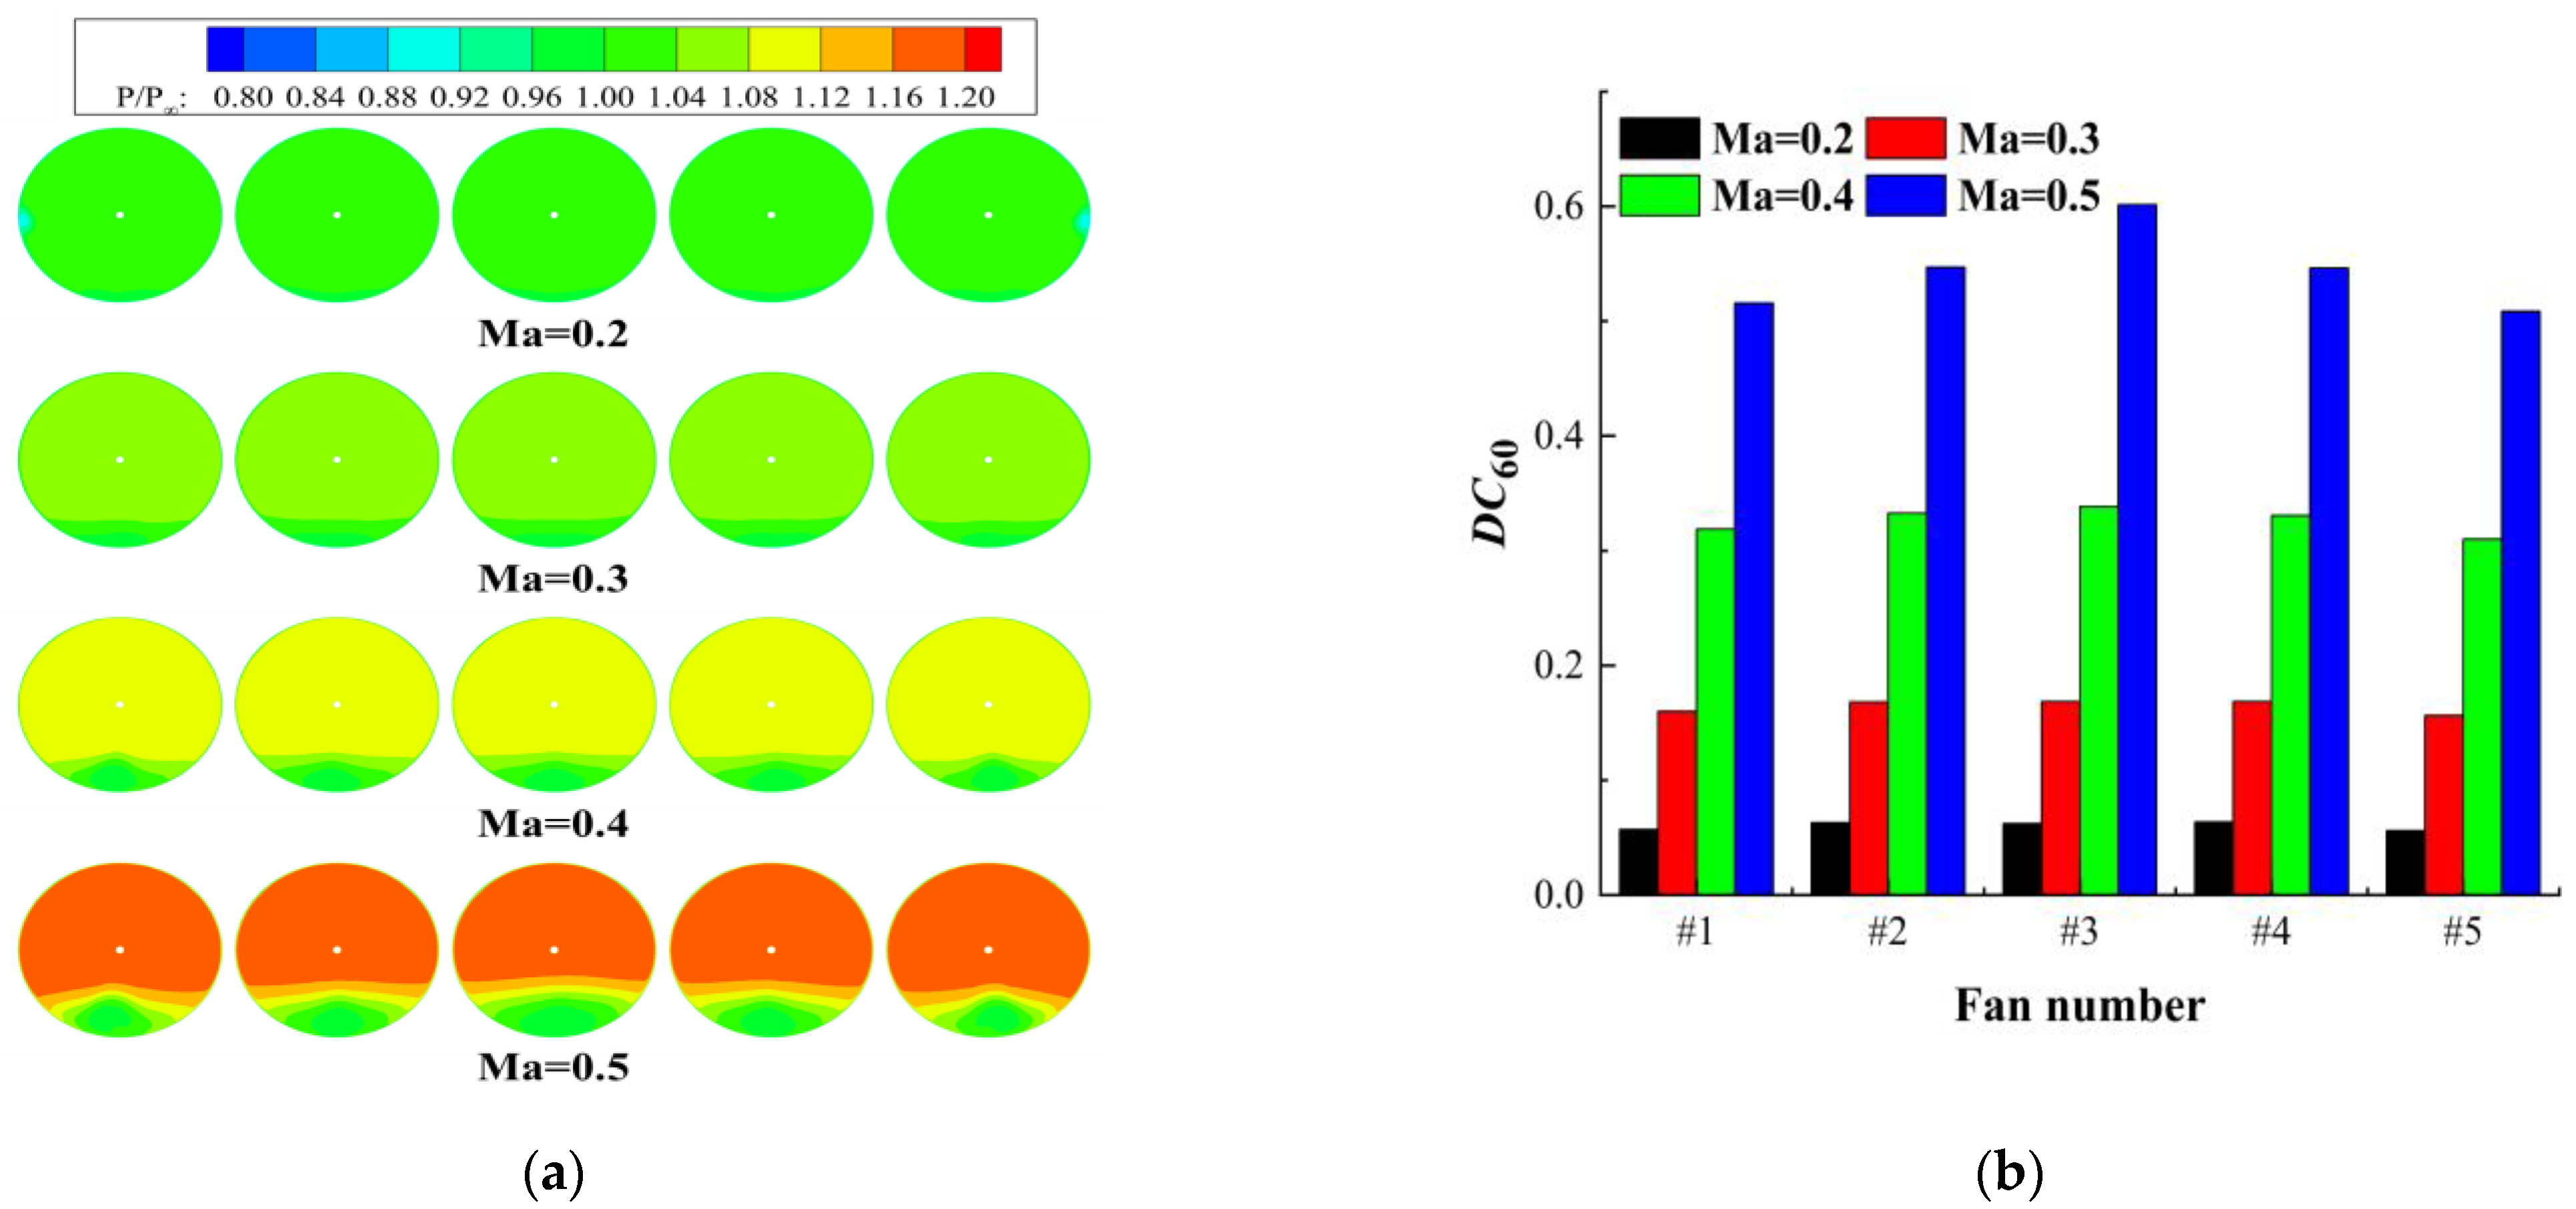
- The higher the flight Mach number is, the greater the degree of intake distortion of the ducted fans is. For total pressure distortion, as the Mach number increases, fan #3 is the most affected by total pressure distortion, followed by fans #2 and #4, and fans #1 and #5 are the least affected by total pressure distortion. For swirl distortion, as the Mach number increases, fans #1 and #5 are the most affected by swirl distortion, followed by fans #2 and #4, and fan #3 is the least affected by swirl distortion.
- (4)
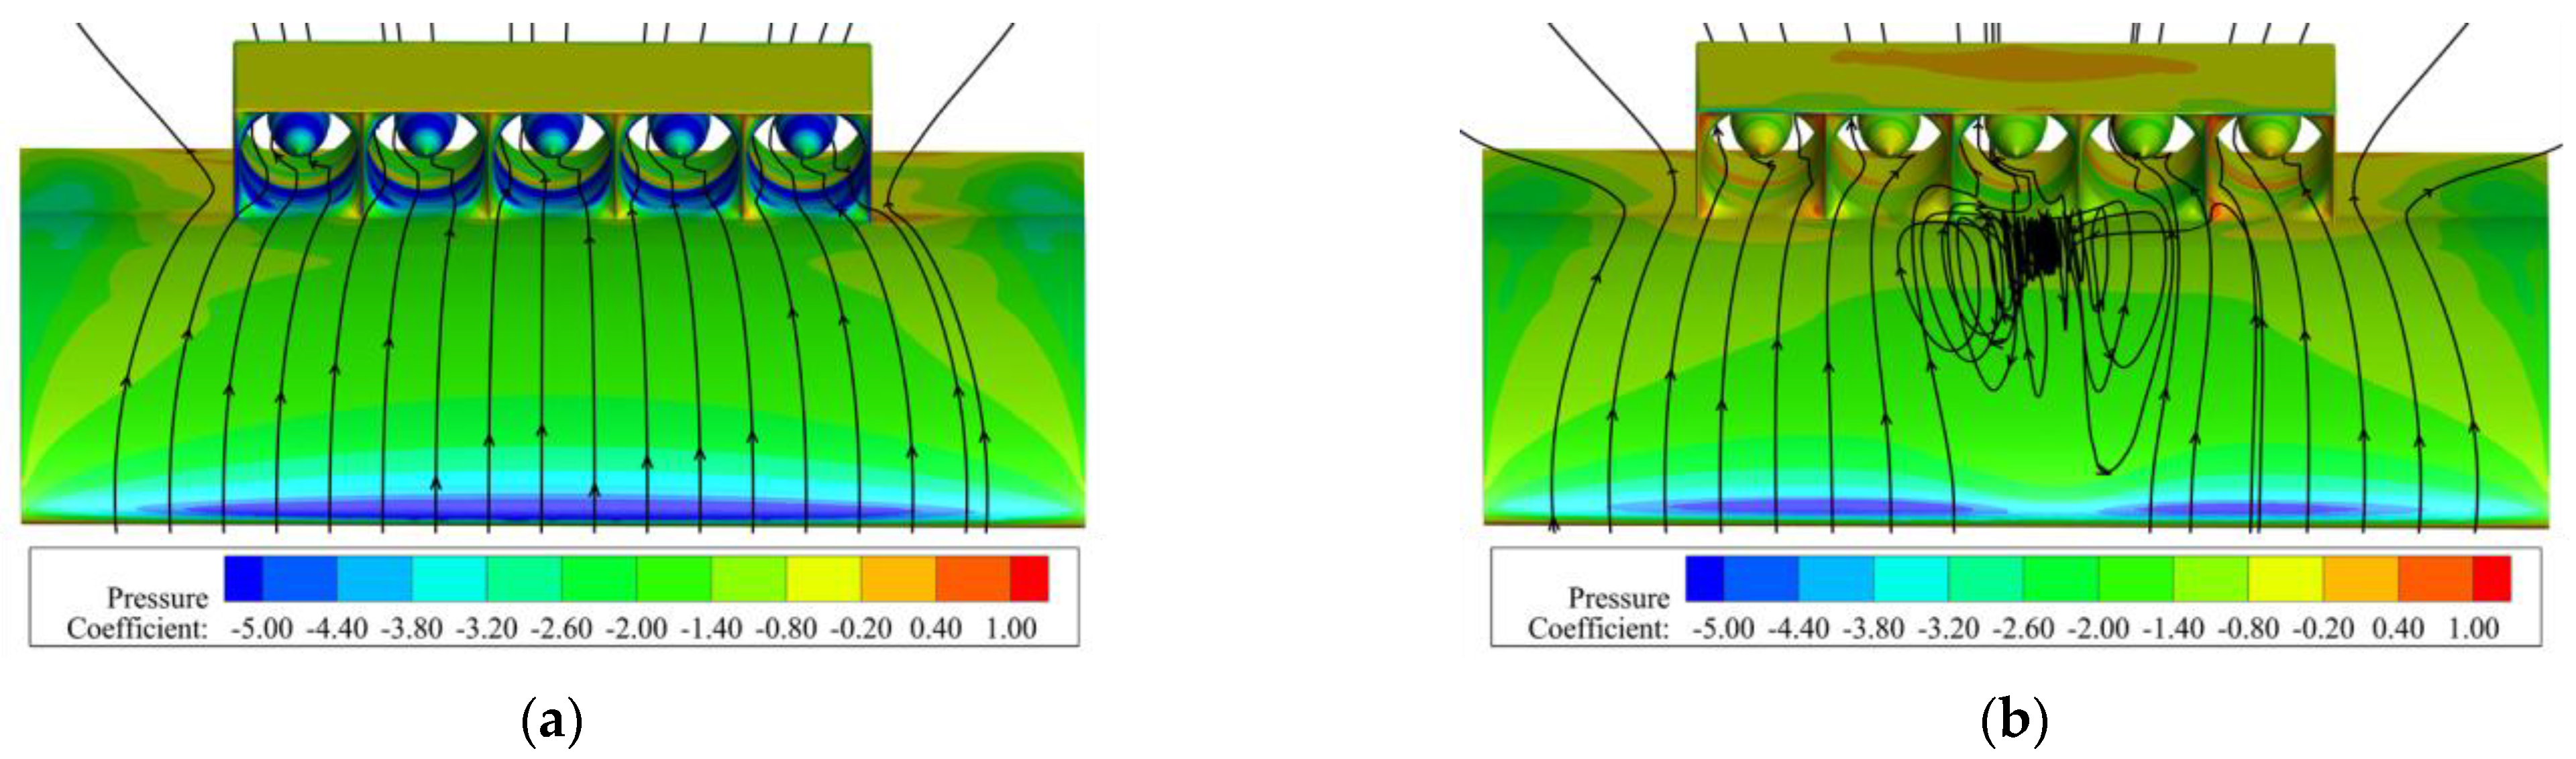
- For the configuration studied in this paper, the fan located in the middle of the ducted fan array is most sensitive to changes in the angle of attack and the incoming flow velocity. At large angles of attack or high incoming velocities, the performance of the middle fan is significantly reduced. However, the edge fans are less affected by the incoming flow and exhibit a relatively stable aerodynamic performance.
Author Contributions
Funding
Institutional Review Board Statement
Informed Consent Statement
Data Availability Statement
Conflicts of Interest
References
- Ashcraft, S.W.; Padron, A.S.; Pascioni, K.A.; Stout, G.W.; Huff, D.L. Review of Propulsion Technologies for N+3 Subsonic Vehicle Concepts; National Aeronautics and Space Administration, Rep. Glenn Research Center: Cleveland, OH, USA, 2011. [Google Scholar]
- Davies, K.; Norman, P.; Jones, C.; Galloway, S.; Husband, M. A review of turboelectric distributed propulsion technologies for N+3 aircraft electrical systems. In Proceedings of the 2013 48th International Universities’ Power Engineering Conference, Dublin, Ireland, 2–5 September 2014. [Google Scholar]
- Wu, G.H.; Zhang, Z.X.; Wang, Z.B.; Miao, Q.; Wang, N.; Zhang, Y.W.; Chang, S.; Jia, K. Green and low-carbon development of aviation manufacturing industry. Strat. Stud. CAE 2023, 25, 157–164. [Google Scholar] [CrossRef]
- Sahoo, S.; Zhao, X.; Kyprianidis, K. A review of concepts, benefits, and challenges for future electrical propulsion-based aircraft. Aerospace 2020, 7, 44. [Google Scholar] [CrossRef]
- Gohardani, A.S.; Doulgeris, G.; Singh, R. Challenges of future aircraft propulsion: A review of distributed propulsion technology and its potential application for the all electric commercial aircraft. Prog. Aerosp. Sci. 2011, 47, 369–391. [Google Scholar] [CrossRef]
- Kim, H.D.; Perry, A.T.; Ansell, P.J. A review of distributed electric propulsion concepts for air vehicle technology. In Proceedings of the 2018 AIAA/IEEE Electric Aircraft Technologies Symposium, Cincinnati, OH, USA, 9–11 July 2018. [Google Scholar]
- Brelje, B.J.; Martins, J.R.R.A. Electric, hybrid, and turboelectric fixed-wing aircraft: A review of concepts, models, and design approaches. Prog. Aerosp. Sci. 2019, 104, 1–19. [Google Scholar] [CrossRef]
- Kim, H.D. Distributed propulsion vehicles. In Proceedings of the 27th International Congress of the Aeronautical Sciences, Nice, France, 19–24 September 2010. [Google Scholar]
- Fard, M.T.; He, J.B.; Huang, H.; Cao, Y. Aircraft distributed electric propulsion technologies—A review. IEEE Trans. Transp. Electrific. 2022, 8, 4067–4090. [Google Scholar] [CrossRef]
- Zhang, X.Y.; Zhang, W.; Li, W.L.; Zhang, X.B.; Lei, T. Experimental research on aero-propulsion coupling characteristics of a distributed electric propulsion aircraft. Chin. J. Aeronaut. 2023, 36, 201–212. [Google Scholar] [CrossRef]
- Perry, A.T. The Effects of Aero-Propulsive Coupling on Aircraft with Distributed Propulsion Systems. Ph.D. Thesis, University of Illinois at Urbana-Champaign, Champaign, IL, USA, 2020. [Google Scholar]
- Cui, R.; Pan, T.Y.; Li, Q.S.; Zhang, J. Numerical investigation on the effects of boundary layer ingestion on aerodynamic performance of distributed propulsion system. J. Aerosp. Power 2018, 33, 1076–10830. [Google Scholar] [CrossRef]
- Xu, D.; Xu, X.P.; Xia, J.Y.; Zhou, Z. Aerodynamic-propulsion coupling characteristics of distributed electric propulsion system. J. Aerosp. Power 2023, 39, 188–203. [Google Scholar] [CrossRef]
- Gong, T.Y.; Yuan, W. Mechanism of internal/external flow coupling effects on the performance of distributed ducted fan. J. Aerosp. Power 2021, 36, 592–605. [Google Scholar] [CrossRef]
- Zhou, F.; Wang, Y.G.; Wang, S.W.; Chen, Y.J.; Qiu, Y.S. Experimental and numerical study on coupling effect of ducted fan in distributed electric propulsion system. J. Propuls. Technol. 2024, 45, 149–159. [Google Scholar] [CrossRef]
- Dorfling, J.; Traub, L.W. An Experimental Study of the Performance of Ducted Fan Arrays for Distributed Electric Propulsion. In Proceedings of the International Powered Lift Conference, San Diego, CA, USA, 12–16 June 2023. [Google Scholar]
- Liu, H.R.; Zhao, X.Y.; Zhou, F.; Feng, Y.Y. Aero-propulsion analysis of distributed ducted-fan propulsion based on lifting-line driven body-force model. Chin. J. Aeronaut. 2024, 38, 103–126. [Google Scholar] [CrossRef]
- Kerho, M.F. Aero-propulsive coupling of an embedded, distributed propulsion system. In Proceedings of the 33rd AIAA Applied Aerodynamics Conference, Dallas, TX, USA, 22–26 June 2015. [Google Scholar]
- Marble, F.E.; Hawthorne, W.R. Three-dimensional flow in turbomachines. High Speed Aero. Jet Propuls. 1964, 10, 83–166. [Google Scholar] [CrossRef]
- Hall, D.K.; Greitzer, E.M.; Tan, C.S. Analysis of fan stage conceptual design attributes for boundary layer ingestion. J. Turbo. 2017, 139, 1–10. [Google Scholar] [CrossRef]
- Thollet, W. Body Force Modeling of Fan-Airframe Interactions. Ph.D. Thesis, ISAE-SUPAERO, Toulouse, France, 2017. [Google Scholar]
- Godard, B.; De Jaeghere, E.; Gourdain, N. Efficient design investigation of a turbofan in distorted inlet conditions. In Proceedings of the ASME Turbo Expo 2019: Turbomachinery Technical Conference and Exposition, Phoenix, AZ, USA, 17–21 June 2019. [Google Scholar]
- Kottapalli, A.P. Development of a Body Force Model for Centrifugal Compressors. Ph.D. Thesis, Massachusetts Institute of Technology, Cambridge, MA, USA, 2013. [Google Scholar]
- Gong, Y. A Computational Model for Rotating Stall and Inlet Distortions in Multistage Compressors. Ph.D. Thesis, Massachusetts Institute of Technology, Cambridge, MA, USA, 1999. [Google Scholar]
- Dufour, G.; Thollet, W. Body force modeling of the aerodynamics of the fan of a turbofan at windmill. In Proceedings of the ASME Turbo Expo 2016: Turbomachinery Technical Conference and Exposition, Seoul, Republic of Korea, 13–17 June 2016. [Google Scholar]
- De, V.R.; Brown, M.; Vos, R. Preliminary sizing method for hybrid-electric distributed-propulsion aircraft. J. Aircr. 2019, 56, 2172–2188. [Google Scholar] [CrossRef]
- Chen, J.H. Research on Active Flow Control of Boundary Layer Inhalation Inlet. Master’s Thesis, Harbin Institute of Technology, Harbin, China, 2009. [Google Scholar]


| Parameter | Value |
|---|---|
| Fan diameter | 352 mm |
| Number of blades | 14 |
| Number of vanes | 40 |
| Rotation speed | 13,150 r·min−1 |
| Inlet total temperature | 288.15 K |
| Inlet total pressure | 101,325 Pa |
| Total pressure ratio | 1.17 |
| Equivalent flow rate | 14.635 kg·s−1 |
| Isentropic efficiency | 0.87 |
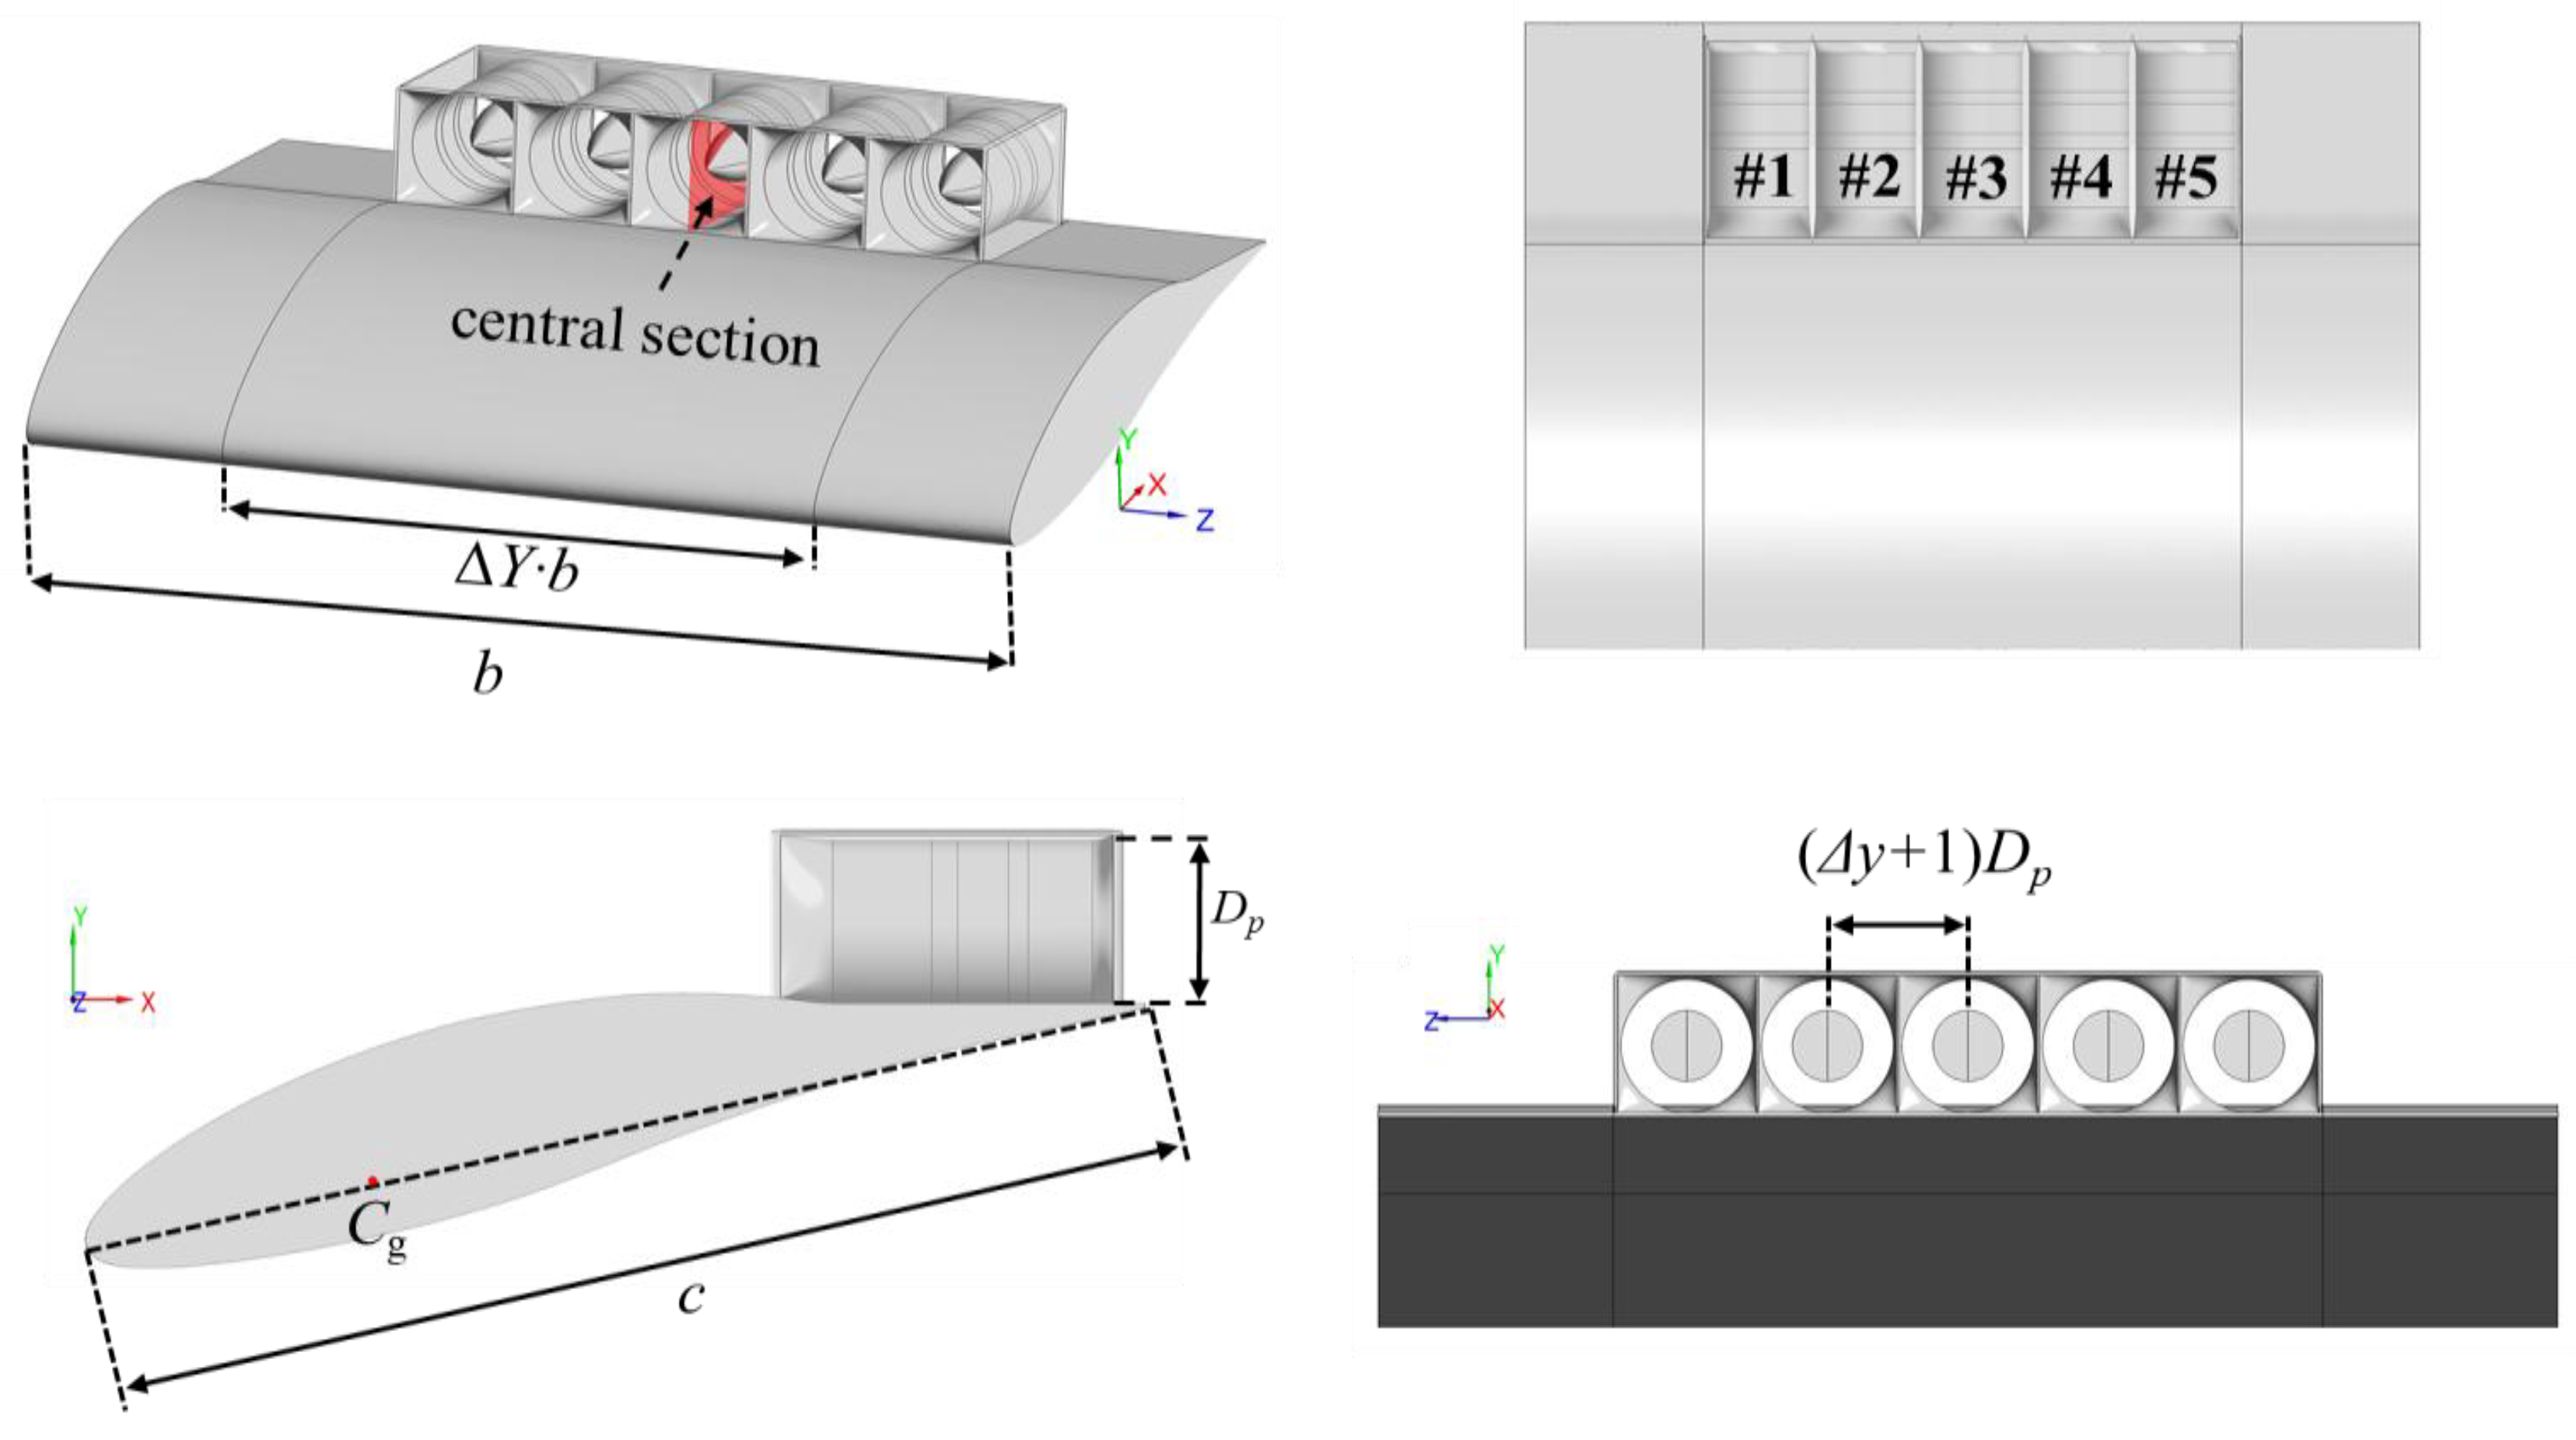
| Parameter | Value |
|---|---|
| Chord/c | 100 cm |
| Span/b | 141.2 cm |
| Fan axial position/(x/c) | 0.7 |
| Fan diameter/DP | 15.84 cm |
| Number of fans/N | 5 |
| Separation distance between neighboring fans/Δy·Dp | 1.0 cm |
| Fraction of wingspan occupied by ducted fan array/ΔY | 0.6 |
| Number of Grids × 104 | |||
|---|---|---|---|
| 836 | 0.314541 | 0.035984 | −0.103817 |
| 1065 | 0.309606 | 0.035231 | −0.100242 |
| 1392 | 0.310634 | 0.035205 | −0.100418 |
| 1612 | 0.309065 | 0.035092 | −0.100660 |
Disclaimer/Publisher’s Note: The statements, opinions and data contained in all publications are solely those of the individual author(s) and contributor(s) and not of MDPI and/or the editor(s). MDPI and/or the editor(s) disclaim responsibility for any injury to people or property resulting from any ideas, methods, instructions or products referred to in the content. |
© 2025 by the authors. Licensee MDPI, Basel, Switzerland. This article is an open access article distributed under the terms and conditions of the Creative Commons Attribution (CC BY) license (https://creativecommons.org/licenses/by/4.0/).
Share and Cite
Yang, X.; Liu, T.; Jia, W. Research on the Aerodynamic–Propulsion Coupling Characteristics of a Distributed Propulsion System. Appl. Sci. 2025, 15, 3536. https://doi.org/10.3390/app15073536
Yang X, Liu T, Jia W. Research on the Aerodynamic–Propulsion Coupling Characteristics of a Distributed Propulsion System. Applied Sciences. 2025; 15(7):3536. https://doi.org/10.3390/app15073536
Chicago/Turabian StyleYang, Xiaojun, Tao Liu, and Wei Jia. 2025. "Research on the Aerodynamic–Propulsion Coupling Characteristics of a Distributed Propulsion System" Applied Sciences 15, no. 7: 3536. https://doi.org/10.3390/app15073536
APA StyleYang, X., Liu, T., & Jia, W. (2025). Research on the Aerodynamic–Propulsion Coupling Characteristics of a Distributed Propulsion System. Applied Sciences, 15(7), 3536. https://doi.org/10.3390/app15073536