
Research of Enzyme-Induced Carbonate Precipitation on Strength Behavior of Reinforced Sand


Abstract
1. Introduction
2. Materials and Methods
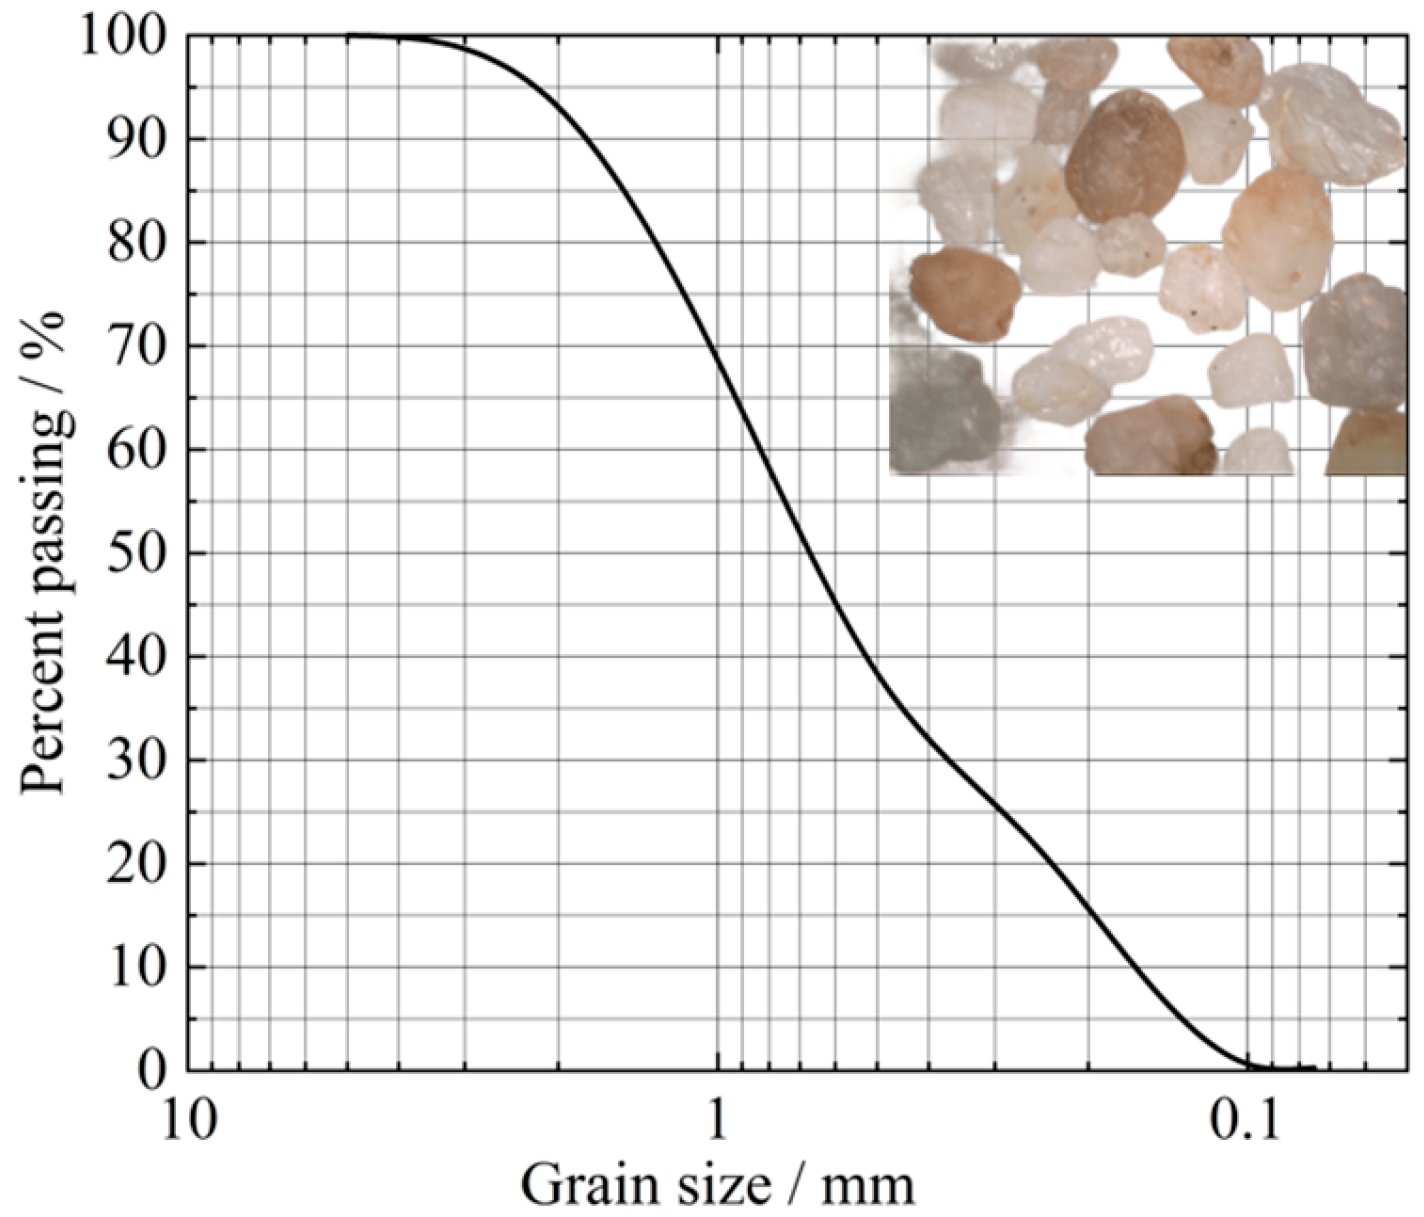
2.1. Materials
2.2. Methods
2.2.1. Sample Preparation
- EICP solution (equal volumes of urease solution and cementation solution) was mixed at 1.1 times the pore volume, as calculated based on the dry density of the soil [28], with sand.
- This mixture was then compacted into the mold in three layers to ensure uniformity.
- The compacted samples were subsequently cured at a constant temperature of 25 °C and a relative humidity of 50% for a predetermined curing period.
- Finally, the samples were demolded and oven-dried to constant weight.
2.2.2. Test Procedure
3. Results and Discussion
3.1. Unconfined Compressive Strength
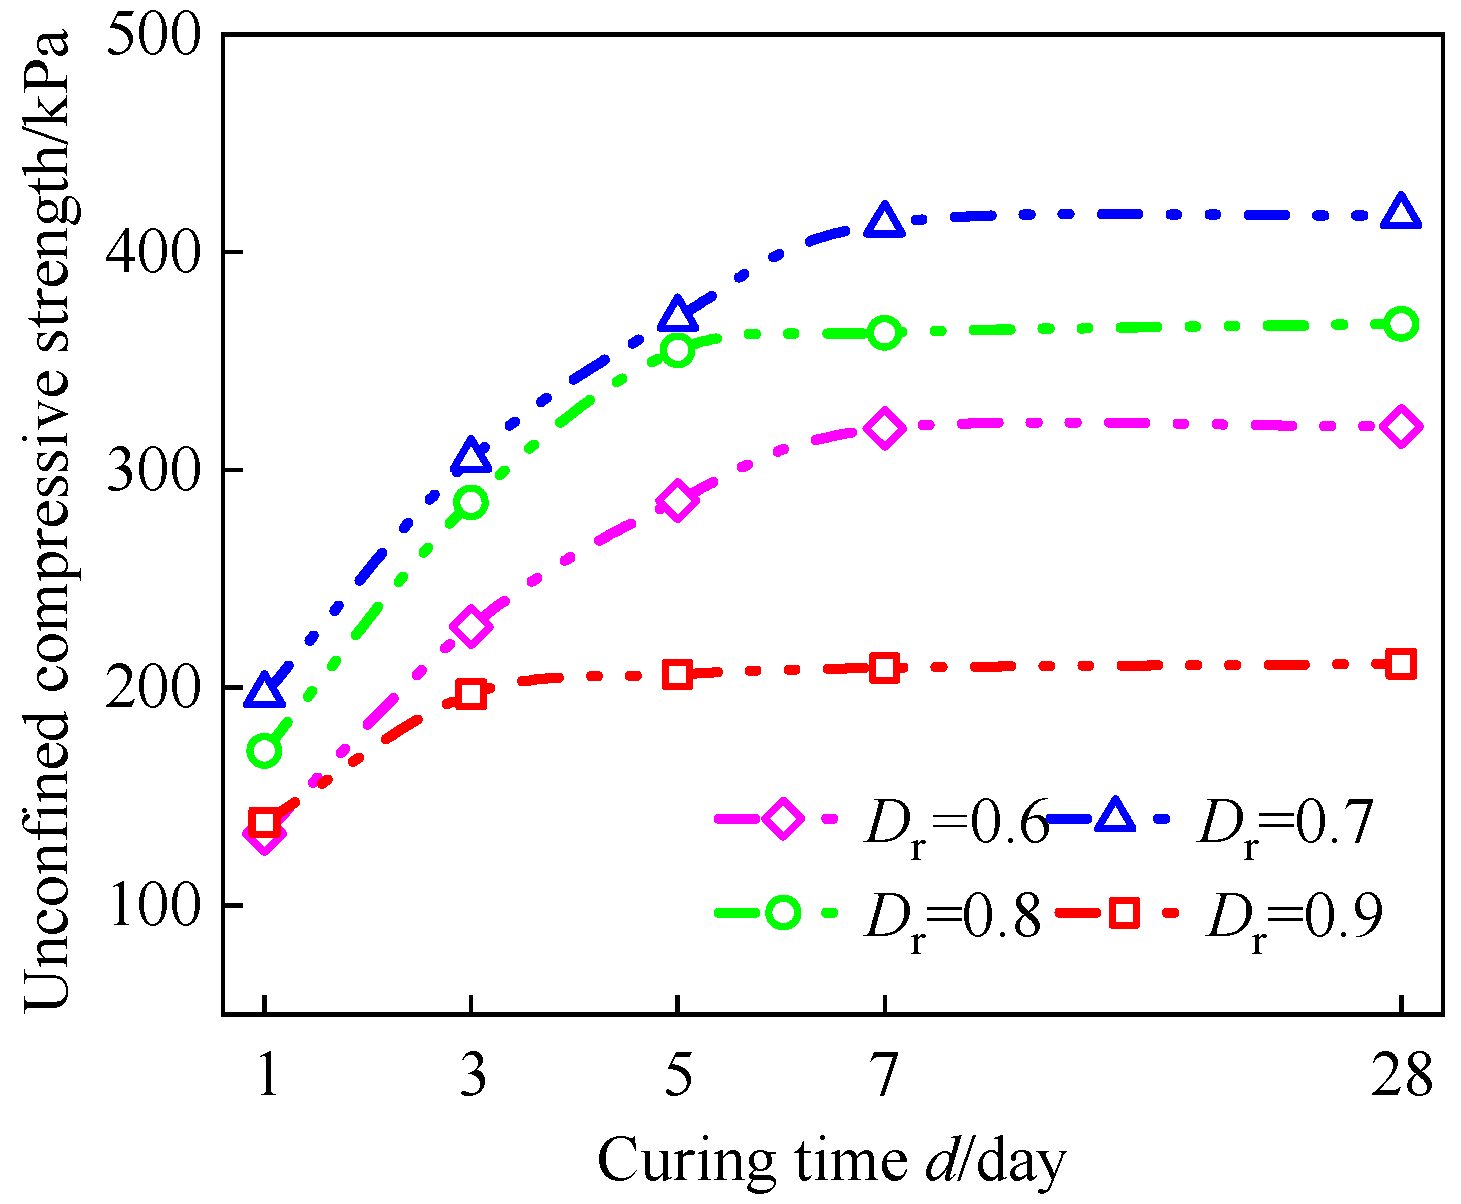
3.1.1. Influence of Curing Time on Strength
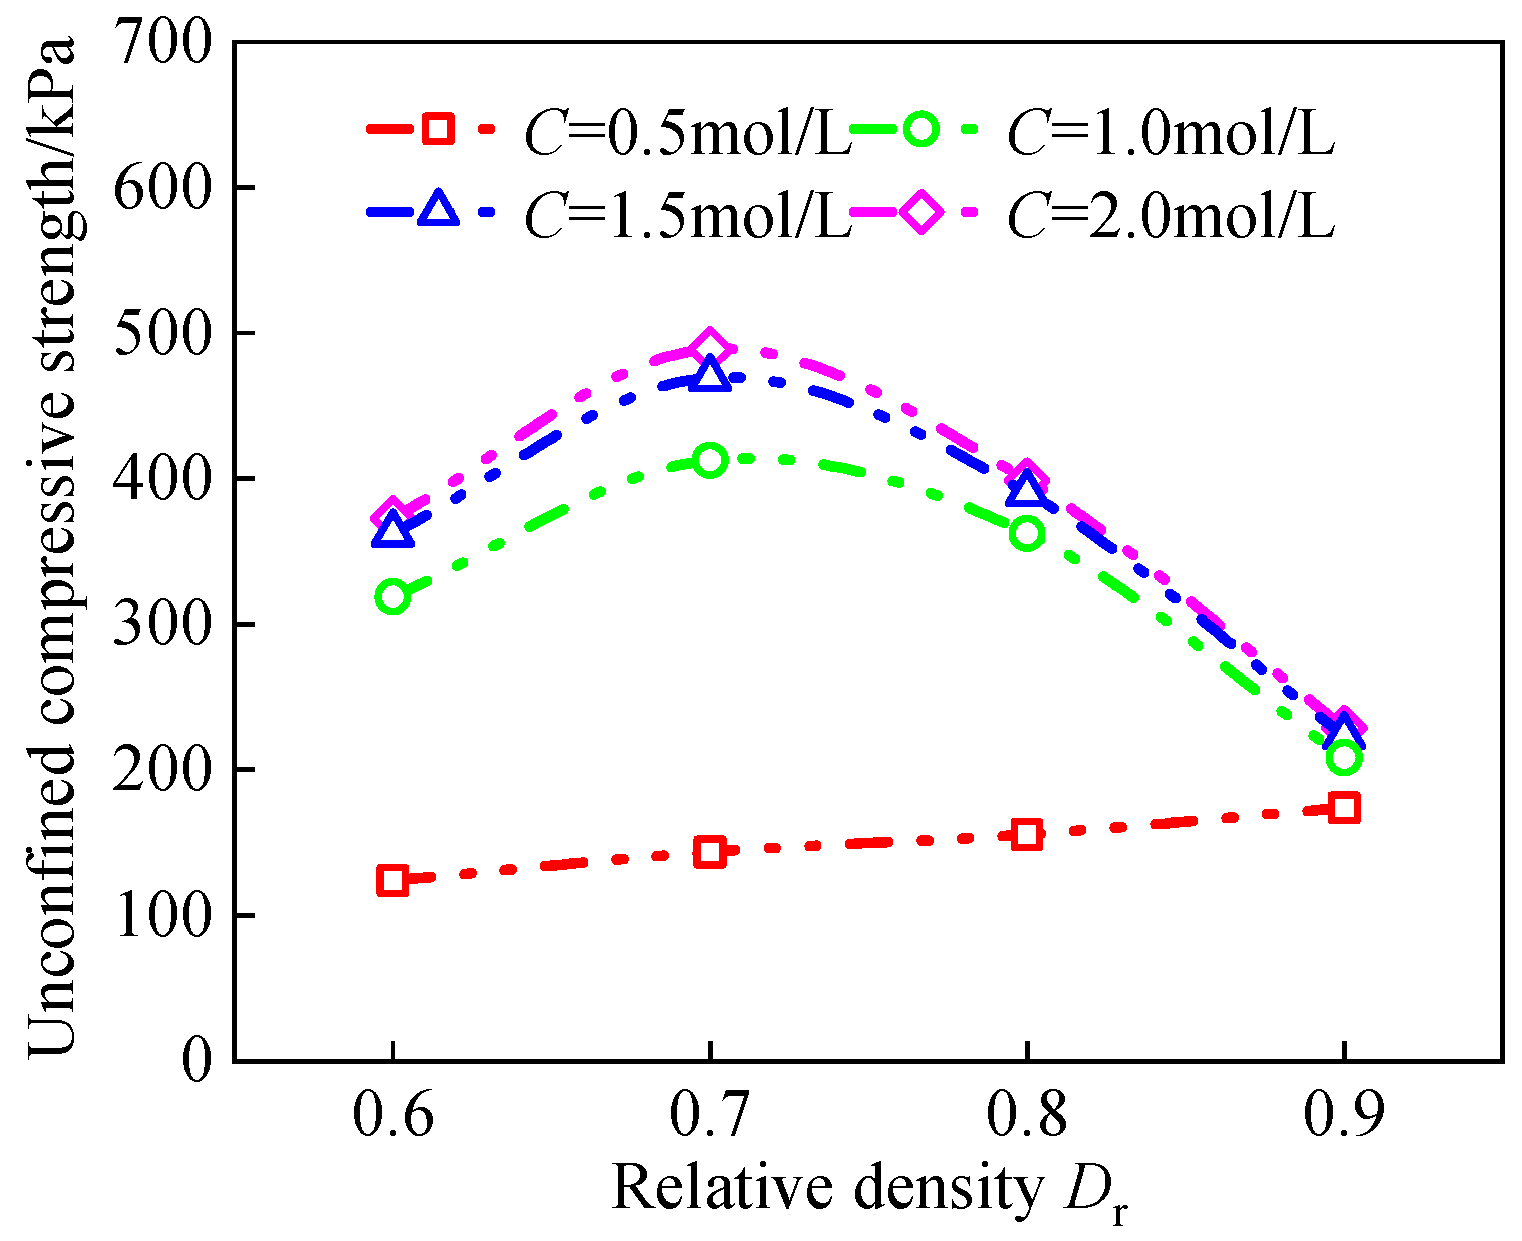
3.1.2. Influence of Relative Density on Strength
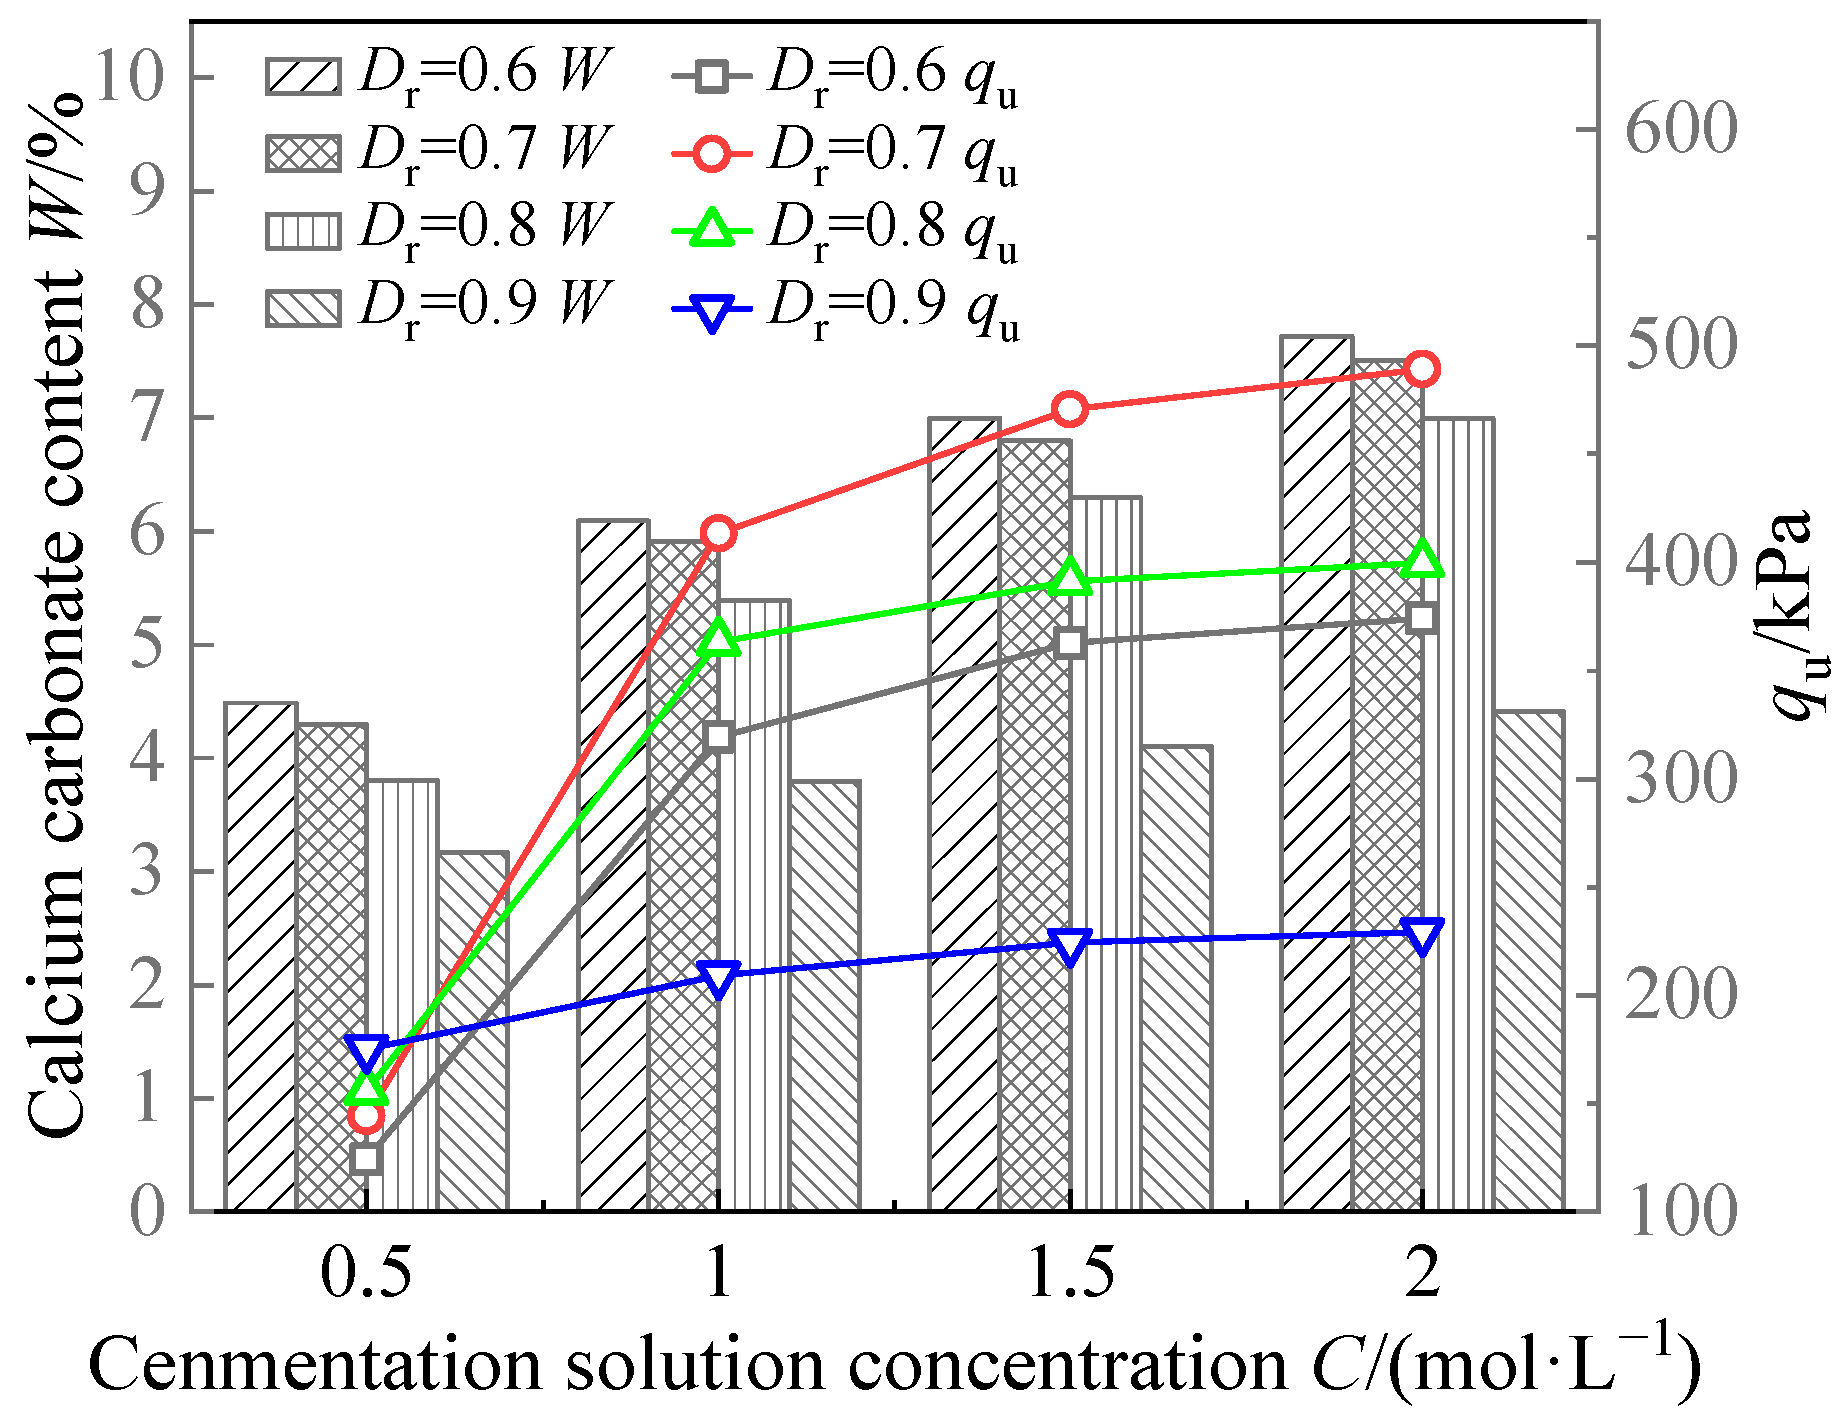
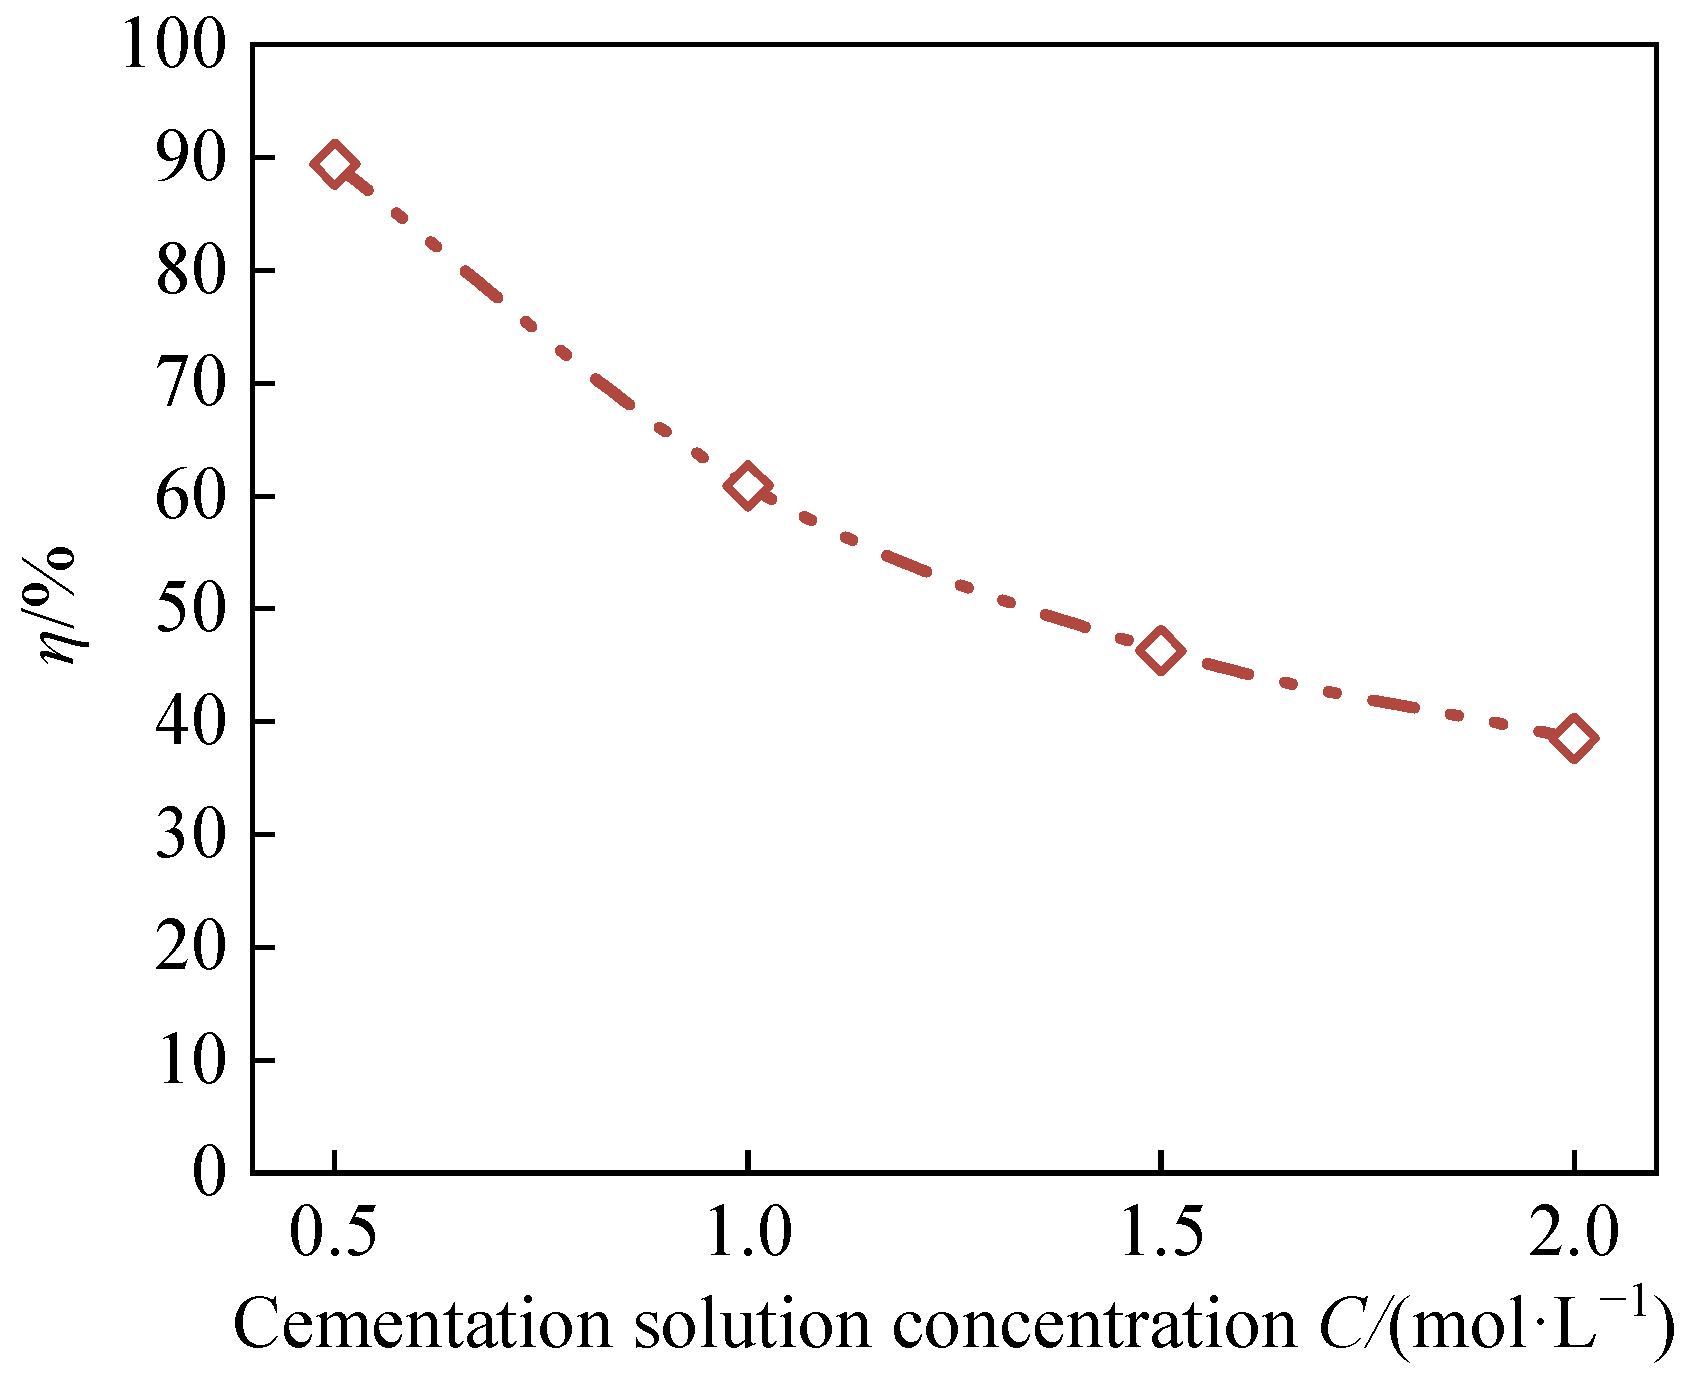
3.1.3. Influence of Cementation Solution Concentration on Strength
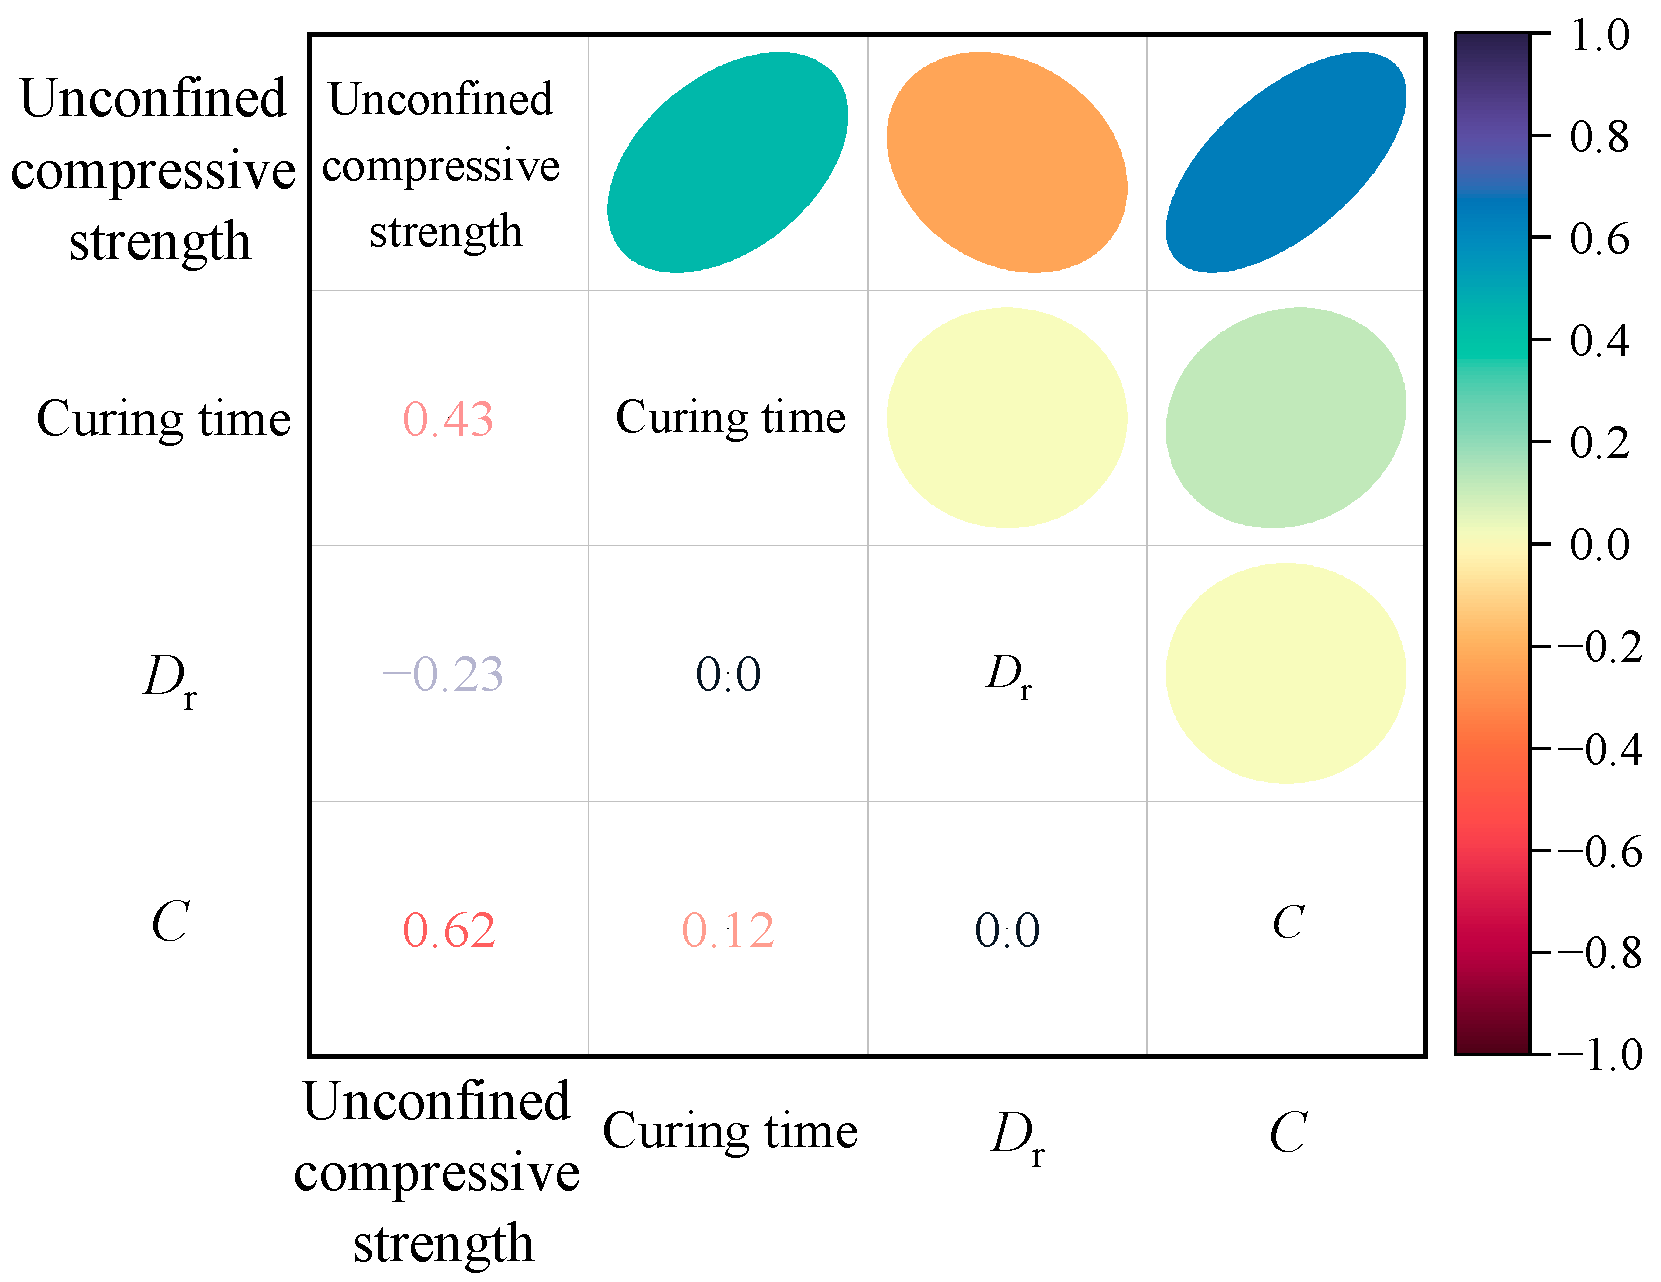
3.1.4. Correlation Analysis Between Variables and Strength
3.1.5. Relationship Between Calcium Carbonate Content and Strength
3.2. Micro-Mechanism of EICP-Reinforced Sand
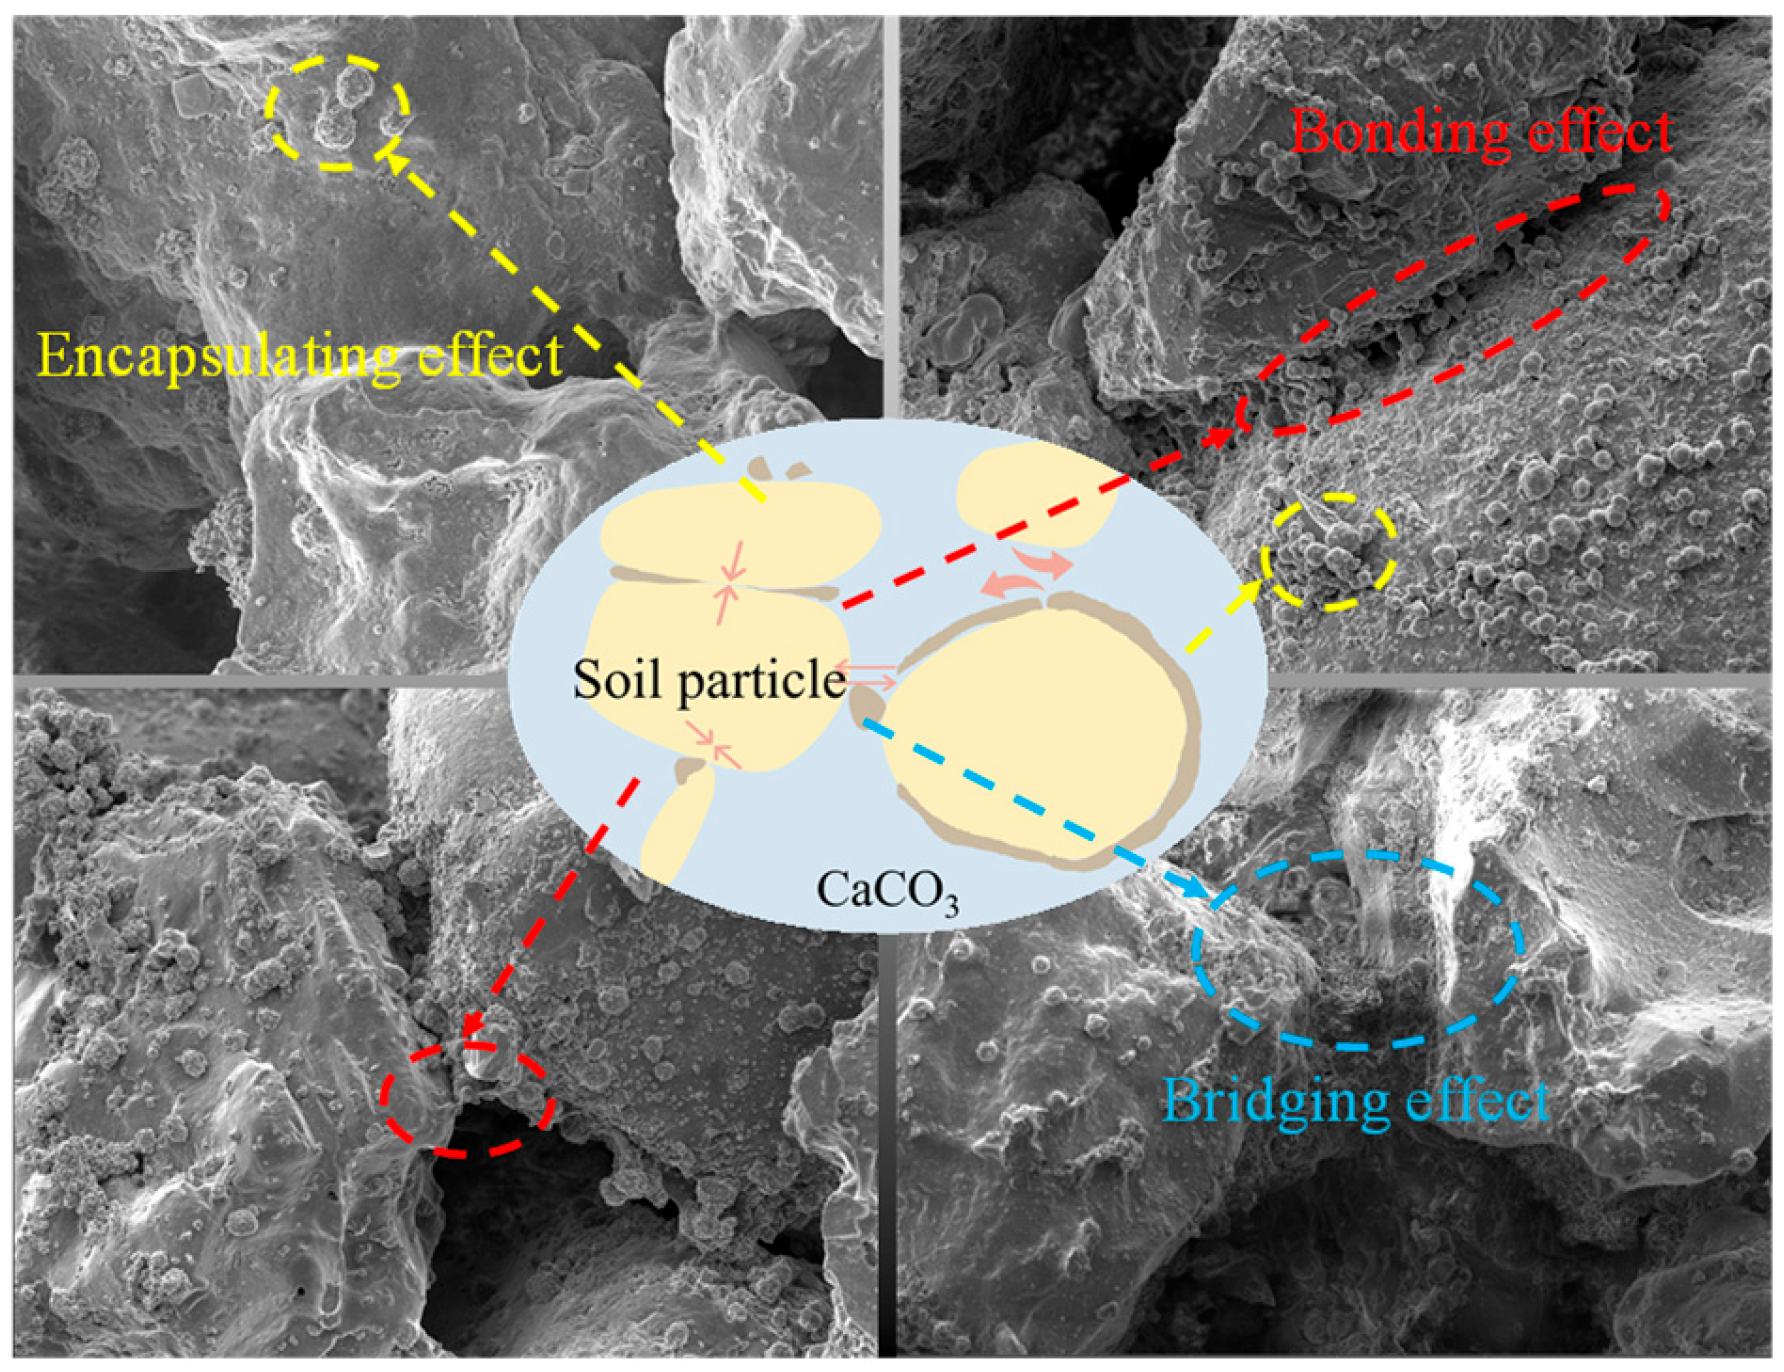
3.2.1. Crystal–Soil Cementation Patterns
- Bonding effect (red arrows): Calcium carbonate precipitates around points of contact between soil particles, effectively binding them together and enhancing their interaction. This effect is most noticeable in particles with plane–plane contacts, where the extended contact surface facilitates greater crystal aggregation, resulting in stronger cementation.
- Bridging effect (blue arrows): When soil particles are not directly in contact, calcium carbonate crystals form on the particle surfaces and grow to bridge the intergranular pores. This “bridging effect” strengthens the overall soil structure by connecting the particles and improving its integrity.
- Encapsulating effect (yellow arrows): Calcium carbonate crystals that form on isolated soil particles gradually accumulate and encapsulate the particles. While this does not directly enhance soil cohesion, it increases intergranular friction, especially in cases where particles are prone to rotation or sliding.
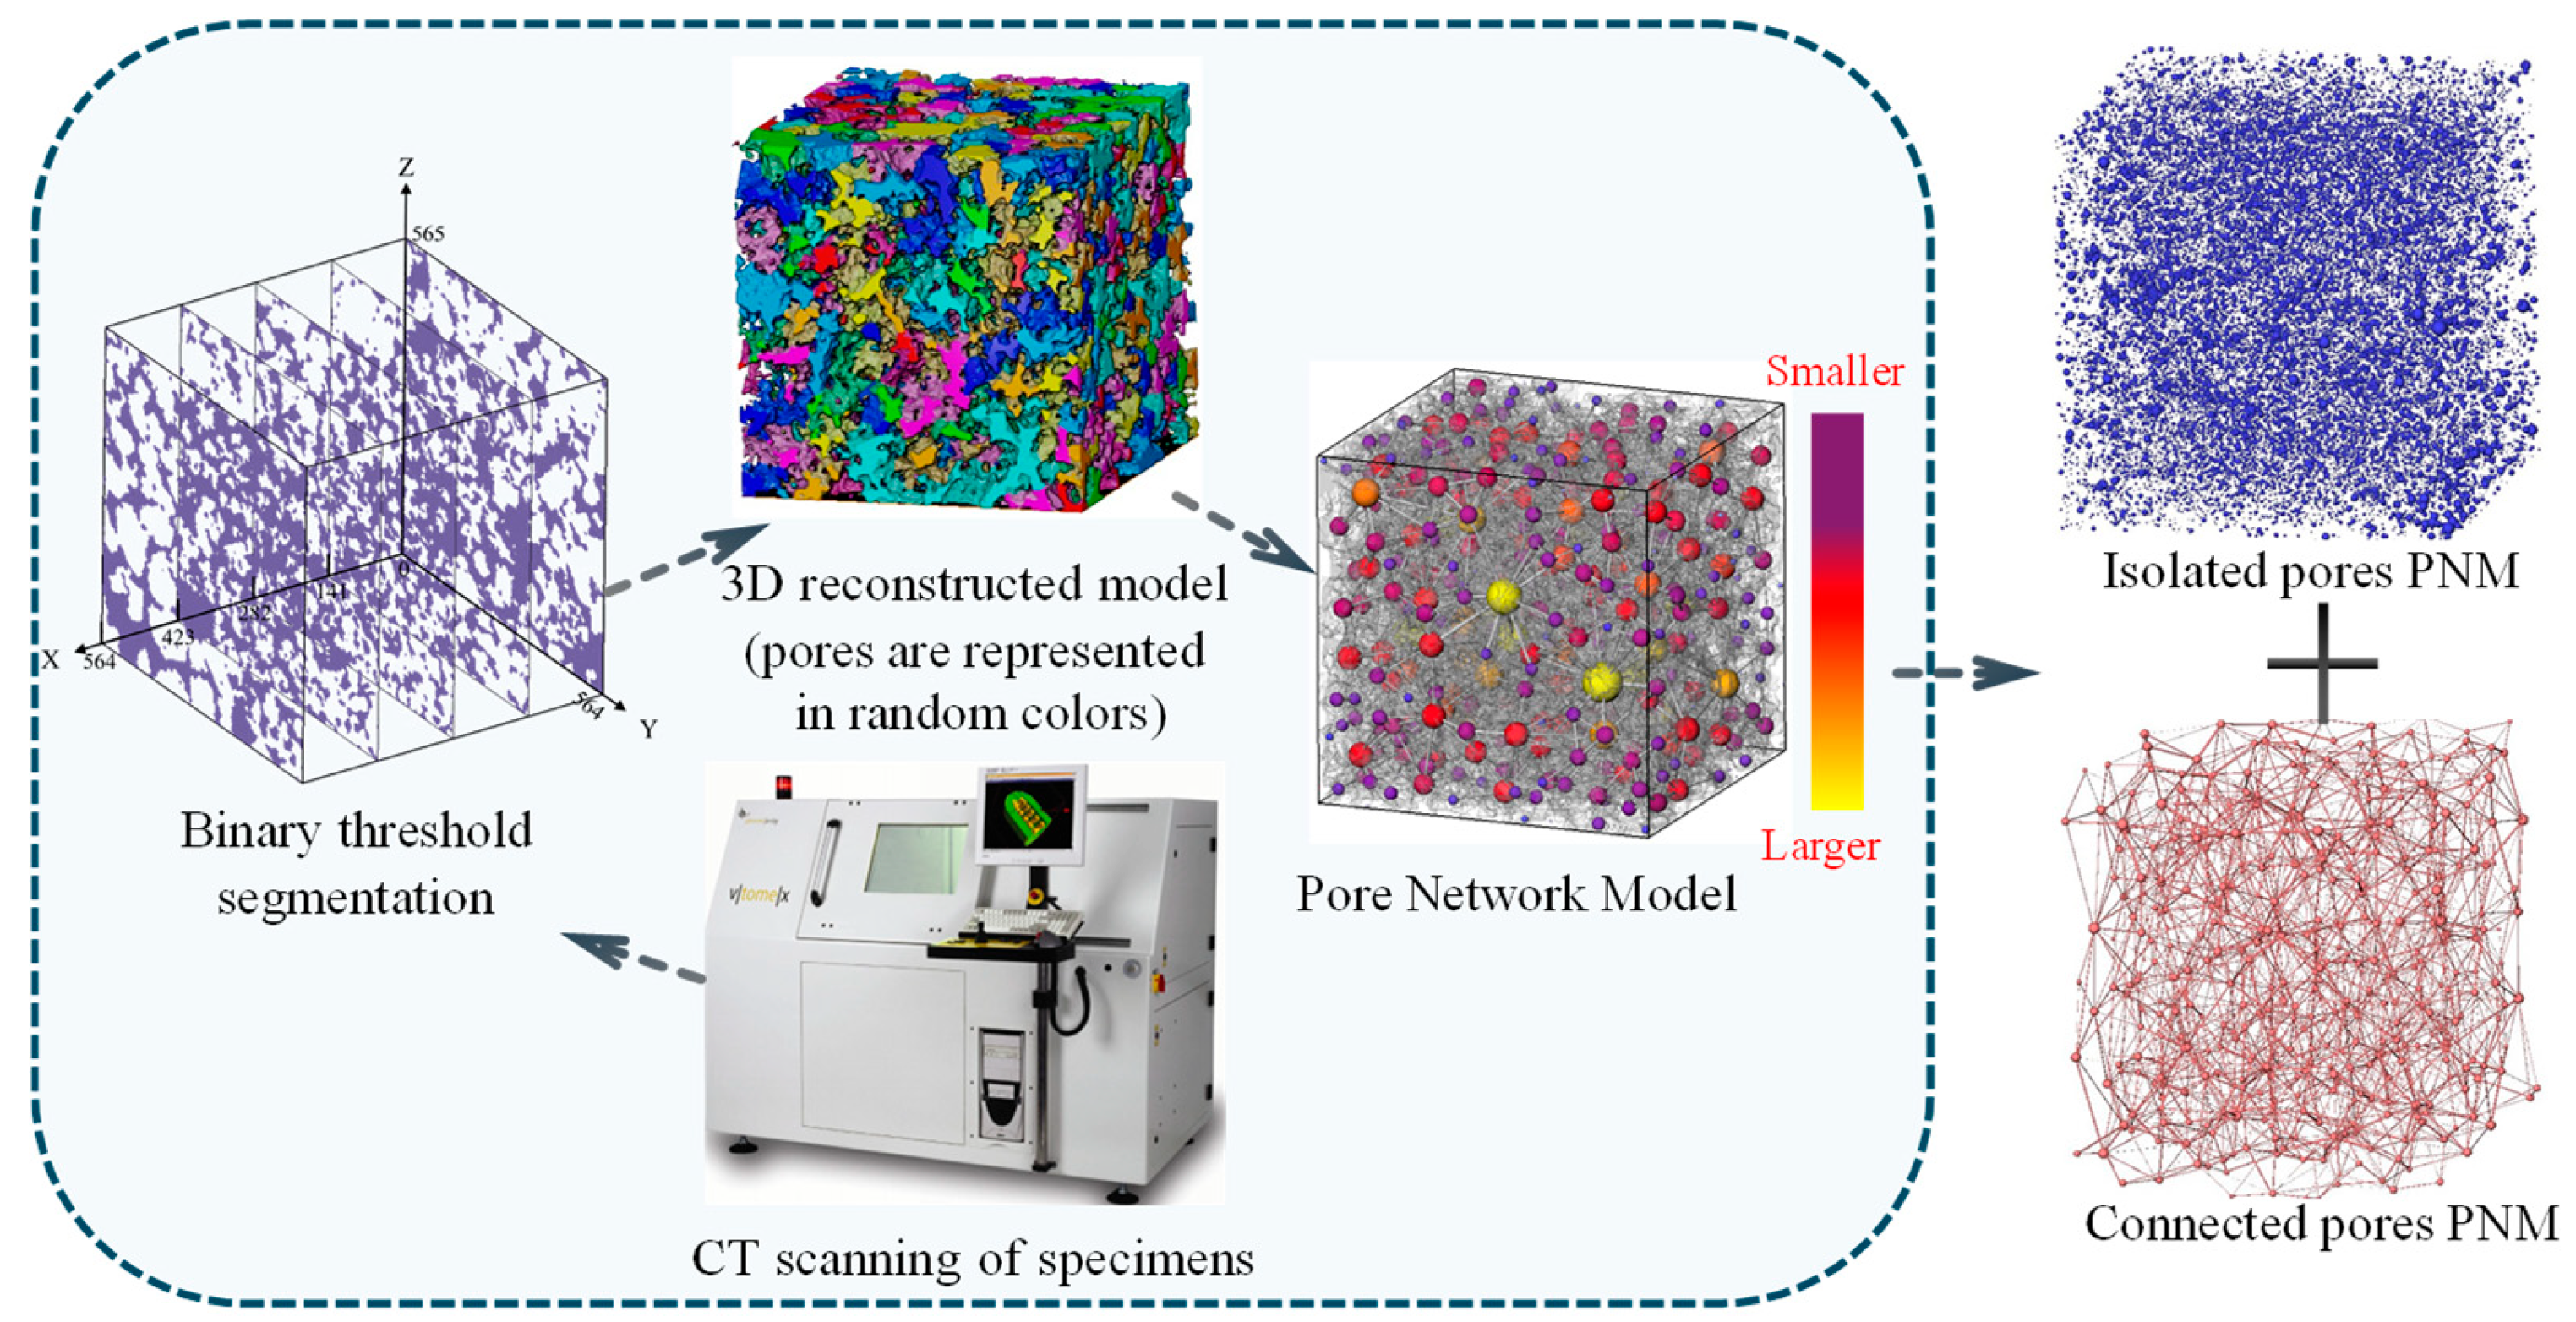
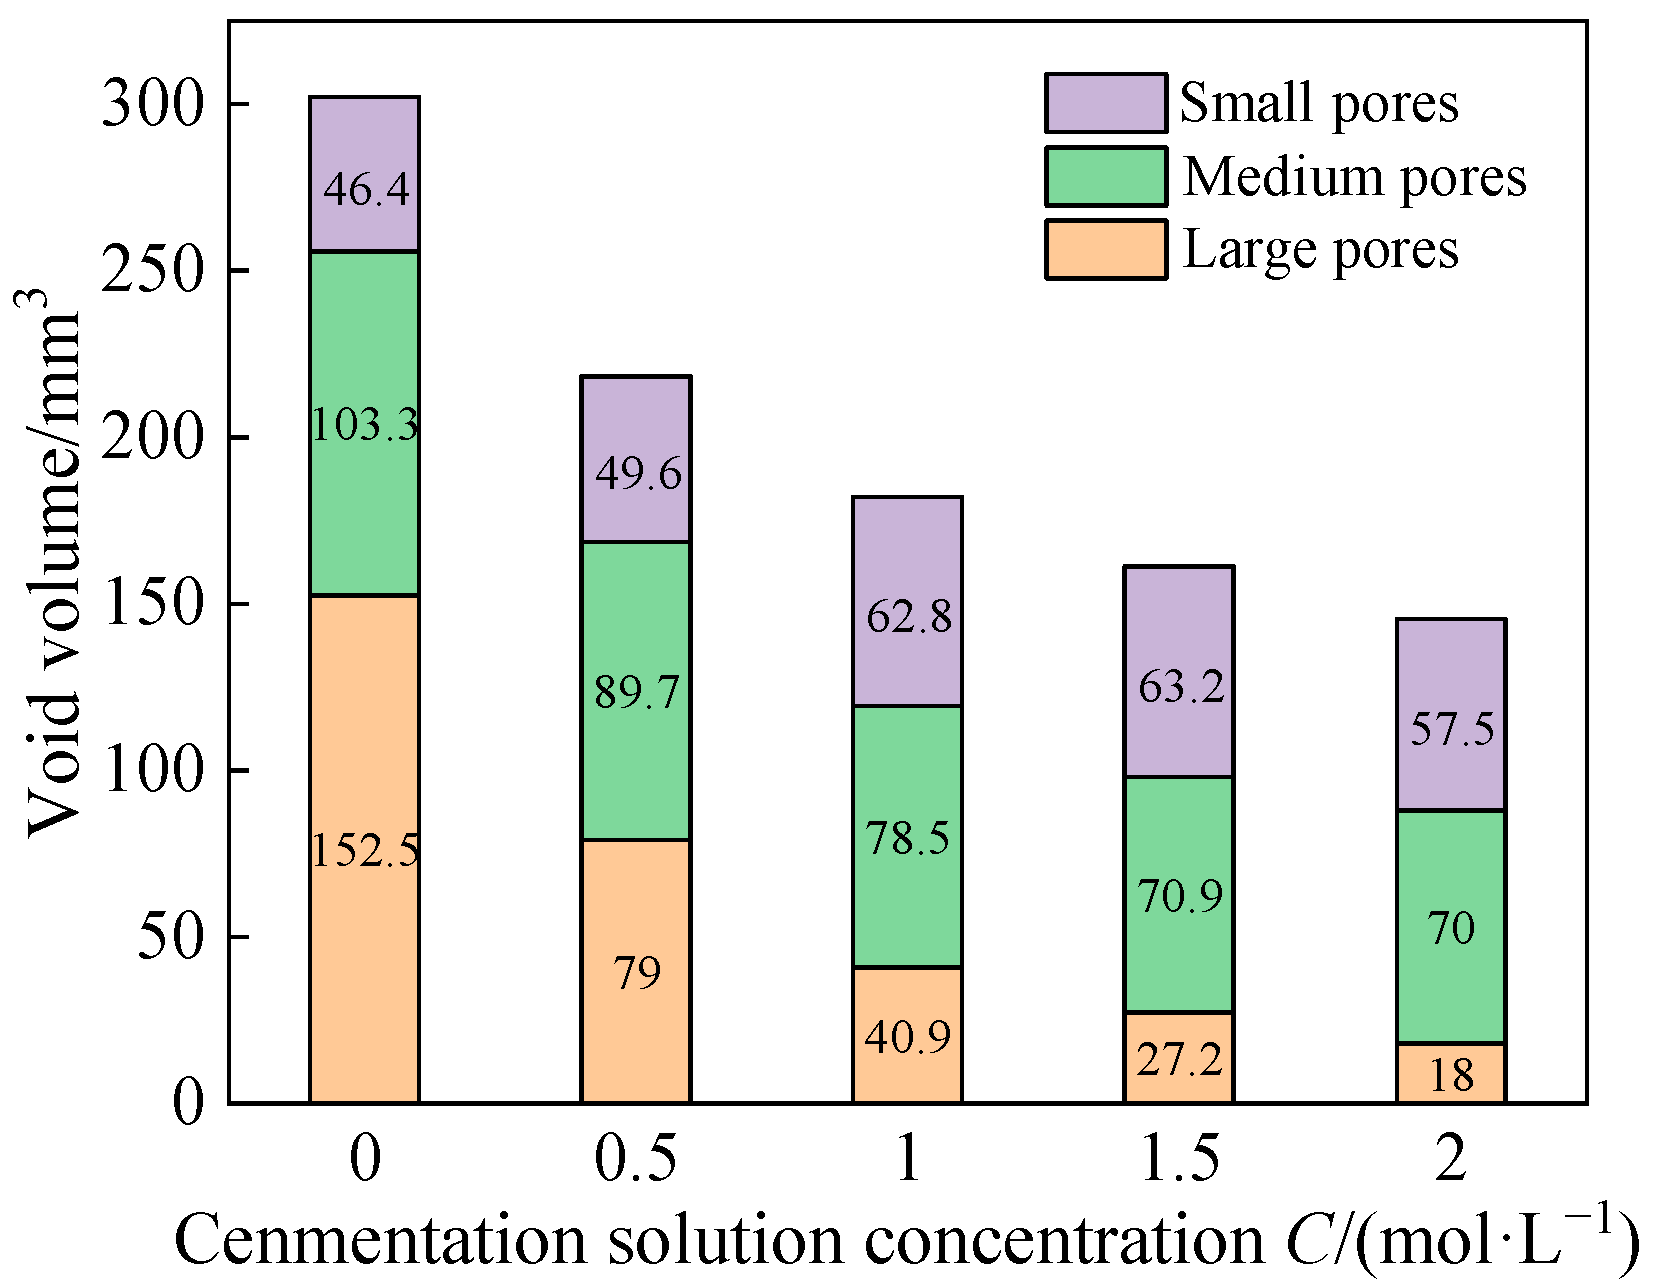
3.2.2. Influence of EICP on Pore Distribution of Soil
3.2.3. Influence of EICP on Pore Connectivity of Soil
- Degradation of Connectivity: The proportion of connected pores decreases from 96.3% at 0 mol/L to 84.51% at 2 mol/L, while the proportion of isolated pores increases from 3.6% to 15.39%.
- Topological Discretization: The Euler number decreases from −88,143 at 0 mol/L to −47,592 at 2 mol/L, indicating that the pore network transitions from highly connected to isolated clusters.
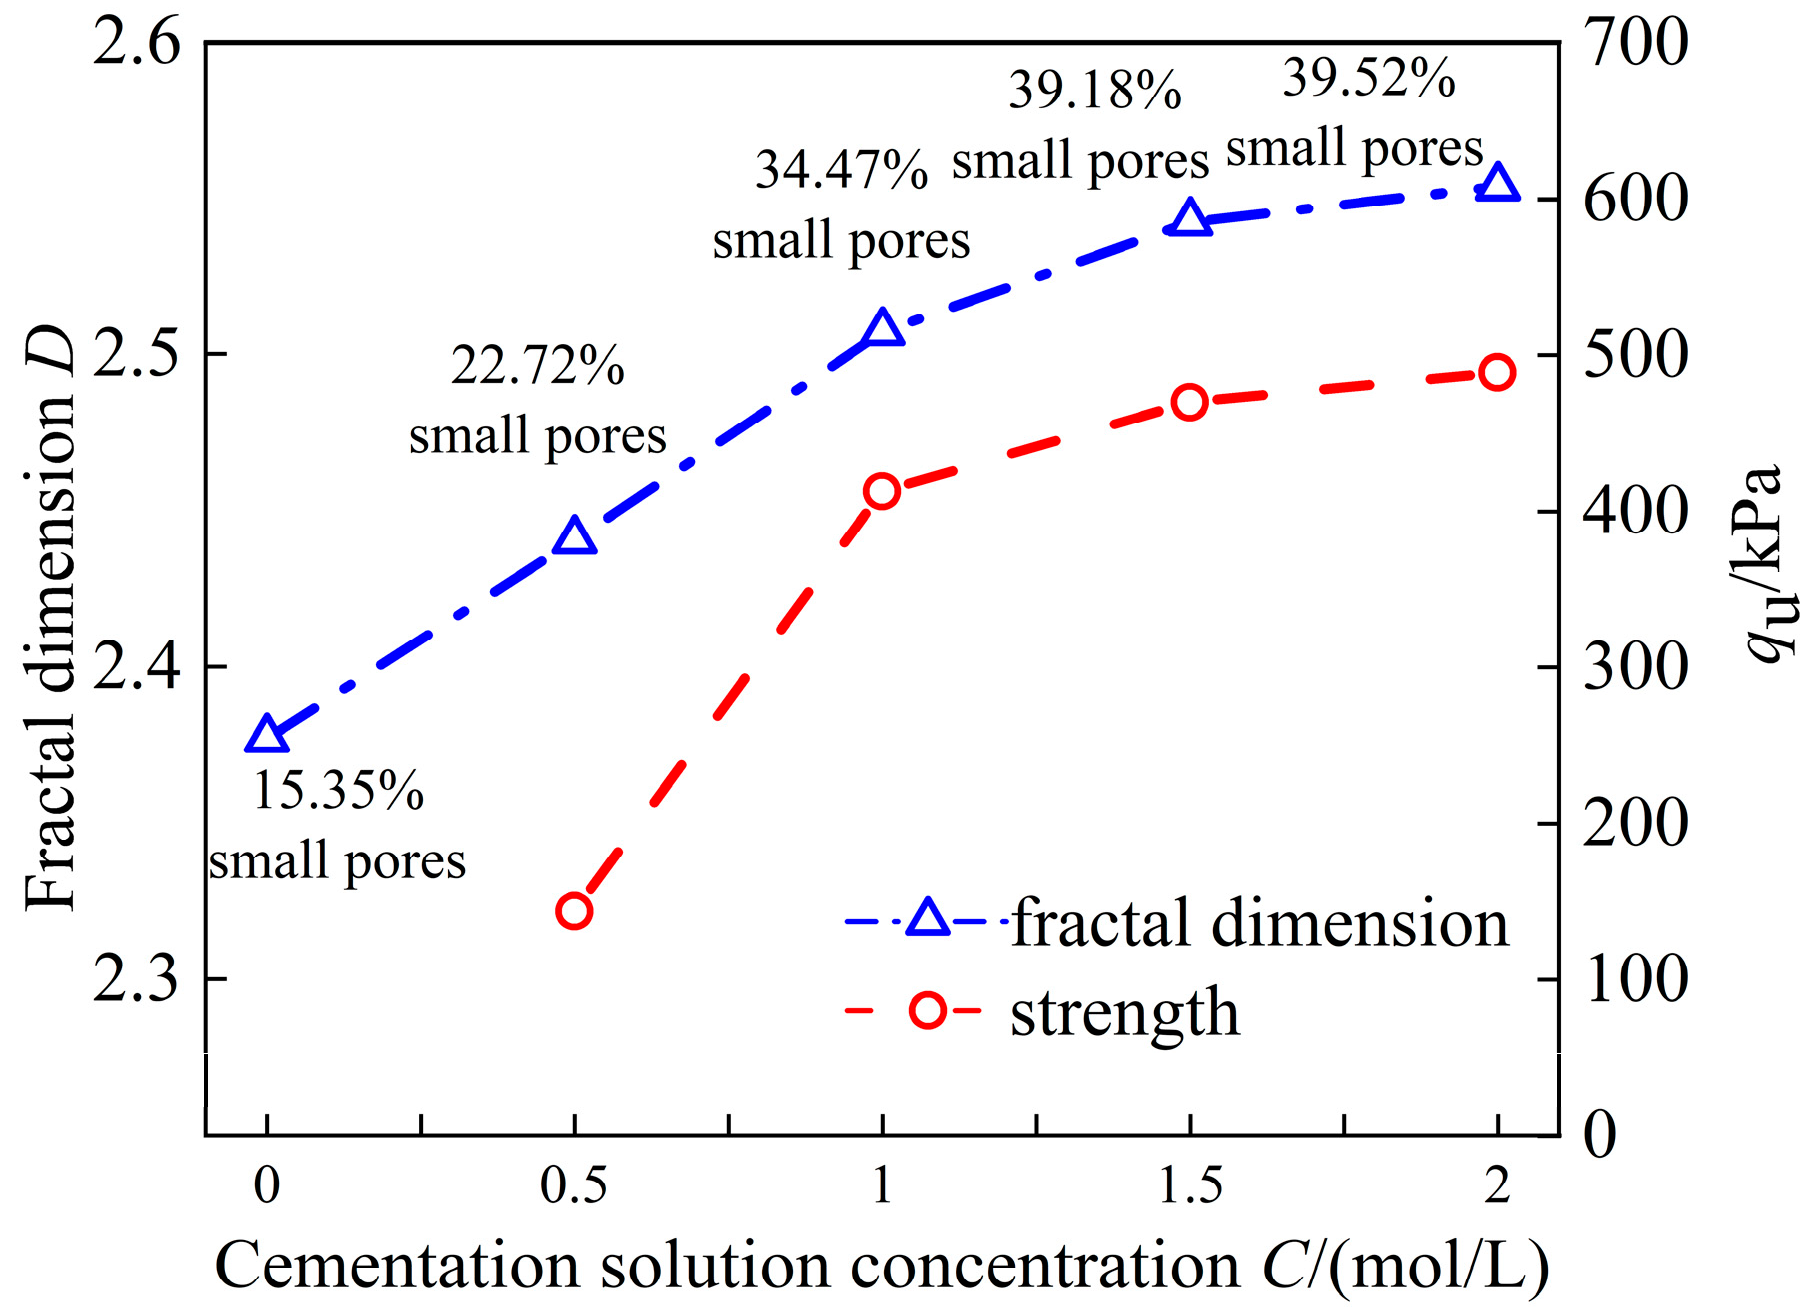
3.2.4. Influence of EICP on Fractal Dimension of Soil
3.2.5. Micro-Mechanism of EICP Reinforcement
4. Conclusions
- (1)
- As the curing time increases, the strength of EICP-reinforced sand progressively increases, reaching a maximum at 7 days. After this period, no significant increase in strength is observed, indicating a plateau effect. The strength is a composite outcome of the inherent strength of the plain soil and the reinforcement provided by EICP, which is strongly influenced by the relative density (Dr) of the unreinforced sand and cementation solution concentration (C). The maximum reinforcing effect occurs when Dr is 0.7 and C is 1 mol/L.
- (2)
- At a microscale, strength improvement is attributed to the three tier modes resulting from precipitation, namely bonding, bridging, and encapsulating effects of the precipitation, which are influenced by specific crystal morphologies that enhance particle bonding.
- (3)
- EICP precipitation contributes to the disintegration of large pores and reduces the total pore volume within the soil. When cementation solution concentration exceeds 1.5 mol/L, small pores tend to be occupied and blocked by the crystals exhibiting an encapsulating effect, which results in a slight increase in strength. This trend substantiates the essence of the strength improvement achieved by the EICP technique, which involved binding particles together and increasing inter-particle friction.
- (4)
- As the cementation solution concentration increases, the proportion of connected pores decreases, and isolated pores become more prevalent. This degradation of pore connectivity hinders the formation of continuous microscopic failure surfaces, contributing to the observed strength enhancement.
- (5)
- Fractal dimension analysis shows that as cementation solution concentration increases from 0 to 1.5 mol/L, pore toughness and heterogeneity rise from 2.38 to 2.54, showing an increase of nearly 7%, indicating the formation of aggregated particles and higher inter-particle friction. This trend correlates with the observed increase in strength and offers further insight into the strengthening mechanisms.
Author Contributions
Funding
Institutional Review Board Statement
Informed Consent Statement
Data Availability Statement
Conflicts of Interest
References
- Debeleac, C.N.; Buraga, A.; Nastac, S.M. Experimental and Numerical Study in Dynamic Compaction of Weakly-Cohesive Soils. Appl. Sci. 2024, 14, 10129. [Google Scholar] [CrossRef]
- Qian, Z.; Xiao, H.; Zhang, Z.; Nadakatti, M.M.; Chi, Y.; Wei, S. The Influence of Operation Times of Manual Tamping Device on Ballast Bed State. Constr. Build. Mater. 2024, 414, 135020. [Google Scholar] [CrossRef]
- Fraccica, A.; Spagnoli, G.; Romero, E.; Arroyo, M.; Gómez, R. Permeation Grouting of Silt-Sand Mixtures. Transp. Geotech. 2022, 35, 100800. [Google Scholar] [CrossRef]
- Li, Z.; Liu, J.; Xu, R.; Liu, H.; Shi, W. Study of Grouting Effectiveness Based on Shear Strength Evaluation with Experimental and Numerical Approaches. Acta Geotech. 2021, 16, 3991–4005. [Google Scholar] [CrossRef]
- DeJong, J.T.; Mortensen, B.M.; Martinez, B.C.; Nelson, D.C. Bio-Mediated Soil Improvement. Ecol. Eng. 2010, 36, 197–210. [Google Scholar] [CrossRef]
- Soon, N.W.; Lee, L.M.; Khun, T.C.; Ling, H.S. Factors Affecting Improvement in Engineering Properties of Residual Soil through Microbial-Induced Calcite Precipitation. J. Geotech. Geoenviron. Eng. 2014, 140, 04014006. [Google Scholar] [CrossRef]
- Lv, C.; Li, W.-Q.; Tang, C.-S.; Zhu, C.; Pan, X.-H.; Zhang, X.; Shi, B. Characterization and Quantification of Calcite Distribution in MICP-Treated Sand Using μ-XRF Image Processing Technique. Acta Geotech. 2024, 19, 115–129. [Google Scholar] [CrossRef]
- Bian, Y.; Chen, Y.; Zhan, L.; Ke, H.; Gao, Y.; Wang, Q.; Qi, G. An Enzyme-Induced Carbonate Precipitation Method for Zn2+, Ni2+, and Cr(VI) Remediation: An Experimental and Simulation Study. Appl. Sci. 2024, 14, 6559. [Google Scholar] [CrossRef]
- Liu, K.-W.; Jiang, N.-J.; Qin, J.-D.; Wang, Y.-J.; Tang, C.-S.; Han, X.-L. An Experimental Study of Mitigating Coastal Sand Dune Erosion by Microbial- and Enzymatic-Induced Carbonate Precipitation. Acta Geotech. 2021, 16, 467–480. [Google Scholar] [CrossRef]
- He, J.; Huang, A.; Ji, J.; Qu, S.; Hang, L. Enzyme Induced Carbonate Precipitation with Fibers for the Improvement of Clay Soil Slopes against Rainfall and Surface Runoff Erosions. Transp. Geotech. 2023, 42, 101074. [Google Scholar] [CrossRef]
- Khoshdel Sangdeh, M.; Salimi, M.; Hakimi Khansar, H.; Dokaneh, M.; Zanganeh Ranjbar, P.; Payan, M.; Arabani, M. Predicting the Precipitated Calcium Carbonate and Unconfined Compressive Strength of Bio-Mediated Sands through Robust Hybrid Optimization Algorithms. Transp. Geotech. 2024, 46, 101235. [Google Scholar] [CrossRef]
- Hamed Khodadadi, T.; Kavazanjian, E.; van Paassen, L.; DeJong, J. Bio-Grout Materials: A Review. Grouting 2017, 1–12. [Google Scholar] [CrossRef]
- Almajed, A.; Khodadadi Tirkolaei, H.; Kavazanjian, E. Baseline Investigation on Enzyme-Induced Calcium Carbonate Precipitation. J. Geotech. Geoenviron. Eng. 2018, 144, 04018081. [Google Scholar] [CrossRef]
- Mortensen, B.M.; DeJong, J.T. Strength and Stiffness of MICP Treated Sand Subjected to Various Stress Paths. In Proceedings of the Geo-Frontiers Congress 2011, Dallas, TX, USA, 13 March 2011; ASCE Press: Reston, VA, USA, 2012; Volume 1, pp. 4012–4020. [Google Scholar]
- Wang, J.; Mitrani, H.; Wipat, A.; Moreland, P.; Haystead, J.; Zhang, M.; Robertson, M.D. A Numerical Bio-Geotechnical Model of Pressure-Responsive Microbially Induced Calcium Carbonate Precipitation. Appl. Sci. 2024, 14, 2854. [Google Scholar] [CrossRef]
- Lin, H.; Suleiman, M.T.; Brown, D.G. Investigation of Pore-Scale CaCO3 Distributions and Their Effects on Stiffness and Permeability of Sands Treated by Microbially Induced Carbonate Precipitation (MICP). Soils Found. 2020, 60, 944–961. [Google Scholar] [CrossRef]
- Chen, Y.; Han, Y.; Zhang, X.; Sarajpoor, S.; Zhang, S.; Yao, X. Experimental Study on Permeability and Strength Characteristics of MICP-Treated Calcareous Sand. Biogeotechnics 2023, 1, 100034. [Google Scholar] [CrossRef]
- Gao, K.; Bick, P.; Suleiman, M.T.; Li, X.; Helm, J.; Brown, D.G.; Zouari, N. Wind Erosion Mitigation Using Microbial-Induced Carbonate Precipitation. J. Geotech. Geoenviron. Eng. 2023, 149, 04023053. [Google Scholar] [CrossRef]
- Hemayati, M.; Nikooee, E.; Habibagahi, G.; Niazi, A.; Afzali, S.F. New Non-Ureolytic Heterotrophic Microbial Induced Carbonate Precipitation for Suppression of Sand Dune Wind Erosion. Sci. Rep. 2023, 13, 5845. [Google Scholar] [CrossRef]
- Krishnan, V.; Khodadadi Tirkolaei, H.; Martin, K.; Hamdan, N.; van Paassen, L.A.; Kavazanjian, E. Variability in the Unconfined Compressive Strength of EICP-Treated “Standard” Sand. J. Geotech. Geoenviron. Eng. 2021, 147, 06021001. [Google Scholar] [CrossRef]
- Venda Oliveira, P.J.; Rosa, J.A.O. Confined and Unconfined Behavior of a Silty Sand Improved by the Enzymatic Biocementation Method. Transp. Geotech. 2020, 24, 100400. [Google Scholar] [CrossRef]
- Zhang, J.; Yin, Y.; Shi, W.; Bian, H.; Shi, L.; Wu, L.; Han, Z.; Zheng, J.; He, X. Strength and Uniformity of EICP-Treated Sand under Multi-Factor Coupling Effects. Biogeotechnics 2023, 1, 100007. [Google Scholar] [CrossRef]
- Almajed, A.; Abbas, H.; Arab, M.; Alsabhan, A.; Hamid, W.; Al-Salloum, Y. Enzyme-Induced Carbonate Precipitation (EICP)-Based Methods for Ecofriendly Stabilization of Different Types of Natural Sands. J. Clean. Prod. 2020, 274, 122627. [Google Scholar] [CrossRef]
- Cui, M.-J.; Lai, H.-J.; Hoang, T.; Chu, J. One-Phase-Low-pH Enzyme Induced Carbonate Precipitation (EICP) Method for Soil Improvement. Acta Geotech. 2021, 16, 481–489. [Google Scholar] [CrossRef]
- Martin, K.; Tirkolaei, H.K.; Kavazanjian, E. Enhancing the Strength of Granular Material with a Modified Enzyme-Induced Carbonate Precipitation (EICP) Treatment Solution. Constr. Build. Mater. 2021, 271, 121529. [Google Scholar] [CrossRef]
- ASTM D2487-11; ASTM Committee D-18 on Soil and Rock. Standard Practice for Classification of Soils for Engineering Purposes (Unified Soil Classification System). ASTM International: West Conshohocken, PA, USA, 2017.
- Khodadadi Tirkolaei, H.; Javadi, N.; Krishnan, V.; Hamdan, N.; Kavazanjian, E. Crude Urease Extract for Biocementation. J. Mater. Civ. Eng. 2020, 32, 04020374. [Google Scholar] [CrossRef]
- Zhao, Y.; Xiao, Z.; Fan, C.; Shen, W.; Wang, Q.; Liu, P. Comparative Mechanical Behaviors of Four Fiber-Reinforced Sand Cemented by Microbially Induced Carbonate Precipitation. Bull. Eng. Geol. Environ. 2020, 79, 3075–3086. [Google Scholar] [CrossRef]
- Chaiyaput, S.; Arwaedo, N.; Kingnoi, N.; Nghia-Nguyen, T.; Ayawanna, J. Effect of Curing Conditions on the Strength of Soil Cement. Case Stud. Constr. Mater. 2022, 16, e01082. [Google Scholar] [CrossRef]
- Decky, M.; Papanova, Z.; Juhas, M.; Kudelcikova, M. Evaluation of the Effect of Average Annual Temperatures in Slovakia between 1971 and 2020 on Stresses in Rigid Pavements. Land 2022, 11, 764. [Google Scholar] [CrossRef]
- Alotaibi, E.; Arab, M.G.; Abdallah, M.; Nassif, N.; Omar, M. Life Cycle Assessment of Biocemented Sands Using Enzyme Induced Carbonate Precipitation (EICP) for Soil Stabilization Applications. Sci. Rep. 2022, 12, 6032. [Google Scholar] [CrossRef]
- Falconer, K. Fractal Geometry: Mathematical Foundations and Applications; John Wiley & Sons: Hoboken, NJ, USA, 2004. [Google Scholar]
- Lu, S.; Tang, H.; Zhang, Y.; Gong, W.; Wang, L. Effects of the Particle-Size Distribution on the Micro and Macro Behavior of Soils: Fractal Dimension as an Indicator of the Spatial Variability of a Slip Zone in a Landslide. Bull. Eng. Geol. Environ. 2018, 77, 665–677. [Google Scholar] [CrossRef]


| Test | Curing Time d Day | Relative Densities Dr |
Cementation C mol/L |
|---|---|---|---|
| UCS-1 | 1, 3, 5, 7, 28 | 0.6, 0.7, 0.8, 0.9 | 1.0 |
| UCS-2 | Optimal curing time | 0.6, 0.7, 0.8, 0.9 | 0.5, 1.0, 1.5, 2.0 |
| SEM | Optimal curing time | 0.6, 0.7, 0.8, 0.9 | 0.5, 1.0, 1.5, 2.0 |
| CaCO3 quantify | Optimal curing time | 0.6, 0.7, 0.8, 0.9 | 0.5, 1.0, 1.5, 2.0 |
| Micro-CT | Optimal curing time | 0.7 | 0, 0.5, 1.0, 1.5, 2.0 |
| Item | CT0 | CT1 | CT2 | CT3 | CT4 |
|---|---|---|---|---|---|
| Porosity (%) | 30.92 | 22.17 | 18.22 | 16.45 | 15.01 |
| Integral pores |  |  |  |  |  |
| Large pores |  | 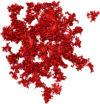 |  |  |  |
| Medium pores | 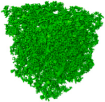 | 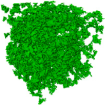 |  |  |  |
| Small pores | 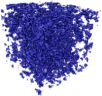 |  |  |  |  |
| Isolated pores (%) | 3.60 | 9.55 | 12.76 | 14.43 | 15.39 |
| Isolated pores |  | 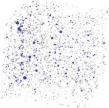 | 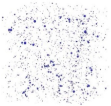 | 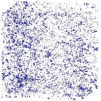 | 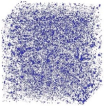 |
| Connected pores | 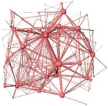 |  |  |  |  |
| Euler number | −88,143 | −58,289 | −51,665 | −49,144 | −47,592 |
Disclaimer/Publisher’s Note: The statements, opinions and data contained in all publications are solely those of the individual author(s) and contributor(s) and not of MDPI and/or the editor(s). MDPI and/or the editor(s) disclaim responsibility for any injury to people or property resulting from any ideas, methods, instructions or products referred to in the content. |
© 2025 by the authors. Licensee MDPI, Basel, Switzerland. This article is an open access article distributed under the terms and conditions of the Creative Commons Attribution (CC BY) license (https://creativecommons.org/licenses/by/4.0/).
Share and Cite
Wang, J.; Li, X.; Peng, L.; Lu, S.; Zhang, J.; Du, X. Research of Enzyme-Induced Carbonate Precipitation on Strength Behavior of Reinforced Sand. Appl. Sci. 2025, 15, 3558. https://doi.org/10.3390/app15073558
Wang J, Li X, Peng L, Lu S, Zhang J, Du X. Research of Enzyme-Induced Carbonate Precipitation on Strength Behavior of Reinforced Sand. Applied Sciences. 2025; 15(7):3558. https://doi.org/10.3390/app15073558
Chicago/Turabian StyleWang, Jianye, Xiao Li, Liyun Peng, Shuang Lu, Jin Zhang, and Xintao Du. 2025. "Research of Enzyme-Induced Carbonate Precipitation on Strength Behavior of Reinforced Sand" Applied Sciences 15, no. 7: 3558. https://doi.org/10.3390/app15073558
APA StyleWang, J., Li, X., Peng, L., Lu, S., Zhang, J., & Du, X. (2025). Research of Enzyme-Induced Carbonate Precipitation on Strength Behavior of Reinforced Sand. Applied Sciences, 15(7), 3558. https://doi.org/10.3390/app15073558