Article

Eccentric Compression Behavior of Coral Aggregate Geopolymer Concrete Columns Reinforced with Stainless-Steel Rebars

1
State Key Laboratory of Featured Metal Materials and Life-Cycle Safey for Composite Structure, Guangxi University, Nanning 530004, China
2
Guangxi Key Laboratory of Disaster Prevention and Structural Safety, College of Civil Engineering and Architecture, Guangxi University, Nanning 530004, China
3
College of Civil Engineering and Architecture, Nanning University, Nanning 541699, China
*
Author to whom correspondence should be addressed.
Appl. Sci. 2025, 15(7), 3570; https://doi.org/10.3390/app15073570
Submission received: 19 February 2025 / Revised: 15 March 2025 / Accepted: 16 March 2025 / Published: 25 March 2025

Abstract

:
Using coral aggregates instead of natural aggregates can save both raw material transportation costs and time in island construction projects. However, coral aggregates are characterized by high brittleness, low strength, and a high chloride content, which result in the brittleness and durability of coral aggregate concrete (CAC). On the other hand, carbon emissions are prominent in the production of Portland cement. A reinforced concrete structure composed of a stainless-steel rebar (SSR), geopolymer concrete, and coral aggregate was employed to address these challenges. Considering that columns are commonly used structural elements, this paper investigates the eccentric compression behavior of stainless-steel rebar-reinforced coral aggregate geopolymer concrete columns (SCGCs) by varying eccentricity (e0 = 70, 140, 210, and 280 mm) and reinforcement ratio (ρs = 0.302%, 0.536%, and 0.838%) values. The failure patterns, load–deformation curves, and crack development of SCGCs were obtained. These results indicate that the failure pattern of SCGCs under eccentric compression is similar to that of conventional reinforced concrete columns. However, SCGCs exhibited a greater lateral deformation. A refined load-bearing capacity prediction model for SCGCs was developed by integrating the constitutive model of coral aggregate geopolymer concrete (CAGC). Furthermore, a crack width prediction model specifically suited for SCGCs was developed, considering the differences in the bond performance between CAGCs and the SSR compared to ordinary concrete and carbon steel and the characteristic of the SSR lacking a yield plateau. The calculations using the refined load-bearing capacity prediction model and the crack width prediction model fit well with the experimental results, indicating that these two models have good application prospects.

1. Introduction

The large-scale development of island engineering projects is underway, driven by the rapid expansion of the marine industry [1]. However, constructing these island projects requires a substantial amount of building materials, and transporting these materials from inland is both time-consuming and expensive [2]. Comprehensive studies have shown that collecting and utilizing coral reef debris does not adversely affect marine ecosystems [3]. This approach, which involves the use of crushed and screened coral reef debris to replace gravel and seawater instead of fresh water, can effectively mitigate the environmental impact of traditional construction materials while also reducing transportation and time costs during construction [4]. To date, many scholars have validated the feasibility of using coral aggregate concrete (CAC) in island engineering projects, with the research focusing on the mechanical properties [5,6], shrinkage [7], bonding performance [8], and durability [9] of CAC.
However, coral aggregate has drawbacks, such as high porosity (15–45%), a high chloride ion content, and low strength (0.6–2.1 MPa) [10,11]. Under the same water–cement ratio, the strength and durability of CAC are lower than those of Ordinary Portland Cement (OPC) concrete. Moreover, the apparent chloride ion diffusion coefficient (Da) of CAC is 1 to 8 times higher than that of OPC, and its total free chloride ion content (Cf) is significantly greater than that of OPC [12]. As a result, the corrosion of reinforcement within CAC structures is more severe than in OPC structures when used in island construction projects. It is also noteworthy that two drawbacks limiting its potential as an environmentally friendly material are that the production of Portland cement consumes a large amount of energy and emits significant quantities of CO2. According to the statistics, producing one ton of cement generates approximately 10 kg of dust, 2 kg of nitrogen oxides, 1 kg of sulfur dioxide, and other by-products [13]. Therefore, it is imperative to address the issue of reinforcement corrosion within CAC structures in marine environments and to seek more “green” alternatives for cementitious materials.
Geopolymer, as a novel and sustainable alternative cementitious material, primarily utilizes industrial waste materials, such as slag, fly ash, and metakaolin, making it an ideal substitute for traditional cement [14]. The combination of geopolymer concrete (GPC) with coral aggregate facilitates the formation of the C-S-H gel phase at the mortar matrix–coral aggregate interface, while the naturally dense pores of coral aggregate contribute to a tight interface transition zone with the cementitious material [15,16]. Thus, the incorporation of a geopolymer not only mitigates the carbon emissions issues associated with Portland cement, but also enhances the split tensile strength, axial compressive strength, and elastic modulus of CAC [17,18].
To prevent rebar corrosion, scholars have proposed various methods, such as applying surface coatings to concrete, increasing the thickness of the concrete cover, using high-performance concrete to block the penetration paths of corrosive agents, galvanizing the rebar, coating the rebar with epoxy resin, using corrosion inhibitors, and providing cathodic protection for the rebar.
However, the aforementioned measures cannot fundamentally solve the problem of steel corrosion, and those measures can only extend the service life of the structure by approximately 20 years [19]. Jing [20] studied the corrosion resistance of duplex stainless-steel rebars (SSRs) used for the Hong Kong Zhuhai Macao Bridge and demonstrated that the critical chloride ion concentration for the SSRs in simulated concrete pore solutions is 3.9 to 3.95 mol/L, which is about 60 times that of a carbon steel rebar. Da [21] found that the corrosion resistance of SSRs embedded in CAC is higher than that of carbon steel rebars with surface coatings, with carbon steel rebars performing the worst. In summary, the SSR exhibits excellent corrosion resistance, effectively addressing the problem of rebar corrosion. However, the mechanical properties of SSRs lead to differences in the structural behavior of stainless-steel rebar concrete (SSRC) structures compared to ordinary reinforced concrete (ORC) structures. The plasticity of the SSR results in greater deformation and wider cracks in SSRC structures during the service stage. Li [22] discovered through experiments that eccentrically loaded SSR columns develop wider cracks than carbon steel rebar columns with the same eccentricity and reinforcement ratio. The high ductility of SSRs causes differences in the load redistribution and stress redistribution patterns in SSRC structures compared to ORC structures, and the asymmetry in the stress–strain curves of SSRs under tension and compression render existing load-bearing capacity calculation formulas unsuitable [19]. Scholars, such as Rabi [23,24], have pointed out that the load-bearing capacity calculation formulas proposed in Eurocode 2 are not applicable to SSRC beams.
In response, scholars have conducted extensive research on the mechanical behavior of SSRC structures. Li [25] found that the strain distribution in the cross-section of four-point bending SSRC beams adheres to the plane section assumption, and the failure pattern is similar to that of ORC beams. Rabi [26] proposed a continuous strength method based on the constitutive relationship of SSRs, which more accurately and reliably predicts the load-bearing capacity of SSRC structures. Khalifa [27] suggested using equivalent stress to replace the yield strength of duplex and austenitic SSRs to calculate the axial-flexural capacity. Building on this, Li [22] developed a computational model for predicting the N-M curves of SSRC columns. Additionally, scholars have also explored the fatigue performance [28] and seismic performance [29] of SSRC structures.
However, although extensive experimental studies and theoretical design studies have been conducted on SSRC structures, no studies have been reported on the eccentric compression behavior of SCGC columns. In addition, since columns are the basic components of frame structures, it is beneficial to study the mechanical properties of columns in depth, and thus it is crucial to study their eccentric compression behavior [30,31]. In this study, a novel concrete column structure that integrates geopolymers, CAC, and SSRs is proposed to further address the limitations of carbon steel reinforcement in marine structures. Considering that columns in real projects are usually subjected to eccentric loading, in this paper, eight SCGCs with different eccentricity (e0) and reinforcement ratios (ρs) were tested with eccentric loading to examine the mechanical behavior of SCGCs under such conditions.

2. Experimental Program

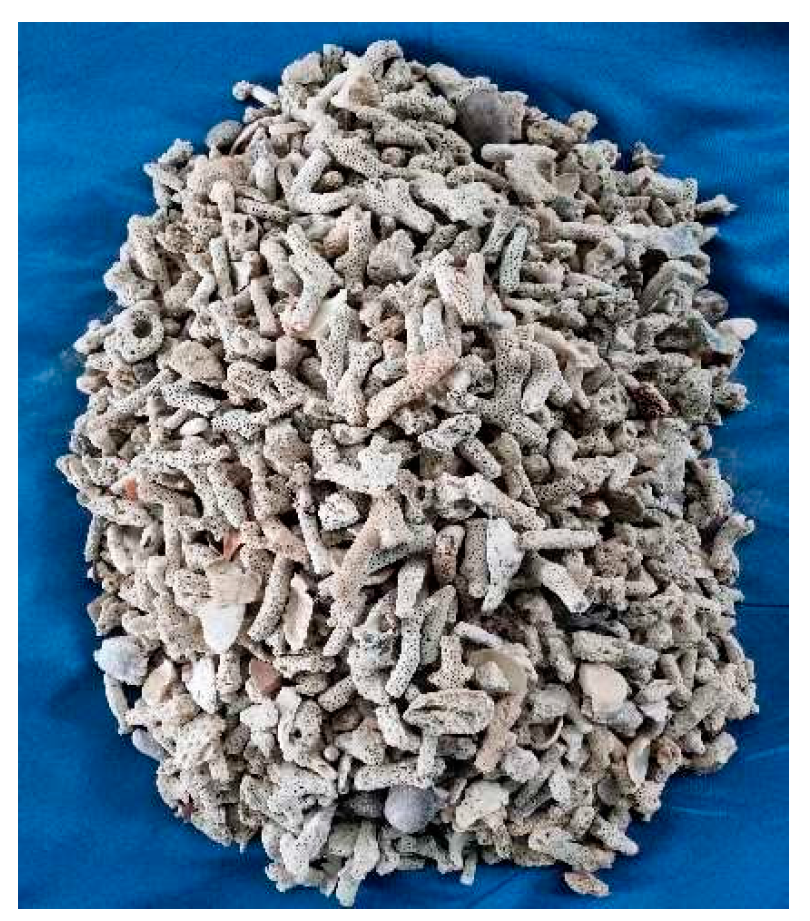
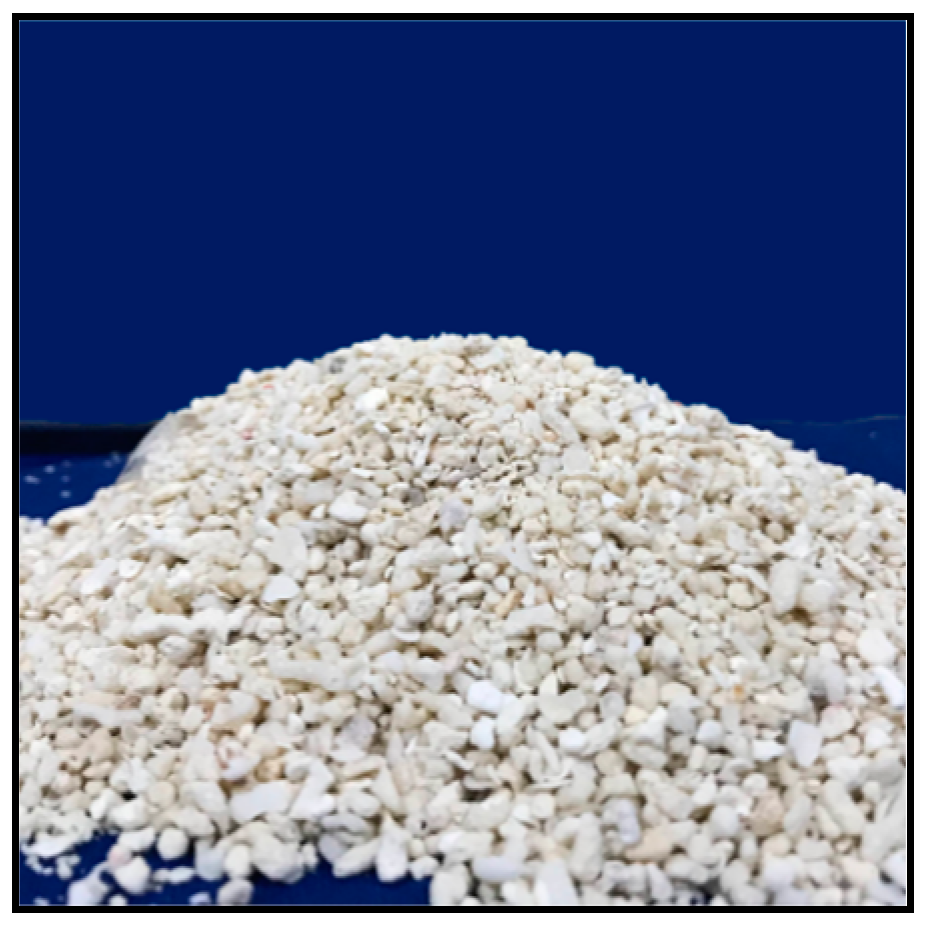
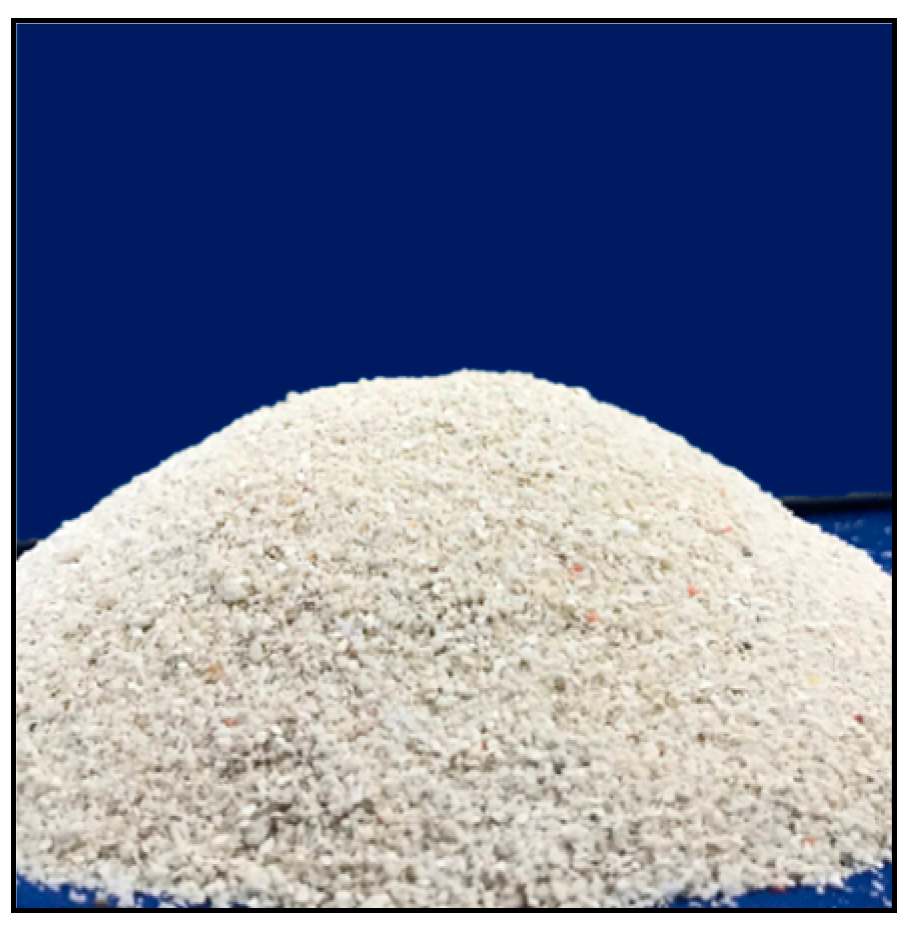
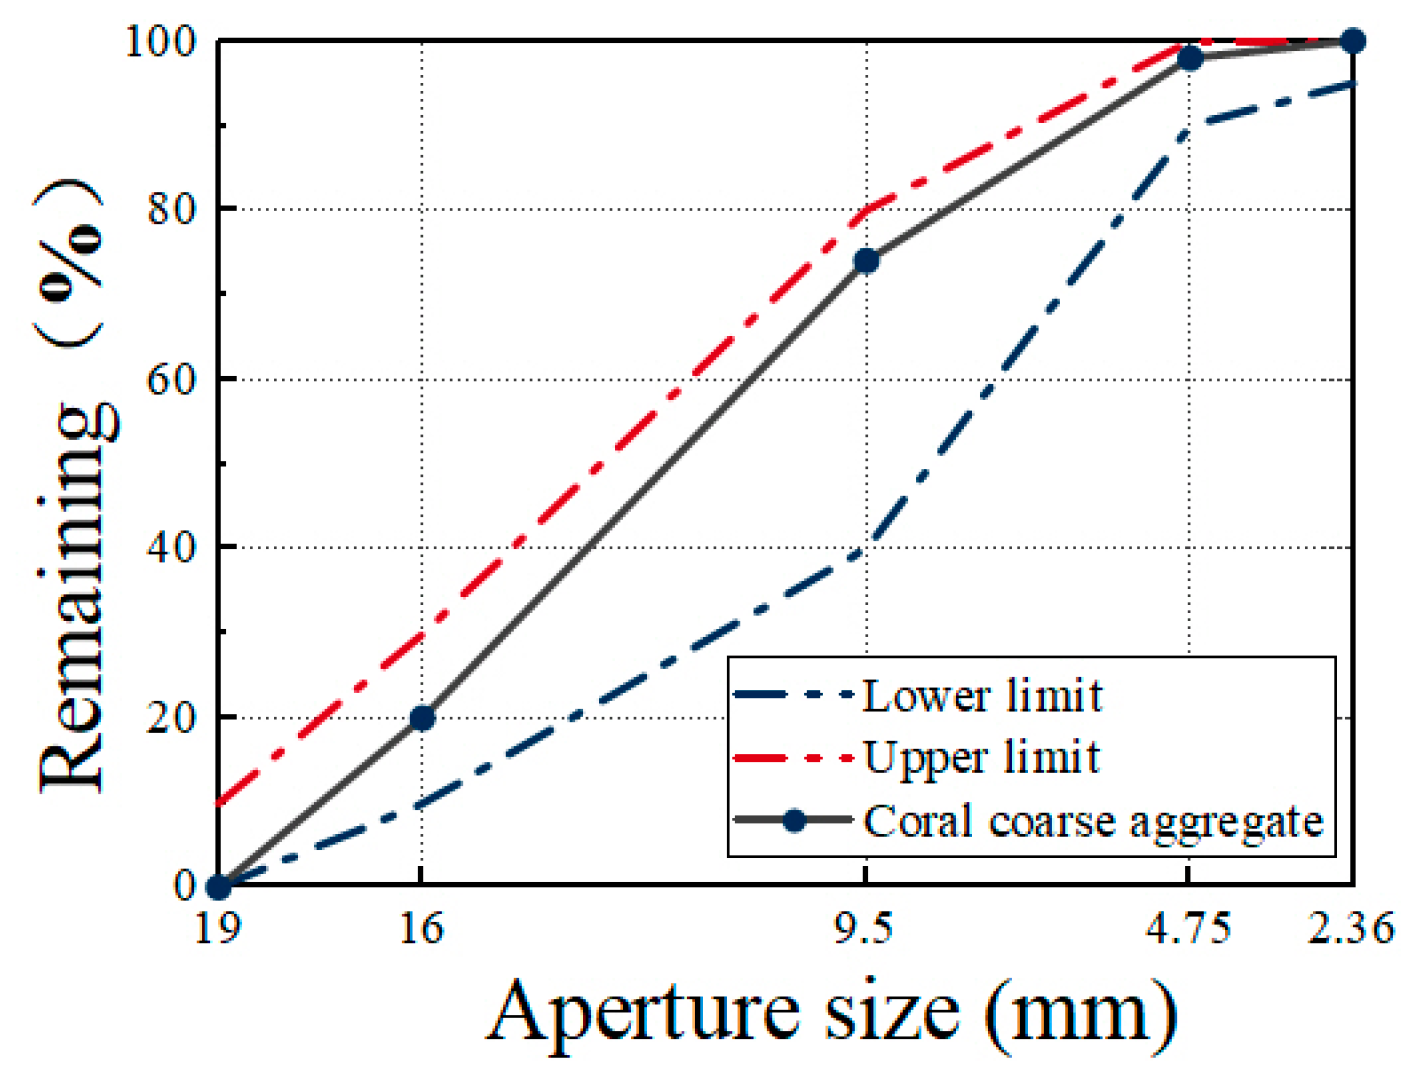
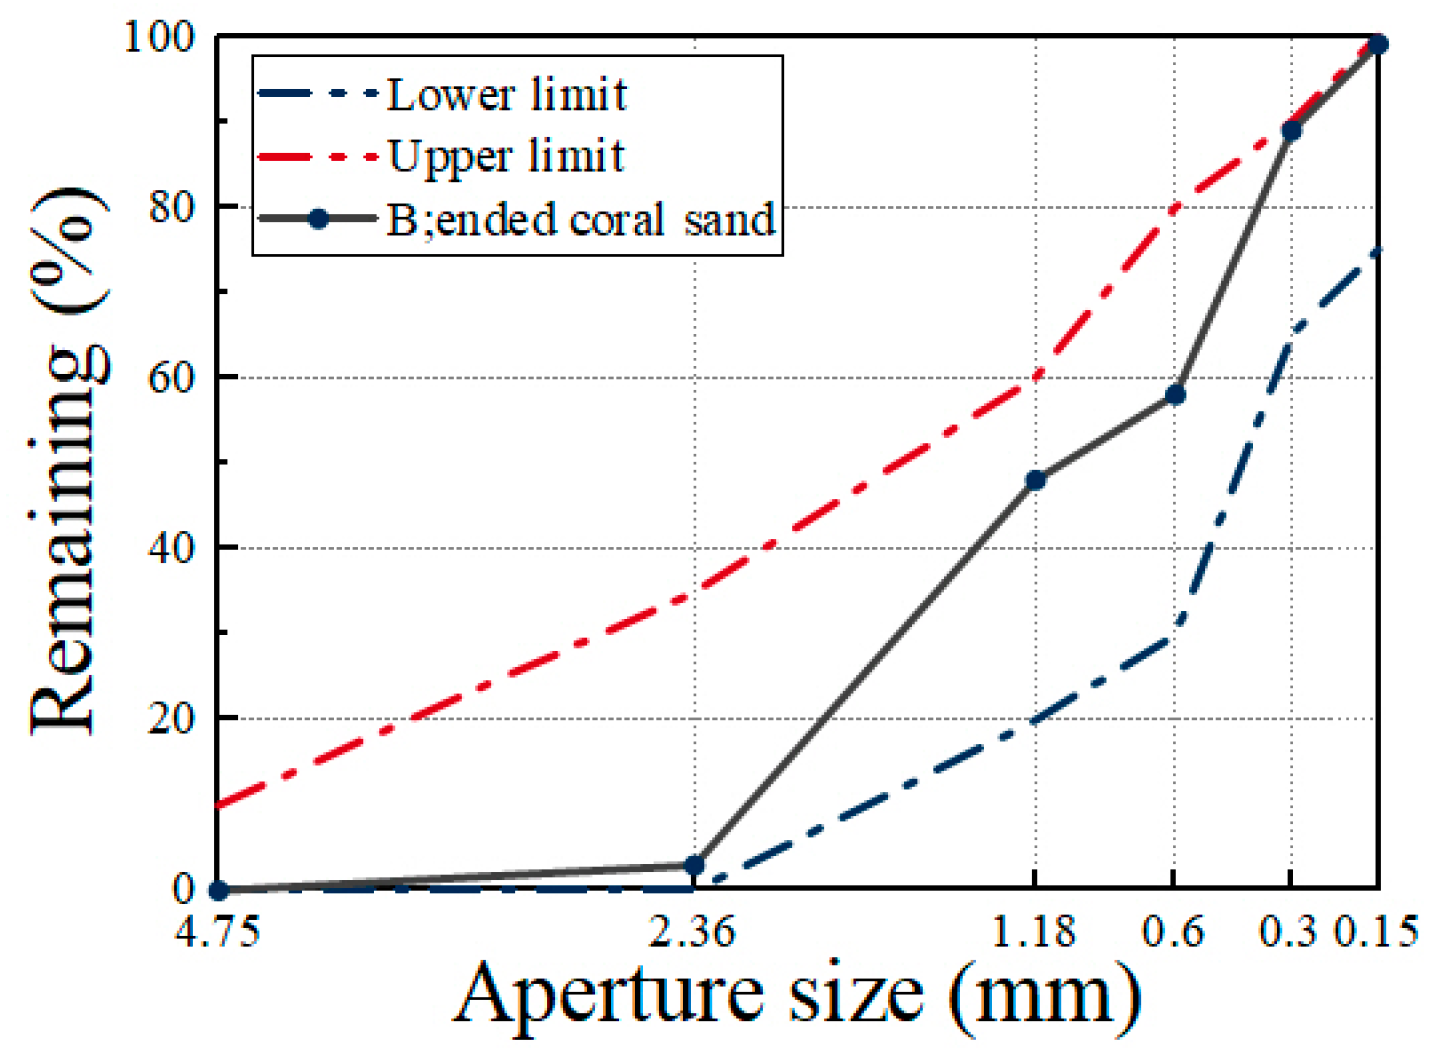
2.1. Raw Material and Mix Ratio of Concrete

This study utilized coral fragments from the Philippines as coarse aggregates (Figure 1) and fine aggregates (Figure 2 and Figure 3). The original coral coarse aggregate (CCA) contained a significant number of coral particles with diameters exceeding 20 mm. In this study, a jaw crusher was used for secondary crushing to prevent an excessive proportion of large-sized coral aggregates from affecting the development of concrete strength. The particle size of the crushed CCA ranged from 2.36 mm to 19 mm, as shown in Figure 4, which was determined based on the sieve analysis and material properties according to the standard JGJ51-2002 [32]. Table 1 presents the physical properties of the CCA.
In this study, coral coarse sand and coral fine sand were mixed in a 1:1 mass ratio to obtain mixed coral sand, which helps avoid the issue of a single type of coral sand leading to poor gradation, which can be detrimental to the development of concrete strength. The particle size distribution of the mixed coral sand was analyzed, and its material properties were measured in accordance with standards GB/T17431-2010 [33] and JGJ52-2006 [34]. The relevant parameters are presented in Figure 5 and Table 2. The blended coral sand was classified as a lightweight aggregate, with a fineness modulus of 3.0, falling into the medium sand zone II, and had a continuous grading.
Table 3 presents the mix proportion for the CAGC. The binder included high-activity, alkaline S95-grade slag powder, and Class I fly ash. The alkaline activator was a sodium silicate solution with a modulus of 1.0, and seawater was prepared according to the artificial seawater formulation by Liu [35], with the main components shown in Table 4 and Composition shown in Table 5. The slag powder (SL) was a high-activity, alkaline S95-grade slag powder. The fly ash (FA) was Class I fly ash. The alkaline activator was prepared by mixing liquid sodium silicate and solid NaOH particles, with sodium silicate having a modulus of 2.46, and sodium silicate containing 12.40% Na2O and 29.54% SiO2. Additionally, the NaOH used had a purity of 99% or higher. The combination of these materials adjusted the sodium silicate modulus to 1.0. To improve the workability of the concrete, a QS-8020 polycarboxylate superplasticizer (PS) (Shanghai Qinhe Chemical Products Co., LTD) was used. Uniaxial compression tests were conducted on cubic specimens (150 × 150 × 150 mm) and prism specimens (150 × 150 × 300 mm) under the same curing conditions to obtain their compressive strength (fcu), axial compressive strength (fc), and uniaxial compressive stress–strain curves, where fcu is the measured compressive strength of the concrete cube for 28d curing; fc is the measured value of the axial compressive strength of the concrete for 28d curing.

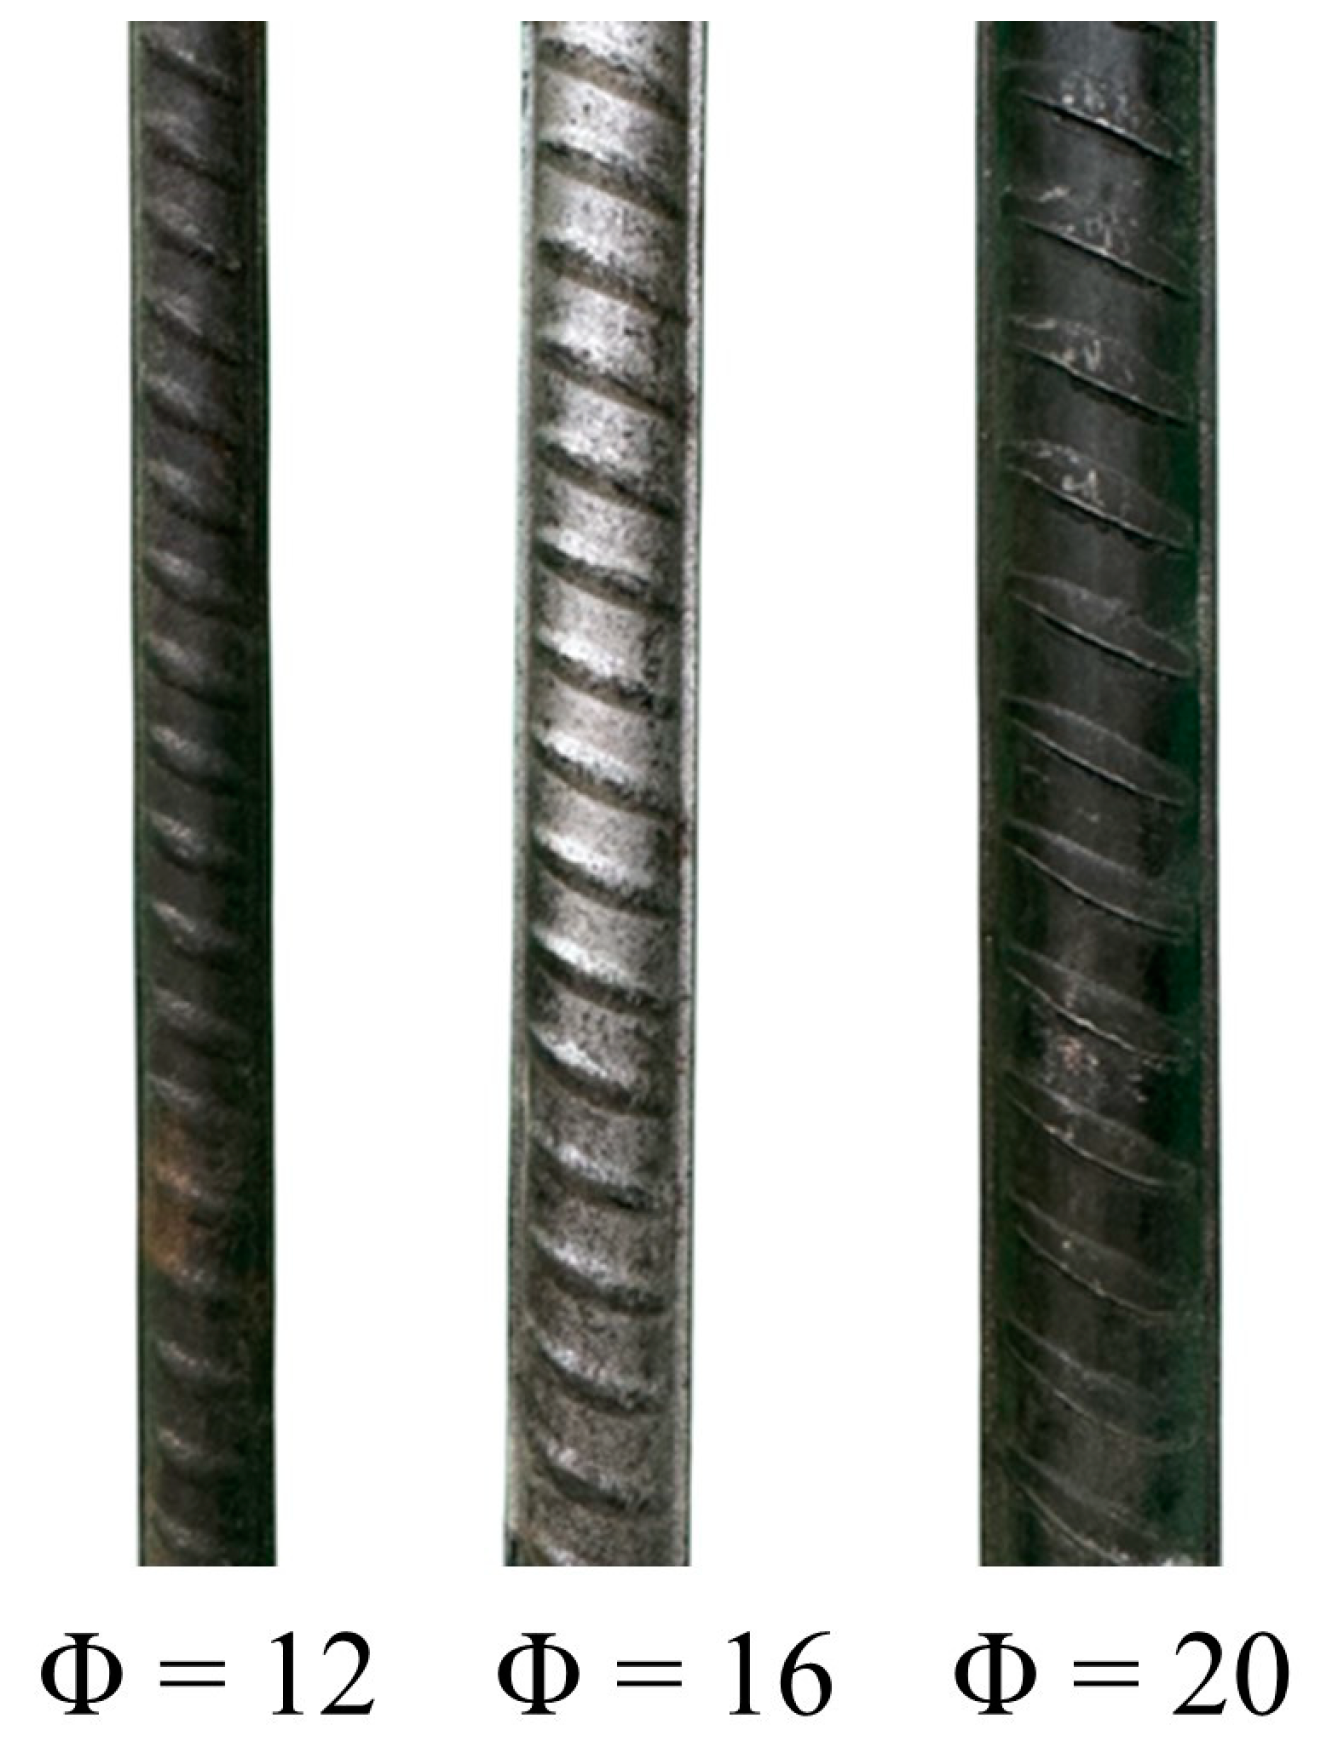
2.2. Tensile Performance of SSRs

Figure 6 shows the 304 SSR used in this study. According to the standard GB/T228.1-2021 [36], a WAW-600 electro-hydraulic servo testing machine (Yanrun Light Machine Technology Co., Ltd. in Shanghai, China)was employed to conduct tensile tests on SSRs of various diameters at room temperature (Figure 7). Table 6 shows the fundamental mechanical properties of the SSRs. Unlike an ordinary carbon steel rebar, the SSR did not exhibit a yield plateau; therefore, its nominal yield strength was defined as the stress corresponding to a 0.2% plastic strain. The nominal yield strength of the SSR was 515.0 MPa, with a tensile strength of 804.1 MPa, an average elastic modulus of 167.1 GPa, and an elongation after fracture of 40.0%, indicating it was a ductile rebar material.

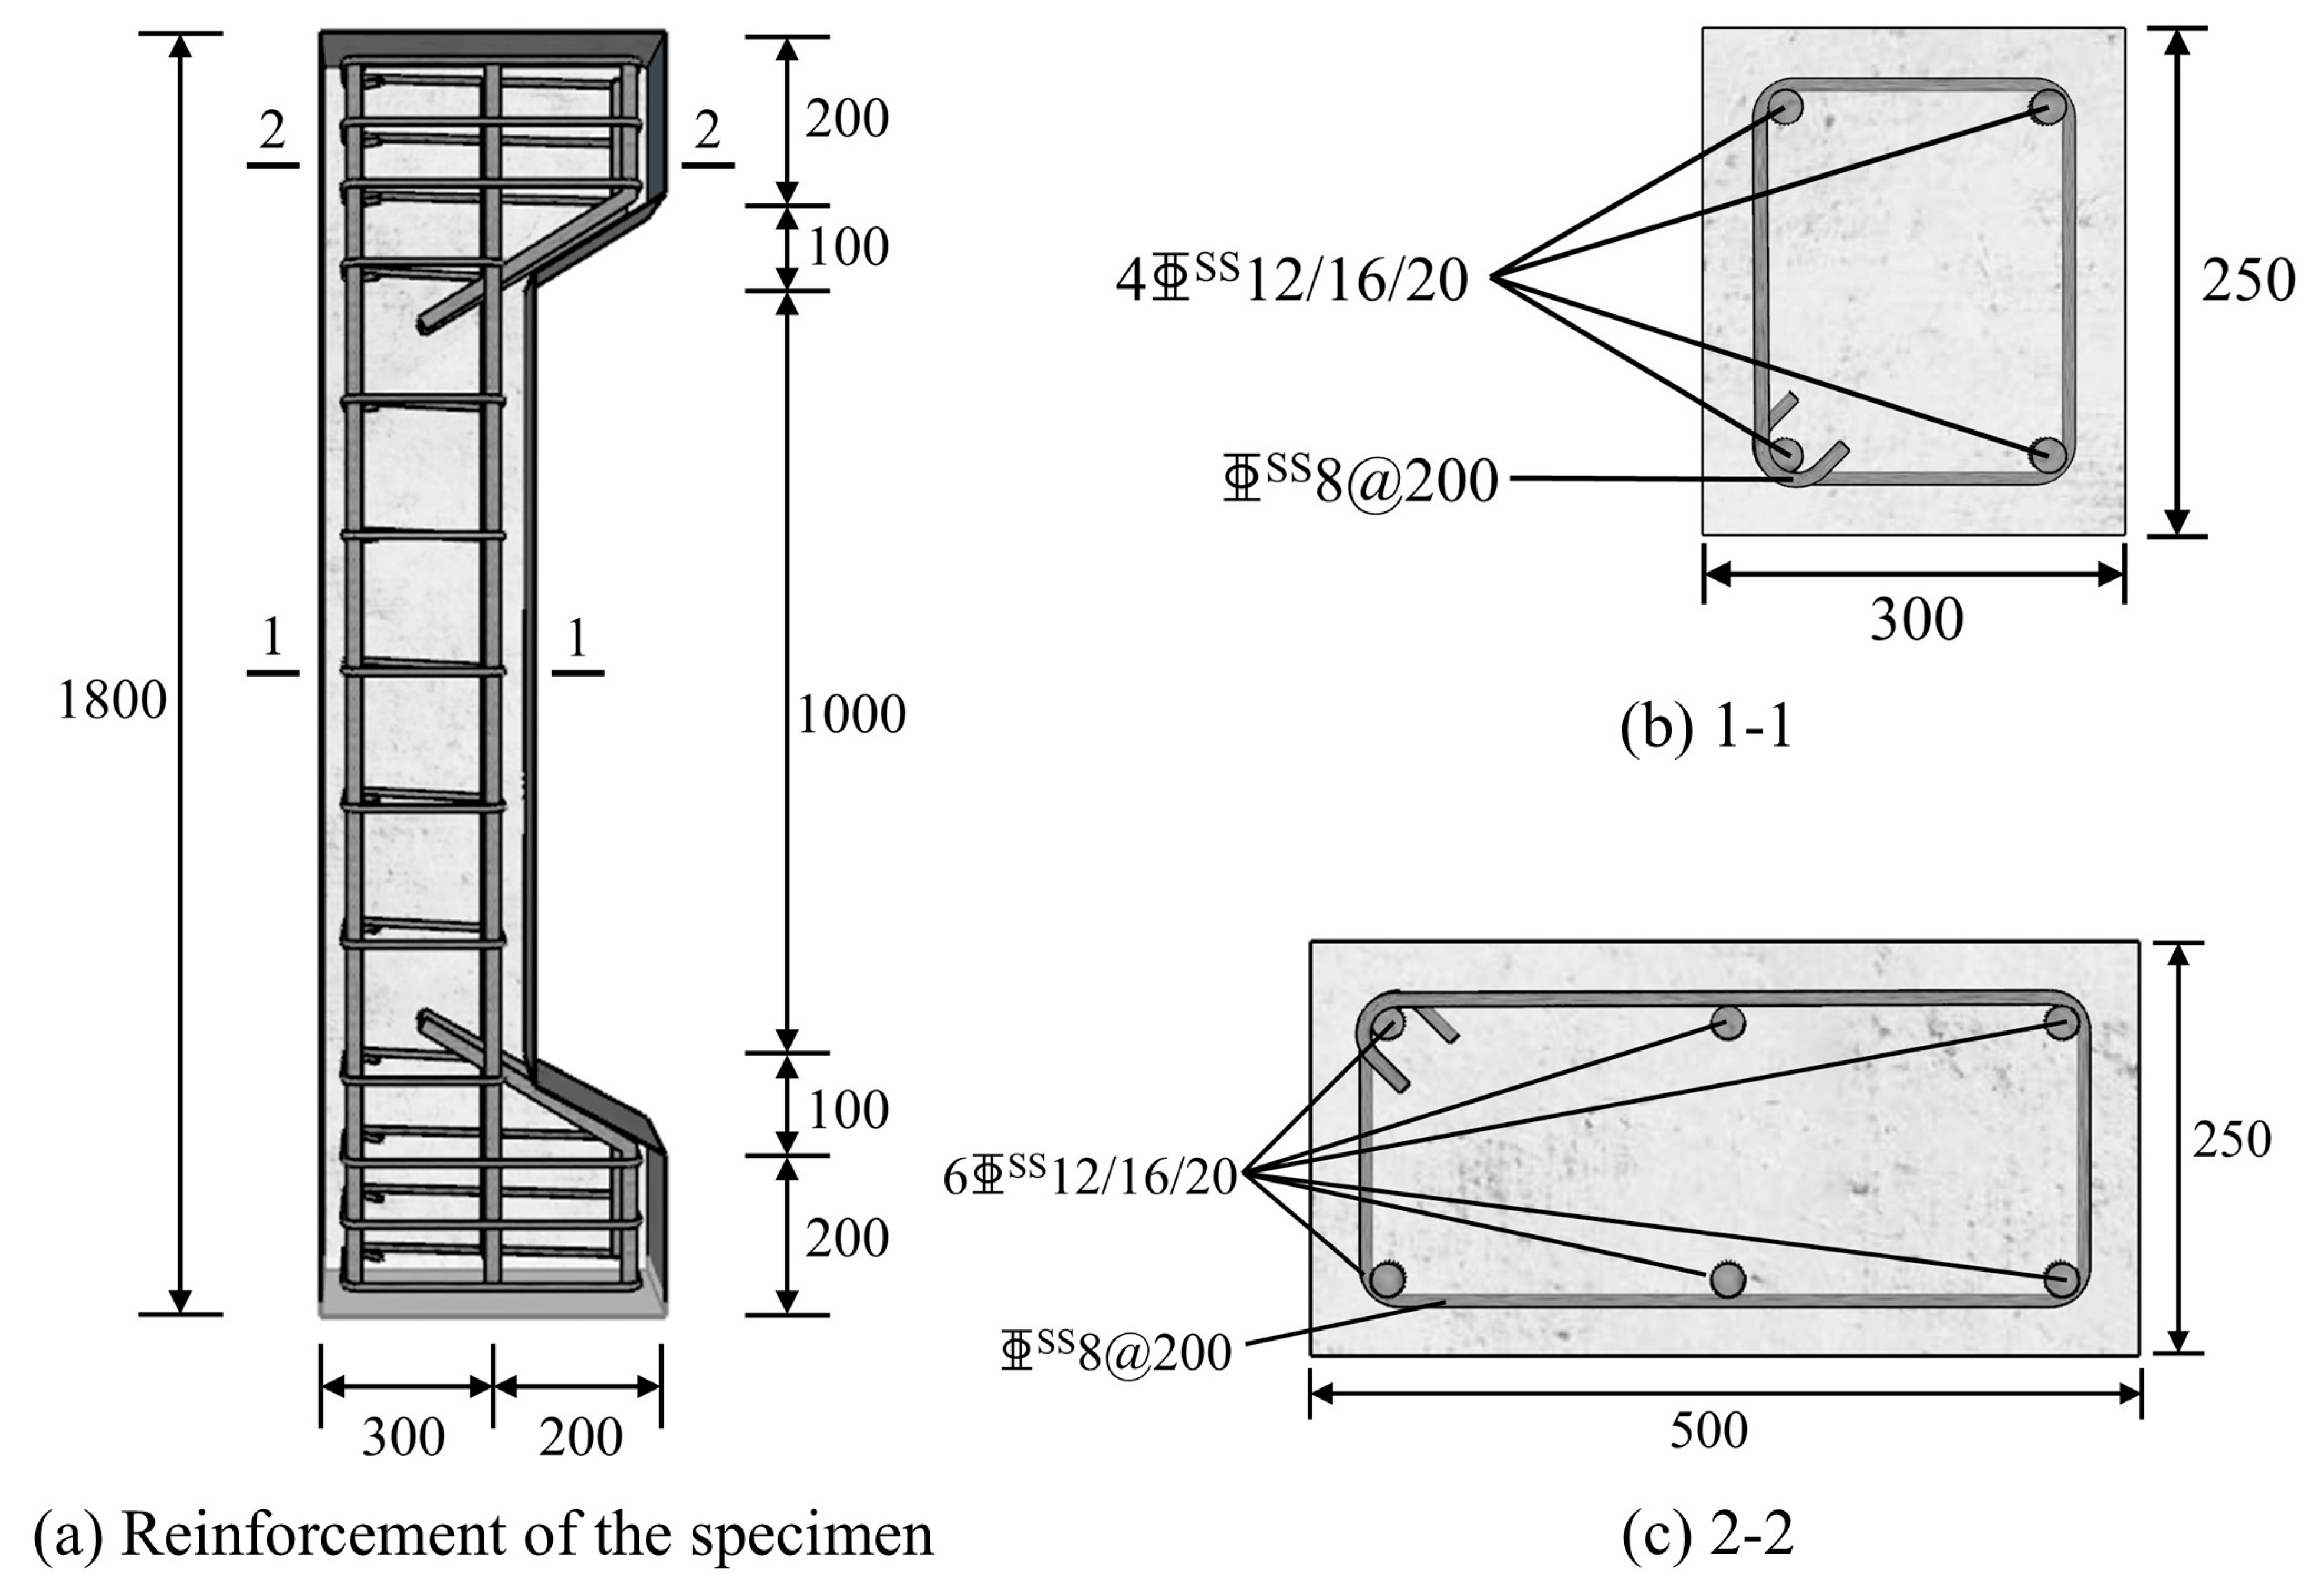
2.3. Eccentric Compression Column Design
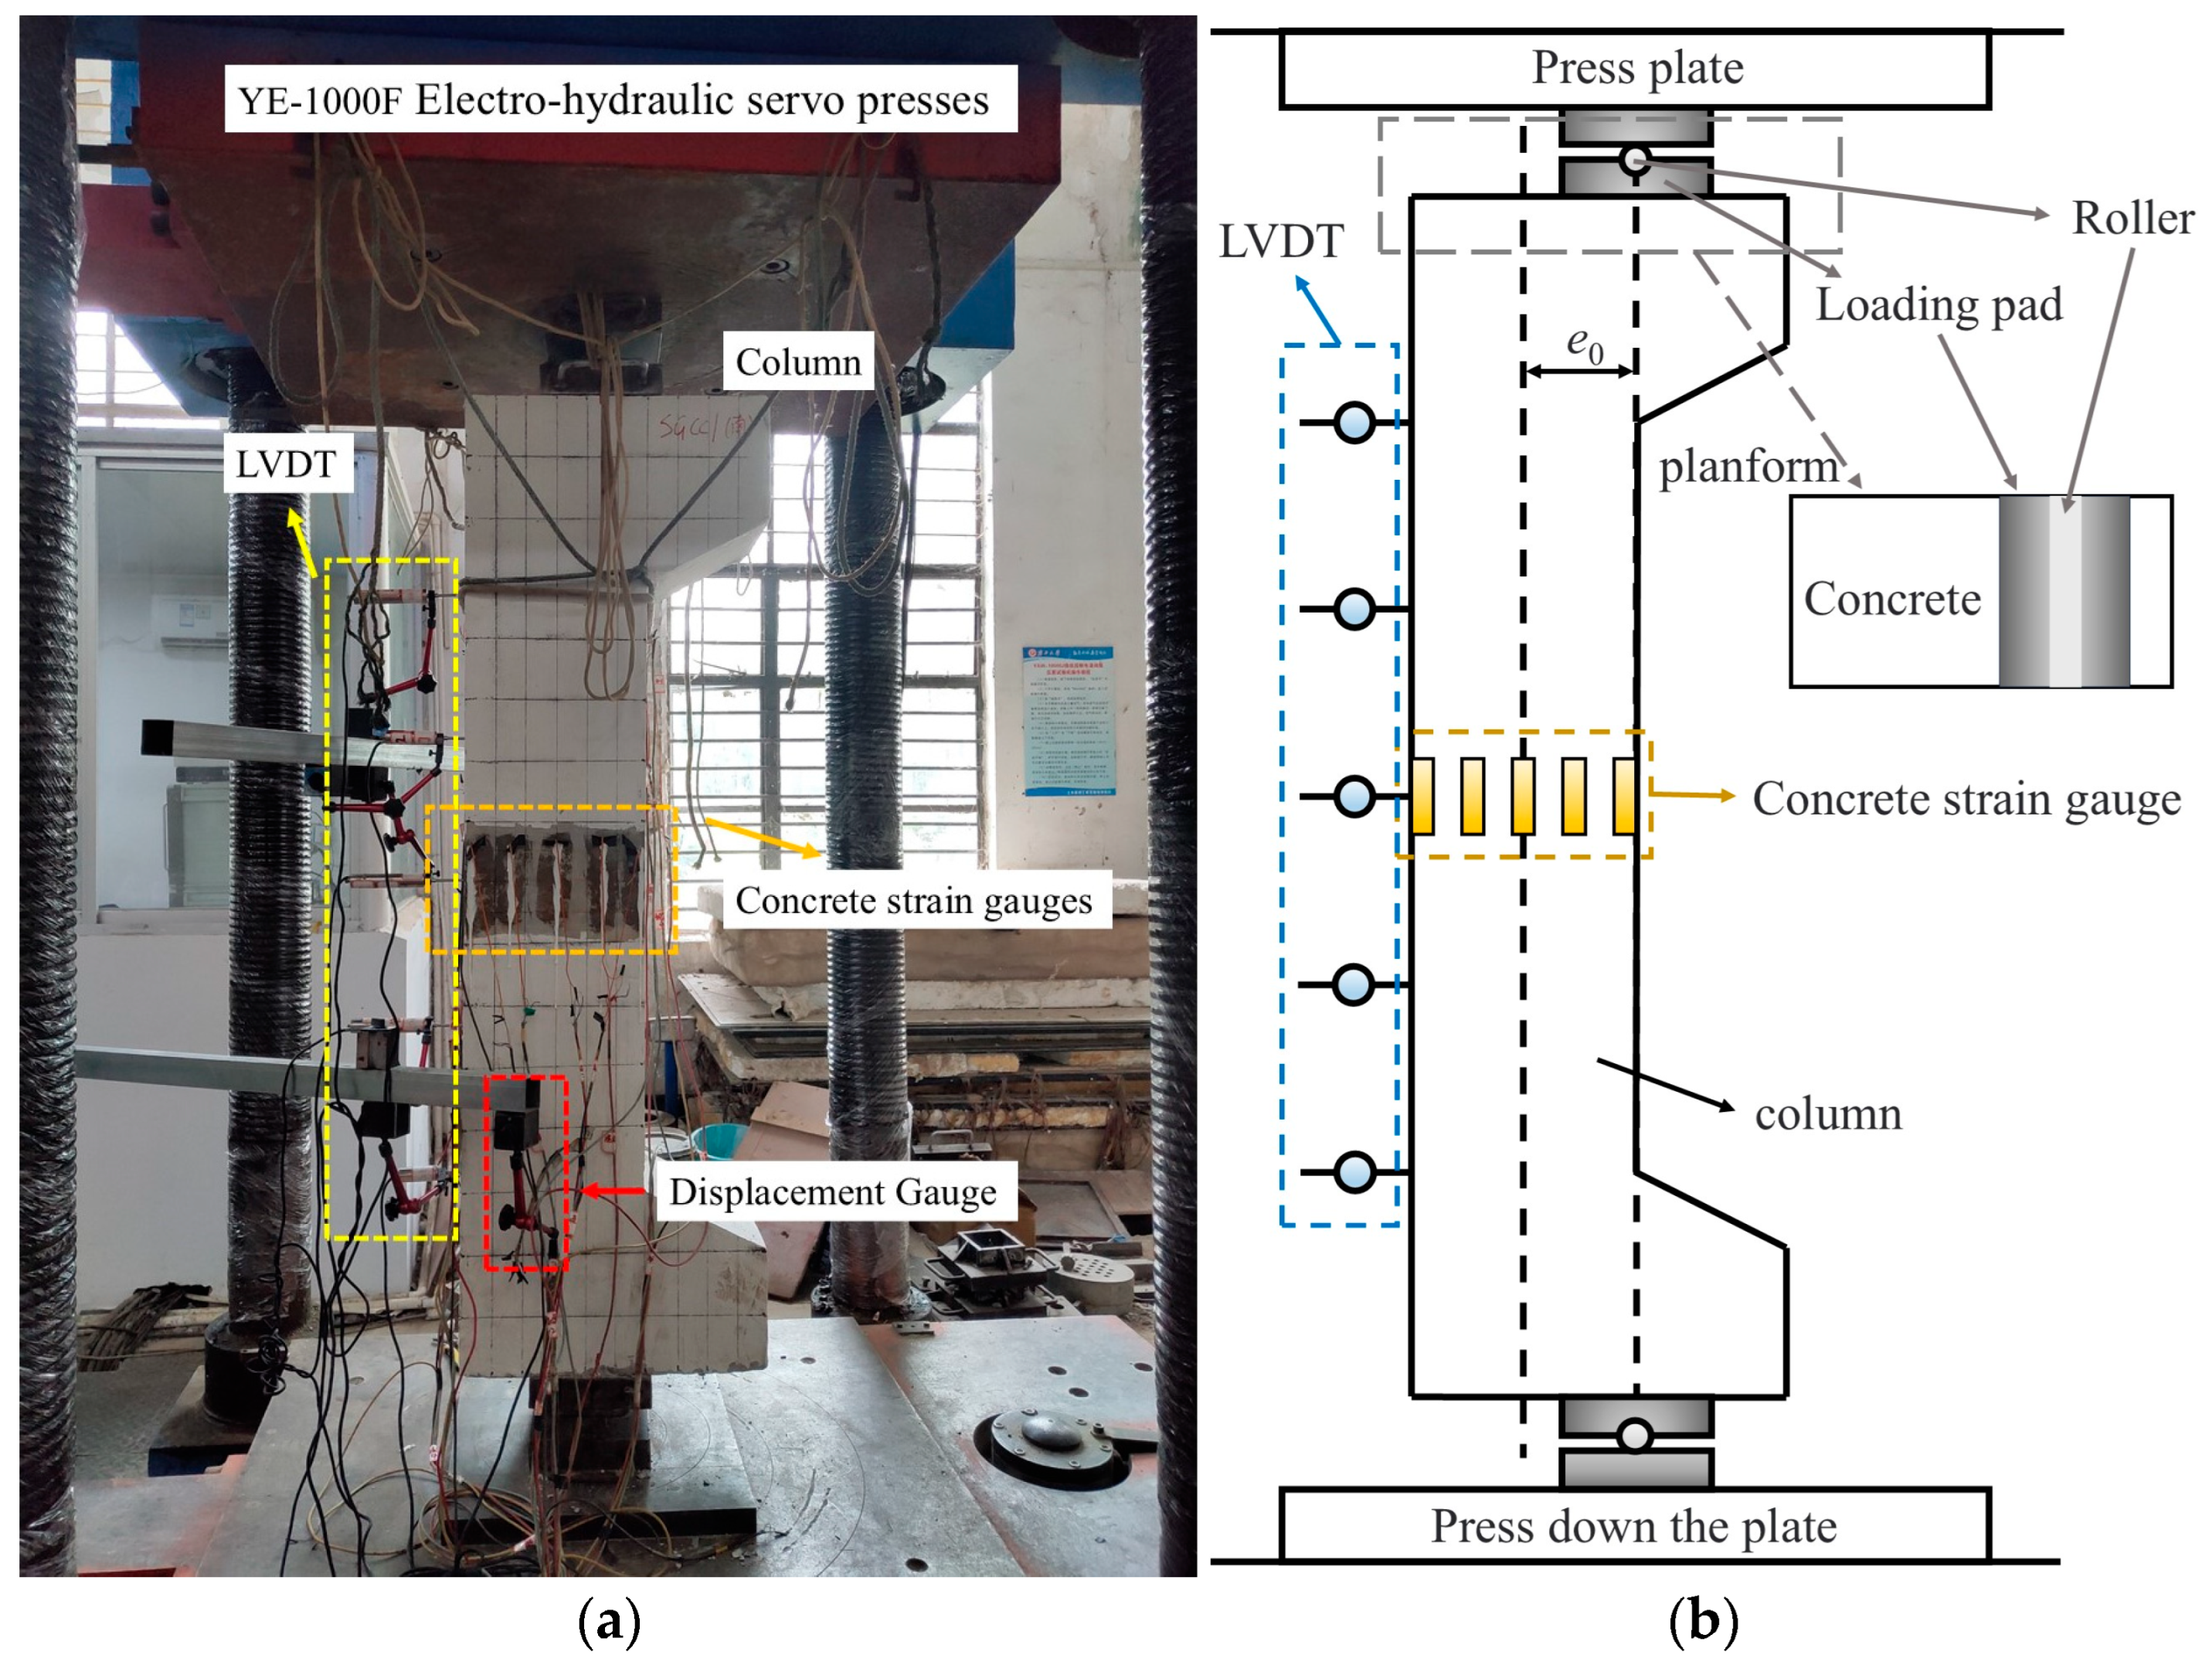
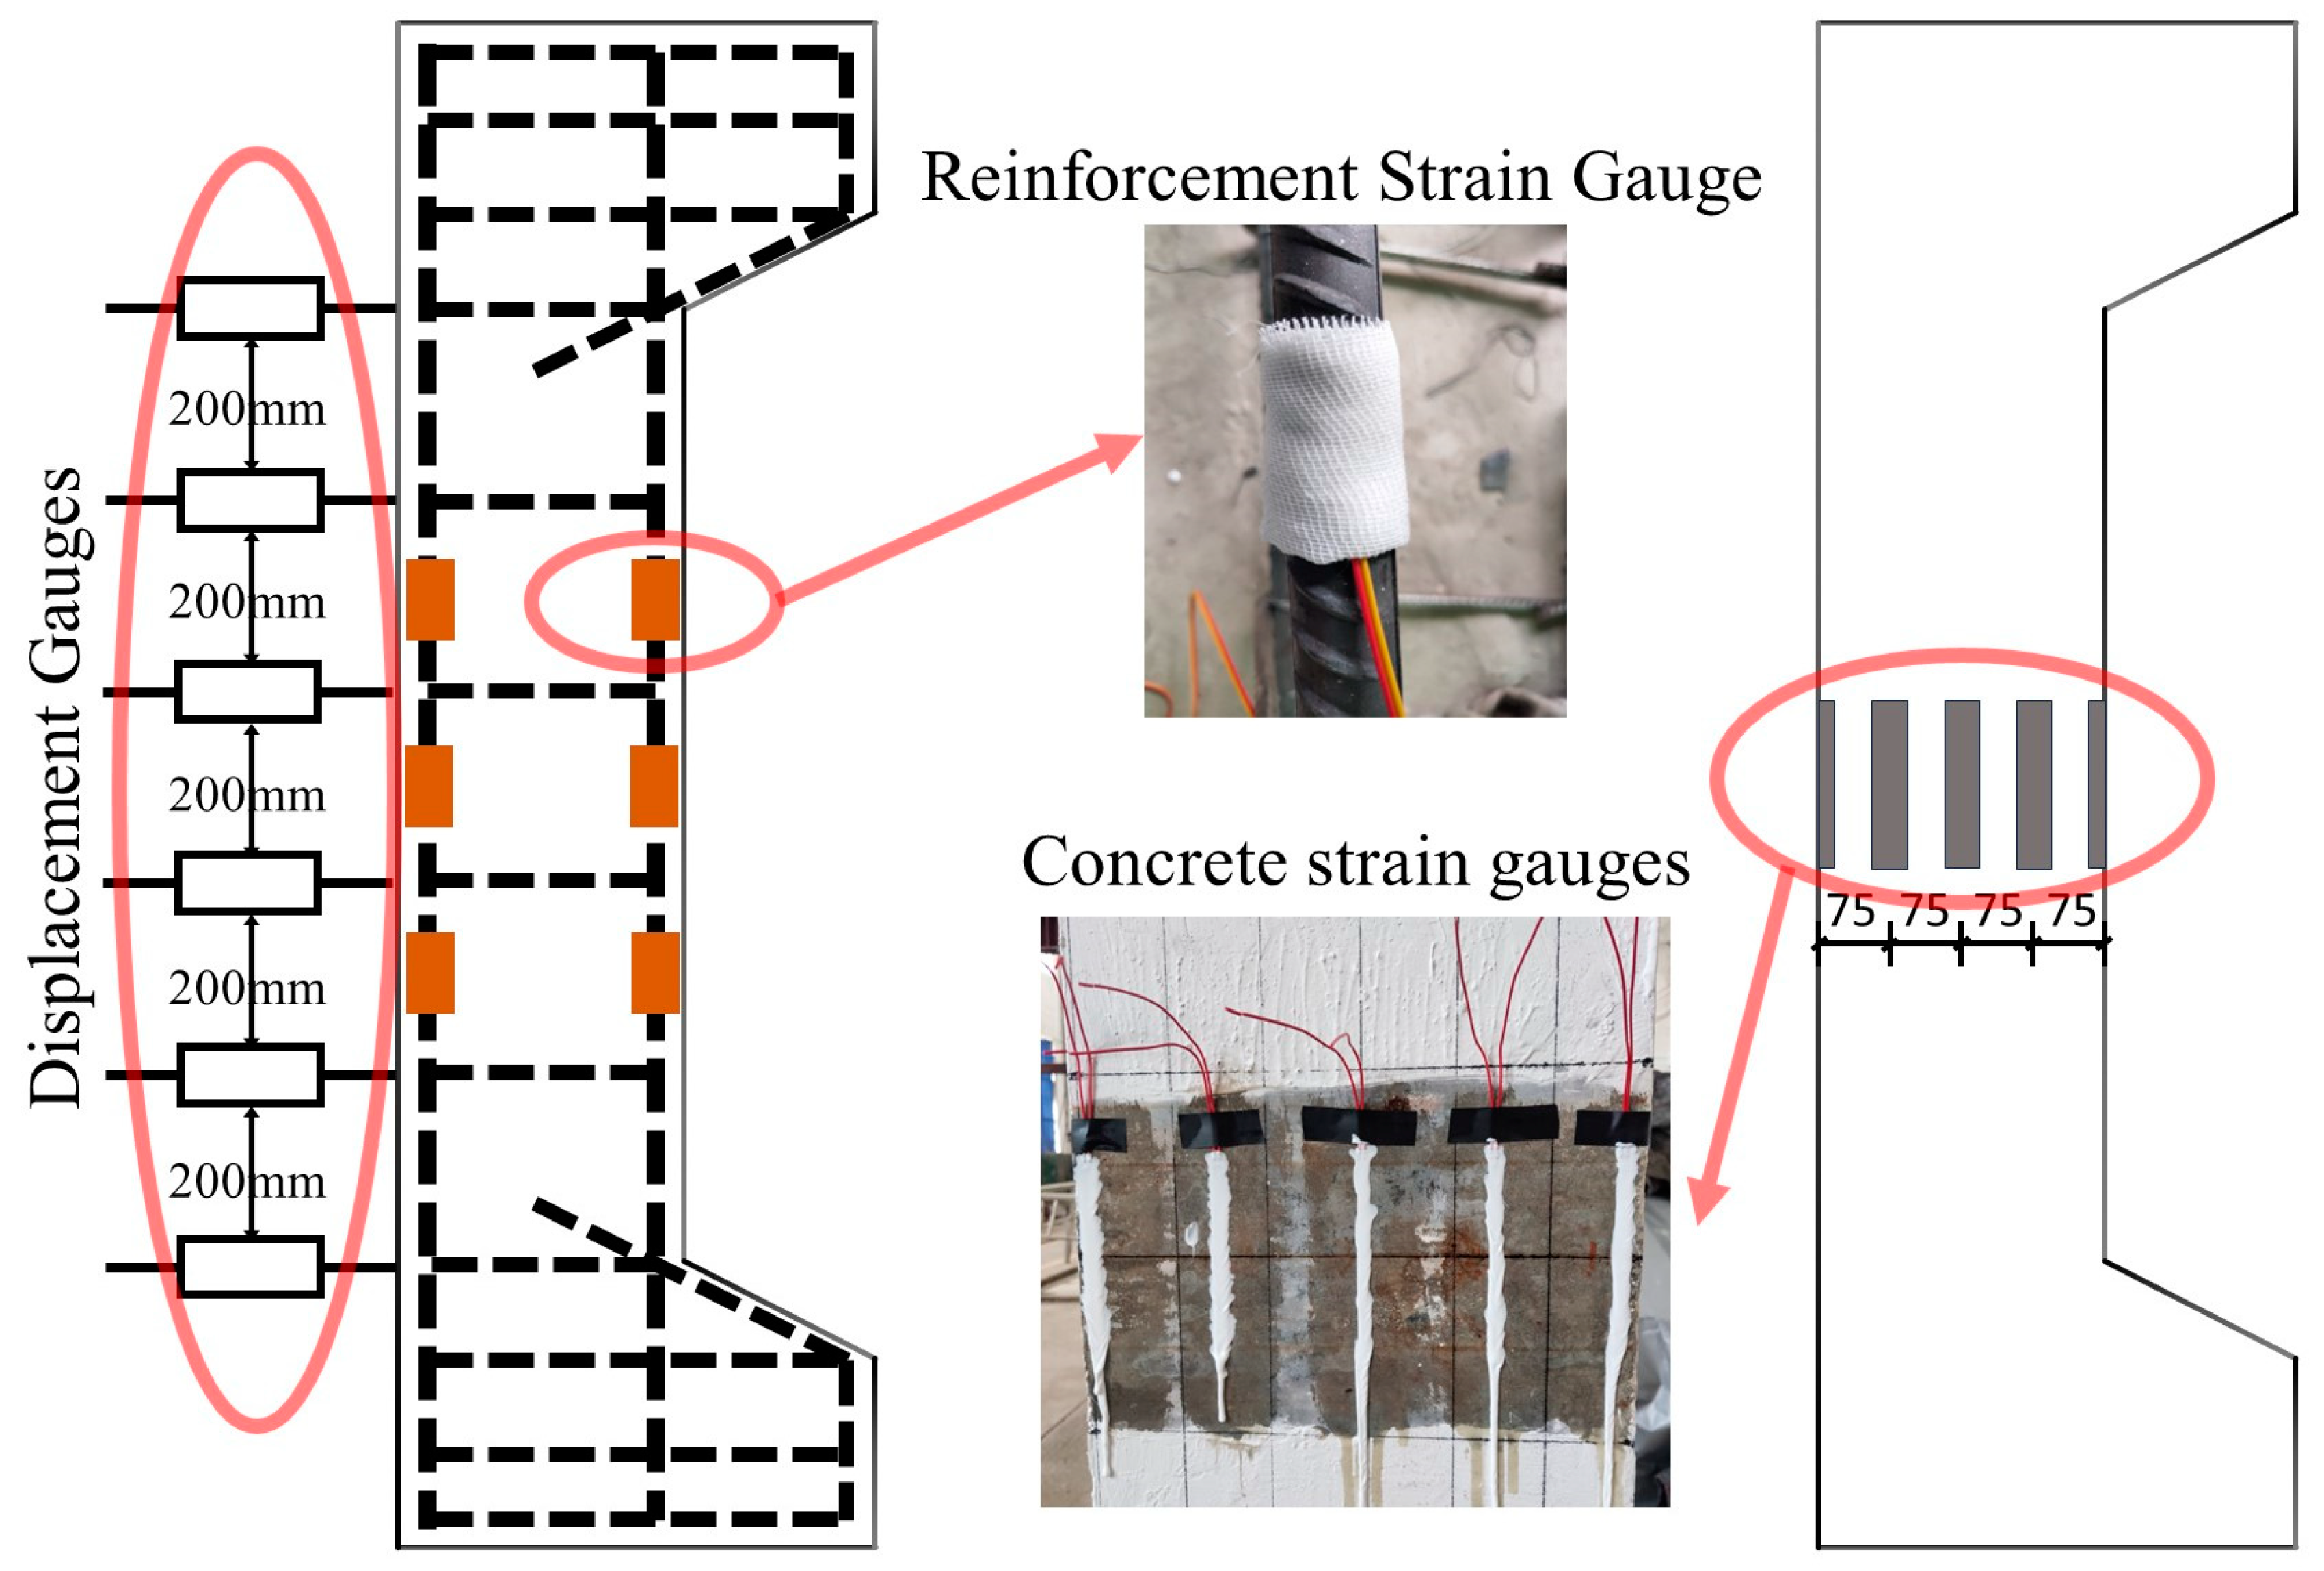
Table 7 shows the detailed parameters of each specimen, where b is the width, h is the height, and l is the length of the cross-section of the SCGCs, in mm; d is the diameter of the longitudinal bars, in mm. Figure 8 shows the schematic diagram of the distribution of reinforcement bars in the specimens, where “DSS” represents the 304 SSR used in this test. The longitudinal and transverse reinforcement of the eight SCGC specimens used 304 SSRs, labeled as SCGC1 to SCGC8, according to different values of ρs and e0. The specimens had a rectangular cross-section with dimensions of 250 mm × 300 mm and a symmetrical reinforcement arrangement. The central section included four longitudinal SSRs of the same diameter, with the longitudinal reinforcement ratios set at 0.302%, 0.536%, and 0.838%, and eccentricities set at 70 mm, 140 mm, 210 mm, and 280 mm. The stirrup diameter spacing was set at 200 mm, with a cover thickness of 30 mm, to closely match practical engineering conditions. Loading and end damage prevention were prioritized during testing. The ends of the SCGC specimens were equipped with enlarged loading flanges and densified stirrups in the flange area. The stirrup spacing was set at 100 mm. Additionally, two SSRs of the same diameter were added to increase the reinforcement ratio.

2.4. Test Setup

The tests were conducted using a YE-1000F electro-hydraulic servo press (Bonwei Electromechanical Control Engineering Co., Ltd. in Hangzhou, China) with a maximum load capacity of 10,000 kN (Figure 9a). To simulate the realistic stress state of eccentrically compressed members, a hinged support structure composed of rollers and loading plates was installed at both ends of the specimen. Both rollers and loading plates were fabricated from Q235 steel, with their long sides matching the width of the specimen’s cross-section (Figure 9b). Pre-marked load application points on the top and bottom surfaces of the specimen enabled the adjustment of the hinged support positions, thereby facilitating the application of various eccentric loads. Strain and displacement data at each loading stage were recorded using a DH3821 static strain measurement system (Donghua Test Technology Co., Ltd. Jingjiang, China).
Figure 10 shows the placement of lateral displacement meters, strain gauges on longitudinal reinforcement, and strain gauges on concrete. Displacement meters were evenly arranged along the height of the column to capture lateral displacements at different stages. Additionally, a single displacement meter was placed on the side to monitor whether the specimen was subjected to unidirectional eccentric compression during loading. A crack width detector was used to observe and measure crack widths, while a ruler was used to measure crack spacing. Concrete strain gauges were evenly attached at the mid-height of the column to measure longitudinal strain at various stages. Strain gauges were also attached at the mid-section of the longitudinal reinforcement and 200 mm above and below this point to measure the strain behavior of the SSR at each stage.

3. Test Result and Analysis

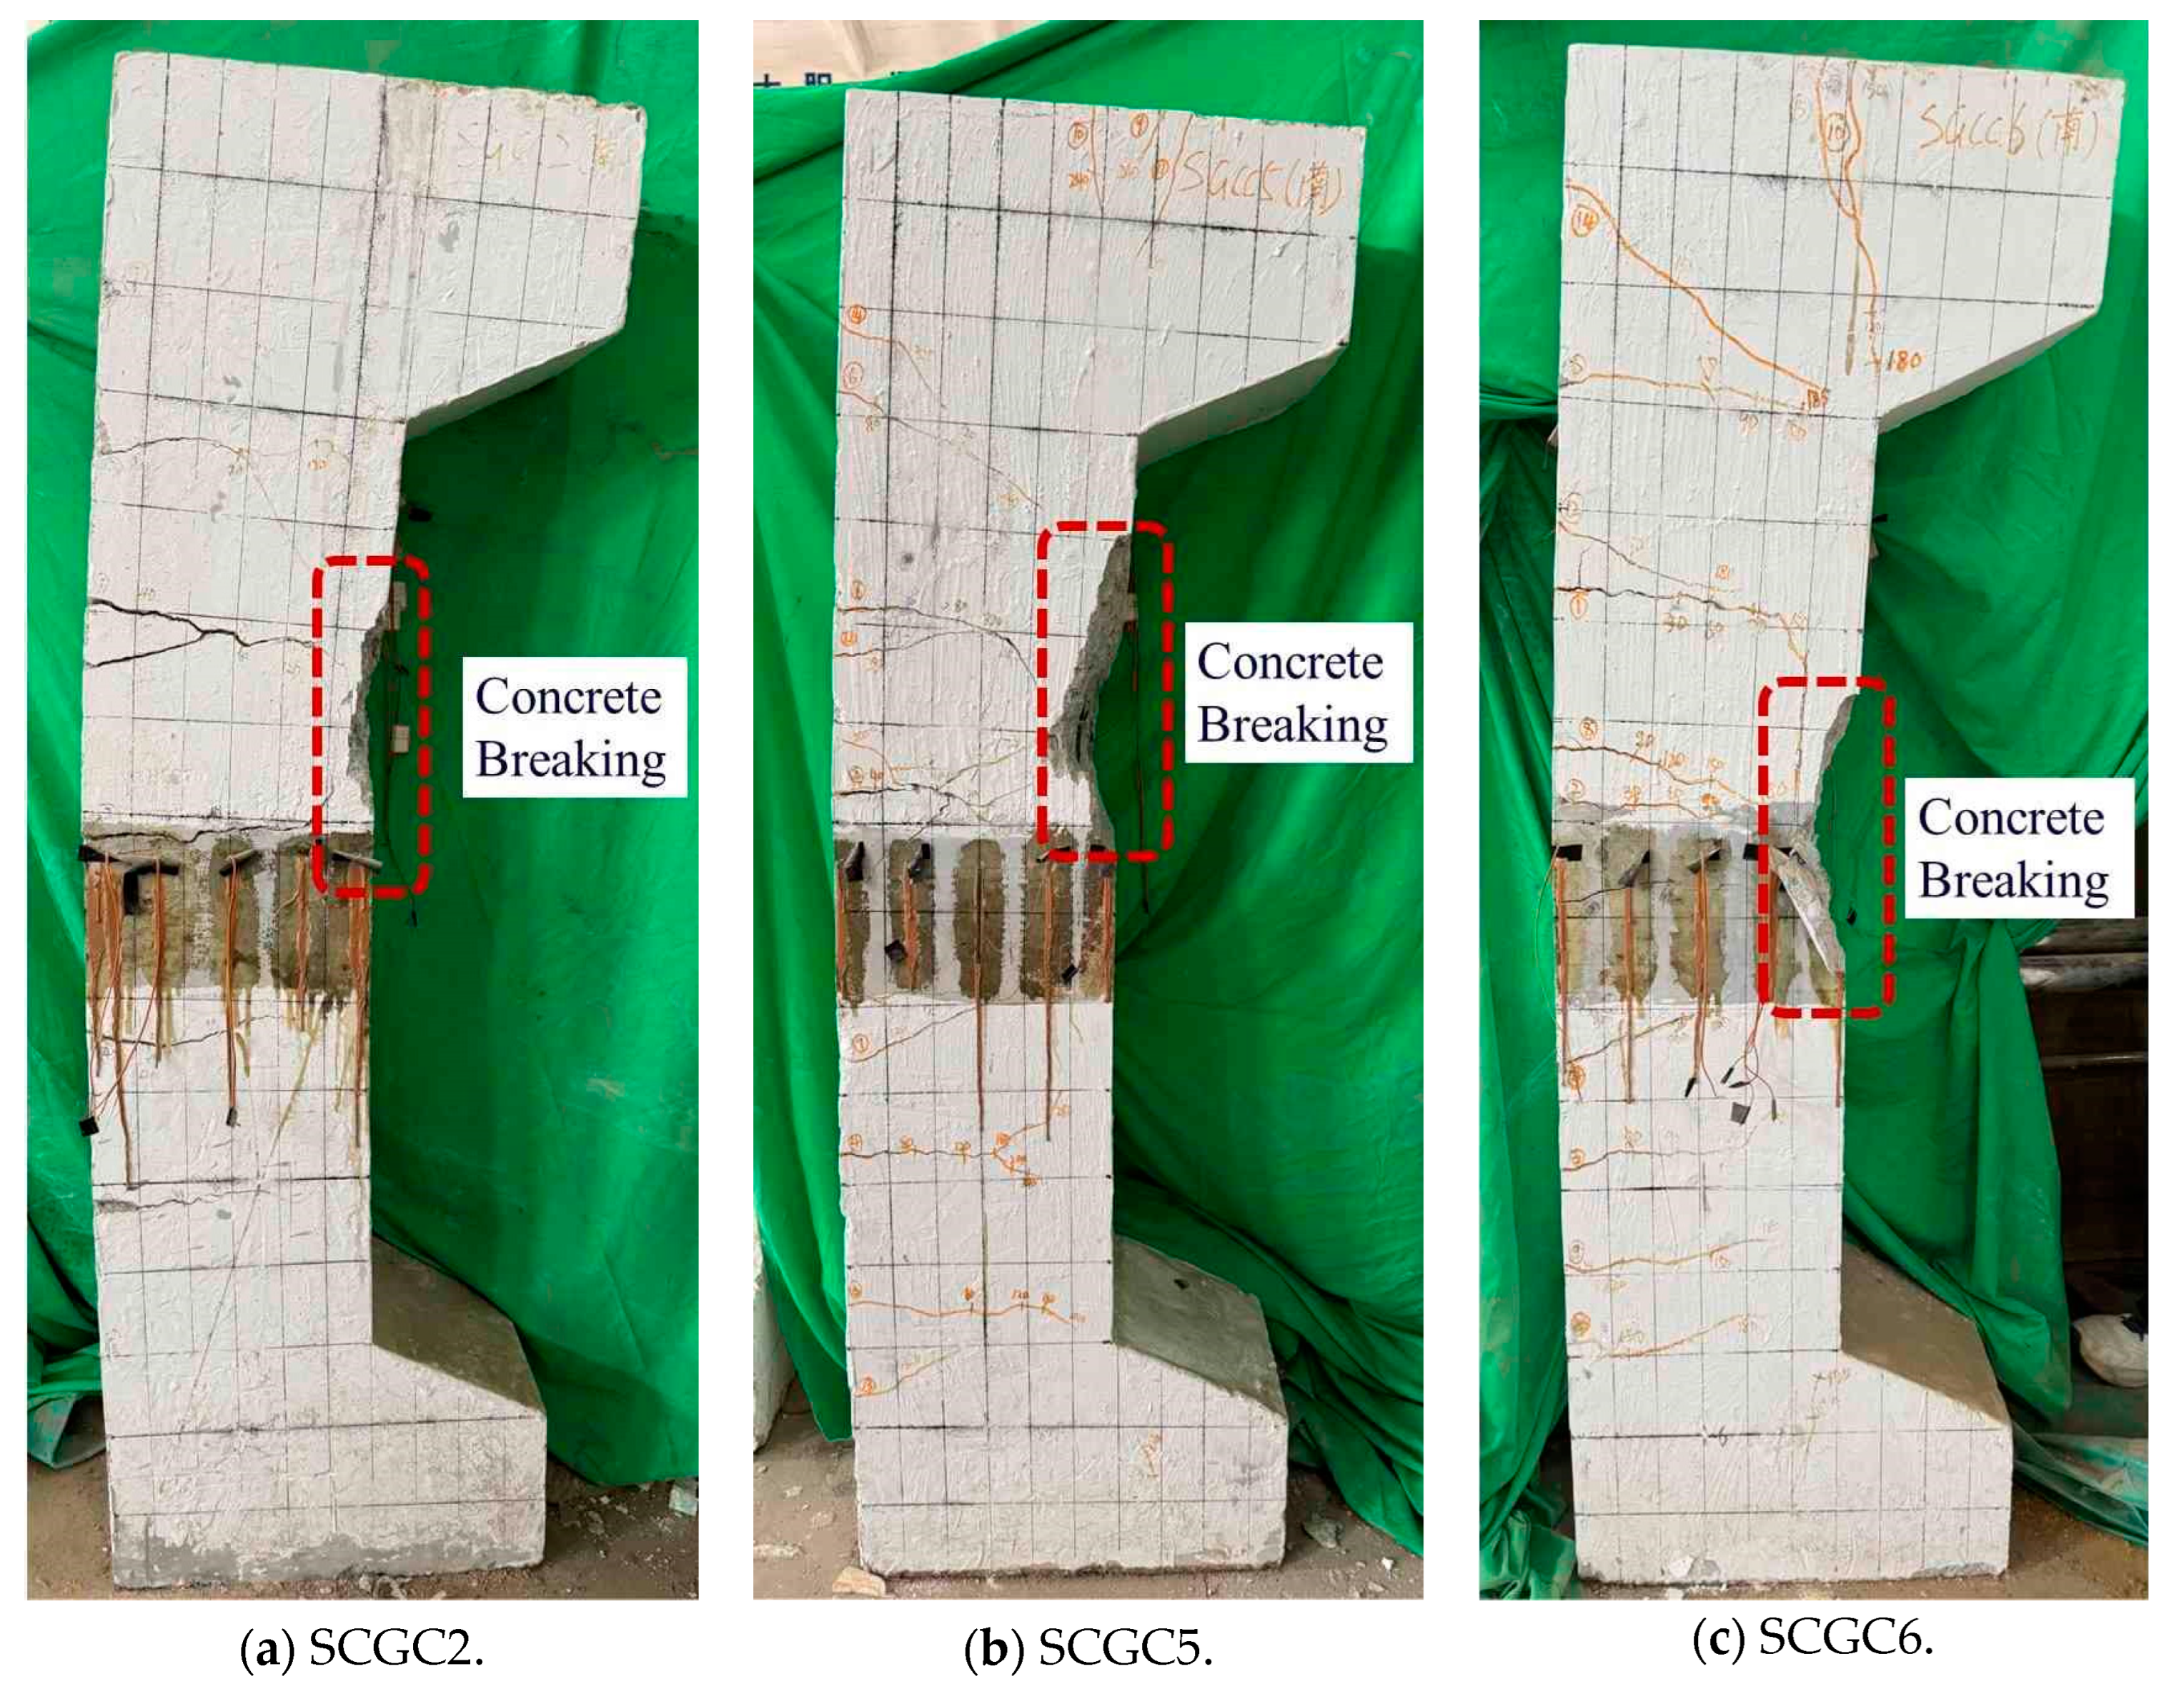
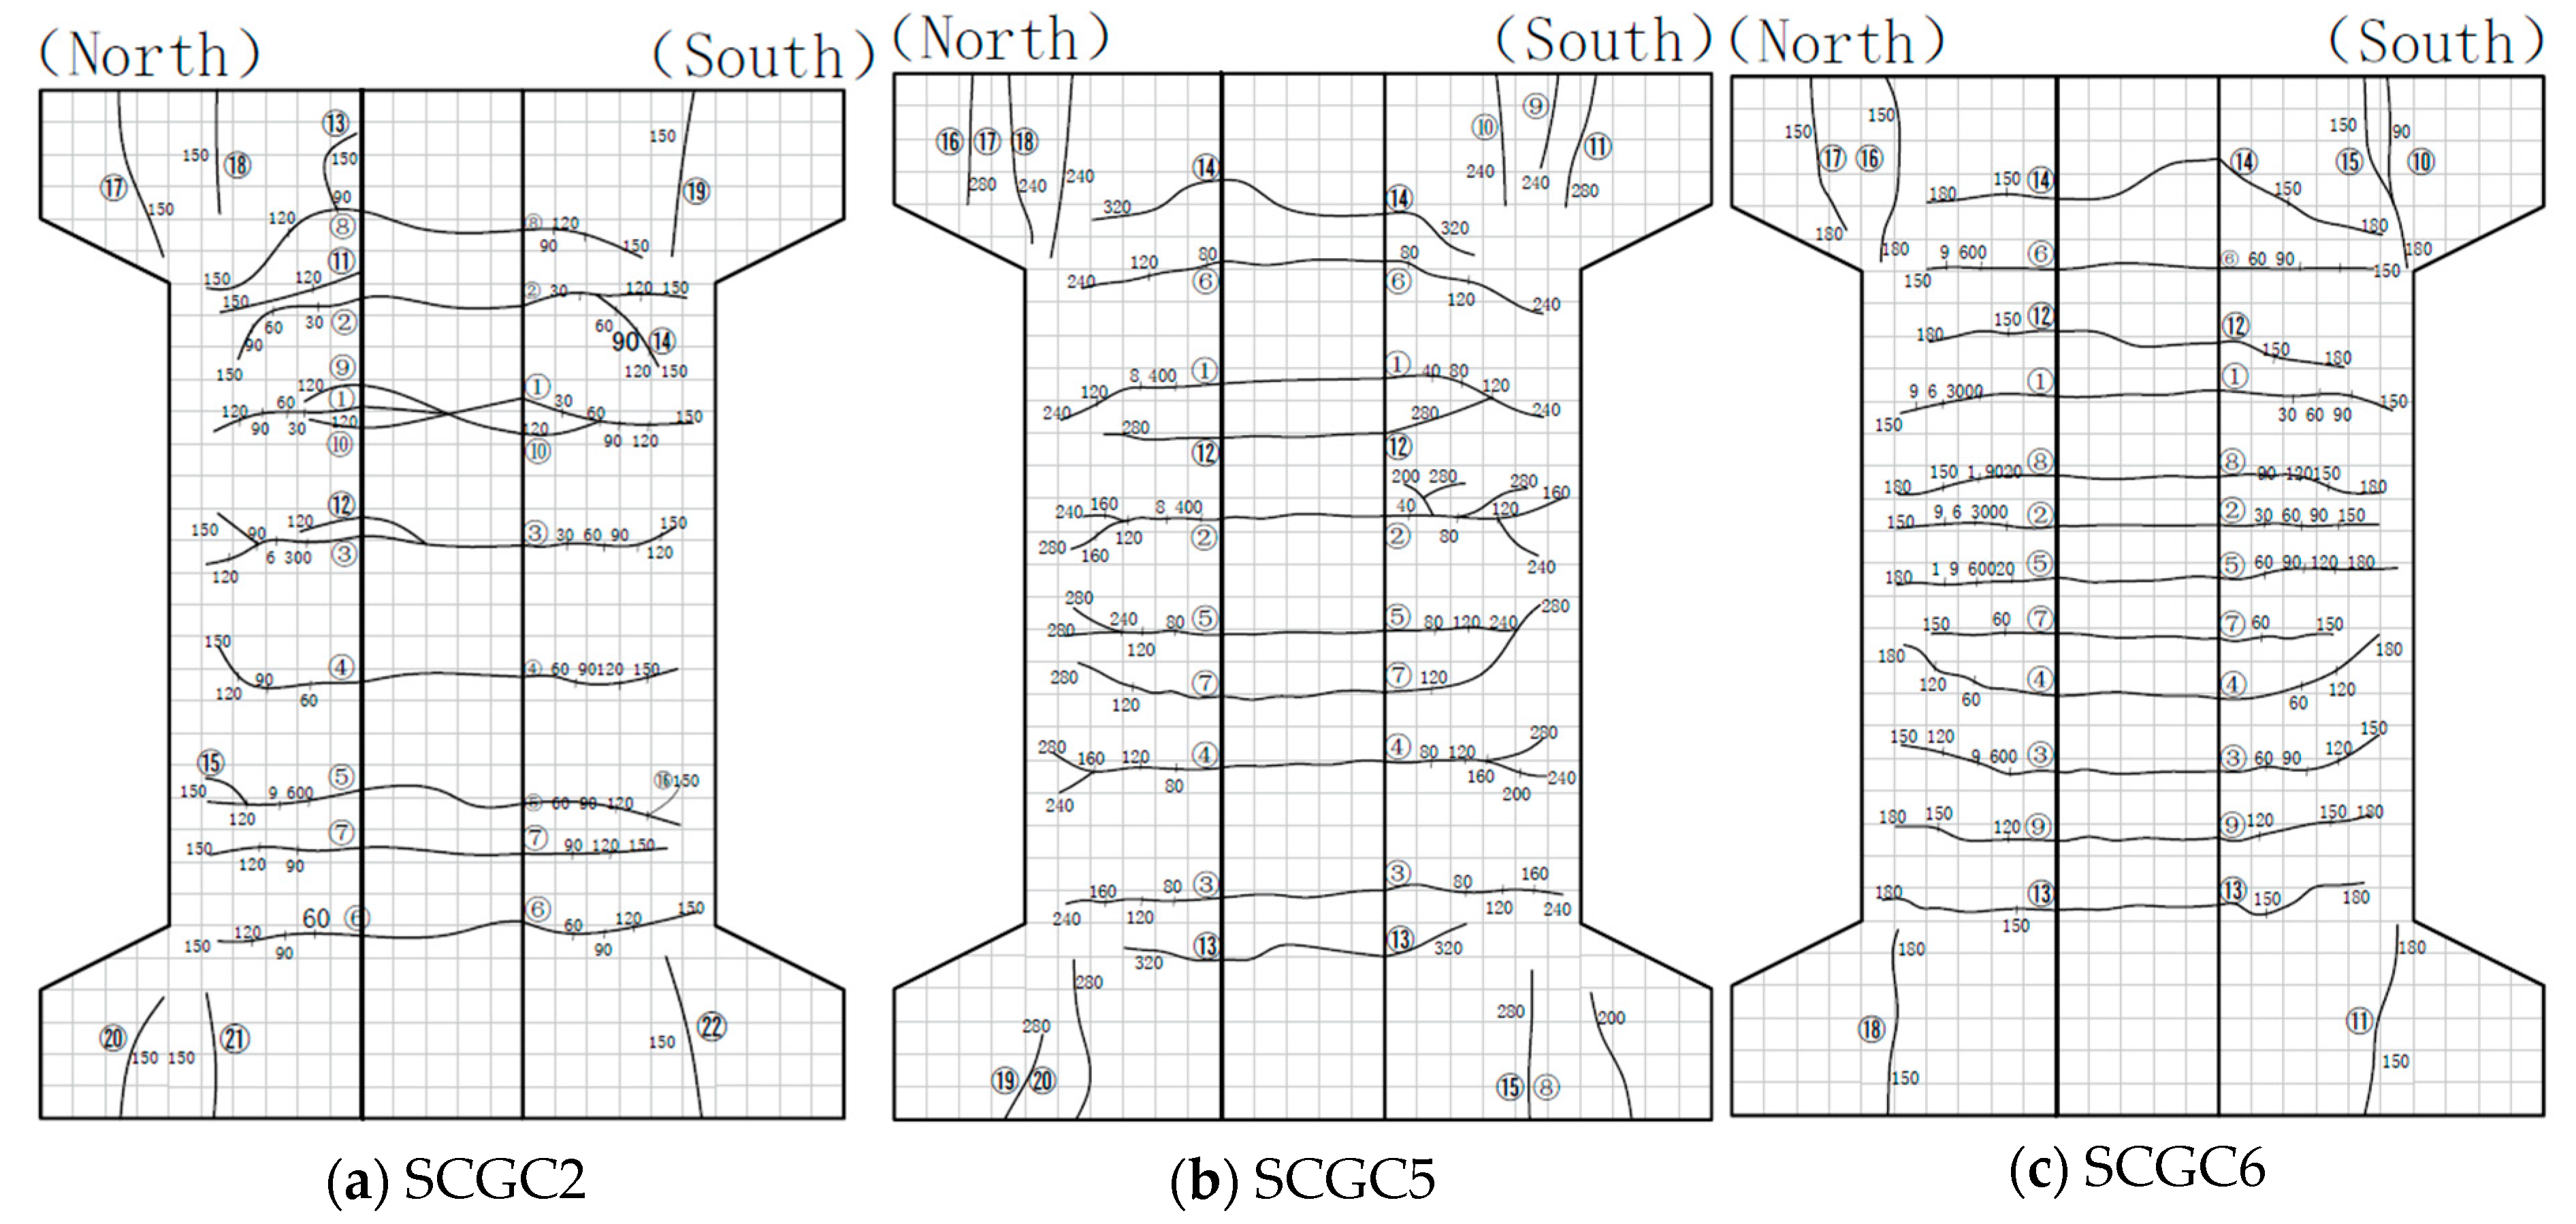
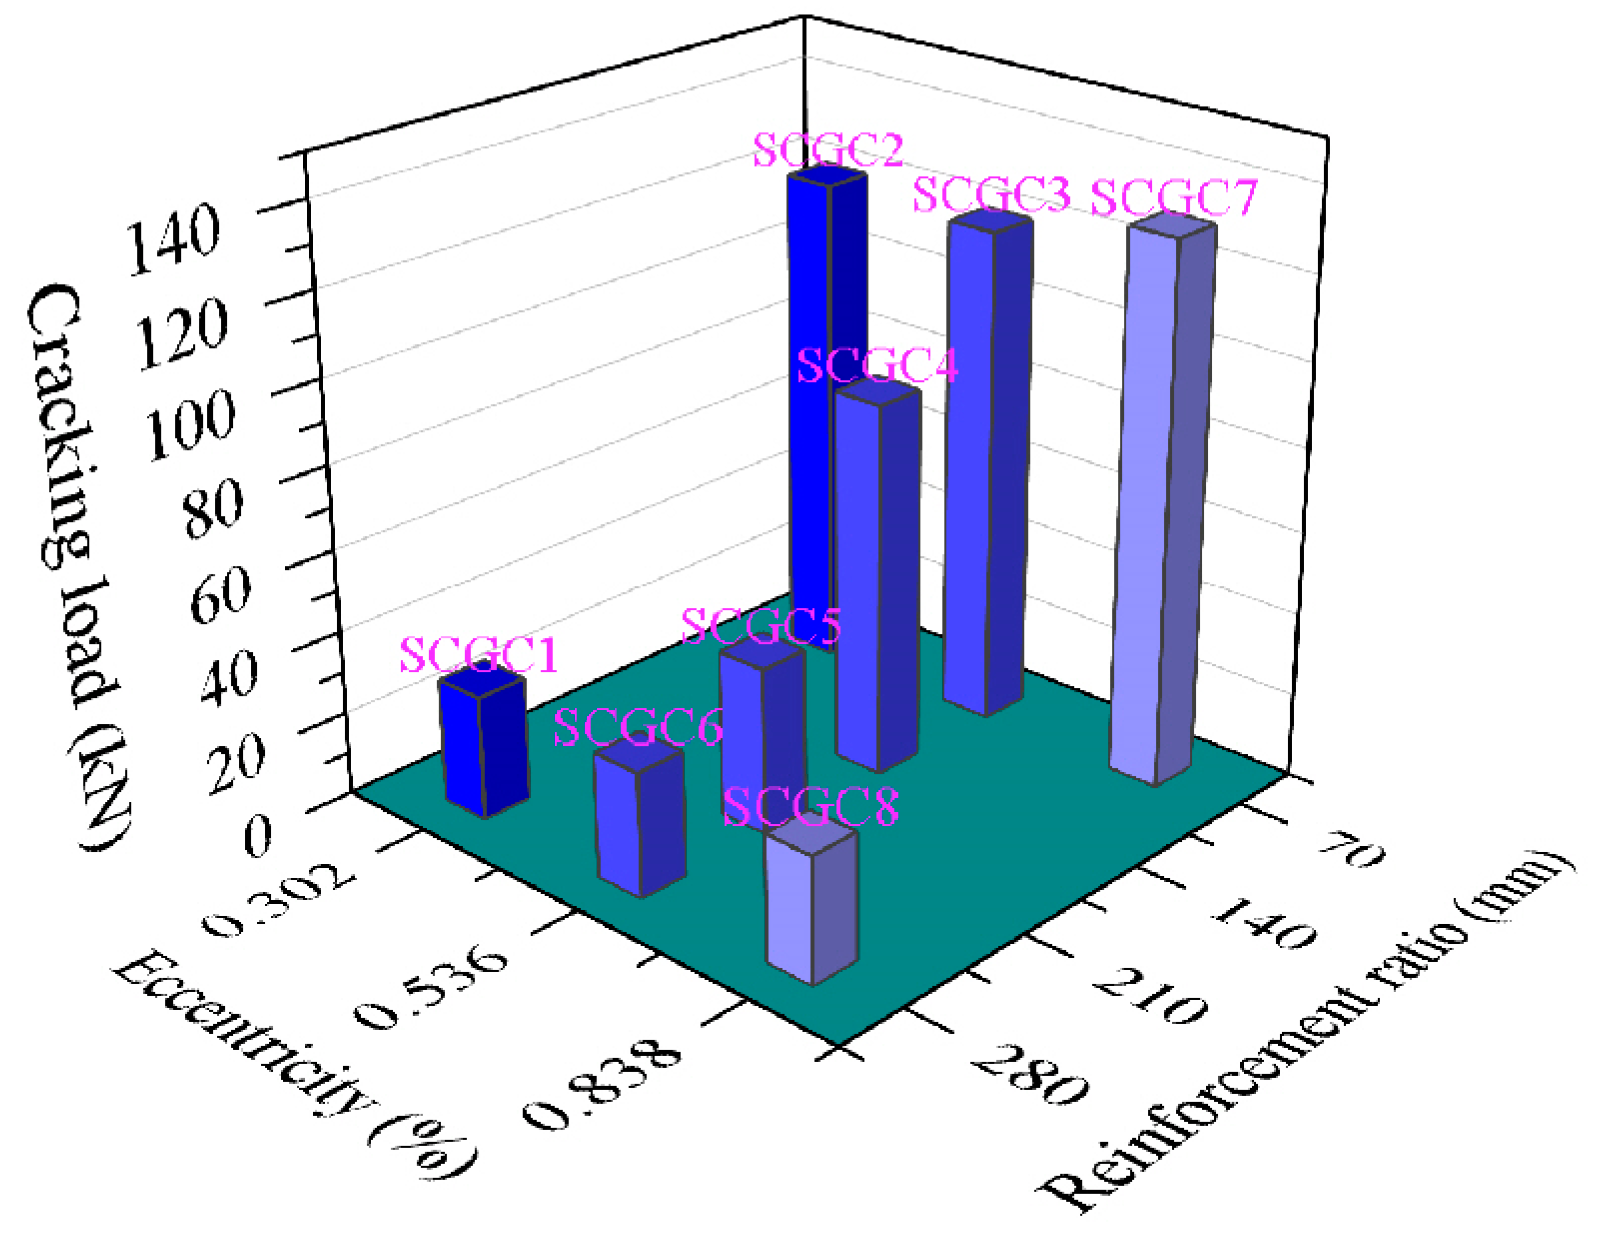
3.1. Failure Patterns and Crack Development

Figure 11 shows the failure patterns of the selected SCGC specimens (taking SCGC2, SCGC5, and SCGC6 for examples). Figure 12 shows the crack propagation in the SCGCs (taking SCGC2, SCGC5, and SCGC6 for examples). While the failure pattern of SCGCs under combined compression and bending is similar to the eccentric compression patterns observed in ORC columns by Li [22], the SCGCs exhibit greater lateral deformation.
When the external load reached 10% to 16% of the ultimate load capacity (Nu), the concrete in the tension zone of the eccentrically loaded columns began to crack, initiating the first horizontal crack. When the load reached 18% to 25% of Nu, a second horizontal crack appeared in the tension zone, and in some cases, a third crack was observed. At 30% to 70% of Nu, the cracks formed in the earlier stages continued to propagate toward the compression zone, while additional fine cracks emerged in the tension zone and progressively widened. When the load reached 70% to 82% of Nu, the number of cracks stabilized, and longitudinal cracks began to form at the supports and in the compression zone. When the ultimate load was reached, the concrete in the compression zone suddenly crushed, signaling the failure of the specimen. The total number of cracks ranged between 16 and 22.
Figure 13 and Figure 14 present the experimental results of the cracking load (Ncr) and ultimate load (Nu) of the SCGC. As the eccentricity increased, both Ncr and Nu of the SCGC decreased; with the increase in the reinforcement ratio, Nu increased, but Ncr showed no significant change. For the SCGC with the same ρs, when e0 was increased to 2, 3, and 4 times its initial value of 70 mm, Ncr decreased by 25%, 67%, and 75%, respectively, while Nu decreased by 40%, 71%, and 80%. For the SCGC with the same e0, when ρs was increased by 1.77 times and 2.77 times from the initial 0.302%, Nu increased by 12.6% and 27.2%, respectively. However, before the SCGC cracked, the strain in the SSR was minimal, resulting in negligible tensile stress. Therefore, the tensile resistance of the SCGC was primarily provided by the concrete, making the influence of ρs on Ncr insignificant.
Figure 15 shows the relationship between N/fcbh and the crack width. It can be observed that an increase in e0 or a decrease in ρs accelerates the rate of crack width development, and the crack width development for each SCGC shows an approximately linear trend.

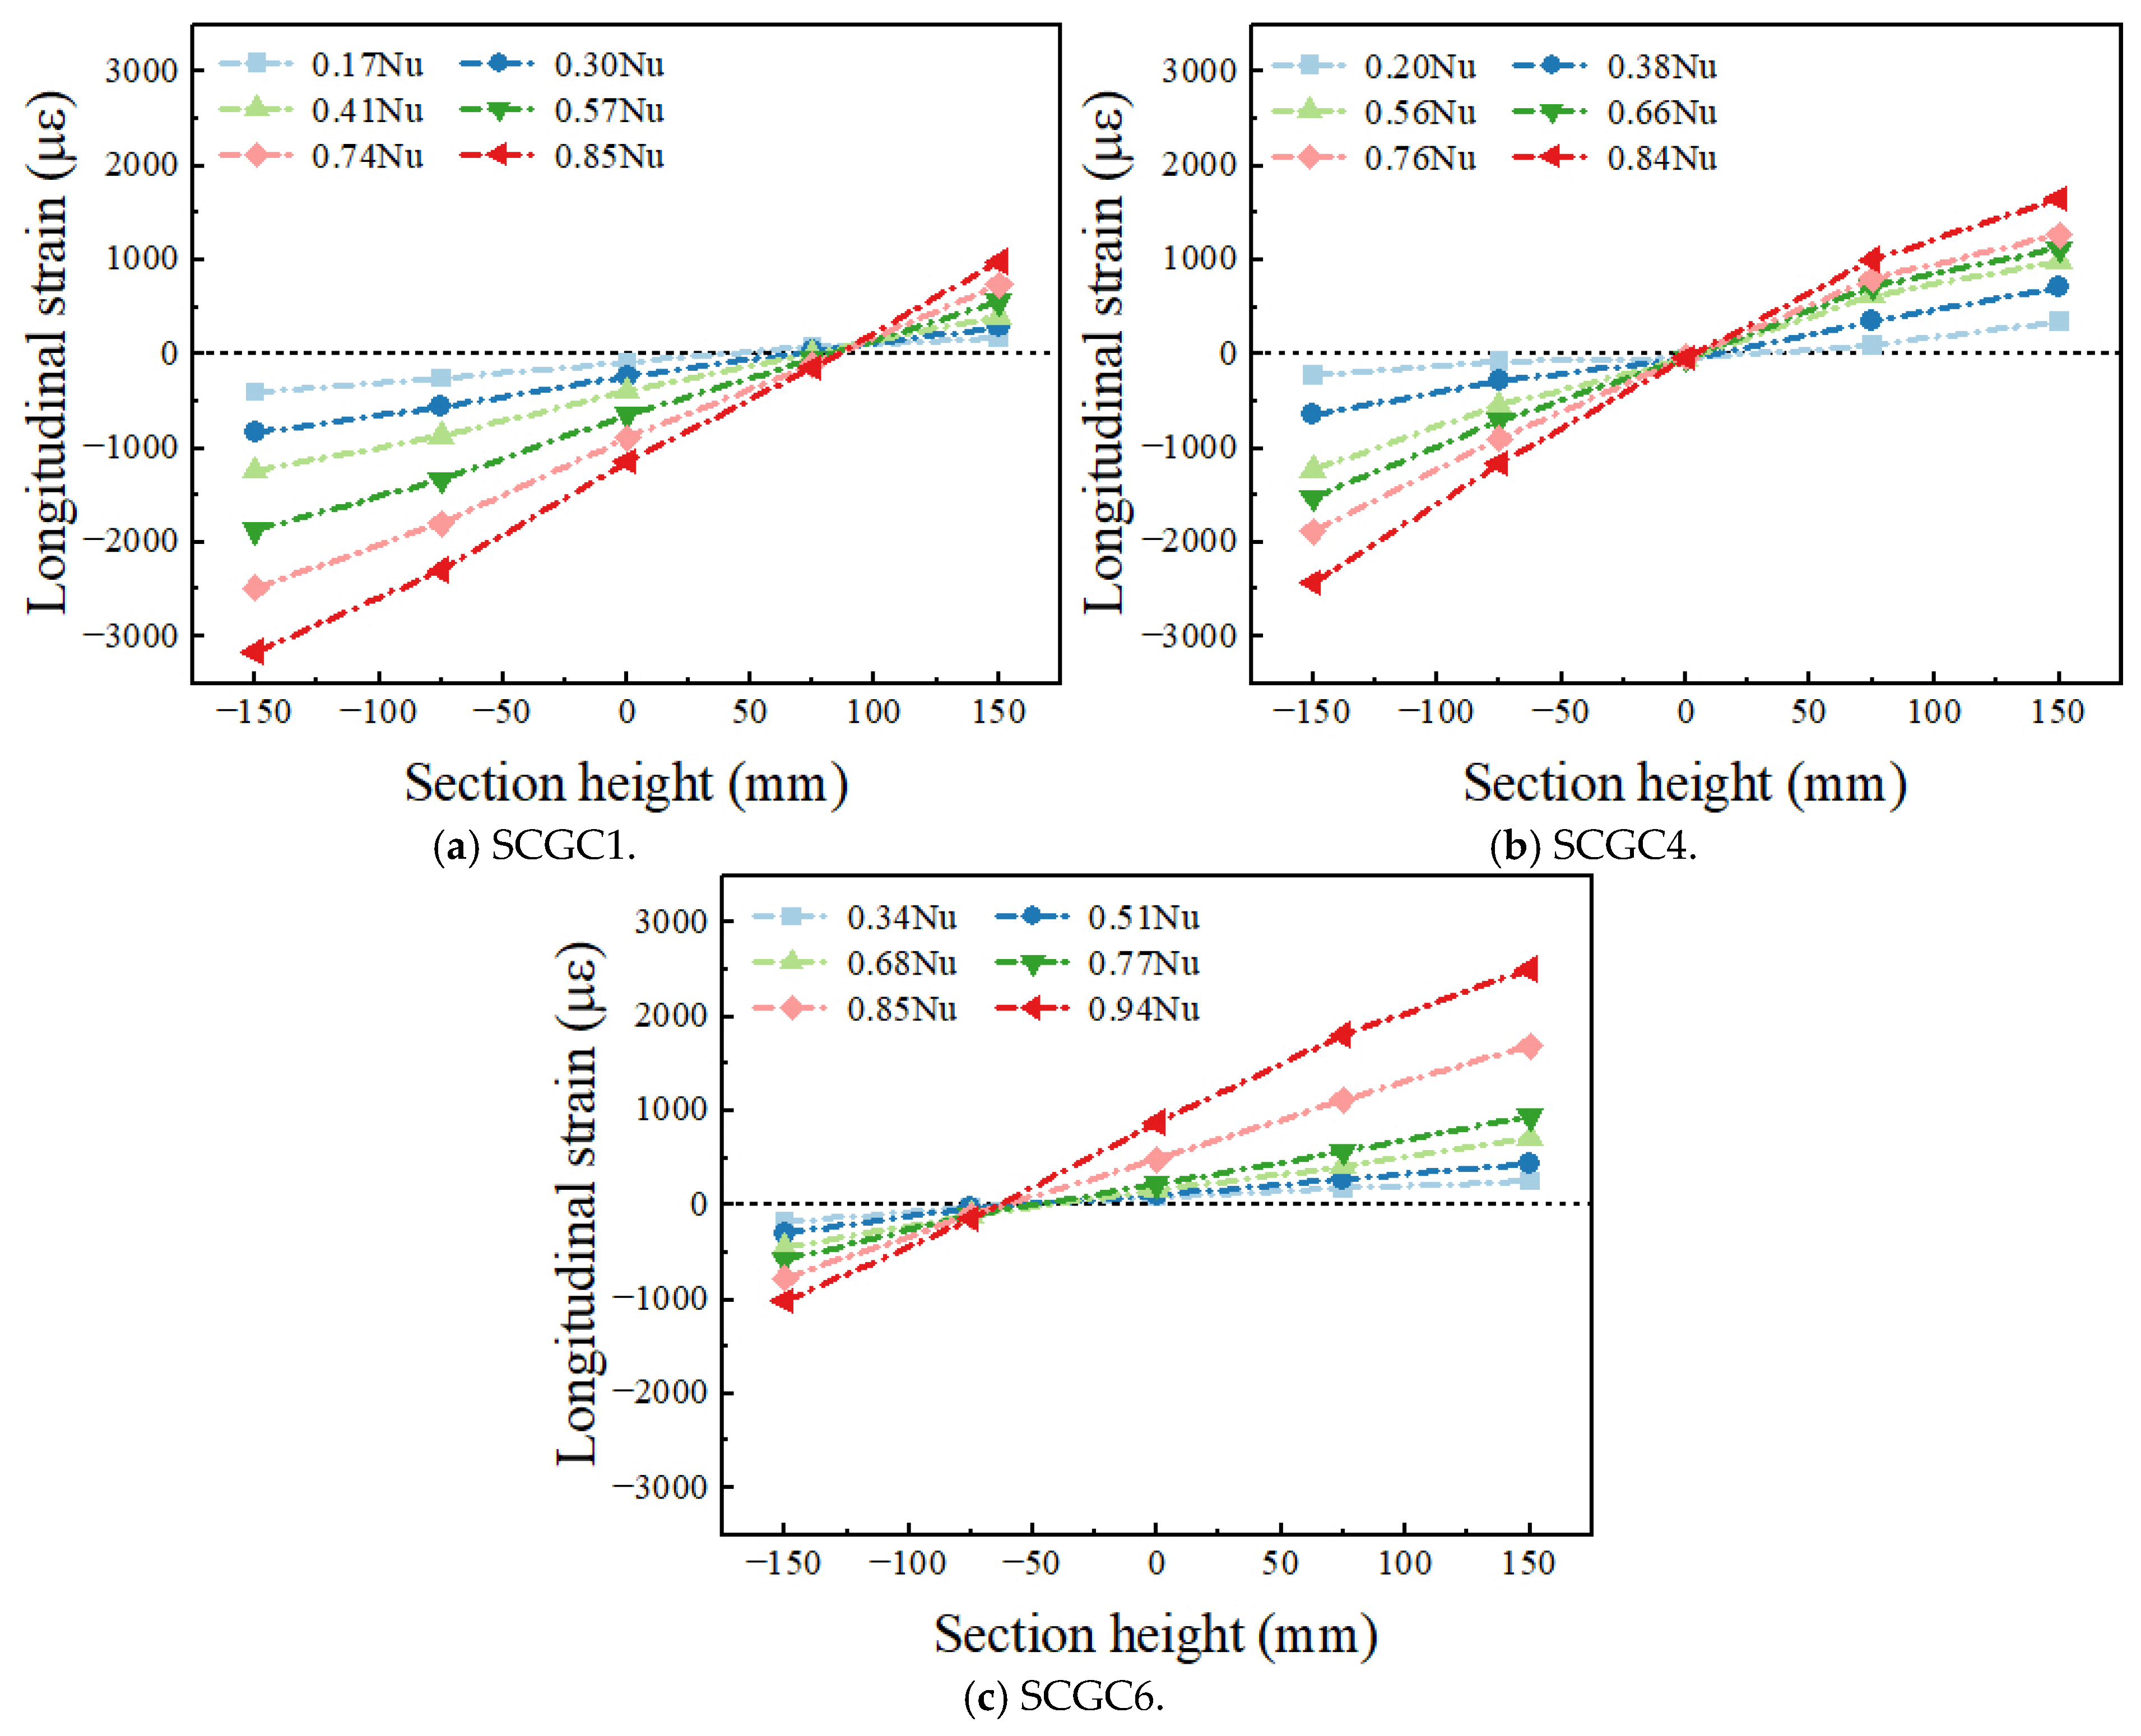
3.2. Deformation Analysis

Figure 16 shows the effect of e0 and ρs on the load–axial displacement curves. While the overall trends of these curves are similar, there are notable differences. The axial deformation of the specimens consists of two components: the axial compression deformation of the specimens themselves and the axial displacement due to bending. The latter is the dominant factor. The curves show an almost linear relationship in the early and middle stages of loading. However, the curves start to smooth out in the later stages, especially near the peak load. The curves become progressively smoother as e0 increases (or ρs decreases), indicating an increase in ductility.
Figure 17 illustrate the effects of e0 and ρs on the load–midspan lateral displacement curves. The overall trends of these curves are consistent. Cracks on the tension side of the column appear earlier in the early stage of loading, as e0 increases (or ρs decreases). This leads to a significant reduction in the lateral stiffness. Consequently, there is a marked increase in the midspan lateral deflection. The lateral displacement curves of the column become steeper as e0 increases (or ρs decreases) during the mid-to-late stages of loading.
Figure 18 presents the lateral displacement curves of SCGC2, SCGC5, and SCGC6 under various loading stages. It can be observed from Figure 18 that the lateral displacement curves exhibit a half-sine wave distribution form from the initial loading of the SCGC until the failure stage. The shape conforms to the function of a standard sine curve, expressed as f1 = fsin(πx/l), where f1 is the lateral deflection, in mm; f is the maximum midspan lateral deflection under each load stage, in mm; and l is the height of the column, in mm.

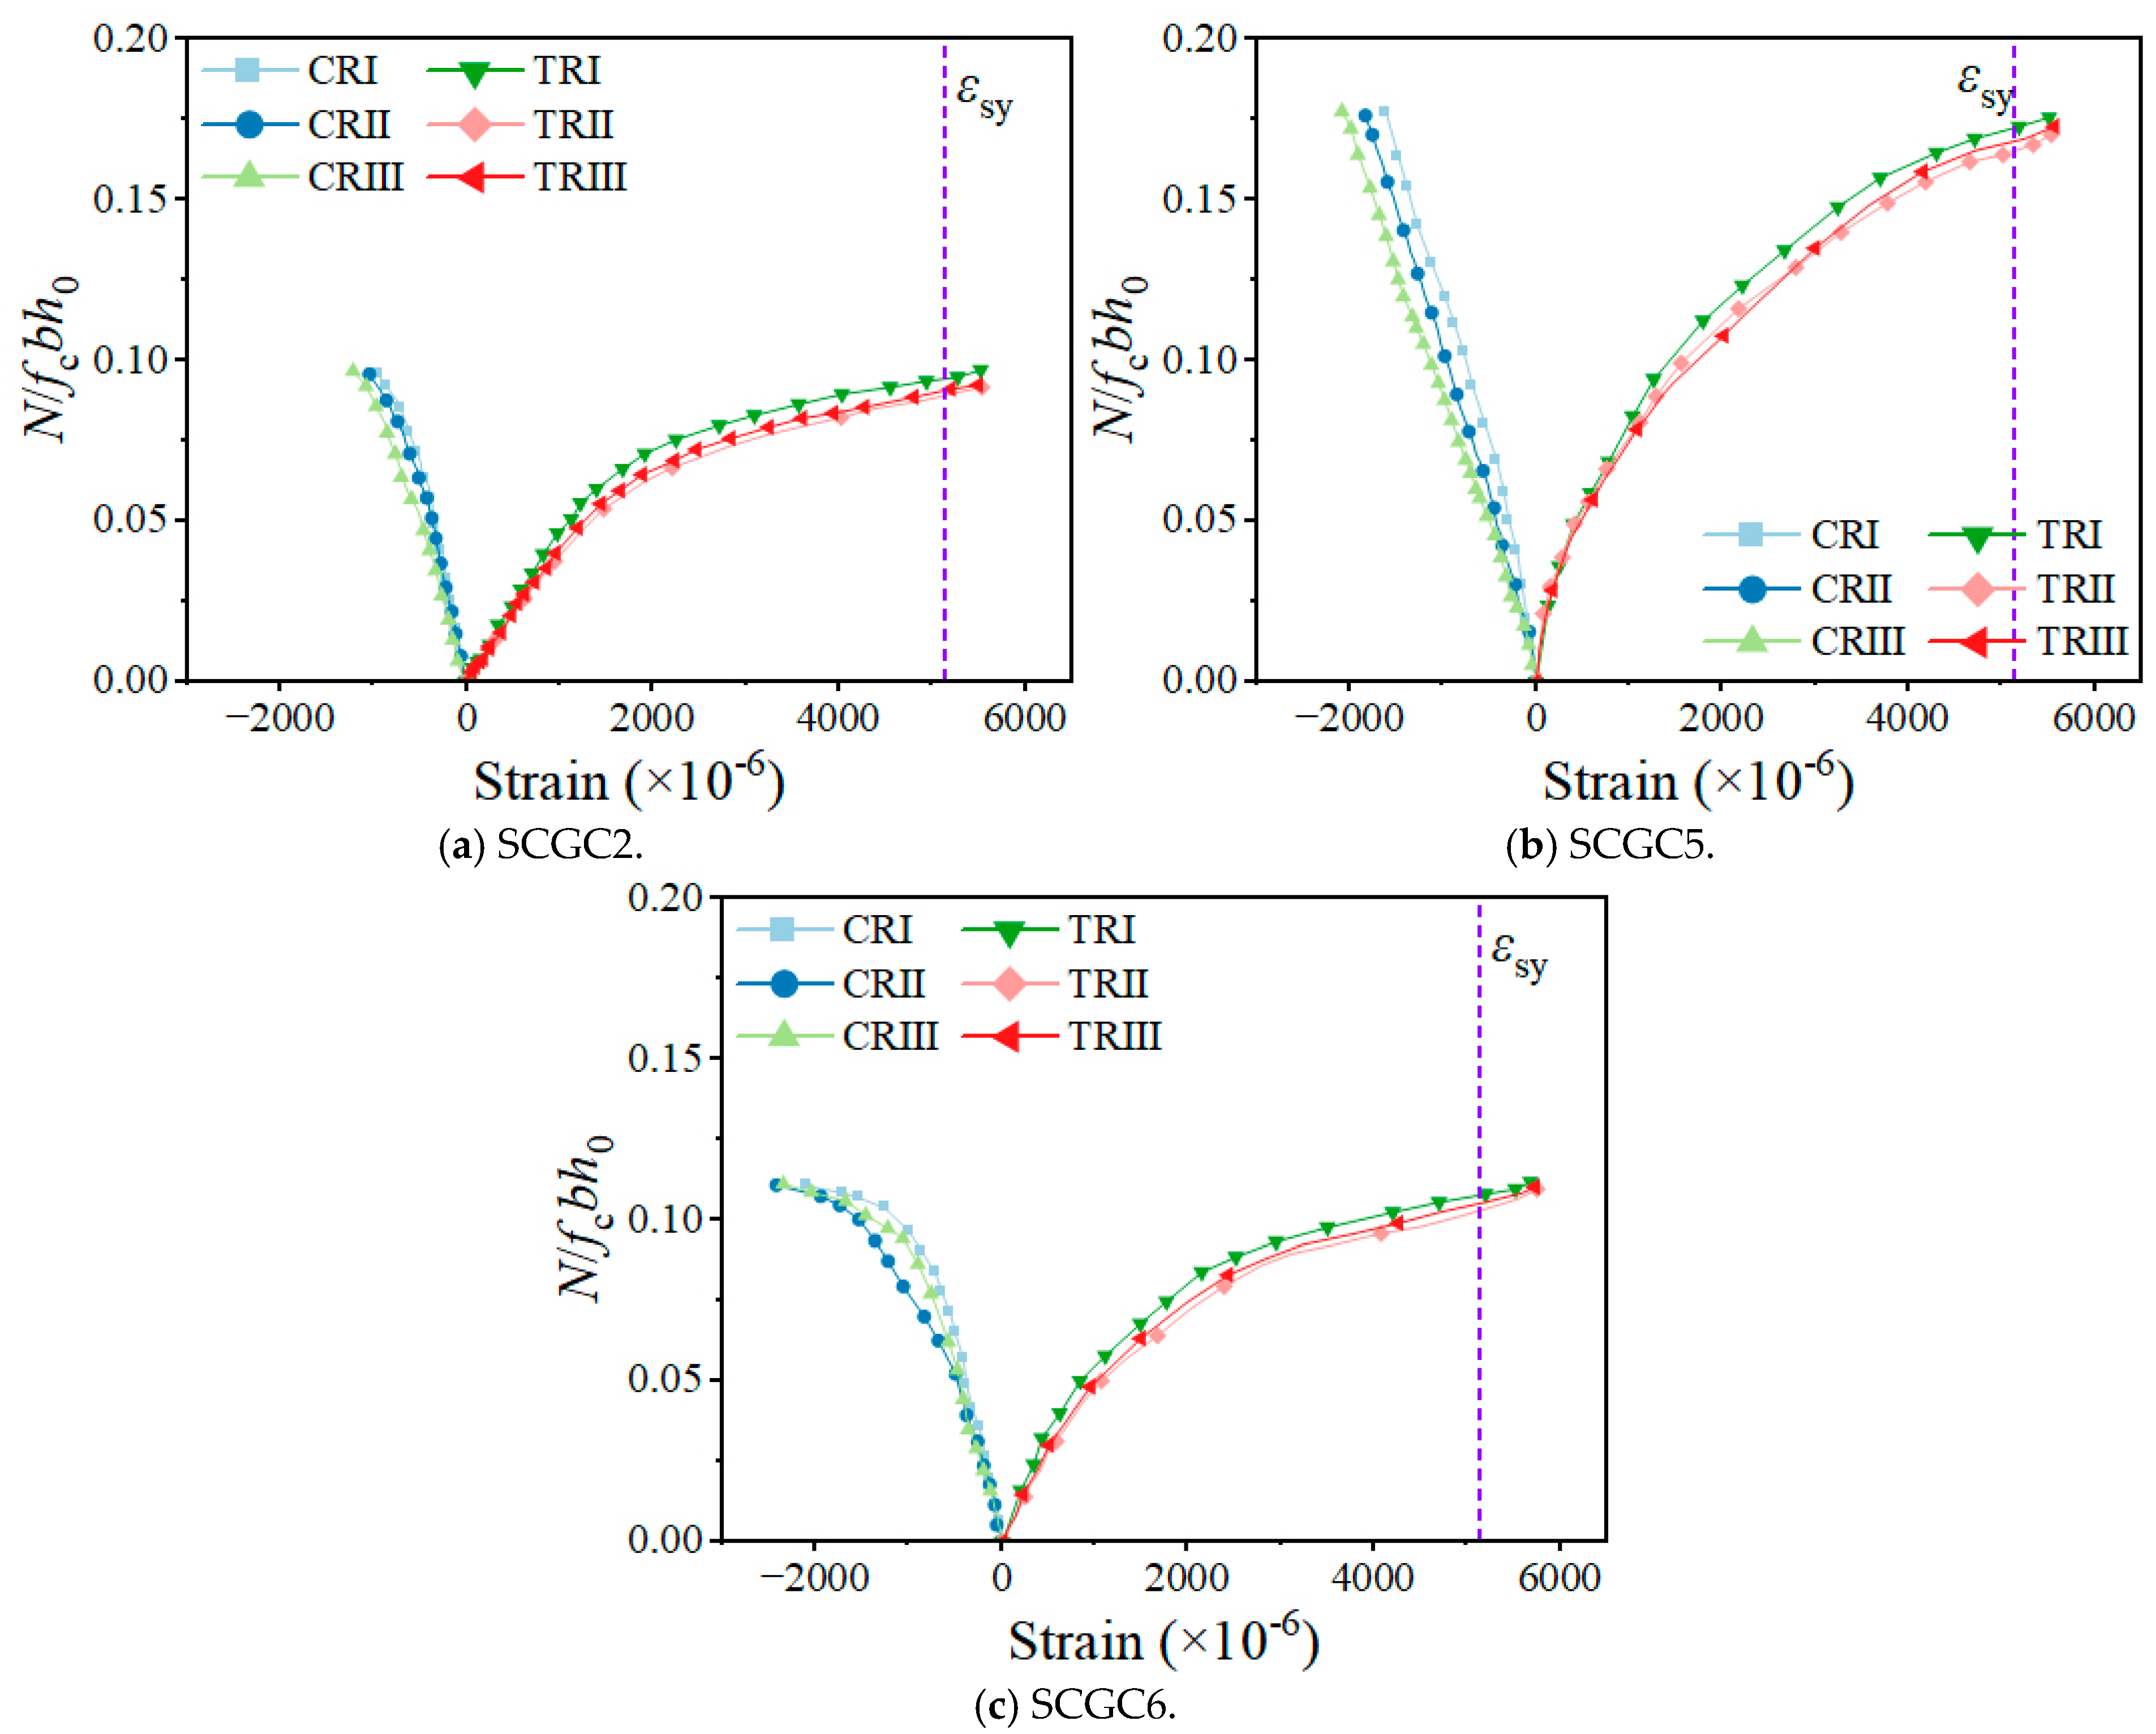
3.3. Strain Analysis

Figure 19 shows the N/fcbh—SSR strain relationship curves (taking SCGC2, SCGC5, and SCGC6 for examples). In these curves, “CR” represents the compressive SSR, “TR” represents the tensile SSR, and εsy represents the tensile yield strain of the SSR. It can be observed that under large eccentricity (e0/h ≥ 0.7), the SSR on the side farther from the axial force reaches its tensile yield strength, indicating full utilization. Additionally, the tensile and compressive curves of the SSR show different rising trends, exhibiting distinct tension–compression behavior, which is consistent with the findings of Yuan [19].
Figure 20 shows the concrete strain distribution at the midspan section during various loading stages (taking SCGC1, SCGC4, and SCGC6 for examples). Here, εsc represents the SSR strain on the side closer to the axial force and εst represents the SSR strain on the side farther from the axial force. The average strain across the transverse section of the SCGC is almost linearly distributed. As the external load increases, the neutral axis gradually shifts toward the edge of the compressive zone of the SCGC. During loading, the concrete strain of the midspan section varies roughly linearly along the height of the section, consistent with the assumption of a planar section.

4. Analysis of the Bearing Capacity and Crack Width of SCGCs

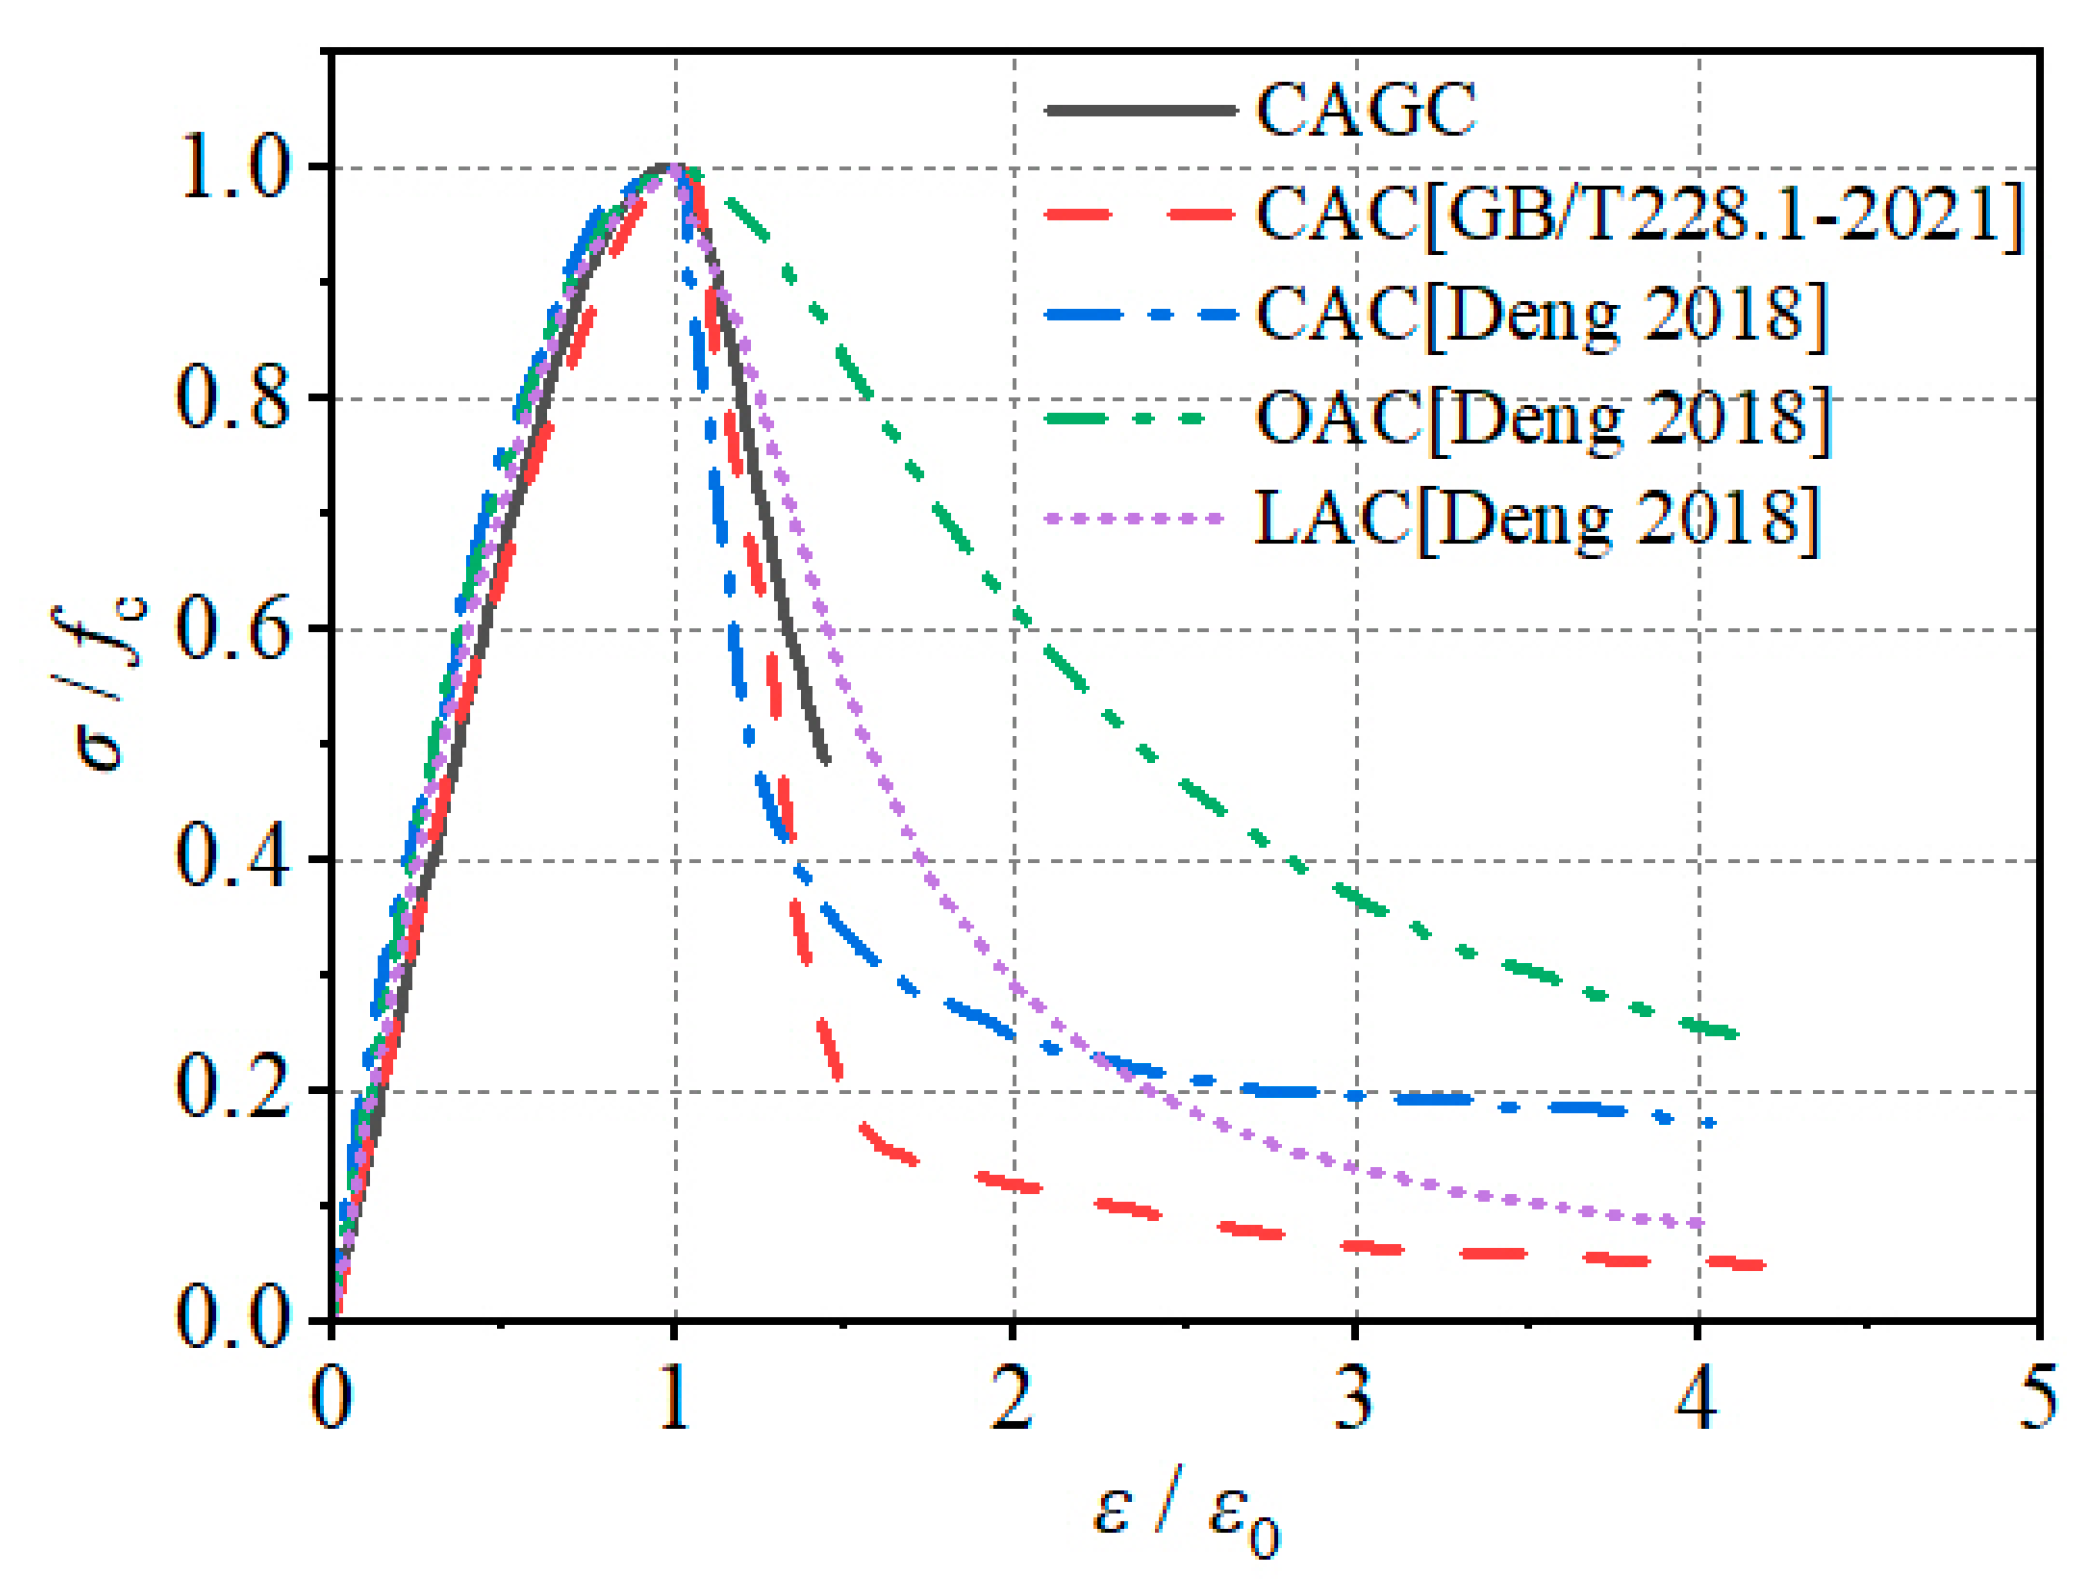
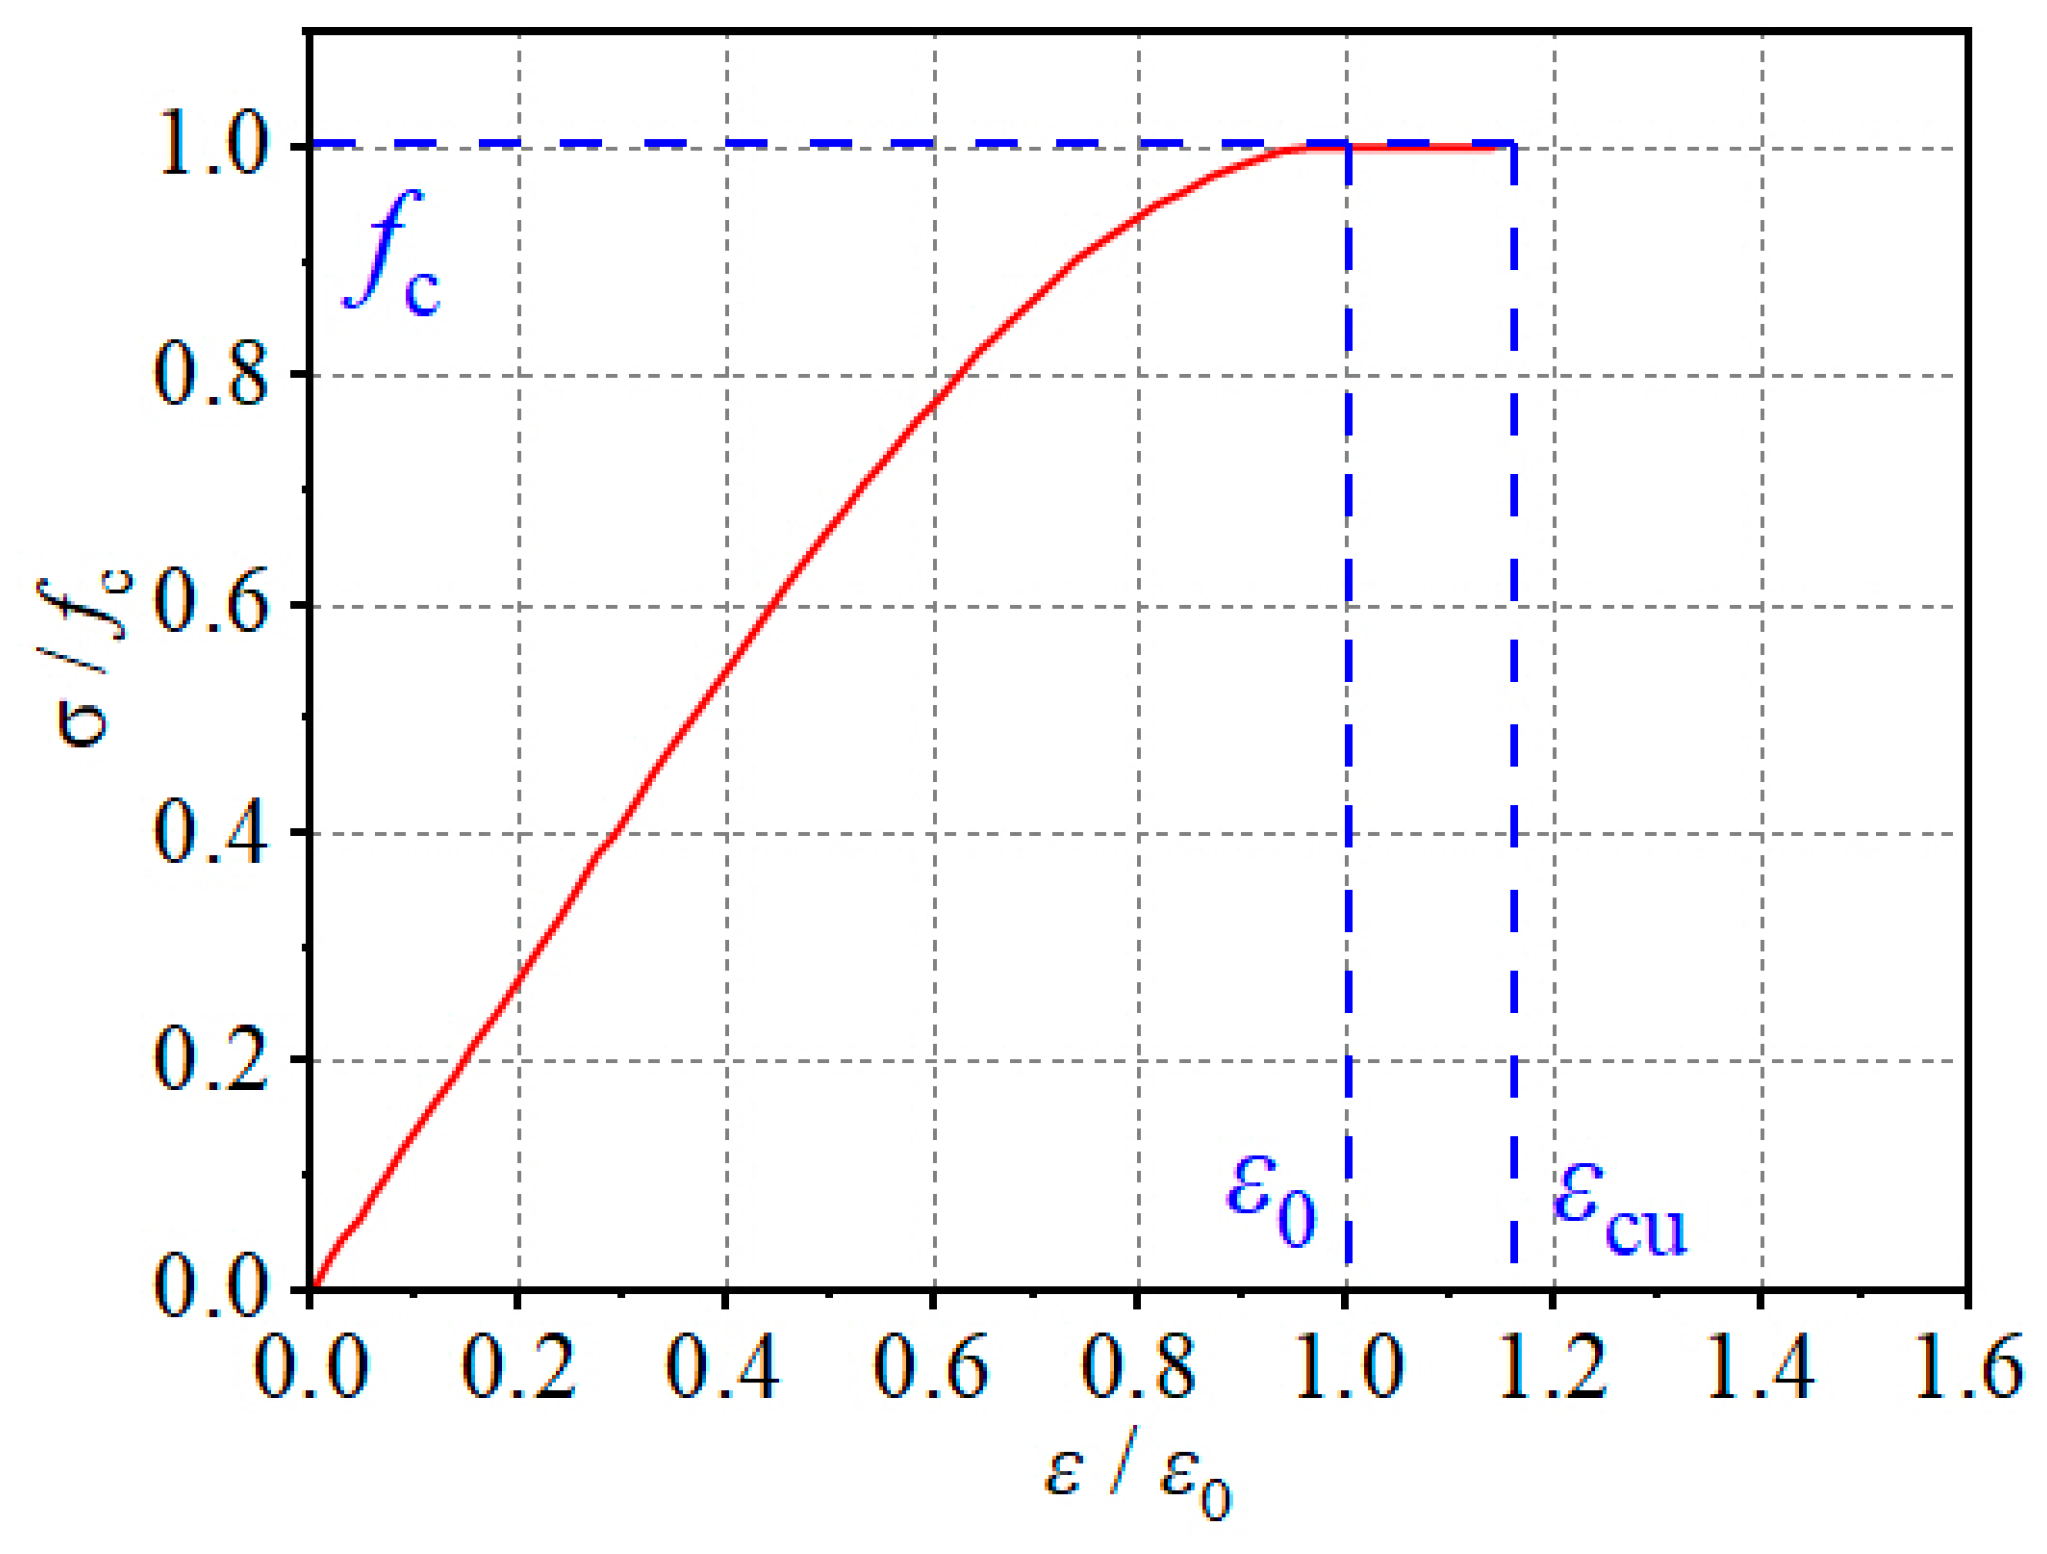
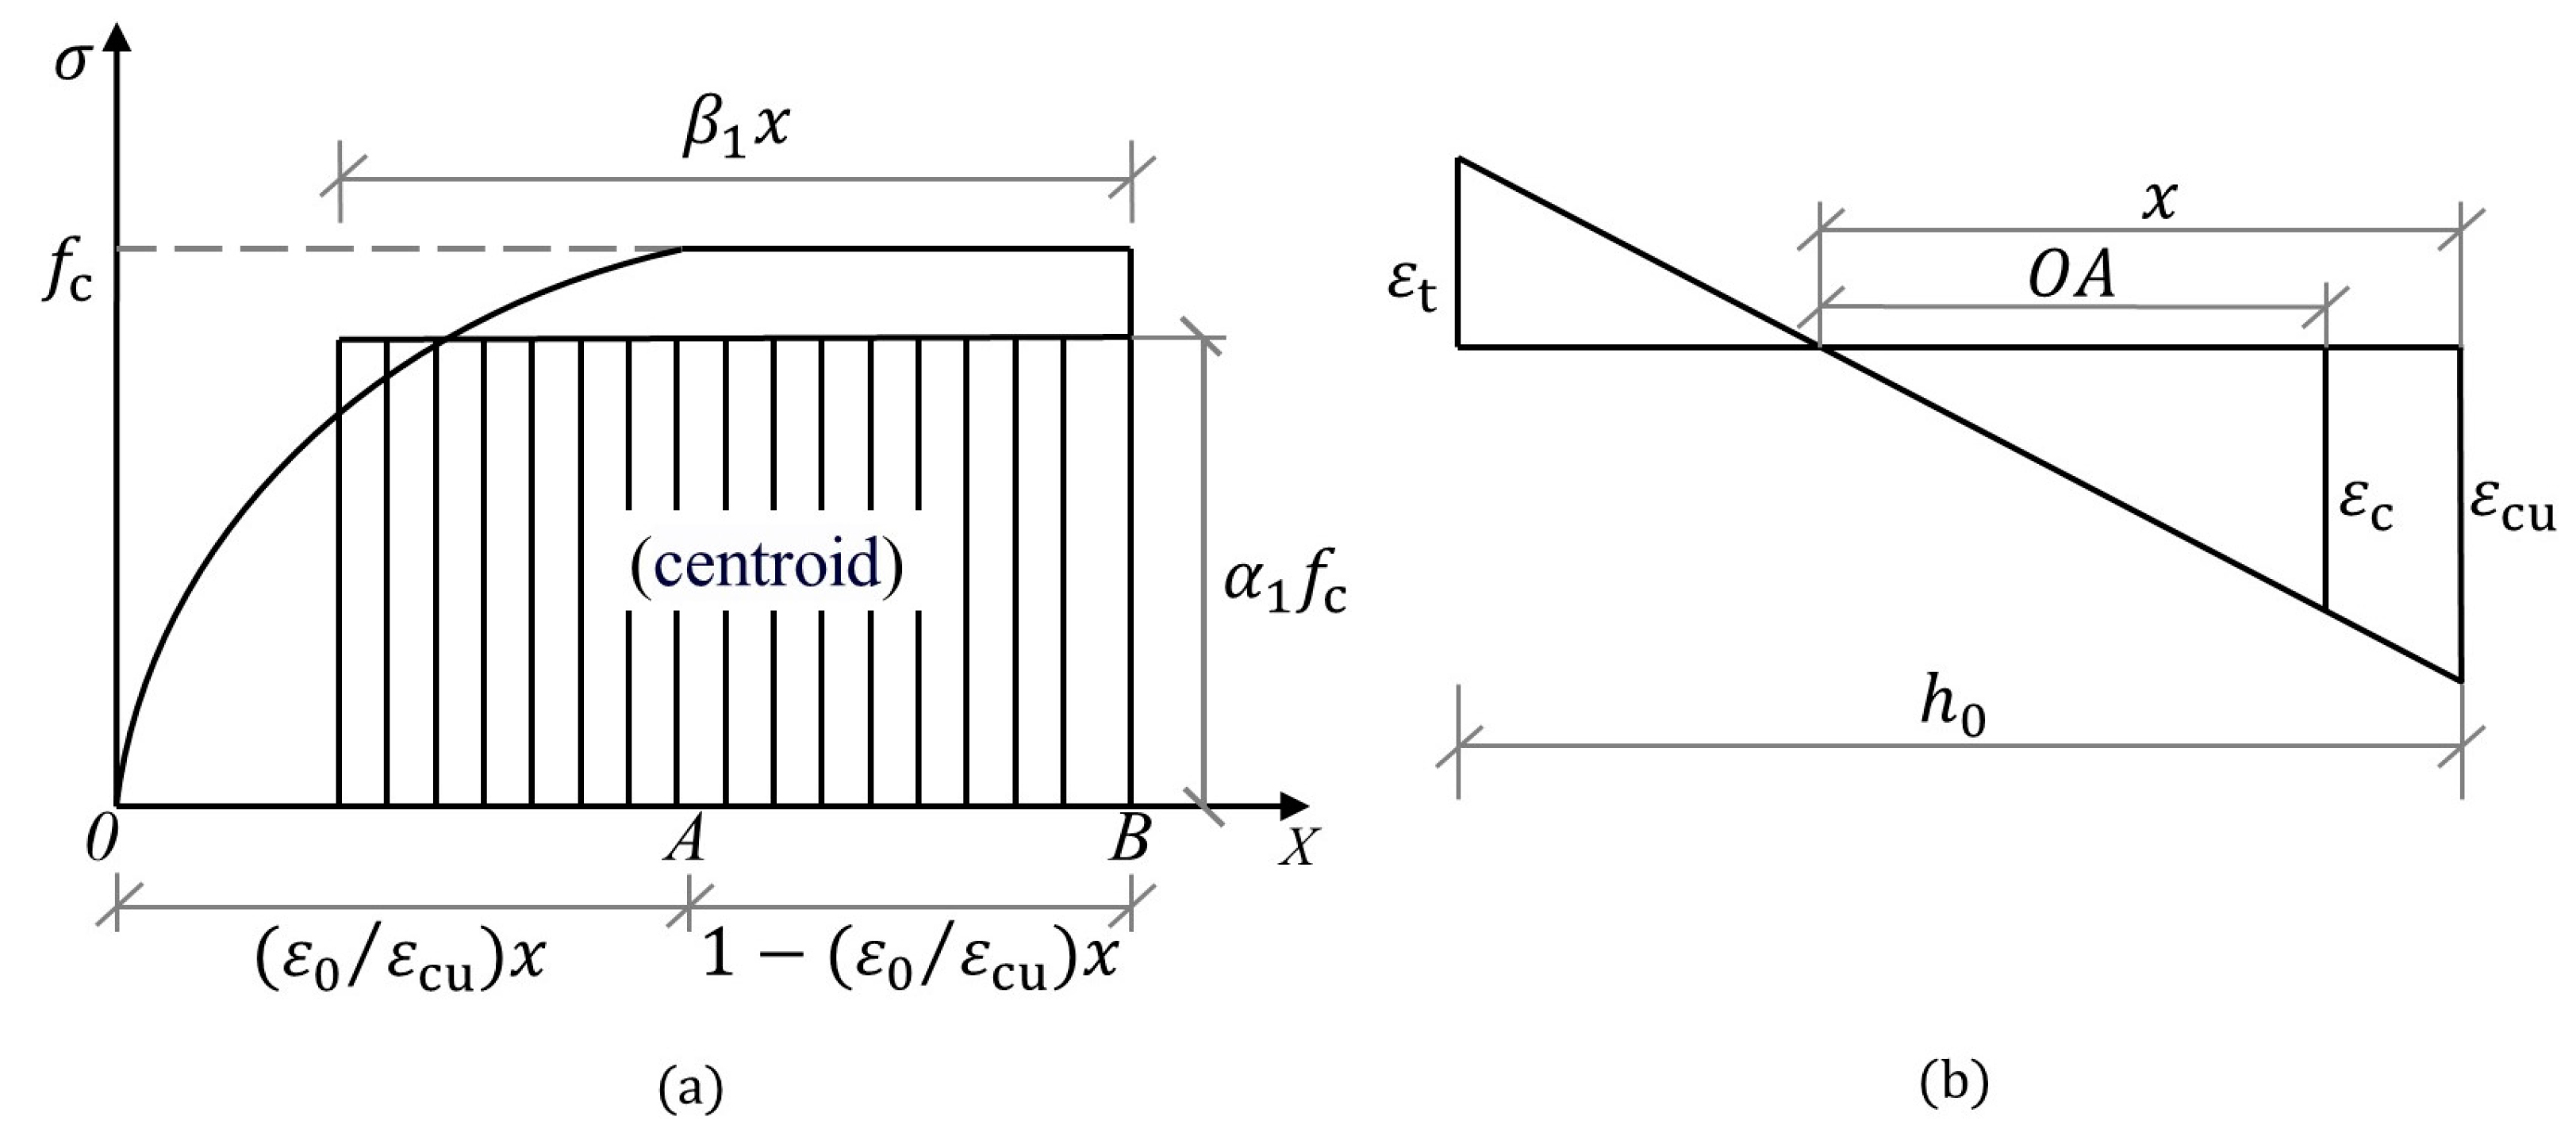
4.1. Constitutive Relationship of CAGC

The uniaxial constitutive model comprehensively reflects the mechanical behavior of concrete under uniaxial loading and plays a crucial role in the design and analysis of reinforced concrete structures [37]. When investigating the uniaxial constitutive relationship of CAGC, the compressive results of prismatic specimens from Section 2.1 were compared with studies by Liu [38] and Da [39], as shown in Figure 21.
It can be observed that in the ascending segment, the curves for CAC, ordinary aggregate concrete (OAC), and lightweight aggregate concrete (LAC) are almost identical to the CAGC curve. However, in the descending segment, the CAGC curve is steeper than the OAC and LAC, but flatter than the CAC. Overall, the constitutive relationship curve of CAGC significantly differs from that of CAC, OAC, and LAC, indicating that their stress–strain relationships are not applicable to CAGC.
Therefore, this paper proposes an optimized uniaxial constitutive model for CAC, based on the work of Liu [38] and Da [39], as shown in Equation (1). A fitting analysis was conducted, and the results are presented in Figure 22.
σ f c = a ε ε 0 + 3 2 a · ε ε 0 2 + a 2 · ε ε 0 3 0 ε < ε 0 ε / ε 0 b ε / ε 0 1 2 + ε / ε 0 ε 0 ε ε c u R 2 = 0.991
where σ is the stress of CAGC, in MPa; fc is the axial compressive strength of CAGC, with a measured value of fc = 29.0 MPa in this study; ε is the strain of CAGC; ε0 is the compressive strain of CAGC when the compressive stress reaches fc, with ε0 = 0.0024; εcu is the ultimate compressive strain of CAGC, taken as εcu = 0.0028; and a and b are the control parameters for the ascending and descending segments of the curve, with values of a = 1.31 and b = 7.892, respectively.
This constitutive model is considered for practical engineering applications, with attention to the safety reserve requirements of the project. Notably, the stress in the ε0 ~ εcu range does not significantly decrease. This paper adopts a horizontal line for the descending segment and truncates it at εcu, referring to the provisions of GB50010-2010 [40] on post-peak concrete behavior, as shown in Figure 23. The resulting uniaxial constitutive relationship expression for CAGC is:
σ f c = a ε ε 0 + 3 2 a · ε ε 0 2 + a 2 · ε ε 0 3 0 ε < ε 0 f c ε 0 ε ε c u

4.2. Bearing Capacity

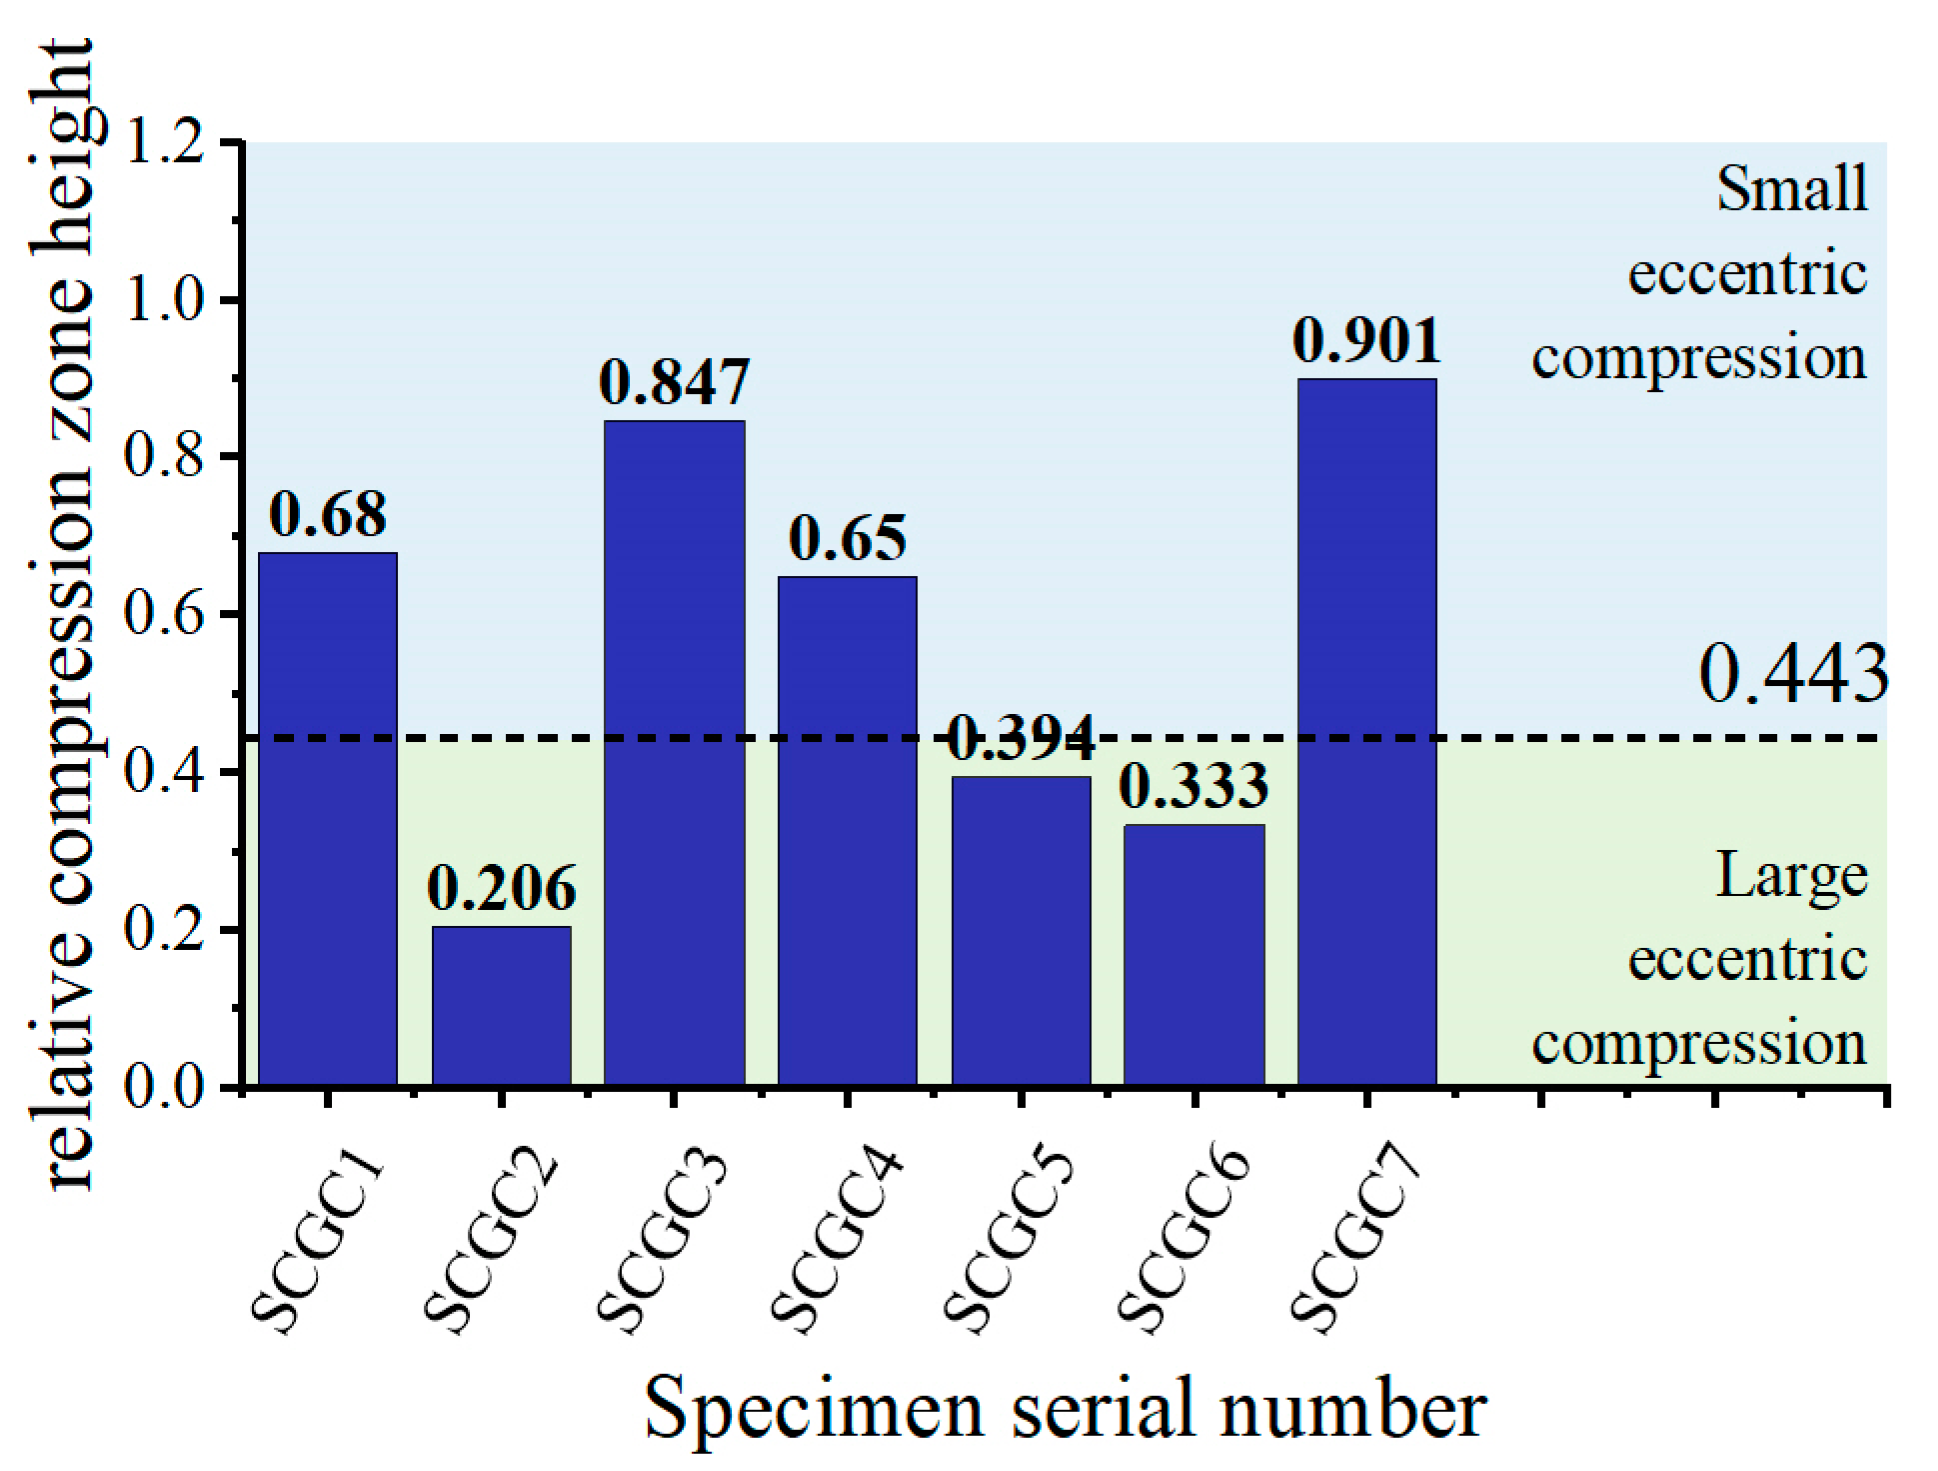
4.2.1. Calculation and Analysis of Nu

The calculation of Nu in this study is based on the following assumptions: (1) The SCGC satisfies the plane section assumption during loading (verified in Section 3.3); (2) The tensile strength of CAGC is not considered in the calculation; (3) The concrete stress in the compression zone of the SCGC section is calculated using an equivalent rectangular stress distribution; (4) With a slenderness ratio l/b = 1000/250 = 4, the test columns are considered short columns, and second-order effects are neglected in the calculation.
This paper establishes formulas for different failure patterns and load-bearing capacity based on these assumptions. As shown in Figure 24, the failure patterns of the SCGC are classified into large eccentric compression and small eccentric compression. In these formulas, ei, et, and ec represent the distances between the external load and the section center, the tensile SSR, and the compressive SSR, respectively; σs and σs′ are the SSR stresses far from (As) and near (As′) the external load; α1 is the rectangular stress coefficient; xc, xb, and x denote the actual height of the CAGC in compression, the limiting height of the compression zone, and the calculated height, where x = β1xc; εt and εy are the strains of the SSR far from the external load and its nominal yield strain, respectively; and εc and εcu are the strains of the SSR near the external load and at the section edge, respectively.
When the external load acts on the SCGC with a small e0, the SCGC section will experience a small eccentric compression, as shown in Figure 24b. At this time, the concrete in the compression zone reaches its compressive strength, and the steel reinforcement on the side farther from the axial force has not reached its yield state, whether it is in compression or tension. Therefore, based on the plane section assumption and force equilibrium, the following formula can be derived:
N u e t = α 1 f c b x h 0 x / 2 + f y A s h 0 a s
N u = α 1 f c b x + f y A s σ s A s
where f y is the design value of the compressive strength of the SSR, in MPa. When e0 is large, the SCGC section will experience large eccentric compression, as shown in Figure 24b. The steel reinforcements that are farther from the axial force reach the yield state, and the concrete in the compression zone reaches its compressive strength. However, it is verified that the steel reinforcement that is closer to the axial force has not reached its yield state based on the strain measurements of the SSR. Therefore, based on the plane section assumption and force equilibrium, the following formula can be derived:
N u e t = α 1 f c b x h 0 x / 2 + σ s A s h 0 a s
N u = α 1 f c b x + σ s A s f y A s
where f y is the design value of the compressive strength of the SSR, in MPa. Determining the compression state directly influences the force calculations, as observed from the analysis. Additionally, the relative boundary compression zone height ξb serves as a key criterion for distinguishing between large and small eccentric failures.
According to Equation (7), the boundary relative compression zone height is determined to be ξ b = 0.443 , which allows for the classification of the SCGC into large and small eccentric compression categories, as shown in Figure 25.
ξ b = x b h 0 = β 1 ε c u ε c u + ε y
In summary, the SCGC specimens tested in this study do not exhibit full-section compression. SCGC8 experienced premature failure due to the slippage of the reinforcement in the anchorage region, resulting in significantly lower load-carrying capacity and thus is excluded from the load-carrying capacity analysis. When e0 = 70 mm and 140 mm, the specimens exhibit small eccentric compression failure; when e0 = 210 mm and 280 mm, the specimens experience large eccentric compression failure.

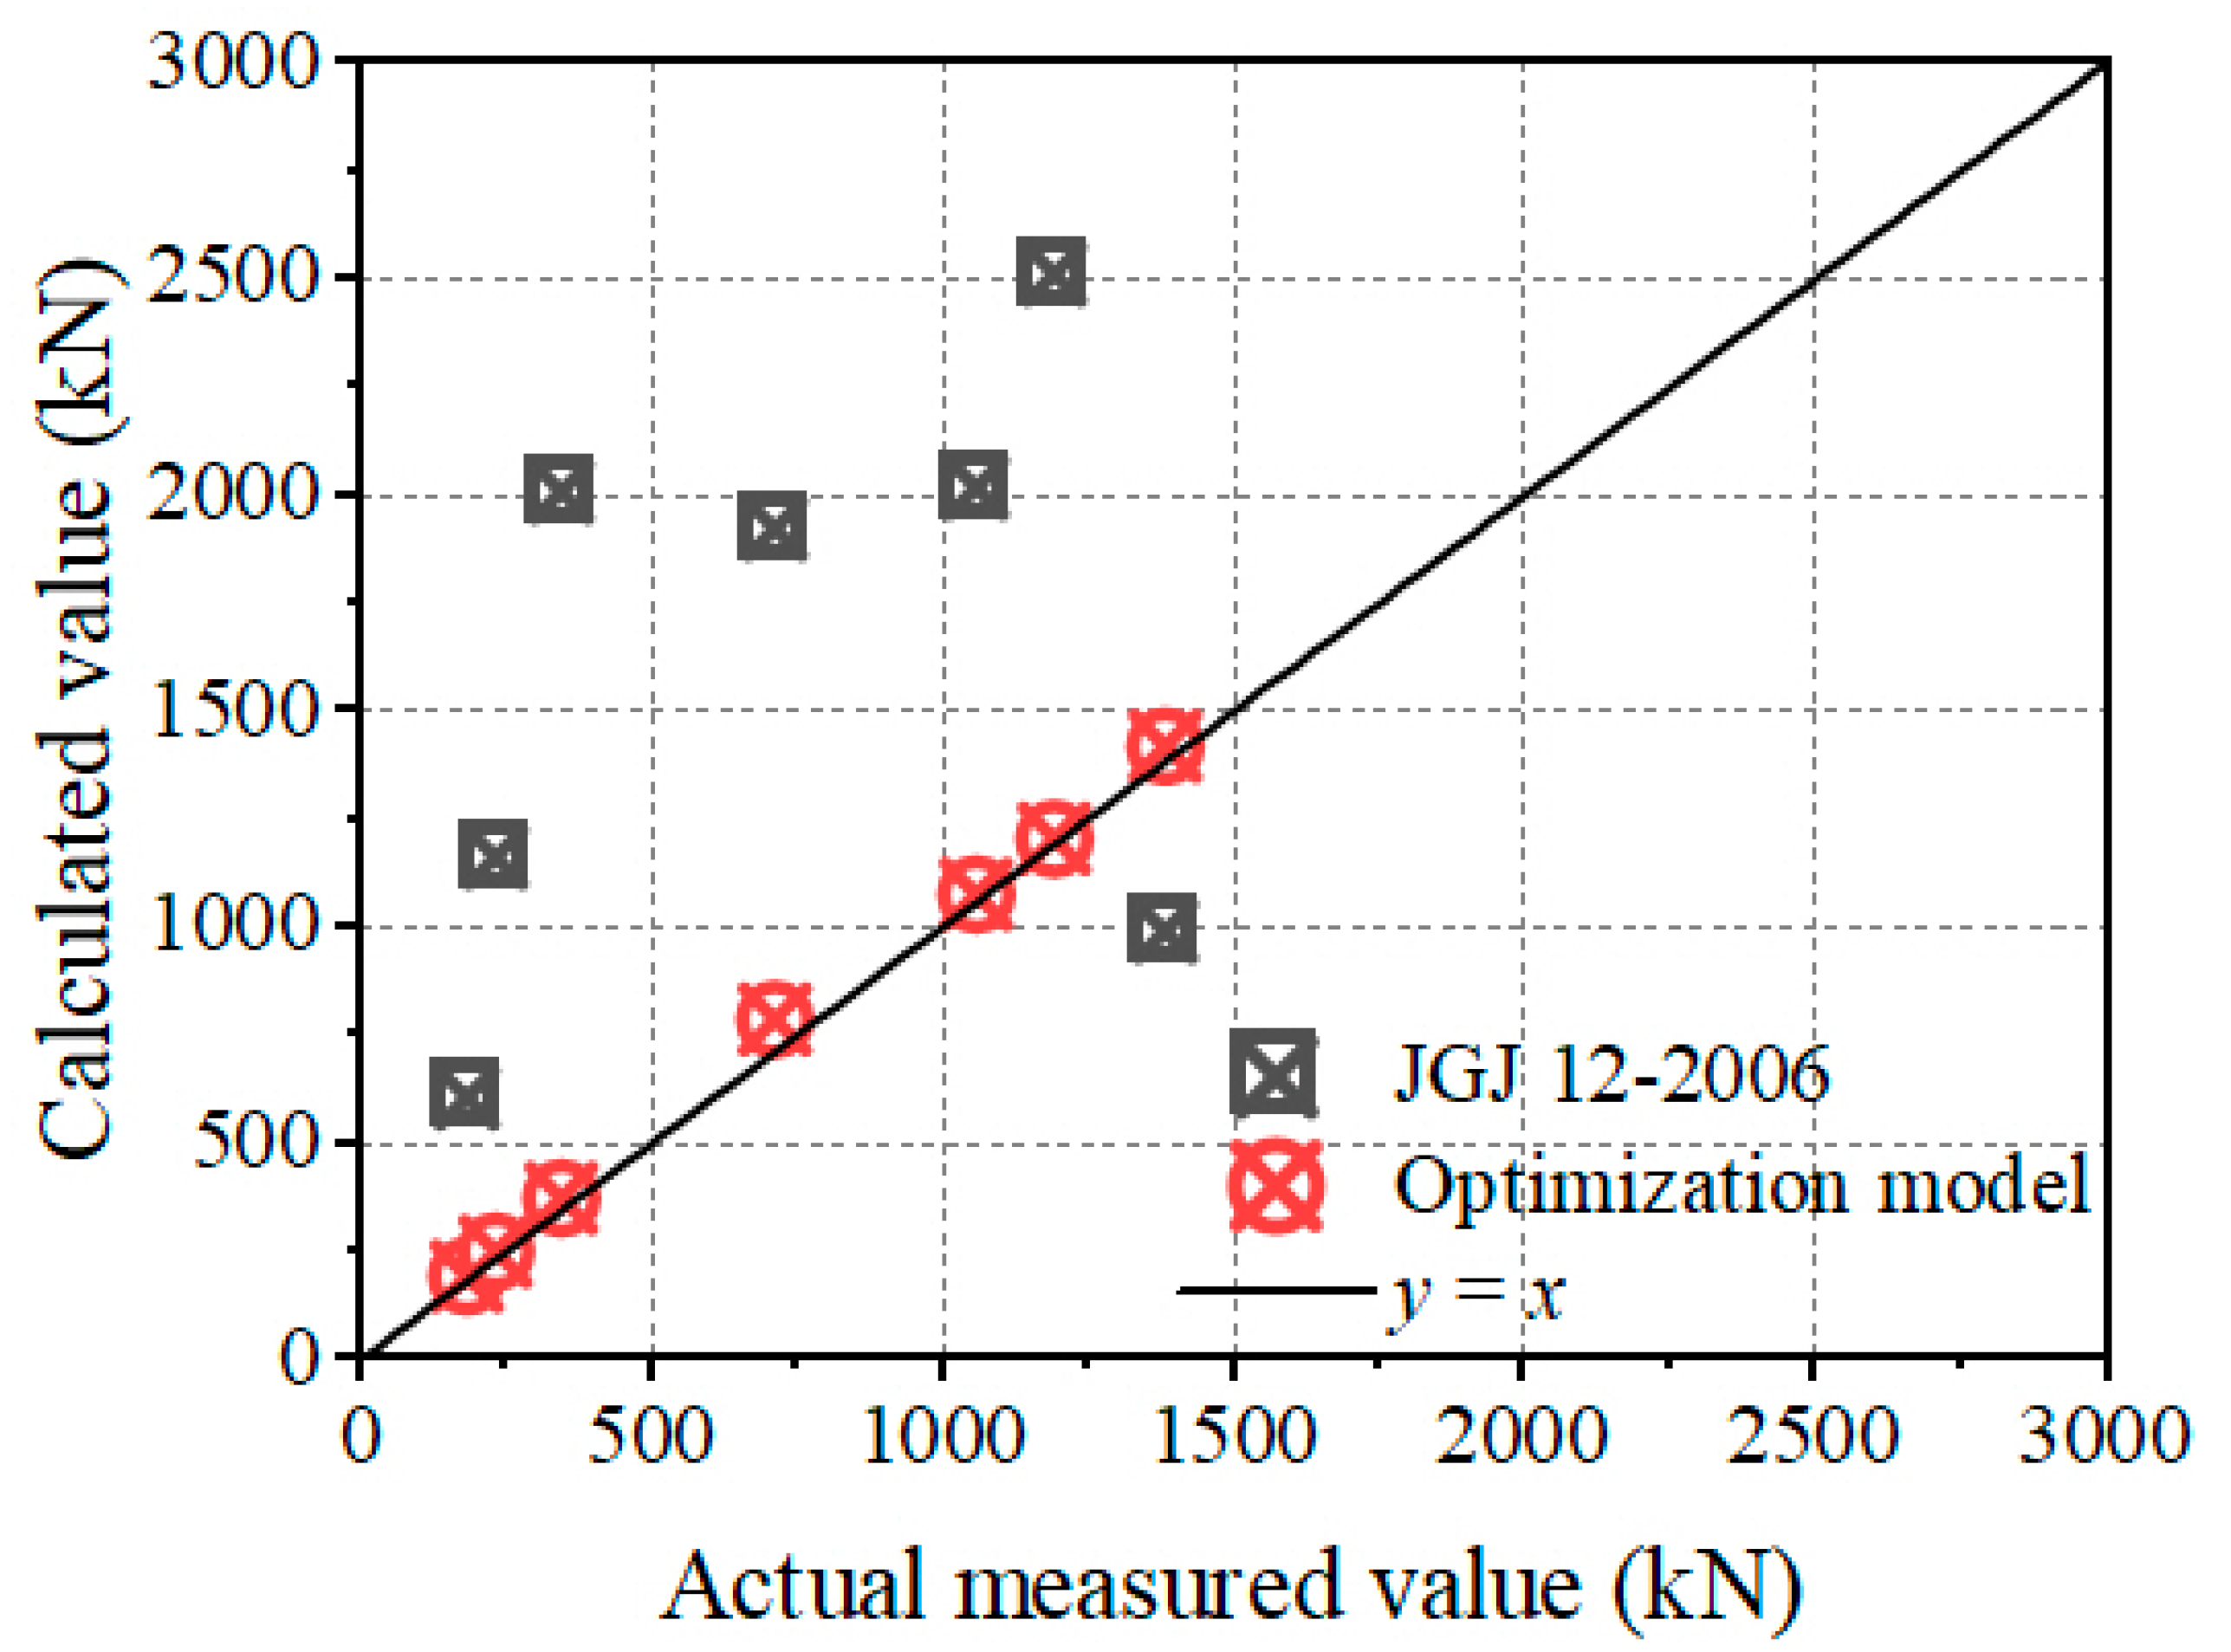
4.2.2. Model Optimization
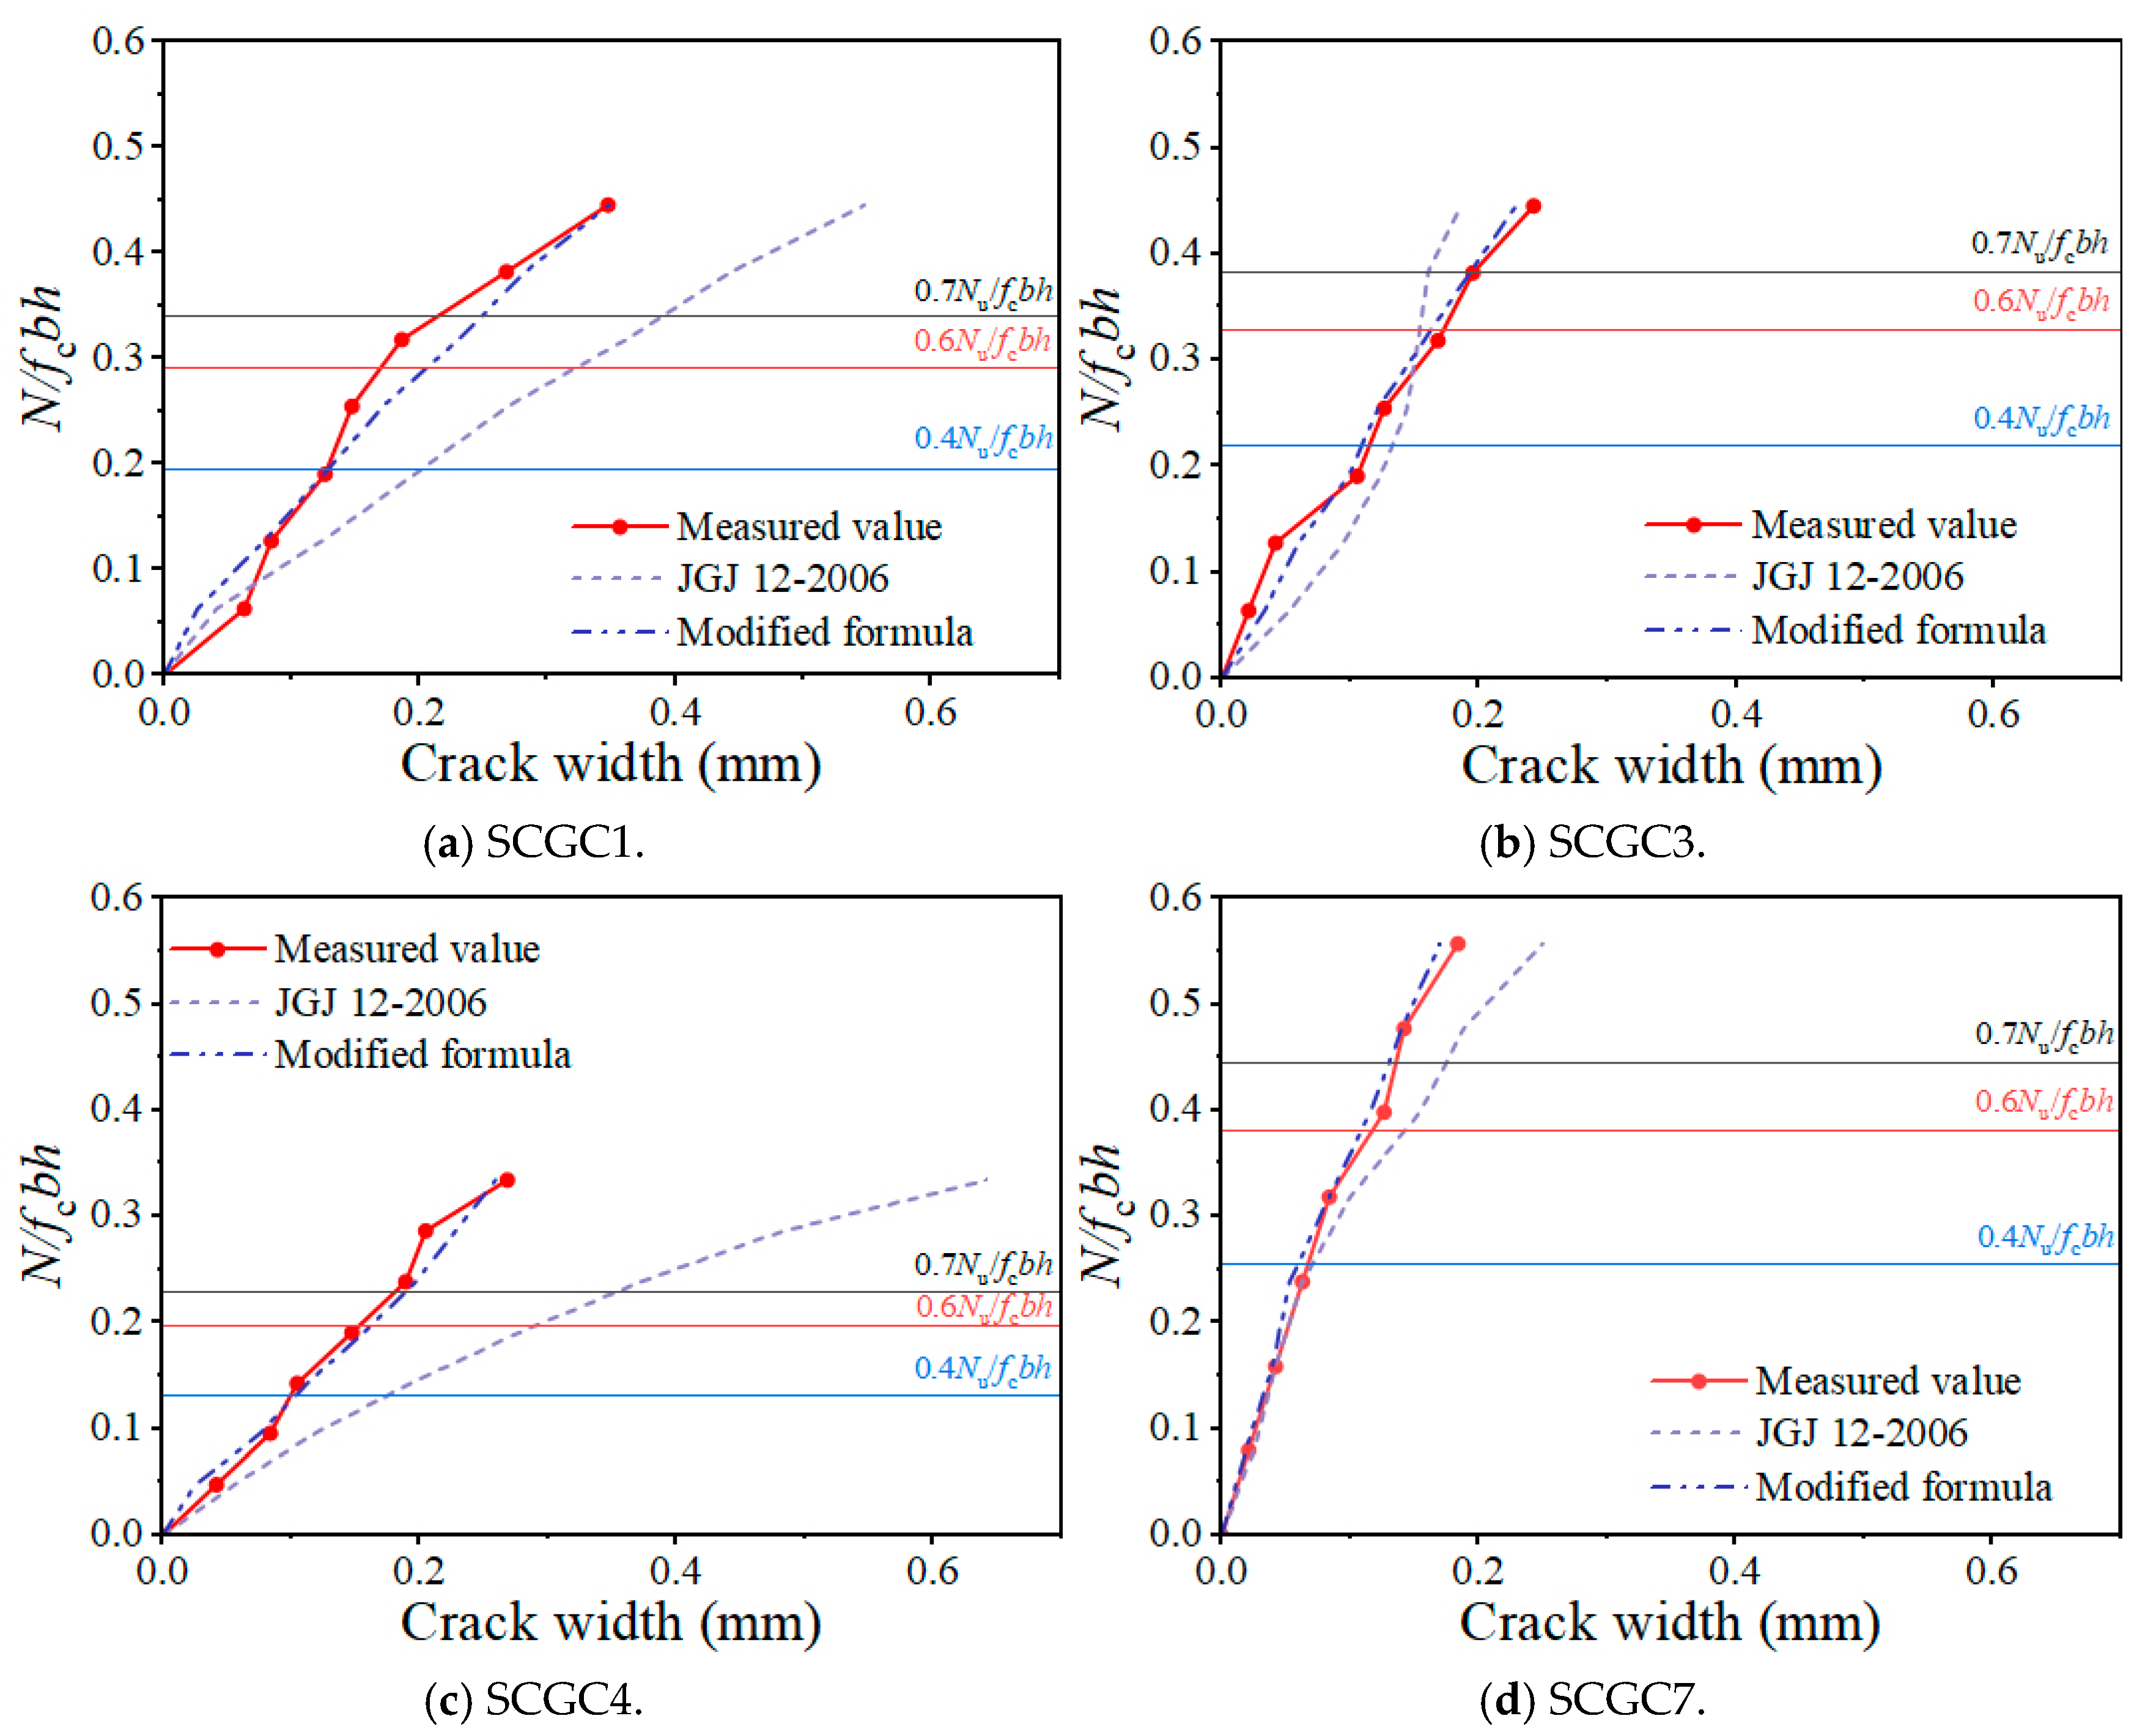
Considering that the coral aggregate is a lightweight aggregate, according to the “Code for Design of Lightweight Aggregate Concrete Structures” (JGJ12-2006) [41], the calculation formula for Nu of a rectangular column under combined axial and bending loads is as follows:
N u f c m b x + f y A s f y A s N u e f c m b x h 0 x / 2 + f y A s h 0 a s e = η e i + h / 2 a s η = 1 + 1 1400 e 0 / h 0 l 0 h 2 ζ 1 ζ 2 ζ 1 = 0.5 f c A / N ζ 2 = 1.3 0.015 l 0 / h e i = e 0 + e a e a = 0.12 ( 0.3 h 0 e 0 )
where f y and f y are the tensile and compressive strengths of the reinforcement, in MPa, respectively; A s and A s are the cross-sectional areas of the tensile and compressive longitudinal reinforcements, in mm2, respectively; a s and a s are the distances from the resultant force points of the tensile and compressive reinforcements to the edge of the cross-section, in mm, respectively; e is the distance between the point of axial load and the resultant force point of the tensile reinforcement, in mm, respectively; ei is the initial eccentricity, in mm; e0 is the eccentricity of the axial load relative to the centroid of the cross-section, in mm; ea is the additional eccentricity, in mm; fcm is the bending compressive strength of the concrete, in MPa, where fcm = 1.05fcu; η is the moment increase factor due to second-order effects; l0 is the effective length of the member, in mm; and ζ1 and ζ2 are fitting parameters, where ζ2 = 1 when l l0/h < 20.
The ultimate bearing capacity (Nu) of seven SCGC specimens under eccentric loading was calculated based on the JGJ12-2006. The average ratio of the calculated values (Nuc) to the measured values (Nu) is 3.07, with a coefficient of variation of 0.58. As shown in Figure 26, the bearing capacity calculated according to the JGJ12-2006 is generally overestimated, leading to poor prediction results. The main reasons are as follows: (i) CAGC is the combination of a geopolymer and coral aggregate, whose mechanical properties differ significantly from those of GPC and lightweight aggregate concrete; (ii) The plastic properties of the SSR result in greater deformation and wider cracks in SSRC structures during normal service, and its high ductility leads to different load redistribution and stress redistribution patterns compared to ORC structures. Additionally, the asymmetry in the stress–strain curve of the SSR under tensile and compressive loads also contributes to the inapplicability of the existing bearing capacity calculation formulas.
In order to cope with the problems above, Equation (8) is modified in this paper.
On the one hand, the differences in equivalent stress calculations are caused by the distinct mechanical properties between the CAGC and LAC. This paper determines the equivalent rectangular stress block for the compression zone of the SCGC based on ensuring that the area of the equivalent rectangular stress block equals the area of the theoretical stress block, and keeping the position of the resultant force unchanged.
In the equivalent stress diagram (Figure 27), x represents the equivalent length (shaded area in Figure 27). And OA corresponds to the parabolic portion of the theoretical stress block, while AB represents the rectangular portion of the theoretical stress block:
O A = ε 0 ε c u x = 0.0024 0.0028 x = 6 7 x
A B = 1 ε 0 ε c u x = 1 7 x
The resultant compressive force D of the concrete can be determined from the area of the theoretical stress block:
D = D 1 + D 2 = 2 3 f c 24 28 x b + f c 4 28 x b = 0.714 x b
According to the method of calculating the static moment of area, the distance from the resultant compressive force point of the concrete to the compression edge of the section can be determined:
1 2 β 1 x = f c b 2 3 · 24 28 x 4 28 x + 3 8 · 24 28 x + f c b 4 28 1 2 · 4 28 x 0.714 x b = 0.38 x
The value of β1 is determined to be 0.76. The resultant compressive force D in the concrete, based on the area of the equivalent rectangular stress distribution, can be calculated as:
D = α 1 f c β 1 x b = 0.76 α 1 σ 0 x b
Equation (14) can be obtained from the equivalence principle.
0.76 α 1 f c x b = 0.714 f c x b
Hence, the value of α1 is determined to be 0.94. For subsequent calculations, α1 is taken as 0.94, and β1 is taken as 0.76.
On the other hand, as discussed in Section 3.3, only the SSR that is farther from the axial force reaches the yield point under the large eccentricity failure pattern of the SCGC. This differs from the assumption in the JGJ12-2006 [41] code, which states that both the tensile and compressive reinforcements yield. However, the mechanical behavior of the SSR is similar to that described in the JGJ12-2006 [41] code under the small eccentricity failure pattern of the SCGC.
This paper derived Equations (15) and (16) based on the plane section assumption and force equilibrium to address this issue, in conjunction with Figure 27. The bearing capacity problem of large and small eccentric compression columns was resolved by solving these equations simultaneously with Equations (5) and (6).
ε t ε c u = h 0 x c x c ε t = ε c u h 0 x c 1
ε c ε y = x c a s h 0 x c ε c = ε y x c a s h 0 x c
This paper utilized the JGJ12-2006 [41] code in conjunction with the modified Ramberg–Osgood model to calculate the bearing capacity (NuS) of specimens SCGC1 to SCGC7, based on the aforementioned model revisions. The average ratio of NuS to the measured bearing capacity Nu was found to be 0.94, with a coefficient of variation of 0.034. The calculation results are shown in Figure 26. In summary, the revised bearing capacity calculation model, combined with the modified Ramberg–Osgood model, provides a reliable prediction of the bearing capacity of SCGC.

4.3. Crack Width

Structural components must not only meet the relevant requirements for bearing capacity but also control cracks and deformations during their service life. According to the JGJ12-2006 [41], the calculation formula for the maximum crack width (ωmax) of rectangular columns under combined compression and bending is as follows:
ω m a x = α c r ψ σ s E s 1.9 C + 0.04 d e q ρ t e
where αcr is the structural characteristic coefficient; ψ is the non-uniformity coefficient, ψ = 1.1 0.65 f t / ρ t e σ s ; σs is the tensile stress of the SSR, in MPa; Es is the elastic modulus of the steel, in GPa; C is the concrete cover thickness, in mm; ρte is the ratio of the SSR cross-sectional area Af to the effective tensile area of the concrete Ate, ρte = Af/Ate, where Ate = 0.5bh, h and b are the height and width of the cross-section, respectively; and deq is the equivalent diameter of the longitudinal tensile reinforcement, in mm, deq = ∑nidi2/∑niυidi, where di, ni, and υi are the nominal diameter (mm), number of bars, and relative bond characteristic coefficient of the i-th type of longitudinal tensile reinforcement, respectively.
As shown in Figure 28 (taking SCGC1, SCGC3, SCGC4, and SCGC7 for examples), the calculation formulas proposed by the aforementioned three standards fail to accurately describe the N/fcbh–crack width curve. Considering the following factors: (i) the bond performance between the CAGC and SSR differs from that between OPC and carbon steel bars, so the ψ calculation formula has been revised as shown in Equation (18); (ii) under a small eccentric load, the tensile SSR strain εs = εcu(h0/xc − 1), while under a large eccentric load, the tensile SSR strain εs = εy. In summary, the revised crack width calculation formula is shown below.
ω m a x = α c r ψ ε s 1.9 C + 0.04 d e q ρ t e ψ = 1.65 0.975 f t / ρ t e σ s
Columns, which in actual engineering practice, are typically subjected to standard combination and quasi-permanent combination loads according to the GB50068-2018 [42]. The load factor γ is 1.367 for the standard combination. The relationship between the axial force Nk under the standard combination and the axial force design value N is Nk = N/1.367 = 0.7N. Similarly, the load factor γ is 1.64 for the quasi-permanent combination. The relationship between Nk under the quasi-permanent combination and N is Nk = N/1.64 = 0.6N. Therefore, the standard combination and quasi-permanent combination loads correspond to 70% and 60% of the ultimate load, respectively. As shown in Figure 28, Equation (18) not only accurately predicts the crack width under standard combination (70% Nu) and quasi-permanent combination (60% Nu) loads but also effectively captures the overall trend of the N/fcbh—crack width curve.
This paper proposes a column structure using a novel material—SCGC—that demonstrates the potential for practical application in island and marine buildings. The use of coral aggregates reduces material transportation costs and carbon emissions, while SSRs can help the structure face the durability challenges posed by the marine environmental context and extend the service life of marine structures. Therefore, this paper suggests the use of SCGC in the marine area with more coral waste. The failure mode of SCGC is similar to that of traditional concrete columns, but the mechanical properties of CAGC are different from ordinary concrete, and the SSR does not have a yielding platform, which leads to the existence of a special column stress situation and crack development, so this paper suggests the use of SCGC in real projects. The load carrying capacity prediction can be referred to Equations (5) and (6) and the crack width prediction can refer to Equation (18). The accuracy of these equations is verified in this paper and the results show that the equations are reliable.

5. Conclusions

This paper presents experimental and theoretical analyses of the eccentric compression of SCGC with different reinforcement ratios and eccentricity, leading to the following key conclusions:
(1) The failure patterns of SCGC under eccentric compression are similar to those of ORC columns, and its lateral displacement curve resembles a sine wave. However, SCGC exhibits greater lateral deformation compared to ORC.
(2) CAC, OAC, LAC, and CAGC exhibit a similar ascending branch. However, in the descending branch, the CAGC curve is steeper than that of the OAC and LAC curves, while flatter than that of the CAC curve. Through a systematic analysis of the stress–strain response characteristics specific to CAGC, this paper proposes a novel constitutive model for CAGC.
(3) When e0/h ≥ 0.7, SCGC experiences large eccentric failure; otherwise, it undergoes small eccentric failure. Under large eccentric compression, the tensioned SSR yields while the compressed SSR does not, which differs from that of reinforced OAC columns. Conversely, under small eccentric compression, the yielding behavior of the SSR is exactly opposite.
(4) This study proposes a novel load-bearing capacity prediction model for SCGC columns through the introduction of the CAGC constitutive model. The refined model demonstrates a strong agreement with the experimental results, indicating that it has promising applications.
(5) An improved crack width calculation model based on the bond-slip theory is developed, taking into account the different bonding characteristics between CAGC and SSR compared to OAC and carbon steel bars and the characteristic of SSRs lacking a yield plateau. The modified model is able to predict the crack width accurately.

Author Contributions

H.X.: Methodology, Visualization, and Supervision. J.J.: Writing—original draft and Formal analysis. C.Y.: Investigation. All authors have read and agreed to the published version of the manuscript.

Funding

This research received no external funding.

Institutional Review Board Statement

Not applicable.

Informed Consent Statement

Not applicable.

Data Availability Statement

The raw data supporting the conclusions of this article will be made available by the authors on request.

Conflicts of Interest

The authors declare that they have no known competing financial interests or personal relationships that could have appeared to influence the work reported in this paper.

References

  1. Ebead, U.; Lau, D.; Lollini, F.; Nanni, A.; Suraneni, P.; Yu, T. A review of recent advances in the science and technology of seawater-mixed concrete. Cem. Concr. Res. 2022, 152, 106666. [Google Scholar] [CrossRef]
  2. Da, B.; Yu, H.; Ma, H.; Tan, Y.; Mi, R.; Dou, X. Experimental investigation of whole stress-strain curves of coral concrete. Constr. Build. Mater. 2016, 122, 81–89. [Google Scholar] [CrossRef]
  3. Yang, H.; Li, M.; Jiang, J.; Zhang, Y.; Mei, J.; Deng, Z. Mechanical properties of steel reinforced coral aggregate concrete column under uniaxial compression. Constr. Build. Mater. 2023, 369, 130508. [Google Scholar] [CrossRef]
  4. Liang, X.; Yin, S.; Hu, C. Environmental reduction factors of BFRP bars in coral aggregate concrete in high temperature and high humidity environments. Structures 2021, 33, 3017–3024. [Google Scholar] [CrossRef]
  5. Zi, M.; Liu, K.; Liu, S.; Qin, M. Study on the basic properties of coral sand used as fine aggregate. Constr. Build. Mater. 2015, 5, 11–14. [Google Scholar]
  6. Zhao, Y.; Han, C.; Zhang, S.; Ge, R. Experimental study on the compression age strength of seawater coral concrete. Concrete 2011, 2, 43–45. (In Chinese) [Google Scholar]
  7. Liu, J.; Ou, Z.; Mo, J.; Chen, Y.; Guo, T.; Deng, W. Effectiveness of saturated coral aggregate and shrinkage reducing admixture on the autogenous shrinkage of ultrahigh performance concrete. Adv. Mater. Sci. Eng. 2017, 2017, 2703264. [Google Scholar] [CrossRef]
  8. Yang, H.; Mei, J.; Yang, Y. Bond strength and reliability analysis of stainless steel rebar embedded in fiber reinforced coral aggregate concrete. Constr. Build. Mater. 2022, 350, 128783. [Google Scholar] [CrossRef]
  9. Huang, D.; Niu, D.; Li, S.; Zheng, H.; Fu, Q.; Liu, Y. Effects of mineral admixtures on chloride diffusion in environment-friendly coral aggregate concrete. J. Renew. Mater. 2022, 10, 3477. [Google Scholar] [CrossRef]
  10. Ma, L.; Li, Z.; Wang, M.; Wei, H.; Fan, P. Effects of size and loading rate on the mechanical properties of single coral particles. Powder Technol. 2019, 342, 961–971. [Google Scholar] [CrossRef]
  11. Zhang, J.; Wu, Z.; Zhang, Y.; Fang, Q.; Yu, H.; Jiang, C. Mesoscopic characteristics and macroscopic mechanical properties of coral aggregates. Constr. Build. Mater. 2021, 309, 125125. [Google Scholar] [CrossRef]
  12. Wang, A.; Zhang, Z.; Liu, K.; Xu, H.; Shi, L.; Sun, D. Coral aggregate concrete: Numerical description of physical, chemical and morphological properties of coral aggregate. Cem. Concr. Compos. 2019, 100, 25–34. [Google Scholar] [CrossRef]
  13. Zhang, P.; Zheng, Y.; Wang, K.; Zhang, J. A review on properties of fresh and hardened geopolymer mortar. Compos. Part B Eng. 2018, 152, 79–95. [Google Scholar] [CrossRef]
  14. Van Jaarsveld, J.G.S.; Van Deventer, J.S.J.; Lorenzen, L. The potential use of geopolymeric materials to immobilise toxic metals: Part I. Theory and applications. Miner. Eng. 1997, 10, 659–669. [Google Scholar] [CrossRef]
  15. Zhang, B.; Zhu, H.; Lu, F. Fracture properties of slag-based alkali-activated seawater coral aggregate concrete. Theor. Appl. Fract. Mech. 2021, 115, 103071. [Google Scholar] [CrossRef]
  16. Zhang, B.; Zhu, H.; Shah, K.W.; Dong, Z.; Wu, J. Performance evaluation and microstructure characterization of seawater and coral/sea sand alkali-activated mortars. Constr. Build. Mater. 2020, 259, 120403. [Google Scholar] [CrossRef]
  17. Zhang, B.; Zhu, H.; Shah, K.W.; Dong, Z.; Wu, J. Design and properties of seawater coral aggregate alkali-activated concrete. J. Sustain. Cem.-Based Mater 2022, 11, 187–201. [Google Scholar] [CrossRef]
  18. Wu, W.; Wang, R.; Zhu, C.; Meng, Q. The effect of fly ash and silica fume on mechanical properties and durability of coral aggregate concrete. Constr. Build. Mater. 2018, 185, 69–78. [Google Scholar] [CrossRef]
  19. Yuan, J.; Ou, Z. Research progress and engineering applications of stainless steel-reinforced concrete structures. Adv. Civ. Eng. 2021, 2021, 9228493. [Google Scholar] [CrossRef]
  20. Jing, Q.; Fang, X.; Ni, J.; Tang, Y.; Fang, X. Use of 2304 Stainless steel reinforcement in Hong Kong-Zhuhai-Macau bridge-corrosion behaviours of 2304 stainless steel reinforcement. J. Highw. Transp. Res. Dev. 2017, 34, 51–56. [Google Scholar]
  21. Da, B.; Yu, H.F.; Ma, H.Y.; Wu, Z. Anti-corrosion performances of different types of rebars in coral aggregate seawater concrete. Mater. Rep. 2019, 33, 2002–2008. (In Chinese) [Google Scholar]
  22. Li, Q.; Kuang, Y.; Guo, W.; Zhang, Y. Experimental research on mechanical performance of SSRC columns under eccentric compression. Appl. Sci. 2020, 10, 5629. [Google Scholar] [CrossRef]
  23. Rabi, M.; Cashell, K.A.; Shamass, R. Flexural analysis and design of stainless steel reinforced concrete beams. Eng. Struct. 2019, 198, 109432. [Google Scholar] [CrossRef]
  24. Geromel, M.; Mazzarella, O. Experimental and analytical assessment of the behavior of stainless steel reinforced concrete beams. Mater. Struct. 2005, 38, 211–218. [Google Scholar] [CrossRef]
  25. Li, Q.; Guo, W.; Liu, C.; Kuang, Y.; Geng, H. Experimental and theoretical studies on flexural performance of stainless steel reinforced concrete beams. Adv. Civ. Eng. 2020, 2020, 4048750. [Google Scholar] [CrossRef]
  26. Rabi, M.; Cashell, K.A.; Shamass, R. Ultimate behaviour and serviceability analysis of stainless steel reinforced concrete beams. Eng. Struct. 2021, 248, 113259. [Google Scholar] [CrossRef]
  27. Khalifa, M. Heat of Hydration Thermal Performance and Flexural Capacity of Stainless-Steel Reinforced Concrete Sections. Master’s Thesis, The University of Western Ontario (Canada), London, ON, Canada, 2019. [Google Scholar]
  28. Zhang, G.; Zhang, Y.; Zhou, Y. Fatigue tests of concrete slabs reinforced with stainless steel bars. Adv. Mater. Sci. Eng. 2018, 2018, 5451398. [Google Scholar] [CrossRef]
  29. Fu, J.; Ge, X.; Li, J.; Sun, Z.; Wang, D. Seismic performance of concrete bridge piers reinforced by stainless steel bars: A quasi-static experimental study. Eng. Struct. 2022, 266, 114507. [Google Scholar] [CrossRef]
  30. Nicoletti, V.; Carbonari, S.; Gara, F. Nomograms for the pre-dimensioning of RC beam-column joints according to Eurocode 8. Structures 2022, 39, 958–973. [Google Scholar] [CrossRef]
  31. Zhou, Y.J.; Wang, X.T.; Sun, H.R.; Chen, X.; Wang, T. Residual seismic performance for damaged RC frame based on beam-to-column joint subassemblies. Structures 2025, 71, 107980. [Google Scholar] [CrossRef]
  32. JGJ51-2002; Technical Code for Lightweight Aggregate Concrete. China Architecture & Building Press: Beijing, China, 2002. (In Chinese)
  33. GB/T17431-2010; Lightweight Aggregate and Its Test Methods. Standards Press of China: Beijing, China, 2010. (In Chinese)
  34. JGJ52-2006; Standard for Quality and Testing Methods of Sand and Crushed Stone for Ordinary Concrete. China Architecture & Building Press: Beijing, China, 2006. (In Chinese)
  35. Liu, B.; Ye, J.; Liu, X.; Lin, W.; Deng, Z.; Liu, Q. Shear strength and failure criterion of carbon fiber reinforced coral concrete under combined compression-shear stresses. Constr. Build. Mater. 2022, 325, 126728. [Google Scholar] [CrossRef]
  36. GB/T228.1-2021; Tensile Testing of Metallic Materials-Part 1: Room Temperature Test Method. Standards Press of China: Beijing, China, 2021. (In Chinese)
  37. Deng, M.; Pan, J.; Liang, X. Uniaxial compressive test of high ductile fiber-reinforced concrete and damage constitutive model. Adv. Civ. Eng. 2018, 2018, 4308084. [Google Scholar] [CrossRef]
  38. Liu, B.; Zhou, J.; Wen, X.; Hu, X.; Deng, Z. Mechanical properties and constitutive model of carbon fiber reinforced coral concrete under uniaxial compression. Constr. Build. Mater. 2020, 263, 120649. [Google Scholar] [CrossRef]
  39. Da, B.; Chen, Y.; Yu, H.; Ma, H.; Chen, D.; Wu, Z.; Liu, J.; Li, Y. Preparation technology, mechanical properties and durability of coral aggregate seawater concrete in the island-reef environment. J. Clean. Prod. 2022, 339, 130572. [Google Scholar] [CrossRef]
  40. GB50010-2010; Code for Design of Concrete Structures. China Architecture & Building Press: Beijing, China, 2015. (In Chinese)
  41. JGJ12-2006; Technical Code for Lightweight Aggregate Concrete Structures. China Architecture & Building Press: Beijing, China, 2006. (In Chinese)
  42. GB50068-2018; Unified Standard for Reliability Design of Engineering Structures. China Architecture & Building Press: Beijing, China, 2018. (In Chinese)
Figure 1. Coarse coral aggregate.
Applsci 15 03570 g001
Figure 2. Coarse coral sand.
Applsci 15 03570 g002
Figure 3. Fine coral sand.
Applsci 15 03570 g003
Figure 4. Gradation curve of coral coarse aggregate after crushing treatment.
Applsci 15 03570 g004
Figure 5. Gradation curve of mixed coral sand.
Applsci 15 03570 g005
Figure 6. SSRs.
Figure 6. SSRs.
Applsci 15 03570 g006
Figure 7. Tensile test of SSRs.
Applsci 15 03570 g007
Figure 8. SCGC’s basic size and reinforcement.
Applsci 15 03570 g008
Figure 9. Loading of specimen. (a) Column loading. (b) Load scheme.
Applsci 15 03570 g009
Figure 10. Arrangement of strain gauges and displacement gauges.
Applsci 15 03570 g010
Figure 11. The failure patterns of typical SCGC specimens.
Applsci 15 03570 g011
Figure 12. Crack development diagram. Note: Numbers 1–22 in the figure show the chronological order of cracks.
Applsci 15 03570 g012
Figure 13. Cracking load.
Applsci 15 03570 g013
Figure 14. Ultimate load.
Applsci 15 03570 g014
Figure 15. N/fcbh—crack width curves.
Applsci 15 03570 g015
Figure 16. N/fcbh0—axial compressive displacement curves.
Applsci 15 03570 g016
Figure 17. N/fcbh0—midspan lateral displacement curve.
Applsci 15 03570 g017
Figure 18. Deflection distribution in the direction of sample height.
Applsci 15 03570 g018
Figure 19. N/fcbh—SSR strain relationship curves.
Applsci 15 03570 g019
Figure 20. Concrete strain distribution diagram of midspan section.
Applsci 15 03570 g020
Figure 21. The stress–strain curves of CAGC, CAC, OAC, and LAC. Refs. [36,37].
Applsci 15 03570 g021
Figure 22. Normalized stress–strain curves.
Applsci 15 03570 g022
Figure 23. Compression stress–strain curve of CAGC.
Applsci 15 03570 g023
Figure 24. Force diagram of column section. (a) Column section (b) Large eccentric compression mode (c) Small eccentric compression mode.
Applsci 15 03570 g024
Figure 25. Relative depth of compressive area.
Applsci 15 03570 g025
Figure 26. NuS vs. Nu.
Applsci 15 03570 g026
Figure 27. Equivalent stress. (a) Equivalent compressive stress of concrete (b) Strain distribution of column section.
Applsci 15 03570 g027
Figure 28. Comparison of test and predicted N/fcbh—crack width curves.
Applsci 15 03570 g028
Table 1. Basic properties of coral coarse aggregate.
No.1 h Water Absorption
(%)
24 h Water Absorption
(%)
Bulk Density
(kg/m3)
Apparent Density
(kg/m3)
Cylinder Compressive Strength
(MPa)
Silt Content
(%)
Coral coarse aggregate7.828.1388220922.14.2
Table 2. Basic properties of mixed coral sand.
No.1 h Water Absorption
(%)
24 h Water Absorption
(%)
Bulk Density
(kg/m3)
Apparent Density
(kg/m3)
Moisture Content
(%)
Silt Content
(%)
Mixed coral sand3.523.73129627072.870.5
Table 3. Mixing proportion.
Coarse Aggregate
(kg/m3)
Fine AggregateSL
(kg/m3)
FA
(kg/m3)
Alkali ActivatorSeawater
(kg/m3)
f c u
(MPa)
f c
(MPa)
Coarse Sand
(kg/m3)
Fine Sand
(kg/m3)
Sodium Silicate (kg/m3)NaOH Solution
(kg/m3)
7113363361672501421276037.629.0
Table 4. Main compound composition of artificial seawater.
No.NaClMgCl2•6H2ONa2SO4CaCl2
Content/(g/L)28.17.222.431.12
Table 5. Composition and proportion of SL and FA.
No.Ingredient Composition
Al2O3
(%)
SiO2
(%)
Fe2O3
(%)
CaO
(%)
MnO
(%)
MgO
(%)
K2O
(%)
Na2O
(%)
SL14.336.53.233.60.87.5\\
FA28.150.86.23.71.228.10.61.2
Table 6. Mechanical properties of SSRs.
d
(mm)
Nominal Yield Stress
RP0.2 (MPa)
Ultimate Stress
Rm (MPa)
Modulus of Elasticity
Es (GPa)
8511.1799.1165.1
12515.4807.5167.2
16516.8806.6166.8
20516.7803.3169.1
Table 7. Design parameters of SCGCs.
No.Strength
Grade
Size (b × h × l)
(mm)
e0
(mm)
d
(mm)
ρs
(mm)
Stirrup
(mm)
SCGC1C30250 × 300 × 160070120.3028@200
SCGC2C30250 × 300 × 1600280120.3028@200
SCGC3C30250 × 300 × 160070160.5368@200
SCGC4C30250 × 300 × 1600140160.5368@200
SCGC5C30250 × 300 × 1600210160.5368@200
SCGC6C30250 × 300 × 1600280160.5368@200
SCGC7C30250 × 300 × 160070200.8388@200
SCGC8C30250 × 300 × 1600280200.8388@200
Disclaimer/Publisher’s Note: The statements, opinions and data contained in all publications are solely those of the individual author(s) and contributor(s) and not of MDPI and/or the editor(s). MDPI and/or the editor(s) disclaim responsibility for any injury to people or property resulting from any ideas, methods, instructions or products referred to in the content.

