Surface Acoustic Wave Sensor for Selective Multi-Parameter Measurements in Cardiac Magnetic Field Detection


Abstract
:1. Introduction
2. Materials and Methods
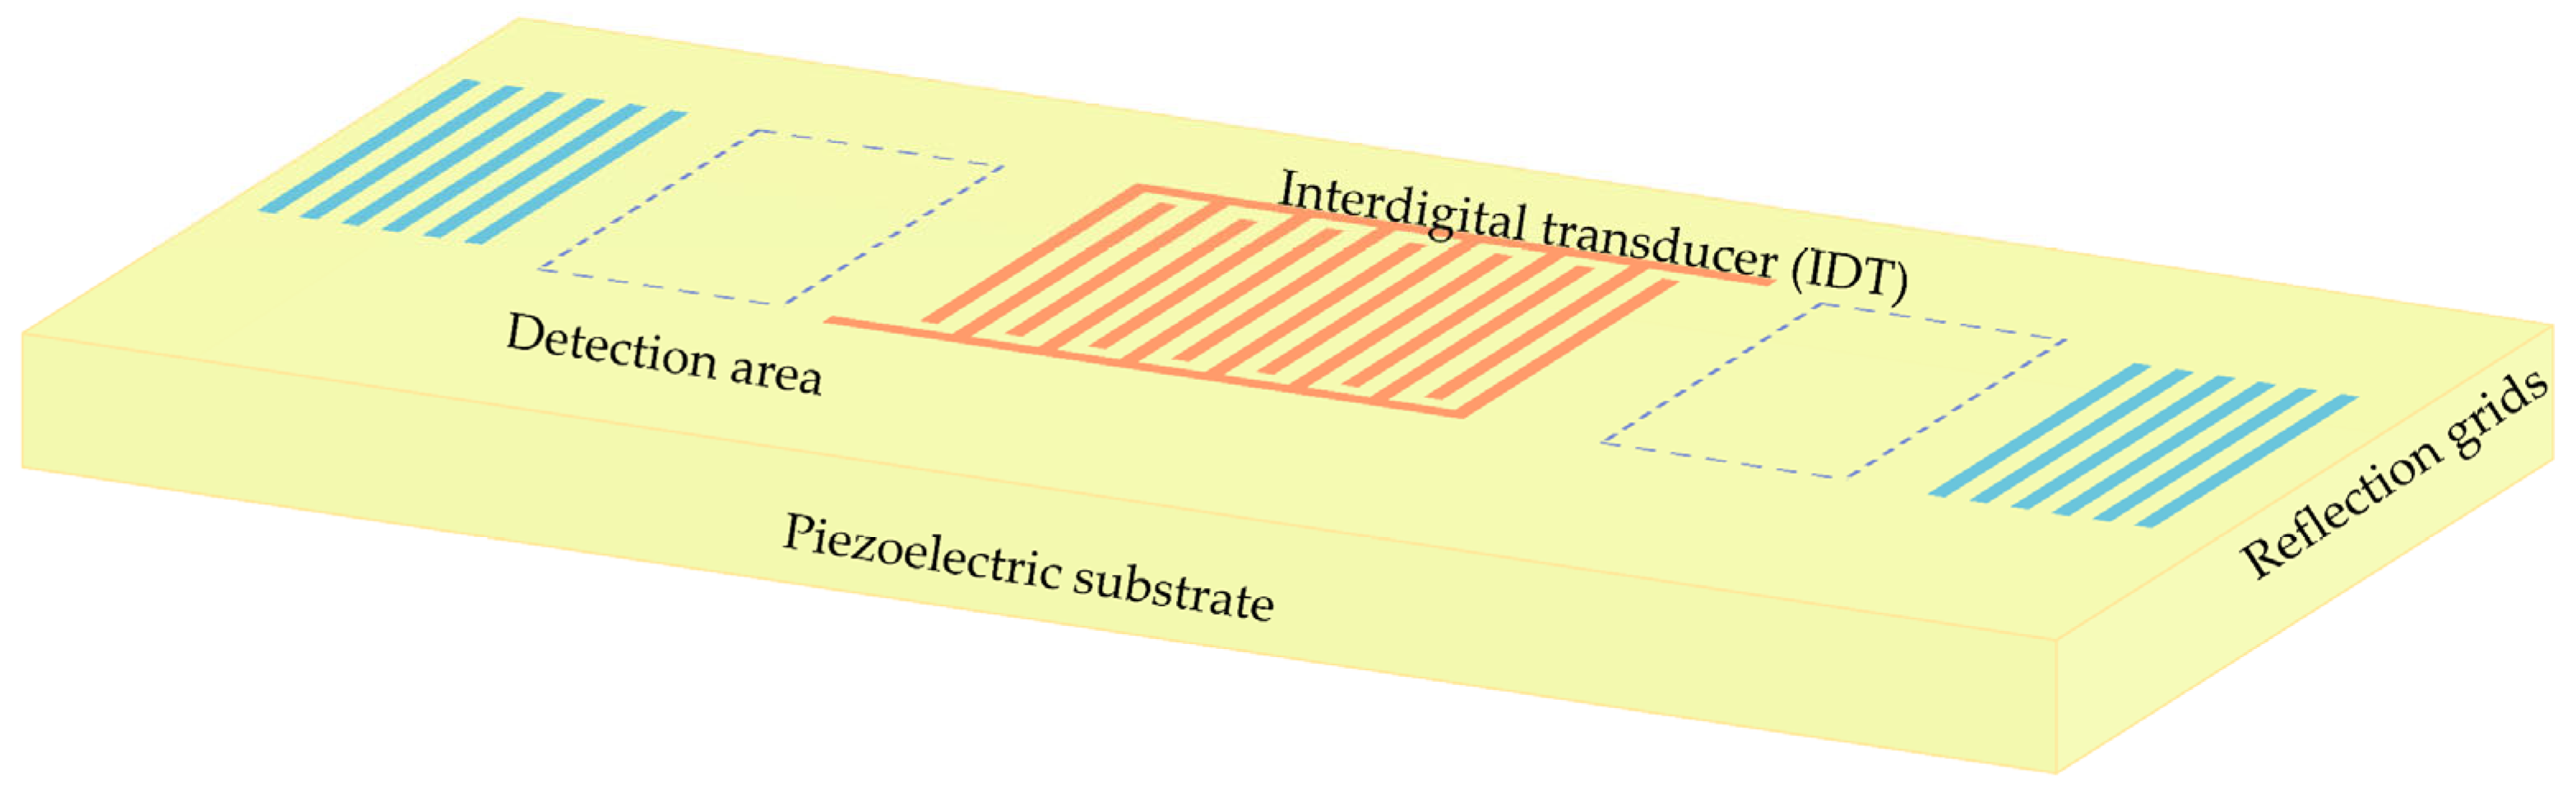
2.1. MP-SAWS Principle
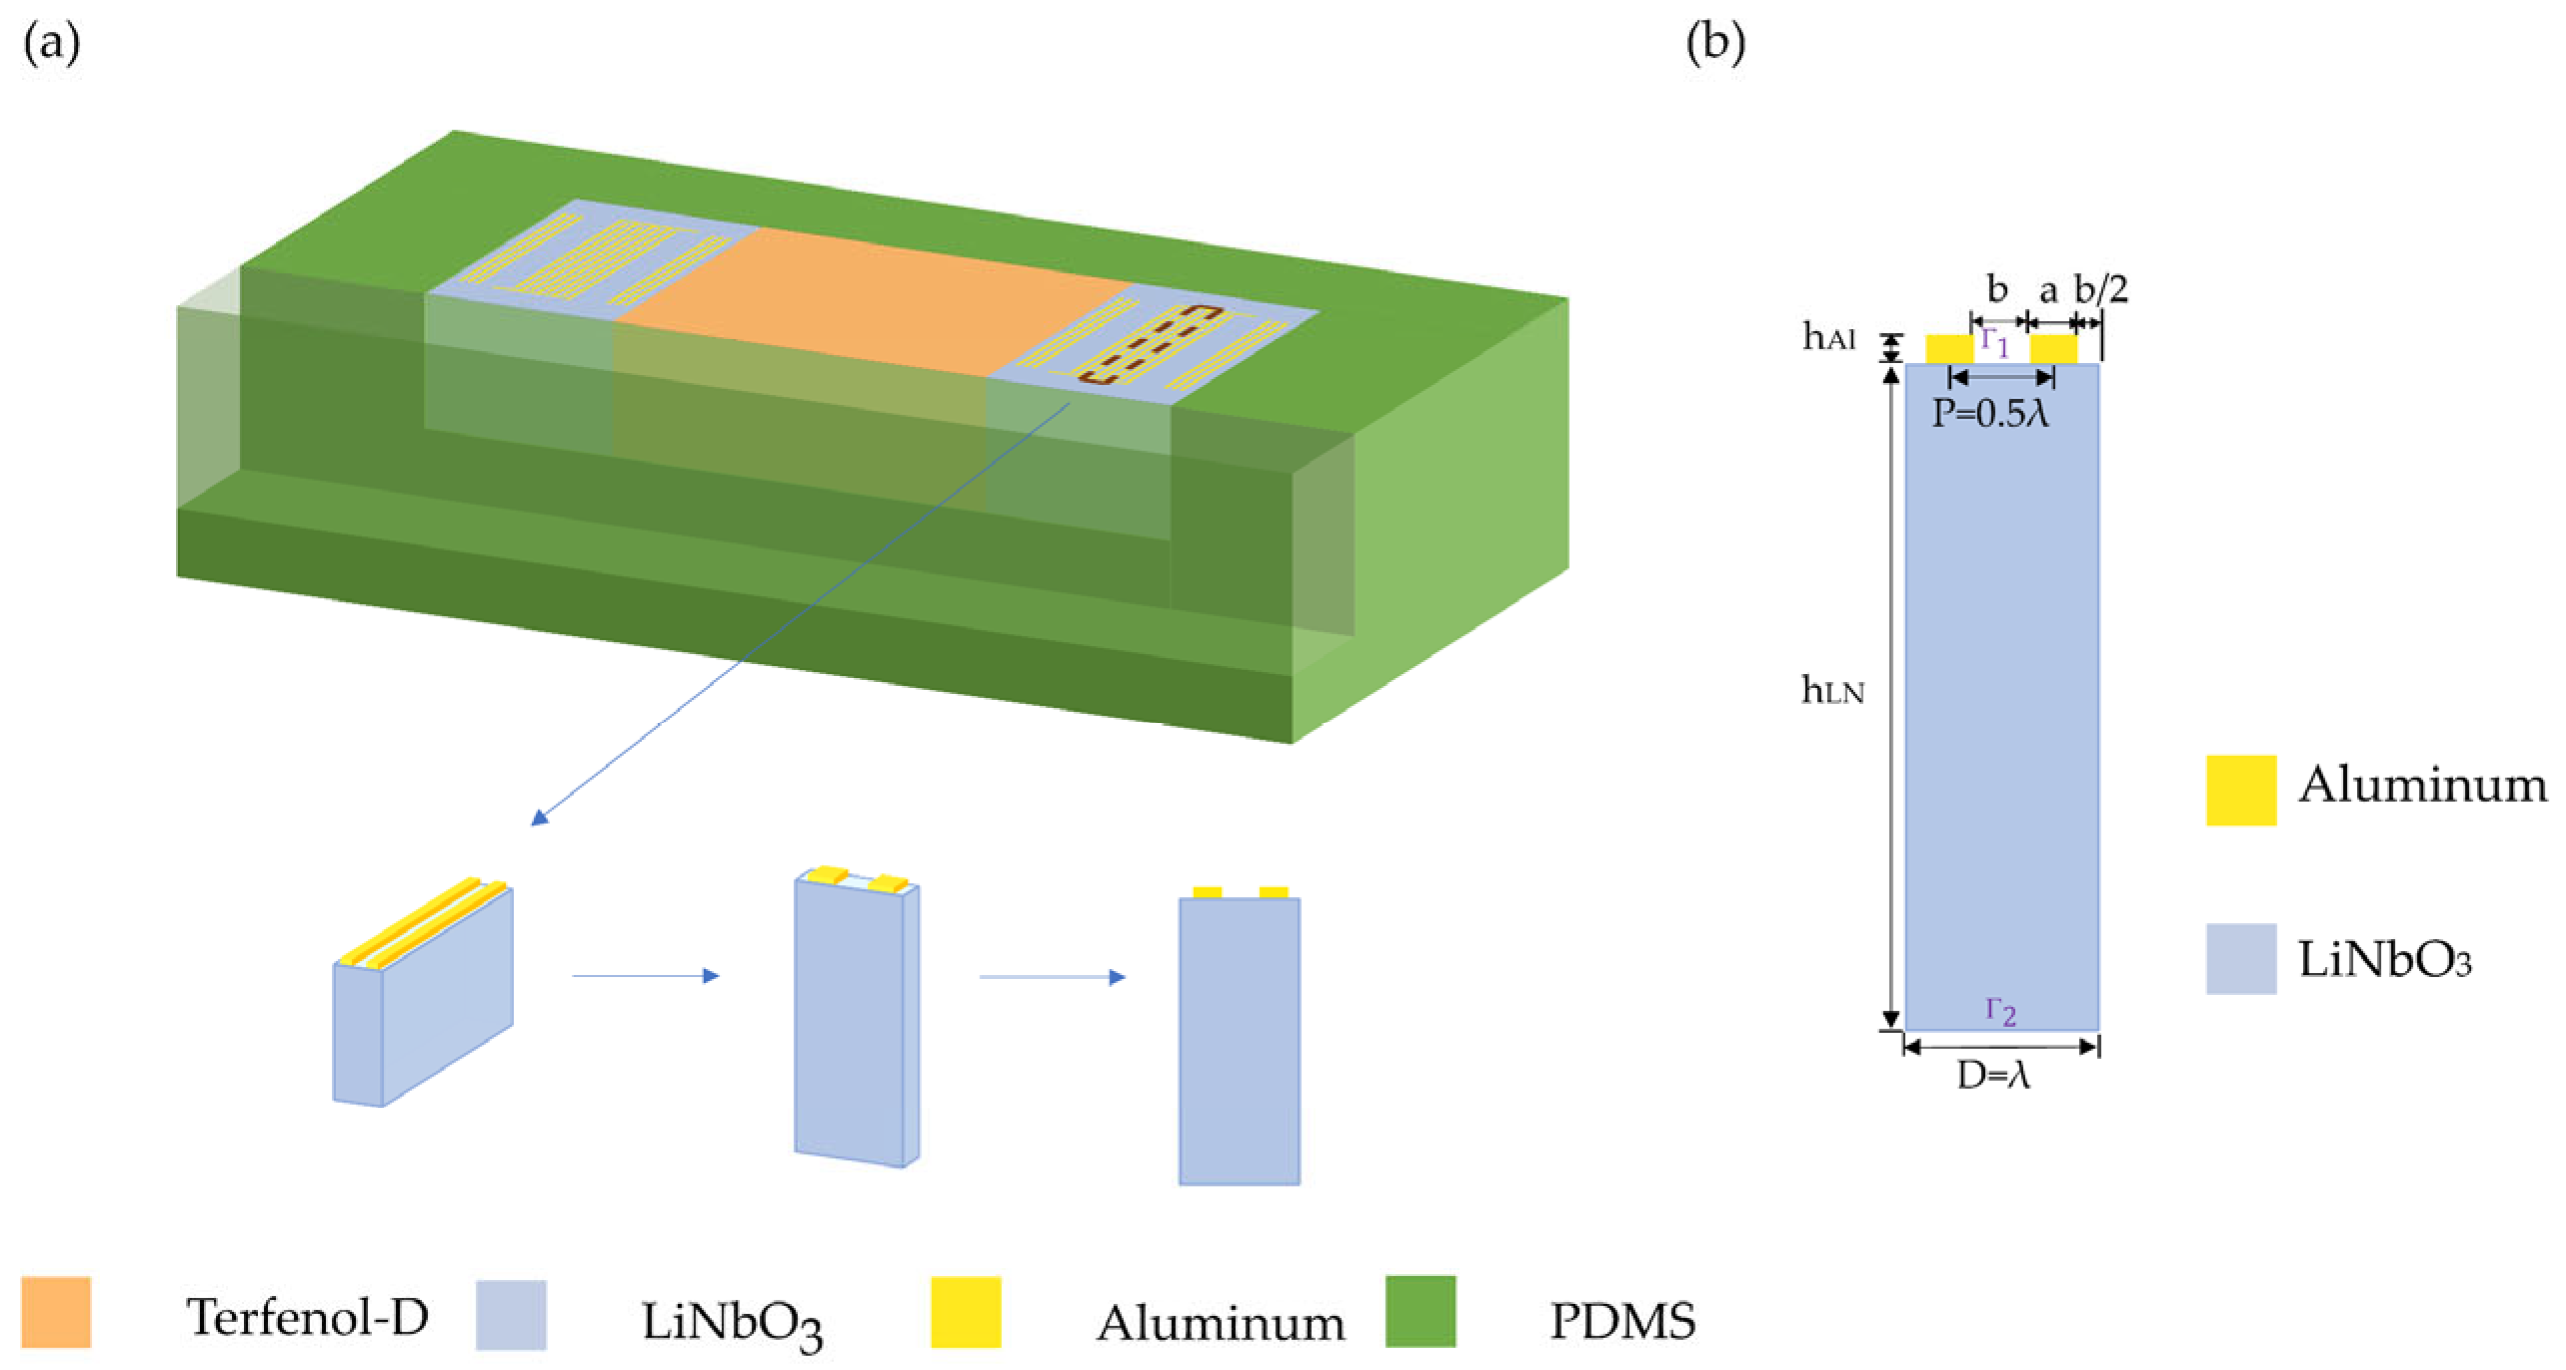
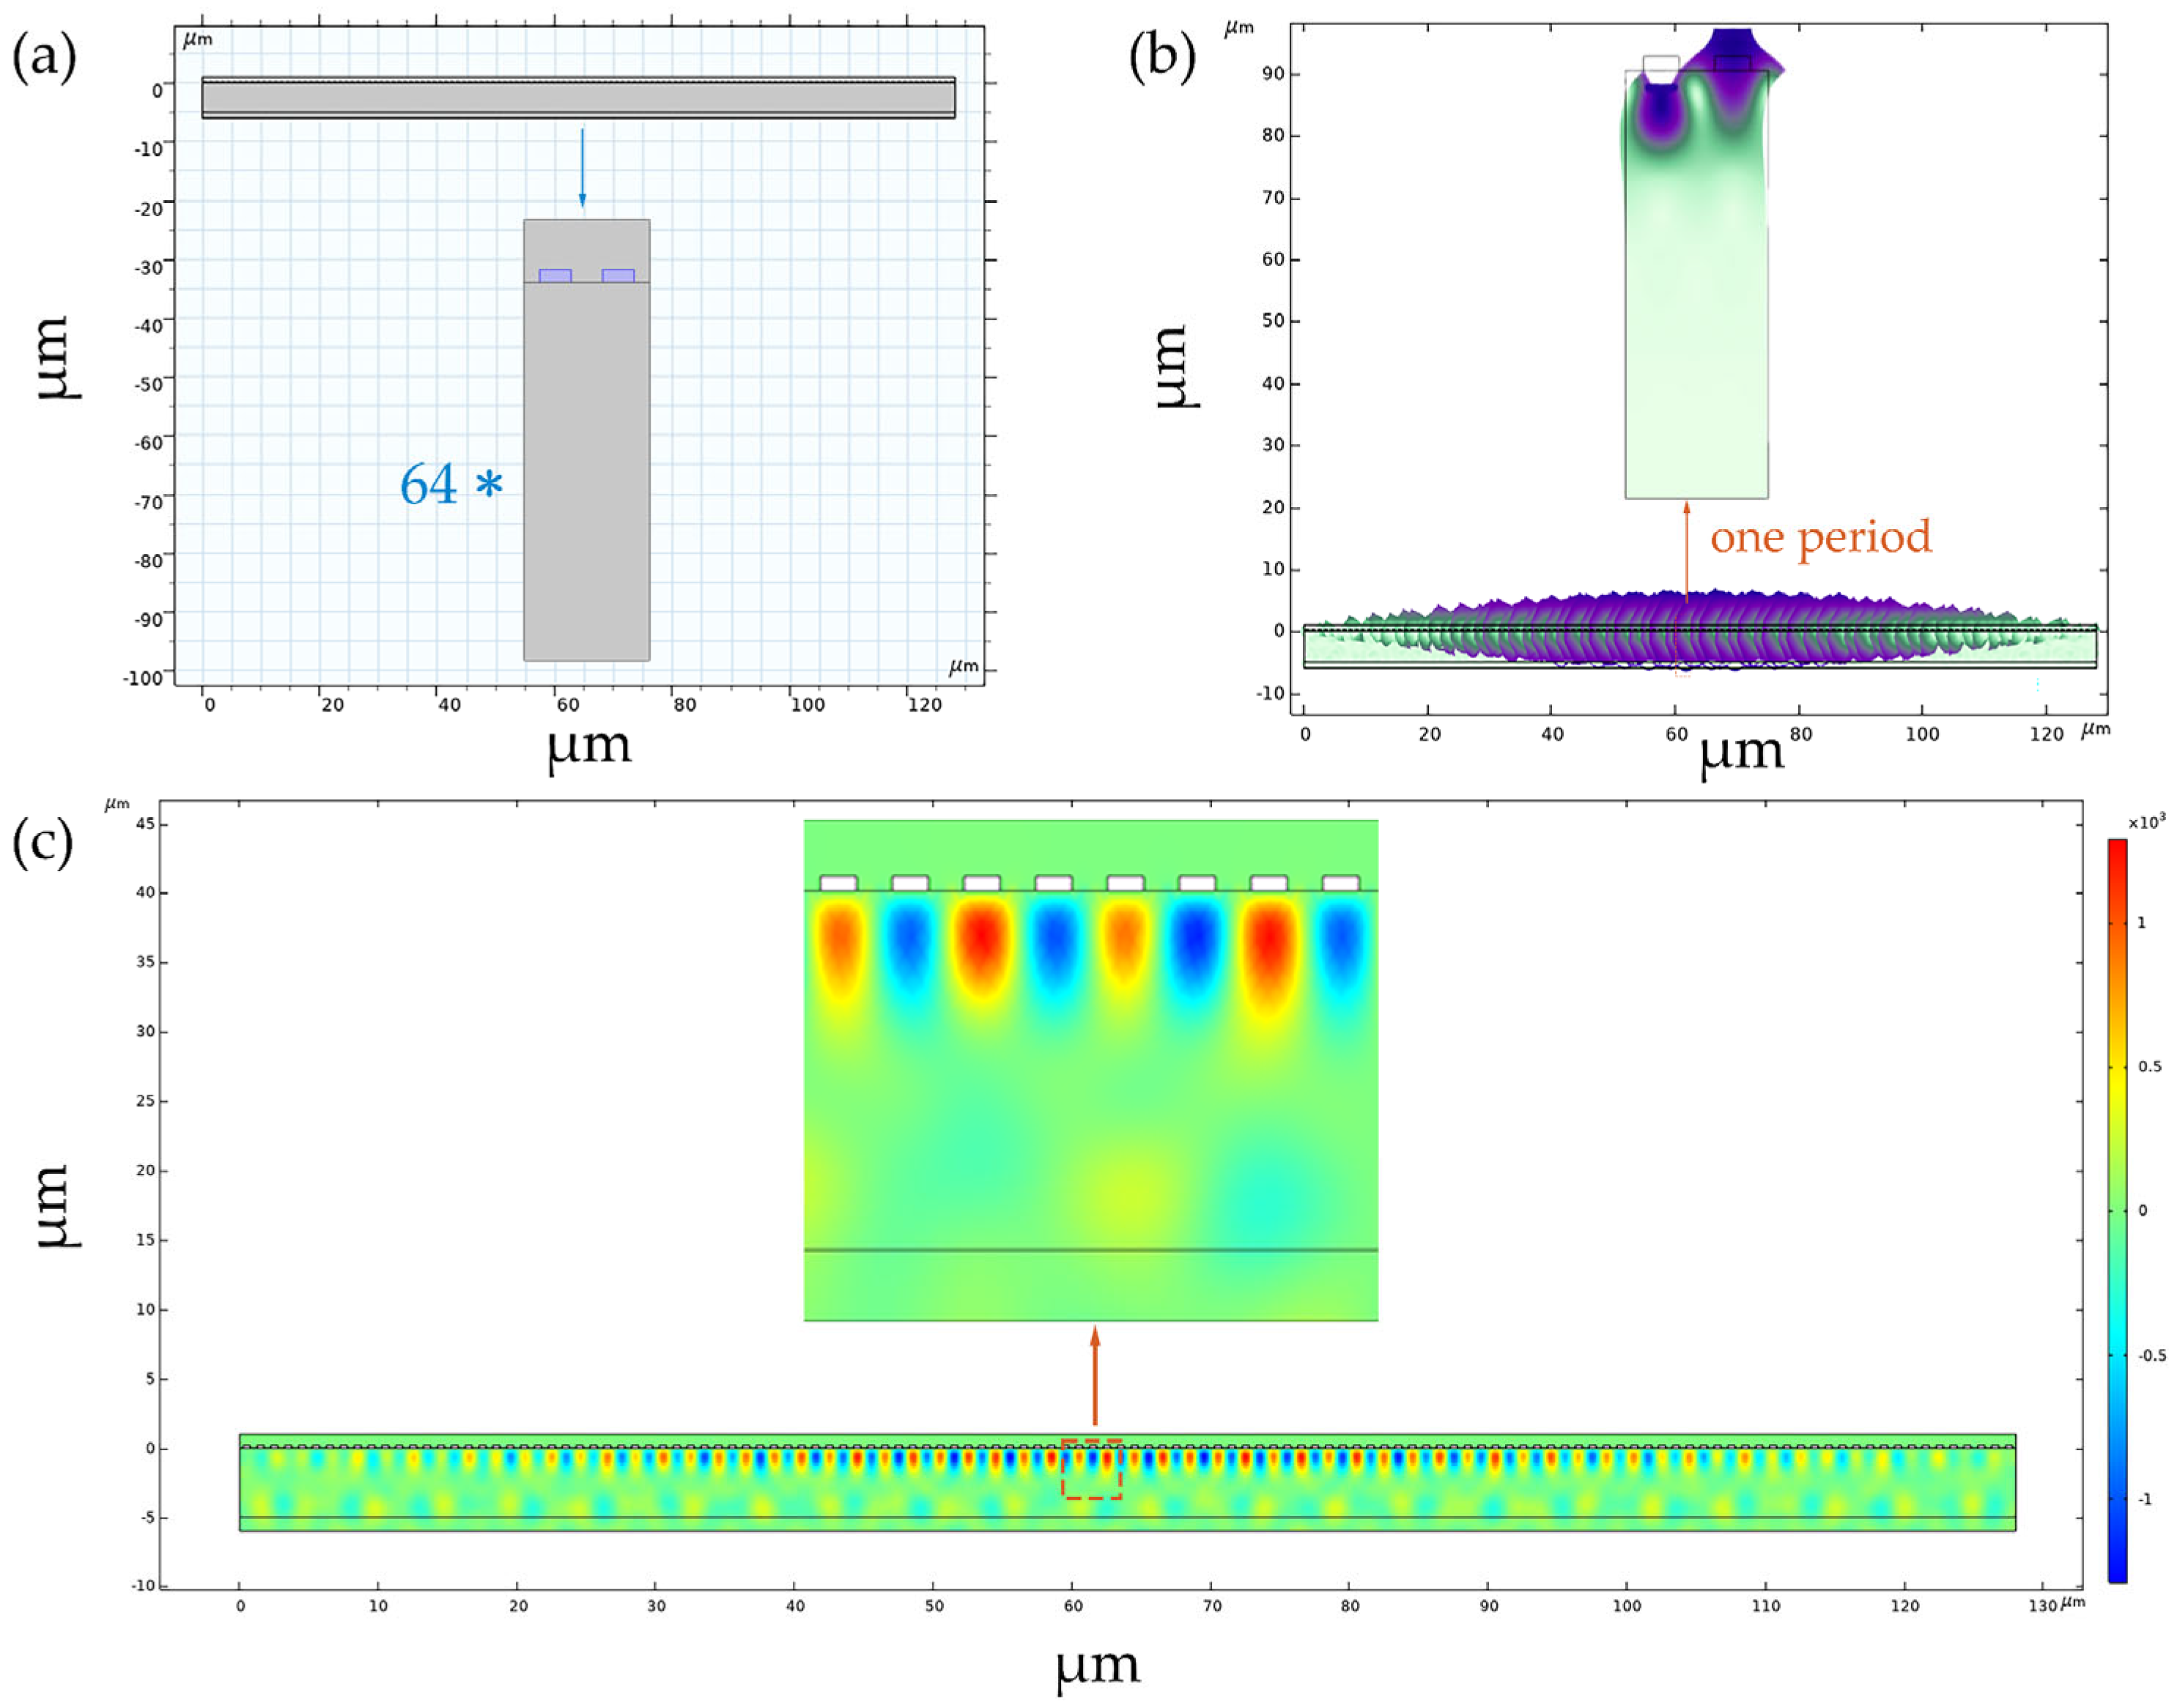
2.2. MP-SAWS Modeling
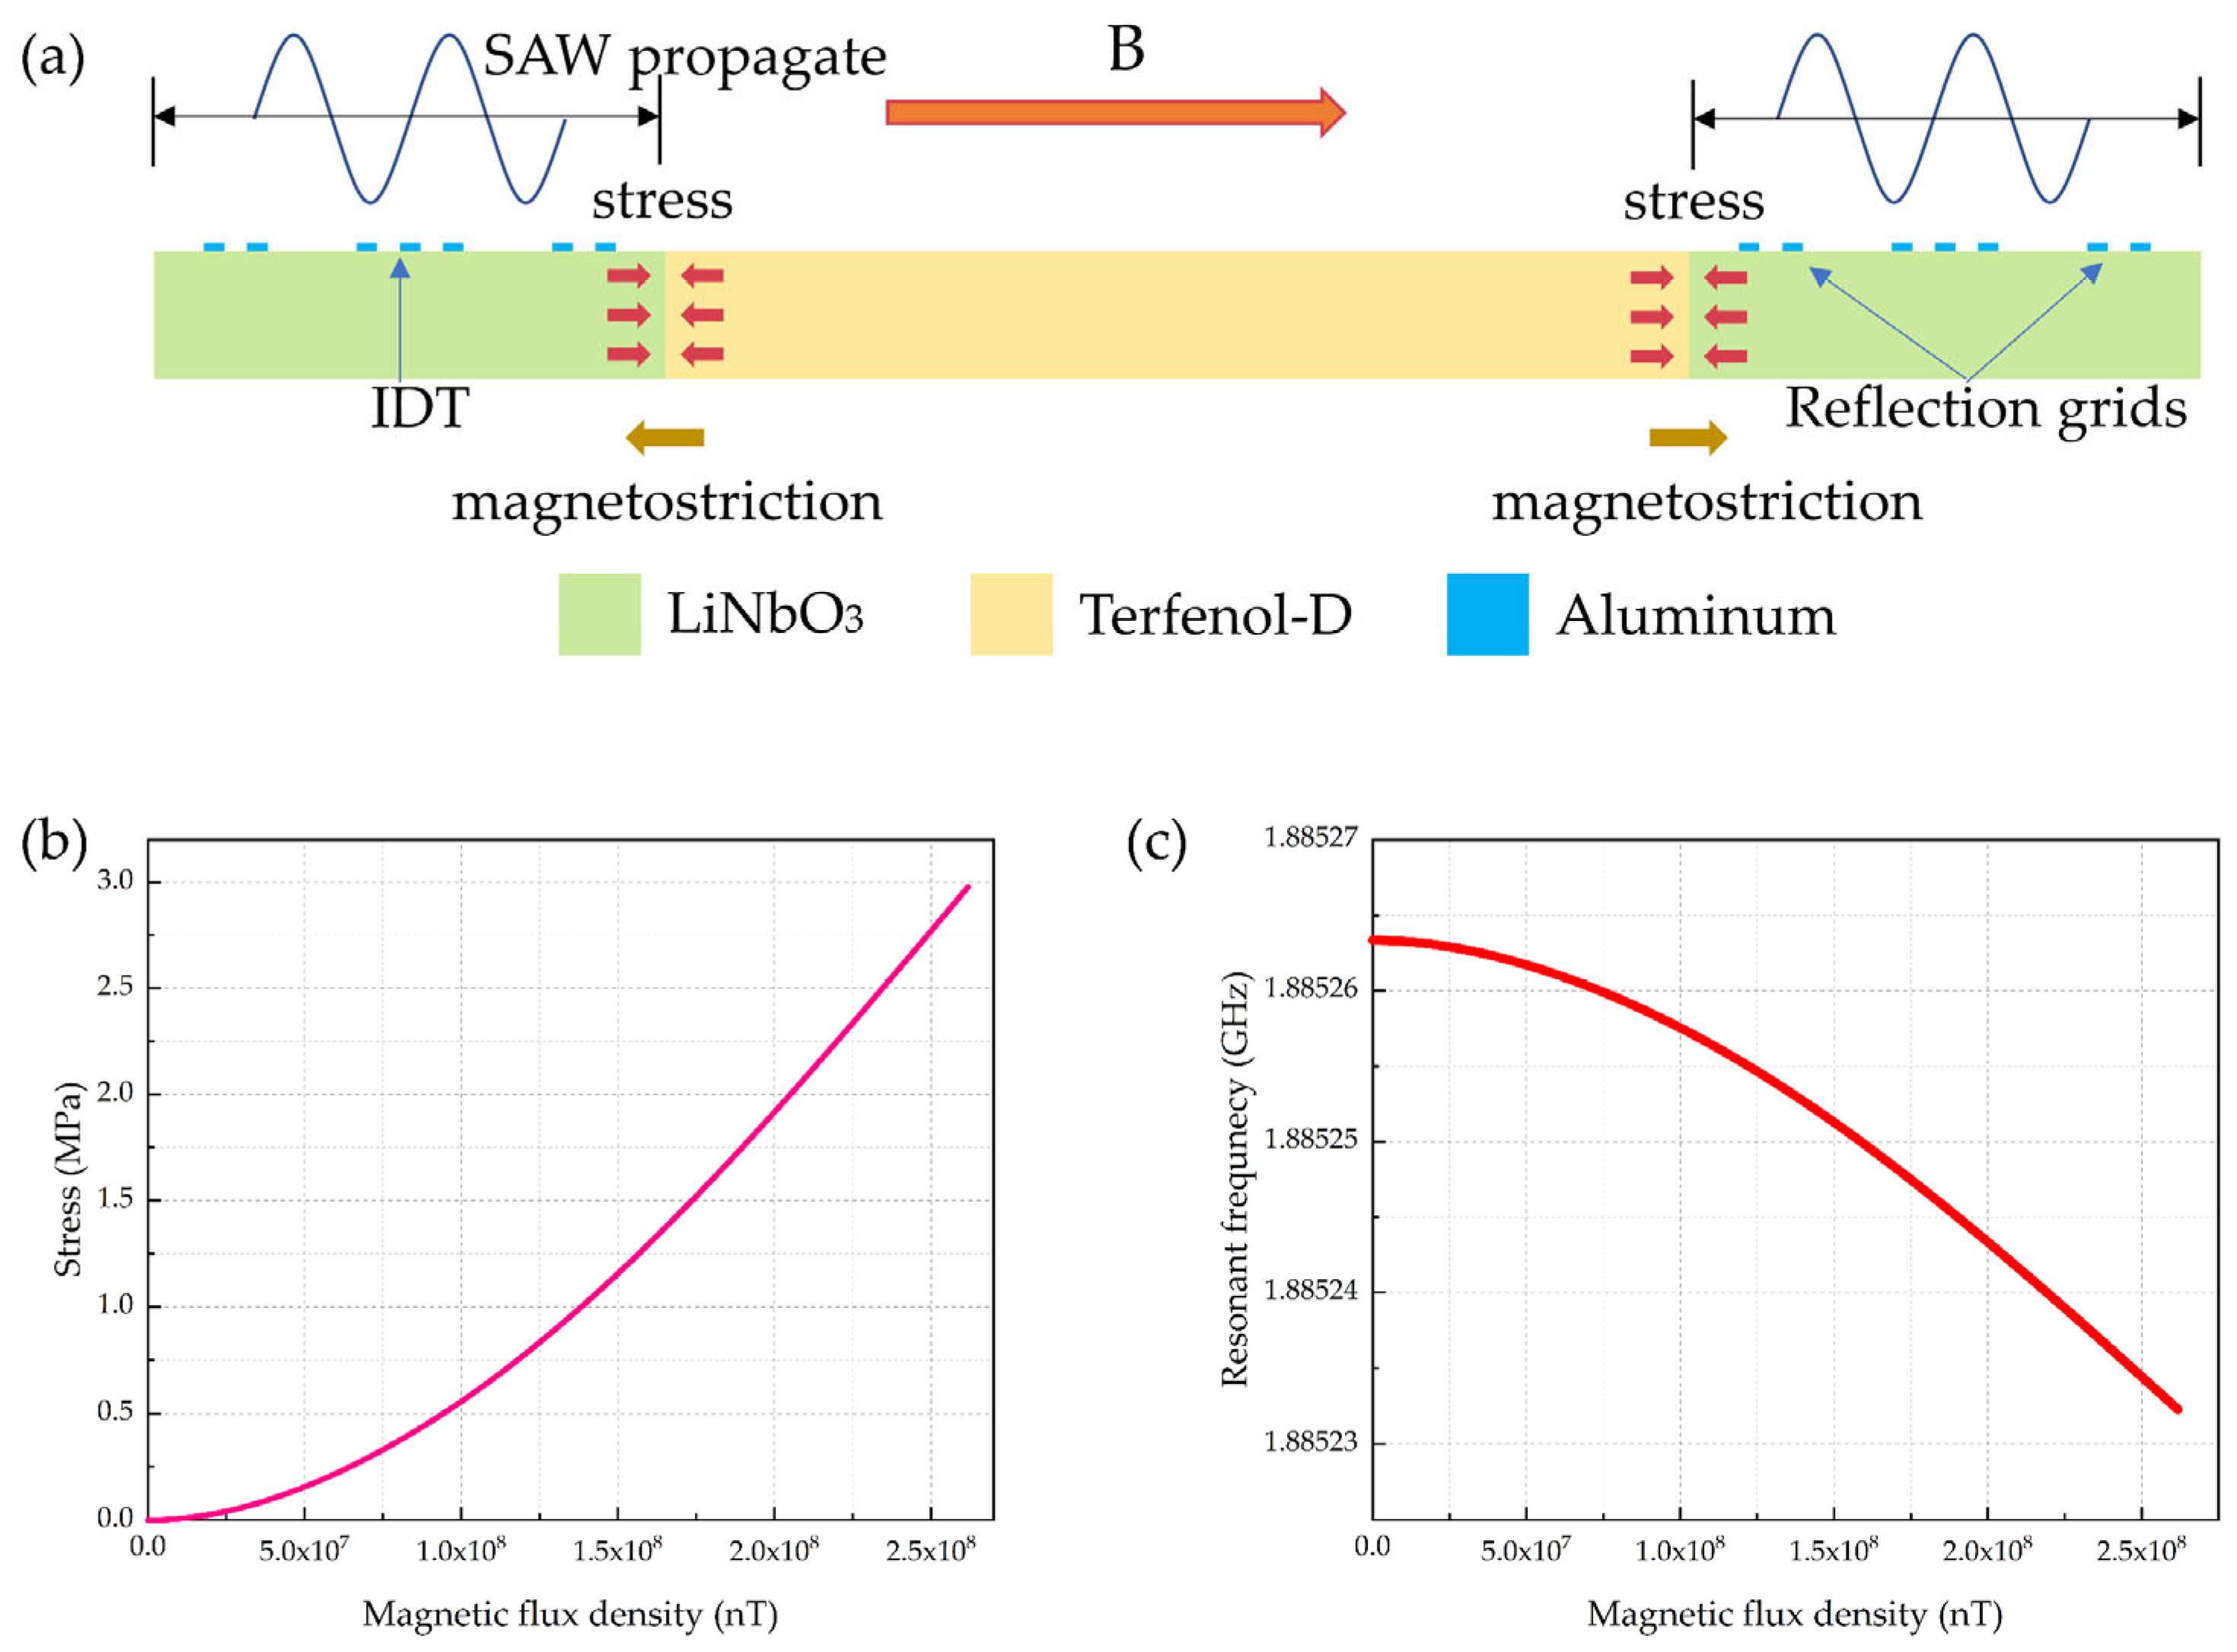
2.3. Magnetostrictive Coupling Modeling
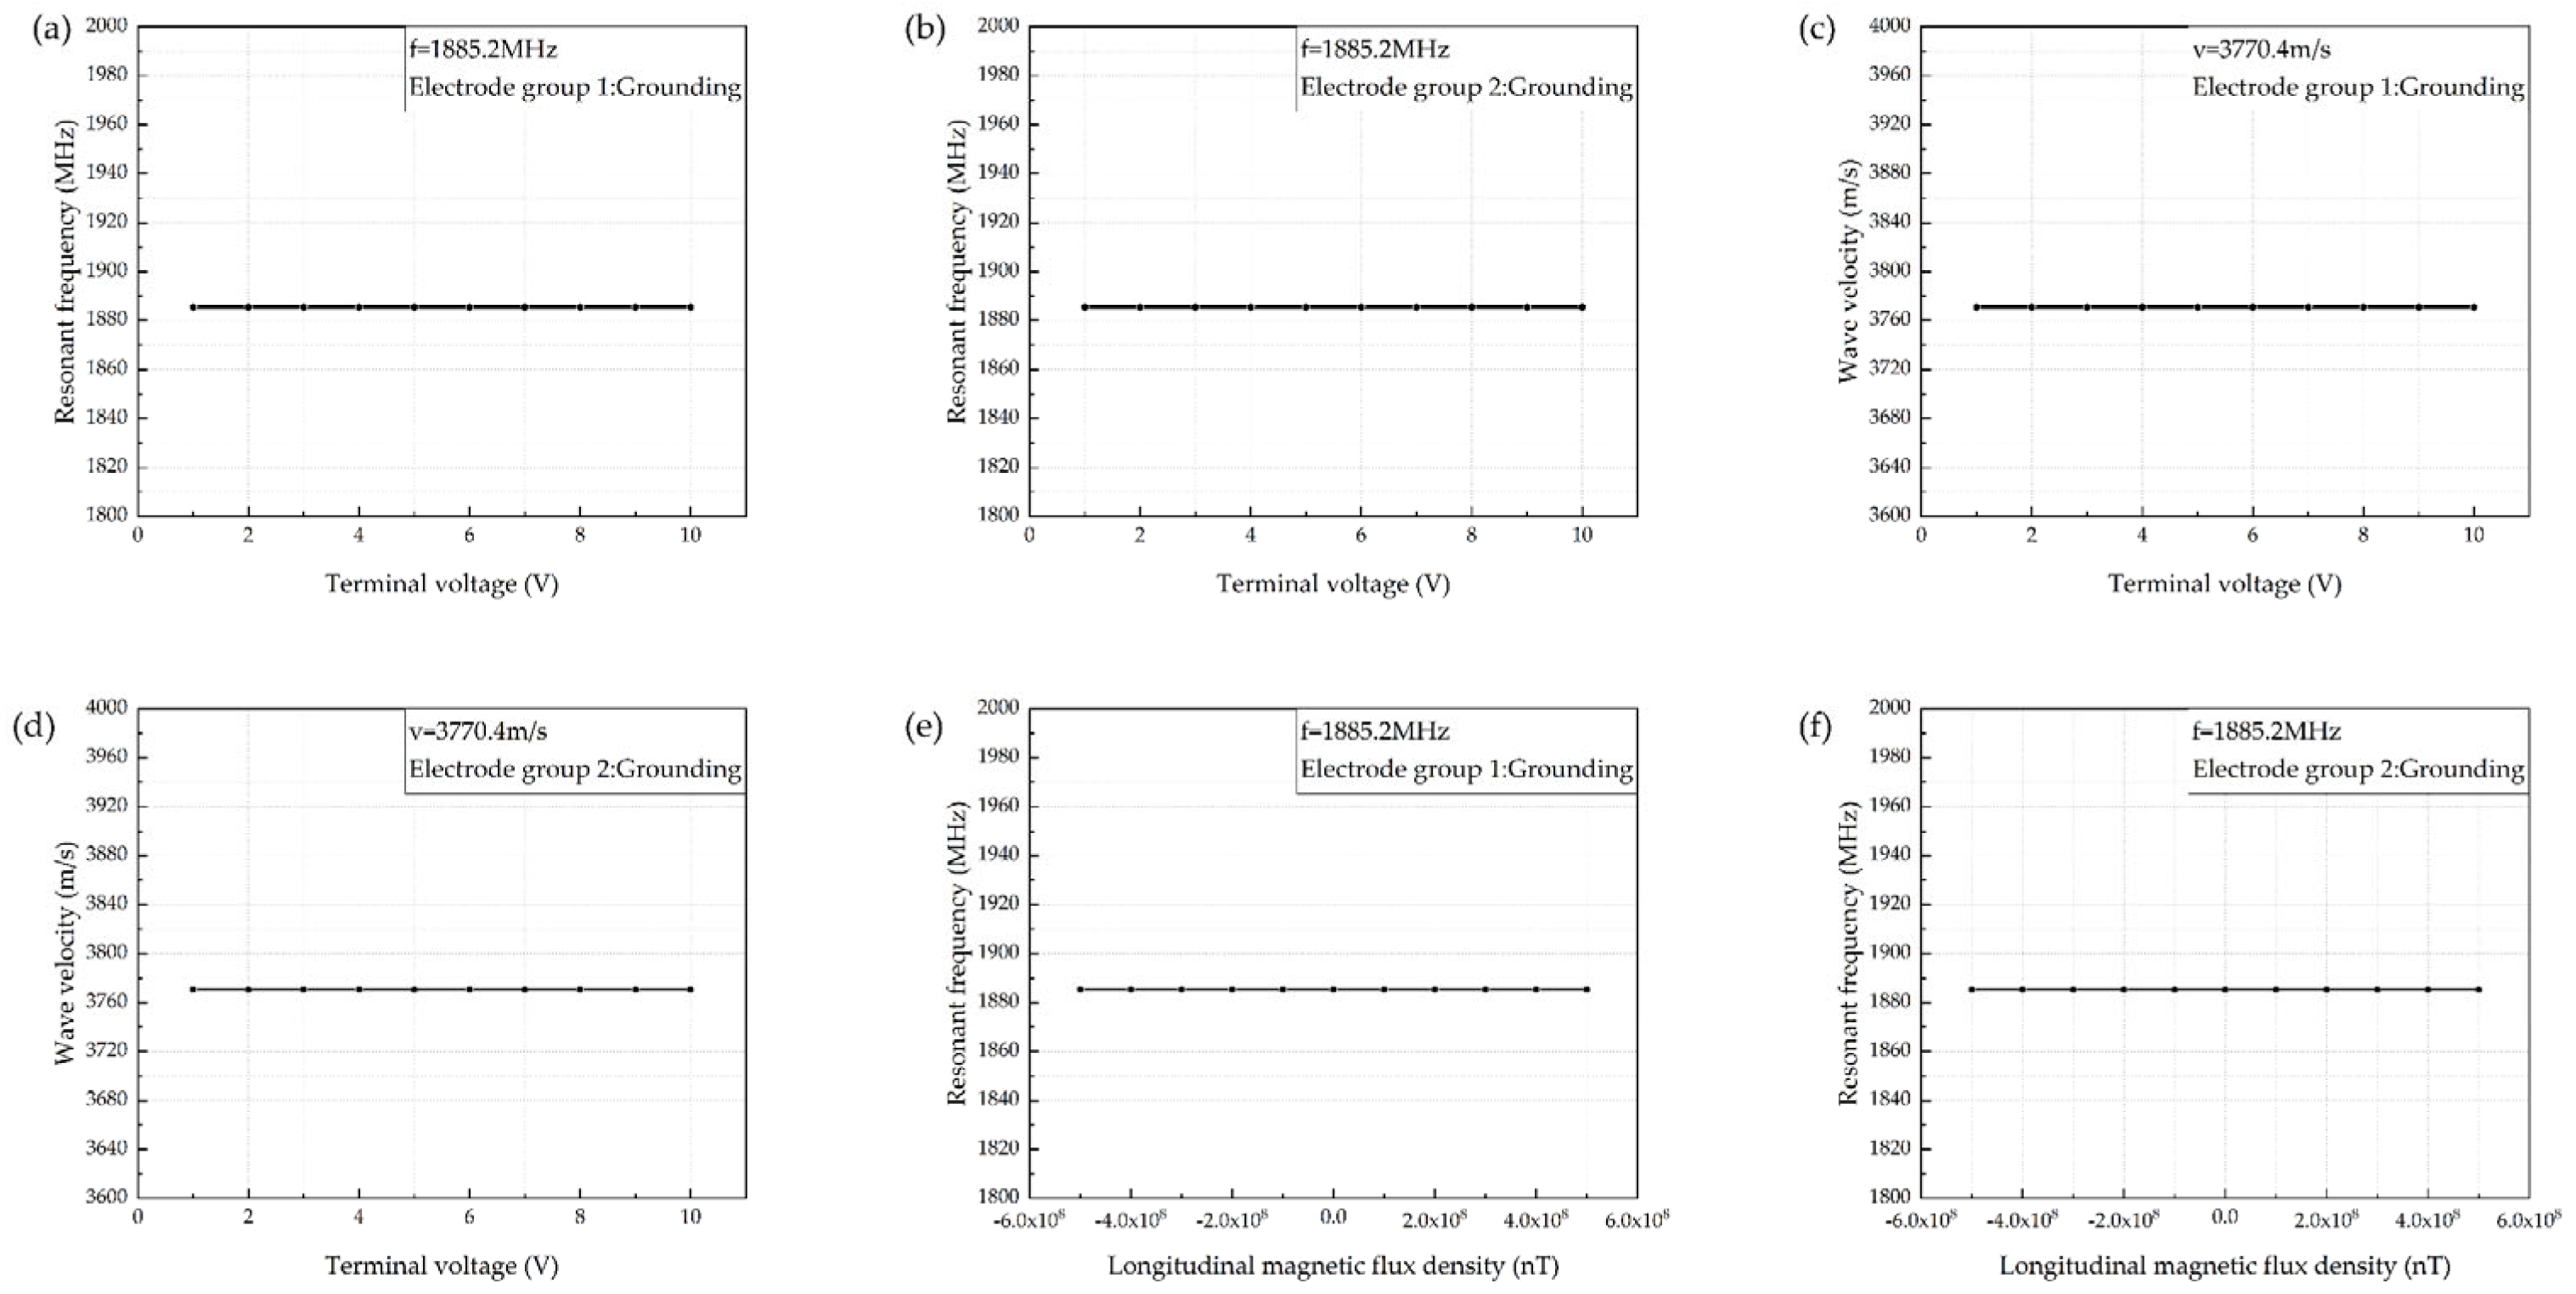
3. Parameter Characteristics of the Sensor
4. Application
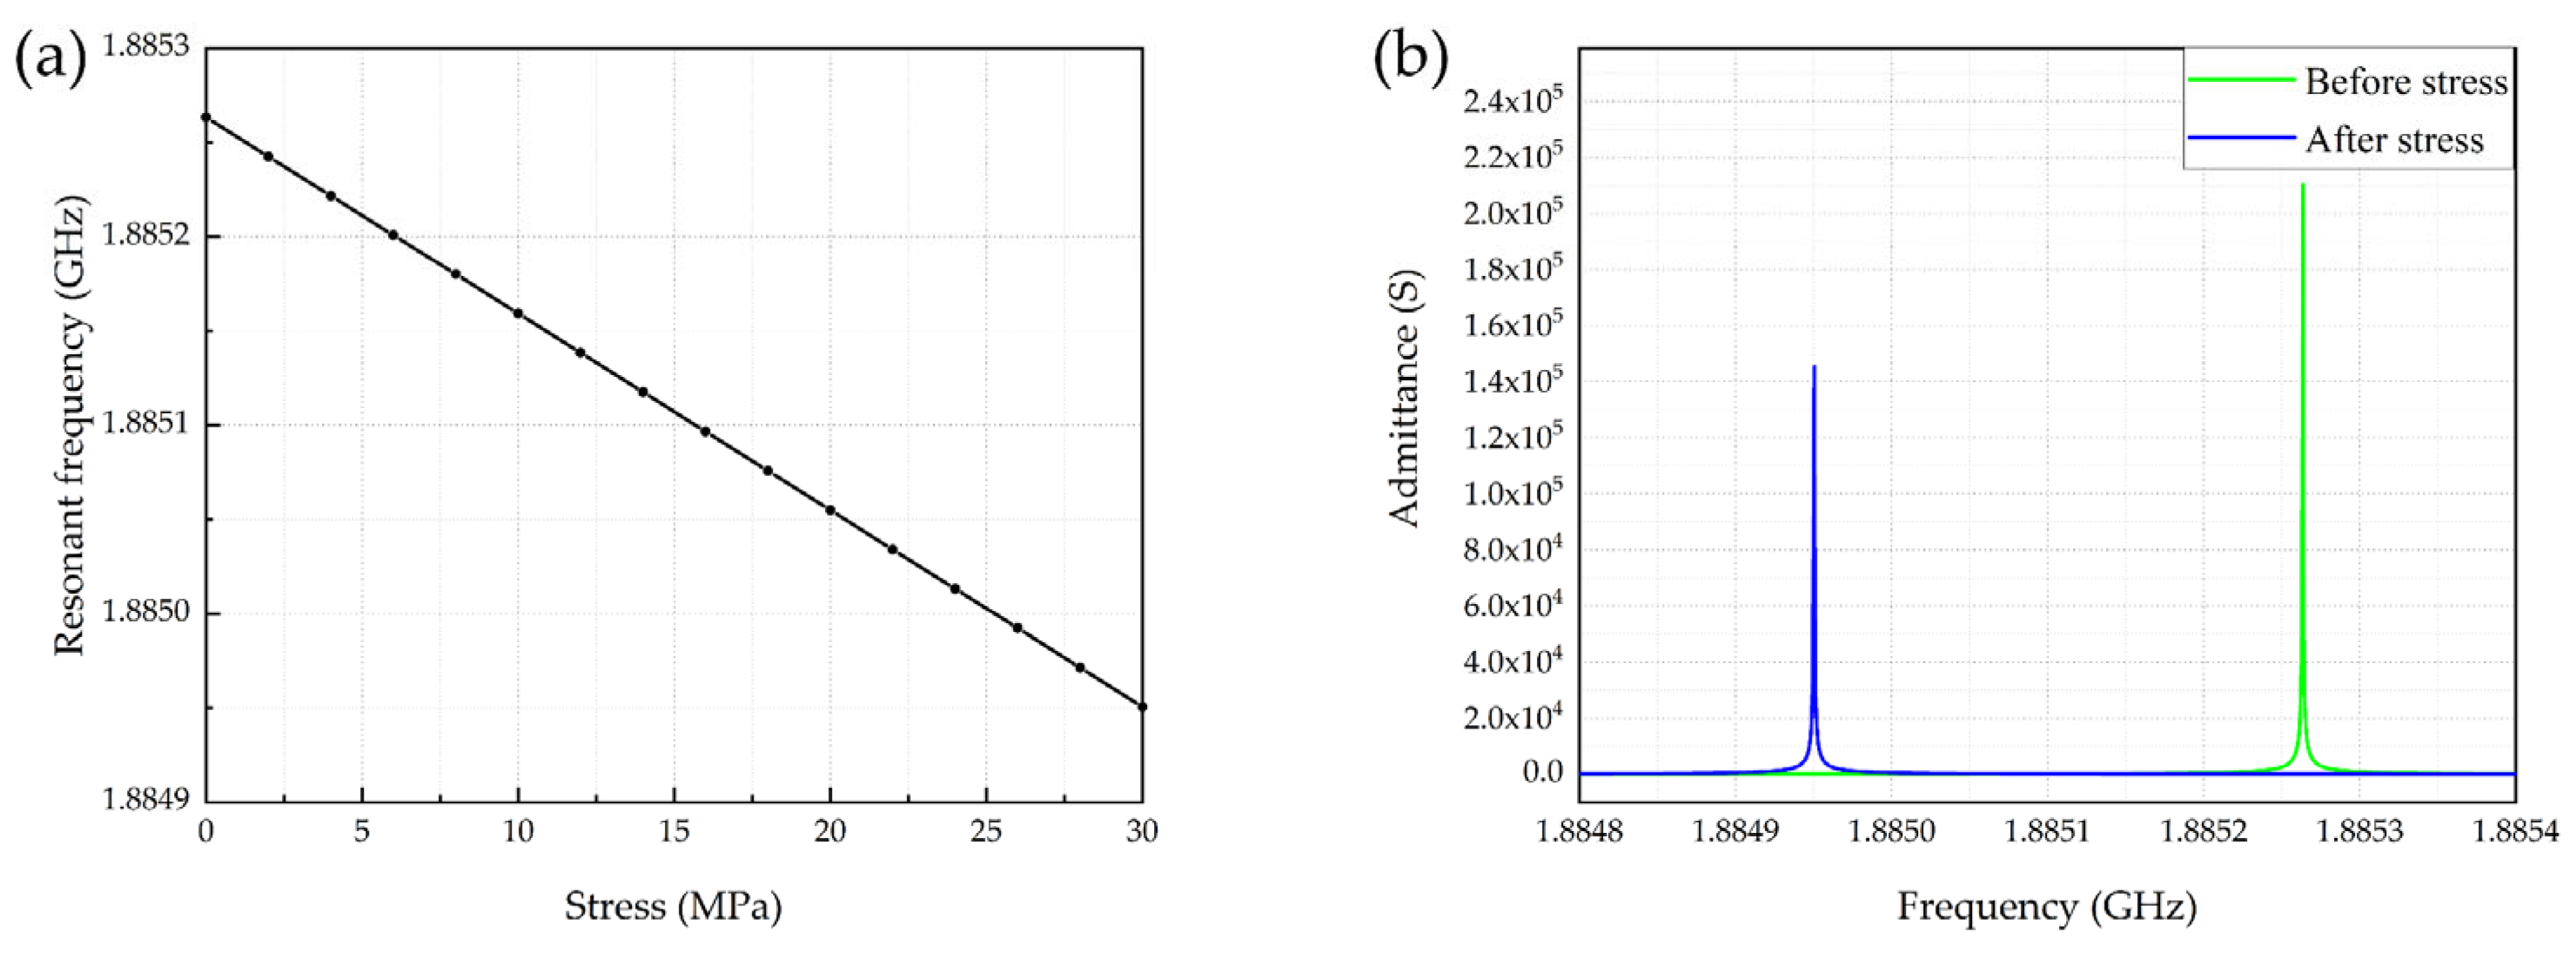
4.1. Pressure
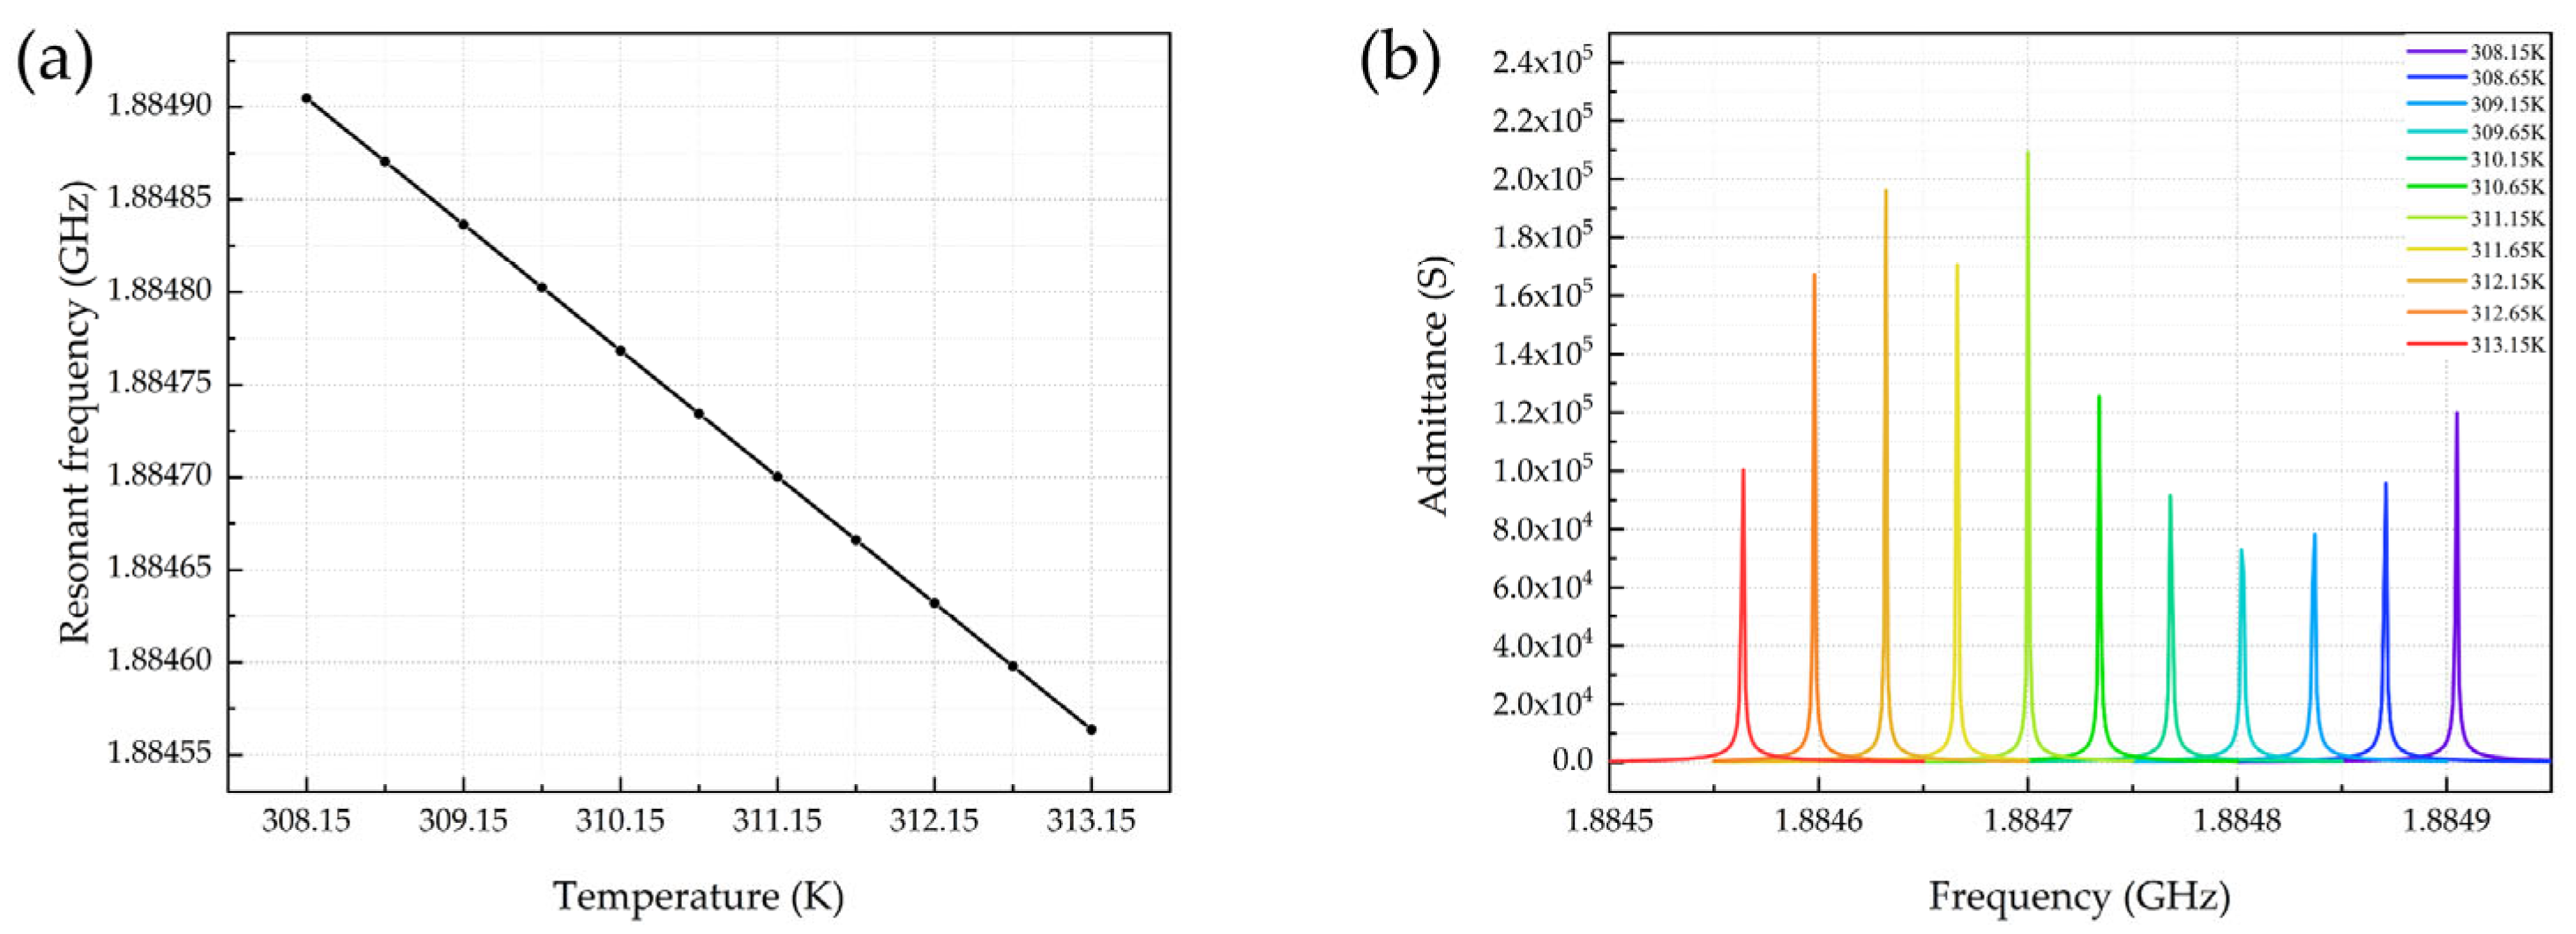
4.2. Temperature
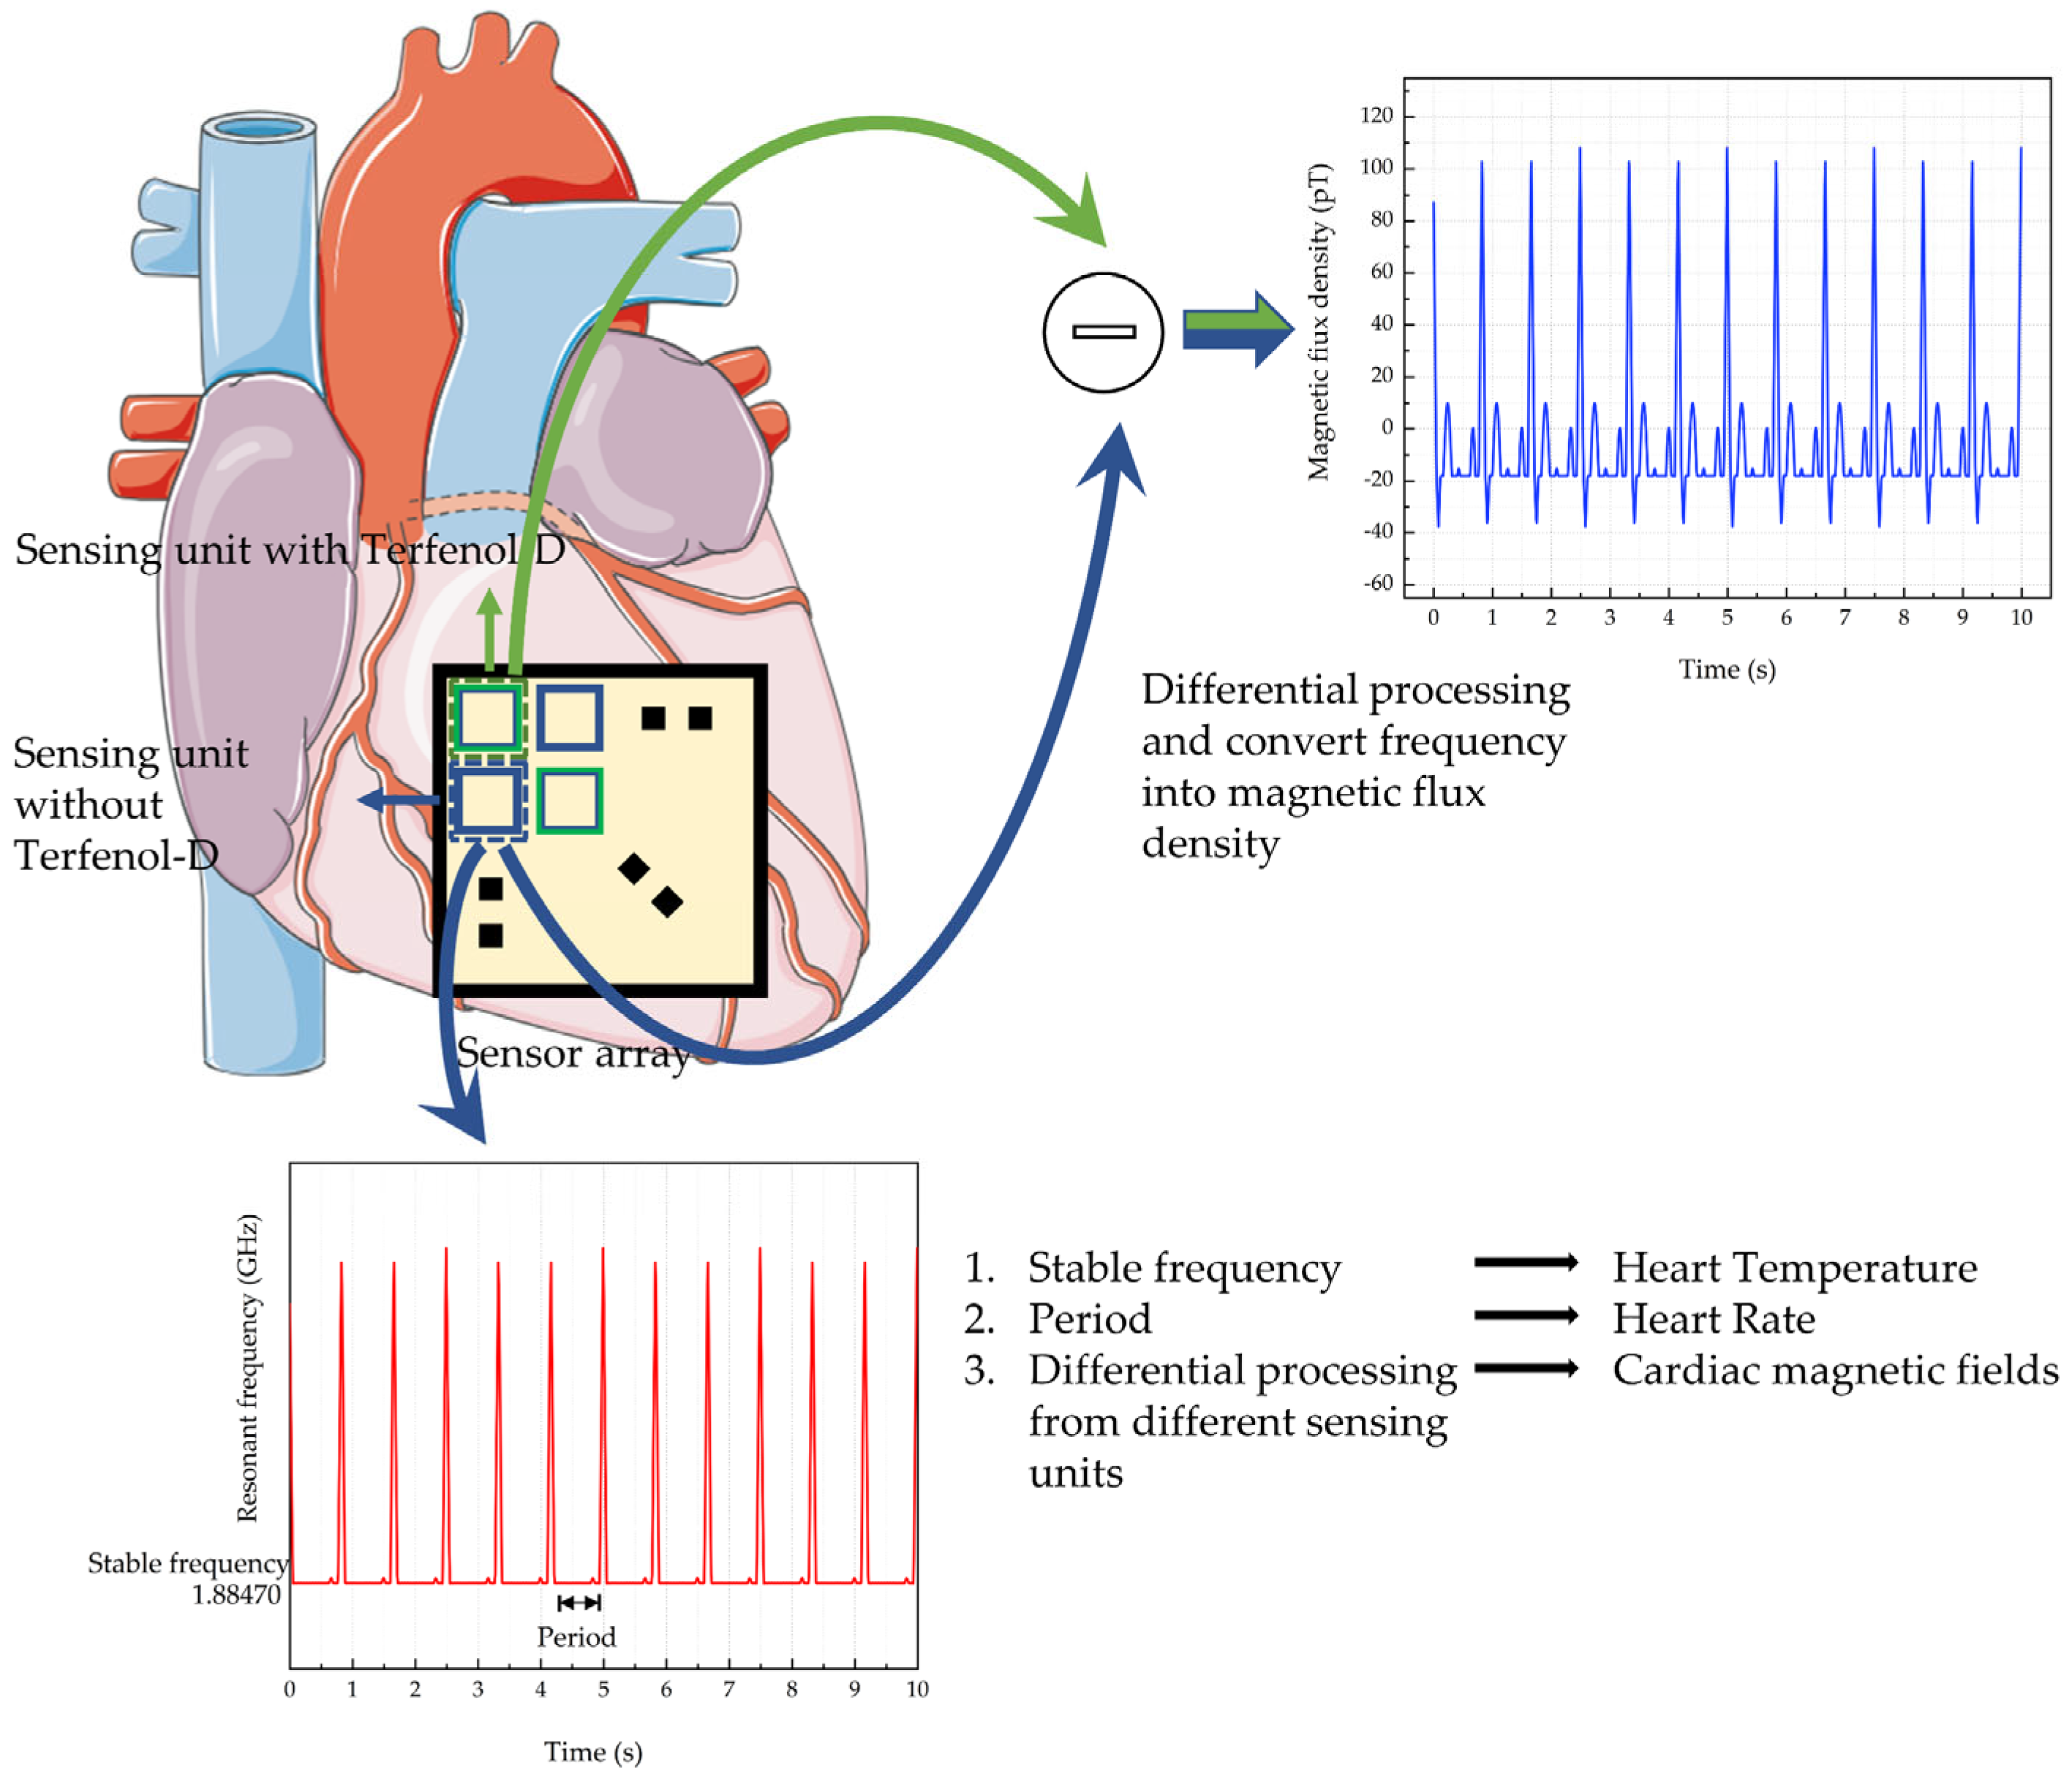
4.3. Cardiac Magnetic Field and MCG
4.4. Multi-Parameter Selective Sensing
5. Conclusions
Author Contributions
Funding
Institutional Review Board Statement
Informed Consent Statement
Data Availability Statement
Acknowledgments
Conflicts of Interest
References
- Huang, F.; Zhang, W.; Li, L.; Sun, Z.; Yang, Y.; Chen, R.; Peng, B.; Zhang, W. MEMS Surface Acoustic Wave Resonator Based on AlN/Si/Fe–Co–Si–B Structure for Magnetic Field Sensing. IEEE Sens. J. 2022, 22, 22510–22518. [Google Scholar] [CrossRef]
- Mandal, D.; Banerjee, S. Surface Acoustic Wave (SAW) Sensors: Physics, Materials, and Applications. Sensors 2022, 22, 820. [Google Scholar] [CrossRef] [PubMed]
- Ahmed, M.J.; Afridi, U.; Shah, H.A.; Khan, H.; Bhatt, M.W.; Alwabli, A.; Ullah, I. CardioGuard: AI-driven ECG authentication hybrid neural network for predictive health monitoring in telehealth systems. SLAS Technol. 2024, 29, 100193. [Google Scholar] [CrossRef] [PubMed]
- Khan, H.; Jan, Z.; Ullah, I.; Alwabli, A.; Alharbi, F.; Habib, S.; Islam, M.; Shin, B.-J.; Lee, M.Y.; Koo, J. A deep dive into AI integration and advanced nanobiosensor technologies for enhanced bacterial infection monitoring. Nanotechnol. Rev. 2024, 13, 20240056. [Google Scholar] [CrossRef]
- Bilal, H.; Tian, Y.; Ali, A.; Muhammad, Y.; Yahya, A.; Izneid, B.A.; Ullah, I. An Intelligent Approach for Early and Accurate Predication of Cardiac Disease Using Hybrid Artificial Intelligence Techniques. Bioengineering 2024, 11, 1290. [Google Scholar] [CrossRef]
- Domae, K.; Miyagawa, S.; Toda, K.; Sawa, Y. New treatment strategy for severe heart failure: Combination of ventricular assist device and regenerative therapy. J. Artif. Organs 2021, 24, 1–5. [Google Scholar] [CrossRef]
- Shlykov, V.; Kotovskyi, V.; Višniakov, N.; Šešok, A. The Modeling of the Temperature Changes and Distribution in the Myocardium. J. Mech. Med. Biol. 2020, 20, 1950061. [Google Scholar] [CrossRef]
- Engrand, C.; Laux, D.; Ferrandis, J.Y.; Demaria, R.; Le Clezio, E. Velocimetric ultrasound thermometry applied to myocardium protection monitoring. Ultrasonics 2018, 87, 1–6. [Google Scholar] [CrossRef]
- Sun, J.H.; Lin, C.C. Wireless Saw-Based Tags with Temperature Sensors that Utilize High-Resolution Delay-Time Measurements. J. Mech. 2016, 32, 435–440. [Google Scholar] [CrossRef]
- Butkow, K.-J.; Dang, T.; Ferlini, A.; Ma, D.; Liu, Y.; Mascolo, C. An evaluation of heart rate monitoring with in-ear microphones under motion. Pervasive Mob. Comput. 2024, 100, 101913. [Google Scholar] [CrossRef]
- Han, Z. Using Adaptive Wireless Transmission of Wearable Sensor Device for Target Heart Rate Monitoring of Sports Information. IEEE Sens. J. 2021, 21, 25027–25034. [Google Scholar] [CrossRef]
- Yang, Z.; Mitsui, K.; Wang, J.; Saito, T.; Shibata, S.; Mori, H.; Ueda, G. Non-Contact Heart-Rate Measurement Method Using Both Transmitted Wave Extraction and Wavelet Transform. Sensors 2021, 21, 2735. [Google Scholar] [CrossRef] [PubMed]
- Stephenson, A.C.; Willis, R.; Alford, C. Using in-seat electrical potential sensors for non-contact monitoring of heart rate, heart rate variability, and heart rate recovery. Int. J. Psychophysiol 2021, 169, 1–10. [Google Scholar] [CrossRef] [PubMed]
- Hadouch, Y.; Mezzane, D.; Amjoud, M.b.; Laguta, V.; Hoummada, K.; Dolocan, V.O.; Jouiad, M.; Lahcini, M.; Uršič, H.; Fišinger, V.; et al. Multiferroic CoFe2O4–Ba0.95Ca0.05Ti0.89Sn0.11O3 Core–Shell Nanofibers for Magnetic Field Sensor Applications. ACS Appl. Nano Mater. 2023, 6, 10236–10245. [Google Scholar] [CrossRef]
- Jiao, C.; Wang, C.; Wang, M.; Pan, J.; Gao, C.; Wang, Q. Finite Element Analysis Model of Electronic Skin Based on Surface Acoustic Wave Sensor. Nanomaterials 2023, 13, 465. [Google Scholar] [CrossRef]
- Yu, S.; Wen, Y.; Li, P. Micromachined Two-Dimensional Weak Magnetic Field Sensors of Soft Magnetic Film/Planar Coil Laminated. IEEE Sens. J. 2023, 23, 13933–13941. [Google Scholar] [CrossRef]
- Abderrahmane, A.; Koide, S.; Sato, S.I.; Ohshima, T.; Sandhu, A.; Okada, H. Robust Hall Effect Magnetic Field Sensors for Operation at High Temperatures and in Harsh Radiation Environments. IEEE Trans. Magn. 2012, 48, 4421–4423. [Google Scholar] [CrossRef]
- Li, N.; Chen, Y.; Zhang, C.; Nong, J.; Xu, W.; Wang, Z.; Yang, J.; Yu, Y.; Zhang, Z. Characterization of Fiber-Optic Vector Magnetic Field Sensors Based on the Magneto-Strictive Effect. Sensors 2023, 23, 7127. [Google Scholar] [CrossRef]
- Eslamlou, A.D.; Ghaderiaram, A.; Schlangen, E.; Fotouhi, M. A review on non-destructive evaluation of construction materials and structures using magnetic sensors. Constr. Build. Mater. 2023, 397, 132460. [Google Scholar] [CrossRef]
- Xu, S.Y.; Sun, J.W.; Wang, C.T.; Zhong, W.B.; Xing, F.F. Structural optimization of magnetostrictive composite materials in magnetostrictive current sensor. Smart Mater. Struct. 2023, 32, 095035. [Google Scholar] [CrossRef]
- Liu, Z.; Li, H. A high magnetic field sensitivity PCF-SPR sensor working in the near-infrared wavelength band. Microw. Opt. Technol. Lett. 2023, 66, e33820. [Google Scholar] [CrossRef]
- Zhang, Q.; Liu, H.; Fu, R.; Li, B.; Yan, X.; Zhang, X.; Wang, F.; Cheng, T. High Sensitivity Surface Plasmon Resonance Magnetic Field Sensor Based on Au/Gold Nanoparticles/Magnetic Fluid in the Hollow Core Fiber. IEEE Sens. J. 2023, 23, 12899–12905. [Google Scholar] [CrossRef]
- Ning, Y.; Guo, H.; Qin, Y.; Zhang, Y.; Li, S.; Mou, J.; Zhang, M.; Zhang, Y.; Liu, Z.; Zhang, J.; et al. Ultrasensitive Fiber SPR Magnetic Field Sensor Using Au/TiO2 Schottky Junction. IEEE Sens. J. 2023, 23, 13823–13828. [Google Scholar] [CrossRef]
- Song, J.; Sun, S.; Jiang, C.; Chen, H.; Zhu, X.; Ren, J.; Wang, S. A tapered multicore fiber sensor for measuring temperature and magnetic field. Opt. Fiber Technol. 2023, 80, 103384. [Google Scholar] [CrossRef]
- Narasimman, S.; Balakrishnan, L.; Alex, Z.C. Highly sensitive magnetic field sensor based on uniform core fiber using Mn doped ZnO nanorods as cladding. Mater. Sci. Semicond. Process. 2023, 166, 107732. [Google Scholar] [CrossRef]
- Wei, L.; Li, H.; Hu, T.; Fu, R.; Zhao, Y.; Cheng, T.; Yan, X. Magnetic Field and Temperature Two-Parameter Sensor Based on Mach–Zehnder Interferometer and Faraday Rotation Effect. IEEE Sens. J. 2023, 23, 14041–14048. [Google Scholar] [CrossRef]
- Pannetier-Lecoeur, M.; Parkkonen, L.; Sergeeva-Chollet, N.; Polovy, H.; Fermon, C.; Fowley, C. Magnetocardiography with sensors based on giant magnetoresistance. Appl. Phys. Lett. 2011, 98, 3. [Google Scholar] [CrossRef]
- Sun, X.; Wu, J.; Liang, X.; Du, Y.; Xu, Y.; Qu, Y.; Guan, M.; Huang, H.; Li, F.; Liu, S.; et al. Effects of Amplitude and Frequency of the Modulation Field on the Sensitivity for Low-Frequency Magnetic Field in Magnetoelectric Sensors. IEEE Sens. J. 2023, 23, 12695–12701. [Google Scholar] [CrossRef]
- Zhang, J.; Gao, K.; Wang, K.; Shi, J.; Ge, D.; Zhang, L. One-dimensional photonic crystal magnetic sensor design based on Bloch surface waves with high sensitivity and high figure of merit (FOM). J. Magn. Magn. Mater. 2023, 582, 170983. [Google Scholar] [CrossRef]
- Wiesenfeld, K.; Moss, F. Stochastic Resonance and the Benefits of Noise—From Ice Ages to Crayfish and Squids. Nature 1995, 373, 33–36. [Google Scholar] [CrossRef]
- Budker, D.; Romalis, M. Optical magnetometry. Nat. Phys. 2007, 3, 227–234. [Google Scholar] [CrossRef]
- Andó, B.; Ascia, A.; Baglio, S.; Bulsara, A.R.; In, V.; Pitrone, N.; Trigona, C. Residence Times Difference fluxgate magnetometer for magnetic biosensing. In Proceedings of the Conference on Biomagnetism and Magnetic Biosystems Based on Molecular Recognition Processes, Sant Feliu de Guixols, Spain, 22–27 September 2007; p. 139. [Google Scholar]
- Huo, Y.; Sofronici, S.; Wang, X.; D’Agati, M.J.; Finkel, P.; Bussmann, K.; Mion, T.; Staruch, M.; Jones, N.J.; Wheeler, B.; et al. Low Noise, Strain Modulated, Multiferroic Magnetic Field Sensor Systems. IEEE Sens. J. 2023, 23, 14025–14040. [Google Scholar] [CrossRef]
- Petrenko, M.V.; Pazgalev, A.S.; Vershovskii, A.K. All-Optical Nonzero-Field Vector Magnetic Sensor for Magnetoencephalography. Phys. Rev. Appl. 2023, 20, 024001. [Google Scholar] [CrossRef]
- Engmann, S.; Bittle, E.G.; Gundlach, D.J. Magnetic field sensor based on OLED/organic photodetector stack. ACS Appl. Electron. Mater. 2023, 5, 4595–4604. [Google Scholar] [CrossRef]
- Zuo, S.M.; Schmalz, J.; Özden, M.; Gerken, M.; Su, J.X.; Niekiel, F.; Lofink, F.; Nazarpour, K.; Heidari, H. Ultrasensitive Magnetoelectric Sensing System for Pico-Tesla MagnetoMyoGraphy. IEEE Trans. Biomed. Circuits Syst. 2020, 14, 971–984. [Google Scholar] [CrossRef] [PubMed]
- Kyoon Lim, H.; Kim, K.; Lee, Y.H.; Chung, N. Detection of non-ST-elevation myocardial infarction using magnetocardiogram: New information from spatiotemporal electrical activation map. Ann. Med. 2009, 41, 533–546. [Google Scholar] [CrossRef]
- Liu, X.; Ou-Yang, J.; Tong, B.; Chen, S.; Zhang, Y.; Zhu, B.; Yang, X. Influence of the delta-E effect on a surface acoustic wave resonator. Appl. Phys. Lett. 2019, 114, 062903. [Google Scholar] [CrossRef]
- Hu, W.; Huang, M.; Xie, H.; Zhang, H.; Bai, F. Self-Biased Magnetic Field Sensors Based on Surface Acoustic Waves through Angle-Dependent Magnetoacoustic Coupling. Phys. Rev. Appl. 2023, 19, 014010. [Google Scholar] [CrossRef]
- Spetzler, B.; Golubeva, E.V.; Friedrich, R.M.; Zabel, S.; Kirchhof, C.; Meyners, D.; McCord, J.; Faupel, F. Magnetoelastic Coupling and Delta-E Effect in Magnetoelectric Torsion Mode Resonators. Sensors 2021, 21, 2022. [Google Scholar] [CrossRef]
- Zernov, V.; Fradkin, L.; Gautesen, A.; Darmon, M.; Calmon, P. Wedge diffraction of a critically incident Gaussian beam. Wave Motion 2013, 50, 708–722. [Google Scholar] [CrossRef]
- Javadi, Y.; Hloch, S. Employing the Waves to Measure Longitudinal Residual Stresses in Different Depths of a Stainless Steel Welded Plate. Adv. Mater. Sci. Eng. 2013, 2013, 746187. [Google Scholar] [CrossRef]
- Fradkin, L.J.; Darmon, M.; Chatillon, S.; Calmon, P. A semi-numerical model for near-critical angle scattering. J. Acoust. Soc. Am. 2016, 139, 141–150. [Google Scholar] [CrossRef]
- Darmon, M.; Ferrand, A.; Dorval, V.; Chatillon, S.; Lonné, S. Recent modelling advances for ultrasonic TOFD inspections. In AIP Conference Proceedings; American Institute of Physics: Boise, ID, USA, 2015; Volume 1650, pp. 1757–1765. [Google Scholar]
- Ma, S.; Wu, H.; Gao, S.; Sun, M.; Song, H.; Wang, Q. Temperature-Independent Sensor of the Magnetic Field Based on FBG and Terfenol-D. Nanomaterials 2023, 13, 2109. [Google Scholar] [CrossRef] [PubMed]
- Fu, Y.Q.; Luo, J.K.; Nguyen, N.T.; Walton, A.J.; Flewitt, A.J.; Zu, X.T.; Li, Y.; McHale, G.; Matthews, A.; Iborra, E.; et al. Advances in piezoelectric thin films for acoustic biosensors, acoustofluidics and lab-on-chip applications. Prog. Mater. Sci. 2017, 89, 31–91. [Google Scholar] [CrossRef]
- Vaish, R. Piezoelectric and Pyroelectric Materials Selection. Int. J. Appl. Ceram. Technol. 2013, 10, 682–689. [Google Scholar] [CrossRef]
- Regehr, K.J.; Domenech, M.; Koepsel, J.T.; Carver, K.C.; Ellison-Zelski, S.J.; Murphy, W.L.; Schuler, L.A.; Alarid, E.T.; Beebe, D.J. Biological implications of polydimethylsiloxane-based microfluidic cell culture. Lab Chip 2009, 9, 2132–2139. [Google Scholar] [CrossRef] [PubMed]
- Ariati, R.; Sales, F.; Souza, A.; Lima, R.A.; Ribeiro, J. Polydimethylsiloxane Composites Characterization and Its Applications: A Review. Polymers 2021, 13, 4258. [Google Scholar] [CrossRef]
- Yadhuraj, S.R.; Babu Gandla, S.; Sudarshan, B.G.; Prasanna Kumar, S.C. Preparation and Study of PDMS Material. Mater. Today Proc. 2018, 5, 21406–21412. [Google Scholar] [CrossRef]
- Miranda, I.; Souza, A.; Sousa, P.; Ribeiro, J.; Castanheira, E.M.S.; Lima, R.; Minas, G. Properties and Applications of PDMS for Biomedical Engineering: A Review. J. Funct. Biomater. 2021, 13, 2. [Google Scholar] [CrossRef]
- Li, S.P.; Zhang, J.Q.; He, J.; Liu, W.P.; Wang, Y.H.; Huang, Z.J.; Pang, H.; Chen, Y.W. Functional PDMS Elastomers: Bulk Composites, Surface Engineering, and Precision Fabrication. Adv. Sci. 2023, 10, 39. [Google Scholar] [CrossRef]
- Zhu, D.; Shao, L.B.; Yu, M.J.; Cheng, R.; Desiatov, B.; Xin, C.J.; Hu, Y.W.; Holzgrafe, J.; Ghosh, S.; Shams-Ansari, A.; et al. Integrated photonics on thin-film lithium niobate. Adv. Opt. Photonics 2021, 13, 242–352. [Google Scholar] [CrossRef]
- Courjal, N.; Guichardaz, B.; Ulliac, G.; Rauch, J.Y.; Sadani, B.; Lu, H.H.; Bernal, M.P. High aspect ratio lithium niobate ridge waveguides fabricated by optical grade dicing. J. Phys. D-Appl. Phys. 2011, 44, 7. [Google Scholar] [CrossRef]
- Lin, J.T.; Zhou, J.X.; Wu, R.B.; Wang, M.; Fang, Z.W.; Chu, W.; Zhang, J.H.; Qiao, L.L.; Cheng, Y. High-Precision Propagation-Loss Measurement of Single-Mode Optical Waveguides on Lithium Niobate on Insulator. Micromachines 2019, 10, 8. [Google Scholar] [CrossRef]
- Yu, M.J.; Desiatov, B.; Okawachi, Y.; Gaeta, A.L.; Loncar, M. Coherent two-octave-spanning supercontinuum generation in lithium-niobate waveguides. Opt. Lett. 2019, 44, 1222–1225. [Google Scholar] [CrossRef] [PubMed]
- Grilli, S.; Vespini, V.; Ferraro, P. Surface-Charge Lithography for Direct PDMS Micro-Patterning. Langmuir 2008, 24, 13262–13265. [Google Scholar] [CrossRef]
- Du, X.Y.; Swanwick, M.E.; Fu, Y.Q.; Luo, J.K.; Flewitt, A.J.; Lee, D.S.; Maeng, S.; Milne, W.I. Surface acoustic wave induced streaming and pumping in 128° Y-cut LiNbO3for microfluidic applications. J. Micromechanics Microengineering 2009, 19, 035016. [Google Scholar] [CrossRef]
- Zhang, H.; Chen, P.; Yang, L.; Wang, H.; Zhu, Z. Fabrication of Surface Acoustic Wave Biosensors Using Nanomaterials for Biological Monitoring. Nanomanufacturing 2024, 4, 159–172. [Google Scholar] [CrossRef]
- Chikazumi, S.; Graham, J.C.D. Physics of Ferromagnetism; Oxford University Press: Oxford, UK, 1997. [Google Scholar]
- Boute, R. The Functional Nature of Units, With Application to the Decibel in Propagation Calculations. IEEE Antennas Propag. Mag. 2021, 63, 131–139. [Google Scholar] [CrossRef]
- Manenti, R.; Peterer, M.J.; Nersisyan, A.; Magnusson, E.B.; Patterson, A.; Leek, P.J. Surface acoustic wave resonators in the quantum regime. Phys. Rev. B 2016, 93, 4. [Google Scholar] [CrossRef]
- Sekar, B.; Critchley, W.R.; Williams, S.G.; Shaw, S.M. Should we consider heart rate reduction in cardiac transplant recipients? Clin. Cardiol. 2013, 36, 68–73. [Google Scholar] [CrossRef]
- Vanderlaan, R.D.; Caldarone, C.A.; Backx, P.H. Heart failure in congenital heart disease: The role of genes and hemodynamics. Pflug. Arch. 2014, 466, 1025–1035. [Google Scholar] [CrossRef]
- Polderman, K.H.; Varon, J. How low should we go? Hypothermia or strict normothermia after cardiac arrest? Circulation 2015, 131, 669–675. [Google Scholar] [CrossRef]
- Jia, L.; Li, J.; Song, X.; Qi, S.; Suo, Y.; Long, T.; Dai, Y.; Ning, X. Analysis and suppression of magnetic field interference for SERF atomic magnetometer. Measurement 2024, 227, 114266. [Google Scholar] [CrossRef]
- Zheng, W.; Su, S.; Zhang, G.; Bi, X.; Lin, Q. Vector magnetocardiography measurement with a compact elliptically polarized laser-pumped magnetometer. Biomed. Opt. Express 2020, 11, 649–659. [Google Scholar] [CrossRef] [PubMed]
- Shirai, Y.; Hirao, K.; Shibuya, T.; Okawa, S.; Hasegawa, Y.; Adachi, Y.; Sekihara, K.; Kawabata, S. Magnetocardiography Using a Magnetoresistive Sensor Array. Int. Heart J. 2019, 60, 50–54. [Google Scholar] [CrossRef] [PubMed]
- Yang, Y.; Xu, M.; Liang, A.; Yin, Y.; Ma, X.; Gao, Y.; Ning, X. A new wearable multichannel magnetocardiogram system with a SERF atomic magnetometer array. Sci. Rep. 2021, 11, 5564. [Google Scholar] [CrossRef]
- International Commission on Non-Ionizing Radiation Protection. Guidelines on Limits of Exposure to Static Magnetic Fields. Health Phys. 2009, 96, 504–514. [Google Scholar] [CrossRef]
- Moody, G.A.; Mark, R.G. The impact of the MIT-BIH arrhythmia database. IEEE Eng. Med. Biol. Mag. 2001, 20, 45–50. [Google Scholar] [CrossRef]
- Raviprakash, K. ECG Simulation Using MATLAB. Available online: https://ww2.mathworks.cn/matlabcentral/fileexchange/10858-ecg-simulation-using-matlab (accessed on 22 January 2024).
- Betts, J.G.; Young, K.A.; Wise, J.A.; Johnson, E.; Poe, B.; Kruse, D.H.; Korol, O.; Johnson, J.E.; Womble, M.; DeSaix, P. Anatomy and Physiology; OpenStax: Houston, TX, USA, 2013. [Google Scholar]


| Materials | ZnO | AlN | ST-Cut Quartz | 128° Y-X LiNbO3 | 36° Y-X LiTaO3 |
|---|---|---|---|---|---|
| Moulus (GPa) | 110–140 | 300–350 | 71.7 | 130–170 | 205 |
| Poisson’s ratio | 0.36 | 0.22–0.29 | 0.17–0.2 | 0.24–0.28 | 0.17–0.2 |
| Piezo-constant d33 (pC/N) | 12 | 4.5, 6.4 | 2.3 (d11) | 12 | 12 |
| Effective coupling coefficient, k2 (%) | 1.5–1.7 | 3.1–8 | 0.1–0.2 | 5–11.3 | 5–6.6 |
| Acoustic velocity of longitudinal (transverse) waves (m/s) | 6336 (2720) | 10,150–11,050 (5800) | 5000–5960 (3159) | 3680–3980 | 4160–4220 |
| Parameter | Size (μm) |
|---|---|
| λ | 2 |
| a | 0.5 |
| b | 0.5 |
| P | 1 |
| D | 2 |
| 0.2 | |
| 7 |
| Material | 128° Y-X LiNbO3 |
|---|---|
| 4700 | |
| Material | Al |
|---|---|
| 2700 | |
| Young’s modulus, E [Pa] | |
| Poisson’s ratio, μ | 0.33 |
| Boundary | Mechanical Condition | Electrical Condition |
|---|---|---|
| Free | Zero-charged | |
| Fixed | Grounded |
| Electrode Group | Al (IDT) |
|---|---|
| Odd | +1 V |
| Even | Ground |
| Material | Terfenol-D |
|---|---|
| 9250 | |
| [ppm] | 2000 |
| Poisson’s ratio, μ | 0.45 |
| Electric conductivity, σ [S/m] | |
| Young’s modulus, E [Pa] |
Disclaimer/Publisher’s Note: The statements, opinions and data contained in all publications are solely those of the individual author(s) and contributor(s) and not of MDPI and/or the editor(s). MDPI and/or the editor(s) disclaim responsibility for any injury to people or property resulting from any ideas, methods, instructions or products referred to in the content. |
© 2025 by the authors. Licensee MDPI, Basel, Switzerland. This article is an open access article distributed under the terms and conditions of the Creative Commons Attribution (CC BY) license (https://creativecommons.org/licenses/by/4.0/).
Share and Cite
Zhao, H.; Jiao, C.; Wang, Q.; Gao, C.; Sun, J. Surface Acoustic Wave Sensor for Selective Multi-Parameter Measurements in Cardiac Magnetic Field Detection. Appl. Sci. 2025, 15, 3583. https://doi.org/10.3390/app15073583
Zhao H, Jiao C, Wang Q, Gao C, Sun J. Surface Acoustic Wave Sensor for Selective Multi-Parameter Measurements in Cardiac Magnetic Field Detection. Applied Sciences. 2025; 15(7):3583. https://doi.org/10.3390/app15073583
Chicago/Turabian StyleZhao, Hongbo, Chunxiao Jiao, Qi Wang, Chao Gao, and Jing Sun. 2025. "Surface Acoustic Wave Sensor for Selective Multi-Parameter Measurements in Cardiac Magnetic Field Detection" Applied Sciences 15, no. 7: 3583. https://doi.org/10.3390/app15073583
APA StyleZhao, H., Jiao, C., Wang, Q., Gao, C., & Sun, J. (2025). Surface Acoustic Wave Sensor for Selective Multi-Parameter Measurements in Cardiac Magnetic Field Detection. Applied Sciences, 15(7), 3583. https://doi.org/10.3390/app15073583