Abstract
Java Island, located in Indonesia, is the country’s main island, with a population of 150 million, more than half the population of the country. There are at least four big cities located on the island that have seen fast development in the last 30 years. The land subsidence (LS) issue caused by groundwater overexploitation, compaction, and geological setting, has been known on the island for more than 20 years. However, past studies have mostly focused on one particular important area, while the big picture of LS on the whole island is often overlooked. This study utilized Sentinel-1 Synthetic Aperture Radar (SAR) data from 2017 to 2023, analyzed using Small Baseline Subset (SBAS) interferometry, to map LS across Java Island. We used DEMNAS to eliminate the topographic signal. We found ten regions with a noticeable LS rate, affecting nearly 60 million people who reside in the LS zones, namely, Serang, Greater Jakarta, Cianjur, Bandung, Cirebon, Brebes and Tegal, Pekalongan, Greater Semarang, Surabaya, and Sidoardjo. The highest rates and the large coverage of LS were observed in Greater Jakarta (up to 150 mm/year), Bandung (200 mm/year), Semarang (160 mm/year), and Pekalongan (up to 110 mm/year). LS was also detected in smaller areas or districts, such as Serang, Cianjur, Cirebon, Brebes, Tegal, Surabaya, and Sidoarjo, with rates ranging from 60 to 140 mm/year. The two areas of Cianjur and Brebes, which have never been mentioned in previous studies, show LS rates of about 80 mm/year and 70 mm/year, respectively. The LS rate in all areas was shown to be linear over time, except in Pekalongan, which shows rate deflation after 2021. We also found that most affected regions are urban and industrial zones, indicating a strong correlation with anthropogenic activities. LS leads to widespread socioeconomic and environmental impacts, including damage to infrastructure, increased flooding, and reduced groundwater capacity.
1. Introduction
Land subsidence (LS) is defined as the settlement of the ground, which can occur gradually or rapidly, and which usually occurs in an area with unconsolidated alluvial deposits. It is well known to occur in many cities in Indonesia, such as Jakarta [1,2], Bandung [3,4], Semarang [2,5], and Pekalongan [6,7]. Many studies have been conducted using various methods to measure the subsidence rate along with the possible cause in the cities; however, the most prominent cause of LS is the ground being subjected to groundwater overexploitation in an unconsolidated alluvial or basin-fill aquifer [8,9]. In addition, LS has negative environmental and socioeconomic impacts, such as infrastructure damage, worsening flooding, loss of housing, and reduced groundwater capacity.
While LS is ongoing in the aforementioned cities, the fact that groundwater exploitation due to industrial, household, and agricultural needs is not limited to those cities does not rule out the possibility that land subsidence will still occur in other areas. For example, LS also occurs in Cirebon, a city with a population of approximately 350.000 residents on the north coast of West Java Province, with rate of 25 mm/year [10]. Moreover, in addition to groundwater, oil and gas exploitation is also known to cause LS in Indonesia [8], and the distribution of oil and gas fields is spread widely throughout the Indonesian archipelago.
Mapping and monitoring of LS in Indonesia has been performed geodetically using various methods, such as Global Navigation Satellite System (GNSS) observation [10,11], leveling [12], and Interferometric Synthetic Aperture Radar (InSAR) [1,10]. However, most of the studies are focused on one It can be understood that ground surveys have limitations in the survey area, but even InSAR observation cannot be easily performed for a very large area, especially when performing time series analysis.
A large area of LS mapping in Indonesia was performed in Java and Sumatra Island using ALOS PALSAR data from 2006 to 2011, and it revealed two other places in Java Island previously unmentioned, that is, Blanakan and Bungbulang [8], but it did not have updated information for most of the locations. However, the case in Cirebon is not mentioned in the paper. A recent study also focused on the northern coast of Java Island, where many large cities are located [11,13], but the LS remains unknown for the rest of the island. The lack of LS information from other places, the fact that a large number of populations are using groundwater for many activities, and the impact caused by LS are the motivations for this study. On the other hand, although global LS mapping was performed in 2023 [14,15], the discussion was undertaken only for large cities, as mentioned before. This study aims to provide the recent status of LS in Java, but it is not limited only to large cities. Furthermore, in this study, we also try to find new areas of LS because of the rapid development in Java over the last decades.
2. Data and Methodology
2.1. Study Area
Java refers to one of the largest and most populated islands in Indonesia. According to the 2020 census by the Central Agency on Statistics of Indonesia, there are more than 151 million people (about 56% of the total population) living on the island [16]. The island has also become the center of both government and business/industry in the country. Administratively, the island is divided into 6 provinces, namely, Banten, West Java, DKI Jakarta, Central Java, Yogyakarta, and East Java. Furthermore, the administrative region is divided into smaller regions called Kabupaten (regencies) and Kota (cities). There are 119 Kabupaten and Kota in Java Island.
The physiography of Java is mainly divided into five elements, which are the southern mountains, Quarternary volcanoes, Central Depression Zone, anticlinorium zone, and alluvial plains (Figure 1). These elements dissect the island in the north–south direction [17]. The southern part is indicated by the southern mountains. The Central Depression Zone of Java consists of alluvial deposits and Pleistocene sediments [18,19,20], alternating with Quaternary volcanoes, and the middle part of Java consists of the anticlinorium region. The alluvial deposit spreads along the northern part of Java, and the eastern part is dominated by anticlinorium formations. The width of the alluvial deposit in the northern part of Java varies between several km and 40 km, with a thickness of about 300 m [21]. A detailed geological map shows that alluvial deposits are found in several places, such as in the Bandung area.
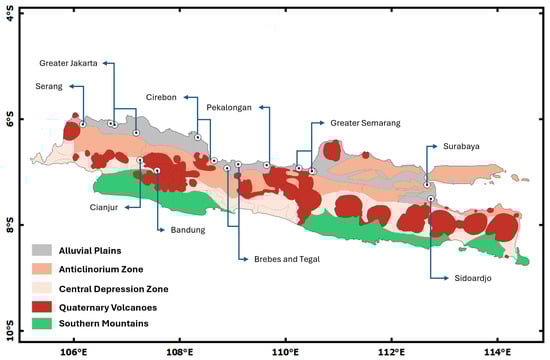
Figure 1.
The physiography of Java (from [17]).
Hydrologically, the state of the groundwater in the lowlands in Java, such as along the northern coast of Java, is closely related to the overall stratification and silty sediment properties [21]. The annual precipitation of Java Island ranges from approximately 800 mm to 3200 mm, with a mean of 1800 mm [16]. In the northern part of Java, groundwater flow systems are driven by gravity, which is impelled by the flow from the higher elevation zone in the center arc of Java (e.g., anticlinorium and Quaternary volcano zones).
2.2. Data Coverage and Processing
The data used in this study are Sentinel-1 data spanning from 2017 to 2022. Java Island is traversed by five descending Sentinel-1 tracks. However, the last track, which covers the east end of the island, has been excluded because the number of available images is only 54 images, which is relatively low compared to more than 150 images retrieved from other tracks. In total, we used 650 tracks to produce deformation maps in this study.
To generate subsidence maps in Java Island from SAR data, small-baseline criteria have been used to form interferograms and estimate the cumulative subsidence relative to a primary date [22]. The LS rate is then calculated using a linear model from the estimated cumulative subsidence.
Interferogram pairs are constructed using the Delaunay Triangulation Network to reduce the number of interferograms used in time-series inversion while still preserving the design matrix rank. The temporal and perpendicular baselines thresholds are still applied to ensure that only small-baseline interferograms are generated; in this case, the thresholds are 180 days and 200 m, respectively. It should be noted that the perpendicular baseline of Sentinel-1 interferograms become longer after 2022 due to the tubing effect [23]. In total, 1818 interferograms have been generated using this method. This is much lower compared to more than 10,000 interferograms generated using only temporal and perpendicular baseline thresholds (less than 185 days and 200 m, respectively, in this case).
Digital Elevation Model Nasional (DEMNAS) or Indonesia’s Digital Elevation Model (DEM) with a spatial resolution of 0.27 arcsecond (8 m) of spatial resolution and an average accuracy of 5 m [24,25] has been utilized to model topographic effects. To unwrap the interferograms, Minimum Cost Flow has been used followed by an iterative model based on [26]. To reduce tropospheric effects, the Generic Atmospheric Correction Online Service (GACOS) model has been applied to all generated interferograms [27,28]. The reference points for each track are placed in alignment with non-deformed GNSS Continuous Operating Reference Stations (CORSs) on Java Island managed by Badan Informasi Geospasial (BIG; Indonesian Geospatial Information Agency). The corresponding CORSs are the BAKO, CSUM, CPBL, and CMAG stations for track 047, 149, 076, and 003, respectively (see Figure 2).
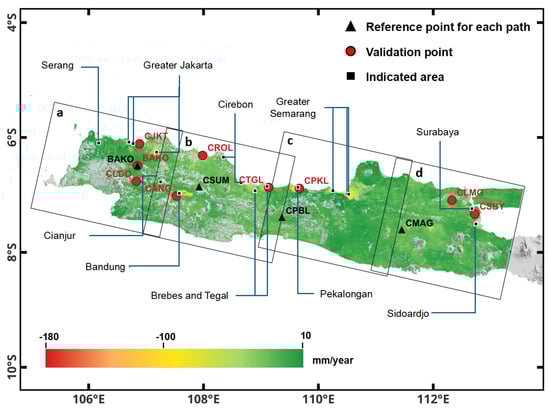
Figure 2.
Rate of LS in Java. This map shows the annual subsidence rates measured in mm/year. The red dots indicate the CORS position used for validation; the black boxes represent the data track of InSAR, with (a) track 047, (b) track 149, (c) track 076, and (d) track 003; the black triangles show the reference points that are used for each track.
Interferogram Corrections
The first step of data filtering on the interferogram is to ensure that only qualified coherence pixels are used for further processing. Only pixels with a coherence higher than 0.3 are used for LS rate estimation. Generally, low coherence is caused by heavy vegetation and watered land such as ponds, rice fields, and lakes. Fish farming, which is usually located in coastal areas, causes a large part of the regions to have low coherence. Dense forests that are usually located in the volcanic or mountainous areas also have severely low coherence.
All coherence interferogram pixels contain several phase contributions [29] and can be written as the following phase combination:
where is the interferogram phase, is the atmospheric phase contribution, is the phase contribution from orbital error, is the phase contribution from DEM error, and is other uncorrelated noise phase contribution. Here, all phase contributions, except deformation, are considered as errors.
Orbital error, , due to the inaccuracy of satellite position data may lead to a parallel fringe on the interferogram, called “orbit phase ramp”. One of the efficient methods to reduce the effect of orbital error is to fit and model the orbit phase ramp using an n-order polynomial [30,31]. The polynomial can also model the phase contribution from ionospheric error since both patterns are similar [32]. The orbital error can also be reduced by using the satellite precise orbit, which is applied in this study. Close inspection of most generated interferograms does not show any significant orbital phase ramp. It is found that corrections using polynomial fitting led to overfitting. Moreover, we select the descending route that observes the area of study early in the day in local time, resulting in ionospheric contribution, which is also considered small.
The phase contribution due to the inaccuracy of the Elevation Model, can be expressed as the following equation [33]:
where is the phase error due to the DEM error between two SAR acquisitions at time and , is the radar wavelength, is the perpendicular baseline between the two acquisitions, r is the slant range (distance between the satellite and the target), is the look angle, and is the DEM error.
It is clear that the DEM error can be considered as a function of the perpendicular baseline. As mentioned, in this study, the perpendicular baseline length has been limited to 180 m to minimize the error contribution. Further correction has been performed by estimating the contribution of the DEM error phase using the baseline history, following [33].
For tropospheric phase contribution correction, Generic Atmospheric Correction Online Service for InSAR [27,28] has been used. It provides atmospheric delay correction maps using high-resolution numerical weather model data from the European Centre for Medium-Range Weather Forecasts (ECMWF). These maps are spatially interpolated to the Synthetic Aperture Radar (SAR) image resolution and provide corrections for large-scale atmospheric effects, particularly long-wavelength delays correlated with topography. The Generic Atmospheric Correction Online Service for InSAR (GACOS) corrections have been applied to the unwrapped phase of each interferogram and reduce the height-dependent delays and spatially correlated tropospheric delays.
Due to the large decorrelation area caused by heavy vegetation and wet area, the coherence value in several locations are below the determined threshold. In many cases, this situation may lead to an island-like area, which contributes to phase unwrapping error. In this study, the error is corrected by benefiting the SBAS network generated using the TIN method. Each face of the TIN represents a linearly dependent interferogram, for which the vector resultant is zero. The correction in the time-series domain following [34] has also been applied.
The deformation obtained from InSAR processing is typically in the line of sight (LOS). To find the true vertical displacement, the LOS displacement must be decomposed into vertical and horizontal components. There are several ways to accomplish this task, but essentially, multiple observations from different look angles are required [35]. However, since the focus is exclusively on the vertical displacement, and the horizontal displacement can be discarded, the conversion of LOS displacement () into vertical displacement () can be carried out using the following equation: , where is the look angle (e.g., refs. [8,36]).
Once all interferograms have been generated and corrected for topographic, tropospheric, orbital, and phase unwrapping errors, time-series inversion is performed to estimate cumulative subsidence during the acquisition periods [22]. Parameters are estimated using the least squares method for each pixel. Then, a temporal filter is applied using Gaussian Process Regression. The velocity of the subsidence is then estimated using linear models for all good coherence pixels.
The map of LS rate has been generated from the estimated vertical displacement using the least squares method. To estimate the subsidence rate, a linear model has been applied, which assumes that there is no acceleration or deceleration in the vertical displacement across the island. This linear assumption simplifies the analysis by presuming a constant rate of subsidence over time. Although this assumption may not be accurate for every pixel, our detailed inspection of Continuous Operating Reference Stations (CORSs) and findings from previous studies suggested that, in most cases, the LS rate in Java is indeed constant. This consistency in the LS rate across the island supports the validity of the linear model for generating the LS rate map. However, it is important to note that it is not applicable where the subsidence rate is not linear, and this should be considered in further detailed analyses.
The result has also been verified with shallow earthquake data in the same period of the data using the USGS earthquake database. Close inspection has been performed on all interferograms within co-seismic events and has identified the location of the earthquake epicenter. While several LOS displacements due to earthquakes have been detected, none of them coincide with the LS area.
During the SAR observation period, one notable earthquake occurred in Cianjur on 21 November 2022, with a magnitude of 5.6. The source was located at 6.836° S 106.997° E at a focal depth of approximately 10 km. The close inspection of several interferograms in this location found that a deformation pattern related to this earthquake was clearly detected. However, the distance from the LS area to the epicenter is about 30 km, making the seismic deformation related to this particular earthquake negligible at the LS location.
3. Results
The results indicate that several areas experience deformation, as shown in Figure 2. The green area shows relatively no changes in the LOS, while the yellowish to red areas show the elongation of the LOS during the data acquisition period, which is assumed to be highly correlated with LS. It has been identified that 10 locations experience LS. From the west to east part of the Java, based on the administrative region, the areas that have a significant signature of LS are (a) Serang*, (b) Greater Jakarta (including West Jakarta, North Jakarta, East Jakarta, South Jakarta, Centra Jakarta, Tangerang City, and Bekasi), (c) Cianjur*, (d) Bandung*, (e) Cirebon, (f) Brebes and Tegal, (g) Pekalongan, (h) Greater Semarang (including Kendal, Semarang and Demak), (i) Surabaya, and (j) Sidoardjo. Meanwhile, subtle signatures of LS were found in Subang and Pamanukan, Indramayu, and Nganjuk. Several new locations that experience LS have been found in this study, in addition to the regions reported in the previous study [8,37]. The regions indicated with an asterisk are not on the northern coast of Java, while almost no LS is detected in the southern part of Java.
3.1. Spatial Distribution and Land Subsidence Rate
LS, particularly in coastal regions, has a significant effect on infrastructure, water resources, and ecosystems. This phenomenon, especially along the northern coast of Java, has garnered increasing attention from researchers due to its implications for urban planning and environmental management. Several studies have highlighted the severity of LS in various regions. For example, ref. [11] conducted extensive research to identify 10 specific areas that are vulnerable to subsidence using the GNSS method. This study emphasizes the necessity of monitoring and mitigation strategies in these locations to prevent further degradation of the land and potential hazards to communities. Furthermore, ref. [13] contributed to the discourse by presenting the areas with the highest rate of LS using InSAR. Their findings serve as a crucial reference point for understanding the dynamics and scale of the issue, particularly in northern Java.
Recent data shown in Figure 2 provide a visual representation of subsidence rates across Java, measured in millimeters per year. The color coding represents the severity of the LS area, with green to red indicating the lowest to critical LS. This mapping is vital for prioritizing interventions and allocating resources to the affected communities. Monitoring these regions is essential to assess ongoing risks and develop effective response strategies. This research has also identified previously unrecognized areas that are experiencing LS, including Serang, Cianjur, Brebes, and Tegal. This finding emphasizes the evolving nature of LS and underscores the importance of continuous research to identify its emerging trends and areas of concern. The findings in each city are discussed in the next individual subchapters.
3.1.1. Serang
Serang refers to two different administrative areas, namely Serang City and Serang Regency. Geographically, Serang City is situated at 6.1104° S, 106.1630° E and Serang Regency at 6.1470° S, 106.1516° E, with populations of 700.000 and 1.6 million, respectively. Serang City is the capital of Banten Province, bordering with Serang Regency in the southern part and the Java Sea on the northern side [16]. Residential and business areas are concentrated in Serang City, while Serang Regency is predominantly agricultural. Geologically, Serang City is situated on loose volcanic products composed of andesite basalt from ancient volcanoes, which is a common feature of Banten Province; in contrast, the northern part lies within the alluvial plains [18].
Several areas with apparent LS have been detected in Serang, as shown in Figure 3a. The regions with significant LS rates in the Serang area are marked by black rectangles (Figure 3(a.1, a.2)). The area with the highest rate of LS is located in Serang City (see Figure 3(a.1)), where it can reach up to 60 mm/year. A satellite image of the area reveals that it lies in a residential zone (Figure 3(c.1)). The cause of LS in this location has not been studied (Figure 3(b.1)); however, it is suspected to be caused by excessive use of groundwater for residential purposes.
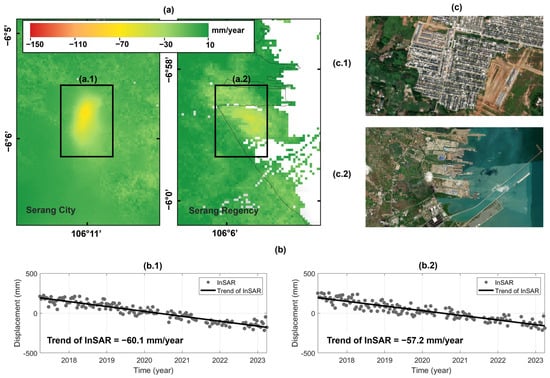
Figure 3.
LS in Serang City and Serang Regency: (a) Map of LS rate in mm/year; (b) Time series of LS retrieved from InSAR (2017–2023) in: (b.1) Serang City and (b.2) Serang Regency; and (c) land use of the region highlighted in black box areas, (a.1) which correspond to residential housing in Serang City (c.1) and (a.2) which correspond to industrial complexes in Serang Regency (c.2). Optical satellite imagery in this study is sourced from Google Earth.
Based on the time series from 2017 to 2023, the areas of LS in Serang Regency are sporadic (Figure 3(a.2)), with an LS rate of 60 mm/year (Figure 3(b.2)). The LS area is located within industrial facilities (Figure 3(c.2)), which were established recently in 2012. Future development in this area could exacerbate LS, as the population growth drives increasing demand for housing and freshwater resources.
The following are several examples of residential areas affected by LS based on field surveys. Figure 4a shows the densely populated environment in Serang City. Further studies are required to identify the underlying causes of LS in this area, enabling the development of effective measures to address this issue.
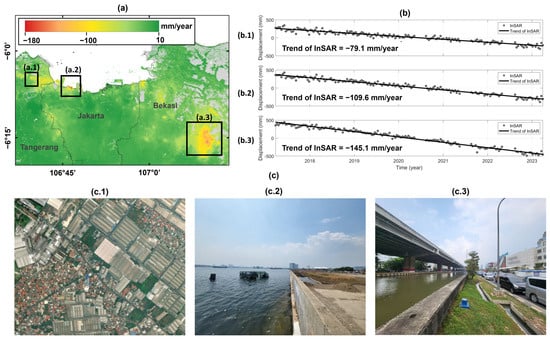
Figure 4.
LS in Greater Jakarta: (a) LS rate in mm/year in Greater Jakarta; (b) LS time series retrieved from InSAR from 2017 to 2023 in: Tangerang (b.1), Jakarta (b.2), and Bekasi (b.3); and (c) land use or situation of the region highlighted in black boxes areas, (a.1) which correspond to industrial complexes in Tangerang (c.1), (a.2) shoreline in North Jakarta with buildings submerged in seawater (c.2), and (a.3) infrastructure in Bekasi where water levels exceed the surrounding ground (c.3), respectively.
3.1.2. Greater Jakarta
LS in Greater Jakarta (approximately at 6.2088° S, 106.8456° E), which includes Tangerang, Jakarta, and Bekasi, has become a pressing issue due to its relatively high rate compared to other regions in Indonesia, which is up to 150 mm/year, as shown in Figure 4a. The highest LS rates in each region are highlighted in Figure 4a, including Tangerang (Figure 4(a.1)), Jakarta (Figure 4(a.2)), and Bekasi (Figure 4(a.3)), with these areas being in the alluvial plain. The time series of vertical displacement are also presented in Figure 4b, while Figure 4c shows land use and examples of field conditions. Based on Figure 4(b.1–b.3), the InSAR data series from 2017–2023 show that the LS rates in Tangerang, Jakarta, and Bekasi are up to 80 mm/year, 110 mm/year, and 150 mm/year, respectively. Figure 4(c.1–c.3) indicate that subsidence in Tangerang occurs in industrial areas, buildings in Jakarta have already sunk, and the ground level in Bekasi is now lower than the surrounding water level.
Several studies have examined the relationship between LS and urban development in Jakarta [1]. Other studies also highlight a high correlation between LS and flood occurrences in Jakarta and its surrounding areas, such as Tanggerang and Bekasi [38,39]. Continuous monitoring and further research are essential to identify the underlying causes of this phenomenon and to develop effective mitigation strategies [1]. Addressing LS in Greater Jakarta is critical to ensure sustainable urban development and protect the livelihoods of its residents.
3.1.3. Cianjur
Cianjur Residence (6.7961° S, 107.1411° E) is located in West Java Province, north of the Bandung area, with a population of 175.000 (according to 2020 cencus) spread across an area of over 3600 km2. It is considered to have a relatively low population density [16]. Cianjur is morphologically varied. In the southern part, it is dominated by southern mountains, domes, and ridges [17], while in the northern part it is dominated by a Quartenary volcanic region, characterized by alluvial plains and undulating hills [18]. Most of these areas are dedicated to agriculture, while only a small portion is allocated for industrial use.
LS in Cianjur has not been mentioned in any published study. However, this study has found that the LS in this region is relatively high, with an LS rate up to 80 mm/year (Figure 5a), which occurs in an industrial area (Figure 5(b.1)). Interestingly, the LS area covers a relatively small area with an almost perfectly elongated oval shape (Figure 5b), indicating that the source may originate from a few adjacent sources. The dimension of the LS area is approximately 1.5 × 0.85 km, with an industrial facility located adjacent to it.
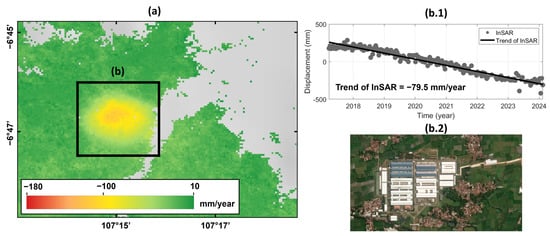
Figure 5.
LS in Cianjur: (a) LS rate in mm/year in the Cianjur area; (b.1) LS time series retrieved from InSAR from 2017 to 2023; and (b.2) land use over the highlighted black box area (b).
3.1.4. Bandung Basin
LS in the Bandung area (6.9175° S, 107.6191° E) is also referred as LS in the Bandung Basin, which administratively consists of four areas, which are Bandung City, Bandung Regency, West Bandung Regency, and Cimahi Regency. These areas are geologically dominated by an alluvial plain. The study of LS in Bandung has been performed intensively since almost three decades ago. The LS in Bandung is triggered by a combination of both natural and anthropogenic factors. However, it is dominantly caused by groundwater exploitation and natural compaction [4]. The impact of LS in Bandung has also been mapped [3]. Recently, the impact of LS on infrastructure has drawn the government’s attention due to the construction of critical infrastructure in Bandung, such as Kereta Cepat Indonesia–China (KCIC; Indonesia–China High-Speed Train).
The result shows that the LS rate in Bandung has not been slowed, which in some cases may reach up to 200 mm/year (see Figure 6a). The LS area is spread, particularly in the southern part of Bandung City and in several industrial areas. All of the LS areas are located within a thick layer of alluvial sediment [18]. Figure 6b emphasizes the locations with the highest rate of LS, Figure 6(b.1) indicates the LS time series, and Figure 6(b.2) indicates the field condition of LS in the region highlighted by the black box (b).
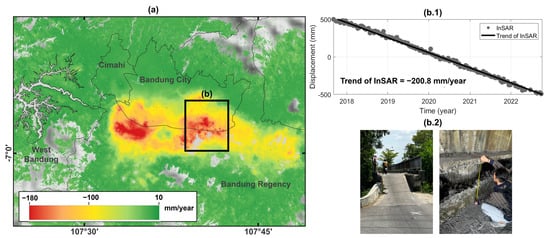
Figure 6.
LS in Bandung: (a) LS rate in mm/year in the Bandung area; (b.1) LS time series retrieved from InSAR from 2017 to 2023; and (b.2) the field condition of LS in the region highlighted by the black box (b).
It is worth noting that the highest rate of LS occurs in residential areas rather than in industrial areas. A field survey revealed that residents in this location extract groundwater for daily use. According to the local residents, the average depth of wells in this area is about 60–80 m deep. With a population density exceeding 15,000 people per km2 in this area, a significant amount of water is required to meet the daily need [40].
3.1.5. Cirebon
Cirebon is one of the cities in West Java Province, Indonesia, which is geologically located within an alluvial plain area. Geographically, Cirebon Regency is located at 6°30′58″–7°00′24″ south latitude and 108°19′30″–108°50′03″ east longitude. As of 2020, the population of Cirebon City is approximately 350,000, with a density of 8265 people per km2.
The analysis in this area includes Indramayu (Figure 7(a.1)), Cirebon City (Figure 7(a.2)), and Cirebon Regency (Figure 7(a.3)). Essentially, Indramayu was not included in the analysis of LS in Cirebon; however, the condition of this region has become a concern not only because its LS rate is as significant as in Cirebon, which is 60 mm/year (Figure 7(b.1)), but also several residential areas in the northern region of the city (Figure 7(c.1)) experienced flooding, and the cause is yet to be discovered.
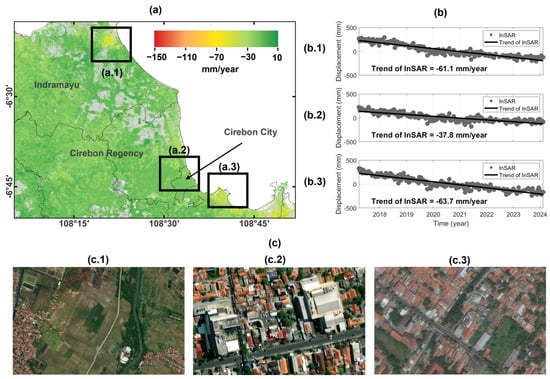
Figure 7.
LS in Cirebon: (a) LS rate in mm/year in Cirebon; (b) LS time series retrieved from InSAR from 2017 to 2023 in Indramayu (b.1), Cirebon City (b.2), and Cirebon Regency (b.3); land use of the region highlighted in black boxes areas, (a.1) which correspond to residential housing and agricultural area in Indramayu (c.1), (a.2) residential and business area (c.2) in Cirebon City, and (a.3) residential housing in Cirebon Residence (c.3).
The rate of LS in Cirebon Regency has a rate of about 60 mm/year (Figure 7(b.2)), which is particularly noticeable in densely populated coastal areas (Figure 7(c.2, c.3). Therefore, it can be anticipated that the probable causes of LS in the area are a combination of natural factors and human activities. The observations of LS in Cirebon align with the findings by [10,41,42].
An interesting event has been observed in Cirebon City, where the area affected by LS is centered around a hotel and a shopping center, with an LS rate of about 40 mm/year (Figure 7(b.3)). Meanwhile, in Cirebon Regency, it is suspected that LS is primarily caused by natural compaction processes in areas with thick sedimentary layers. Additionally, the presence of a steam power plant in the area may also contribute to the increased rate of LS in this area.
3.1.6. Brebes and Tegal
Brebes (6.8765° S, 108.5713° E) and Tegal (6.8816° S, 109.1346° E) are cities situated in Central Java Province. In these regions, LS reached alarming rates of 70 mm/year and 60 mm/ year, respectively (see Figure 8(b.1, b.2). Despite this significant concern, research on LS in Brebes and Tegal remains limited, resulting in an inconclusive explanation of the factors and causes of the issue. The morphology of Brebes and Tegal is dominated by alluvial plains and volcanic zones in the northern and southern parts, respectively [17].
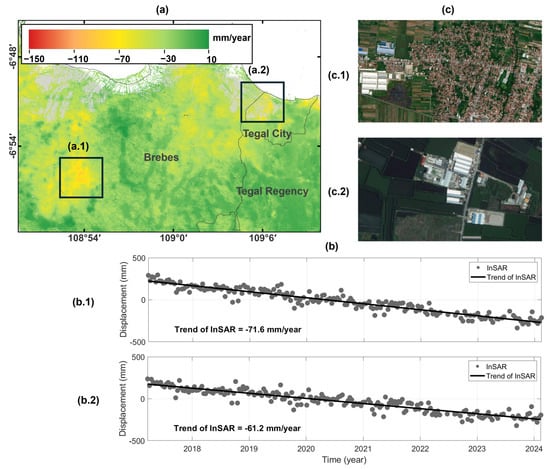
Figure 8.
LS in Brebes and Tegal: (a) Map of LS rate in mm/year; (b) LS time series retrieved from InSAR from 2017 to 2023 in Brebes (b.1) and Tegal (b.2); and (c) land use in black box area (a.1) corresponding to residential housing and industrial area in Brebes (c.1) and (a.2) corresponding to industrial complexes in an agricultural zone in Tegal (c.2).
In Brebes, the area affected by LS is rather extensive, primarily affecting densely populated residential areas and agricultural zones, particularly rice fields, as shown in Figure 8(c.1). This extensive subsidence poses risks not only to the infrastructure, but also to the livelihoods of the residents who rely on agriculture. However, the Tegal area is characterized by residential neighborhoods and aquaculture zones, as shown in Figure 8(c.2).
Groundwater irrigation in the Brebes and Tegal districts has been offered as a primary water supply solution for agriculture during the dry season. Since 2008, the local government has considered groundwater as one of the sources for irrigation network systems in the area. In 2019, the groundwater irrigation network was established in 17 locations, covering 425 ha of agricultural land [43]. However, studies on the influence of using groundwater for irrigation on LS in Indonesia are limited. A similar situation was reported in Bandung [37]. This study indicates that large-scale groundwater exploitation for agricultural activities has led to a significant decline in the groundwater table.
Information about groundwater irrigation in Tegal is also limited. However, a similar regulation was published by the local government in 2008, stating that groundwater is one of the sources for the irrigation network in Tegal Regency [44].
The practice of developing groundwater irrigation on Java Island has been increasing in recent years due to limited surface water supply, particularly during the dry season [45]. Although this practice is common in many countries, overexploitation of groundwater can lead to significant depletion of the groundwater table, reduced stream flow, declining water quality, and triggering LS hazards [46].
3.1.7. Pekalongan
Pekalongan (6.8936° S, 109.6665° E) refers to two administrative areas located in Central Java Province, which are located within an alluvial plain area. This location has been renowned as the center of Batik industry (Indonesian cultural fabrics) for centuries, and there is a long history of its active harbor. The industry areas are located mainly in the northern part of the city, which is also adjacent to the Java Sea. According to the 2020 census, Pekalongan is populated by 1.25 million residents.
The LS in Pekalongan has also been considered significant for more than a decade, as studied by [7,47] using the geodetic method. The result of this study shows that the LS rate in Pekalongan is up to 140 mm/year in several areas (Figure 9(b.1)). Figure 9a shows that the rate has not slowed since 2017.
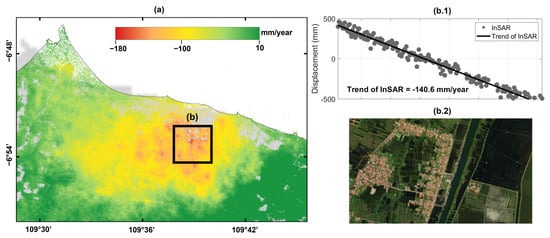
Figure 9.
LS in Pekalongan: (a) LS rate in mm/year in the Pekalongan area; (b.1) LS time series retrieved from InSAR from 2017 to 2023; and (b.2) land use of the region highlighted in the black box (b).
Groundwater overexploitation by the Batik industries has been identified as a key contibutor to LS in Pekalongan [47]. This argument is supported by the fact that the area with a relatively high LS rate is predominantly occupied by Batik industries, where the volume of groundwater extraction is not well recorded. The other primary factor that contributes to LS in Pekalonganis is the geological condition, as it is located within a thick deposit of alluvial sedimentation [17], which is prone to LS [48].
Generally, LS in Pekalongan encompasses almost the entire city, with the most affected areas being densely populated residential areas, as shown in the satellite image of Figure 9(b.2).
3.1.8. Greater Semarang
LS also occurs in Kendal, Semarang, and Demak—collectively called Greater Semarang—located in Central Java Province (approximately 7.0052° S, 110.4381° E). These areas are located within an alluvial plain area. Semarang City, the capital of Central Java, is considered the fifth largest metropolitan area in Indonesia, after Jakarta, Surabaya, Medan, and Bandung. Positioned on the northern coast of Java Island, Semarang serves as a key economic and cultural hub in the region, with an estimated population of around 1.65 million in 2020 [16]. Its strategic location and vibrant economy make it prominent for trade and commerce in Central Java.
The observation results of LS in the city of Semarang are consistent with previous studies conducted by [2,36,49,50]. LS in Kendal, Semarang, and Demak is relatively significant, as indicated by the black boxes in Figure 10a (Figure 10(a.1–a.3)), with LS rates up to 80 mm/year, 160 mm/year, and 100 mm/year, respectively, as shown in Figure 10(c.1–c.3). Figure 10d shows the land use and field conditions in each area. In Kendal (Figure 10(d.1)), subsidence is detected in industrial areas near the port; in Semarang, due to high rates of LS, houses are lower than the roads (Figure 10(d.2)); and in Demak, LS occurs in residential and agriculture areas (Figure 10(d.3)).
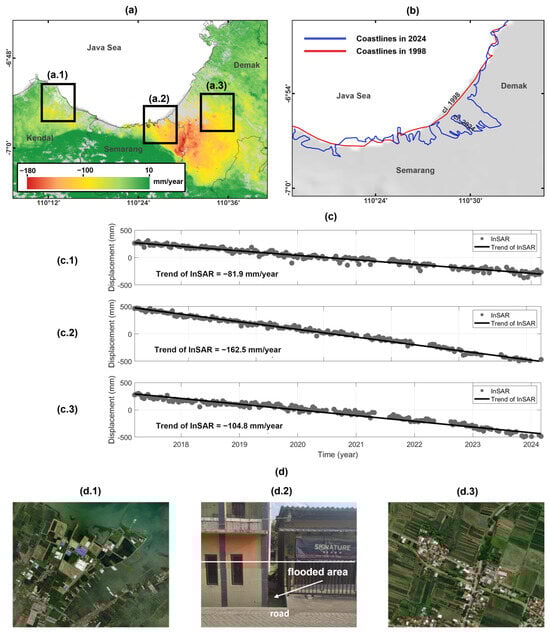
Figure 10.
LS in Greater Semarang: (a) LS rate in mm/year in Greater Semarang; (b) the coastline shift between Semarang and Demak from 1998 to 2024; and (c) LS time series retrieved from InSAR from 2017 to 2023 in Kendal (c.1), Semarang (c.2), and Demak (c.3); (d) Land use or situation of the region highlighted in the black box, (a.1) which correspond to industrial areas in the coastal area in Kendal Regency(d.1), (a.2) lowering of the housing floor level in the Northern Coast of Semarang (d.2), and (a.3) the agricultural area in Demak (d.3).
The impact of LS in Semarang has caused substantial damage in numerous aspects. One clear impact is the seawater inundation that has worsened over time. Figure 10b shows the coastline shift based on LANDSAT images from 1998 and 2024, showing a movement of more than 5 km inland. Other studies also indicate that inundations expanded by 650 m between 2006 and 2016 [51].
3.1.9. Surabaya
Surabaya (7.2504° S, 112.7688° E), the second largest city in Indonesia after Jakarta, is the capital of East Java Province and has a population of 3.1 million, according to the 2020 census [16]. The city is known for its dynamic economy, encompassing a diverse range of industries, such as manufacturing, trade, and services. It is also recognized for its well-planned urban infrastructure and ongoing efforts to promote environmental sustainability. Similar to most of the areas discussed in this study, Surabaya is also located on an alluvial plain area. Research on LS in Surabaya remains relatively limited, despite its accelerating rate due to urban development and environmental challenges [52,53,54,55].
The LS rate in Surabaya reaches up to 80 mm/year (Figure 10(b.1)), with the most affected area is marked by the black box (Figure 11b). Although LS in this city is considered relatively low compared to other cities, long-term impacts must be taken into account, particularly over densely populated urban areas. The LS is primarily observed in cluster housing areas, characterized by high-density development, extensive groundwater extraction, and insufficient drainage systems. The most affected areas are located within housing cluster zones, highlighted in Figure 11(b.2).
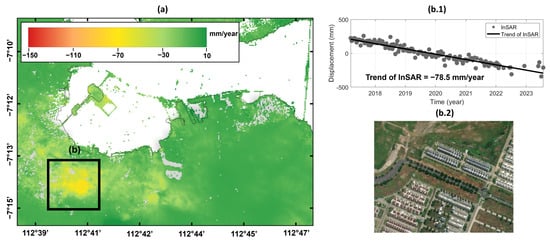
Figure 11.
LS in Surabaya: (a) LS rate in mm/year in Surabaya area; (b.1) LS time series retrieved from InSAR from 2017 to 2023; and (b.2) land use of the region highlighted in the black box (b).
3.1.10. Sidoardjo
Sidoardjo (7.4474° S, 112.7025° E) is located in East Java Province, approximately 40 km south of Surabaya, and has a population of approximately 2 million, according to the 2020 census. It is located on an alluvial plain area and renowned for its oil and gas production and industrial zones. Significant LS in this region is caused by the Lumpur Sidoardjo (LUSI) mud volcano eruption in 2006 [49,56,57].
Figure 12 illustrates the LS phenomena in Sidoarjo, with an LS rate up to 140 mm/year. Figure 12a shows the spatial distribution of the LS rate, while Figure 12b,c, respectively, present the LS time series from 2017 to 2023 and field conditions based on satellite imagery. The results show that LOS deformation in the LUSI mud volcano continued into 2024, although at a lower rate compared to the 2006–2014 period [56]. It is worth noting that the spatial extent of deformation in LUSI remains consistent with previous observations. Additionally, other affected areas have been identified, including a well site, rice field, and residential zones located west and east of the LUSI mud volcano, respectively.
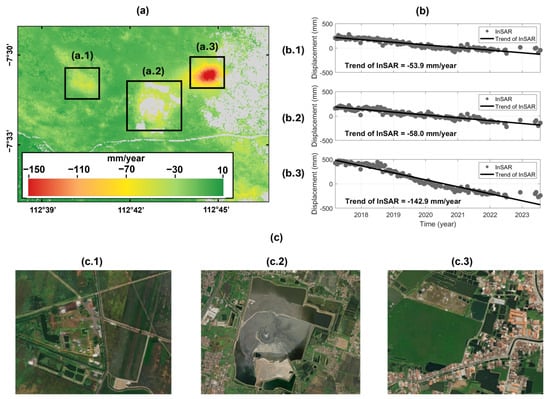
Figure 12.
LS in Sidoardjo: (a)Map if LS rate in mm/year; (b) LS time series retrieved from InSAR from 2017 to 2023 in oil and gas field area (b.1), LUSI mud volcano (b.2), residential area (b.3); (c) land use of the region highlighted in black boxes, (a.1) which correspond to complexes of oil and gas fields (c.1), (a.2) which correspond to the LUSI mud volcano (c.2), and (a.3) which correspond to the developed residential area (c.3).
3.2. Comparison with GNSS Observations
LS is typically monitored using geodetic methods, such as InSAR or GNSS. We validated our InSAR results using nine CORSs managed by the Indonesian Geospasial Information Agency [58]. These stations are primarily distributed along the northern coast of Java, as shown in Figure 2. Some CORS data have been excluded from the analysis due to several issues, such as antenna changes or repositions, outliers, and unexplained sudden rate changes. After data cleaning, both CORS and InSAR results were estimated using a linear model, as shown in Figure 13.
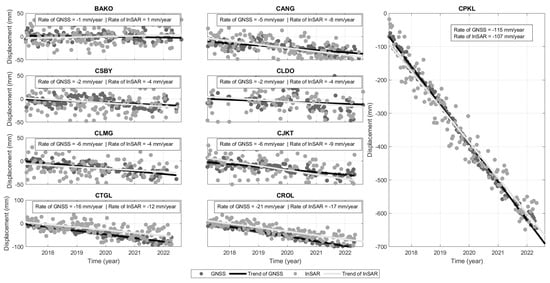
Figure 13.
Time series from GNSS and InSAR data in BAKO, CSBY, CLMG, CJKT, CANG, CLDO, CTGL, CROL, and CPKL stations.
The InSAR LS rate shows agreement with the CORS data. In BAKO station, the CORS rate was recorded at −0.41 mm/year, compared to the InSAR rate, which measured 1.45 mm/year. Although the signs are opposite, the value remained within the RMS rate estimation, which is 6.025 mm/year. All other stations have the same sign, with similar LS rate values. The largest discrepancy in LS rate occurred at the CPKL station, where the rates from each method differed by 16.04 mm/year. This is because LS observed from the CORS is not linear. The acceleration of the LS rate has been visible since 2012, with a slight deceleration observed in 2016. Recalculation of the CORS LS rate from 2016 to 2022 shows much greater agreement with the InSAR LS rate, which now differs by only 10.04 mm/year.
In general, the agreement between the InSAR and CORS LS rate is very high, as evidenced by its high correlation value of 0.94 derived from the cumulative displacement of nine CORSs (Figure 14). Additionally, the location of the largest displacement in Pekalongan has been identified.
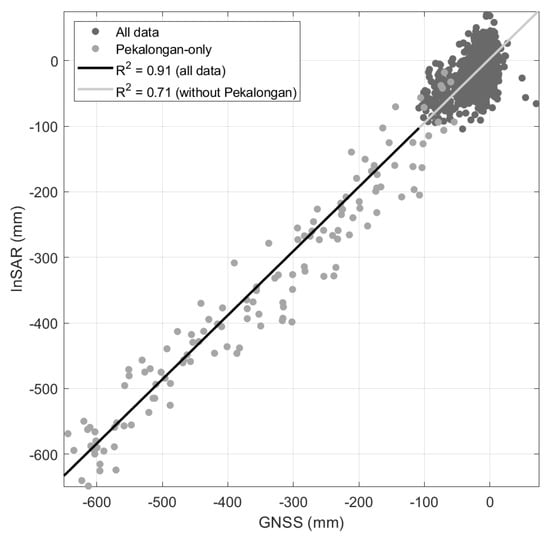
Figure 14.
Correlation between GNSS and InSAR cumulative displacement from 9 CORSs.
4. Discussion
4.1. Impact of Land Subsidence on Java Island
LS poses numerous consequences in multidimensional aspects. In this study, the impacts are classified into three categories: social, economic, and environmental aspects. These impacts may influence each other, for example, LS in urban areas that rely on groundwater for daily needs can lead to a decline in groundwater quality, resulting in higher water treatment costs. Moreover, the quantity of groundwater diminishes over time, reducing the carrying capacity of that area and potentially limiting economic and social activities. Table 1 summarizes the global effects of LS.

Table 1.
Impact of LS, especially on Java Island.
The impacts of LS in large cities, such as Jakarta, Bandung, and Semarang, are significantly evident. In Jakarta, there is a high rate of LS in the northern part, reducing the land level to lower than the mean sea level. Therefore, to prevent inundation, dam structures were built along the coast of Muara Angke, and more have been added since they were first built in 2007. At the time of this study, the land level in Muara Angke was observed as low as 1.5 m below sea level during high tide (see Figure 4(a.2)).
In the last decade, LS in Semarang has expanded to western and eastern areas, resulting in coastal flooding and loss. Inundations have been reported to reach up to 8 km from the shoreline in several areas. Groundwater over exploitation, as well as natural compaction, have been reported as the primary factors of LS in Semarang [72]. Damages to infrastructure have increased significantly: buildings are frequently flooded (with some cases of permanent flooding), railways are inundated, and even the newly built airport is now at high risk of flooding. Repurposing inundated areas for fishponds and the support of industries by some individuals has excerbated the situation. People are not only losing their properties, including houses, but also their livelihood.
Similar situations have also been reported in Bandung, with significant infrastructure damage. The most prominent evidence is a cracked bridge with a gap of approximately 80 cm (Figure 6(b.2)). According to a road construction company responsible for routine maintenance of the bridge, the last repair was performed in 2013, which aligns with the result of LS occurring at a rate of 80 mm/year. Cracks on buildings and roads have also been reported in other studies, [64]. Worsening of coastal flooding [47] and damages to the drainage system have also been reported in Pekalongan [73].
4.2. Spatial Changes in Land Subsidence
In the greater area of Semarang, the spatial distribution of LS has changed since the first study was conducted. Observations between 2006 and 2011 indicate that the LS rate in this particular area was insignificant [5]. Another notable change is the eastward expansion of the LS area, extending further into Demak Regency. The LS area has expanded by more than 500 km2 to the east compared to data observed in 2007 [5].
Another significant spatial change in LS has also been observed in the Bandung area. The maximum rate of LS has shifted from the industrial area in the western side of Bandung City to the southern part, from 60 mm/year to 150 mm/year. However, the LS rate in several industrial areas in Bandung, such as Majalaya and Banjaran, has remained unchanged since 2006. Recently, residential areas in Bandung have been facing a substantially higher LS rate compared to 20 years ago, and the rate is now potentially comparable to that in industrial areas [74].
In Cirebon, the LS phenomenon did not exist 10 years ago. Rapid infrastructure development in accordance with groundwater exploitation in Cirebon City may instigate LS in the region. A single oval-shaped area in Cirebon and Cianjur suggests that the causes may originate from several adjacent sources. Moreover, LS detected in this study along the Cirebon shoreline may also contribute to the rapid abrasion of the city’s shoreline [75].
4.3. Importance of Land Subsidence Monitoring in Java
LS is caused by several factors, including groundwater extraction [76,77], urban development [78], natural compaction [48,79], and tectonic activity [80]. In Java, as has been extensively discussed in this paper, areas that suffer from LS are urban, industrial, and relatively highly developed areas. As is well established, LS contributes to substantial losses economically, socially, and environmentally. Therefore, continuous LS monitoring is crucial for (1) early detection and prevention [81], (2) infrastructure safety and risk management [82], (3) natural resource management [83], (4) effective urban planning [81], and (5) understanding its long-term mechanisms and trends [84].
However, continuous LS monitoring faces some challenges that must be addressed. Firstly, continuous LS monitoring using GNSS measurement, despite the fact that it can provide a high-accuracy LS rate, requires a large number of GNSS stations, thus demanding huge financial support. Secondly, continuous LS monitoring using the InSAR-based method has its own challenges: the large amount of data and linear data growth. Therefore, advancement in computational infrastructure and methodological breakthroughs are required to overcome these issues.
The approach used to retrieve the LS rate in this study is the least-square method, which requires high-specification processing tools. Computational costs will continue to increase linearly in proportion to the growth of the data. To overcome this problem, real-time parameter estimation methods, such as recursive least-squares, Kalman filtering, least-mean-squares, and moving-horizon estimation can be applied. In our case, recursive least-squares (RLS) is more suitable for LS monitoring using InSAR in Java. Compared to other methods, especially Kalman filtering, RLS is simpler to implement and performs very well for cases with stable parameters over time, such as in LS monitoring.
RLS can estimate the adjustment solution when new data enter the calculation process without having to store all previously collected data [85]. It is efficient in reducing computational system resources and accelerating the time series inversion estimation process, particularly when processing SAR data for deformation monitoring, as the data continuously increase over time; thus, the parameter re-estimation process (deformation magnitude) does not have to be repeated entirely when new data are available.
However, this method has some limitations, such as numerical instability and being slow in estimating time-varying parameters [86]. However, these limitations can be addressed through specific measures. Numerical instability, mainly caused by round-off error in recursive operations, can be mitigated using a decent decomposition method, such as singular value decomposition (SVD) [87]. The advancements in computation have significantly reduced these issues. Furthermore, computational efficiency can be improved by decomposing the systems into smaller subsystems [88].
5. Conclusions
This study has ascertained the capability of SAR data in mapping LS for massive areas such as Java, Indonesia. It is found that LS in Java not only transpires in major cities, such as Jakarta, Semarang, and Bandung, which are frequently studied and discussed, but has also been occurring in smaller cities, such as Cirebon and Pandeglang, with annual subsidence rates reaching up to 110 mm/year. This study has also identified two new locations affected by LS that were not previously studied: Cianjur and Tegal. Although the LS rates in these regions are relatively lower compared to larger cities, they remain a significant concern. A summary of the lithology and compositions of LS regions and LS probable causes are tabulated in Table 2.
Table 2.
Lithological composition of LS-indicated areas.
The deformation caused by LS derived from SAR data shows strong agreement with GNSS measurements, allowing us to ascertain its accuracy and reliability. CORS GNSS measurements not only validate the deformation from SAR but also play an important role throughout the SAR processing steps. This highlights the importance of integrating both methods to enhance the accuracy of LS estimation.
The prevalence of LS in industrial areas in Indonesia with thick sediment deposits aligns with previous studies, identifying groundwater overexploitation as the primary cause. LS is also observed in agricultural regions like Brebes and Tegal, where irrigation-related groundwater use may contribute, though detailed causal studies are still lacking. Additionally, the north coast of Java, where most LS cases are identified in this study, requires particular attention due to the severe impacts of subsidence. In conclusion, it is suggested that continuous monitoring of LS in Java using SAR and GNSS measurements should be performed, as land subsidence may emerge in new areas.
Author Contributions
Conceptualization, T.P.S. and I.G.; methodology, T.P.S.; software, T.P.S.; validation, T.P.S., I.G. and H.Z.A.; writing—original draft preparation, T.P.S.; writing—review and editing, I.G. and R.L.; visualization, R.L.; supervision, H.Z.A., I.M. and A.P.; funding acquisition, I.G. and H.Z.A. All authors have read and agreed to the published version of the manuscript.
Funding
Part of this research was funded by Faculty of Earth Sciences and Technology at ITB (PPMI scheme) grant number 57A/IT1.C01/SK-KS/2024.
Data Availability Statement
The data presented in this study were derived from the following resources available in the public domain: InaCORS (Indonesia’s Continuously Operating Reference Stations), available at https://www.big.go.id/content/produk/inacors (accessed on 10 October 2024); DEMNAS (Digital Elevation Model Nasional; Indonesia’s DEM), available at https://www.big.go.id/content/produk/demnas (accessed on 2 February 2024); USGS (United States Geological Survey), available at https://www.usgs.gov (accessed on 17 November 2024); and ASF (Alaska Satellite Facility), available at https://www.asf.alaska.edu (accessed on 5 April 2024).
Acknowledgments
We express our gratitude to the Geospatial Information Agency (Badan Informasi Geospasial) for their valuable discussions and access to data that supported this research. We also thank the Ministry of Public Works and Public Housing (Kementerian PUPR) of Indonesia for their insightful discussions and provision of computational resources during the initial stages of this study. Additionally, our appreciation goes to Bumi Kala Carta Bandung for their support in conducting part of the field surveys related to this study.
Conflicts of Interest
The authors declare no conflicts of interest.
References
- Harintaka, H.; Suhadha, A.G.; Syetiawan, A.; Ardha, M.; Rarasati, A. Current land subsidence in Jakarta: A multi-track SBAS InSAR analysis during 2017–2022 using C-band SAR data. Geocarto Int. 2024, 39, 2364726. [Google Scholar] [CrossRef]
- Bott, L.M.; Schöne, T.; Illigner, J.; Haghshenas Haghighi, M.; Gisevius, K.; Braun, B. Land subsidence in Jakarta and Semarang Bay—The relationship between physical processes, risk perception, and household adaptation. Ocean Coast. Manag. 2021, 211, 105775. [Google Scholar] [CrossRef]
- Gumilar, I.; Sidiq, T.P.; Meilano, I.; Bramanto, B.; Pambudi, G. Extensive Investigation of the Land Subsidence Impressions on Gedebage District, Bandung, Indonesia. IOP Conf. Ser. Earth Environ. Sci. 2021, 873, 12044. [Google Scholar] [CrossRef]
- Bramanto, B.; Breili, K.; Gerlach, C.; Gumilar, I.; Ophaug, V.; Wahyudi, E.J. Geodetic/gravimetric evidence for mass loss in the subsidence area of Bandung, Indonesia. J. Geodyn. 2023, 157, 101987. [Google Scholar] [CrossRef]
- Marfai, M.A.; King, L. Tidal inundation mapping under enhanced land subsidence in Semarang, Central Java Indonesia. Nat. Hazards 2007, 44, 93–109. [Google Scholar] [CrossRef]
- Sarah, D.; Soebowo, E.; Satriyo, N.A. Review of the land subsidence hazard in Pekalongan delta, central Java: Insights from the subsurface. Rud.-Geološko Zb. 2021, 36, 163–176. [Google Scholar] [CrossRef]
- Sidiq, T.P.; Adiwijaya, R.F.; Nugroho, E.O.; Gumilar, I.; Abidin, H.Z. Long term subsidence rate in Pekalongan city observed by SAR Interferometry. IOP Conf. Ser. Earth Environ. Sci. 2023, 1276, 12014. [Google Scholar] [CrossRef]
- Chaussard, E.; Amelung, F.; Abidin, H.; Hong, S.H. Sinking cities in Indonesia: ALOS PALSAR detects rapid subsidence due to groundwater and gas extraction. Remote Sens. Environ. 2013, 128, 150–161. [Google Scholar] [CrossRef]
- Galloway, D.L.; Burbey, T.J. Review: Regional land subsidence accompanying groundwater extraction. Hydrogeol. J. 2011, 19, 1459–1486. [Google Scholar] [CrossRef]
- Bramanto, B.; Gumilar, I.; Sidiq, T.P.; Rahmawan, Y.A.; Abidin, H.Z. Geodetic evidence of land subsidence in Cirebon, Indonesia. Remote Sens. Appl. Soc. Environ. 2023, 30, 100933. [Google Scholar] [CrossRef]
- Susilo, S.; Salman, R.; Hermawan, W.; Widyaningrum, R.; Wibowo, S.T.; Lumban-Gaol, Y.A.; Meilano, I.; Yun, S.H. GNSS land subsidence observations along the northern coastline of Java, Indonesia. Sci. Data 2023, 10, 421. [Google Scholar] [CrossRef] [PubMed]
- Abidin, H.Z.; Andreas, H.; Gamal, M.; Djaja, R.; Subarya, C.; Hirose, K.; Maruyama, Y.; Murdohardono, D.; Rajiyowiryono, H. Monitoring Land Subsidence of Jakarta (Indonesia) Using Leveling, GPS Survey and InSAR Techniques. In A Window on the Future of Geodesy: Proceedings of the International Association of Geodesy IAG General Assembly Sapporo, Japan, 30 June–11 July 2003; Sansò, F., Ed.; Springer: Berlin/Heidelberg, Germany, 2005; pp. 561–566. [Google Scholar]
- Sidiq, T.P.; Gumilar, I.; Meilano, I.; Abidin, H.Z.; Andreas, H.; Permana, A. Land Subsidence of Java North Coast Observed by SAR Interferometry. IOP Conf. Ser. Earth Environ. Sci. 2021, 873, 012078. [Google Scholar] [CrossRef]
- Hasan, M.F.; Smith, R.; Vajedian, S.; Pommerenke, R.; Majumdar, S. Global land subsidence mapping reveals widespread loss of aquifer storage capacity. Nat. Commun. 2023, 14, 6180. [Google Scholar] [CrossRef] [PubMed]
- Wu, P.; Wei, M.; D’Hondt, S. Subsidence in coastal cities throughout the world observed by INSAR. Geophys. Res. Lett. 2022, 49, e2022GL098477. [Google Scholar] [CrossRef]
- Badan Pusat Statistik. Statistical Yearbook of Indonesia 2023; Badan Pusat Statistik: Jakarta, Indonesia, 2023. [Google Scholar]
- van Bemmelen, R. The Geology of Indonesia; Goverment Printing: The Hague, The Netherlands, 1949. [Google Scholar]
- Geological Research and Development Centre of Indonesia. Regional Geological Map, Sheet: Western of Java Scale 1:500,000. 1998. Available online: https://geologi.esdm.go.id/geomap/pages/preview/peta-geologi-lembar-jawa-bagian-barat (accessed on 3 November 2024).
- Geological Research and Development Centre of Indonesia. Regional Geological Map, Sheet: Middle Part of Java Scale 1:500,000. 1999. Available online: https://geologi.esdm.go.id/geomap/pages/preview/peta-geologi-lembar-jawa-bagian-tengah (accessed on 3 November 2024).
- Geological Research and Development Centre of Indonesia. Regional Geological Map, Sheet: Eastern Part of Java Scale 1:500,000. 1999. Available online: https://geologi.esdm.go.id/geomap/pages/preview/peta-geologi-lembar-jawa-bagian-timur (accessed on 3 November 2024).
- Engelen, G.B.; Kloosterman, F.H. Regional Hydrological Systems Analysis in the northern coastal plain of Java, Indonesia. In Hydrological Systems Analysis: Methods and Applications; Springer: Dordrecht, The Netherlands, 1996; pp. 140–144. [Google Scholar] [CrossRef]
- Schmidt, D.A.; Bürgmann, R. Time-dependent land uplift and subsidence in the Santa Clara valley, California, from a large interferometric synthetic aperture radar data set. J. Geophys. Res. Solid Earth 2003, 108, 1–13. [Google Scholar] [CrossRef]
- Pinheiro, M. Increase of Sentinel-1a Orbital Tube: Impact on Interferometry; Technical Note ESA-EOPG-EOPGMQ-TN-2024-12, Issue 1.0, 8 April 2024; European Space Agency (ESA): Frascati, Italy, 2024; pp. 5–14. [Google Scholar]
- Julzarika, A.; Harintaka. Indonesian DEMNAS: DSM or DTM? In Proceedings of the 2019 IEEE Asia-Pacific Conference on Geoscience, Electronics and Remote Sensing Technology (AGERS), Jakarta, Indonesia, 26-27 August 2019; pp. 31–36. [Google Scholar] [CrossRef]
- Susetyo, D.B. Vertical Accuracy Assessment of Various Open-Source Dem Data: Demnas, Srtm-1, and Aster Gdem. Geod. Cartogr. 2023, 49, 209–215. [Google Scholar] [CrossRef]
- Chen, C.W.; Zebker, H.A. Two-dimensional phase unwrapping with use of statistical models for cost functions in nonlinear optimization. J. Opt. Soc. Am. A 2001, 18, 338–351. [Google Scholar] [CrossRef]
- Yu, C.; Li, Z.; Penna, N.T. Interferometric synthetic aperture radar atmospheric correction using a GPS-based iterative tropospheric decomposition model. Remote Sens. Environ. 2018, 204, 109–121. [Google Scholar] [CrossRef]
- Yu, C.; Li, Z.; Penna, N.; Crippa, P. Generic Atmospheric Correction Model for Interferometric Synthetic Aperture Radar Observations. J. Geophys. Res. Solid Earth 2018, 123. [Google Scholar] [CrossRef]
- Agram, P.S.; Simons, M. A noise model for InSAR time series. J. Geophys. Res. Solid Earth 2015, 120, 2752–2771. [Google Scholar] [CrossRef]
- Hanssen, R.F. Radar Interferometry: Data Interpretation and Error Analysis; Springer: Dordrecht, The Netherlands, 2001. [Google Scholar] [CrossRef]
- Liu, Z.; Jung, H.S.; Lu, Z. Joint correction of ionosphere noise and orbital error in L-Band SAR interferometry of interseismic deformation in southern California. IEEE Trans. Geosci. Remote Sens. 2014, 52, 3421–3427. [Google Scholar] [CrossRef]
- Du, Y.; Fu, H.; Liu, L.; Feng, G.; Peng, X.; Wen, D. Orbit error removal in InSAR/MTInSAR with a patch-based polynomial model. Int. J. Appl. Earth Obs. Geoinf. 2021, 102, 102438. [Google Scholar] [CrossRef]
- Fattahi, H.; Amelung, F. DEM Error Correction in InSAR Time Series. IEEE Trans. Geosci. Remote Sens. 2013, 51, 4249–4259. [Google Scholar] [CrossRef]
- Yunjun, Z.; Fattahi, H.; Amelung, F. Small baseline InSAR time series analysis: Unwrapping error correction and noise reduction. Comput. Geosci. 2019, 133, 104331. [Google Scholar] [CrossRef]
- Hu, J.; Li, Z.W.; Ding, X.L.; Zhu, J.J.; Zhang, L.; Sun, Q. Resolving three-dimensional surface displacements from InSAR measurements: A review. Earth-Sci. Rev. 2014, 133, 1–17. [Google Scholar] [CrossRef]
- Aditiya, A.; Ito, T. Present-day land subsidence over Semarang revealed by time series InSAR new small baseline subset technique. Int. J. Appl. Earth Obs. Geoinf. 2023, 125, 103579. [Google Scholar] [CrossRef]
- Sidiq, T.P.; Gumilar, I.; Abidin, H.Z.; Gamal, M. Land subsidence induced by agriculture activity in Bandung, West Java Indonesia. IOP Conf. Ser. Earth Environ. Sci. 2019, 389, 12024. [Google Scholar] [CrossRef]
- Arhatin, R.; Lumban-Gaol, J.; Nurjaya, I.W.; Susilo, S.; Kushardono, D.; Nugroho, U.; Jumarang, M.; Sinurat, M.; Nabil, N. Assessing land subsidence and analyzing tidal flooding in Tangerang, Banten. BIO Web Conf. 2024, 106, 4010. [Google Scholar] [CrossRef]
- Widodo, J.; Herlambang, A.; Sulaiman, A.; Razi, P.; Yohandri; Perissin, D.; Kuze, H.; Sumantyo, J.T.S. Land subsidence rate analysis of Jakarta Metropolitan Region based on D-InSAR processing of Sentinel data C-Band frequency. J. Phys. Conf. Ser. 2019, 1185, 12004. [Google Scholar] [CrossRef]
- BPS-Statistics Bandung Regency. Margahayu District in Figures 2024; BPS-Statistics Bandung Regency: Bandung, Indonesia, 2024; Volume 13. [Google Scholar]
- Ardha, M.; Khomarudin, M.R.; Pranowo, W.S.; Chulafak, G.A.; Yudhatama, D.; Mujio; Pravitasari, S. Spatial information on the rate of subsidence in North Coastal Area of Java and the estimation of inundation in 2031. IOP Conf. Ser. Earth Environ. Sci. 2022, 1109, 12022. [Google Scholar] [CrossRef]
- Solihuddin, T.; Husrin, S.; Mustikasari, E.; Heriati, A.; Kepel, T.L.; Salim, H.L.; Risandi, J.; Dwiyanti, D. Coastal Inundation and Land Subsidence in North Coast of West Java: A New Hazard? IOP Conf. Ser. Earth Environ. Sci. 2021, 925, 12015. [Google Scholar] [CrossRef]
- Pemerintah Provinsi Jawa Tengah. Maksimalkan Irigasi Pertanian, Pemkab Brebes Kucurkan Dana Rp 6 Milyar. 2019. Available online: https://jatengprov.go.id/publik/maksimalkan-irigasi-pertanian-pemkab-brebes-kucurkan-dana-rp-6-milyar (accessed on 2 December 2024).
- Pemerintah Daerah Kabupaten Tegal. Peraturan Daerah Kabupaten Tegal Nomor 4 Tahun 2008 tentang Pengembangan dan Pengelolaan Sistem Irigasi, 2008. Ditetapkan pada 31 Mei 2008, diundangkan pada 3 Juni 2008, dalam LD Kabupaten Tegal Tahun 2008 Nomor 4, TLD Kabupaten Tegal Nomor 19. Available online: https://jdih.tegalkab.go.id/index.php/ProdukHukum/detail/65 (accessed on 24 November 2024).
- Kementerian Departemen Pertanian. Pedoman Teknis Pengembangan Irigasi Tanah Dangkal dan Irigasi Tanah Dalam. Direktorat Pengelolaan Air Irigasi 2011. [Google Scholar]
- Faunt, C.C.; Sneed, M.; Traum, J.A.; Brandt, J.T. Water availability and land subsidence in the Central Valley, California, USA. Hydrogeol. J. 2016, 24, 675–684. [Google Scholar] [CrossRef]
- Nashrrullah, S.; Aprijanto, A.; Pasaribu, J.; Hazarika, M.; Samarakoon, L. Study of flood inundation in pekalongan, central java. Int. J. Remote Sens. Earth Sci. 2013, 10, 76–83. [Google Scholar]
- Sarah, D.; Hutasoit, L.; Delinom, R.; Sadisun, I. Natural Compaction of Semarang-Demak Alluvial Plain and Its Relationship to the Present Land Subsidence. Indones. J. Geosci. 2020, 7, 273–289. [Google Scholar] [CrossRef]
- Andreas, H.; Abidin, H.Z.; Sidiq, T.P.; Gumilar, I.; Aoki, Y.; Hakim, A.L.; Sumintadiredja, P. Understanding the trigger for the LUSI mud volcano eruption from ground deformation signatures. Geol. Soc. London, Spec. Publ. 2017, 441, 199–212. [Google Scholar] [CrossRef]
- Giovanie, Y.; Azzarra, A.B.; Hidayatullah, A.F.; Hariz, A.R. Land Subsidence in the North Coastal Semarang City for Socioeconomic Activities. TEMALI J. Pembang. Sos. 2023, 6, 15–22. [Google Scholar] [CrossRef]
- Prasetyo, Y.; Bashit, N.; Sasmito, B.; Setianingsih, W. Impact of Land Subsidence and Sea Level Rise Influence Shoreline Change in the Coastal Area of Demak. IOP Conf. Ser. Earth Environ. Sci. 2019, 280, 012006. [Google Scholar] [CrossRef]
- Anjasmara, I.M.; Yulyta, S.A.; Cahyadi, M.N.; Khomsin, K.; Taufik, M.; Jaelani, L.M. Land subsidence analysis in Surabaya urban area using time series InSAR method. In Proceedings of the International Symposium on Earth Hazard and Disaster Mitigation, ISEDM 2017: The 7th Annual Symposium on Earthquake and Related Geohazard Research for Disaster Risk Reduction, Bandung, Indonesia, 20–21 November 2017. [Google Scholar] [CrossRef]
- Handoko, E.; Kurniawan, A.; Angger, S. Apakah Surabaya Terjadi Land subsidence? Kajian Awal Land Subsidence Surabaya. Semin. Nas. Apl. Teknol. Prasarana Wil. 2011, 20011, 17–20. [Google Scholar]
- Pamungkas, Y.A.; Chiang, S.H. Monitoring land subsidence induced by groundwater change using satellite gravimetry and radar interferometry measurements. Case study: Surabaya city, Indonesia. IOP Conf. Ser. Earth Environ. Sci. 2021, 916, 12030. [Google Scholar] [CrossRef]
- Riastama, C.N.; Anjasmara, I.M.; Maulida, P. Monitoring Land Subsidence and its Effect on Surabaya Coastal Inundation by Utilizing GPS Campaigns Data. IOP Conf. Ser. Earth Environ. Sci. 2023, 1127, 12002. [Google Scholar] [CrossRef]
- Aoki, Y.; Sidiq, T.P. Ground deformation associated with the eruption of Lumpur Sidoarjo mud volcano, east Java, Indonesia. J. Volcanol. Geotherm. Res. 2014, 278–279, 96–102. [Google Scholar] [CrossRef]
- Fukushima, Y.; Mori, J.; Hashimoto, M.; Kano, Y. Subsidence associated with the LUSI mud eruption, East Java, investigated by SAR interferometry. Mar. Pet. Geol. 2009, 26, 1740–1750. [Google Scholar] [CrossRef]
- Badan Informasi Geospasial. InaCORS BIG: Satu Referensi Pemetaan Indonesia, 1st ed.; Badan Informasi Geospasial: Cibinong, Indonesia, 2025; pp. 12–19. [Google Scholar]
- Andreas, H.; Zainal Abidin, H.; Pradipta, D.; Anggreni Sarsito, D.; Gumilar, I. Insight look the subsidence impact to infrastructures in Jakarta and Semarang area; Key for adaptation and mitigation. MATEC Web Conf. 2018, 147, 1–8. [Google Scholar] [CrossRef][Green Version]
- Dinar, A.; Esteban, E.; Calvo, E.; Herrera, G.; Teatini, P.; Tomás, R.; Li, Y.; Ezquerro, P.; Albiac, J. We lose ground: Global assessment of land subsidence impact extent. Sci. Total Environ. 2021, 786, 147415. [Google Scholar] [CrossRef]
- Belland, M.; Kooy, M.; Zwarteveen, M. Destabilizing the science of soils: Geoscientists as spokespersons for land subsidence in Semarang, Indonesia. Environ. Plan. E Nat. Space 2024, 7, 882–903. [Google Scholar] [CrossRef]
- Purnomo, A.H.; Kurniawan, T.; Farandy, A.R.; Apriliani, T.; Nurlaili; Imron, M.; Sajise, A.J. Revisiting the climate change adaptation strategy of Jakarta’s coastal communities. Ocean Coast. Manag. 2024, 253, 107112. [Google Scholar] [CrossRef]
- Saputra, E.; Spit, T.; Zoomers, A. Living in a Bottomless Pit: Households’ Responses to Land Subsidence, an Example from Indonesia. J. Environ. Prot. 2019, 10, 1–21. [Google Scholar] [CrossRef][Green Version]
- Gumilar, I.; Sidiq, T.P.; Virtriana, R.; Pambudi, G.; Bramanto, B.; Abidin, H.Z. Geodetic observations confirming land subsidence of Bandung Basin, Indonesia, and subsequent building damage. Acta Geod. Et Geophys. 2023, 58, 373–388. [Google Scholar] [CrossRef]
- Adelina, C.; Gamal, A.; Marthanty, D.R. Literature Review: How Does Water Play a Role in Forming Land Value? IOP Conf. Ser. Earth Environ. Sci. 2021, 837, 12011. [Google Scholar] [CrossRef]
- Saputra, E.; Hartmann, T.; Zoomers, A.; Spit, T. Fighting the Ignorance: Public Authorities’ and Land Users’ Responses to Land Subsidence in Indonesia. Am. J. Clim. Change 2017, 6, 1–21. [Google Scholar] [CrossRef]
- Nugroho, E.O.; Juliadi, S.A.; Soekarno, I.; Widyaningtias, W.; Kuntoro, A.A.; Sidiq, T.P.; Nurmalia, S.L.; Widigdo, C. Kajian Banjir dan Perubahan Dasar Sungai Banger Akibat Penutupan Regulator Gate, Kota Pekalongan, Provinsi Jawa Tengah. J. Educ. 2024, 6, 12720–12732. [Google Scholar] [CrossRef]
- Abidin, H.Z.; Djaja, R.; Darmawan, D.; Hadi, S.; Akbar, A.; Rajiyowiryono, H.; Sudibyo, Y.; Meilano, I.; Kasuma, M.A.; Kahar, J.; et al. Land Subsidence of Jakarta (Indonesia) and its Geodetic Monitoring System. Nat. Hazards 2001, 23, 365–387. [Google Scholar] [CrossRef]
- Taftazani, R.; Kazama, S.; Takizawa, S. Spatial Analysis of Groundwater Abstraction and Land Subsidence for Planning the Piped Water Supply in Jakarta, Indonesia. Water 2022, 14, 3197. [Google Scholar] [CrossRef]
- Moe, I.R.; Kure, S.; Januriyadi, N.F.; Farid, M.; Udo, K.; Kazama, S.; Koshimura, S. Effect of Land Subsidence on Flood Inundation in Jakarta, Indonesia. J. Jpn. Soc. Civ. Eng. Ser G (Environmental Res. 2016, 72, 283–289. [Google Scholar] [CrossRef]
- Yuwono, B.D.; Sabri, L.M.; Wijaya, A.P.; Awaluddin, M. Assessment of Flood Risk Induced by Land Subsidence Using Machine Learning. Indones. J. Geogr. 2024, 56, 376–386. [Google Scholar] [CrossRef]
- Sarah, D.; Soebowo, E. Land subsidence threats and its management in the North Coast of Java. IOP Conf. Ser. Earth Environ. Sci. 2018, 118, 12042. [Google Scholar] [CrossRef]
- Putri, S.I.; Syakira, H.; Nugroho, E.O.; Layaliya, H.N.; Soeharno, A.W.; Kusuma, M.S.; Farid, M.; Kuntoro, A.A.; Sidiq, T.P.; Nurmalia, S.L.; et al. An overview of flood risk components: The Land subsidence case of Pekalongan City. E3S Web Conf. 2024, 513, 1001. [Google Scholar] [CrossRef]
- Abidin, H.Z.; Gumilar, I.; Andreas, H.; Murdohardono, D.; Fukuda, Y. On causes and impacts of land subsidence in Bandung Basin, Indonesia. Environ. Earth Sci. 2013, 68, 1545–1553. [Google Scholar] [CrossRef]
- Rusdi, K.; Wibowo, A.; Saraswati, R. Coastline Changes On The Coast of Cirebon Using Landsat. E3s Web Conf. 2020, 202, 15016. [Google Scholar] [CrossRef]
- Galloway, D.; Jones, D.; Ingebritsen, S. Land Subsidence in the United States; US Geological Survey: Reston, VA, USA, 1999; Volume 1182. [Google Scholar]
- Poland, J.F. Guidebook to Studies of Land Subsidence due to Ground-Water Withdrawal; The United Nations Educational, Scientific and Cultural Organization: Paris, France, 1984. [Google Scholar]
- Erkens, G.; Bucx, T.; Dam, R.; de Lange, G.; Lambert, J. Sinking coastal cities. Proc. Int. Assoc. Hydrol. Sci. 2015, 372, 189–198. [Google Scholar] [CrossRef]
- Koster, K.; Lange, G.D.; Harting, R.; de Heer, E.; Middelkoop, H. Characterizing void ratio and compressibility of Holocene peat with CPT for assessing coastal–deltaic subsidence. Q. J. Eng. Geol. Hydrogeol. 2018, 51, 210–218. [Google Scholar] [CrossRef]
- Hall, R.; Morley, C.K. Sundaland basins. In Continent-Ocean Interactions Within East Asian Marginal Seas; American Geophysical Union (AGU): Washington, DC, USA, 2004; Volume 149, pp. 55–85. [Google Scholar] [CrossRef]
- Galloway, D.L.; Hoffmann, J. The application of satellite differential SAR interferometry-derived ground displacements in hydrogeology. Hydrogeol. J. 2007, 15, 133–154. [Google Scholar] [CrossRef]
- López-Quiroz, P.; Doin, M.P.; Tupin, F.; Briole, P.; Nicolas, J.M. Time series analysis of Mexico City subsidence constrained by radar interferometry. J. Appl. Geophys. 2009, 69, 1–15. [Google Scholar] [CrossRef]
- Erban, L.E.; Gorelick, S.M.; Zebker, H.A. Groundwater extraction, land subsidence, and sea-level rise in the Mekong Delta, Vietnam. Environ. Res. Lett. 2014, 9, 84010. [Google Scholar] [CrossRef]
- Carreón-Freyre, D.; Cerca, M.; Ochoa-González, G.; Teatini, P.; Zuñiga, F.R. Shearing along faults and stratigraphic joints controlled by land subsidence in the Valley of Queretaro, Mexico. Hydrogeol. J. 2016, 24, 657–674. [Google Scholar] [CrossRef]
- Teunissen, P. Dynamic Data Processing: Recursive Least-Squares; TU Delft OPEN Publishing: Delft, The Netherlands, 2001. [Google Scholar] [CrossRef]
- Jiang, J.; Zhang, Y. A revisit to block and recursive least squares for parameter estimation. Comput. Electr. Eng. 2004, 30, 403–416. [Google Scholar] [CrossRef]
- Dumortier, F. Theory and practice of recursive identification. Automatica 1985, 21, 499–501. [Google Scholar] [CrossRef]
- Wang, S.; Ding, R. Three-stage recursive least squares parameter estimation for controlled autoregressive autoregressive systems. Appl. Math. Model. 2013, 37, 7489–7497. [Google Scholar] [CrossRef]


Disclaimer/Publisher’s Note: The statements, opinions and data contained in all publications are solely those of the individual author(s) and contributor(s) and not of MDPI and/or the editor(s). MDPI and/or the editor(s) disclaim responsibility for any injury to people or property resulting from any ideas, methods, instructions or products referred to in the content. |
© 2025 by the authors. Licensee MDPI, Basel, Switzerland. This article is an open access article distributed under the terms and conditions of the Creative Commons Attribution (CC BY) license (https://creativecommons.org/licenses/by/4.0/).