Abstract
The combination of reclaimed asphalt pavement (RAP) and foamed bitumen content (FBC) in bitumen mixtures presents a viable and economically advantageous approach to asphalt pavement construction. This investigation delves into the optimal combinations of RAP and FBC to attain a perfect performance, particularly concerning rutting resistance and tensile strength, as assessed through the Hamburg Wheel Tracking Test (HWTT) and the Indirect Tensile Strength (ITS) test. Advanced artificial intelligence (AI) methodologies, such as Random Forest, Support Vector Regression (SVR), and Linear Regression, were utilized to check performance data and attain optimal mix designs. The findings indicate that RAP content ranging from 60% to 80%, in conjunction with FBC levels between 1.5% and 1.8%, yield the most adequate performance under both wet and dry conditions, confirming enhanced rutting resistance and tensile strength.
1. Introduction
The increasing demand for sustainable and cost-effective asphalt pavement solutions has driven significant research into incorporating reclaimed asphalt pavement (RAP) into new mixtures. The reuse of RAP reduces dependency on virgin materials and minimizes construction waste, contributing to environmental sustainability. However, determining the ideal combination of RAP and foamed bitumen content (FBC) is important to ensure optimal pavement performance, particularly in terms of rutting resistance and tensile strength. The use of RAP in asphalt mixtures is widely recognized for enhancing sustainability while saving or improving pavement performance. Many studies have analyzed the effects of RAP content on mechanical properties, which proves not only its benefits but also its challenges. Sánchez et al. tested the impact of foaming techniques and mixing temperature on foamed bitumen mixtures that contain RAP, showing that optimized foaming improves adhesion and workability [1,2]. Mogawer et al. found that high RAP content increases stiffness but may lead to cracking susceptibility [2], while Dinis-Almeida et al. demonstrated that RAP incorporation of up to 100% is possible with warm mix technologies, ensuring adequate mechanical performance [3]. Although high RAP percentages improve stiffness and rutting resistance, they may reduce cracking resistance due to aged binder properties, which require a balance between RAP and FBC proportions.
Foamed bitumen has emerged as a material in sustainable asphalt pavement recycling techniques, including cold in-place recycling (CIR) and full-depth reclamation (FDR). This is due to its ability to enhance adhesion and significantly reduce moisture sensitivity, which ensures the long-term durability of asphalt pavements, particularly in wet conditions. Previous studies have shown that foamed bitumen enhances the durability of cold-recycled asphalt mixtures by improving their resistance to environmental damage. In terms of evaluating the performance of foamed bitumen-stabilized mixtures, several advanced laboratory tests have been employed. The Hamburg Wheel-Tracking Test (HWTT) is widely used to assess rutting resistance, simulating the effects of long-term traffic loading [4,5]. In contrast, the indirect tensile strength (ITS) test offers valuable insights into the mixture’s resistance to cracking and tensile strength, both of which are essential for ensuring the durability of pavements in colder climates [5].
Recent advancements in artificial intelligence (AI) and machine learning (ML) have revolutionized asphalt mixture design by enhancing the accuracy of performance predictions. Various AI techniques, such as support vector machines (SVM), random forest, and artificial neural networks (ANNs), have been applied to analyze the laboratory test results and optimize asphalt mixture compositions. Notably, SVM has been employed to predict the indirect tensile strength of foamed bitumen-stabilized base course materials, showing its effectiveness in improving model accuracy [6,7]. Daneshvar and Behnood employed Random Forest models to enhance asphalt mix design by capturing nonlinear interactions between mix components and pavement performance [8]. Miani et al. used hyperparameter-optimized machine learning to model bitumen mixtures, showing improved prediction accuracy compared to traditional statistical methods [9]. Additionally, Wang et al. developed a foaming quality control model using neural networks and parameter optimization, which significantly improved mixture stability and workability [10].
Building on these advancements, this study aims to identify the optimal RAP and FBC proportions to achieve a balance between rutting resistance and tensile strength. The proposed mixtures will be validated through HWTT and ITS tests under both wet and dry conditions, ensuring their performance across various environmental scenarios. Additionally, AI-based models, including random forest, SVM, and linear regression, will be employed to predict and optimize RAP–FBC proportions. By combining experimental analysis with AI-driven modeling, this research aims to provide recommendations for utilizing foamed bitumen in the construction of sustainable asphalt pavements that are not only durable but also cost-effective. The goal is to ensure the suitability of these pavements for heavy traffic and diverse climatic conditions, thereby contributing to the development of high-performance, long-lasting asphalt infrastructure.
2. Materials and Methods
2.1. Determination of Aggregate Gradation
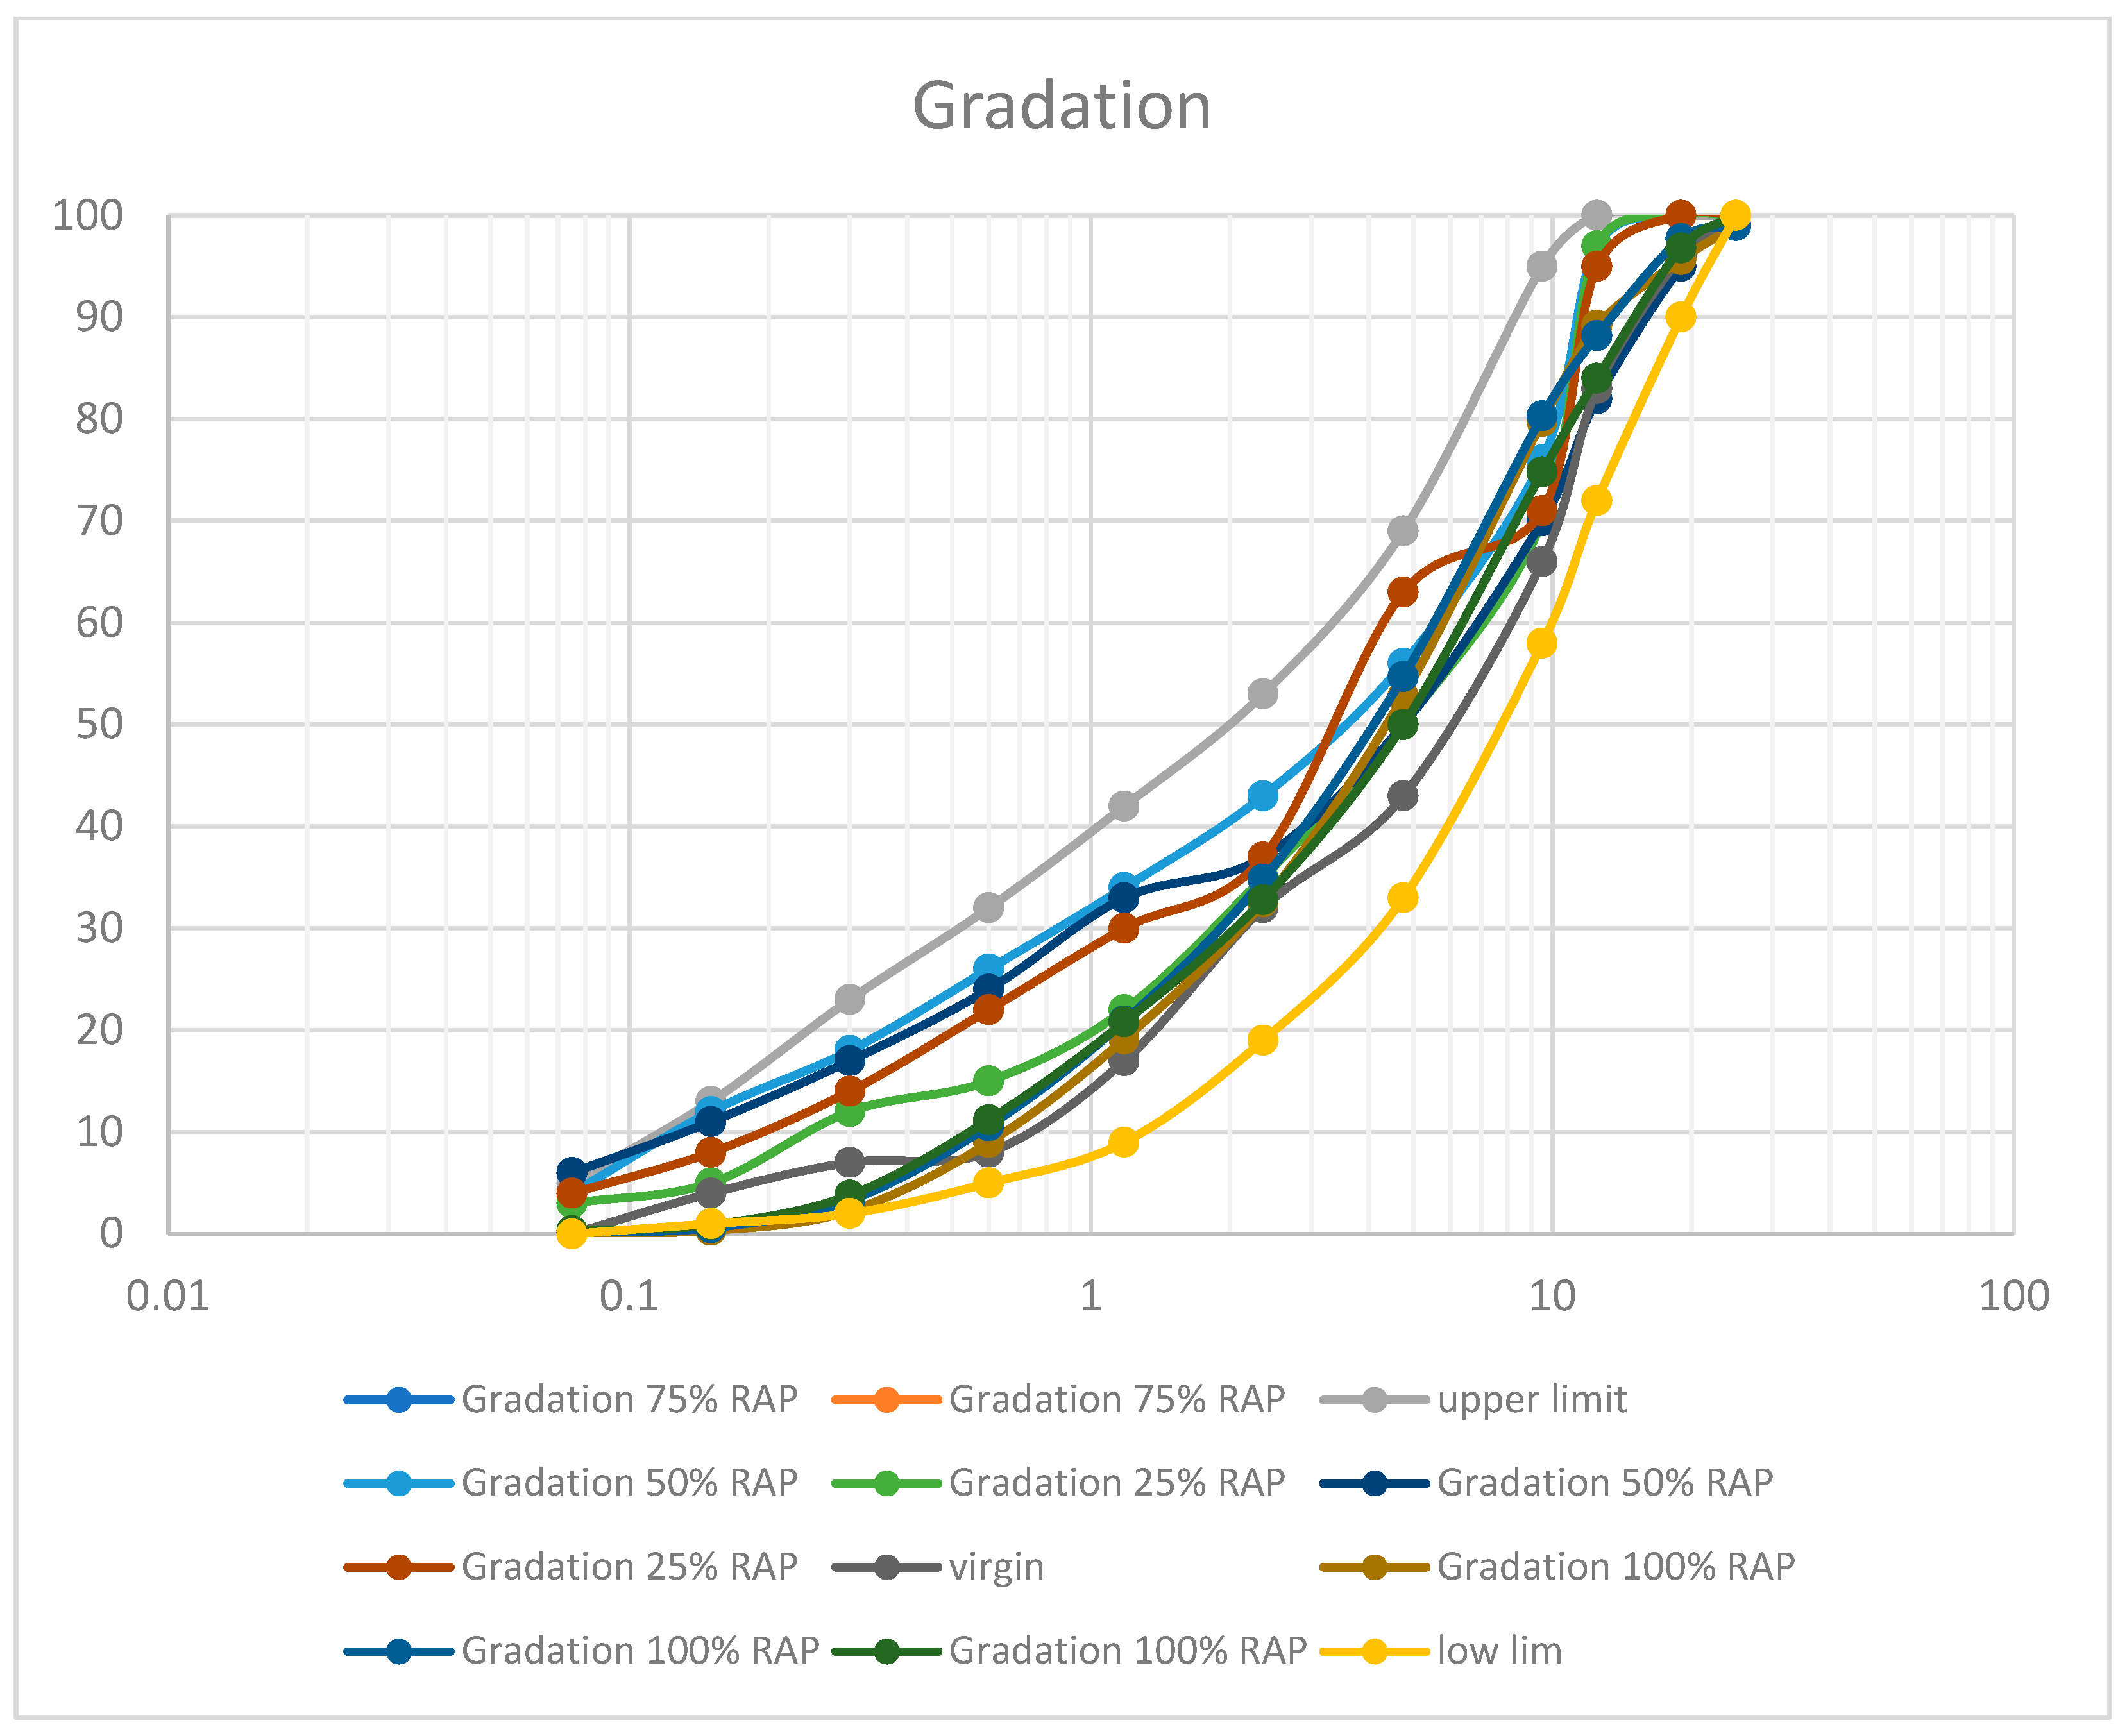
Mixed operations involved the use of gradations containing three curves with 100% reclaimed asphalt pavement (RAP), and two curves containing 75%, 50%, and 25% RAP, respectively, and one curve with entirely virgin aggregate all according to standard specification (D1073) as shown in Figure 1.
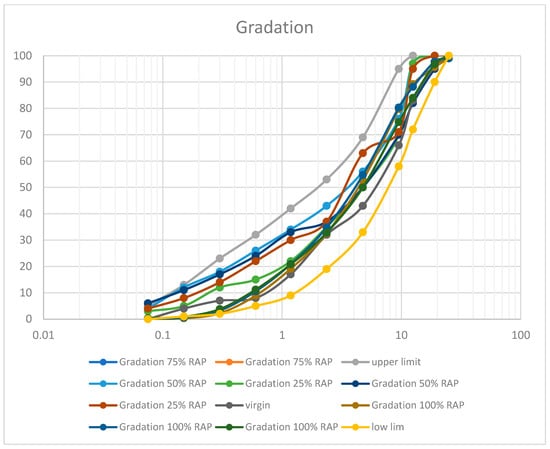
Figure 1.
Aggregate gradations applied.
The characteristics of RAP aggregates varied across different sources. For instance, RAP-1 had a maximum aggregate grain size of 19 mm, RAP-2 had 12.5 mm, and RAP-3 had 9.5 mm, consisting of finer fractions. To ensure compliance with standards, the gradation curves for different RAP contents were analyzed in accordance with EN 933-1 [11], and EN 13043 [12].
In this study, the reclaimed asphalt pavement (RAP) had a binder content of approximately 4.9% by weight, determined using the standard extraction method (EN 12697-1) [13]. The key properties of the binder were analyzed, resulting in a penetration value of 56 dmm at 25 °C (EN 1426) [14], and a softening point of 53.8 °C (EN 1427) [15]. Its dynamic viscosity was recorded at 0.625 Pa·s (EN 13302) [16].
2.2. Bitumen Type
In our analysis, two types of bitumen (70/100 and 50/70) were chosen; it was shown that both bitumen types complied with the requirements of related specification (EN 12591) [17], proving their effectiveness for road construction. The characteristics of the bitumen types used are summarized in Table 1.

Table 1.
Bitumen characteristics.
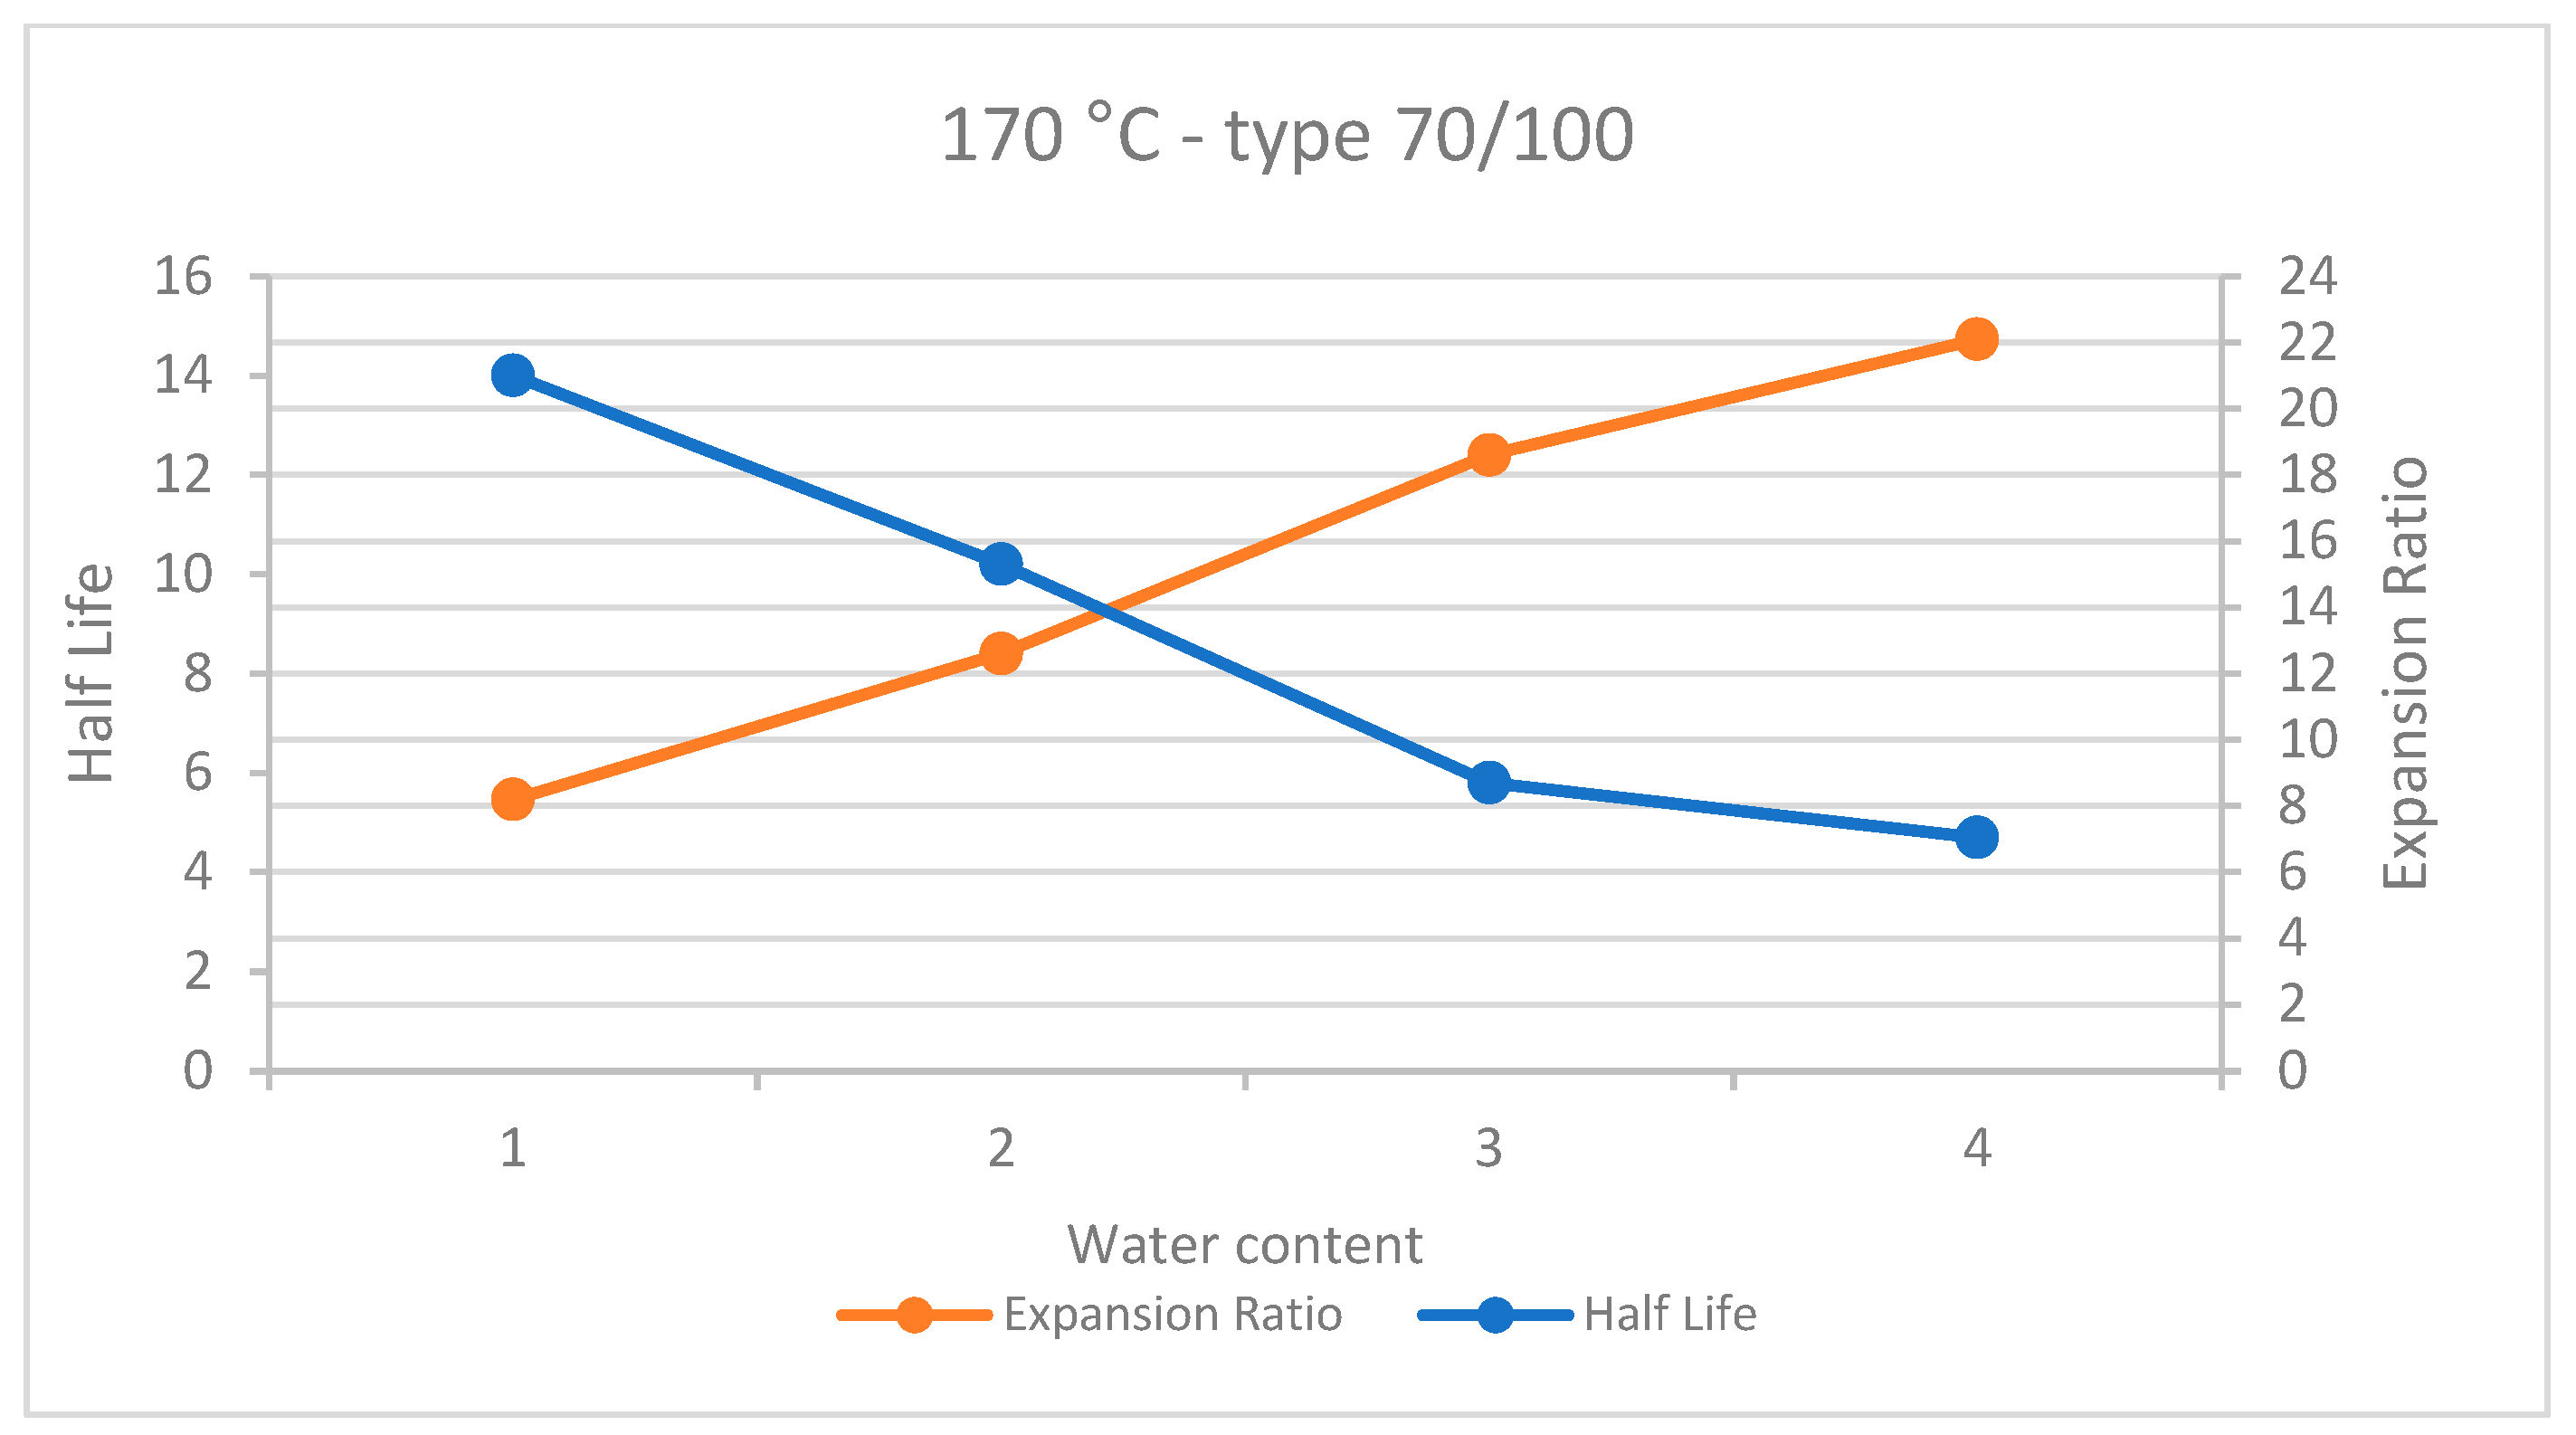
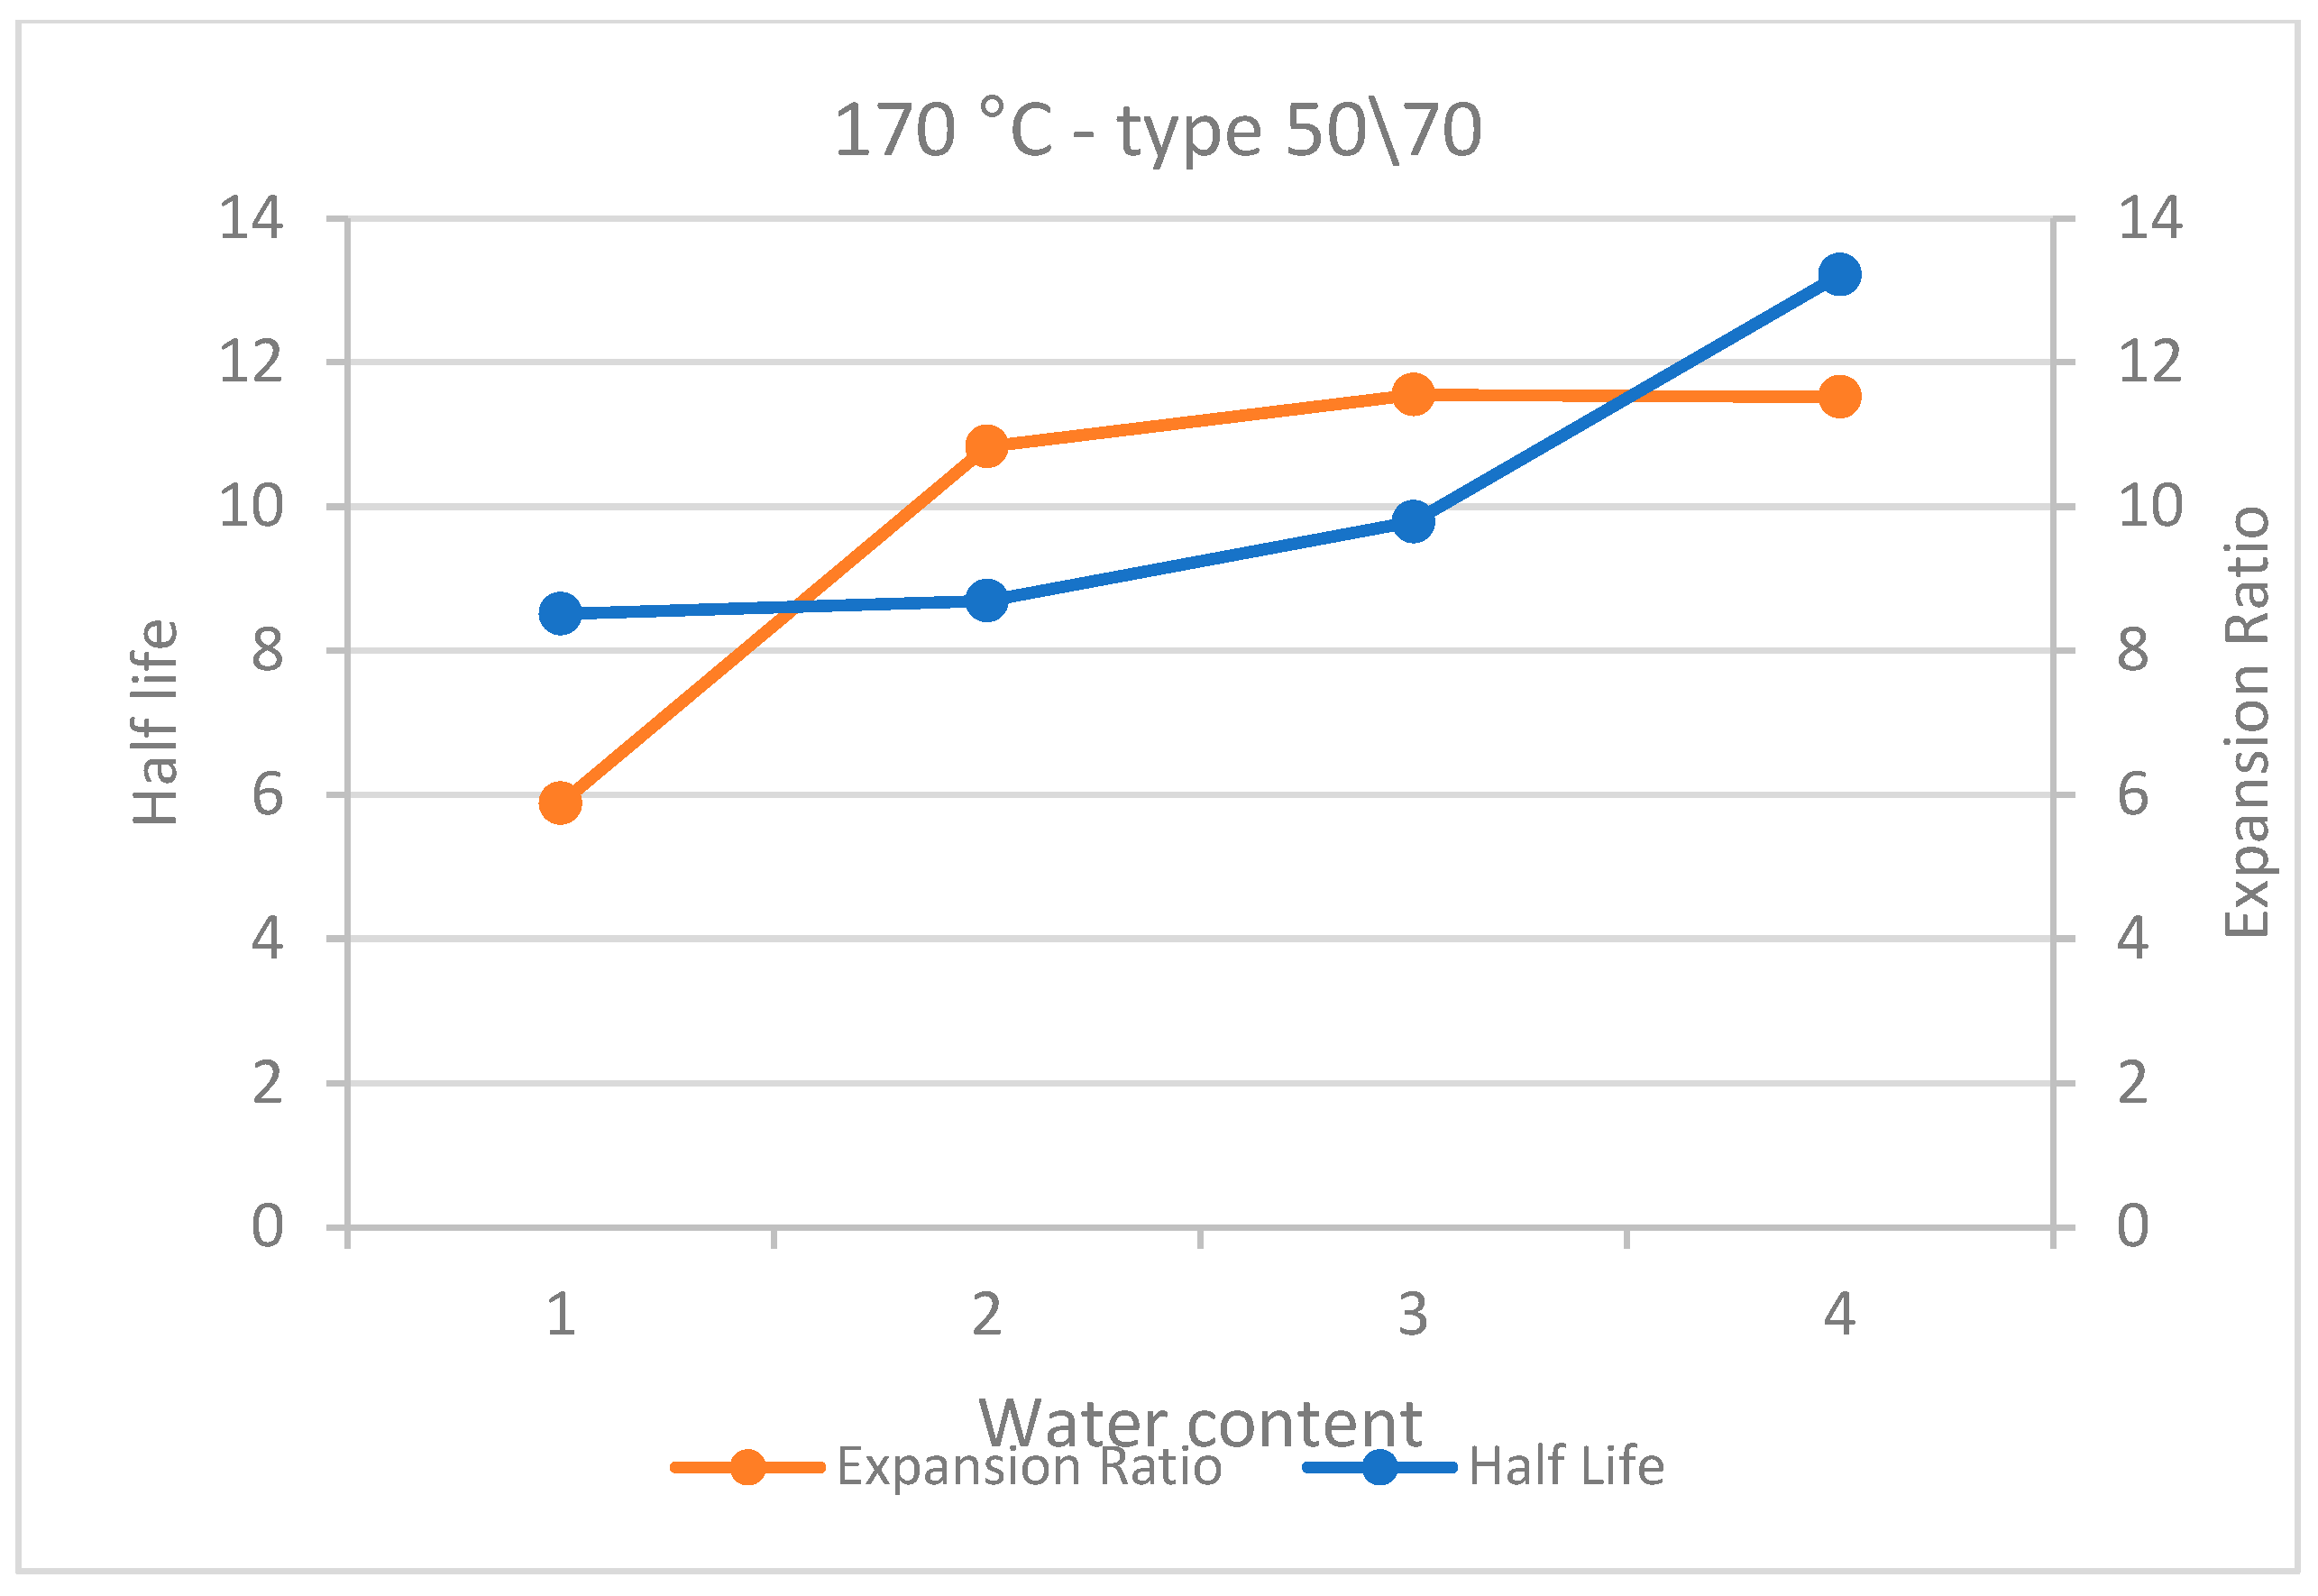
For the foaming process according to Wirtgen WLB 10S Guidelines, bitumen 70/100 demonstrated a half-life of 10.2 s and an expansion ratio of 12.6 times when mixed with 2% water at a temperature of 170 °C. Meanwhile, bitumen 50/70 exhibited a half-life of 12.3 s and an expansion ratio of 11.4 times with a 2.5% water content at the same temperature, as shown in Figure 2 and Figure 3. Notably, according to these guidelines, the foam should have a minimum expansion ratio of eight times the original volume and a half-life of 6 s to ensure effective aggregate stabilization at temperatures exceeding 15 °C.
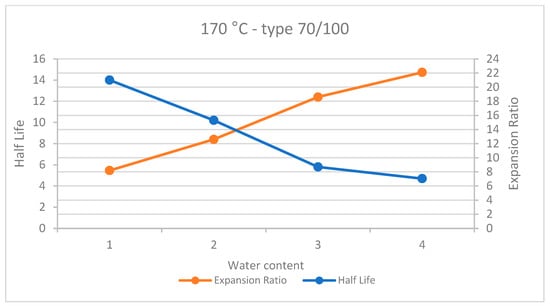
Figure 2.
Results of foaming bitumen 70/100 at 170 °C.
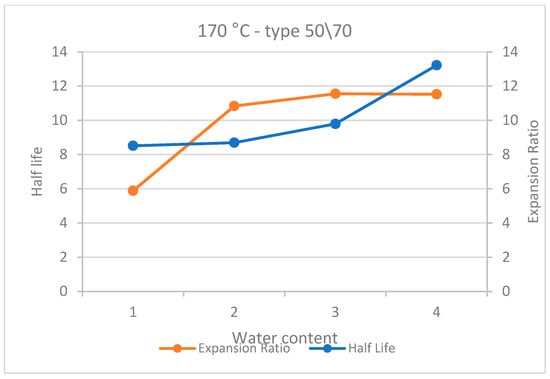
Figure 3.
Results of foaming bitumen 50/70 at 170 °C.
2.3. Mix Design
The preparation of asphalt mixtures with foamed bitumen followed a systematic procedure. The foamed bitumen was produced using the Wirtgen WLB 10S laboratory foamed bitumen unit, with the foaming temperature and water content optimized based on expansion ratio and half-life tests. The foamed bitumen was then mixed with the reclaimed asphalt pavement (RAP) at ambient temperature using a Wirtgen WLM 30 to ensure uniform coating and replicate actual asphalt production parameters. The final mixture was compacted using a Marshall Compactor in accordance with European Standard EN 12697-30 [19], applying 2 × 75 blows per face. This increased compaction energy was selected to simulate higher traffic loads, ensuring a dense mixture in line with specific national guidelines and previous research. This approach aimed to reflect real-world pavement conditions under heavy traffic, enhancing the applicability of the findings.
2.4. HWTT
The HWTT is a crucial technique for assessing the resilience of asphalt mixtures against rutting, closely modeling real-world pavement performance under heavy traffic conditions. This method is particularly valuable for testing mixtures that incorporate (RAP) and (FBC), as both elements can greatly influence the mixture’s resistance to rutting. Research works indicate that high RAP content or insufficient FBC can lead to diminished performance; RAP tends to increase stiffness and brittleness, while a lack of foamed bitumen can result in inadequate adhesion and cohesion [5].
The evaluation of rutting depth and deformation rate under controlled conditions allows for a comprehensive assessment of different mixtures. By analyzing these outcomes, it is a feasible option to identify optimum proportions of RAP and FBC to achieve an asphalt mixture with excellent rutting resistance while maintaining other critical properties, such as tensile strength (assessed through ITS) and cracking resistance [20] at a favorable level.
Wheel-tracking tests were conducted under the guidelines of AASHTO T324-19 [21]. So, this test was conducted at a temperature of 40 °C, selected based on the binder grade and the base layer location. In compliance with the prescribed standard, the samples underwent a 45 min preconditioning period in water before the testing phase. The testing apparatus consisted of a steel wheel with a width of 47 mm and a weight of 705 ± 4.5 N. During the test, the wheel operated at a frequency of 52 ± 2 passes per minute, with a maximum speed of 0.305 m/s at the midpoint. The test was concluded when either a maximum of 20,000 passes was reached or a rutting depth of 18 mm was achieved, whichever occurred first.
2.5. Indirect Tensile Strength
Indirect tensile strength (ITS) testing is a widely recognized method for assessing the mechanical properties and durability of asphalt mixtures. ITS is a particularly important test for evaluating foamed bitumen bound asphalt mixtures as it provides insights into the material’s tensile strength, cracking resistance, and moisture sensitivity. According to Zieliński [6], ITS testing is instrumental in determining the structural performance of foamed bitumen bound asphalt mixtures, especially when reclaimed asphalt pavement (RAP) is incorporated in the mixture. This is critical for ensuring that such mixtures meet performance standards in terms of stiffness, strength, and resistance to environmental induced stresses.
In this study, we use ITS-wet and ITS-dry as separate inputs to achieve higher accuracy. These parameters represent the indirect tensile strength (ITS) values measured under wet and dry conditions, according to EN 12697-12 [22]. The compaction energy for the Marshall specimens was adjusted accordingly. Cylindrical Marshall samples with a diameter of 101.6 mm and a height of 63.5 mm (±2.5 mm) were compacted by 2 × 75 blows in accordance with PN-EN 12697-30 [23,24]. The samples were used for testing indirect tensile strength (ITS) in accordance with PN-EN 12697-23 [25].
3. Machine Learning Model
Artificial neural networks (ANNs) have recently become a key method for analyzing and optimizing foamed bitumen bound asphalt mixtures. They can provide a useful approach to predict and to enhance the properties of the mixture materials. Many studies have noted that ANNs can effectively improve complex relationships between various input factors such as temperature, foam content, expansion ratio, and half-life, alongside outputs like Marshall Stability and ITS [26]. For instance, a back proportion or feedforward neural network with its hidden layers has been successfully employed to predict the characteristics of bitumen mixtures, resulting in reliable and accurate prediction equations [27]. Furthermore, the integration of ANNs with particle swarm optimization has improved foamed bitumen properties in cold recycling technology by enhancing prediction accuracy through the analysis of multiple variables, including temperature and water content [28]. Researchers have also advanced the prediction of mechanical properties in foamed bitumen bound asphalt pavements using ANNs, which aids in optimizing pavement design and in thoroughly understanding input–output dynamics [9,29].
To obtain precise predictions and determine the optimal percentages of reclaimed asphalt pavement (RAP) and foamed bitumen content (FBC), various AI models have already been developed. The primary focus was on three main models: Random Forest (RF), Support Vector Regression (SVR), and Linear Regression.
Support vector regression (SVR) is an effective machine learning technique for modeling and forecasting material behavior in pavement engineering, especially in the field of foamed bitumen bound asphalt mixtures. Its advantage lies in its ability to capture nonlinear relationships by transforming input data into a higher-dimensional one using nodes and functions. This capability is important to understanding the complex behaviors of asphalt materials. Research has indicated that SVR effectively predicts various performance properties of foamed bitumen bound asphalt mixtures, such as Marshall Stability and Flow, which are affected by many factors like bitumen content, foam expansion ratio, and temperature [30,31]. This technique has confirmed prediction accuracy in comparison with traditional regression models, especially in situations of limited sample sizes, so reducing the risk of overfitting [30]. Notably, SVR has been successfully employed to forecast the performance of foamed bitumen bound asphalt mixtures used in cold recycling technology by providing accurate predictions for long-term pavement durability. Additional is SVR’s capacity to deliver estimates of foamed bitumen behavior in different conditions and improve the optimization process in pavement material design [32].
Random forests (RF) have emerged as a machine learning approach for predicting the characteristics and performance of foamed bitumen bound asphalt mixtures. This technique creates numerous decision trees and aggregates their outputs, which leads it to be effective in handling high-dimensional data and showing nonlinear interactions between variables [33]. In applications related to foamed bitumen bound asphalt mixtures, RF models have efficiently predicted key metrics like Marshall Stability, Flow, and rutting resistance against different factors such as foam content, bitumen temperature, and water content [34,35]. The strengths of RF are clear in its ability to manage inclusive and varied datasets, perform reliably across different sample sizes, and provide accurate predictions with minimizing the risk of overfitting, which especially takes place in traditional machine learning methods [35]. For example, RF has played an important role in enhancing the mix design of foamed asphalt by clarifying the interaction between mix components and pavement performance [8]. Moreover, RF models have shown improved predictive accuracy compared to simple regression techniques and established them as tools for engineers working with foamed asphalt applications in cold recycling and other pavement projects [36].
The machine learning algorithms used in this study include random forest (RF), support vector regression (SVR), and linear regression (LR). RF was selected for its ability to handle nonlinear relationships and prevent overfitting through group learning. SVR was applied due to its effectiveness in modeling complex material behaviors with small datasets. LR was used to evaluate the performance of nonlinear models. The target outputs of these models were the optimal RAP–FBC combinations for maximizing rut resistance and tensile strength, as well as predicted values for ITS under wet and dry conditions and predicted rut depth from HWTT.
For model development and boundary conditions, the dataset was split into 80% for training and 20% for testing to validate the models. Feature normalization was applied where necessary to ensure consistency in numerical scaling. The boundary conditions for the study were as follows: RAP content varied between 0% and 100%, FBC content ranged from 1.0% to 4.5%, and temperature and moisture exposure were based on standard laboratory conditions.
4. Results and Discussion
4.1. Model Validation and Optimization
Following the development of the AI model aimed at identifying the best combination of RAP and FBC for foamed bitumen bound asphalt mixtures, the subsequent vital phase involves validating and optimizing the model. This step is essential to confirm the model’s predictive accuracy and its capability to suggest mixed designs that fulfill the necessary criteria for rutting resistance (HWTT) and tensile strength (ITS). It is imperative that the recommendations generated by the AI model undergo thorough testing against actual data, allowing for ongoing adjustments and enhancements.
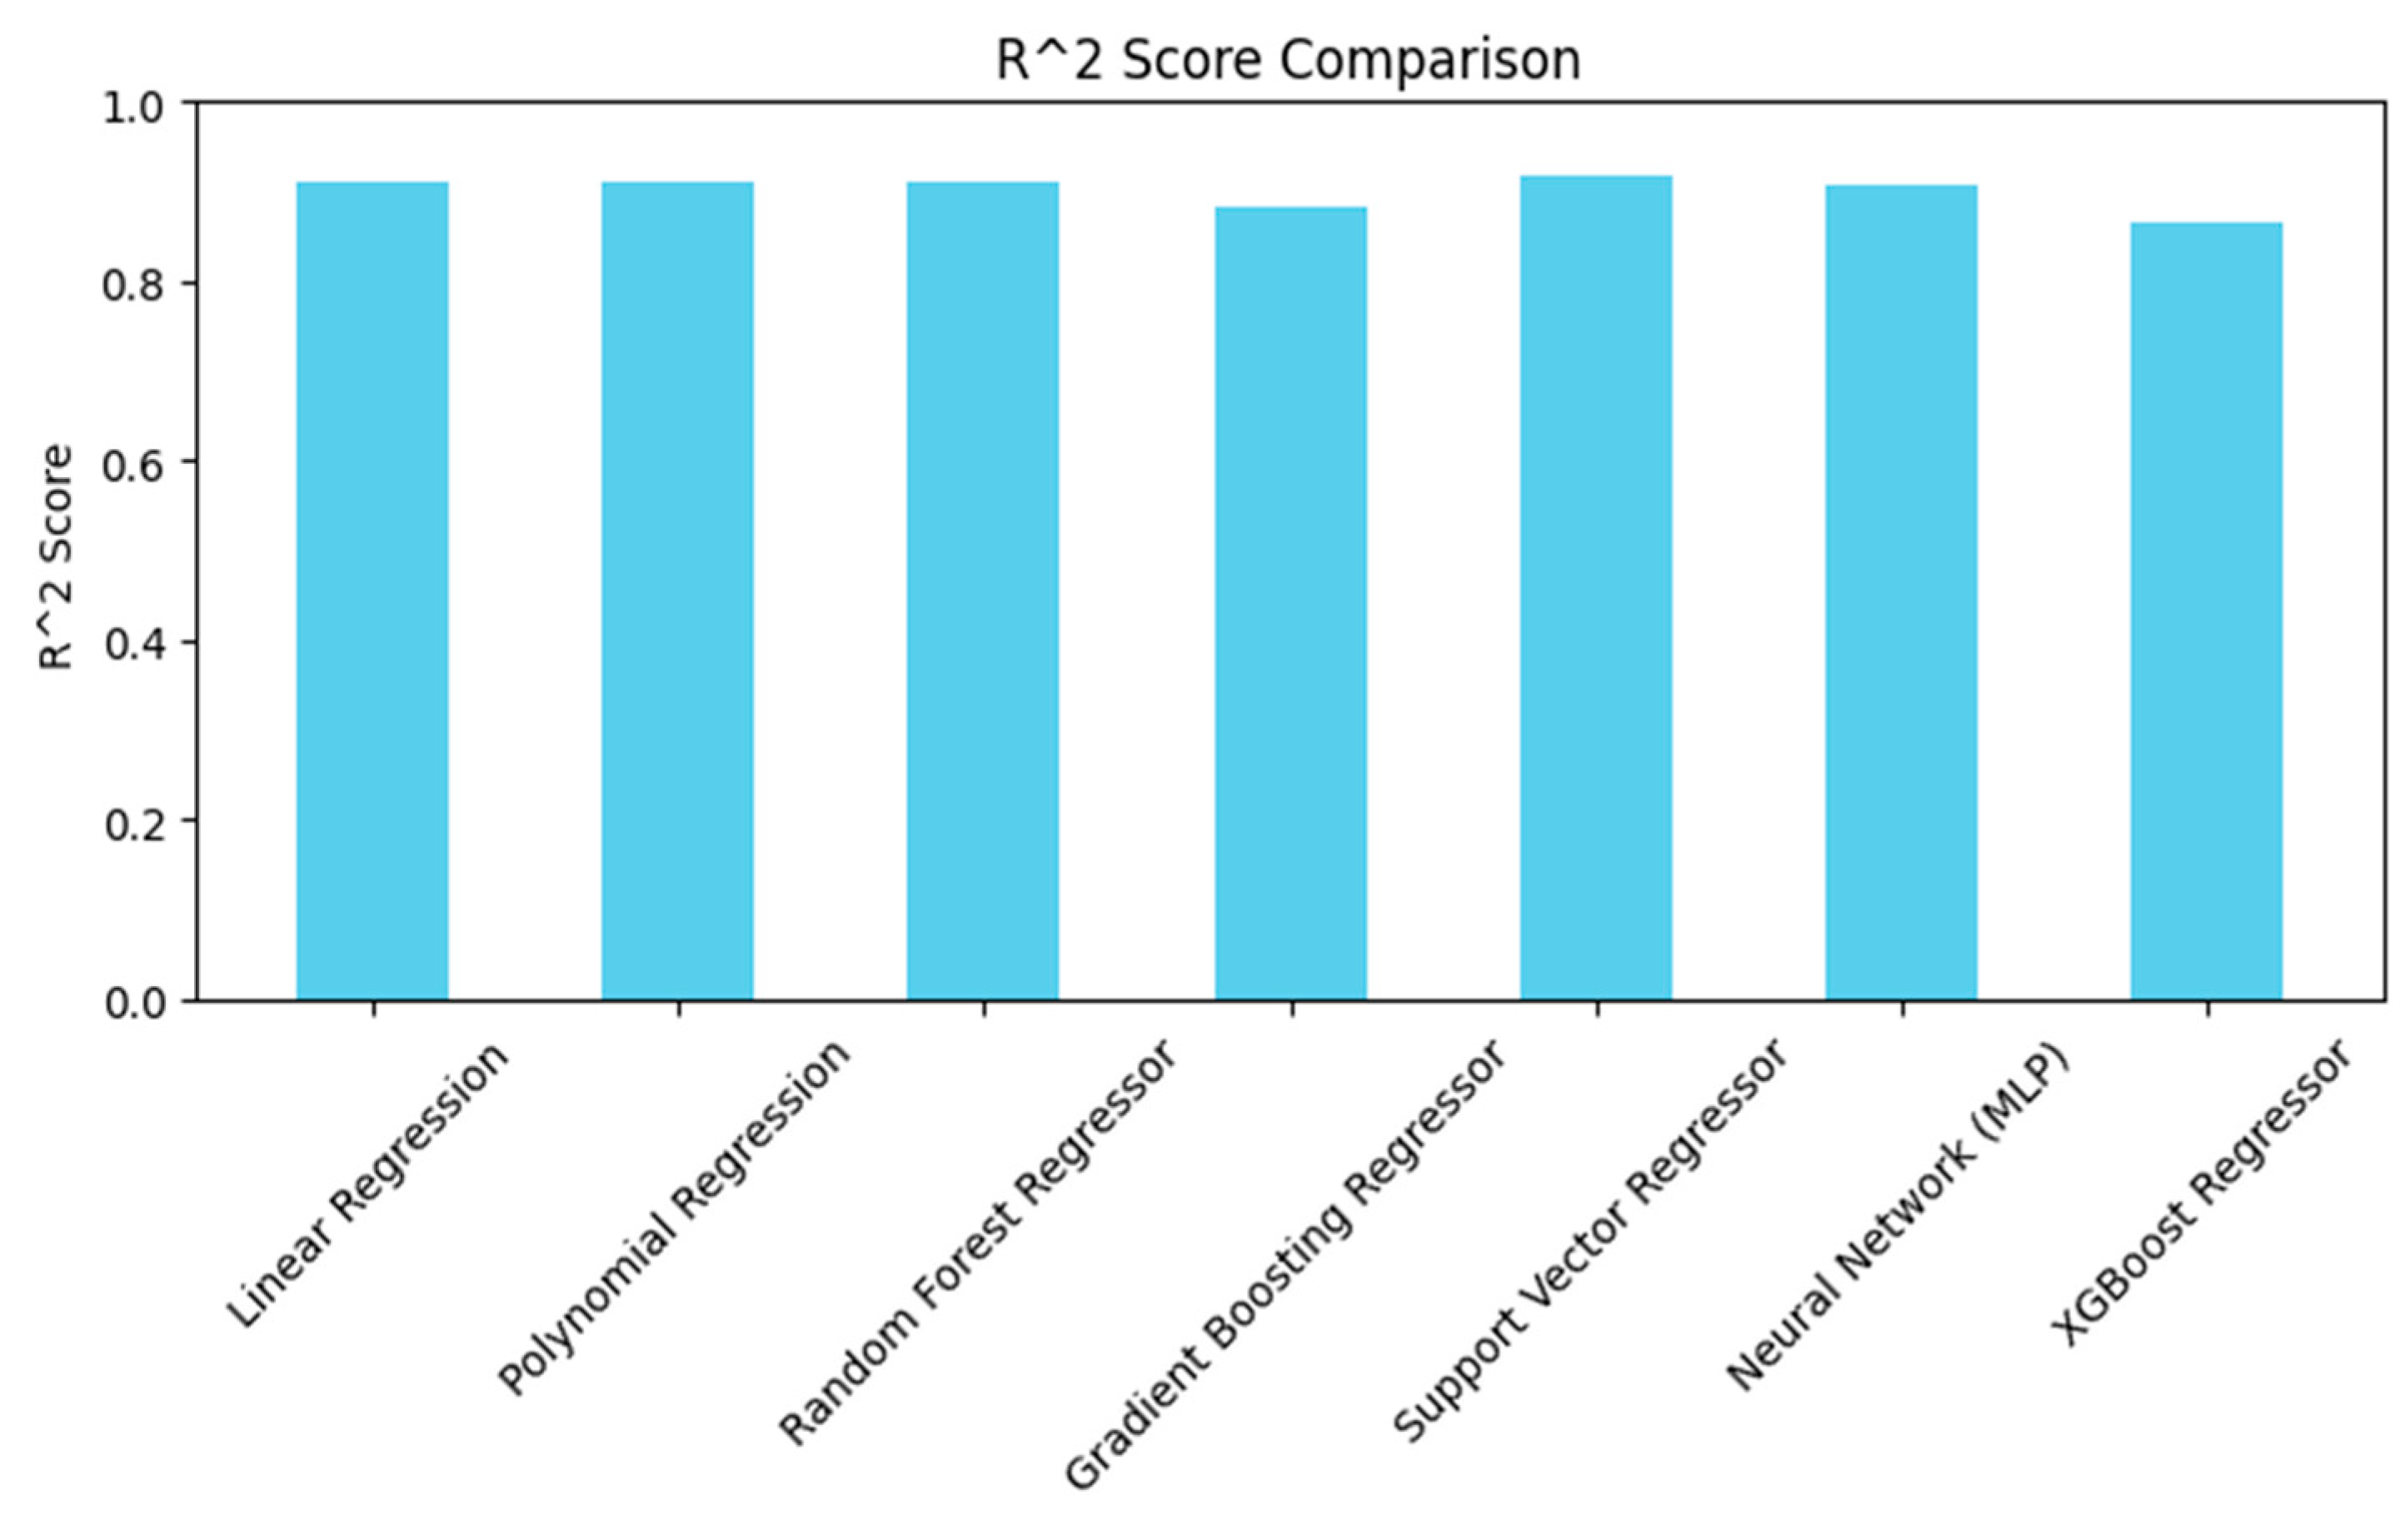
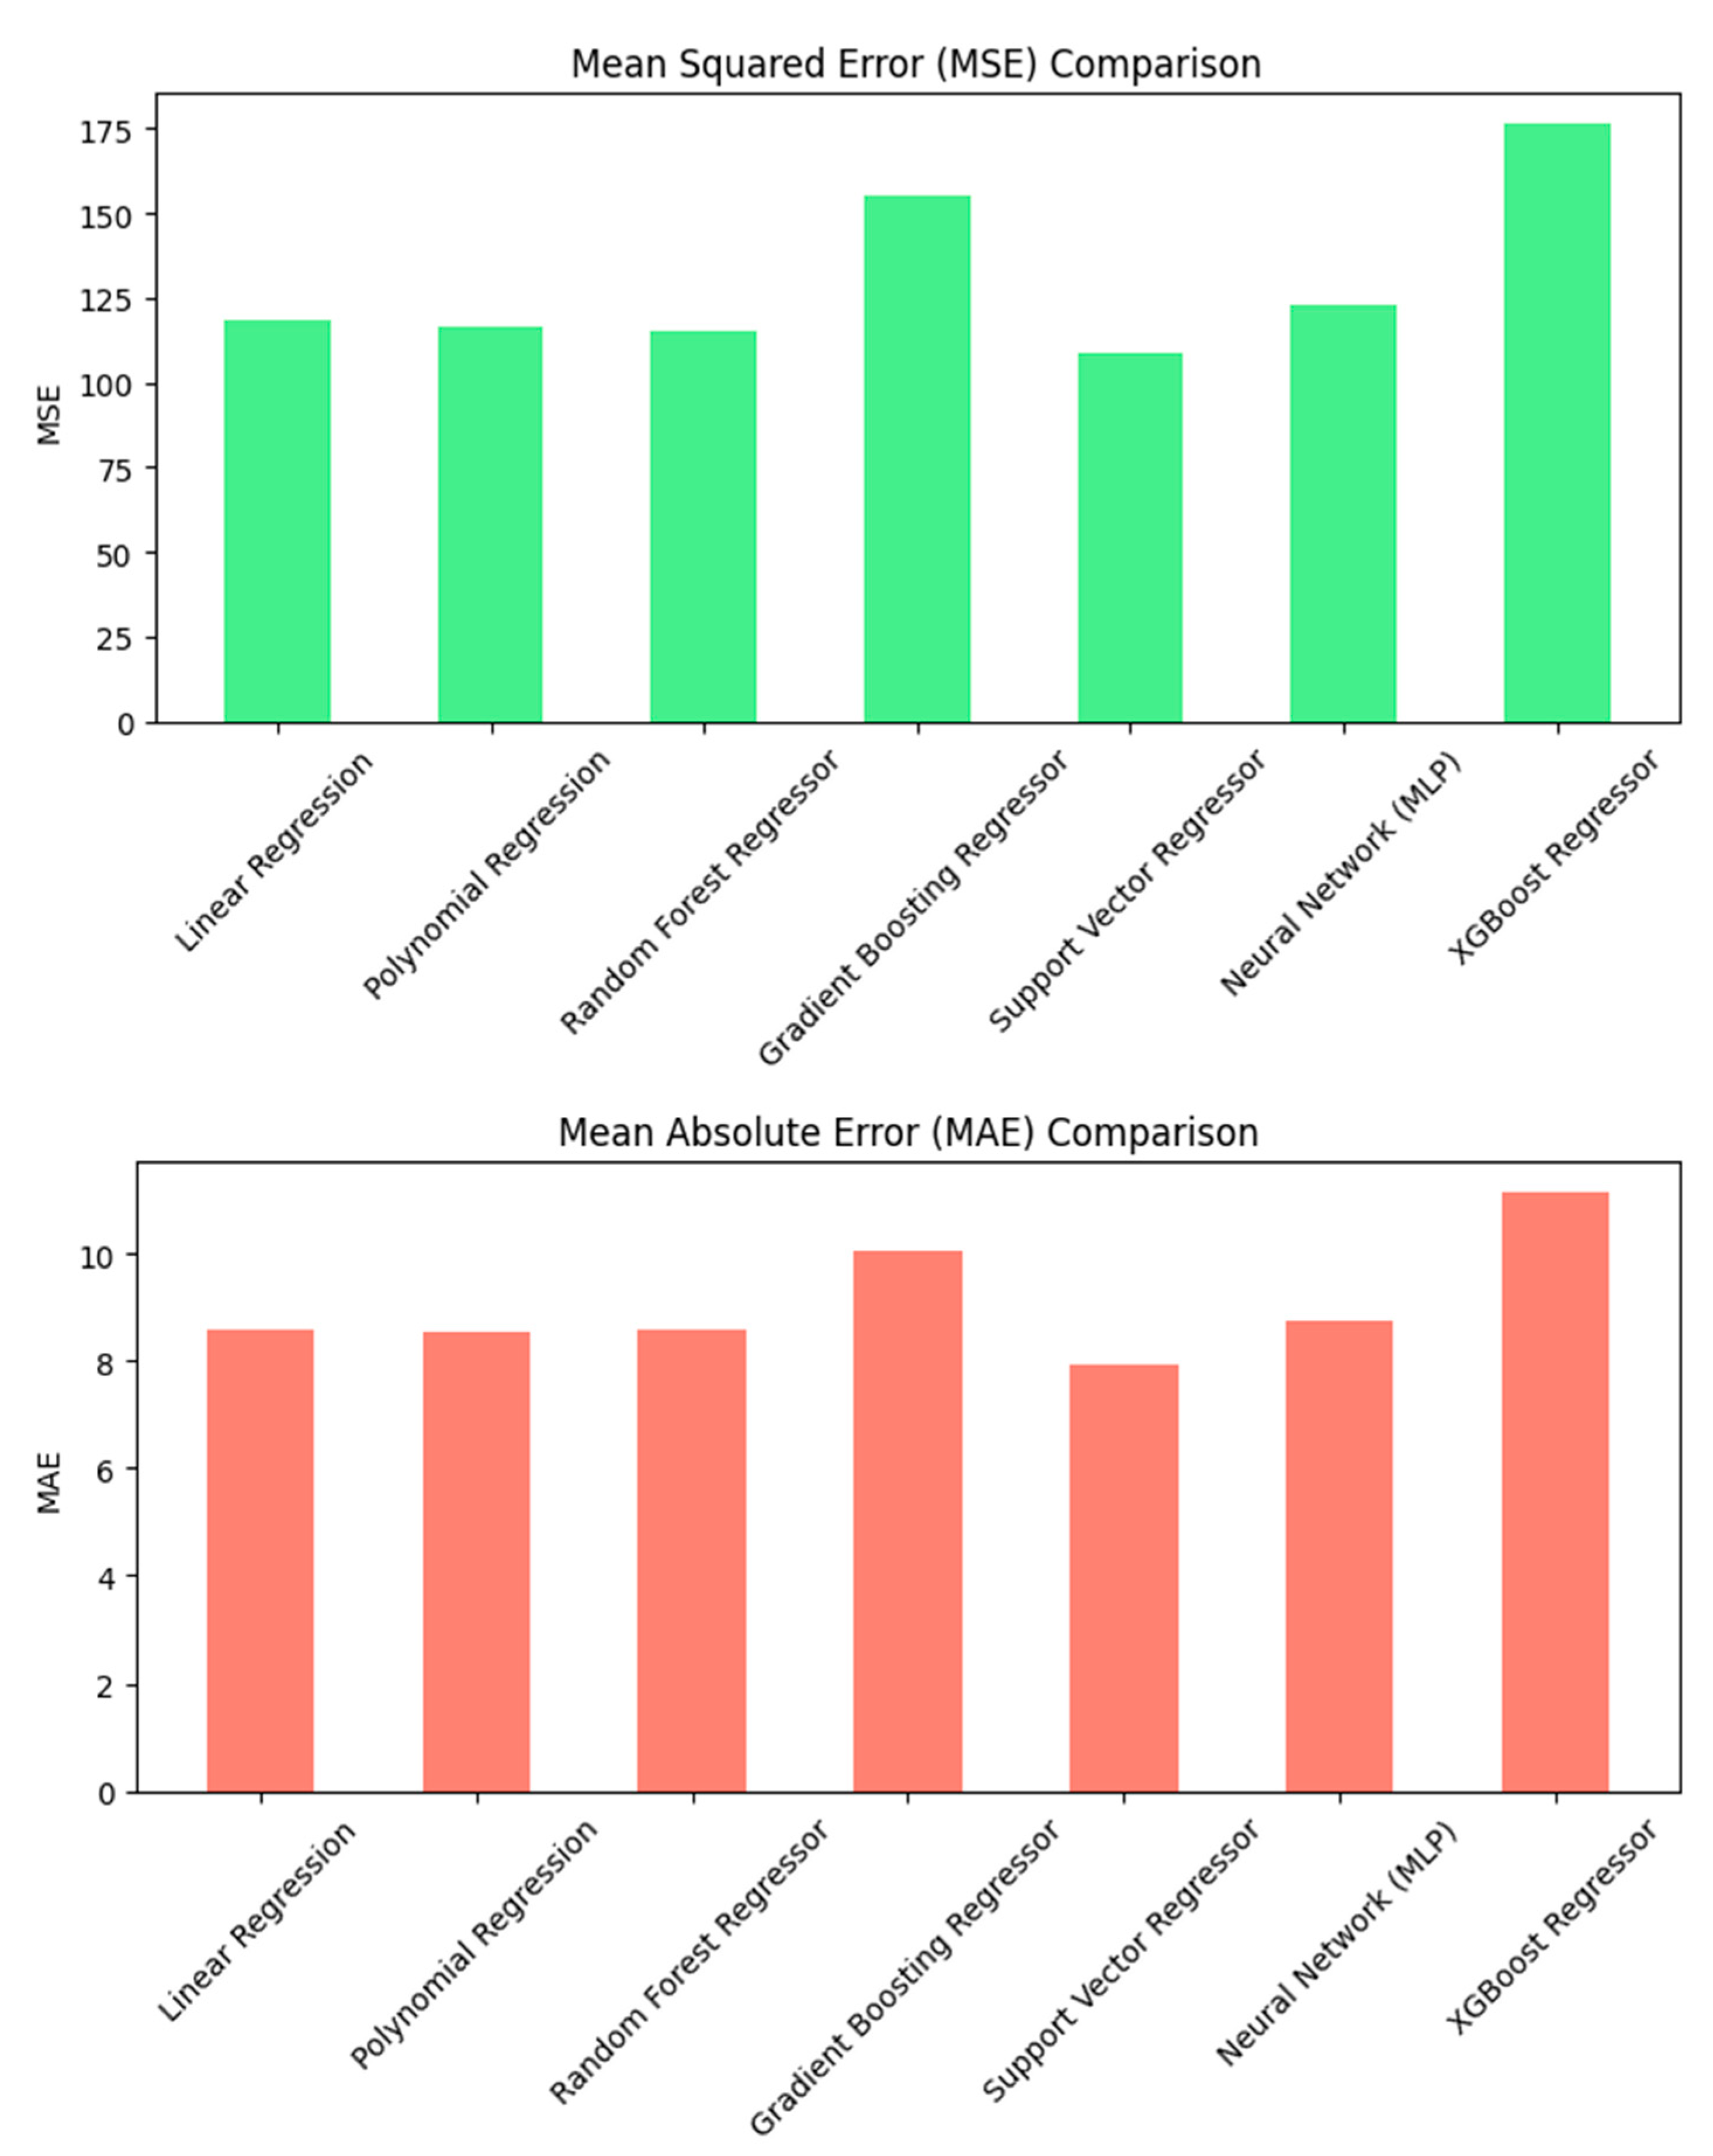
Figure 4 compares the performance of various AI models that use real experimental test results as inputs. The errors shown represent the performance of each model, helping to determine the most accurate one that can best fit this dataset, considering the complex relationship between foamed bitumen parameters. This selection process allows for deeper training on the dataset, which includes experimental tests with varying RAP content (0–100%) and foamed bitumen content (1.5–4%). After training the model, boundary limits were set for RAP and FBC to refine the predictions. The goal is to identify the best-performing model for further refinement and practical application. All models achieved a high R2 above 0.83 with a small mean squared error (MSE) and a mean absolute error (MAE). Based on the metrics, the Random Forest Regressor is the best-performing model. However, in this comparison, it showed a performance similar to that of SVR, but RF performs well with large, high-dimensional datasets and can effectively handle non-linearity, noise, and missing data. Unlike SVR, it is less sensitive to feature scaling.
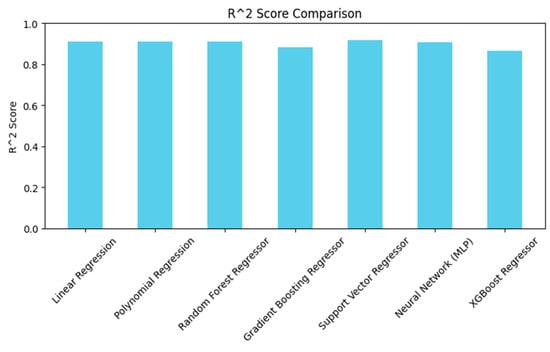

Figure 4.
Comparison of designed models.
4.2. Model Results
The three selected models were designed for deep training on the measured results of HWTT and ITS under both dry and wet conditions, considering variations in FBC, RAP content, and the number of passes (NP). Linear Regression achieved an R2 of 0.85, indicating a good linear relationship between prediction values and measured ones, but its moderate MSE suggested a balance between simplicity and accuracy. Random Forest performed the best with an R2 of 0.91, capturing nonlinear relationships effectively and minimizing errors with the lowest MSE. SVR had an R2 of 0.91, providing a reasonable fit, but its higher MSE showed slightly less accuracy than Random Forest as shown later. The predictions for ITS values (MPa) were made under both wet and dry conditions. The tests were conducted at a temperature of 25 °C, which corresponds to room temperature.
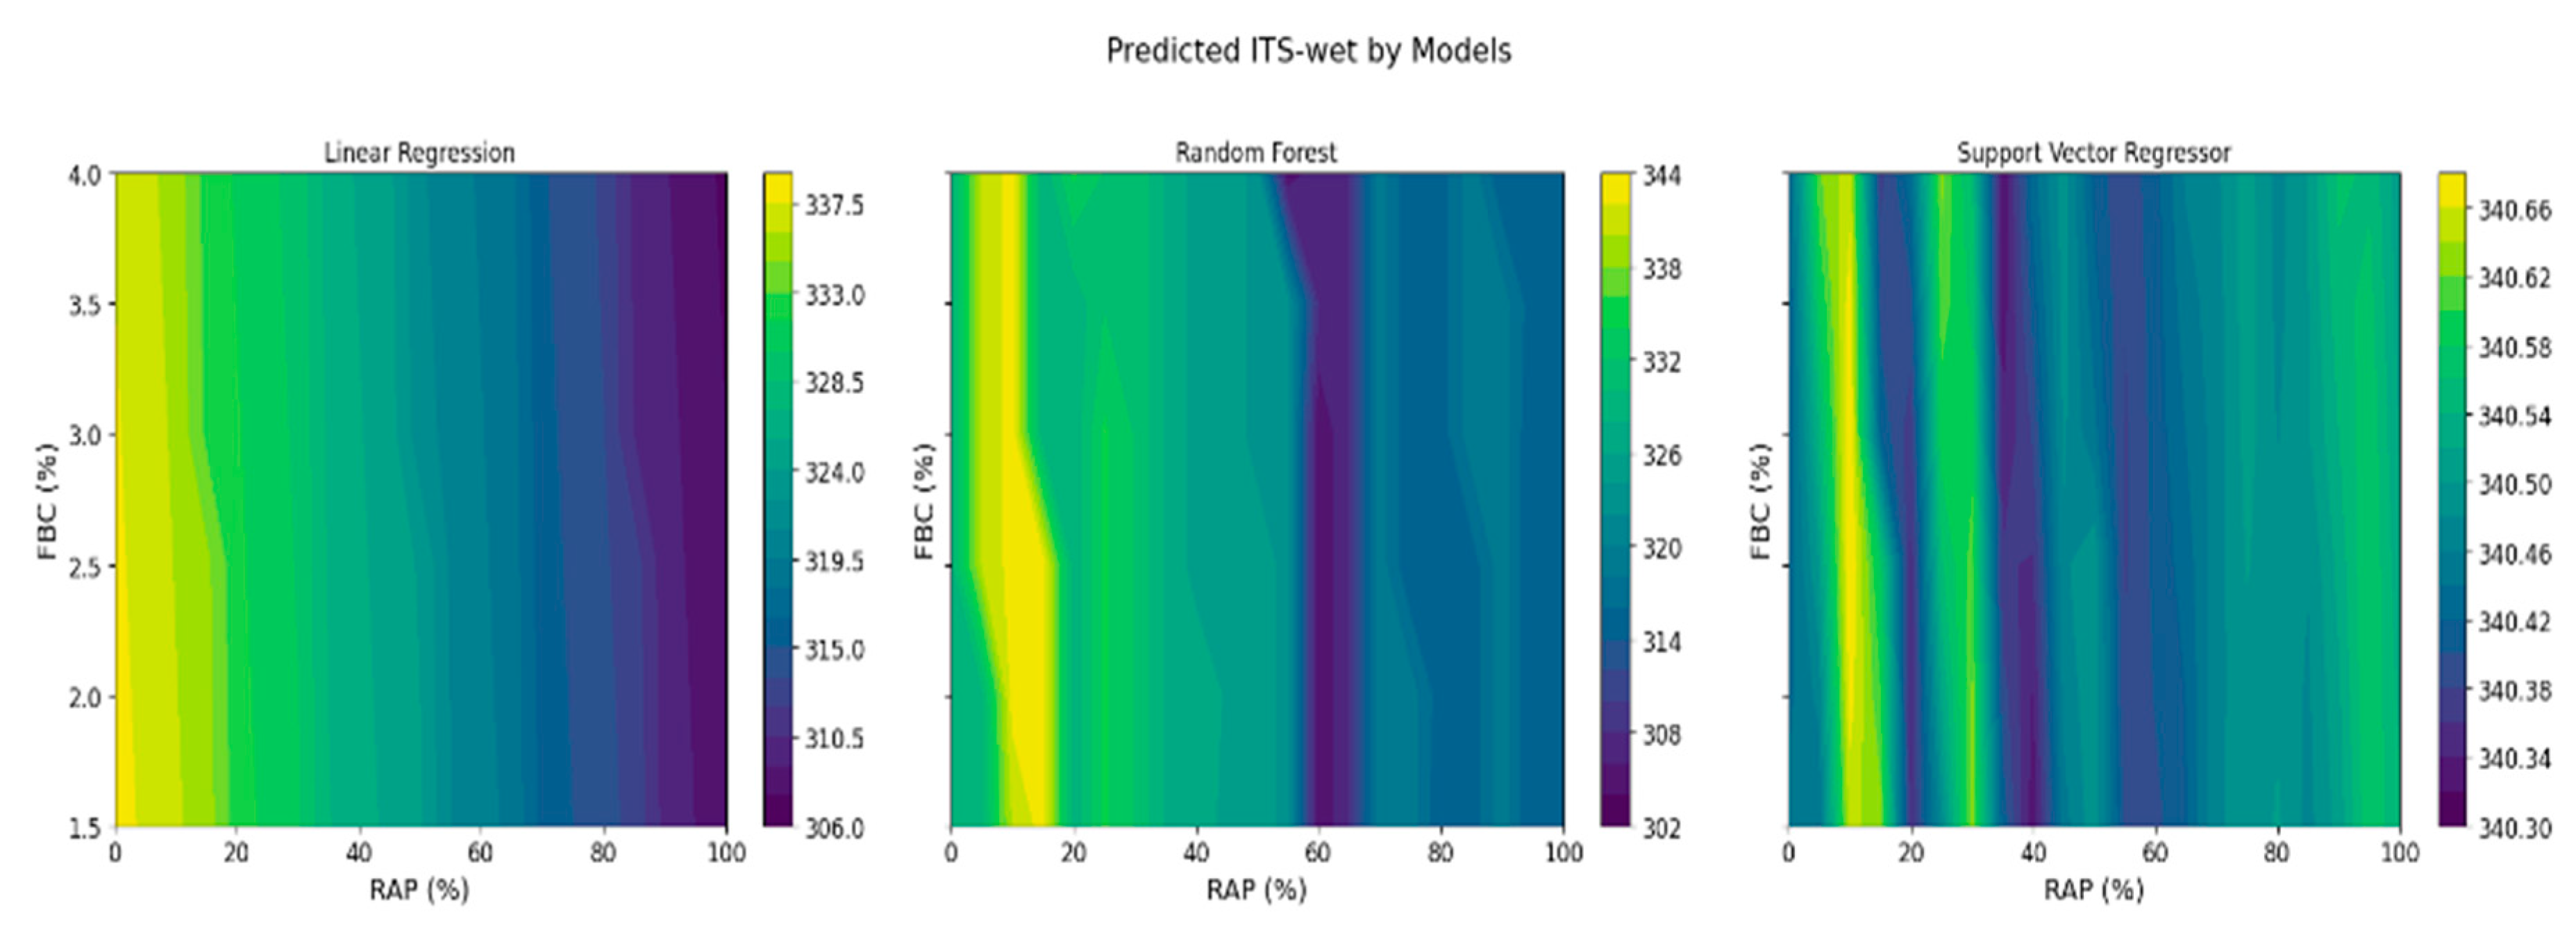
In the analysis of ITS-wet predictions, yellow represents higher predicted ITS values, indicating better tensile strength, while dark blue represents lower predicted ITS values, indicating weaker tensile strength. The optimal configuration for Linear Regression was identified with an FBC ranging from 2.00% to 2.30% and a RAP between 0% and 6%, leading to a predicted ITS of 338.18 MPa. Conversely, Random Forest demonstrated slightly superior performance with an FBC of 1.50% to 1.7% and a RAP of 62% to 68%, resulting in a predicted ITS of 341.67 MPa. Support Vector Regression (SVR) pinpointed its best combination as an FBC of 1.5% to 1.80% and a RAP of 64% to 70%, yielding a predicted ITS of 340.68 MPa, as shown in Figure 5.
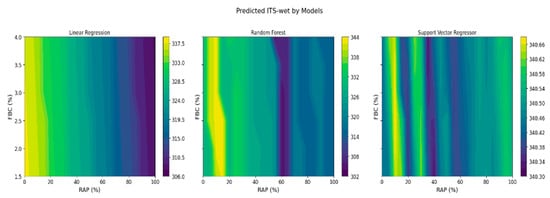
Figure 5.
ITS-wet predictions using three models.
For ITS-dry predictions, the most effective combination for Linear Regression was an FBC of 1.5% to 1.70% with a RAP exceeding 90%, which predicted an ITS of 444.55 MPa. In contrast, Random Forest identified an FBC of 1.50% and a RAP of 64% to 68%, achieving a slightly elevated predicted ITS of 455.46 MPa. SVR also found an optimal combination with an FBC of 1.5% to 1.80% and a RAP of 76% to 80%, resulting in a predicted ITS of 429.80 MPa (Figure 6).
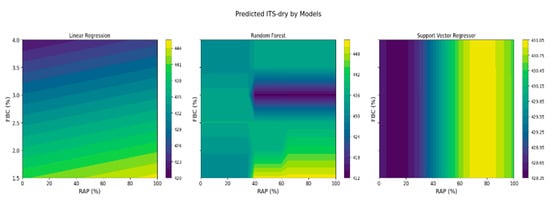
Figure 6.
ITS-dry predictions using three models.
Across both wet and dry conditions, the percentages of FBC and RAP are crucial in determining the mechanical properties of the asphalt mixture. Generally, an increase in RAP tends to reduce the ITS due to the aging and inferior quality of the binder in RAP materials; however, the interplay with FBC alters this dynamic. FBC serves as a binder that enhances the stiffness and performance of the mixture by strengthening the bond between aggregates, especially under dry conditions. The models, especially Random Forest, adeptly capture the intricate nature of these interactions, as Figure 7 and Figure 8 show. The high percentage of RAP with a small one of FBC achieved high ITS results.
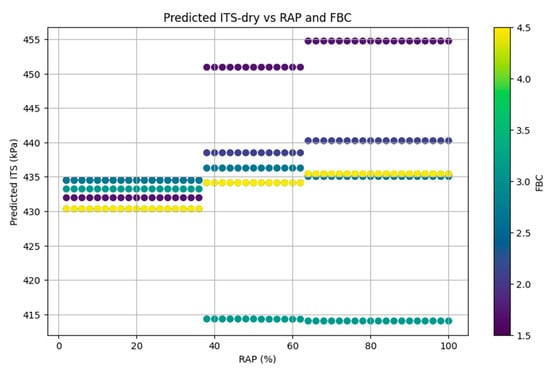
Figure 7.
ITS-dry predictions.
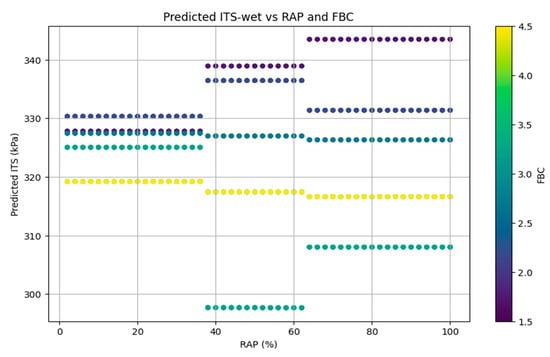
Figure 8.
ITS-wet predictions.
The color variations in the figures allow us to see how the FBC percentage affects the predicted outcomes. Each FBC percentage is represented by five main colors, showing the influence of FBC on the predicted ITS values. For instance, in Figure 7, the yellow color corresponds to FBC at 4.5%, and for RAP in the range of 0% to 36%, the predicted ITS values fall between 430 and 431 MPa. This pattern indicates how varying FBC percentages influence ITS predictions across different RAP dosages.
Additionally, the model predicts ITS values for each RAP percentage in increments of 2%. As a result, within specific RAP dosage intervals, the ITS values remain relatively constant, which is reflected in the horizontal trends in the figures. Therefore, the horizontal data points indicate that ITS does not change significantly over those specific RAP percentages.
Figure 9 illustrates the performance of three models used for HWTT predictions, all achieving a high R2 value exceeding 0.85, alongside low MSE and MAE. Among these models, the Random Forest Regressor stands out as the most effective with an R2 of 0.97, as indicated by the metrics.
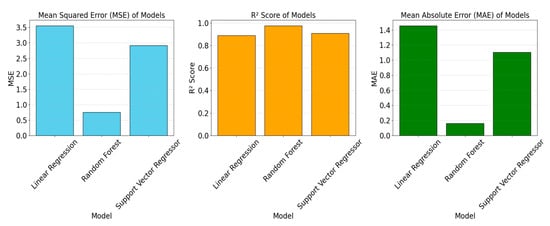
Figure 9.
Performance of the three models.
In the initial phase of HWTT prediction, as Figure 10 shows, the RAP percentages of 25%, 50%, 75%, and 100% reveal a strong correlation between predicted values and actual outcomes. Notably, utilizing 100% of RAP significantly enhances resistance to cracking, which explains the positive effect that as utilizing a high percentage of RAP increases, so does the precision of the predictions.
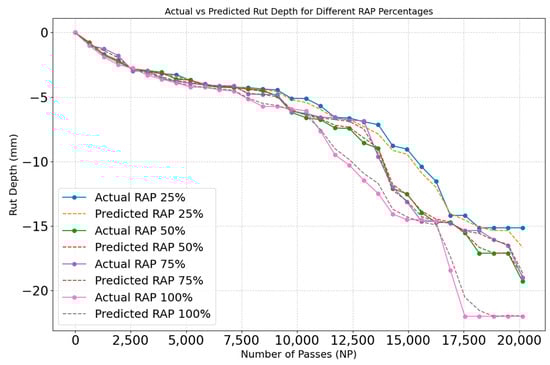
Figure 10.
First stage of HWTT prediction.
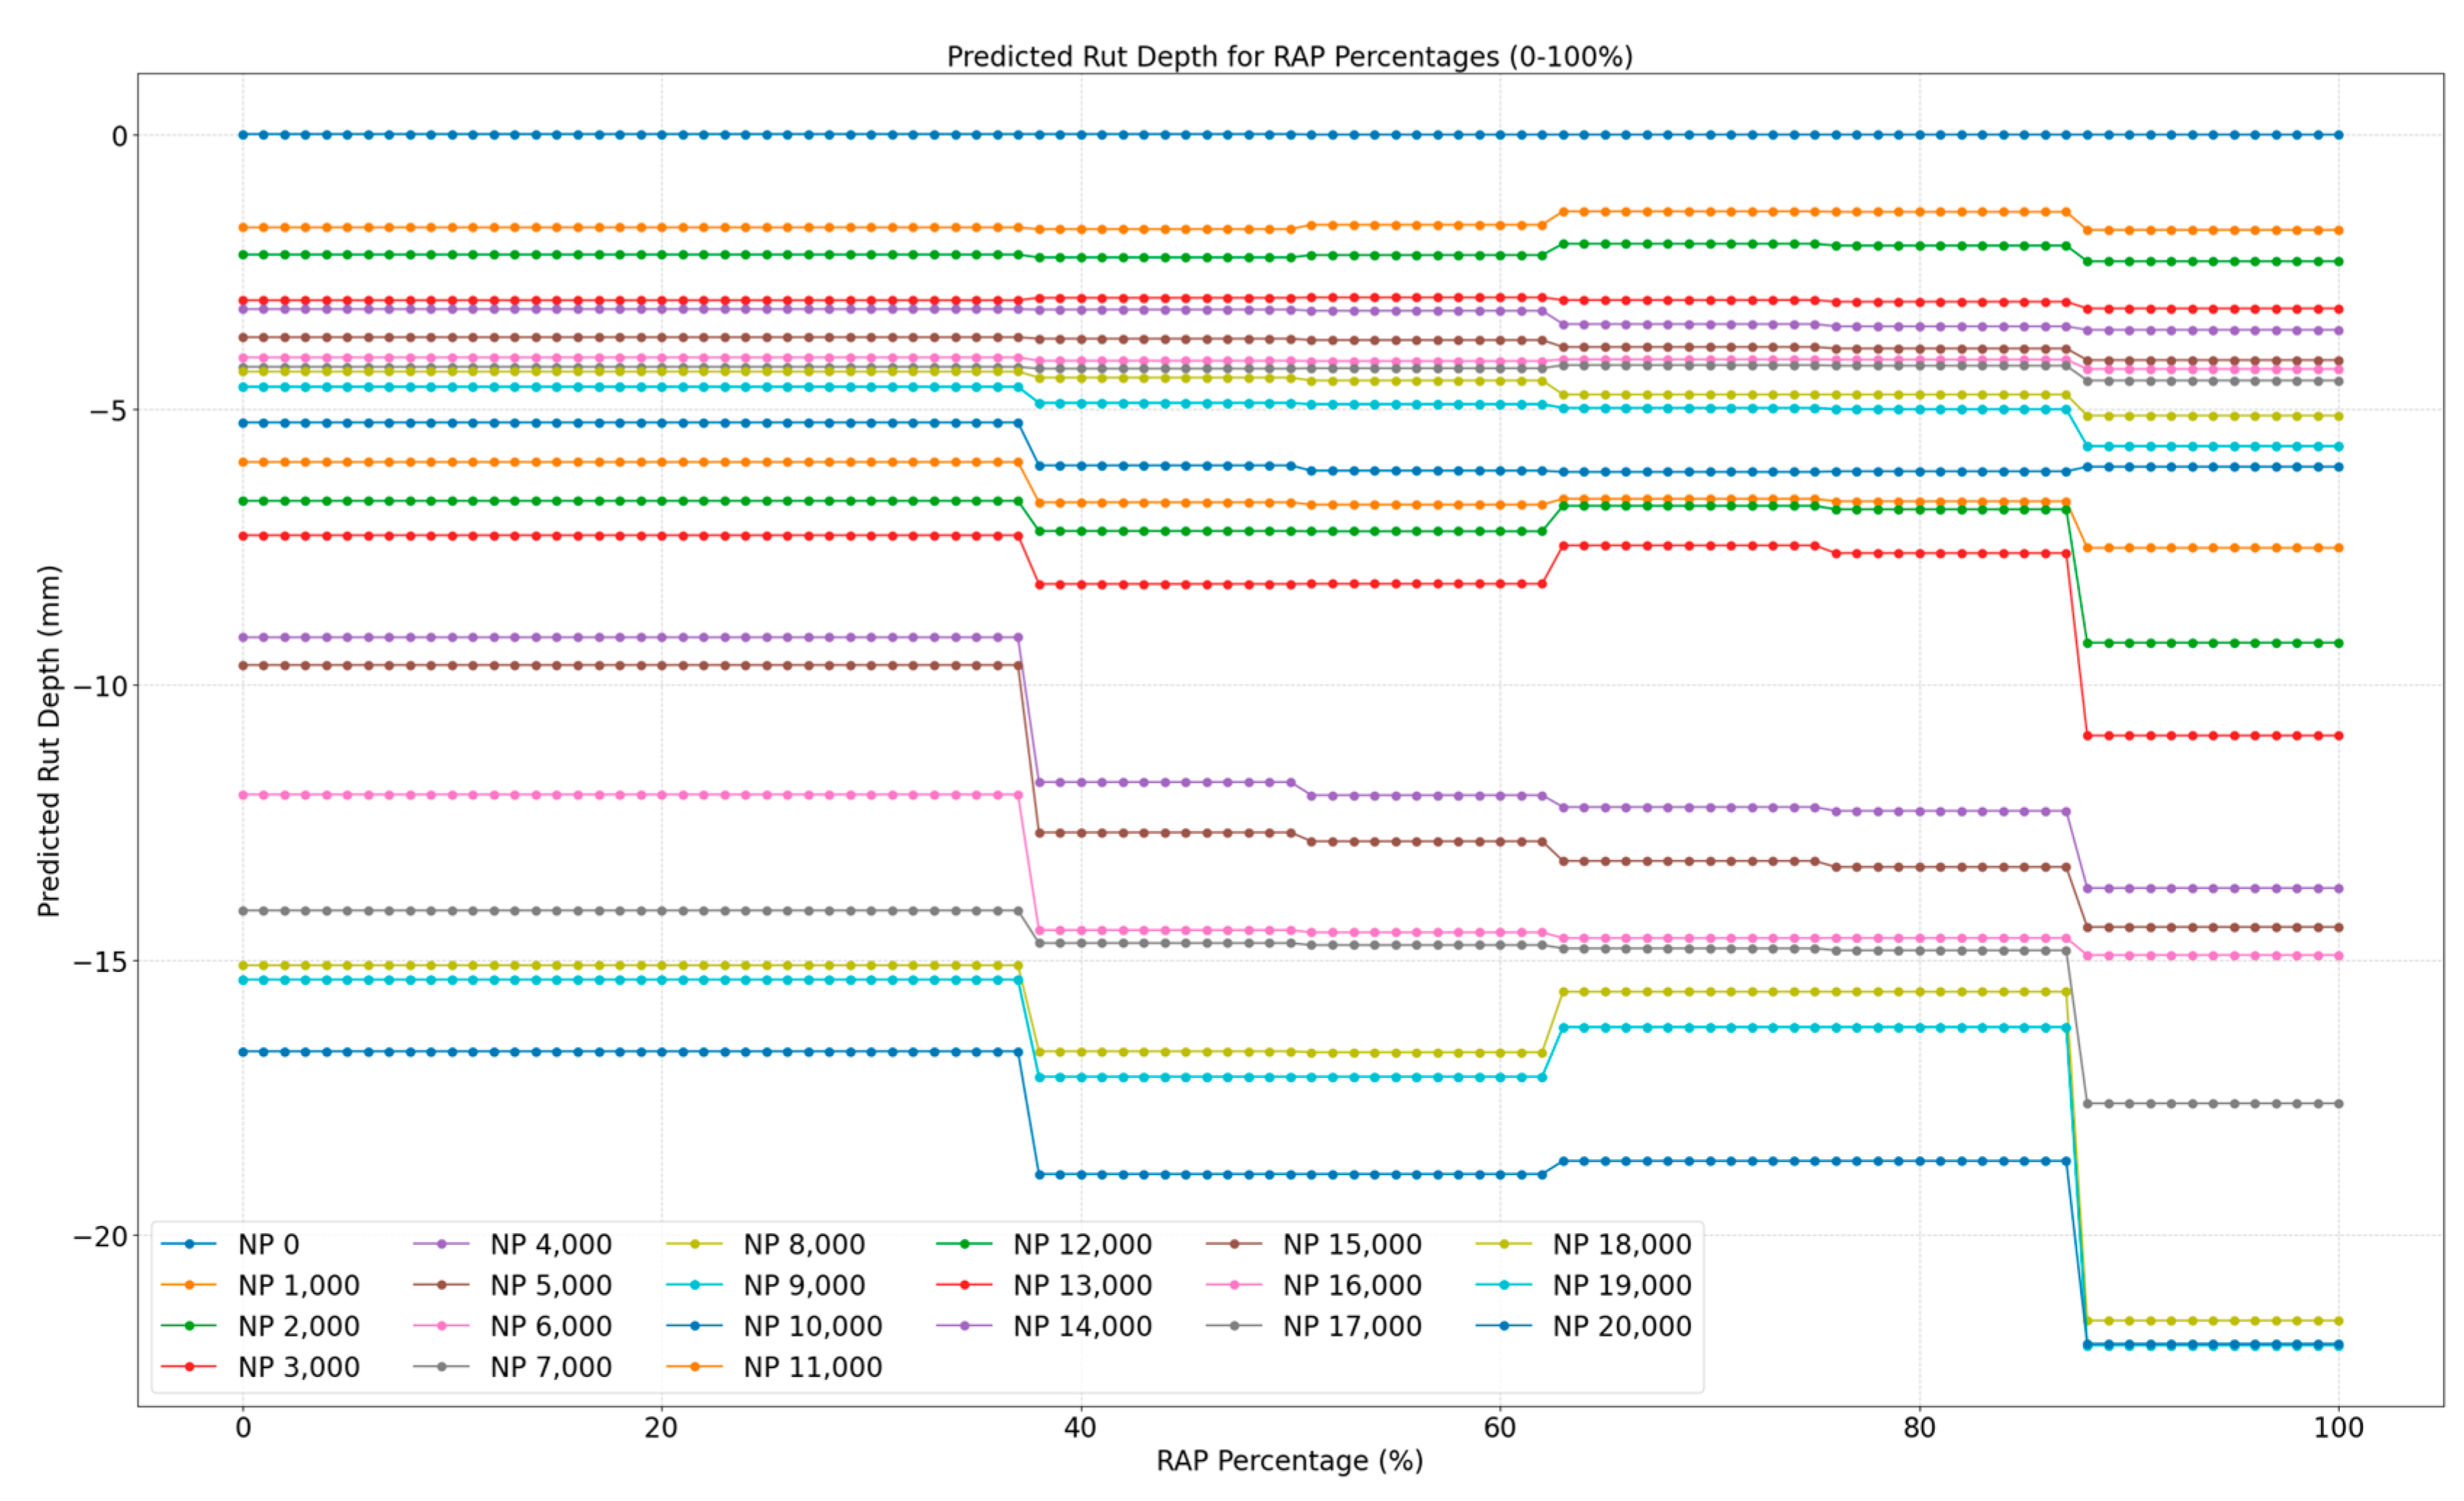
The second stage of prediction, as Figure 11 presents, involved forecasting rut depth after training the model with a 2% increase in RAP and a total of 1000 passes. The results indicated that using 0% to 40% RAP is generally acceptable, as it slightly enhances resistance. In contrast of it, RAP of between 60% and 80% demonstrated a significant improvement in rut depth up under 13,000 passes, after which rut depth increased as the RAP content exceeded 80%. Notably, resistance improved with the use of up to 100% RAP until reaching 11,000 passes, compared to actual rut depth results. This suggests that higher RAP content can enhance rutting resistance under specific conditions, although attention should be given to the 80% to 90% range, which resulted in reduced resistance to cracking.

Figure 11.
The detailed prediction of HWTT.
The findings suggest that optimal RAP usage is crucial for maintaining pavement integrity under varying traffic conditions.
5. Conclusions
This research work clearly identifies the ideal ranges of reclaimed asphalt pavement (RAP) and foamed bitumen content (FBC) that yield optimal performance in asphalt mixtures.
Through rigorous laboratory experiments and advanced AI modeling, it has been determined that a RAP content ranging from 60% to 80%, combined with FBC levels between 1.5% and 1.8%, hits an optimal balance between rutting resistance and tensile strength. Higher RAP percentages surpassing 80% lead to increased stiffness, which negatively influences cracking resistance, while insufficient FBC levels adversely affect both adhesion and cohesion properties. Among the AI models tested, the Random Forest algorithm exhibited the highest predictive accuracy (R2 = 0.91), effectively capturing the complex relationships among RAP, FBC, and performance metrics. The identified optimized combinations significantly improve the durability and sustainability of asphalt pavements, making them suitable for heavy traffic and varied climatic conditions.
Author Contributions
Conceptualization, A.S.; Writing—review & editing, L.G. All authors have read and agreed to the published version of the manuscript.
Funding
This research received no external funding.
Institutional Review Board Statement
Not applicable.
Informed Consent Statement
Not applicable.
Data Availability Statement
The original contributions presented in this study are included in the article. Further inquiries can be directed to the corresponding author.
Conflicts of Interest
The authors declare no conflict of interest.
References
- Sánchez, D.B.; Airey, G.; Caro, S.; Grenfell, J. Effect of foaming technique and mixing temperature on the rheological characteristics of fine RAP-foamed bitumen mixtures. Road Mater. Pavement Des. 2020, 21, 2143–2159. [Google Scholar] [CrossRef]
- Mogawer, W.; Bennert, T.; Daniel, J.S.; Bonaquist, R.; Austerman, A.; Booshehrian, A. Performance characteristics of plant produced high RAP mixtures. Road Mater. Pavement Des. 2012, 13, 183–208. [Google Scholar] [CrossRef]
- Dinis-Almeida, M.; Castro-Gomes, J.; Sangiorgi, C.; Zoorob, S.E.; Afonso, M.L. Performance of Warm Mix Recycled Asphalt containing up to 100% RAP. Constr. Build. Mater. 2016, 112, 1–6. [Google Scholar] [CrossRef]
- Lv, Q.; Huang, W.; Sadek, H.; Xiao, F.; Yan, C. Investigation of the rutting performance of various modified asphalt mixtures using the Hamburg Wheel-Tracking Device test and Multiple Stress Creep Recovery test. Constr. Build. Mater. 2019, 206, 62–70. [Google Scholar]
- Batioja-Alvarez, D.; Lee, J.; Rahbar-Rastegar, R.; Haddock, J.E. Asphalt Mixture Quality Acceptance using the Hamburg Wheel-Tracking Test. Transp. Res. Rec. 2020, 2674, 338–349. [Google Scholar] [CrossRef]
- Zieliński, P. Indirect tensile test as a simple method for rut resistance evaluation of asphalt concrete. Arch. Civ. Eng. 2019, 65, 31–43. [Google Scholar]
- Nazemi, M.; Heidaripanah, A. Support vector machine to predict the indirect tensile strength of foamed bitumen-stabilised base course materials. Road Mater. Pavement Des. 2016, 17, 768–778. [Google Scholar]
- Daneshvar, D.; Behnood, A. Estimation of the dynamic modulus of asphalt concretes using random forests algorithm. Int. J. Pavement Eng. 2022, 23, 250–260. [Google Scholar]
- Miani, M.; Dunnhofer, M.; Rondinella, F.; Manthos, E.; Valentin, J.; Micheloni, C.; Baldo, N. Bituminous mixtures experimental data modeling using a hyperparameters-optimized machine learning approach. Appl. Sci. 2021, 11, 11710. [Google Scholar] [CrossRef]
- Wang, A.L.; Fu, Z.S.; Liu, F.M. Asphalt foaming quality control model using neural network and parameters optimization. Int. J. Pavement Res. Technol. 2018, 11, 401–407. [Google Scholar]
- SIST-EN-933–1; Tests for Geometrical Properties of Aggregates—Part 1: Determination of Particle Size Distribution—Sieving Method. European Commision: Brussels, Belgium, 2012.
- SIST-EN-13043; Aggregates for Bituminous Mixtures and Surface Treatments for Roads, Airfields and Other Trafficked Areas. European Commision: Brussels, Belgium, 2002.
- SIST-EN-12697–1; Bituminous Mixtures—Test Methods—Part 1: Soluble Binder Content. European Commision: Brussels, Belgium, 2020.
- SIST-EN-1426; Bitumen and Bituminous Binders—Determination of Needle Penetration. European Commision: Brussels, Belgium, 2015.
- SIST EN 1427; Bitumen and Bituminous Binders—Determination of the Softening Point—Ring and Ball Method. European Commision: Brussels, Belgium, 2015. Available online: https://standards.iteh.ai/catalog/standards/sist/b3b509ac-bcc8-4914-a440- (accessed on 27 March 2025).
- SIST EN 13302; Bitumen and Bituminous Binders—Determination of Dynamic Viscosity of Bituminous Binder Using a Rotating Spindle Apparatus. European Commision: Brussels, Belgium, 2018.
- SIST EN 12591; Bitumen and Bituminous Binders-Specifications for Paving Grade Bitumens. European Commision: Brussels, Belgium, 2009.
- SIST-EN-ISO-2592; Petroleum and Related Products—Determination of Flash and Fire Points—Cleveland Open Cup Method. European Commision: Brussels, Belgium, 2017.
- SIST-EN-12697–30; Bituminous Mixtures—Test Methods—Part 30: Specimen Preparation by Impact Compactor. European Commision: Brussels, Belgium, 2019.
- Liu, J.; Cheng, C.; Zheng, C.; Wang, X.; Wang, L. Rutting prediction using deep learning for time series modeling and K-means clustering based on RIOHTrack data. Constr. Build. Mater. 2023, 385, 131515. [Google Scholar] [CrossRef]
- AASHTO T324-19; Standard Method of Test for Hamburg Wheel-Track Testing of Compacted Hot Mix Asphalt (HMA). AASHTO: Washington, DC, USA, 2019.
- SIST-EN-12697–12; Bituminous Mixtures—Test Methods—Part 12: Determination of the Water Sensitivity of Bituminous Specimens. European Commision: Brussels, Belgium, 2018.
- Buczyński, P.; Iwański, M.; Krasowski, J. Assessment of the impact of hydraulic binder on the properties of the cold recycled mixture with foamed bitumen and bitumen emulsion: Field tests. Buildings 2020, 10, 223. [Google Scholar] [CrossRef]
- Zieliński, P. Indirect tensile test as a simple method for rut resistance evaluation of asphalt mixtures–Polish experience. Road Mater. Pavement Des. 2022, 23, 112–128. [Google Scholar] [CrossRef]
- SIST-EN-12697–23; Bituminous Mixtures—Test Methods—Part 23: Determination of the Indirect Tensile Strength of Bituminous Specimens. European Commision: Brussels, Belgium, 2018.
- Godenzoni, C.; Graziani, A.; Perraton, D. Complex modulus characterisation of cold-recycled mixtures with foamed bitumen and different contents of reclaimed asphalt. Road Mater. Pavement Design 2017, 18, 130–150. [Google Scholar] [CrossRef]
- Mazari, M.; Rodriguez, D.D. Prediction of pavement roughness using a hybrid gene expression programming-neural network technique. J. Traffic Transp. Eng. 2016, 3, 448–455. [Google Scholar] [CrossRef]
- Ly, H.B.; Nguyen, M.H.; Pham, B.T. Metaheuristic optimization of Levenberg–Marquardt-based artificial neural network using particle swarm optimization for prediction of foamed concrete compressive strength. Neural Comput. Appl. 2021, 33, 17331–17351. [Google Scholar] [CrossRef]
- Ghanizadeh, A.R.; Fakhri, M. Prediction of frequency for simulation of asphalt mix fatigue tests using MARS and ANN. Sci. World J. 2014, 2014, 515467. [Google Scholar] [CrossRef]
- Ziari, H.; Maghrebi, M.; Ayoubinejad, J.; Waller, S.T. Prediction of pavement performance: Application of support vector regression with different kernels. Transp. Res. Rec. 2016, 2589, 135–145. [Google Scholar] [CrossRef]
- Maalouf, M.; Khoury, N.; Trafalis, T.B. Support vector regression to predict asphalt mix performance. Int. J. Numer. Anal. Methods Geomech. 2008, 32, 1989–1996. [Google Scholar] [CrossRef]
- Pham, B.T.; Bui, D.T.; Dholakia, M.B.; Prakash, I.; Pham, H.V. A Comparative Study of Least Square Support Vector Machines and Multiclass Alternating Decision Trees for Spatial Prediction of Rainfall-Induced Landslides in a Tropical Cyclones Area. Geotech. Geol. Eng. 2016, 34, 1807–1824. [Google Scholar] [CrossRef]
- Gong, H.; Sun, Y.; Shu, X.; Huang, B. Use of random forests regression for predicting IRI of asphalt pavements. Constr. Build. Mater. 2018, 189, 890–897. [Google Scholar] [CrossRef]
- Gong, H.; Sun, Y.; Hu, W.; Polaczyk, P.A.; Huang, B. Investigating impacts of asphalt mixture properties on pavement performance using LTPP data through random forests. Constr. Build. Mater. 2019, 204, 203–212. [Google Scholar] [CrossRef]
- Cao, S.; Li, P.; Nan, X.; Yi, Z.; Sun, M. Optimization of Aggregate Characteristic Parameters for Asphalt Binder—Aggregate System under Moisture Susceptibility Condition Based on Random Forest Analysis Model. Appl. Sci. 2023, 13, 4732. [Google Scholar] [CrossRef]
- Zhan, Y.; Li, J.Q.; Liu, C.; Wang, K.C.P.; Pittenger, D.M.; Musharraf, Z. Effect of aggregate properties on asphalt pavement friction based on random forest analysis. Constr. Build. Mater. 2021, 292, 123467. [Google Scholar]

Disclaimer/Publisher’s Note: The statements, opinions and data contained in all publications are solely those of the individual author(s) and contributor(s) and not of MDPI and/or the editor(s). MDPI and/or the editor(s) disclaim responsibility for any injury to people or property resulting from any ideas, methods, instructions or products referred to in the content. |
© 2025 by the authors. Licensee MDPI, Basel, Switzerland. This article is an open access article distributed under the terms and conditions of the Creative Commons Attribution (CC BY) license (https://creativecommons.org/licenses/by/4.0/).