


Correlation Between Leg Length and Physical Performance According to Sports Characteristics of Well-Trained Athletes

Abstract
:1. Introduction
2. Materials and Methods
2.1. Participants
2.2. Procedures
2.2.1. Body Composition and Anthropometric Measurements (Femur and Tibia Length)
2.2.2. Basic Physical Performance Assessments
2.2.3. Anaerobic Test
2.3. Statistical Analysis
3. Results
4. Discussion
5. Conclusions
Author Contributions
Funding
Institutional Review Board Statement
Informed Consent Statement
Data Availability Statement
Conflicts of Interest
References
- Winter, E.M.; Hamley, E.J. Sub maximal oxygen uptake related to fat free mass and lean leg volume in trained runners. Br. J. Sports Med. 1976, 10, 223–225. [Google Scholar] [PubMed]
- Knechtle, B.; Knechtle, P.; Schulze, I.; Kohler, G. Upper arm circumference is associated with race performance in ultra-endurance runners. Br. J. Sports Med. 2008, 42, 295–299. [Google Scholar] [PubMed]
- Arrese, A.L.; Ostáriz, E.S. Skinfold thicknesses associated with distance running performance in highly trained runners. J. Sports Sci. 2006, 24, 69–76. [Google Scholar]
- Kong, P.W.; De Heer, H. Anthropometric, gait and strength characteristics of Kenyan distance runners. J. Sports Sci. Med. 2008, 7, 499. [Google Scholar]
- Cavanagh, P.R.; Kram, R. Stride length in distance running: Velocity, body dimensions, and added mass effects. Med. Sci. Sports Exerc. 1989, 21, 467–479. [Google Scholar] [PubMed]
- Mooses, M.; Mooses, K.; Haile, D.W.; Durussel, J.; Kaasik, P.; Pitsiladis, Y.P. Dissociation between running economy and running performance in elite Kenyan distance runners. J. Sports Sci. 2015, 33, 136–144. [Google Scholar] [PubMed]
- Rahmani, A.; Locatelli, E.; Lacour, J.R. Differences in morphology and force/velocity relationship between Senegalese and Italian sprinters. Eur. J. Appl. Physiol. 2004, 91, 399–405. [Google Scholar]
- Laumets, R.; Viigipuu, K.; Mooses, K.; Mäestu, J.; Purge, P.; Pehme, A.; Mooses, M. Lower leg length is associated with running economy in high level Caucasian distance runners. J. Hum. Kinet. 2017, 56, 229. [Google Scholar]
- Van Wouwe, T.; Hicks, J.; Delp, S.; Liu, K.C. A simulation framework to determine optimal strength training and musculoskeletal geometry for sprinting and distance running. PLoS Comput. Biol. 2024, 20, e1011410. [Google Scholar]
- Paruzel-Dyja, M.; Walaszczyk, A.; Iskra, J. Elite male and female sprinters’ body build, stride length and stride frequency. Stud. Phys. Cult. Tour. 2006, 13, 33–37. [Google Scholar]
- Mackala, K. Optimisation of performance through kinematic analysis of the different phases of the 100 metres. New Stud. Athlet. 2007, 22, 7–16. [Google Scholar]
- Nasrulloh, A.; Deviana, P.; Yuniana, R.; Pratama, K.W. The Effect of Squat Training and Leg Length in Increasing the Leg Power of Volleyball Extracurricular Participants. Phys. Educ. Theory Methodol. 2021, 21, 244–252. [Google Scholar] [CrossRef]
- Bakti, A.P.; Kusnanik, N.W.; Wahjuni, E.S.; Firmansyah, A.; Susanto, I.H.; Abdil, L. The Correlation of Leg Length, Jump Height, and Leg Muscle Explosive Power Toward Sprint Ability. Retos 2024, 51, 1463–1468. [Google Scholar] [CrossRef]
- Foster, C.; Lucia, A. Running economy: The forgotten factor in elite performance. Sports Med. 2007, 37, 316–319. [Google Scholar] [CrossRef] [PubMed]
- Tomita, D.; Suga, T.; Terada, M.; Tanaka, T.; Miyake, Y.; Ueno, H.; Otsuka, M.; Nagano, A.; Isaka, T. Relationship between leg bone length and sprint performance in sprinters; Are there any event-related differences in 100-m and 400-m sprints? BMC Res. Notes 2020, 13, 297. [Google Scholar] [CrossRef] [PubMed]
- Ueno, H.; Suga, T.; Takao, K.; Miyake, Y.; Terada, M.; Nagano, A.; Isaka, T. The potential relationship between leg bone length and running performance in well-trained endurance runners. J. Hum. Kinet. 2019, 70, 165–172. [Google Scholar] [CrossRef]
- Pelliccia, A.; Fagard, R.; Bjørnstad, H.H.; Anastassakis, A.; Arbustini, E. Recommendations for competitive sports participation in athletes with cardiovascular disease. Eur. Heart J. 2005, 26, 1422–1445. [Google Scholar] [CrossRef]
- Mitchell, J.H.; Haskell, W.L.; Raven, P.B. Classification of sports. J. Am. Coll. Cardiol. 1994, 24, 864–866. [Google Scholar] [CrossRef]
- Krishnan, A.; Sharma, D.; Bhatt, M.; Dixit, A.; Pradeep, P. Comparison between Standing Broad Jump test and Wingate test for assessing lower limb anaerobic power in elite sportsmen. Med. J. Armed Forces India 2017, 73, 140–145. [Google Scholar] [CrossRef]
- El-gohary, T.M.; Al-Shenqiti, A.M.; Ibrahim, M.I.; Eweda, R.S.; Emara, H.A.; Ibrahim, S.R. Exploring physical performance using basic fitness test among adolescent athletes. Int. J. Health Rehabil. Sci. 2019, 8, 1–12. [Google Scholar] [CrossRef]
- Wilderman, D.R.; Ross, S.E.; Padua, D.A. Thigh muscle activity, knee motion, and impact force during side-step pivoting in agility-trained female basketball players. J. Athl. Train. 2009, 44, 14–25. [Google Scholar] [PubMed]
- St Clair Gibson, A.; Broomhead, S.; Lambert, M.I.; Hawley, J.A. Prediction of maximal oxygen uptake from a 20-m shuttle run as measured directly in runners and squash players. J. Sports Sci. 1998, 16, 331–335. [Google Scholar]
- Muyor, J.M.; Vaquero-Cristóbal, R.; Alacid, F.; López-Miñarro, P.A. Criterion-related validity of sit-and-reach and toe-touch tests as a measure of hamstring extensibility in athletes. J. Strength. Cond. Res. 2014, 28, 546–555. [Google Scholar]
- Tsuji, S.; Tsunoda, N.; Yata, H.; Katsukawa, F.; Onishi, S.; Yamazaki, H. Relation between grip strength and radial bone mineral density in young athletes. Arch. Phys. Med. Rehabil. 1995, 76, 234–238. [Google Scholar] [CrossRef]
- Castañeda-Babarro, A. The wingate anaerobic test, a narrative review of the protocol variables that affect the results obtained. Appl. Sci. 2021, 11, 7417. [Google Scholar] [CrossRef]
- Minahan, C.; Chia, M.; Inbar, O. Does power indicate capacity? 30-s Wingate anaerobic test vs. maximal accumulated O2 deficit. Int. J. Sports Med. 2007, 28, 836–843. [Google Scholar] [CrossRef]
- Fudge, B.W.; Westerterp, K.R.; Kiplamai, F.K.; Onywera, V.O.; Boit, M.K.; Kayser, B.; Pitsiladis, Y.P. Evidence of negative energy balance using doubly labelled water in elite Kenyan endurance runners prior to competition. Br. J. Nutr. 2006, 95, 59–66. [Google Scholar] [PubMed]
- Marino, F.E.; Lambert, M.I.; Noakes, T.D. Superior performance of African runners in warm humid but not in cool environmental conditions. J. Appl. Physiol. 2004, 96, 124–130. [Google Scholar]
- Prommer, N.; Thoma, S.; Quecke, L.; Gutekunst, T.; Völzke, C.; Wachsmuth, N.; Schmidt, W. Total hemoglobin mass and blood volume of elite Kenyan runners. Med. Sci. Sports Exerc. 2010, 42, 791–797. [Google Scholar]
- Vernillo, G.; Schena, F.; Berardelli, C.; Rosa, G.; Galvani, C.; Maggioni, M.; La Torre, A. Anthropometric characteristics of top-class Kenyan marathon runners. J. Sports Med. Phys. Fitness. 2013, 53, 403–408. [Google Scholar]
- Lucia, A.; Oliván, J.; Bravo, J.; Gonzalez-Freire, M.; Foster, C. The key to top-level endurance running performance: A unique example. Br. J. Sports Med. 2008, 42, 172–174. [Google Scholar] [PubMed]
- Morrison, S.M.; Dick, T.J.; Wakeling, J.M. Structural and mechanical properties of the human Achilles tendon: Sex and strength effects. J. Biomech. 2015, 48, 3530–3533. [Google Scholar]
- Van Mechelen, W.; Hlobil, H.; Kemper, H.C. Incidence, severity, aetiology and prevention of sports injuries: A review of concepts. Sports Med. 1992, 14, 82–99. [Google Scholar] [PubMed]
- Hootman, J.M.; Dick, R.; Agel, J. Epidemiology of collegiate injuries for 15 sports: Summary and recommendations for injury prevention initiatives. J. Athl. Train. 2007, 42, 311. [Google Scholar] [PubMed]
- Lyle, M.A.; Valero-Cuevas, F.J.; Gregor, R.J.; Powers, C.M. Lower extremity dexterity is associated with agility in adolescent soccer athletes. Scand. J. Med. Sci. Sports 2015, 25, 81–88. [Google Scholar]
- De Leva, P. Adjustments to Zatsiorsky-Seluyanov’s segment inertia parameters. J. Biomech. 1996, 29, 1223–1230. [Google Scholar]
- Marangoz, İ.; Polat, Y. The effects of body composition and somatotypes on acceleration speed in male athletes. J. Acad. Soc. Sci. 2017, 54, 345–360. [Google Scholar]


| Variable | Low Dynamic Sports (LD; n = 41) | Moderate Dynamic Sports (MD; n = 87) | High Dynamic Sports (HD; n = 184) | Total Athletes (N = 312) |
|---|---|---|---|---|
| Age (years) | 17.46 ± 0.60 | 17.87 ± 1.34 | 18.04 ± 1.93 | 17.92 ± 1.67 |
| Height (cm) | 166.94 ± 7.37 | 171.36 ± 8.62 | 169.41 ± 7.33 | 169.63 ± 7.81 |
| Weight (kg) | 67.89 ± 15.81 | 65.85 ± 15.74 | 68.54 ± 12.92 | 67.70 ± 14.15 |
| BMI (kg/m2) | 24.20 ± 4.43 | 22.37 ± 4.58 | 23.77 ± 3.39 | 23.43 ± 3.95 |
| Career (years) | 7.46 ± 0.60 | 7.55 ± 1.53 | 7.94 ± 1.48 | 7.84 ± 1.73 |
| I. Low static | Baseball | Badminton | ||
| Fencing | Field hockey | |||
| Seppak takraw | ||||
| Running (sprint) | ||||
| Taekwondo | ||||
| Tennis | ||||
| II. Moderate static | Fin swimming | |||
| Diving | Soccer | |||
| Gymnastics | Swimming | |||
| Judo | Team handball | |||
| Shooting | ||||
| III. High static | Weightlifting | Wrestling | Boxing | |
| Cycling | ||||
| Modern pentathlon | ||||
| Rowing |
| Variable | Groups | ||||
|---|---|---|---|---|---|
| LD (n = 41) | MD (n = 87) | HD (n = 184) | F | p-Value | |
| absolute leg length | |||||
| tibia (cm) | 34.80 ± 2.86 b | 36.35 ± 2.93 a | 35.86 ± 3.09 | 3.695 | 0.026 * |
| femur (cm) | 42.84 ± 3.05 | 44.17 ± 3.72 | 43.69 ± 2.71 | 2.655 | 0.072 |
| femur + tibia (cm) | 77.63 ± 4.93 b | 80.52 ± 5.90 a | 79.55 ± 4.97 | 4.244 | 0.015 * |
| relative leg length | |||||
| tibia, % of body length | 20.82 ± 1.10 | 21.20 ± 1.10 | 21.15 ± 1.26 | 1.495 | 0.226 |
| femur, % of body height | 25.65 ± 1.28 | 25.75 ± 1.23 | 25.78 ± 1.01 | 0.240 | 0.787 |
| femur + tibia, % of body height | 46.47 ± 1.41 | 46.95 ± 1.48 | 46.93 ± 1.40 | 1.869 | 0.156 |
| Variable | SU (rp) | SLJ (cm) | SJ (cm) | 10mRT (s) | SS (rp) | 20mSRT (rp) | SR (cm) | GS (kg) | PP (w/kg) | |
|---|---|---|---|---|---|---|---|---|---|---|
| absolute leg length | ||||||||||
| tibia (cm) | −0.109 | 0.430 ** | 0.433 ** | −0.385 ** | 0.147 * | 0.212 ** | −0.365 ** | 0.592 ** | 0.506 ** | |
| femur (cm) | 0.053 | 0.479 ** | 0.419 ** | −0.315 ** | 0.091 | 0.243 ** | −0.271 ** | 0.495 ** | 0.504 ** | |
| femur + tibia (cm) | −0.033 | 0.527 ** | 0.493 ** | −0.406 ** | 0.138 * | 0.266 ** | −0.368 ** | 0.629 ** | 0.581 ** | |
| relative leg length | ||||||||||
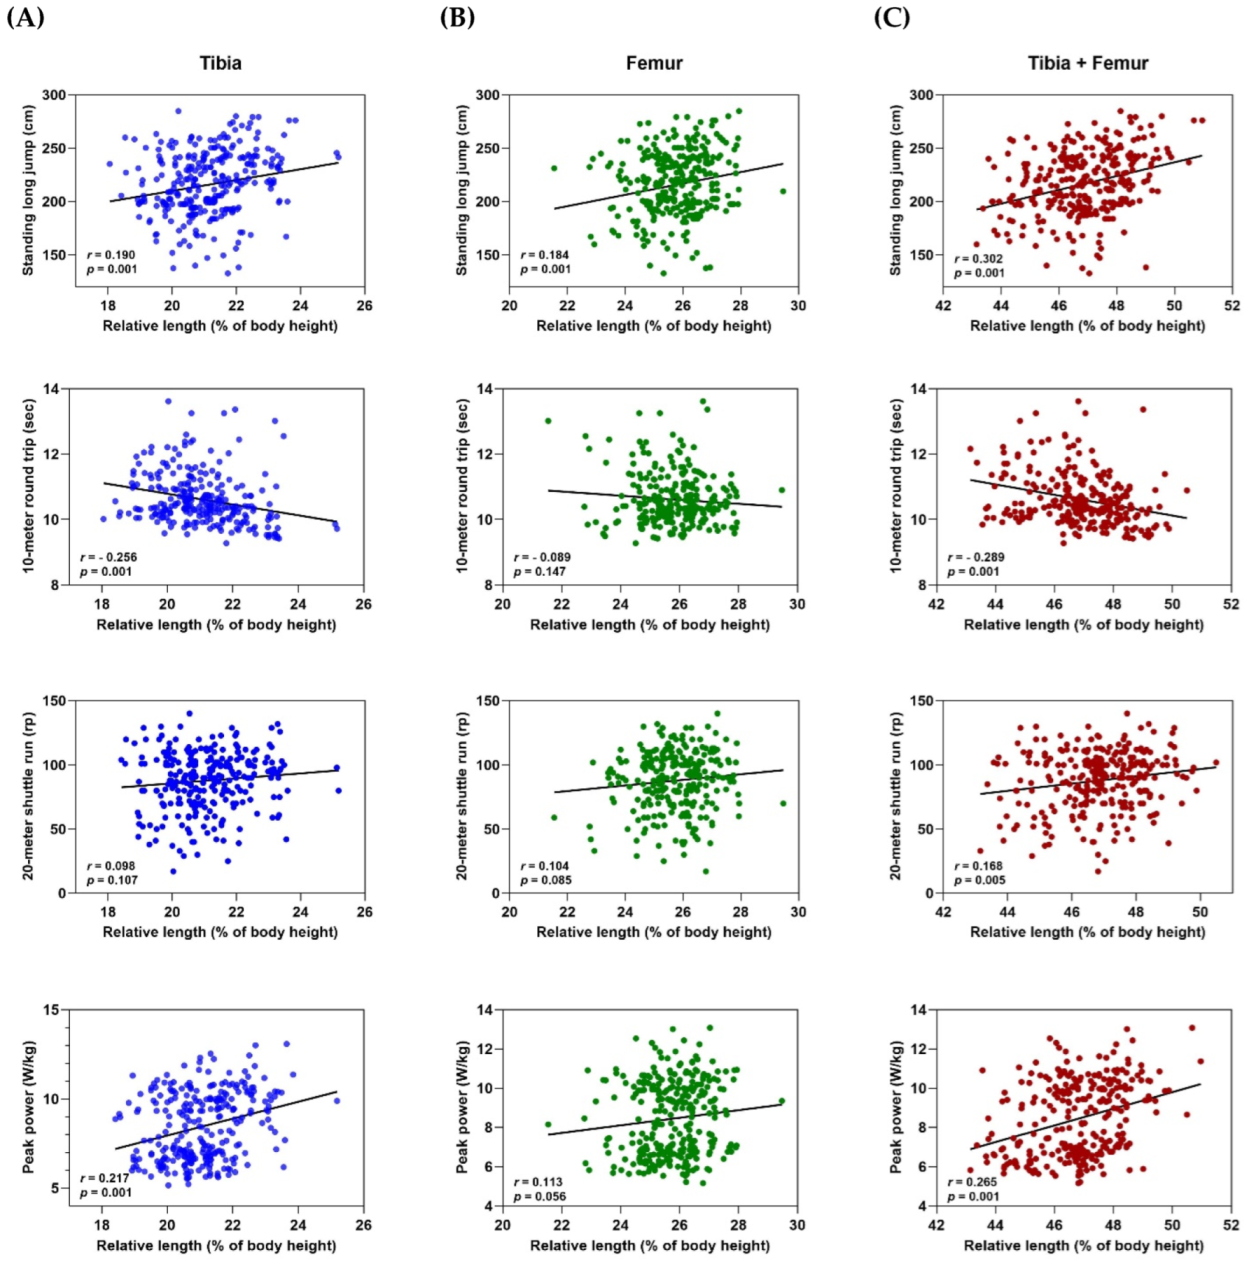
| tibia, % of body length | ALL | −0.150 * | 0.190 ** | 0.215 ** | −0.256 ** | 0.135 * | 0.098 | −0.337 ** | 0.331 ** | 0.217 ** |
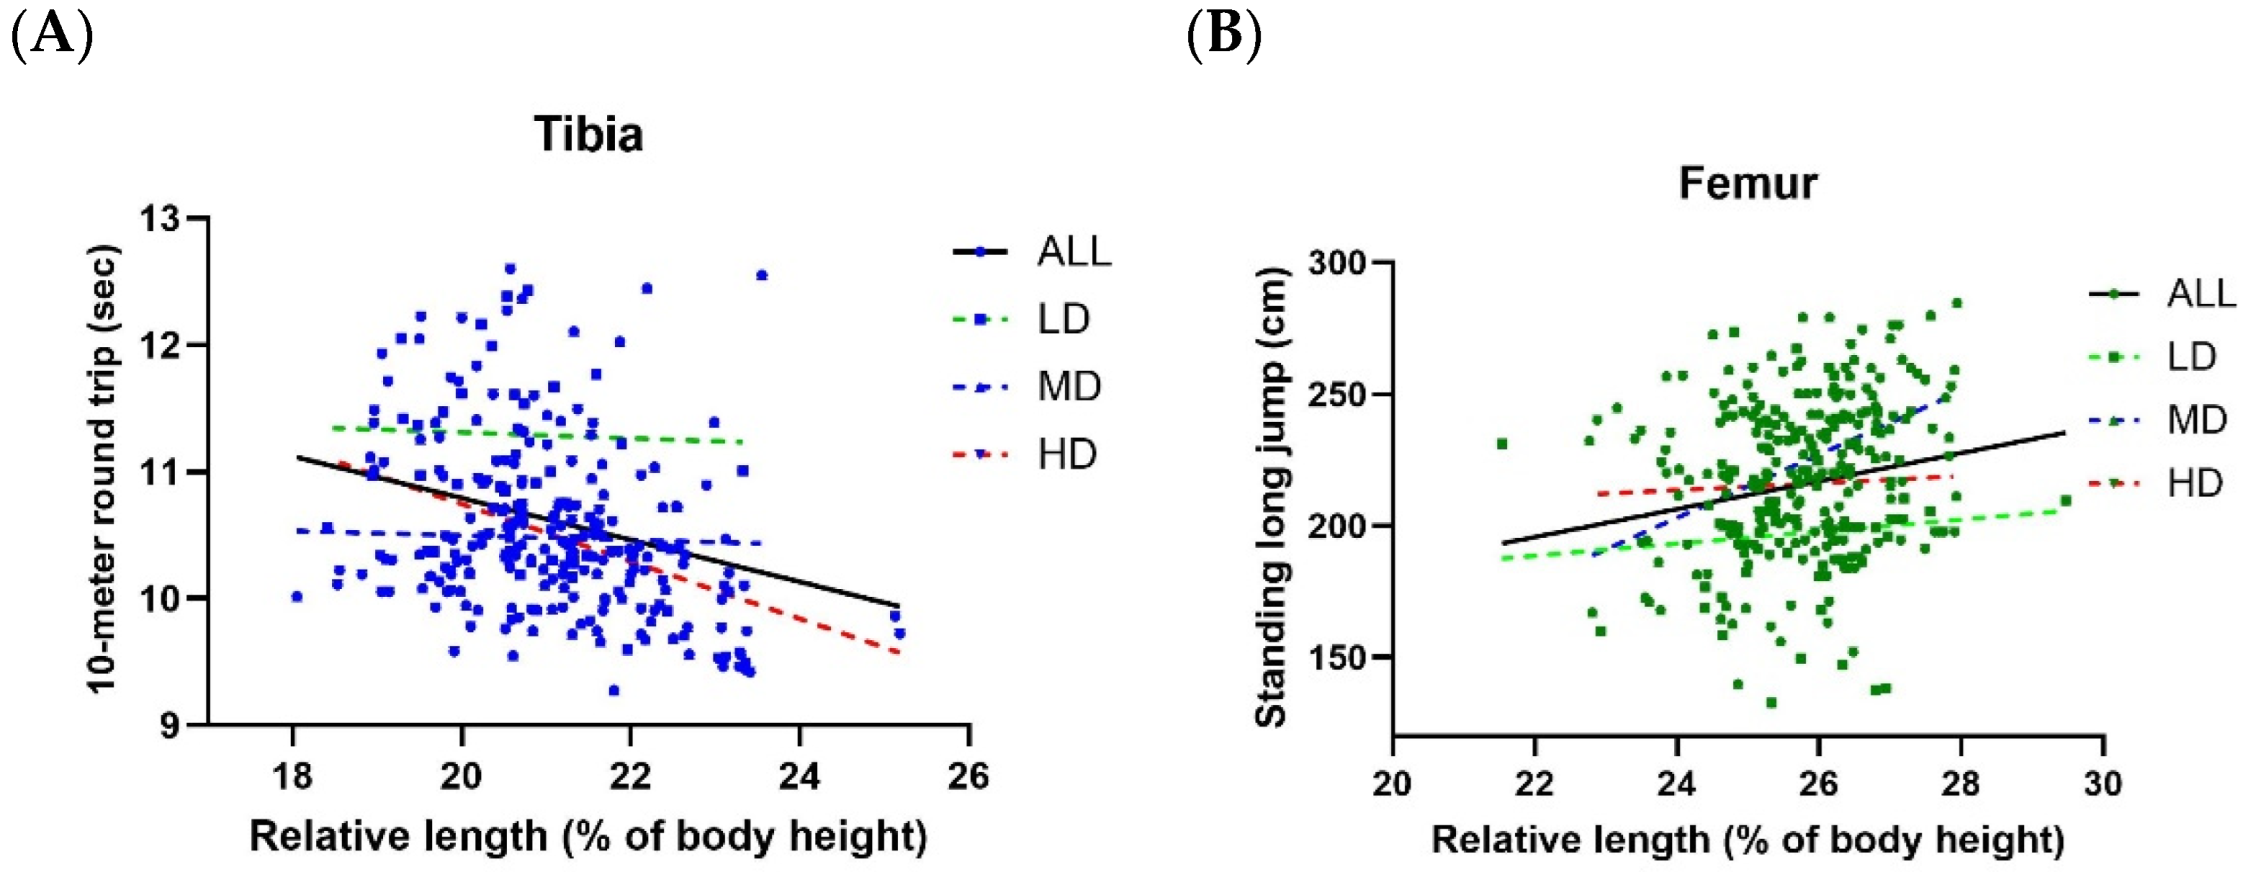
| LD | −0.018 | 0.215 | 0.098 | −0.025 | 0.117 | 0.100 | −0.139 | 0.293 | 0.057 | |
| MD | −0.129 | 0.173 | 0.116 | −0.028 | 0.214 * | 0.035 | −0.235 * | 0.152 | 0.226 | |
| HD | −0.207 ** | 0.166 * | 0.272 ** | −0.455 ** | 0.145 | 0.079 | −0.439 ** | 0.434 ** | 0.338 ** | |
| femur, % of body height | ALL | 0.106 | 0.184 ** | 0.115 * | −0.089 | 0.038 | 0.104 | −0.168 ** | 0.074 | 0.113 |
| LD | −0.098 | 0.075 | 0.169 | −0.268 | 0.086 | 0.143 | −0.406 ** | 0.066 | 0.288 | |
| MD | 0.335 ** | 0.453 ** | 0.412 ** | −0.368 ** | 0.405 ** | 0.204 | −0.079 | 0.253 * | 0.358 ** | |
| HD | 0.063 | 0.047 | −0.090 | 0.249 ** | 0.014 | 0.015 | −0.152 * | −0.061 | −0.051 | |
| femu + tibia, % of body height | ALL | −0.045 | 0.302 ** | 0.269 ** | −0.289 ** | 0.145 * | 0.168 ** | −0.412 ** | 0.335 ** | 0.265 ** |
| LD | −0.103 | 0.237 | 0.231 | −0.265 | 0.171 | 0.210 | −0.480 ** | 0.289 | 0.308 | |
| MD | 0.184 | 0.503 ** | 0.426 ** | −0.317 ** | 0.493 ** | 0.196 | −0.239 * | 0.322 ** | 0.458 ** | |
| HD | −0.145 | 0.183 * | 0.180 * | −0.238 ** | 0.145 | 0.085 | −0.504 ** | 0.347 ** | 0.248 ** | |
Disclaimer/Publisher’s Note: The statements, opinions and data contained in all publications are solely those of the individual author(s) and contributor(s) and not of MDPI and/or the editor(s). MDPI and/or the editor(s) disclaim responsibility for any injury to people or property resulting from any ideas, methods, instructions or products referred to in the content. |
© 2025 by the authors. Licensee MDPI, Basel, Switzerland. This article is an open access article distributed under the terms and conditions of the Creative Commons Attribution (CC BY) license (https://creativecommons.org/licenses/by/4.0/).
Share and Cite
Kwon, H.; Kim, D. Correlation Between Leg Length and Physical Performance According to Sports Characteristics of Well-Trained Athletes. Appl. Sci. 2025, 15, 3836. https://doi.org/10.3390/app15073836
Kwon H, Kim D. Correlation Between Leg Length and Physical Performance According to Sports Characteristics of Well-Trained Athletes. Applied Sciences. 2025; 15(7):3836. https://doi.org/10.3390/app15073836
Chicago/Turabian StyleKwon, Hyeongtae, and Daeho Kim. 2025. "Correlation Between Leg Length and Physical Performance According to Sports Characteristics of Well-Trained Athletes" Applied Sciences 15, no. 7: 3836. https://doi.org/10.3390/app15073836
APA StyleKwon, H., & Kim, D. (2025). Correlation Between Leg Length and Physical Performance According to Sports Characteristics of Well-Trained Athletes. Applied Sciences, 15(7), 3836. https://doi.org/10.3390/app15073836