Article

Laboratory Study on Rockburst Control by Step Method in Deep Tunnel

1
Road Engineering Research Center, Research Institute of Highway Ministry of Transport, Beijing 100088, China
2
State Key Laboratory for Geomechanics & Deep Underground Engineering, China University of Mining & Technology (Beijing), Beijing 100083, China
3
School of Mechanics and Civil Engineering, China University of Mining and Technology (Beijing), Beijing 100083, China
4
Shanxi Transportation Research Institute Group Co., Ltd., Taiyuan 030006, China
*
Author to whom correspondence should be addressed.
Appl. Sci. 2025, 15(7), 3853; https://doi.org/10.3390/app15073853
Submission received: 4 February 2025 / Revised: 28 March 2025 / Accepted: 28 March 2025 / Published: 1 April 2025

Abstract

:
In terms of rockburst control technology, it is generally believed that optimizing the section design and adopting the step method can effectively suppress the occurrence of rockburst, but there is no literature to explain the reasons for adopting this method from the experimental point of view. In addition, compared with the application of support, this method can achieve the effect of not increasing the construction process, not affecting the progress of the project and reducing the project cost. In view of this, the Gaoloushan deep-buried tunnel with rockburst was taken as the research object in this paper. Firstly, the excavation scheme based on the step method was proposed, and its explosion-proof effect was verified again. The experimental results showed that the step method could be essentially regarded as the transformation of surrounding rock by reasonably distributing explosives and reducing the working section. The beneficial effects of this method were as follows: the release intensity of absolute energy was slowed down, the way of energy release was changed; the stress condition of surrounding rock was improved; the path of the continuous supplement of strain energy in the original rockburst area was cut off; and the energy accumulation degree of surrounding rock was reduced, so that the accumulated energy in the rock mass did not exceed its energy storage limit at the location where the rockburst should have occurred. The reduced high energy was released in an orderly manner and induced the rock failure process, forming a fracture zone and a plastic zone. In the process of expansion, the fracture zone and plastic zone further reduced the stress concentration of the surrounding rock and deteriorated the mechanical properties of the surrounding rock. The stress concentration zone was transferred to the deeper surrounding rock outside the unloading relaxation zone, and part of the elastic energy accumulated in the surrounding rock was released. The strain energy could be distributed and dissipated, and the effect of energy safety and slow release was achieved.

1. Introduction

The mechanism, prediction and control of rockburst have always been a hot and difficult problem in the field of rock mechanics [1,2,3,4]. In these studies, control is the ultimate goal. In terms of rockburst control technology, a variety of rockburst control methods have been further enriched and developed. There are two main methods to prevent and control rockburst. One is rockburst control technology based on stress release. The core idea is to weaken the mechanical properties of the rock itself, change the integrity of the local rock mass, and weaken the effect of the initial stress on the surrounding rock, so that the rock mass does not have the conditions for rockburst or weaken the strength of rockburst, such as drilling blasting boreholes and microwave fracturing, destress blasting, large-scale panel destressing, hydraulic fracturing in roof techniques to absorb energy and vibration waves [5,6,7,8,9,10]. The other is the rockburst control technology based on energy absorption. The core idea is to curb the large deformation of the surrounding rock of the tunnel by means of support or filling, and to control the stability of the surrounding rock through the absorption and dissipation of energy. In the control of rockburst through the support system, Kaiser et al. [11] considered the anchor rod as the main component—the main role was to reinforce the surrounding rock and the suspension, and emphasize the strength of the anchor rod to control the rockburst, including the supporting role of the net, belt and other auxiliary components. Since then, the bolt with energy absorption characteristics gradually appeared. As proposed by Li [12], a support system for rockburst control comprises surface-retaining devices and yield rockbolts as well as yield cable bolts when needed. Wang et al. [13] explored the control mechanism of the constant-resistance energy-absorbing (CREA) bolt to rockburst. He et al. [14] proposed the concept of NPR support for the first time and developed a constant resistance and large deformation bolt/cable with the above excellent properties based on the excellent properties of negative Poisson’s ratio materials or structures in terms of impact resistance, shear resistance and energy absorption. In addition, Luo and Gong [15] made a quantitative estimation of rockburst based on the number of supporting devices such as energy-absorbing bolts required for scientific and sufficient support of pillars. In addition to the energy-absorbing anchor, Tang et al. [16] developed a flexible protection network system suitable for tunnel rockburst disaster protection. Lu et al. [17] proposed a metal retractable bracket and a flexible energy-absorbing cushion, which could also play a role in controlling rockburst disasters. In controlling rockburst by filling method, feasible mining techniques under rockburst conditions were put forward, that is, the stoping and filling method [18]. According to the characteristics and uses of stale waste filling materials, Zhou et al. [19] proposed two processes of volume filling and strength filling, and designed the key technology of stale garbage filling to control rockburst. However, rockburst control technologies represented by stress release had weakened the high-stress state of the surrounding rock to a certain extent, but they could not completely eliminate the stress at its root. It is necessary to resist the occurrence of rockburst after the redistribution of stress through the application of the support system. By applying the method of supporting or filling to increase the energy storage limit, the construction process would be increased, the progress of the project would be affected, and the overall cost of the project would be increased. The construction side of the project adopted the method of drilling pressure relief, but rockburst disasters still occurred from time to time, which could not solve the problem of rockbursts in tunnel construction.
AE (acoustic emission) can be more effectively applied to warn of rockburst danger [20,21,22]. In the aspect of acoustic emission analysis, the existing research focuses on the time domain and frequency domain of acoustic emission, and then analyzes and understands rockburst [23]. However, the conclusions are mainly based on the characteristics of acoustic emission parameters of a certain experiment [24,25,26]. For the samples characterized by metamorphic sandstone in Gaoloushan, the related acoustic emission research is still in the blank stage, and there are few studies on the control effect of rockburst control experiments from the perspective of acoustic emission. It is generally believed that optimizing the section design and adopting the step method can effectively suppress the occurrence of rockburst, but there is no literature to explain the reasons for this method from the experimental point of view. In view of this and on the basis of previous studies, this paper adopted the optimized excavation design method without shortening the excavation footage, changed the original “full-face blasting excavation method” to “step method”, and then carried out relevant experimental research to explore the effect of this method on controlling rockburst.

2. Experimental Methods

2.1. Engineering Background

Located in Wen County, Longnan City, Gansu Province, Gaoloushan Tunnel is a control project for Longnan City and Jiuzhaigou in Sichuan Province. The tunnel site is an alpine canyon landform with a complex geological structure, high seismic intensity (VIII degree seismic area), high geostress (maximum principal stress between 27 and 51 MPa), high ground temperature (maximum ground temperature may exceed 30 °C), and large tunnel buried depth (with 1680 m maximum buried depth and buried depth > 1000 m accounting for about 30% of the total length), which is a typical representative of deeply buried extra-long highway tunnel under complex geological conditions. Under the dual influence of tectonic stress and self-weight stress field, 90% of the tunnel section is extremely high stress and high stress, and the possibility of strong–medium rockburst in hard rocks such as metamorphic sandstone and schist is high. According to the actual rockburst situation on site, the impact-induced rockburst at YK53+908–YK53+912 of Gaoloushan Tunnel was taken as the research object in this paper, of which the buried depth is 843 m, the surrounding rock level is grade III, and the formation lithology is mainly metamorphic sandstone. The rock mass is relatively complete, mostly in a block-like overall structure. The surrounding rock level is grade III (Hard rock, BQ = 450~350). A large area of ejection and collapse occurs at the arch roof and both sides of the haunch. The shape and size of the pit are shown in Figure 1.

2.2. Design of Rockburst Control

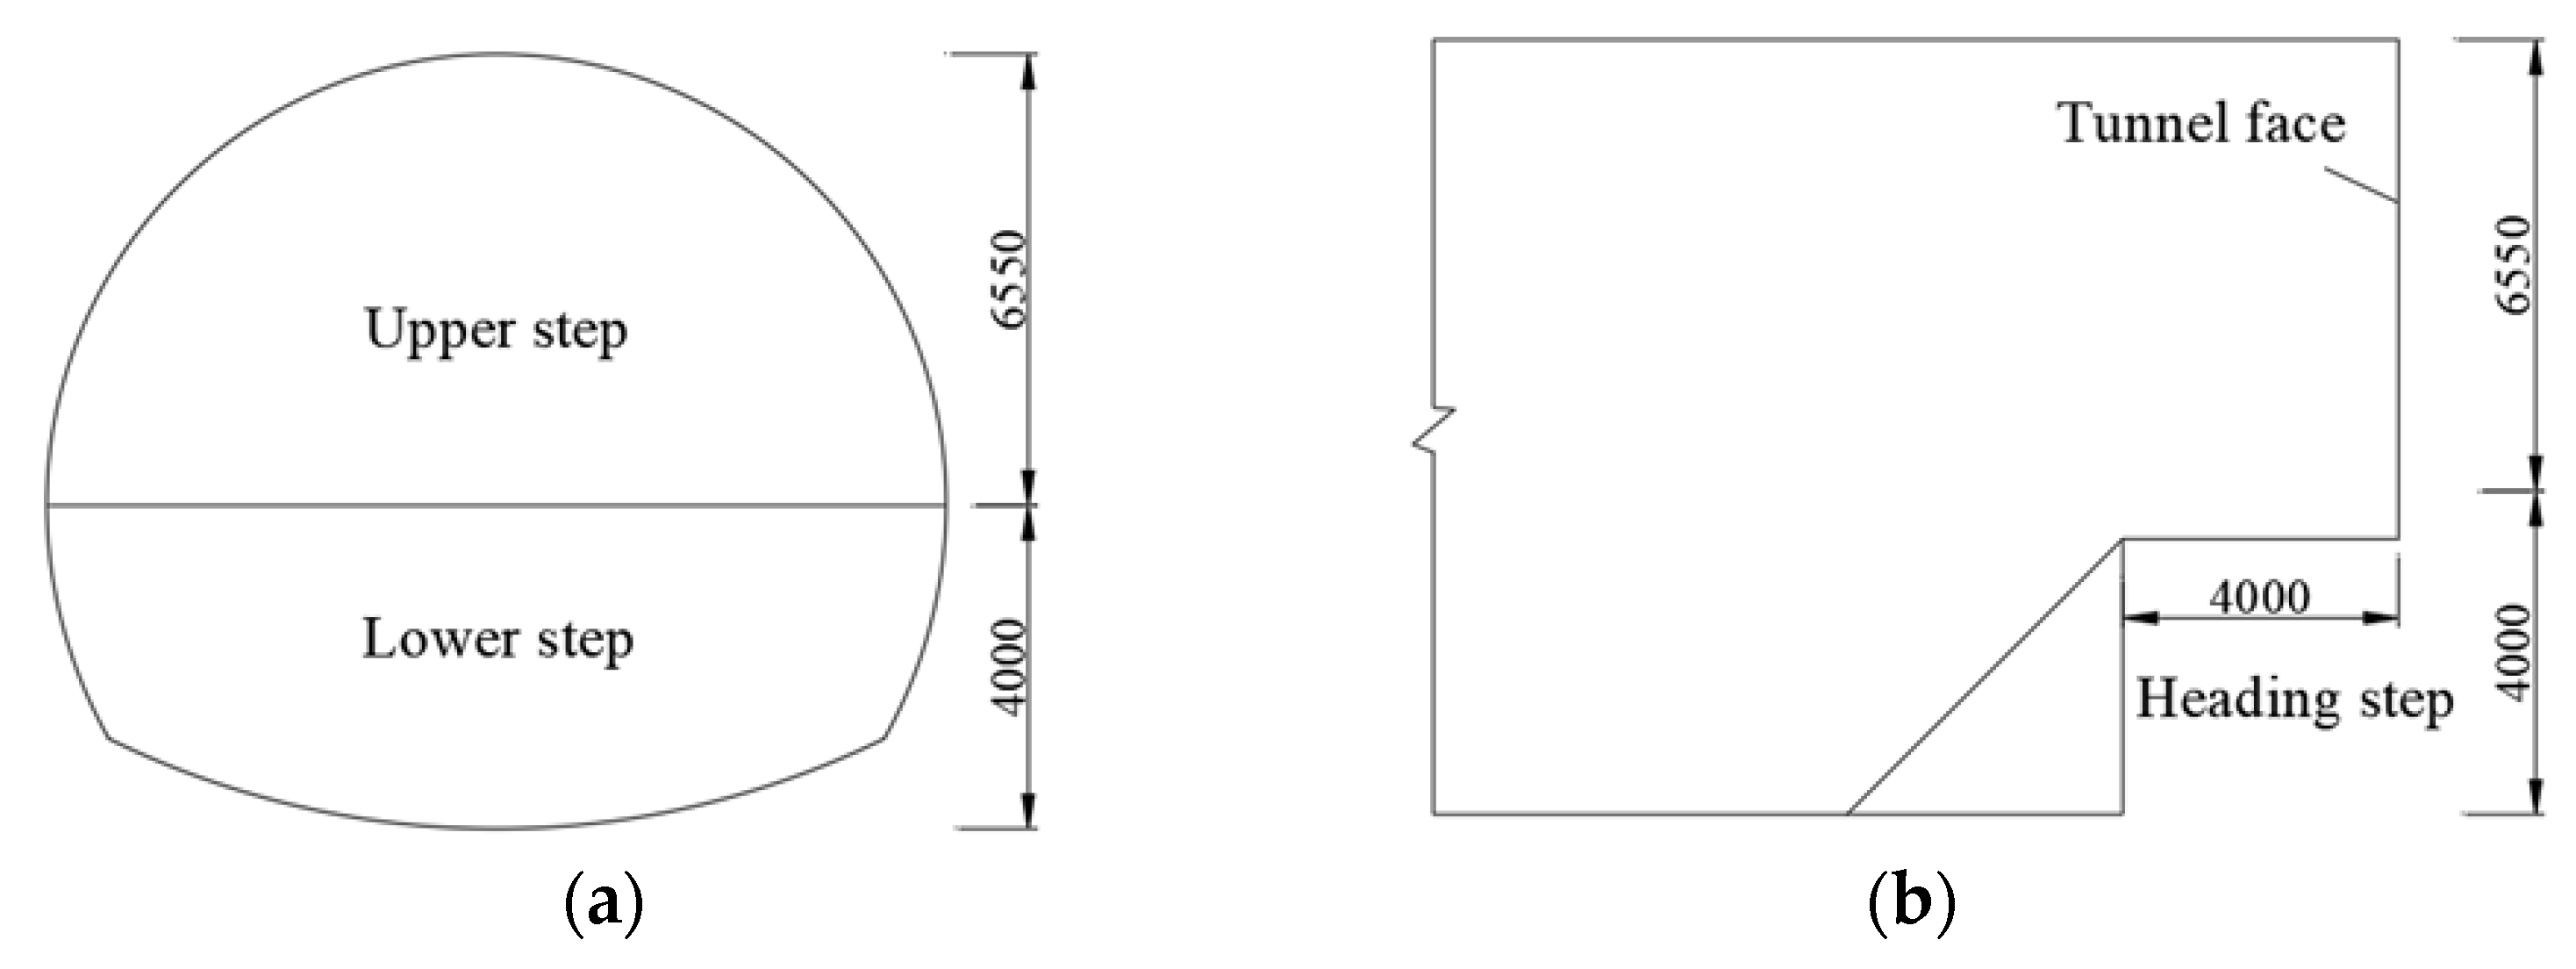
The core idea of this method is to reduce the stress concentration and disturbance stress wave in the rockburst area by means of time difference without affecting the construction footage and reducing the consumption of explosives. By redistributing the explosive ratio, the blasting vibration is finally reduced and the rockburst control is realized. Compared with full-face blasting, step method blasting can reduce the total amount of single blasting as well as the disturbance load caused by blasting, and thus reduce the possibility of rockburst. Based on the engineering status of the Gaoloushan deep-buried tunnel, this paper proposed an excavation scheme based on the step method. As shown in Figure 2, the excavation height of the upper step is 6.55 m, the excavation height of the lower step is about 4 m, and the length of the heading step is set to 4 m. By adopting the above design, it could meet the requirements of the drilling and blasting support working space of the upper step and the limit of the length of the outrigger of slag removing operation of the excavator.

2.3. Testing Equipment

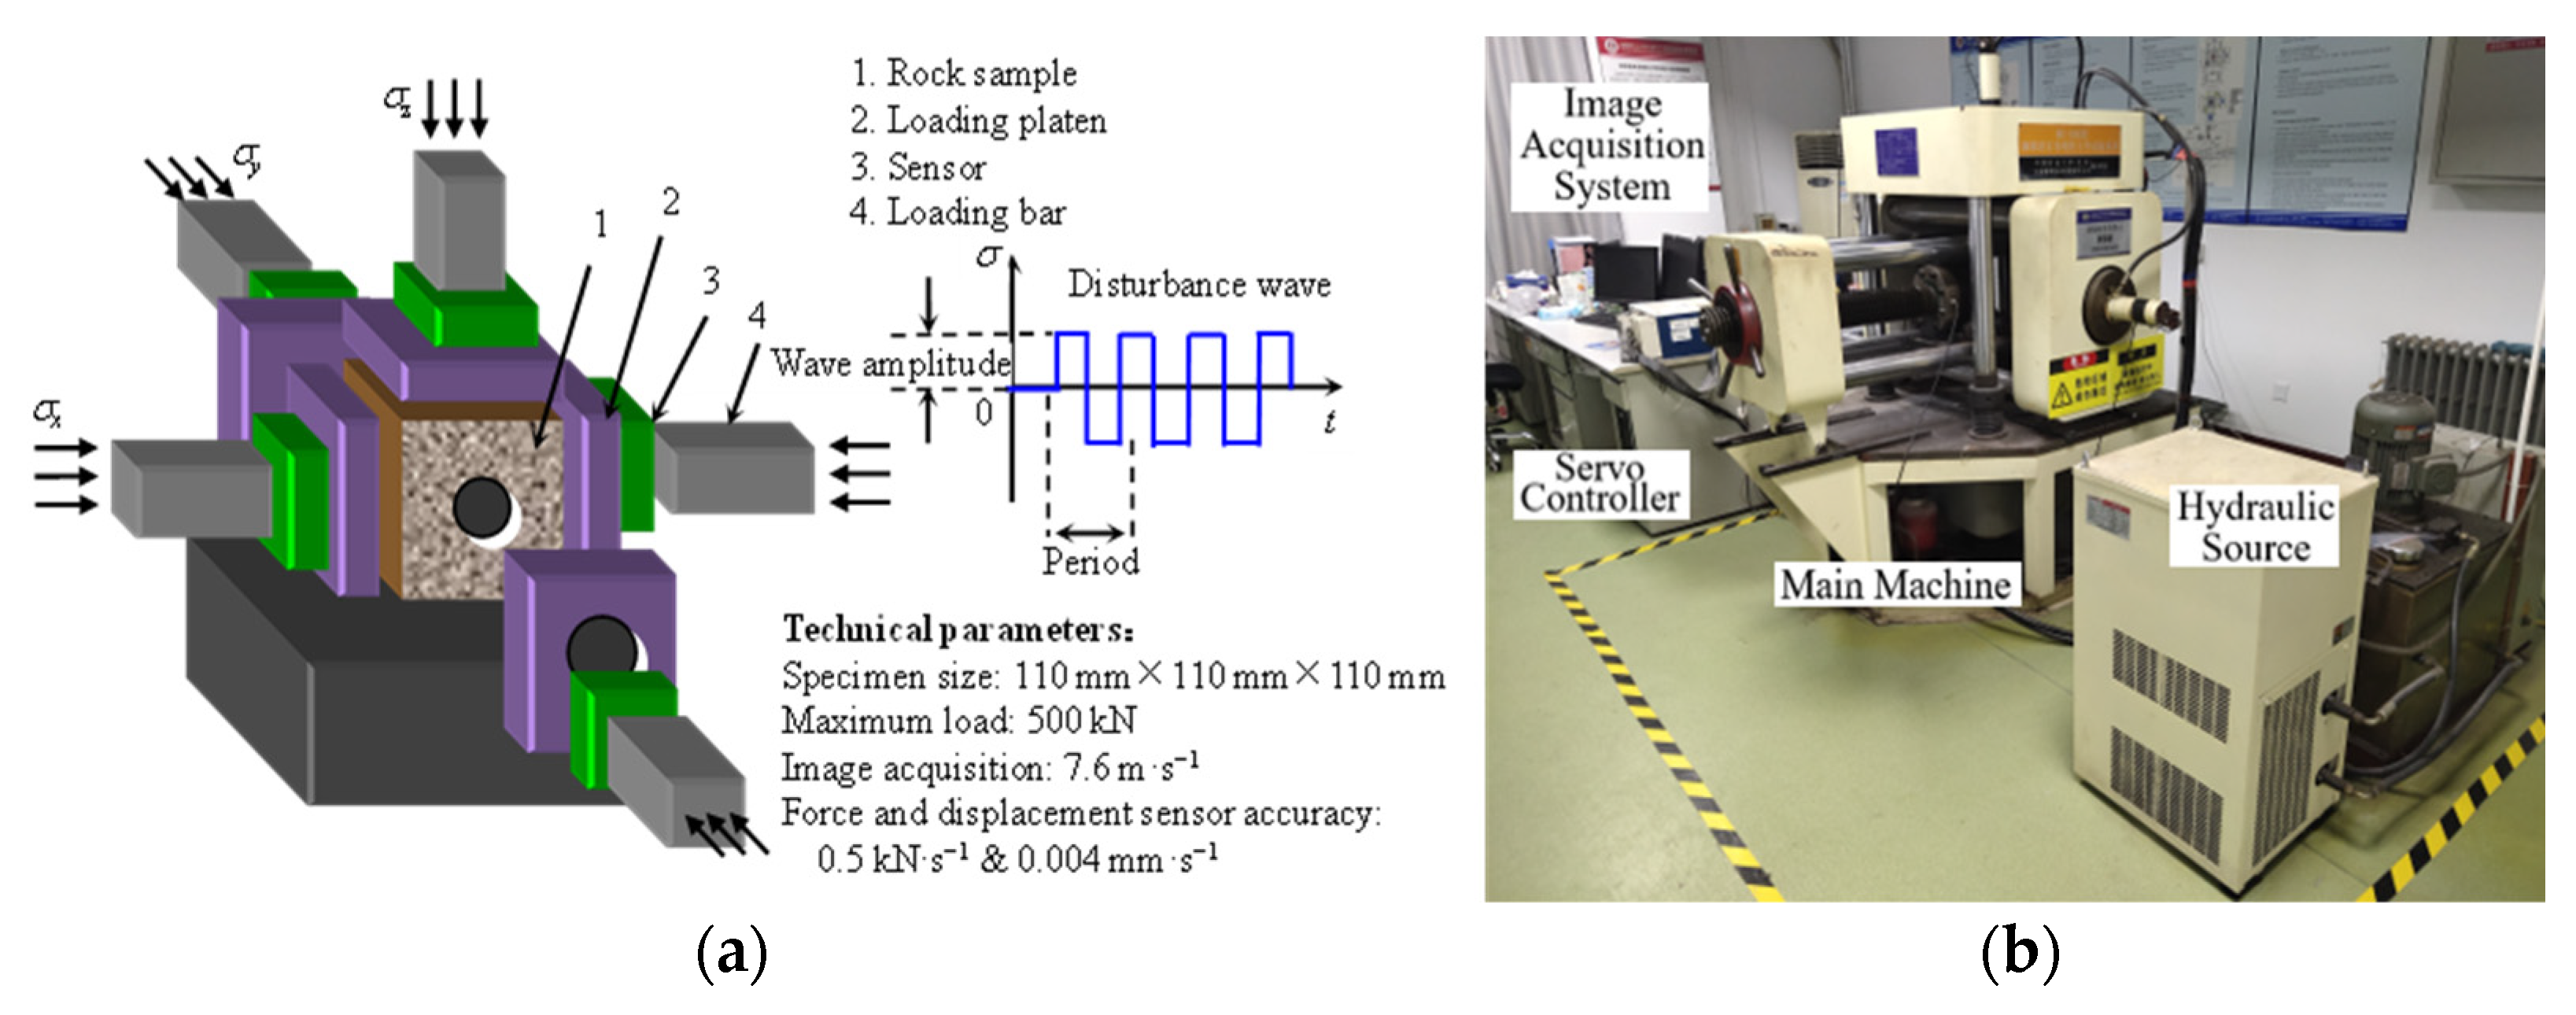
This rockburst experiment was carried out by the impact-induced rockburst experimental system developed by He Manchao’s scientific research team. The loading system was three-way independent, and the servo controller of NI company (Austin, TX, USA) in the United States was adopted, which could realize three-way asynchronous loading and unloading, and three-way or any two-way synchronous loading and unloading. The principle diagram and system performance index of the impact-induced rockburst experimental system are shown in Figure 3a. The experimental system consists of four parts, such as host, hydraulic source, measurement and control device and image acquisition system, as shown in Figure 3b. At present, the system has 16 basic waveform signals, including ramp wave, sine wave, triangular wave and sawtooth wave. Under the displacement control mode, the amplitude range of these disturbance waves is 0~1 mm and the frequency range is 0~1 Hz.

2.4. Rock Description and Specimen Preparation

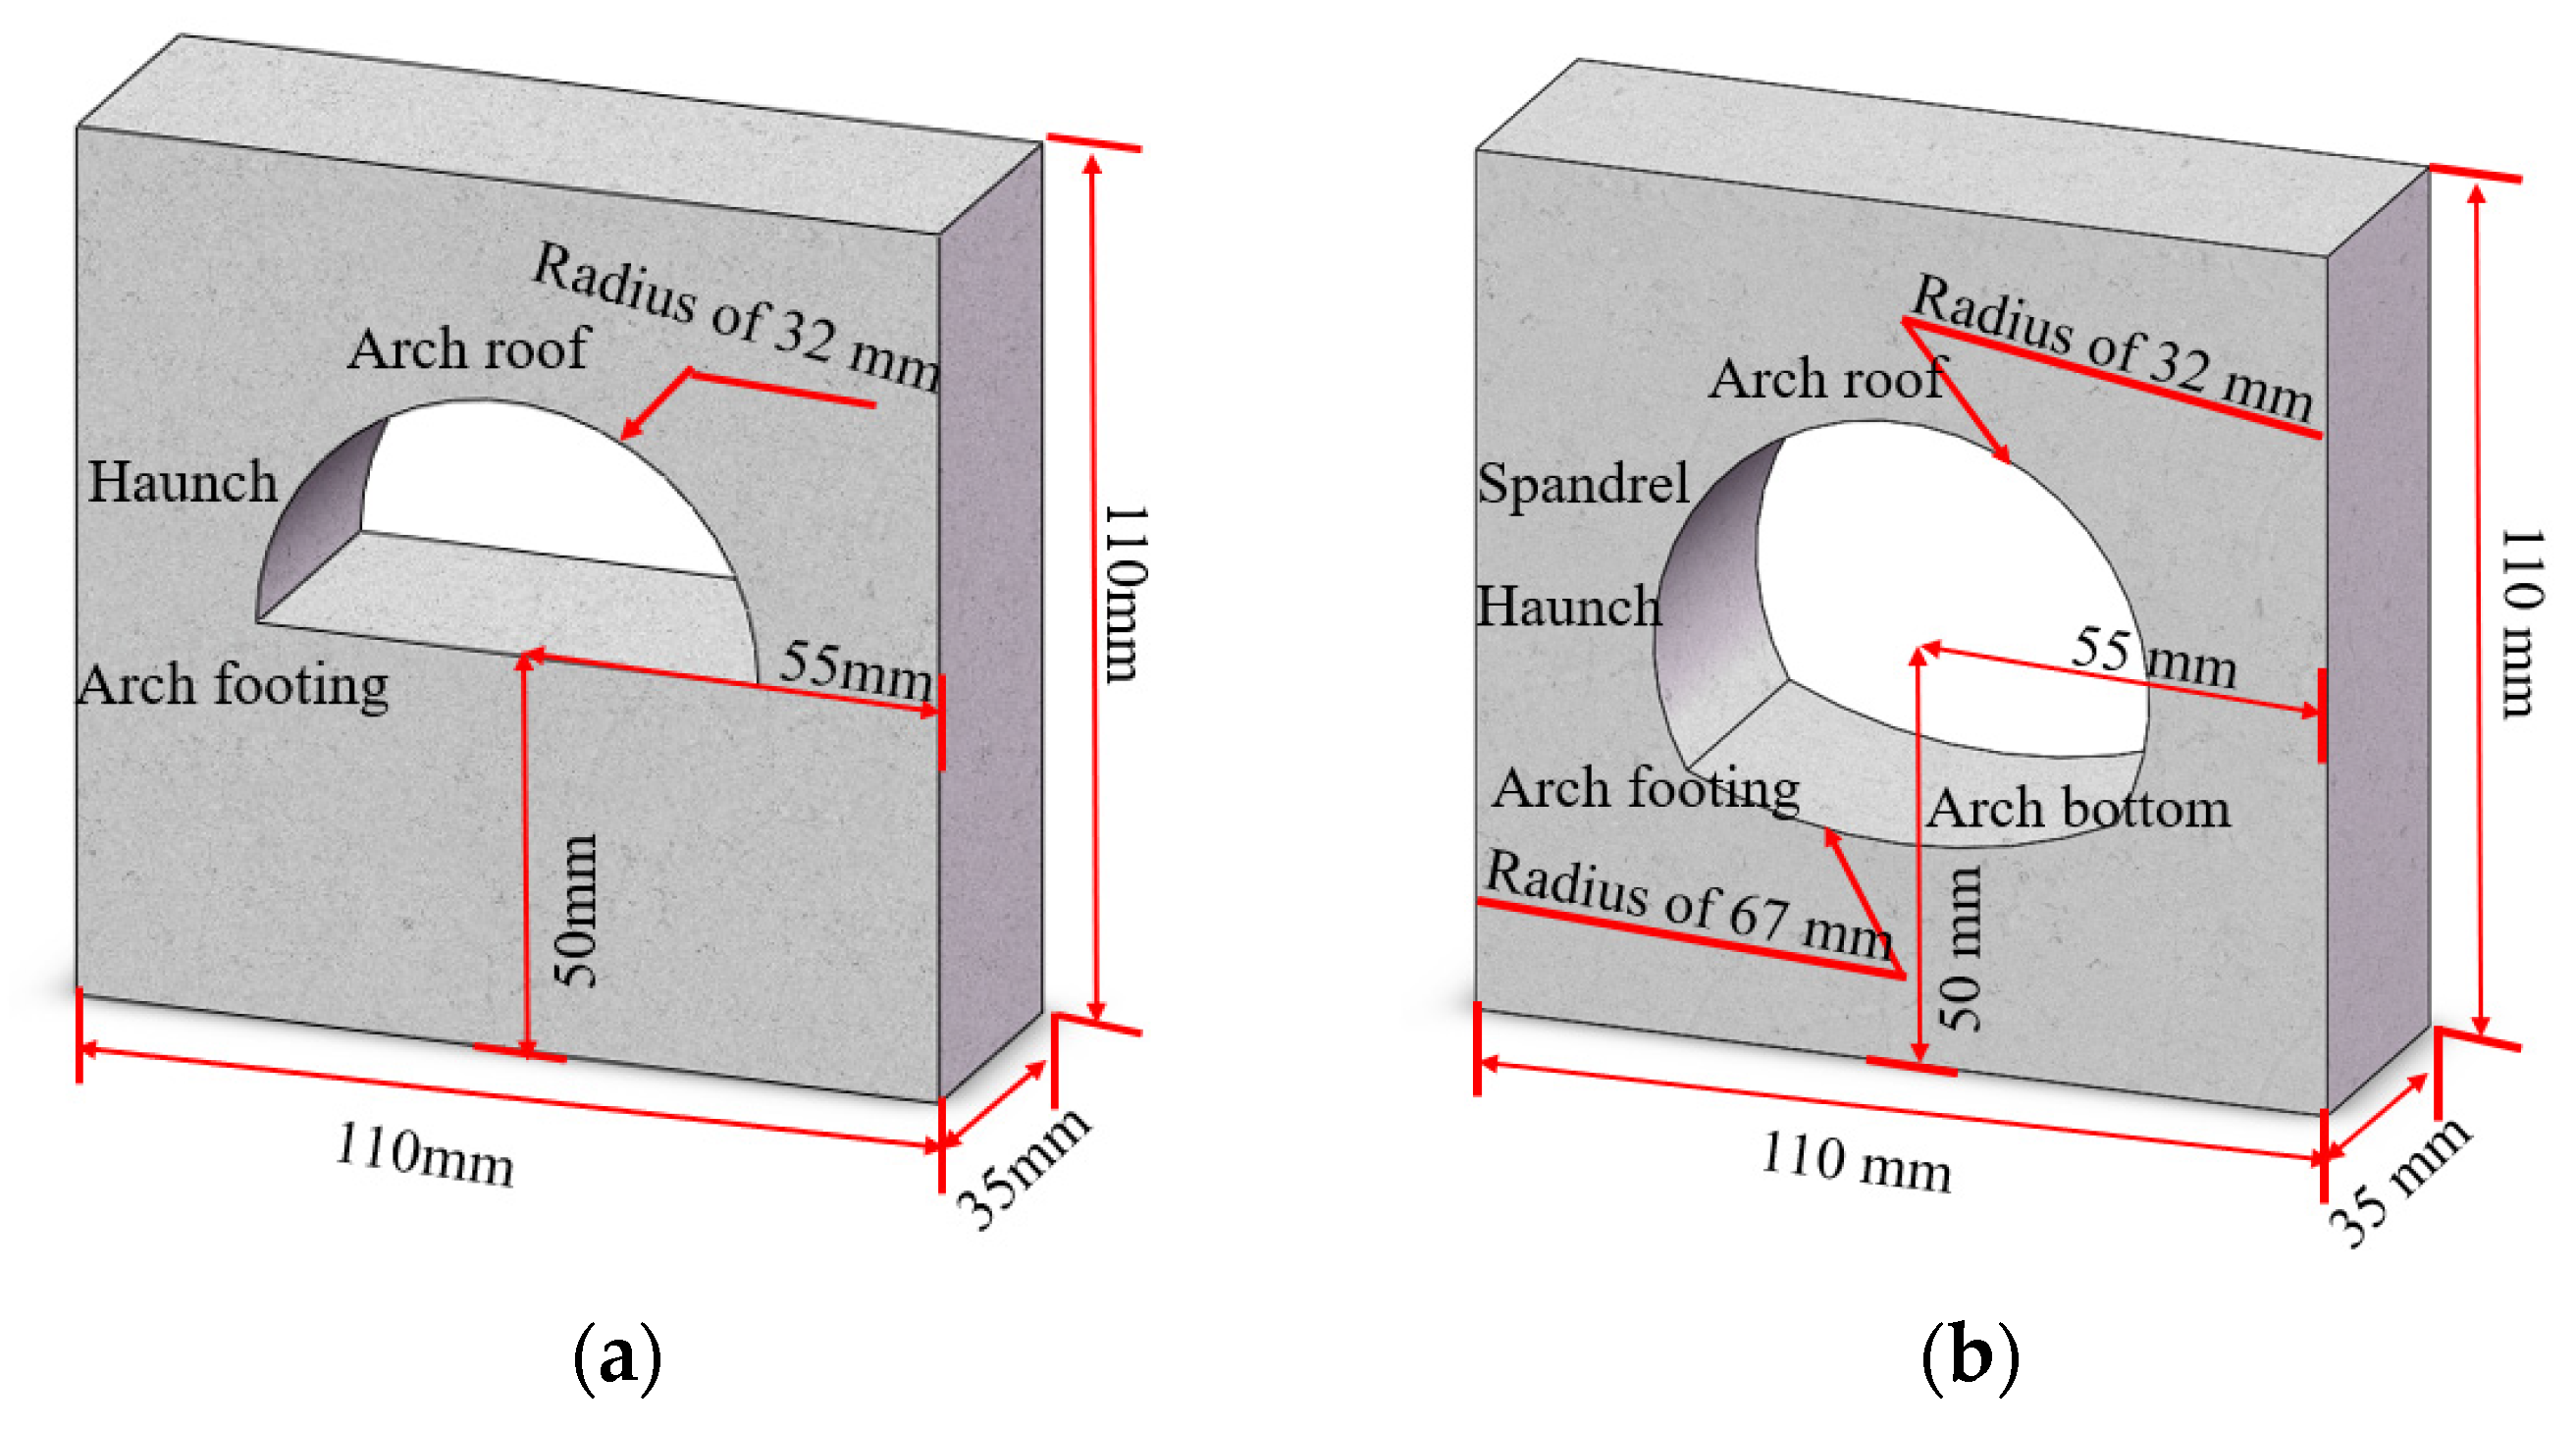
With a gray-white color, the metamorphic sandstone specimen sample was taken from the WJSY3 section of the Gaoloushan Tunnel of the Wujiu Expressway, the overall dense surface of which was uniform without stratification. The average uniaxial compressive strength was 97.4 MPa, the average elastic modulus 50.65 GPa and the average Poisson’s ratio 0.14, as shown in Figure 4a. The sample was processed into a sample with a specification of 110 mm × 110 mm × 35 mm, in which the surface flatness was within ± 0.05 mm, and the verticality deviation of the adjacent two surfaces was within ± 0.25°. The specific size design and the naming of each part of the tunnel are shown in Figure 4b. According to the proportion of the original tunnel size of 1:200, the wire-electrode cutting to cut hole was used to simulate the different stages of the excavation of the on-site step method.

2.5. Experimental Scheme

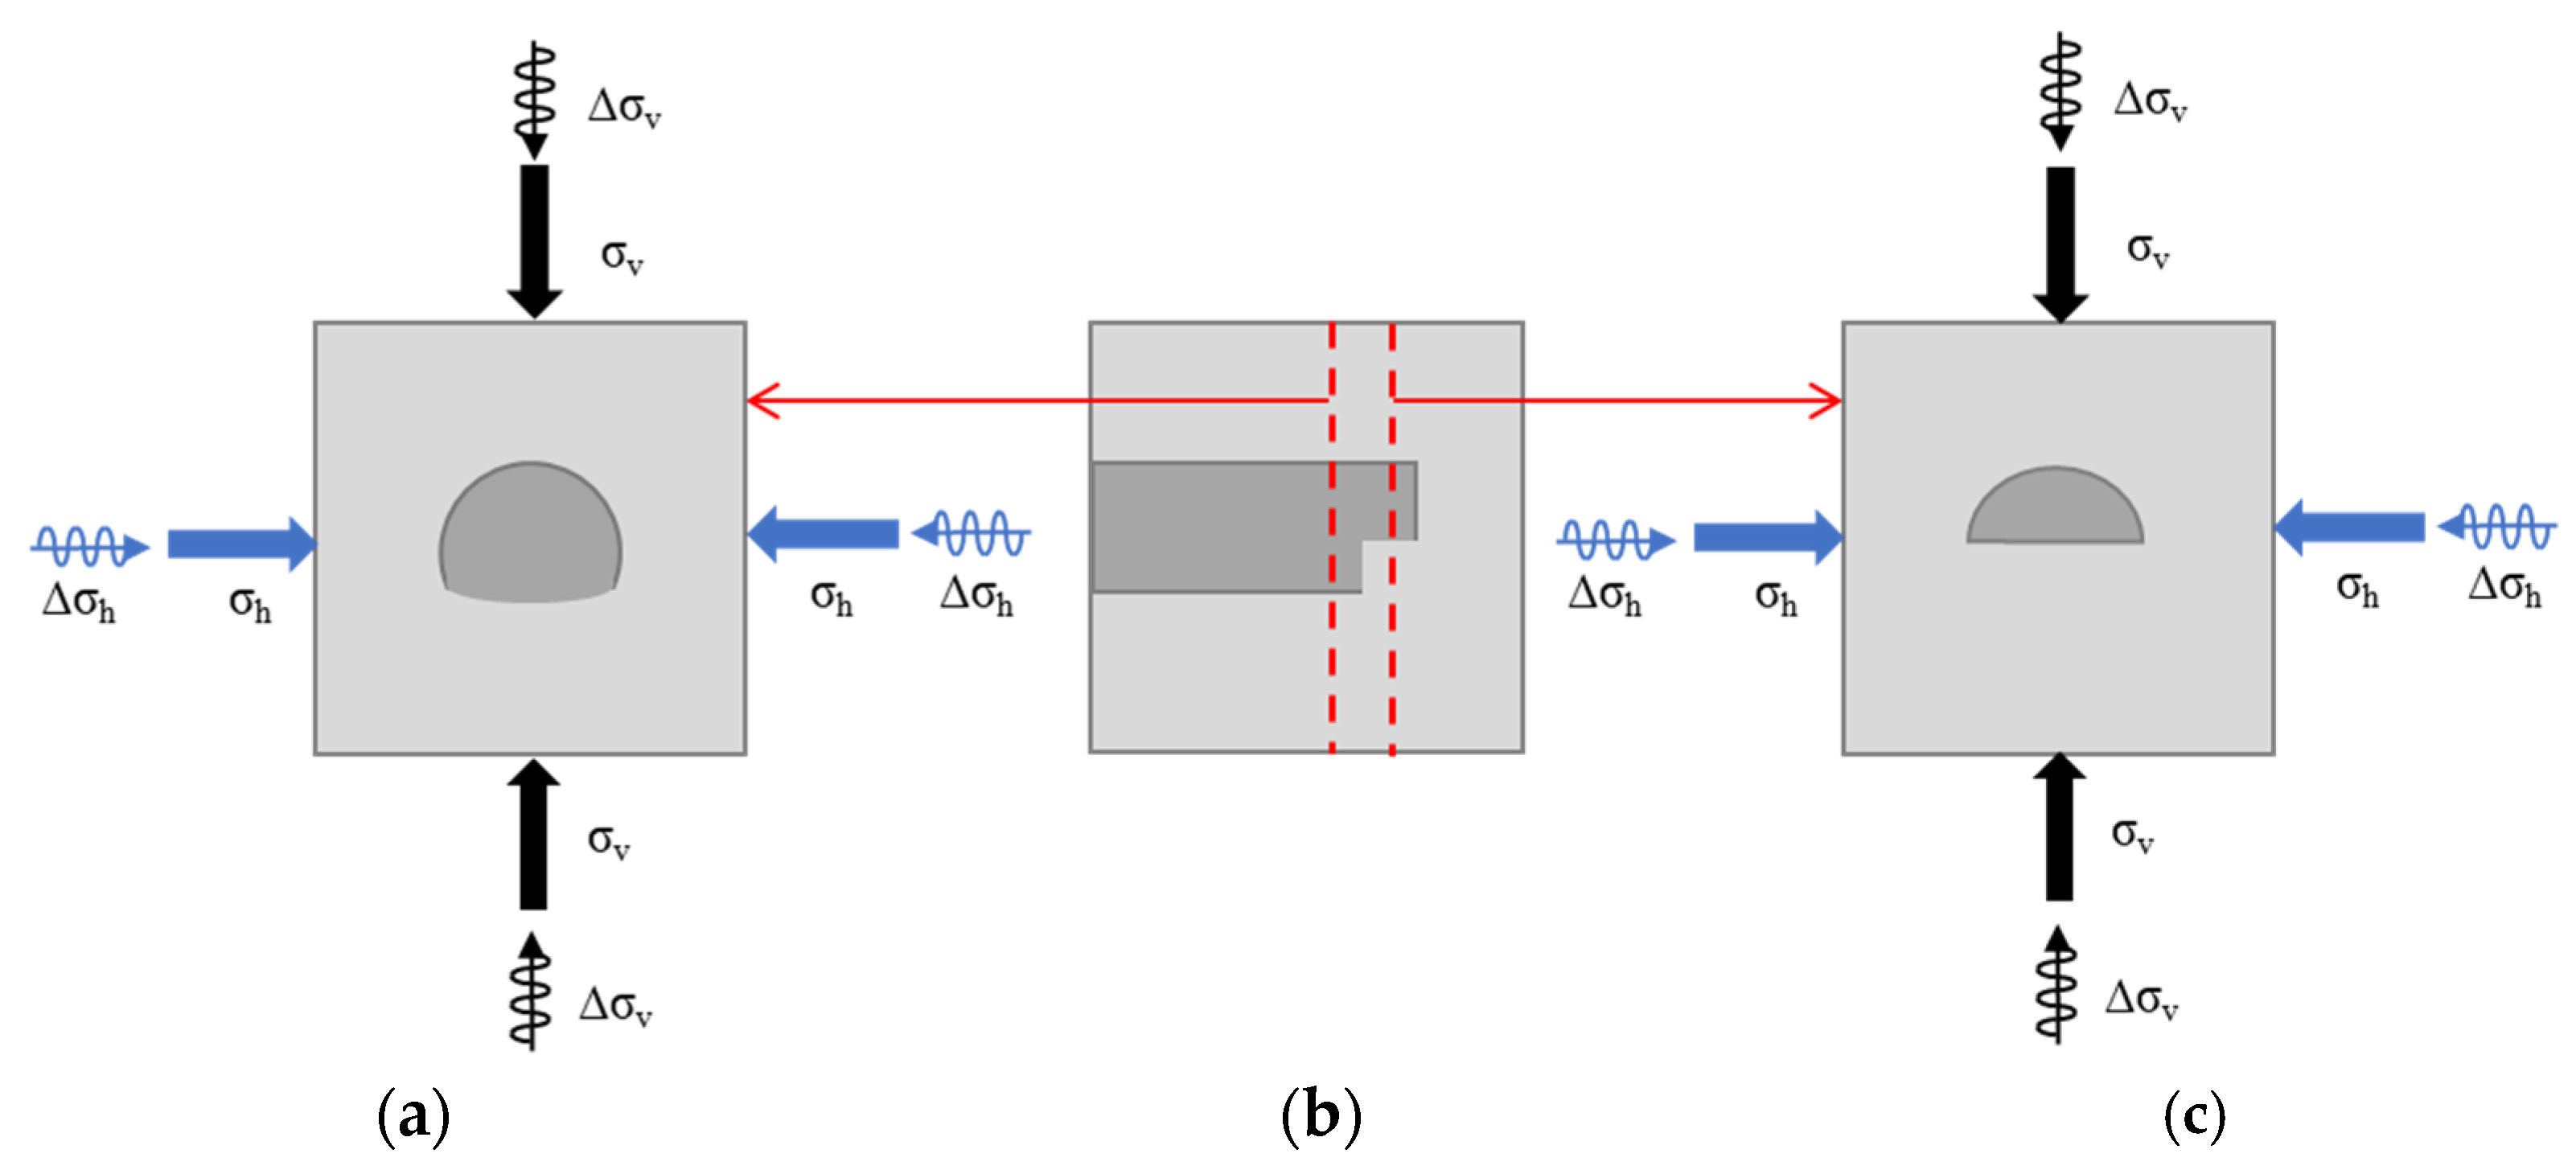
The control experiment was divided into two groups. Considering the different blasting loads generated by the blasting of the upper and lower steps, the stress wave was applied to the above four groups of specimens while applying σv and σh, respectively, to simulate the phenomenon of rockburst in the upper and lower steps of the tunnel during the excavation process. The experimental model is shown in Figure 5.
In view of the fact that the rockburst in the field survey data basically occurred in the range of 800~900 m, this experiment selected the geostress environment of 850 m buried depth, in which the vertical stress was σv = 22.5 MPa and the horizontal stress was σh = 28.5 MPa. In the process of loading, the geostress was firstly loaded to the designed geostress level at a speed of 0.05 MPa·s−1 in two directions synchronously for 60 s, so that the initial geostress distribution was stable, and then the vertical stress σv was increased, mainly considering the leading role of stress adjustment on rockburst after excavation and unloading of the deep tunnel. Ten sinusoidal disturbance waves were synchronously applied in the σh direction and the σv direction to simulate the stress wave generated by blasting. The disturbance frequency was 0.1 Hz. After the disturbance was completed, the load was kept for 60 s, and the buried depth of each stage was increased by 100 m. However, the disturbance amplitude remained the same until the rockburst occurred. According to the field blasting parameters and the ratio of the disturbance amplitude of the upper and lower steps of 6:4, the disturbance amplitude in the σh direction of the upper step was 9.96 MPa and the disturbance amplitude in the σv direction was 12.6 MPa; the disturbance amplitude in the σh direction of the lower step was 8.4 MPa and the disturbance amplitude in the σv direction was 6.64 MPa.

3. Testing Results Analysis

3.1. Analysis of Experimental Results of Upper Step Specimen

3.1.1. Space–Time Evolution Process of Surrounding Rock Deformation and Fracture

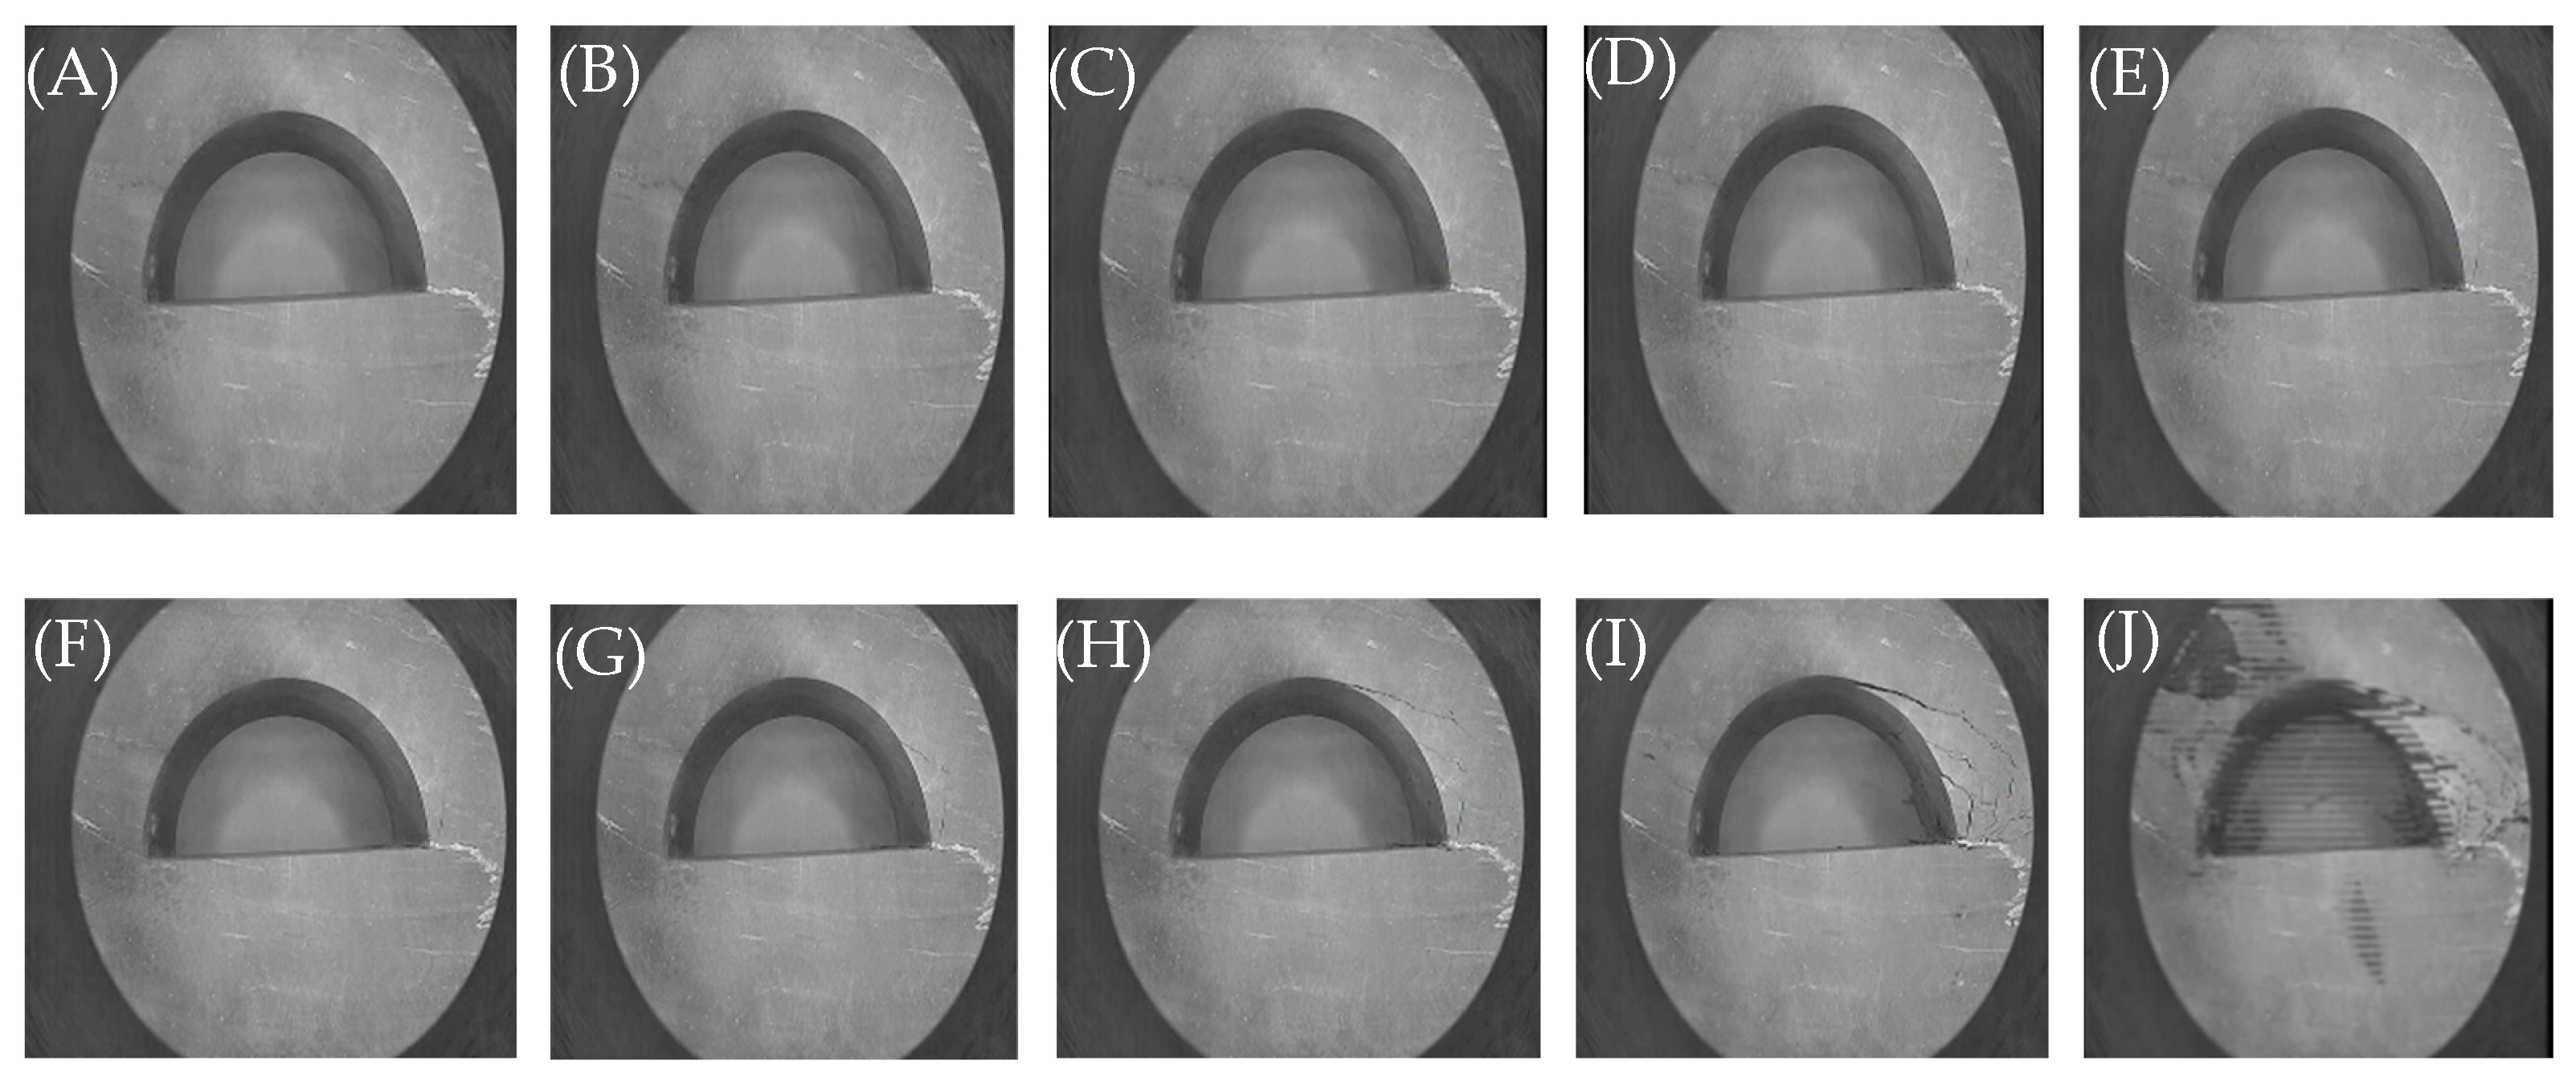
Figure 6 is the experimental stress–time curve of the upper step specimen. Figure 7 is the rockburst process image of the upper step specimen. Figure 8 is the total displacement cloud diagram of the upper step specimen. In general, before the buried depth of 1150 m, the average and maximum values of the total displacement were mainly concentrated in the left arch roof and the inner wall of the arch footing, and the total displacement of the remaining positions was small (Figure 8A–G). When the buried depth was 1050 m, the first closed fracture ring was generated (Figure 7F). With the further increase of the buried depth (1150–1250 m), the multiple fracture zones of the specimen were superimposed on each other, and a fracture zone with a certain width was formed on the surface of the tunnel surrounding rock (Figure 7G–H). Before the rockburst (Figure 7I), the fracture zone of the surrounding rock was characterized by banded and interval distribution. The average and maximum values of total displacement were mainly concentrated at the right arch roof and arch footing (Figure 8I). During the formation of the fracture zone, the mechanical properties of the surrounding rock deteriorated, and a considerable part of the elastic strain energy of the surrounding rock was consumed, thereby reducing the energy accumulation degree of the surrounding rock. When the buried depth was 1350 m, the depth of the stress concentration area transferred from the excavation contour to the deep part of the surrounding rock was further increased, and finally a slight rockburst failure occurred (Figure 7J). At this time, the average and maximum values of displacement reached the peak (Figure 8J). During the rockburst, only the shedding of the specimen epidermis and the ejection at the right arch foot were seen, the ejection speed was slow, and no obvious pit was formed.

3.1.2. Characteristics of Acoustic Emission Energy

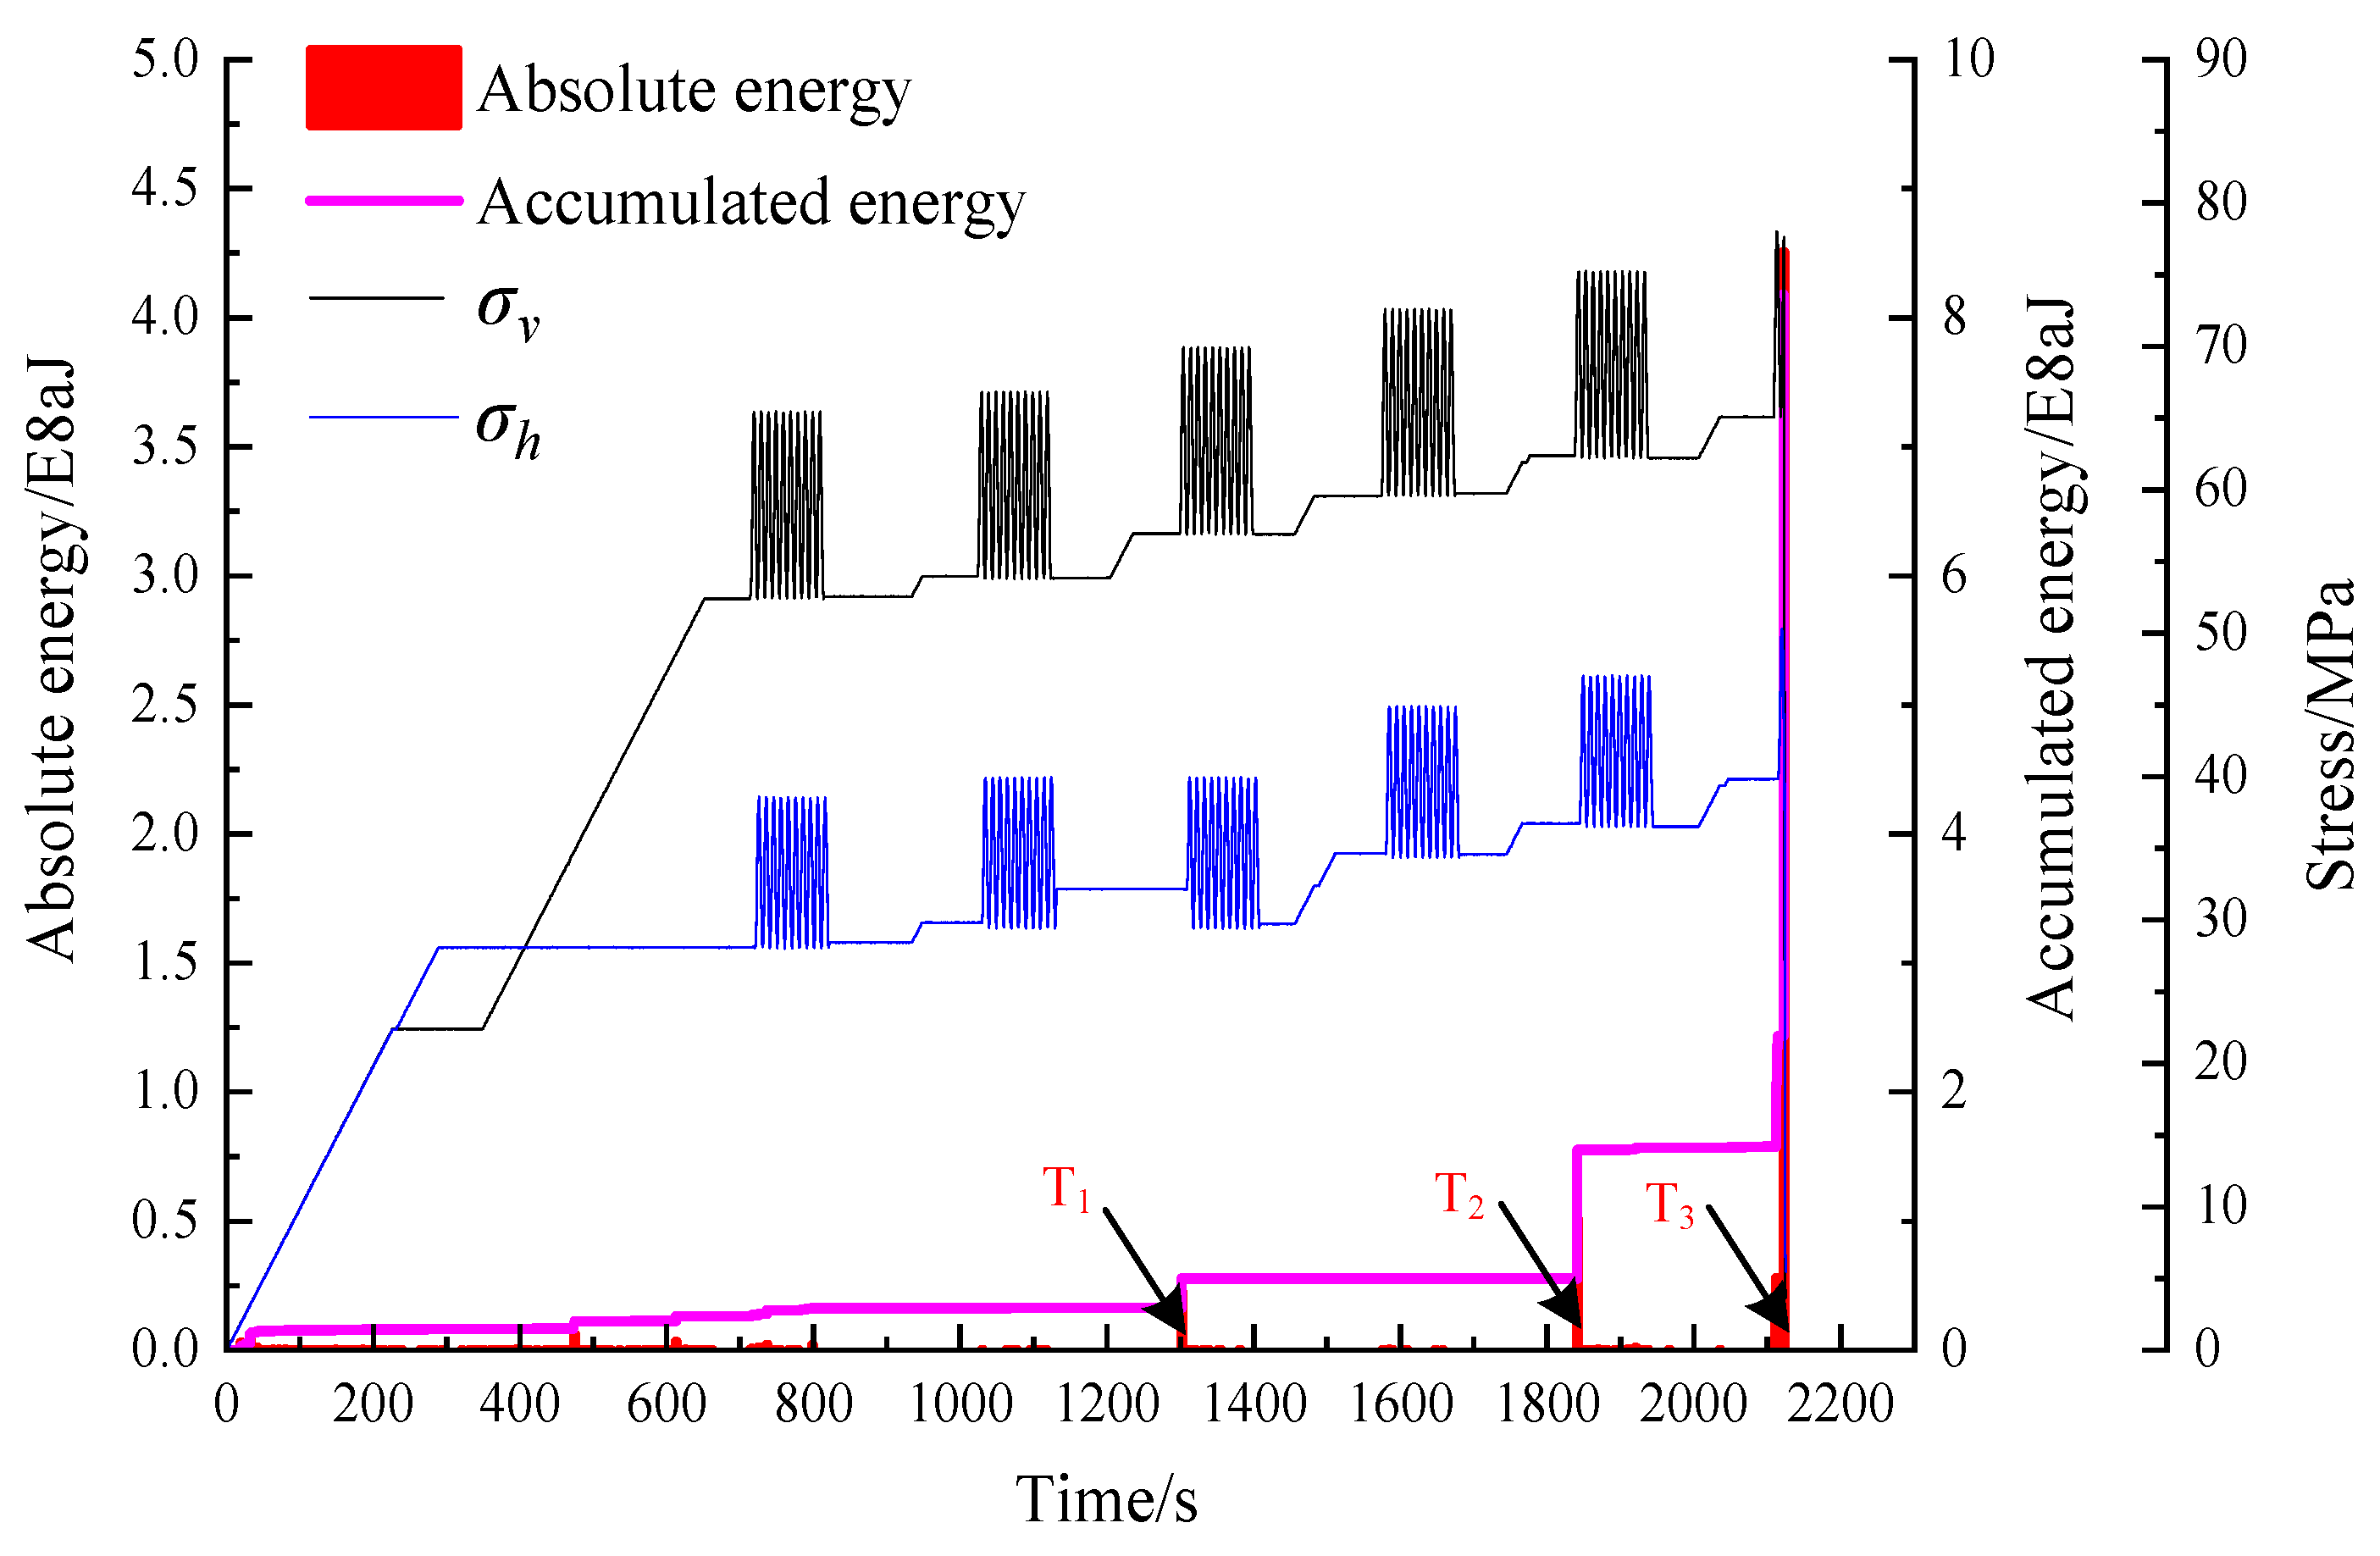
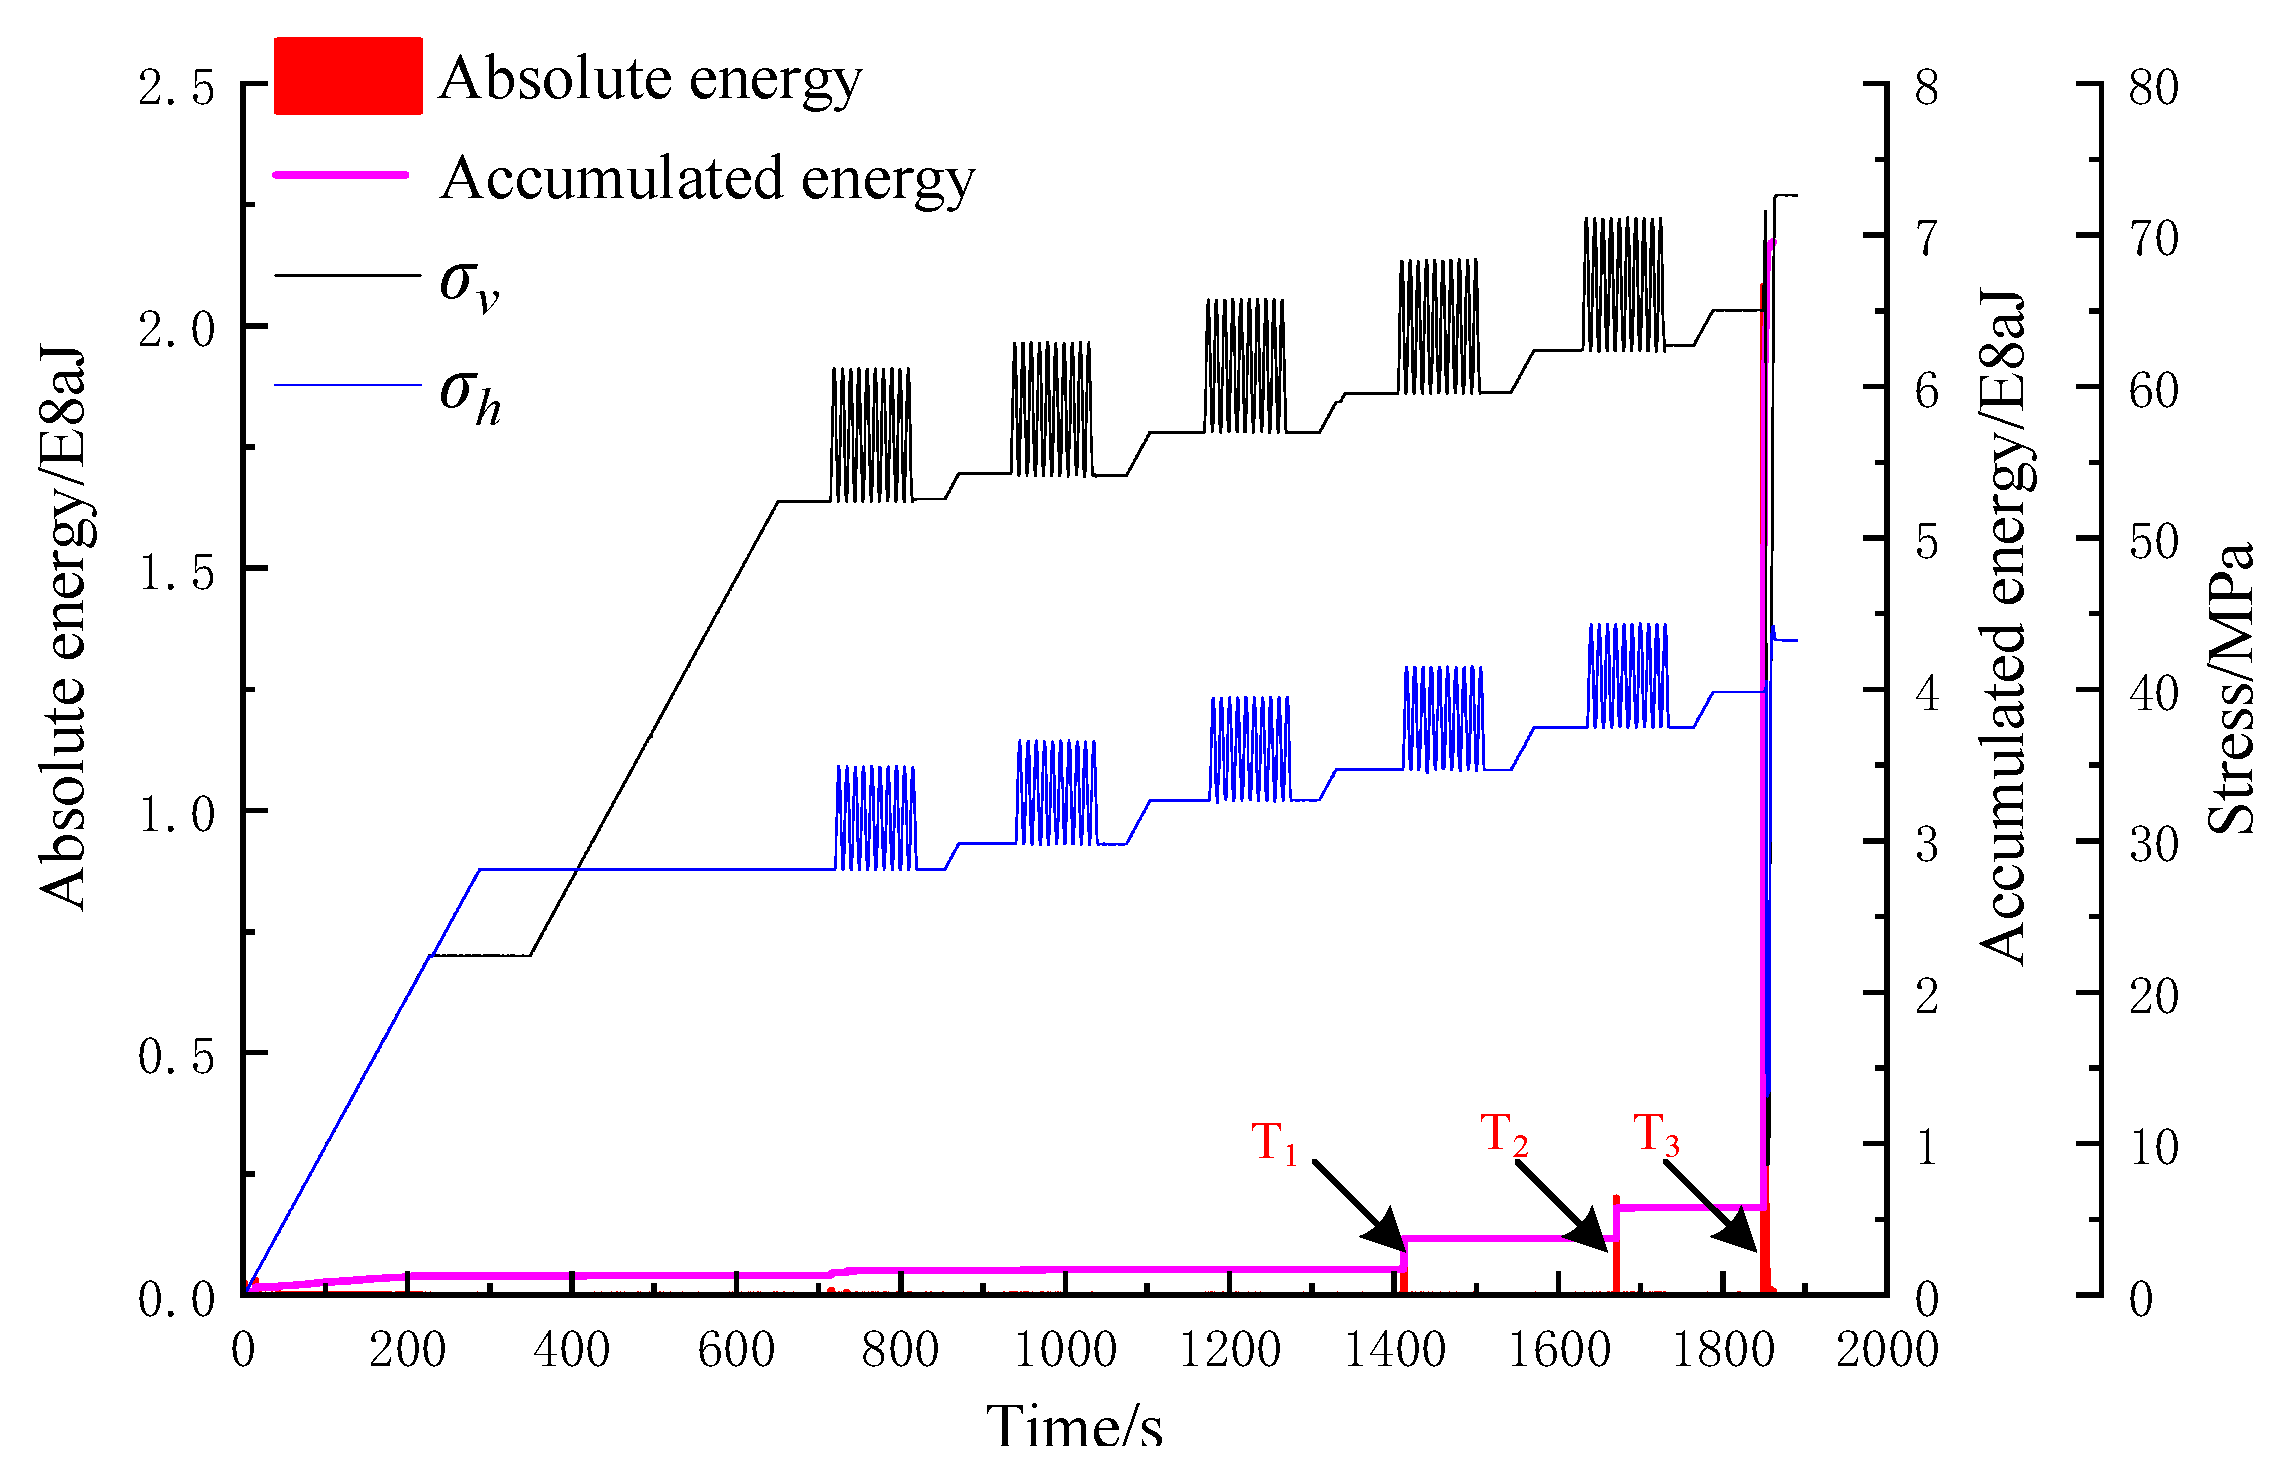
In acoustic emission nondestructive testing, the energy of acoustic emission signal is defined for the signal waveform, representing parameters related to the amplitude and amplitude distribution of acoustic emission signal, and corresponding to the released energy, which has important research significance for effectively measuring and accurately evaluating the degree of rock fracture and damage. Figure 9 is the acoustic emission absolute energy and accumulated energy diagram of the upper step specimen. Among them, T1, T2 and T3 were the key points at which the absolute energy of the three acoustic emissions changed abruptly. In general, the absolute energy of acoustic emission was released step by step in the whole process by using the step method, which led to the gradual growth of the accumulated energy curve of acoustic emission, and the effect of energy release step by step was achieved. In the initial geostress loading stage, the upper step specimen was affected by the crack propagation and grain slip in the rock, and the absolute energy and accumulated energy of acoustic emission were in a low and stable state. In the second half of the disturbance stage and the rockburst stage, the characteristics of steep increase and step-like rise were observed. During the disturbance process, an obvious acoustic emission energy release occurred at the T1 point of the upper step specimen, and the released energy was 2.24 × 10⁷ aJ. When the fifth-order disturbance was applied, there was also an obvious acoustic emission energy release, and the released energy was 5.06 × 10⁷ aJ. At this time, multiple transverse shear cracks occurred in the right arch roof and arch footing of the specimen, and then a fracture zone with a certain width was formed on the surface of the tunnel surrounding rock. Before the rockburst, a large number of acoustic emission energy releases of 1.15 × 10⁷ aJ~1.02 × 10⁸ aJ began to appear, which represented the process of further expansion and extension of cracks in the fracture zone of the specimen, and consumed a lot of energy in this process, and then the fracture zone of the surrounding rock showed the characteristics of banded and interval distribution, which played a role in reducing the risk and grade of rockburst. When the rockburst was destroyed, the absolute energy of the acoustic emission of the upper step specimen reached 4.25 × 10⁸ aJ, and the accumulated energy of the acoustic emission reached 8.18 × 10⁸ aJ.

3.1.3. Analysis of Characteristics of Two-Dimensional Spectrum

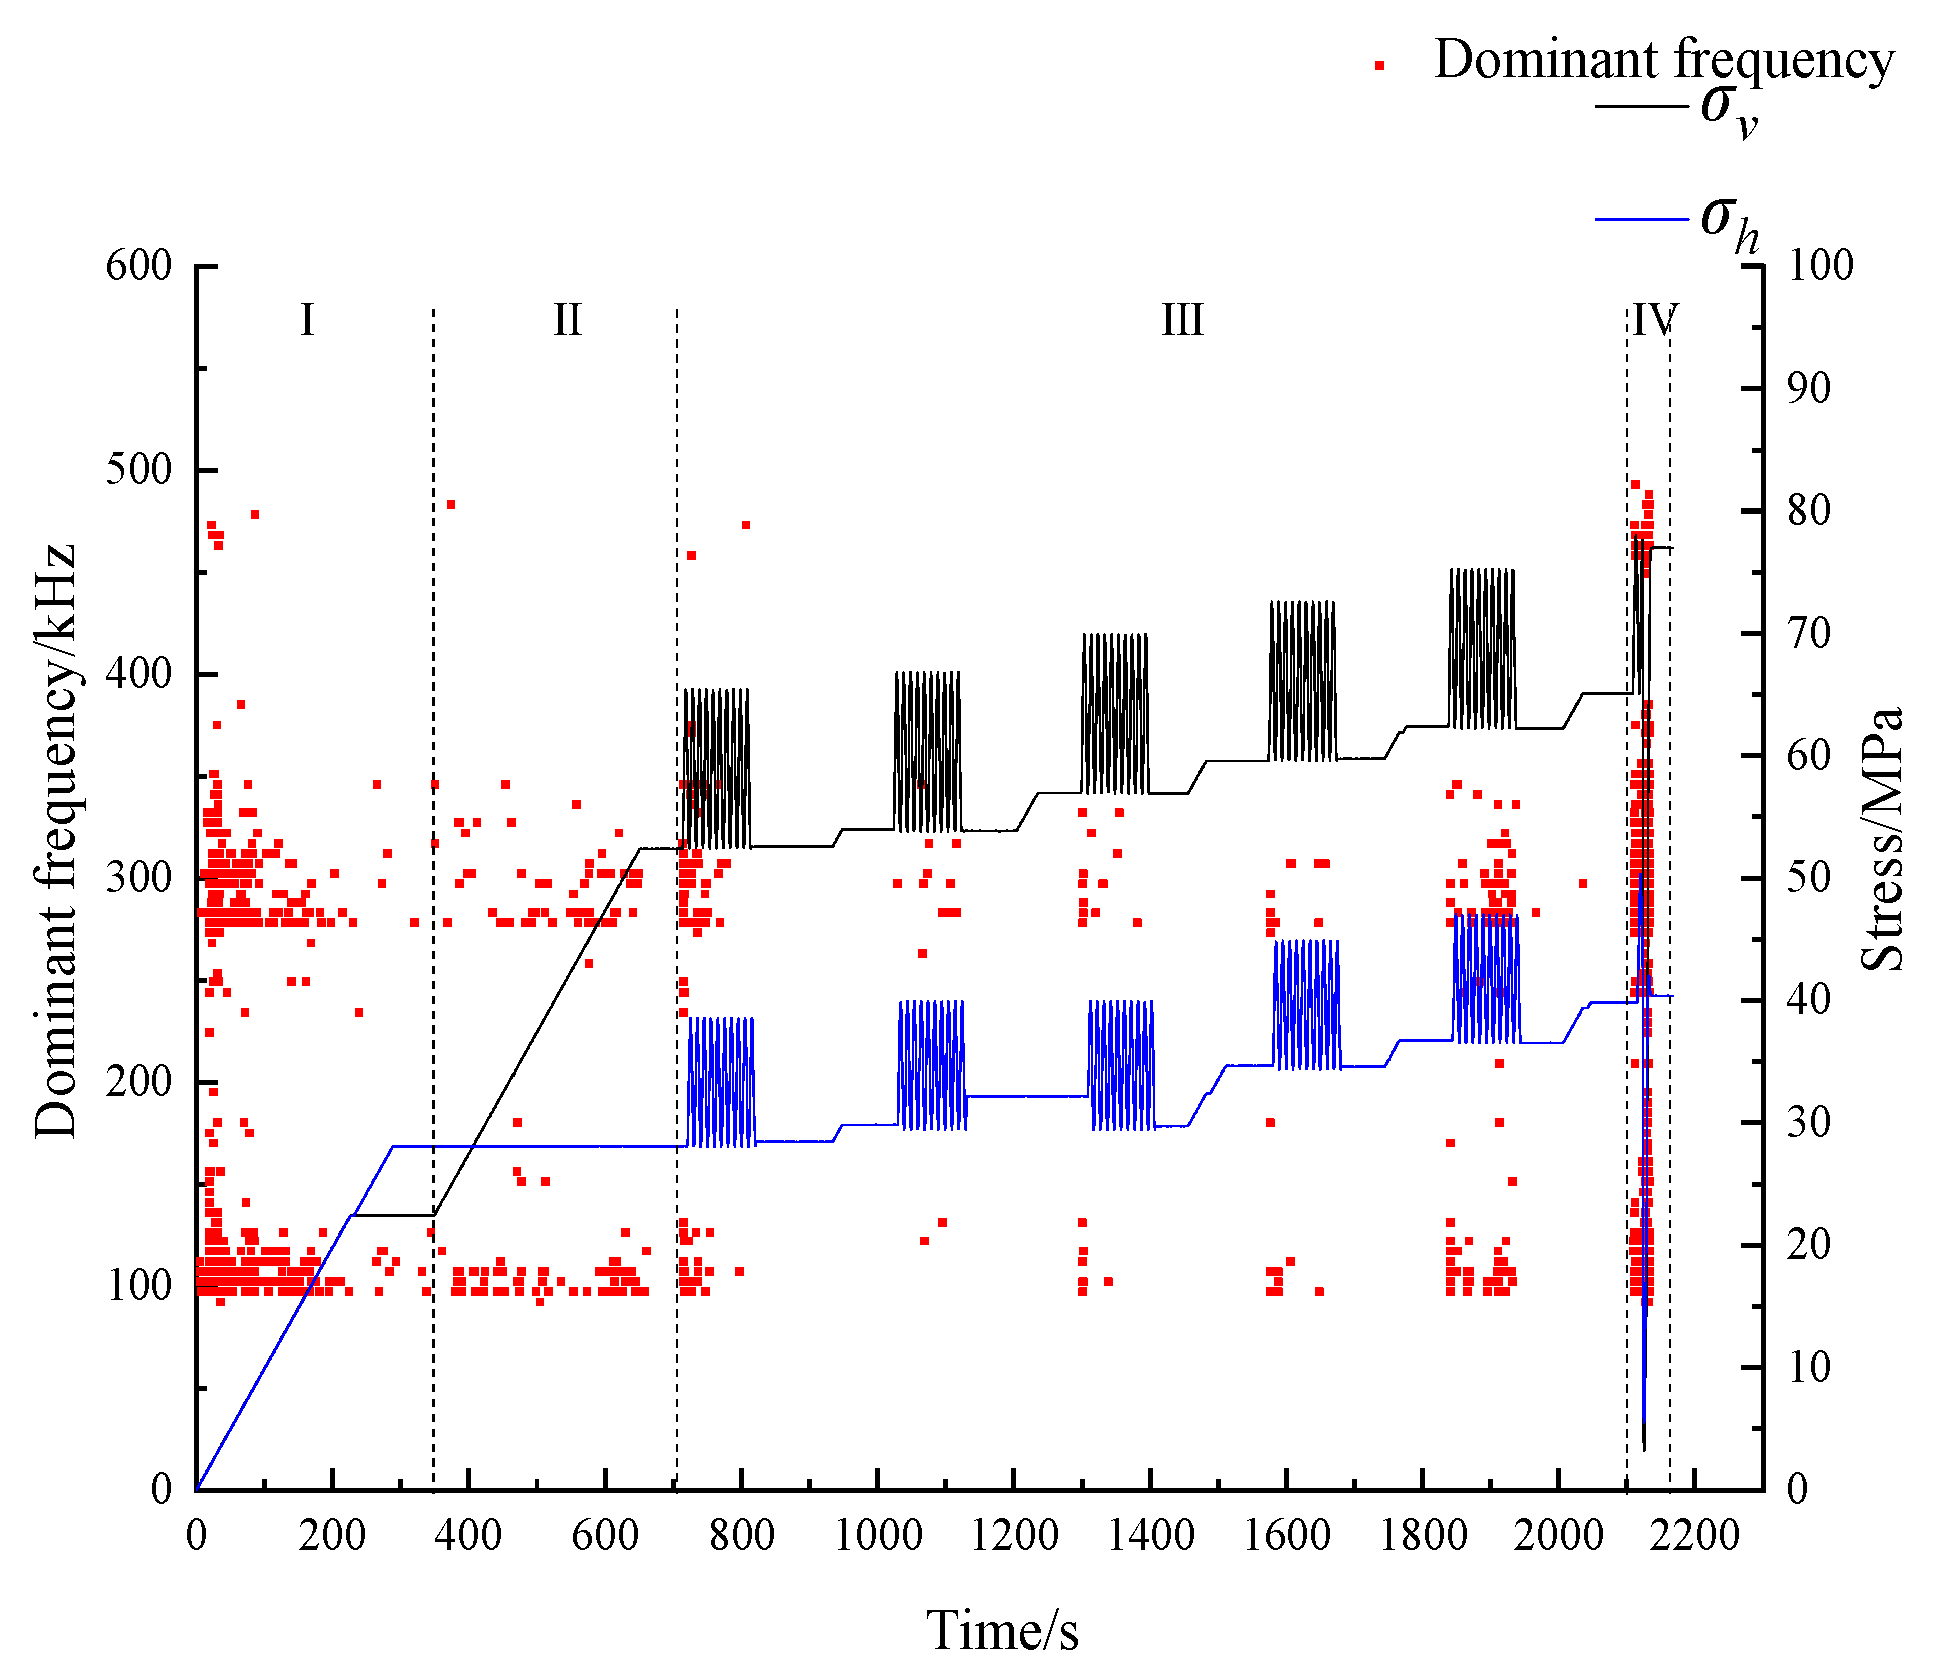
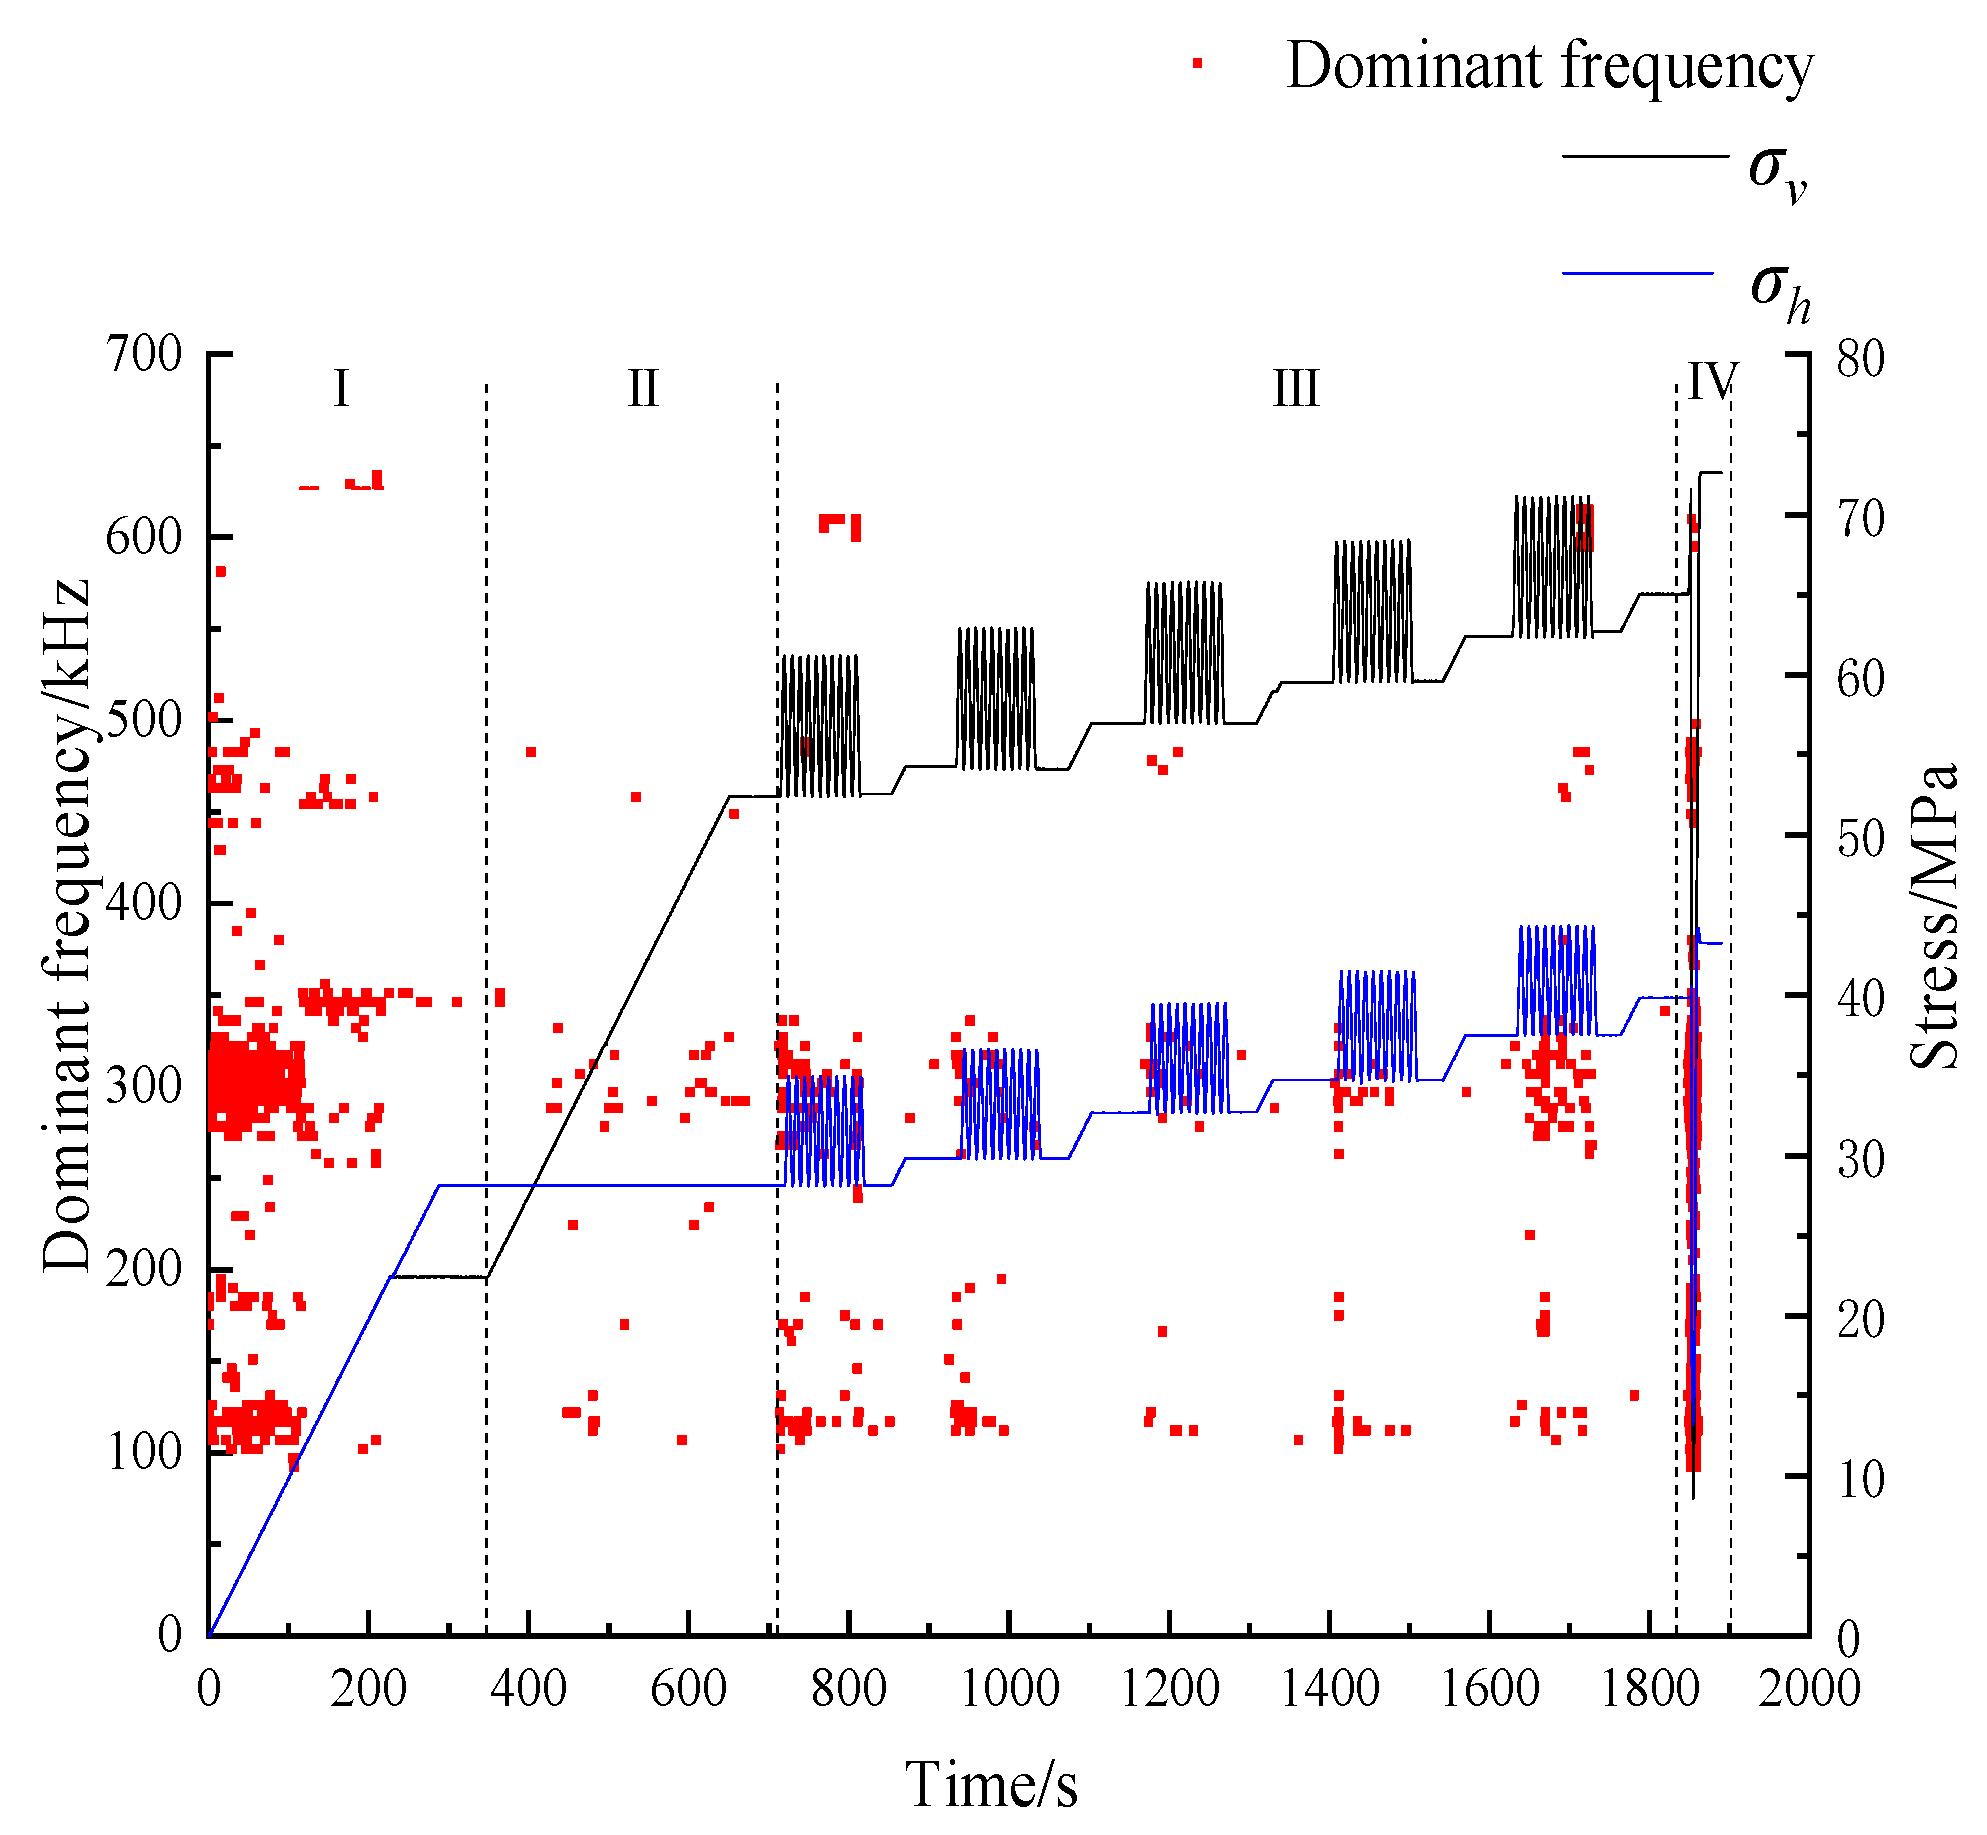
The original waveform file is transformed by a fast Fourier transform to obtain a two-dimensional spectrum diagram, in which the maximum amplitude of the two-dimensional spectrum diagram is the main frequency. Figure 10 is the main frequency diagram of the whole process of the upper step specimen. Table 1 is the proportion of the main frequency distribution of the upper step specimen. Based on the comprehensive analysis of Figure 10 and Table 1, the main frequency distribution of the experiment could be divided into four stages:
(1) I compaction stage: This stage was the geostress loading stage. The main frequency of this stage was mainly concentrated between 100 and 200 kHz, and 250 and 350 kHz, and the sum of the two was 89.63%. At this stage, there was also a small amount of signal with a main frequency of about 100 kHz, which was mainly caused by the disturbance of the load change to the original crack, resulting in a small amount of large-scale fracture inside the rock.
(2) II stress concentration stage: This stage was the vertical loading stage and the main stage of rockburst energy accumulation. The bandwidth of the main dominant frequency band remained stable, and there was no large-scale and large-scale fracture in the sample. With the increase in load, the elastic strain energy accumulated rapidly.
(3) III shock disturbance stage: In this stage, the low-frequency signal and high-frequency signal tended to be stable during the disturbance process, the fluctuation was obviously smaller, and the bandwidth of the main frequency band appeared from wide to narrow. The high-frequency band (450–600 kHz) had experienced a process from existence to nonexistence, which showed that after the optimization design of the step method, the elastic strain energy accumulated in the surrounding rock was released, and the energy accumulated in the rock mass did not exceed its energy storage limit. Under the premise of insufficient energy storage, the transformation from the original small-scale fracture to the larger-scale and large-scale fracture was inhibited. After experiencing multi-level burial depth, the low-frequency signal (100–200 kHz) and the intermediate frequency signal (250–350 kHz) increased slightly at the burial depth of 1250 m. The increase of medium- and low-frequency values meant the occurrence of large-scale and larger-scale fractures, respectively. Combined with the images, it could be seen that the generation of large-scale and larger-scale fractures released the high stress inside the surrounding rock, promoted the generation of cracks and formed a loose zone, thereby regulating the high elastic energy storage in the high-stress rock mass for pre-splitting rock mass and reducing the risk of rockburst.
(4) IV rockburst failure stage: At this stage, the acoustic emission frequency band showed a beam-like feature. There was no frequency band above 390–430 kHz and 500 kHz in this experiment, which reflected the non-intensity of the rockburst.

3.2. Analysis of Experimental Results of Lower Step Specimen

3.2.1. Space–Time Evolution Process of Deformation and Fracture of Surrounding Rock

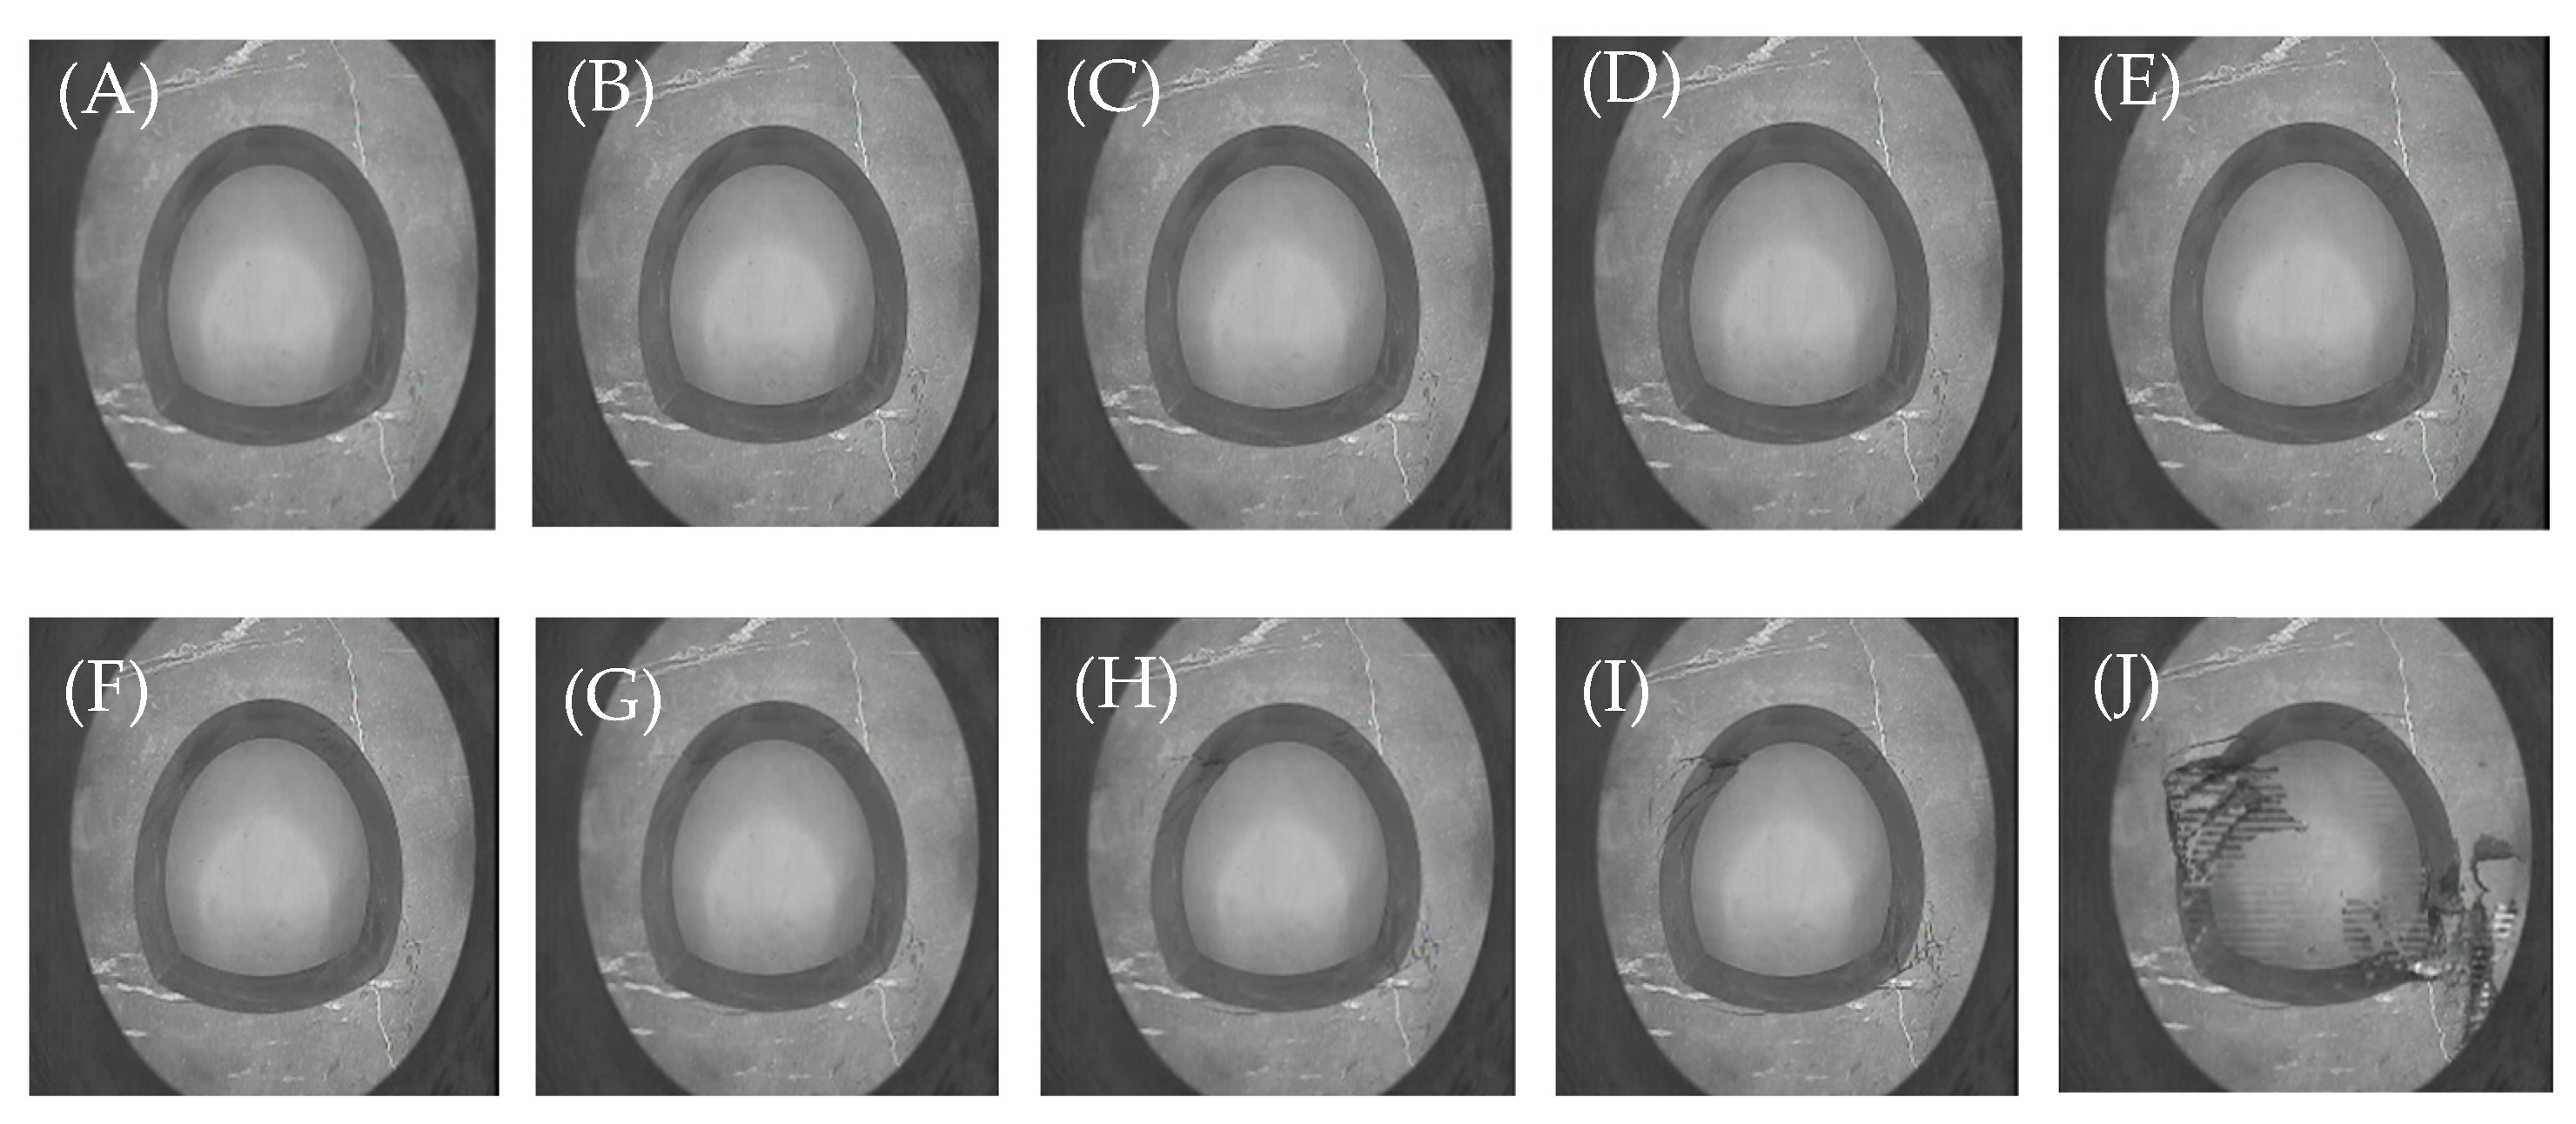
Figure 11 is the experimental stress–time curve of the lower step specimen. Figure 12 is the rockburst process image of the lower step specimen. Figure 13 is the total displacement cloud diagram of the lower step specimen. In general, before the rockburst, the average and maximum values of the total displacement basically showed the characteristics of circumferential distribution (Figure 13A–I). Starting from the buried depth of 850 m, the deformation and fracture of the lower step specimens were initiated at the inner walls of the left and right sides (Figure 12A–E), and the shear deformation could be judged from the direction of the displacement vector (Figure 13A–E). With the further increase of the buried depth (1050–1250 m), the cracks would extend to the deep part of the surrounding rock, and intersect and connect with each other in the process of expansion. The surrounding rock near the left spandrel, haunch, right spandrel and arch footing was cut into a fractured rock mass containing different blocks of wedges, that is, a zonal fracture phenomenon similar to “logarithmic spiral” (Figure 12F–H). When the buried depth was 1350 m, the average and maximum values of the total displacement of the specimen reached the peak at the critical moment (Figure 13I). Subsequently, slight rockburst damage occurred at the left spandrel, haunch, right haunch and arch footing (Figure 12J). The rockburst at the right haunch and arch footing only showed the shedding of the specimen skin, the ejection speed was slow, and no obvious pit was formed. When the step method was used for construction, the upper step usually adopted the method of shotcrete to seal the surrounding rock. Therefore, the slight rockburst phenomenon of the upper step would be obviously weakened in the actual construction.

3.2.2. Characteristics of Acoustic Emission Energy

Figure 14 is the acoustic emission absolute energy and accumulated energy diagram of the lower step specimen. Among them, T1, T2 and T3 were the key points at which the absolute energy of the three acoustic emissions changed abruptly. In general, the absolute energy and accumulated energy curves of acoustic emission of the lower step specimen and upper step specimen had a high similarity. The difference was that when the lower step specimen was disturbed in the fourth stage, a large acoustic emission energy release occurred, and the released energy was about 1.17 × 10⁷ aJ. At this time, the shear cracks appearing in the specimen intersected with each other during the expansion process, forming a local penetration and resulting in a “logarithmic spiral” partition fracture phenomenon and a trend of flake spalling. When the fifth-order perturbation was applied, there was also a significant release of acoustic emission energy, which was about 2.0 × 10⁷ aJ, representing the development of the “logarithmic spiral” zonal disintegration phenomenon at the right arch footing. With the continuous development and penetration of cracks, when the sixth-order disturbance was applied, the acoustic emission signal was concentrated and the energy was huge, releasing a large amount of energy, and finally rockburst occurred. When the rockburst was destroyed, the absolute energy of acoustic emission of the lower step specimen reached 2.08 × 10⁸ aJ, and the accumulated energy of acoustic emission could reach 2.67 × 10⁸ aJ.

3.2.3. Analysis of Characteristics of Two-Dimensional Spectrum

Figure 15 shows the main frequency diagram of the whole process of the lower step specimen. Table 2 shows the proportion of the main frequency distribution of the lower step specimen. Based on the comprehensive analysis of Figure 15 and Table 2, the main frequency distribution of the experiment could be divided into four stages:
(1) I compaction stage and II stress concentration stage: The prominent feature of this process was the rapid accumulation of elastic strain energy of the specimen. The main frequencies of the two stages were mainly concentrated between 100 and 200 kHz, 250 and 350 kHz, and 450 and 600 kHz.
(2) III impact disturbance stage: compared with the upper step specimen, the same point was that the bandwidth of the main frequency band also appeared from wide to narrow, but the overall change tended to be stable. The high-frequency (480–600 kHz) and ultra-highfrequency (600–700 kHz) bands showed a process from scratch. Different from the upper step specimen, the frequency band of high frequency (450–500 kHz) and ultra-high frequency (600–700 kHz) appeared after the experience of multi-level buried depth and at the buried depth of 1250 m, and the intermediate frequency signal (250–350 kHz) increased at the same time. The appearance of high-frequency value and ultra-high frequency value represented the initiation of small size and smaller size cracks in the specimen. The increase of medium frequency value meant the occurrence of large-scale fracture. The simultaneous appearance of the two indicated that at this stage, the rapid development of cracks of different scales caused the occurrence of zonal fracture similar to the “logarithmic spiral” type. Different from the zonal fracture phenomenon of the “banded and interval distribution” of the upper specimen, this fracture difference was mainly caused by the difference in the shape and size of the section between the two.
(3) IV rockburst failure stage: This stage was similar to the upper step specimen, and the acoustic emission frequency band showed a bunchy feature. However, the bandwidth was basically stable. Compared with the previous two groups of mechanism experiments, there was no frequency band of 390–430 kHz and 600–700 kHz, which reflected the non-intensity of rockburst.

4. Discussion and Conclusions

4.1. Discussion

(1) The analysis results of acoustic emission energy and two-dimensional spectrum show that the step method can realize the step-by-step release of rockburst energy and achieve a good rockburst control effect. The method is in the form of “rupture bands” or “logarithmic spirals” to resist rockbursts.
(2) There are two disadvantages of this method. First, the step method can control rockbursts at the cost of expanding the plastic zone, which may cause safety hazards such as roof fall, collapse and sliding instability, or lead to more serious secondary disasters. Second, the method increases the buried depth of rockburst resistance to less than 1350 m. In view of this, supporting measures will be adopted to carry out explosion-proof support design, and relevant experimental studies will be further carried out to meet the needs of site safety construction.

4.2. Conclusions

(1) From the perspective of the space–time evolution process of deformation and fracture of surrounding rock, the surrounding rock under the excavation of step method resisted rockburst in the form of “fracture zone” or “logarithmic spiral” in the process of deformation and fracture. The range of rockburst area was effectively reduced, and the risk level and intensity of rockburst were effectively reduced, which realized the gradual release of rockburst energy and the treatment and improvement of tunnel rockburst.
(2) From the perspective of characteristics of acoustic emission energy, although the buried depth continued to increase by using the excavation of step method, the absolute energy and cumulative energy of acoustic emission of each key point of the two specimens maintained a small value, which realized the gradual release of rockburst energy.
(3) From the perspective of characteristics of two-dimensional spectrum, after the excavation optimization design, the frequency band range was relatively fixed, which showed that the high frequency and ultrahigh frequency values of the acoustic emission waveform signal fluctuated greatly, while the low frequency and ultralow frequency values changed little, indicating that during the experiment, the formation of small-scale and smaller-scale cracks in the interior had random characteristics, while large-scale and larger-scale fractures had certain commonalities, which were characterized by zonal fracture.

Author Contributions

Conceptualization, X.S.; methodology, D.L.; software, C.R. and J.Y.; validation, X.S.; formal analysis, C.R.; investigation, D.L.; data curation, C.R.; writing—original draft preparation, C.R.; writing—review and editing, J.Y.; project administration, X.S.; funding acquisition, X.S. and D.L. All authors have read and agreed to the published version of the manuscript.

Funding

This research was funded by the National Natural Science Foundation of China, grant number (5217042575, 52074299); Key Scientific Research Project of Gansu Provincial Department of Transportation, grant number (u150154); Fundamental Research Funds for the Central Universities, grant number (2023JCCXSB02).

Institutional Review Board Statement

Not applicable.

Informed Consent Statement

Not applicable.

Data Availability Statement

All data included in this study are available upon request by contact with the corresponding author.

Conflicts of Interest

Author Jinkun Yang was employed by the company Shanxi Transportation Research Institute Group Co., Ltd. The remaining authors declare that the research was conducted in the absence of any commercial or financial relationships that could be construed as a potential conflict of interest.

References

  1. Li, G.K.; Xue, Y.G.; Qu, C.Q.; Qiu, D.H.; Wang, P.; Liu, Q.S. Intelligent prediction of rockburst in tunnels based on back propagation neural network integrated beetle antennae search algorithm. Environ. Sci. Pollut. Res. 2023, 30, 33960–33973. [Google Scholar]
  2. He, X.Q.; Zhou, C.; Song, D.Z.; Li, Z.L.; Cao, A.Y.; He, S.Q.; Khan, M. Mechanism and monitoring and early warning technology for rockburst in coal mines. Int. J. Miner. Metall. Mater. 2021, 28, 1097–1111. [Google Scholar]
  3. Niu, W.J.; Feng, X.T.; Feng, G.L.; Xiao, Y.X.; Yao, Z.B.; Zhang, W.; Hu, L. Selection and characterization of microseismic information about rock mass failure for rockburst warning in a deep tunnel. Eng. Fail. Anal. 2022, 131, 105910. [Google Scholar] [CrossRef]
  4. Sun, L.J.; Hu, N.Y.; Ye, Y.C.; Tan, W.K.; Wu, M.L.; Wang, X.H.; Huang, Z.Y. Ensemble stacking rockburst prediction model based on Yeo-Johnson, K-means SMOTE, and optimal rockburst feature dimension determination. Sci. Rep. 2022, 12, 15352. [Google Scholar] [CrossRef]
  5. Wang, G.F.; Gong, S.Y.; Dou, L.M.; Cai, W.; Yuan, X.Y.; Fan, C.J. Rockburst mechanism and control in coal seam with both syncline and hard strata. Saf. Sci. 2019, 115, 320–328. [Google Scholar]
  6. Konicek, P.; Waclawik, P. Stress changes and seismicity monitoring of hard coal longwall mining in high rockburst risk areas. Tunn. Undergr. Space Technol. 2018, 81, 237–251. [Google Scholar] [CrossRef]
  7. Vennes, I.; Mitri, H.; Chinnasane, D.R.; Yao, M.K. Large-scale destress blasting for seismicity control in hard rock mines: A case study. Int. J. Min. Sci. Technol. 2020, 30, 141–149. [Google Scholar]
  8. Vennes, I.; Mitri, H.; Chinnasane, D.R.; Yao, M.K. Effect of Stress Anisotropy on the Efficiency of Large-Scale Destress Blasting. Rock Mech. Rock Eng. 2021, 54, 31–46. [Google Scholar] [CrossRef]
  9. Gao, H.; Zhao, W.S.; Chen, W.Z.; Xie, P.Y.; Zhong, K.; Qin, C.K. Continuous three-dimensional stress monitoring in roof of coal mines for investigating the rockburst control effect with hydraulic fracturing. Environ. Earth Sci. 2022, 81, 433. [Google Scholar]
  10. Feng, X.T.; Liu, J.P.; Chen, B.R.; Xiao, Y.X.; Feng, G.L.; Zhang, F.P. Monitoring, Warning, and Control of Rockburst in Deep Metal Mines. Engineering 2014, 3, 538–545. [Google Scholar]
  11. Kaiser, P.; Mccreath, D.; Tannant, D. Canadian Rockburst Support Handbook; CAMIRO Mining Division: Sudbury, ON, Canada, 1996. [Google Scholar]
  12. Li, C.C. Principles and methods of rock support for rockburst control. J. Rock Mech. Geotech. Eng. 2021, 13, 46–59. [Google Scholar]
  13. Wang, Q.; Wu, W.R.; Wang, Y.T.; He, M.C.; Xue, H.J.; Wei, H.Y. Evolution and Control Mechanism of Rockburst in Rock Anchored by New Energy-Absorbing Material CREA material bolt. Rock Mech. Rock Eng. 2023, 56, 4569–4582. [Google Scholar]
  14. He, M.C.; Li, C.; Gong, W.L.; Wang, J.; Tao, Z.G. NPR bolt/cable support principle and large deformation control technology. J. Rock Mech. Eng. 2016, 35, 1513–1529. [Google Scholar]
  15. Luo, S.; Gong, F.Q. Evaluation of energy storage and release potentials of highly stressed rock pillar from rockburst control perspectives. Int. J. Rock Mech. Min. Sci. 2023, 163, 105324. [Google Scholar]
  16. Tang, J.L.; Li, T.B.; Zeng, P.; Han, Y.X.; Zhou, X.H. Study on rockburst flexible protective net and its dynamic characteristics. Chin. J. Rock Mech. Eng. 2019, 38, 794–797. [Google Scholar]
  17. Lu, X.F.; Pan, Y.S. The Oretical Analysis and Experimental Research on Rockburst Prevention Mechanism of Rigid-Flexible-Rigid Supporting Structure. Chin. J. Rock Mech. Eng. 2012, 31, 52–59. [Google Scholar]
  18. Wu, A.X.; Sun, Y.Z.; Sen, G.; Shen, H.M.; Yang, B.H. Characteristics of rockburst and its mining technology in mines. J. Cent. South Univ. Technol. 2002, 9, 255–259. [Google Scholar]
  19. Zhou, C.; Zhu, S.T.; Li, J.J.; Jiang, F.X.; Gao, Y.T.; Qu, X.C.; Ji, M.W.; Wei, Q.D. Basic Research on Rockburst Control Technology for Deep Well Filling of Municipal Solid Waste. Lithosphere 2022, 2022, 7262715. [Google Scholar]
  20. Liu, Y.; Lu, C.P.; Zhang, H. Mutation effect of acoustic and electromagnetic emissions of hard rock impact failure. Int. J. Distrib. Sens. Netw. 2019, 15, 1550147718824473. [Google Scholar]
  21. Su, G.S.; Li, P.F.; Xu, H.J.; Liu, X.J. A two-step method for predicting rockburst using sound signals. Acta Geotech. 2024, 19, 273–303. [Google Scholar]
  22. Zhang, Z.; Wang, E.; Zhang, H.; Bai, Z.; Zhang, Y.; Chen, X. Research on nonlinear variation of elastic wave velocity dispersion characteristic in limestone dynamic fracture process. Fractals 2023, 31, 2350008. [Google Scholar]
  23. Sun, X.M.; Xu, H.C.; Zheng, L.G.; He, M.C.; Gong, W.L. An experimental investigation on acoustic emission characteristics of sandstone rockburst with different moisture contents. Sci. China Technol. Sci. 2016, 59, 1549–1558. [Google Scholar]
  24. Hu, X.C.; Su, G.S.; Chen, G.Y.; Mei, S.M.; Feng, X.T.; Mei, G.X.; Huang, X.H. Experiment on Rockburst Process of Borehole and Its Acoustic Emission Characteristics. Rock Mech. Rock Eng. 2019, 52, 783–802. [Google Scholar]
  25. He, M.C.; Miao, J.L.; Feng, J.L. Rock burst process of limestone and its acoustic emission characteristics under true-triaxial unloading conditions. Int. J. Rock Mech. Min. Sci. 2009, 47, 286–298. [Google Scholar]
  26. Zhai, S.B.; Su, G.S.; Yin, S.D.; Yan, S.Z.; Wang, Z.F.; Yan, L.B. Fracture evolution during rockburst under true-triaxial loading using acoustic emission monitoring. Bull. Eng. Geol. Environ. 2020, 79, 4957–4974. [Google Scholar]
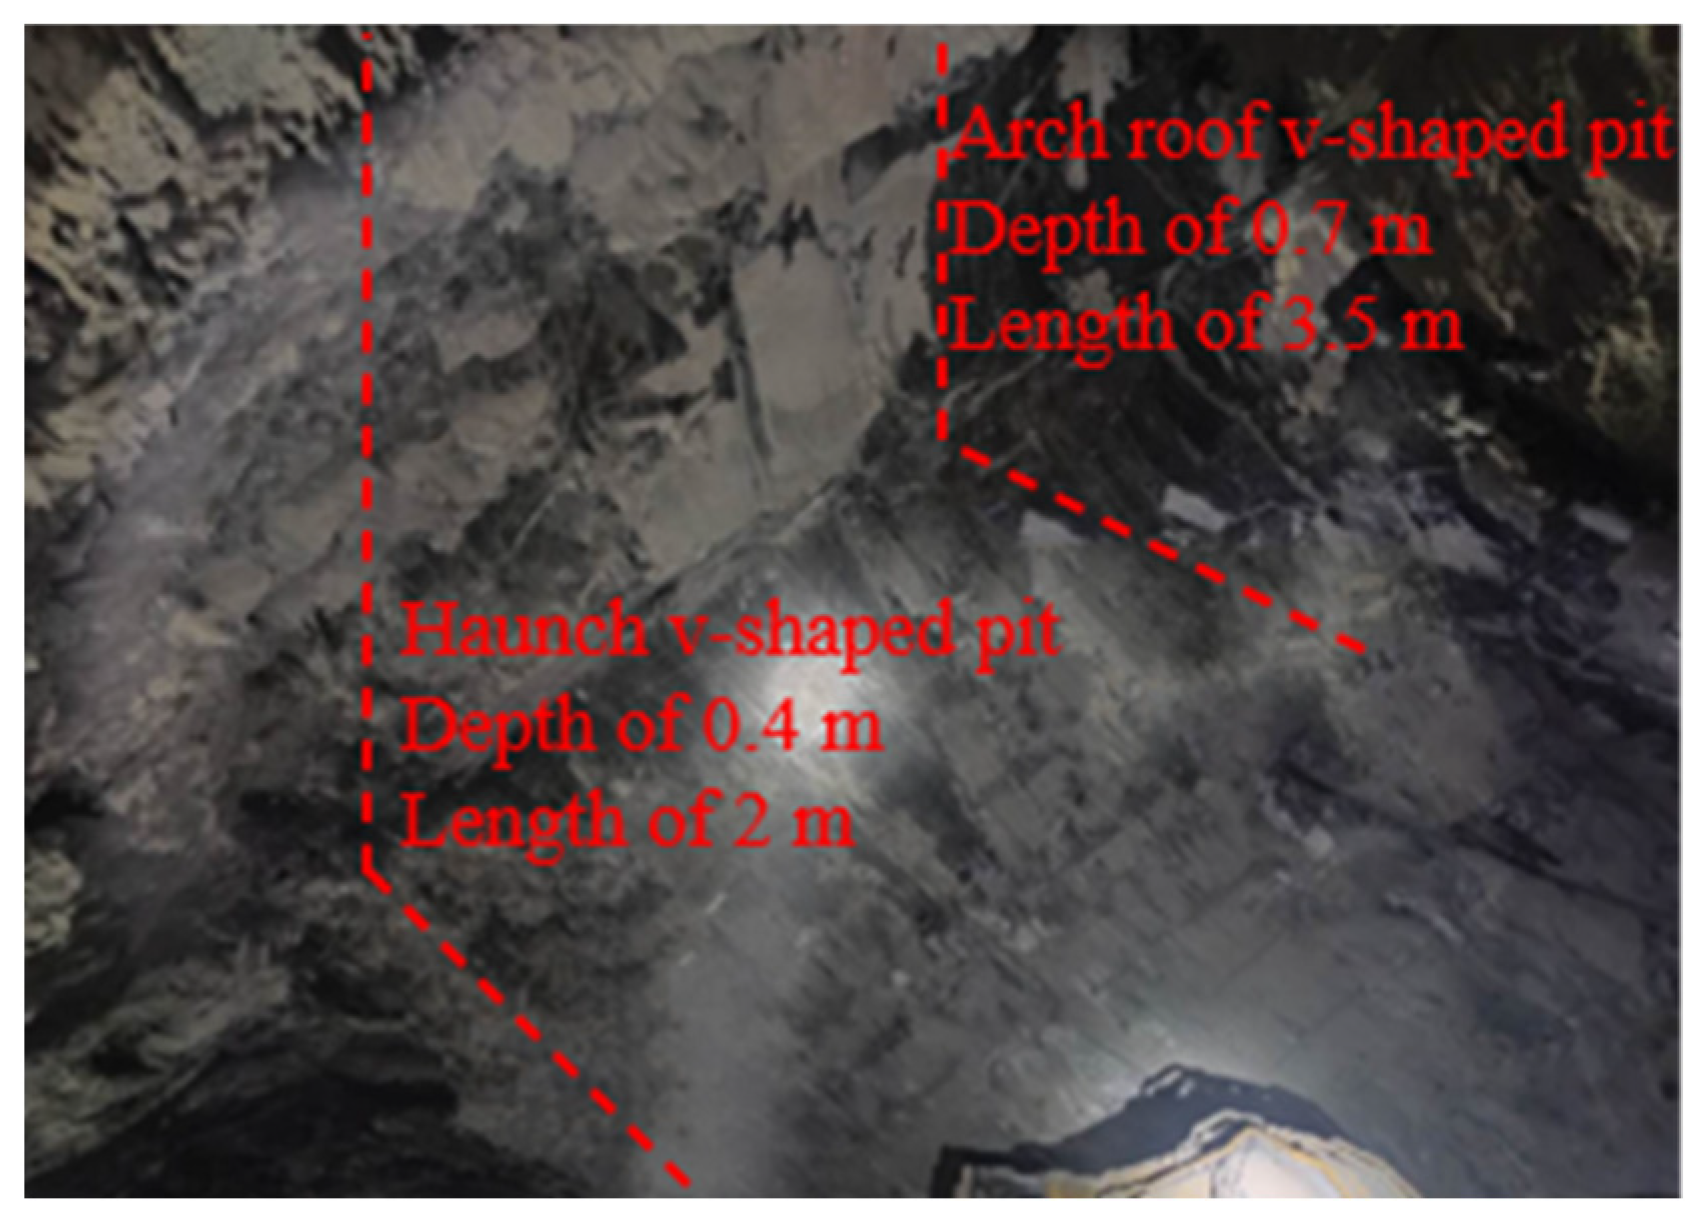
Figure 1. Rockburst phenomenon.
Applsci 15 03853 g001
Figure 2. Excavation optimization design drawing of step method: (a) longitudinal section diagram of step method of excavation; (b) facade of step method of excavation.
Applsci 15 03853 g002
Figure 3. Experimental system of impact-induced rockburst: (a) schematic diagram of the test system; (b) picture of the test system.
Applsci 15 03853 g003
Figure 4. Specimen size design of upper and lower steps: (a) upper step; (b) lower step.
Applsci 15 03853 g004
Figure 5. Rockburst experimental model of Gaoloushan Tunnel by step method: (a) lower step; (b) longitudinal profile of tunnel; (c) upper step.
Applsci 15 03853 g005
Figure 6. Experimental stress–time curve of upper step specimen.
Applsci 15 03853 g006
Figure 7. Experimental process images of upper step specimen: (A) initial control, t = 0 s, σv = 0 MPa, σh = 0 MPa; (B) initial geostress, t = 335 s, σv = 22.4 MPa, σh = 28.1 MPa; (C) vertical loading, t = 684 s, σv = 52.4 MPa, σh = 28.1 MPa; (D) the first-level disturbance, t = 880 s, σv = 52.5 MPa, σh = 28.1 MPa; (E) the second -level disturbance, t = 1168 s, σv = 54.1 MPa, σh = 29.8 MPa; (F) the third-level disturbance, t = 1423 s, σv = 56.9 MPa, σh = 32.7 MPa (G) the fourth-level disturbance, t = 1707 s, σv = 59.6 MPa, σh = 34.7 MPa; (H) the fifth-level disturbance, t = 1980 s, σv = 62.7 MPa, σh = 37.5 MPa; (I) critical moment, t = 2122.59 s, σv = 77.62 MPa, σh = 43.67 MPa; (J) rockburst ejection, t = 2123.19 s, σv = 75.6 MPa, σh = 42.51 MPa.
Applsci 15 03853 g007
Figure 8. Contours of total displacement of upper step specimen: (A) initial control, t = 0 s, σv = 0 MPa, σh = 0 MPa; (B) initial geostress, t = 335 s, σv = 22.4 MPa, σh = 28.1 MPa; (C) vertical loading, t = 684 s, σv = 52.4 MPa, σh = 28.1 MPa; (D) the first-level disturbance, t = 880 s, σv = 52.5 MPa, σh = 28.1 MPa; (E) the second-level disturbance, t = 1168 s, σv = 54.1 MPa, σh = 29.8 MPa; (F) The third-level disturbance, t = 1423 s, σv = 56.9 MPa, σh = 32.7 MPa; (G) the fourth-level disturbance, t= 1707 s, σv = 59.6 MPa, σh = 34.7 MPa; (H) the fifth-level disturbance, t =1981 s, σv = 62.7 MPa, σh = 37.5 MPa; (I) critical moment, t = 2122.59 s, σv = 77.62 MPa, σh = 43.67 MPa; (J) rockburst ejection, t = 2123.19 s, σv = 75.6 MPa, σh = 42.51 MPa.
Applsci 15 03853 g008
Figure 9. Diagram of acoustic emission absolute energy and accumulated energy about upper step specimen.
Applsci 15 03853 g009
Figure 10. Main frequency diagram in the whole process of upper step specimen.
Applsci 15 03853 g010
Figure 11. Experimental stress–time curve of lower step specimens.
Applsci 15 03853 g011
Figure 12. Experimental process images of lower step specimen: (A) initial control, t = 0 s, σv = 0 MPa, σh = 0 MPa; (B) initial geostress, t = 320 s, σv = 22.4 MPa, σh = 28.1 MPa; (C) vertical loading, t = 675 s, σv = 52.4 MPa, σh = 28.1 MPa; (D) the first-level disturbance, t = 835 s, σv = 52.5 MPa, σh = 28.1 MPa; (E) the second-level disturbance, t = 1050 s, σv = 54.1 MPa, σh = 29.8 MPa; (F) the third-level disturbance, t = 1290 s, σv = 56.9 MPa, σh = 32.7 MPa; (G) the fourth-level disturbance, t = 1525 s, σv = 59.6 MPa, σh = 34.7 MPa; (H) the fifth-level disturbance, t = 1745 s, σv = 62.7 MPa, σh = 37.5 MPa; (I) critical moment, t = 1851.54 s, σv = 70.78 MPa, σh = 39.83 MPa; (J) rockburst ejection, t = 1851.91 s, σv = 71.57 MPa, σh = 39.92 MPa.
Applsci 15 03853 g012
Figure 13. Contours of total displacement of lower step specimen: (A) initial control, t = 0 s, σv = 0 MPa, σh = 0 MPa; (B) initial geostress, t = 320 s, σv = 22.4 MPa, σh = 28.1 MPa; (C) vertical loading, t = 675 s, σv = 52.4 MPa, σh = 28.1 MPa; (D) the first-level disturbance, t = 835 s, σv = 52.5 MPa, σh = 29.8 MPa; (E) the second-level disturbance, t = 1050 s, σv = 54.1 MPa, σh = 32.7 MPa; (F) the third-level disturbance, t = 1290 s, σv = 56.9 MPa, σh = 28.1 MPa; (G) the fourth-level disturbance, t = 1525 s, σv = 59.6 MPa, σh = 34.7 MPa; (H) the fifth-level disturbance, t = 1745 s, σv = 62.7 MPa, σh = 37.5 MPa; (I) critical moment, t = 1851.54 s, σv = 70.78 MPa, σh = 39.83 MPa; (J) rockburst ejection, t = 1851.91 s, σv = 71.57 MPa, σh = 39.92 MPa.
Applsci 15 03853 g013
Figure 14. Diagram of acoustic emission absolute energy and accumulated energy about lower step specimen.
Applsci 15 03853 g014
Figure 15. Diagram of acoustic emission energy and accumulated energy about lower step specimen.
Applsci 15 03853 g015
Table 1. Main frequency distribution ratio of upper step.
StagesSignal Proportion (%)
Low Frequency (100~200 kHz)Intermediate Frequency (250~350 kHz)High Frequency (450~600 kHz)Ultra High Frequency
(600~700 kHz)
I51.7037.930.970.00
II31.0146.51 0.780.00
III32.7956.720.660.00
IV18.5469.592.650.00
Table 2. Main frequency diagram in the whole process of lower step specimen.
StagesSignal Proportion (%)
Low Frequency (100~200 kHz)Intermediate Frequency (250~350 kHz)High Frequency (450~600 kHz)Ultra High Frequency
(600~700 kHz)
I19.3367.54 9.430.00
II18.6065.124.650.00
III33.6556.094.535.97
IV41.3854.171.430.07
Disclaimer/Publisher’s Note: The statements, opinions and data contained in all publications are solely those of the individual author(s) and contributor(s) and not of MDPI and/or the editor(s). MDPI and/or the editor(s) disclaim responsibility for any injury to people or property resulting from any ideas, methods, instructions or products referred to in the content.