Article

Exploring Chemical Catalytic Mechanisms for Enhancing Bonding Energy in Direct Silicon Dioxide Wafer Bonding

1
Université Grenoble Alpes, CEA, LETI, 17 rue des Martyrs, 38054 Grenoble, CEDEX 9, France
2
SOITEC, Parc Technologique des Fontaines, 38190 Bernin, France
*
Author to whom correspondence should be addressed.
Appl. Sci. 2025, 15(7), 3883; https://doi.org/10.3390/app15073883
Submission received: 31 January 2025 / Revised: 2 March 2025 / Accepted: 24 March 2025 / Published: 2 April 2025

Abstract

:

Featured Application

It is a generic surface treatment for any wafer bonding using direct bonding of silicon dioxide layers such as SOI elaboration, hybrid bonding for 3D application, and CFET using bonding technology.

Abstract

The influence of pH on silicon dioxide direct bonding is studied, unveiling its role in bonding energy enhancement. We show that the deposition of basic salt or molecules consistently increases the silicon dioxide adherence energy. The underlying mechanisms, including silica hydrolysis and catalysis of siloxane bond formation, are explored. The results offer valuable insights into optimized direct bonding processes for microelectronics and related applications.

1. Introduction

Direct bonding is a well-established technique with a wide range of applications, attracting significant interest due to its spontaneous bonding nature and the absence of intermediate materials. It is particularly relevant for microelectronics, microelectromechanical systems (MEMS), and biomedical devices [1,2,3,4,5]. In direct bonding, two types of energy are involved: adhesion and adherence [6,7,8]. Adhesion refers to the energy developed during bonding that enables mechanical deformation of the substrates [9,10,11,12], while adherence is the classical bonding energy required to separate the wafers after bonding [13,14,15,16,17]. Enhancing adherence, i.e., mechanical strength, at low post-bonding annealing (PBA) temperatures (<500 °C) is a key challenge in direct bonding. Many applications, particularly those involving CMOS devices on at least one of the wafers, cannot tolerate PBA temperatures above 400 °C. This is especially true for hybrid bonding, which enables advanced 3D applications. In this context, a PBA temperature of 400 °C is typically used for the copper/SiO2 hybrid interface. Moreover, for certain applications, such as memory devices, PBA temperatures of 200 °C or lower are required [18,19,20,21,22]. Achieving high bonding energy at low PBA temperatures is therefore crucial.
Another prominent application that justifies this research is photonic integration on silicon, which has gained considerable interest. This application involves bonding III/V components to silicon wafers, where the coefficient of thermal expansion (CTE) mismatch between the materials restricts the use of high PBA temperatures. For example, direct bonding of indium phosphide (InP) to silicon is typically not annealed above 300 °C to avoid exceeding the brittle–ductile transition temperature (BDT) of InP, which is approximately 350 °C [23,24]. Again, achieving high adherence after low-temperature PBA (below 500 °C) is highly desirable.
Methods such as plasma treatments and chemical mechanical polishing (CMP) are known to improve bonding adherence at low temperatures [25,26] However, plasma treatments often require expensive equipment and may introduce drawbacks. For example, in hybrid bonding, plasma treatment can cause copper to sputter onto the dielectric surface, potentially leading to electrical leakage, particularly for future ultra-high-density interconnections with small pitch [27]. Additionally, plasma treatment can significantly increase the amount of interfacial water, as surface modifications at the nanoscale enhance hydration as shown by Larrey et al. [28]. This excess water could contribute to oxidation during PBA, potentially inducing bonding defects. CMP, on the other hand, does not always enhance bonding energy, as its effectiveness depends on the type of slurry used. The slurry may not always be compatible with the surface preparation needed to improve roughness and planarity. It may be beneficial to use CMP for its primary function while exploring other surface preparation techniques to enhance bonding energy.
Recently, N,N-diethylethanolamine (DEAE), an organic molecule, has been shown to enhance adherence at temperatures below 500 °C [29,30]. This is an exciting development, as DEAE is a low-cost solution that performs similarly to plasma treatment without causing morphological changes to the surface (such as sputtering or subsurface modification). This new technique for enhancing direct bonding energy could enable plasma-free surface preparation, even for applications requiring low PBA. In this study, we further explore this technology by testing other acidic and basic molecules, as well as salts, to identify the most promising candidates. We selected molecules with low vapor pressure to ensure they remain on the surface after drying. This is why some salts, which have no vapor pressure, were included in the study. Additionally, we chose acidic molecules to confirm whether the basic character is essential for enhancing bonding energy. By varying the pKa values, we aim to gain a deeper understanding of the direct bonding mechanisms associated with these molecules and salts.

2. Materials and Methods

2.1. Adsorption of Chemical Species and Wafer Bonding

For this study, 200 mm (001) silicon wafers are used. A 100 nm thick thermal silicon dioxide (SiO2) layer is grown on each wafer at 950 °C under a steam atmosphere. Wafers are, in the first step, cleaned using a standard DiO3 and RCA (Radio Corporation of America) SC1/SC2 chemical treatment. They are dried using a Marangoni dryer.
Various chemical species (salts or organic molecules) with different acid dissociation constants are then applied to silicon dioxide wafer surfaces by spreading aqueous solutions (refer to Table 1). The chosen molecular solution (at a concentration of a few 10−4 g/cm3 in water) is poured onto the wafer surface and spread by rotating the wafer at 200 rotations per minute (rpm) for 45 s. The surface is then spin-dried at 2000 rpm for an additional 45 s (see Figure 1). Reference wafers are treated with pure DiW (deionized water) instead of the various chemical species.
Wafers exposed to the same solutions are bonded manually at room temperature within 5 min, in a clean room air atmosphere, following the drying step. After bonding, annealing is conducted at 100 °C for 2 h. The annealed structures are then cut into 20 mm wide beams and stored in a low-humidity atmosphere (<5% relative humidity, RH). This low-humidity storage will prevent the bonding interface from being filled by water and prevent any impact on direct bonding energy [31,32]. As soon as possible (<2 days), each beam undergoes annealing at desired temperatures (<500 °C) for two hours prior to bonding energy measurements.
Different tools are used in this study: a GC2441M infrared camera from Framos; a SAM_501_HD2 acoustic microscope from PVA TEPLA (Westhausen, Germany); an SP2 from KLA Tencor (Milpitas, CA, USA) for the diffusion light scattering characterization; a Dimension FastScan AFM from Brücker (Palaiseau, France); and a VPD300A Rigaku (Neu-Isenburg, Germany) for the TXRF measurement. For the WOS/ATDGCMS, this measurement is outsourced to Tera Environment (Crolles, France). In order to avoid any transportation issues, we sent Tera Environment bonded wafers with trapped molecules at the bonding interface. The bonded are not annealed and Tera Environment debonds the wafer just before entering inside their measurement tool.

2.2. Bonding Energy Measurement

Bonding energy (adherence) is assessed using the Double Cantilever Beam technique (DCB) under prescribed displacement. A blade is inserted at the bonding interface, and the debonded length is measured. Transparency of silicon to infrared (IR) light facilitates measurement using an IR camera. Bonding energy (G) is evaluated using El-Zein’s formula [16] (Equation (1)).
G = 3 δ 2 . t 3 16 β 11 . a 4 . 1 1 t 3 . β 26 8 β 11 . a 4   with   β ij = S ij S i 3 . S j 3 S 33
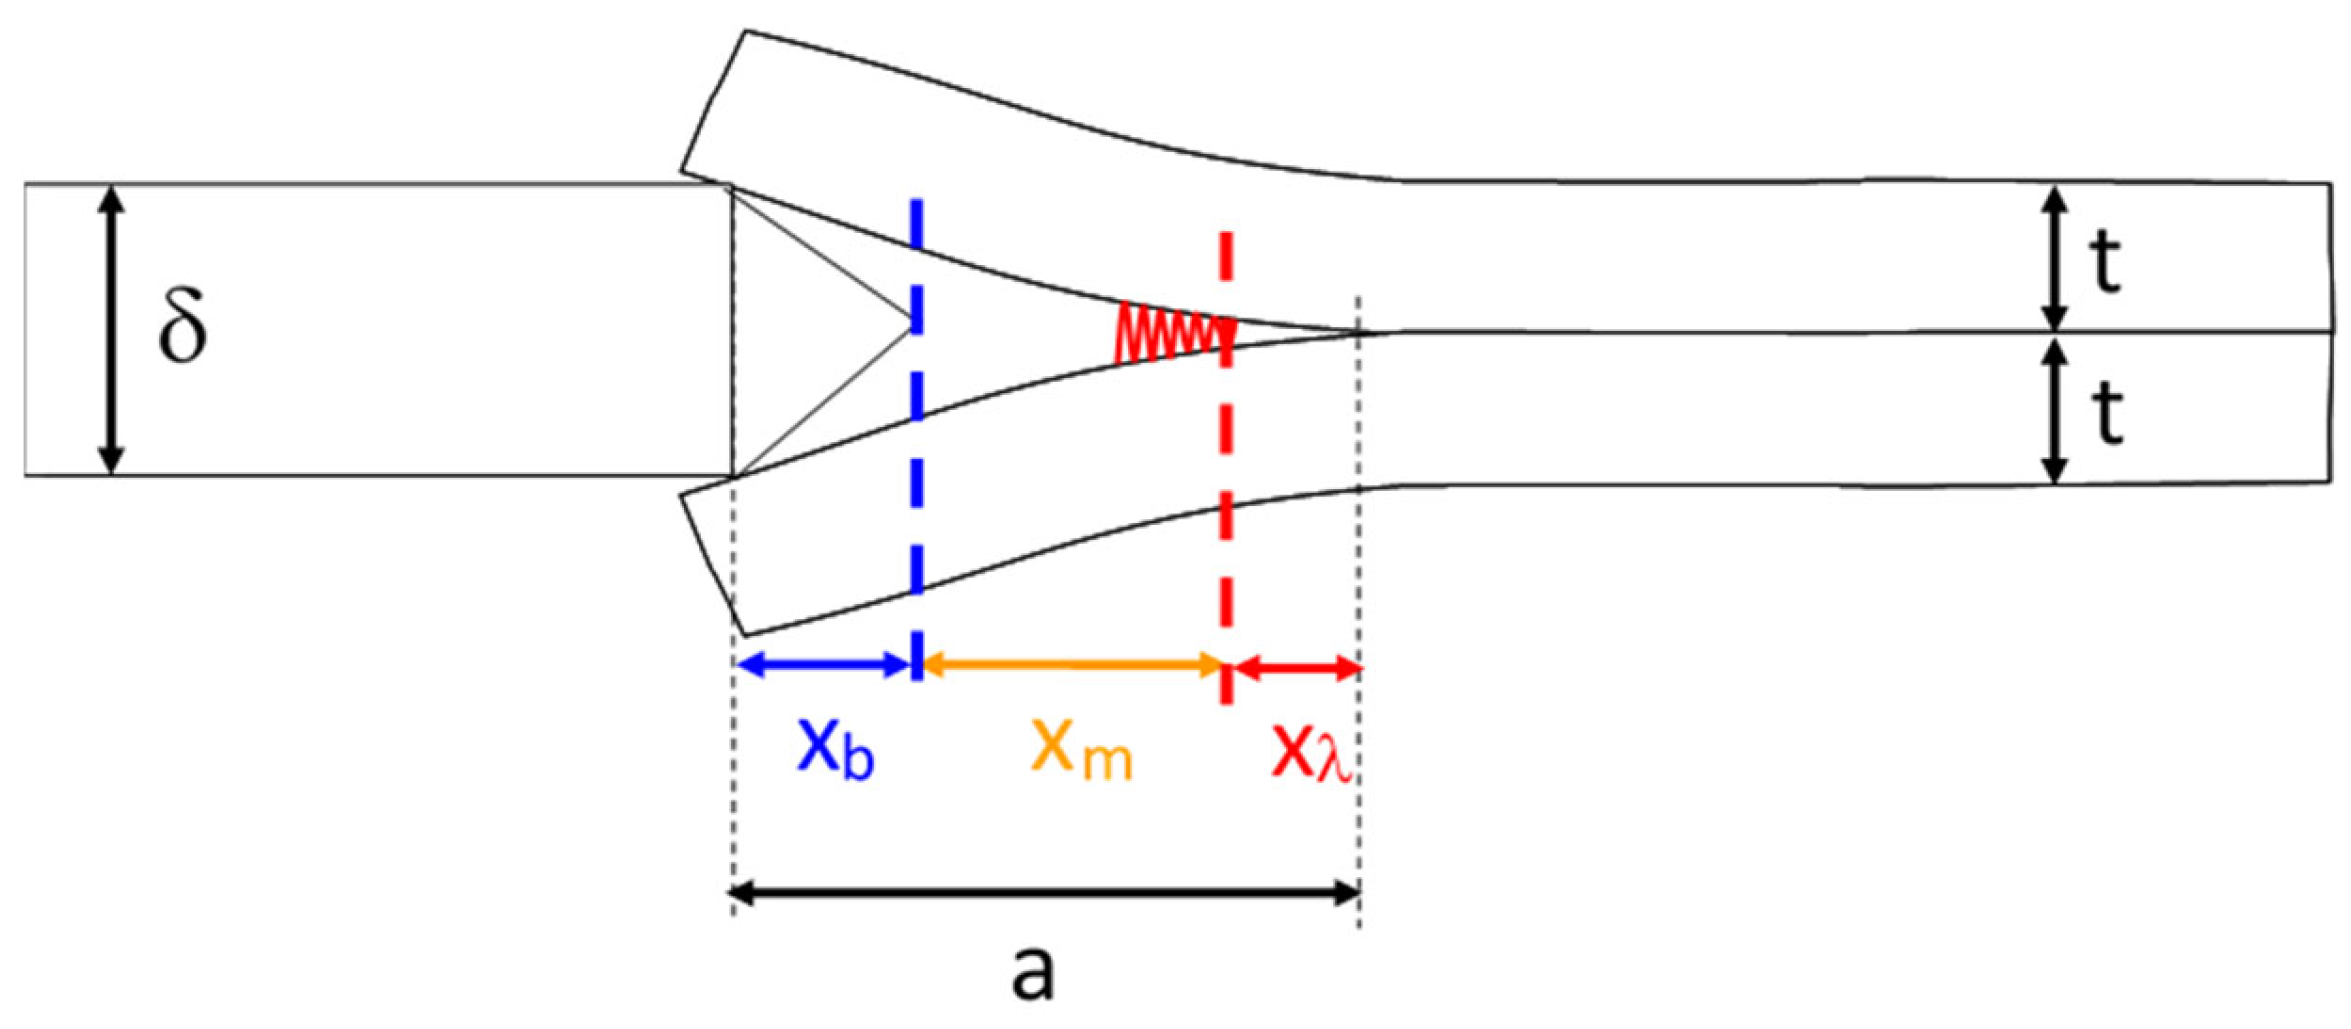
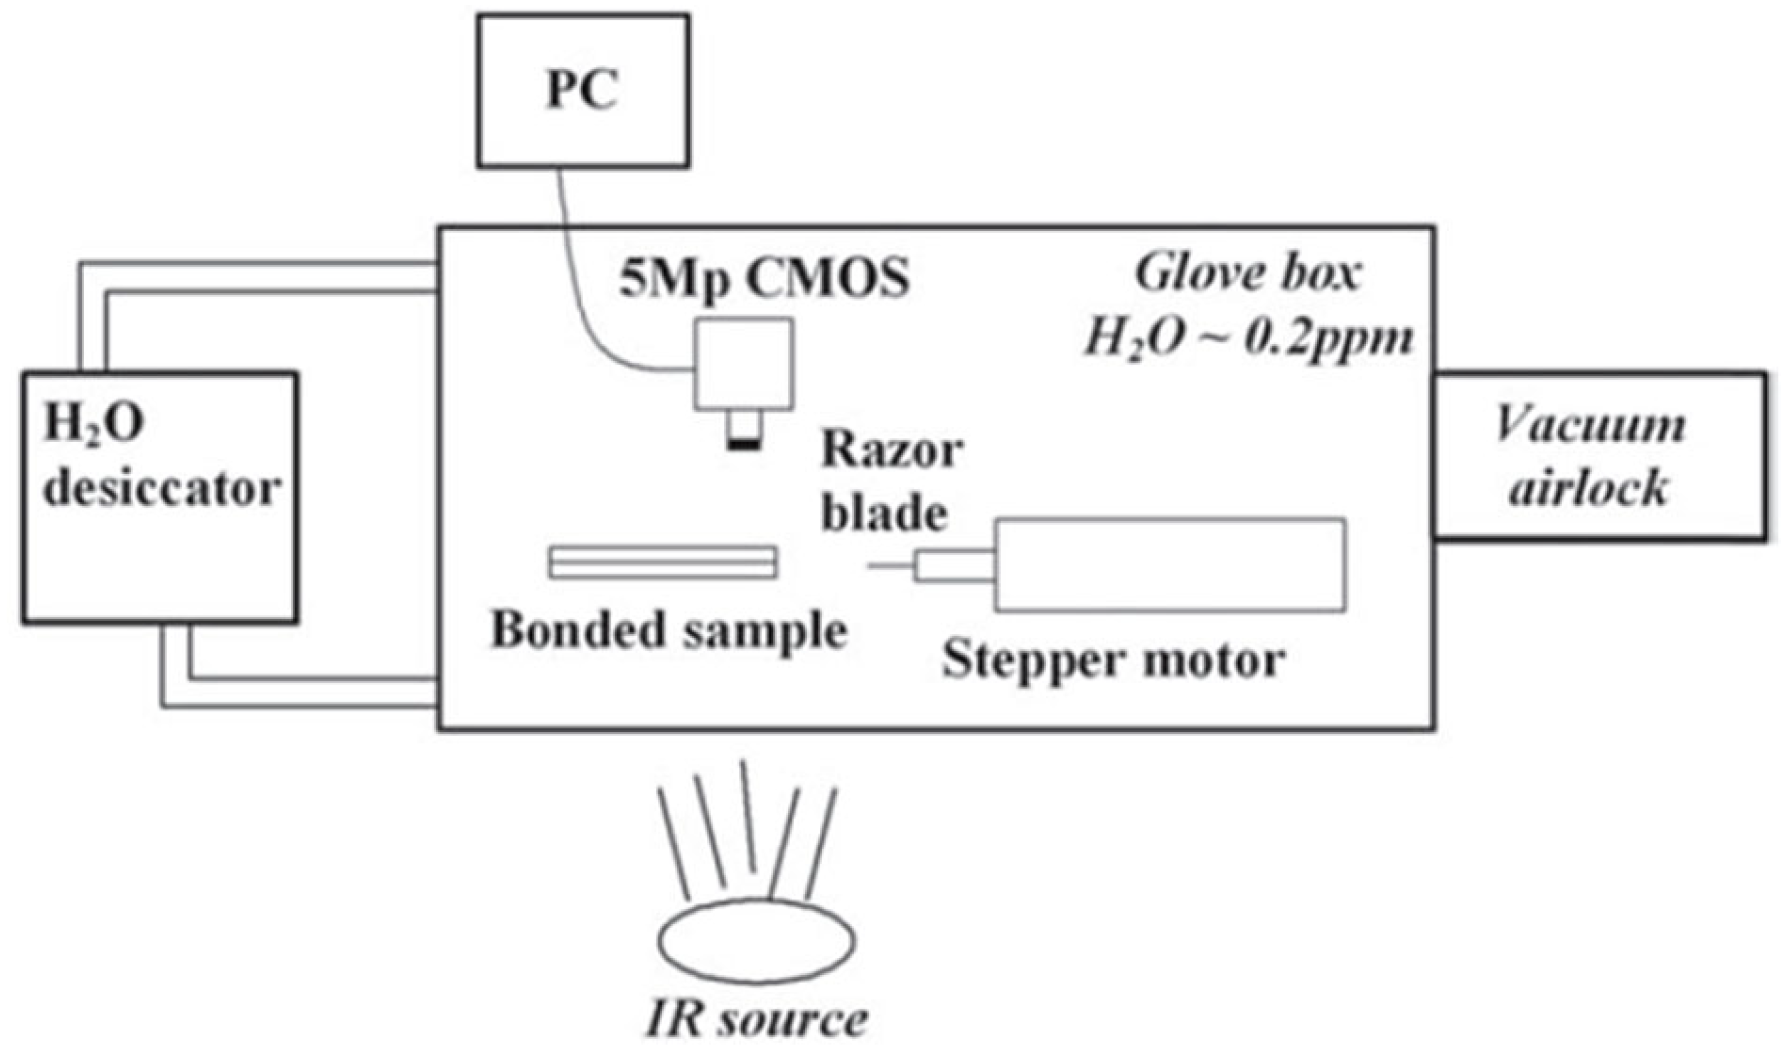
where δ represents blade thickness, t the wafer thickness, and Sij denotes compliance tensor factors. The crack length, a, is the sum of the debonded length measured by the IR camera (Xm), the blade bevel length (Xb), and a calculated length (Xλ) which is the distance between the first IR optical interference and the crack tip (Figure 2) [33]. To avoid water stress corrosion coming from the clean room atmosphere humidity, all bonding energy measurements are performed in an anhydrous atmosphere with a water concentration in nitrogen below 1 ppm. Indeed, it is important to remove any impact on bonding energy of the well-known silica water stress corrosion (WSC) [34,35]. This WSC impact the DCB bonding energy measurement has seen with DCB performed in vacuum [36], during steady-state DCB as shown by Bertholet et al. [37] or in anhydrous nitrogen [38]. The DCB measurement method using anhydrous atmosphere has been previously developed in our laboratory (cf. Figure 3) [33]. Even if the DCB is performed under anhydrous nitrogen, the bonding energy is taken after 5 min in order to take into account the internal water stress corrosion coming from the water trapped at the bonding interface [39,40,41,42,43]. Indeed, as it is the water of the bonding interface itself that is important, this time, we must take into account the WSC due to this specific amount of water.

3. Results

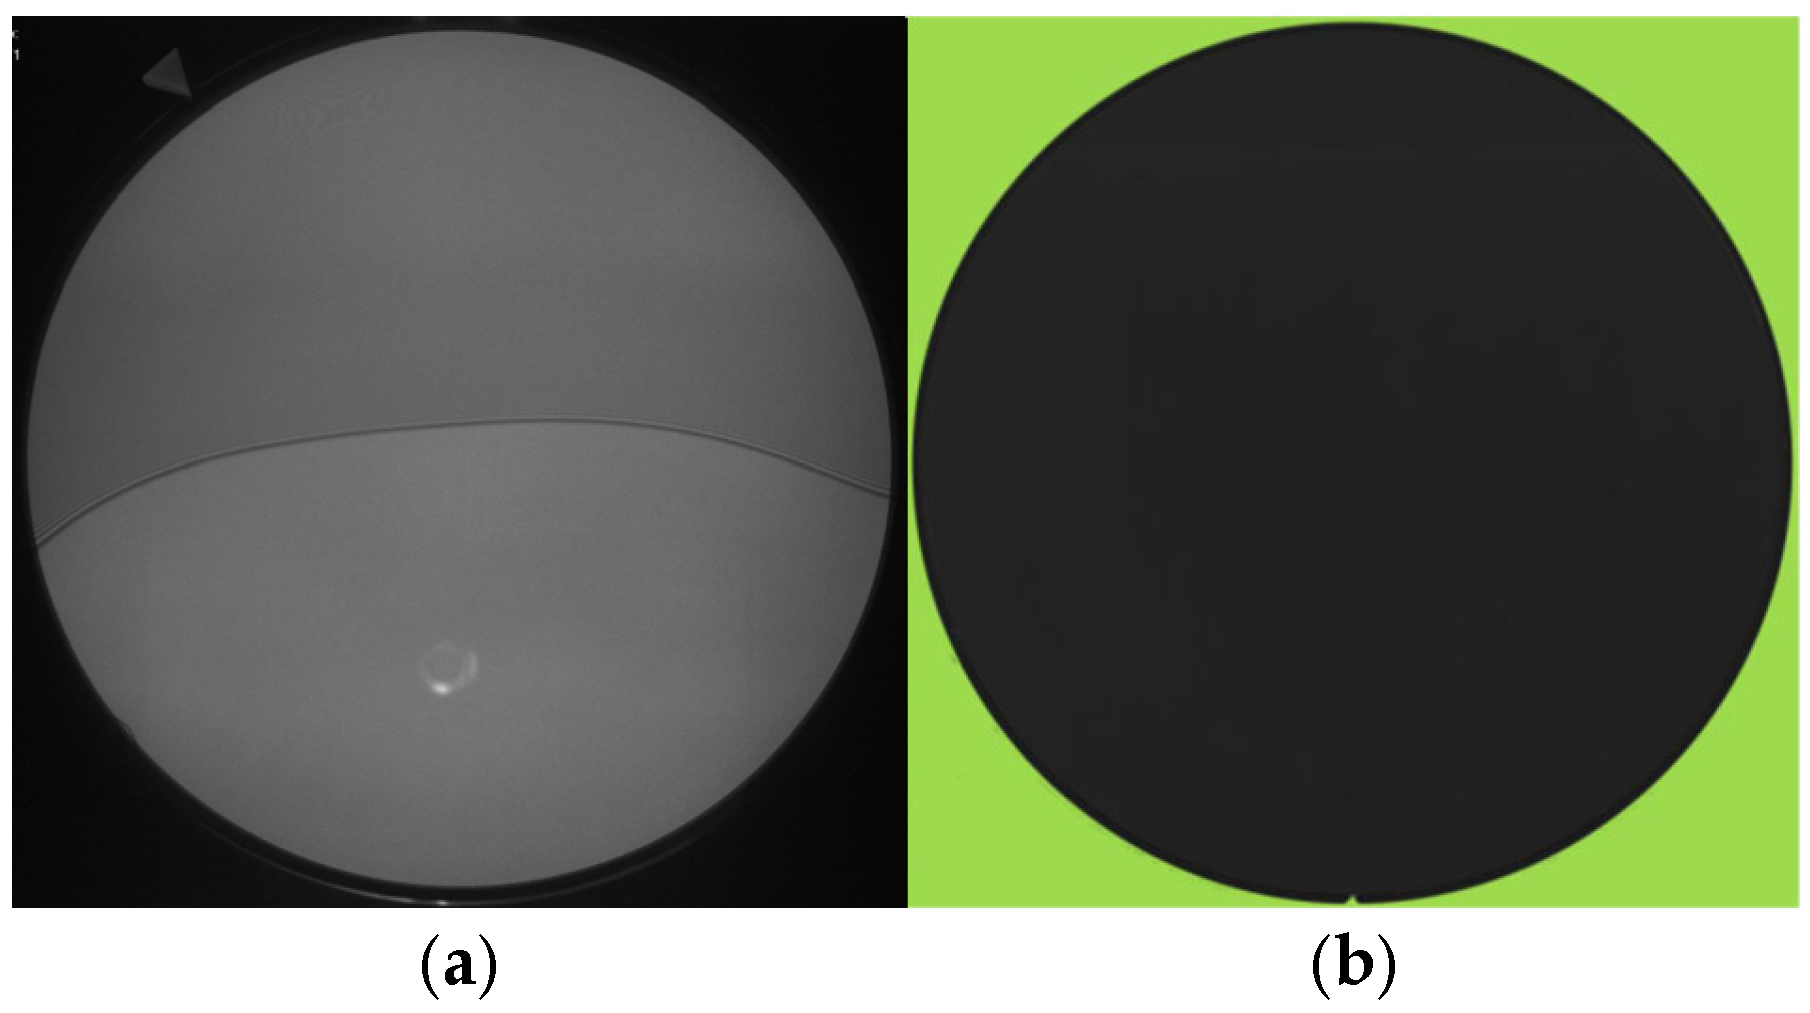
As shown in Figure 4a, the bonding waves for the different samples are smooth, with a nearly constant velocity of approximately 20 mm/s, which is typical of standard hydrophilic bonding. This suggests that the adhesion energy is not affected by the different surface treatments. No bonding defects are detected, even when using scanning acoustic microscopy (see Figure 4b).
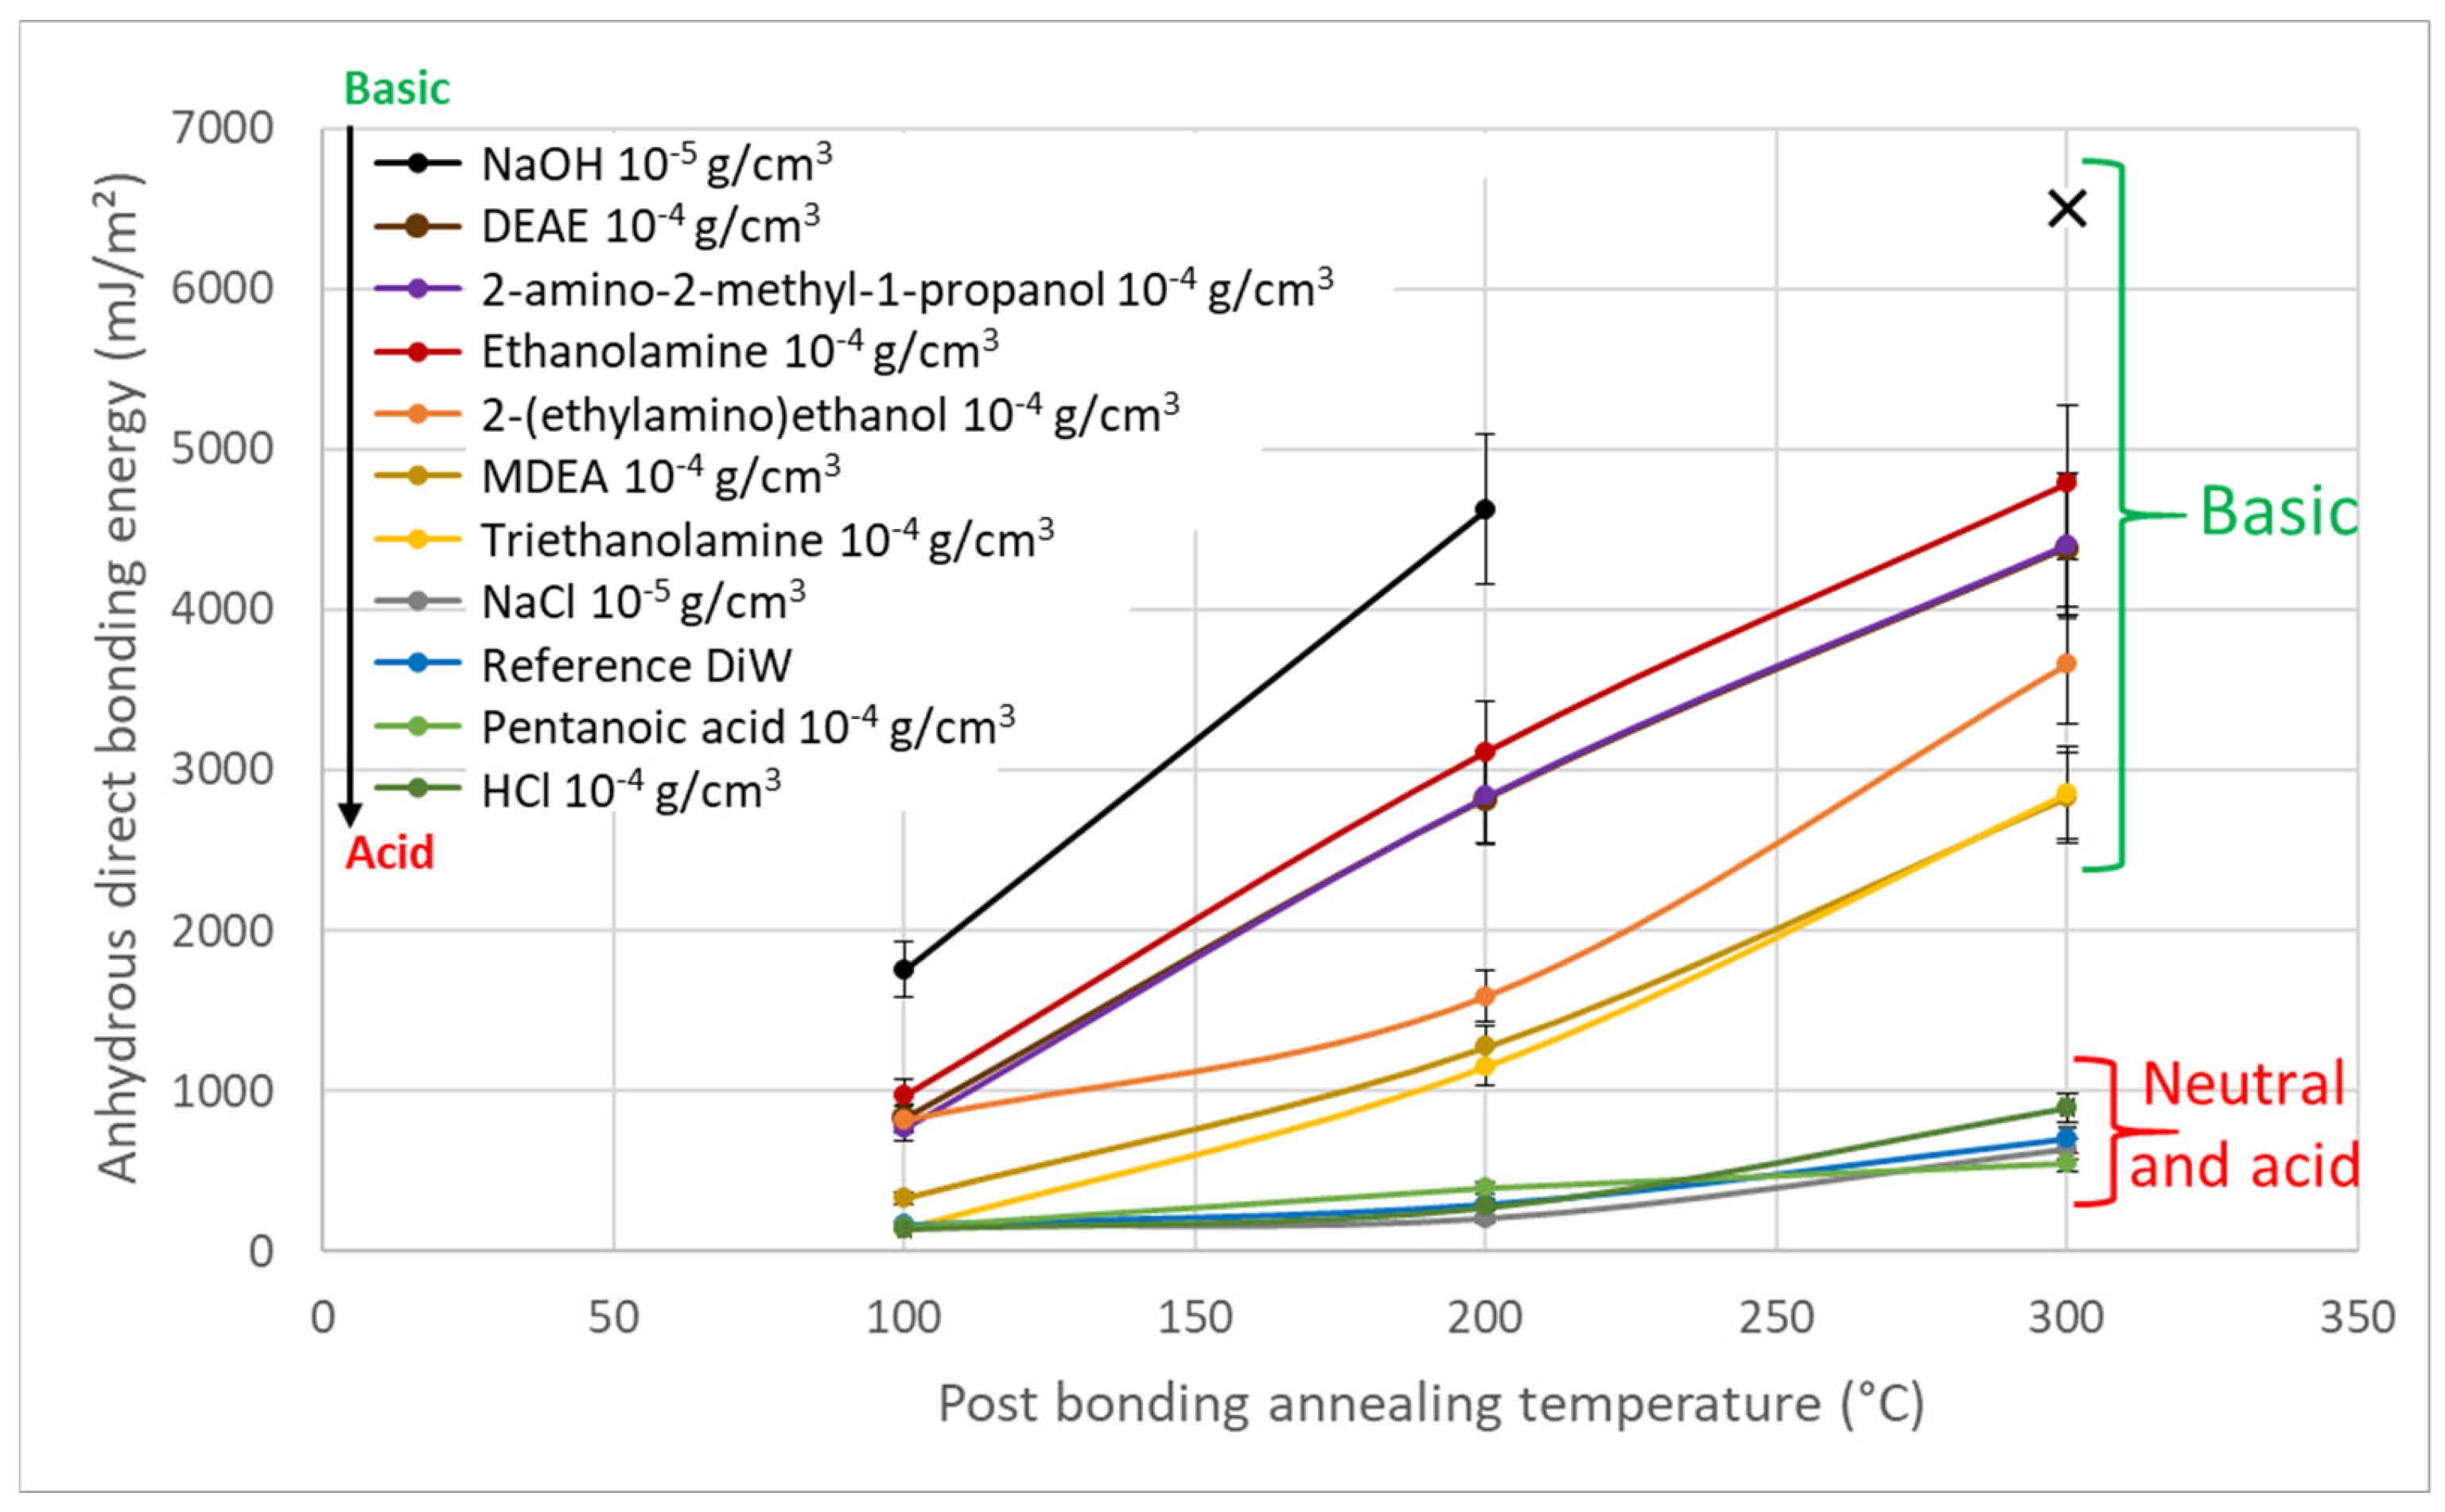
Figure 5 shows the evolution of anhydrous direct bonding energies as a function of annealing temperature for various acidic and basic molecules. The concentrations were chosen to remain below the threshold for inducing particle contamination after spin drying. Although ammonia could have been used at a higher concentration, a similar concentration to the other molecules was chosen for comparative purposes. Regardless of the annealing temperature, the bonding energies increase in the presence of basic molecules.
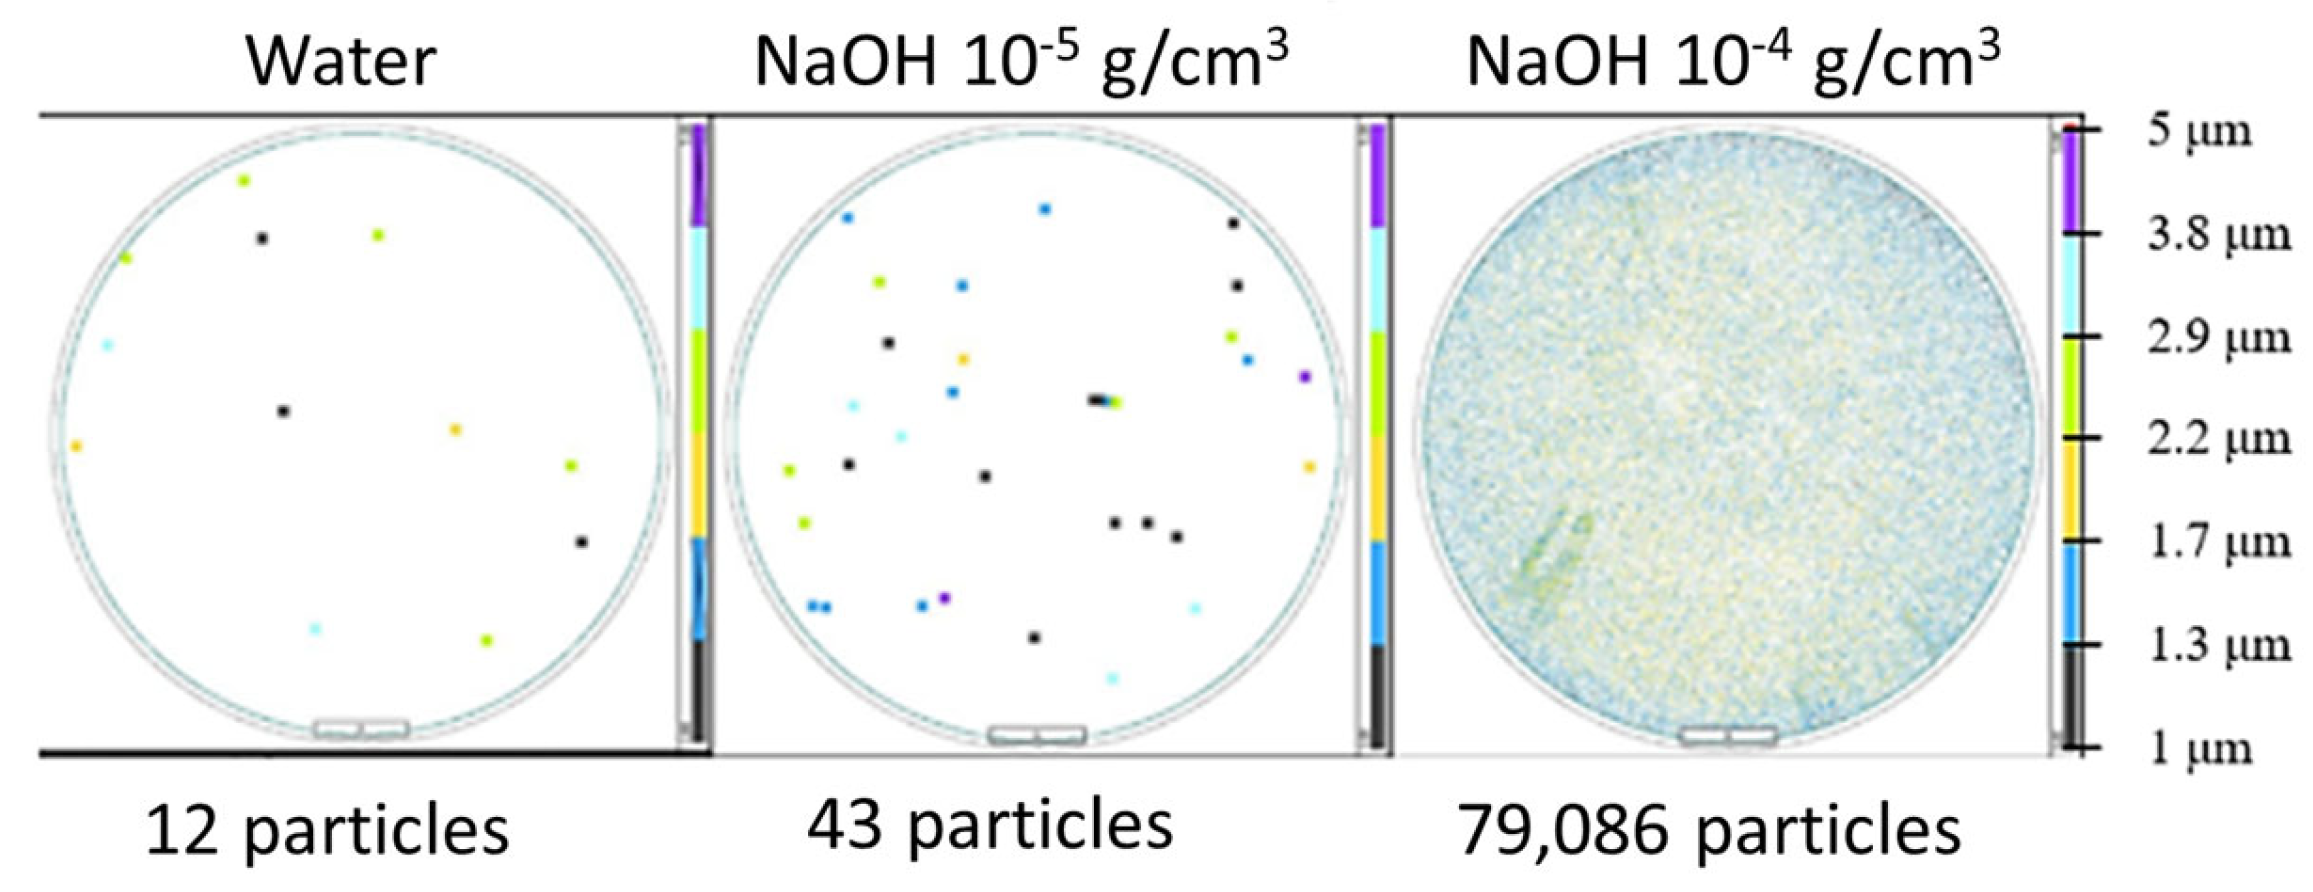
Expanding on this finding, the influence of the pH of the spin-dried solution is examined using strong base NaOH solutions at concentrations ranging from 10−8 g/cm3 to 10−5 g/cm3. A NaOH solution of 10−5 g/cm3 represents the maximum concentration enabling spontaneous bonding. Indeed, with a NaOH solution of 10−4 g/cm3, bonding does not occur due to excessive NaOH “particles” (Figure 6), detected using diffusion light scattering with a size threshold of 1000 nm.
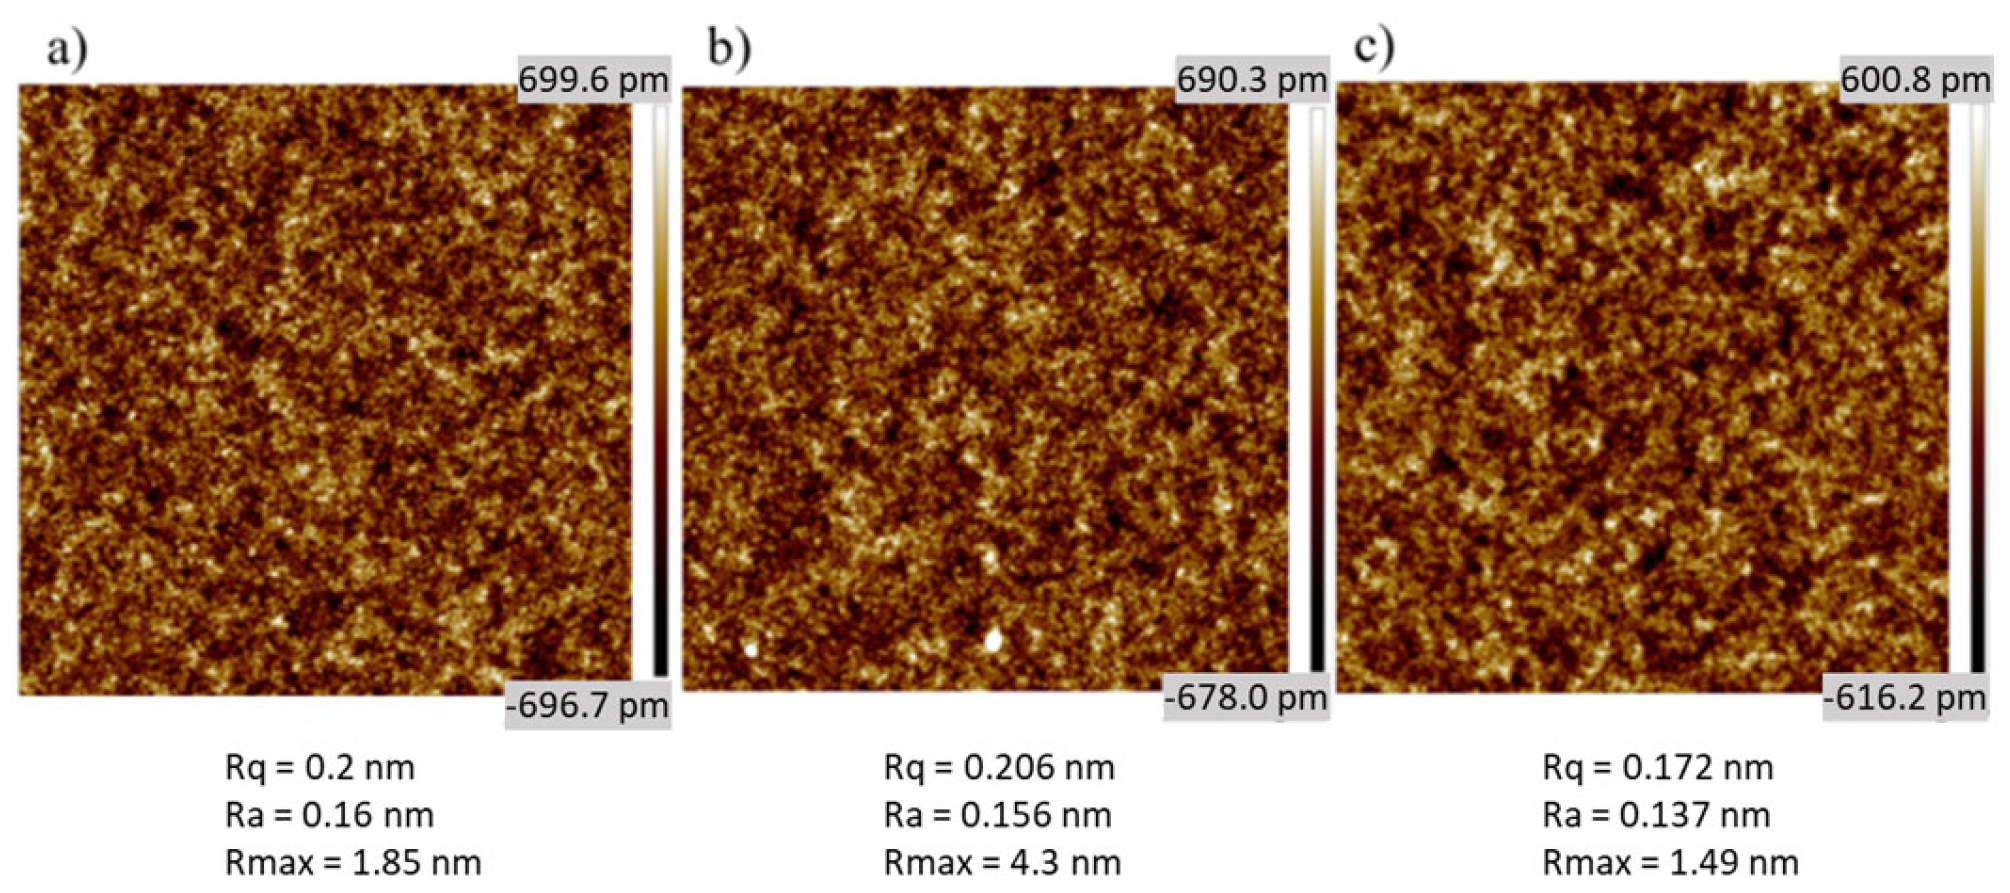
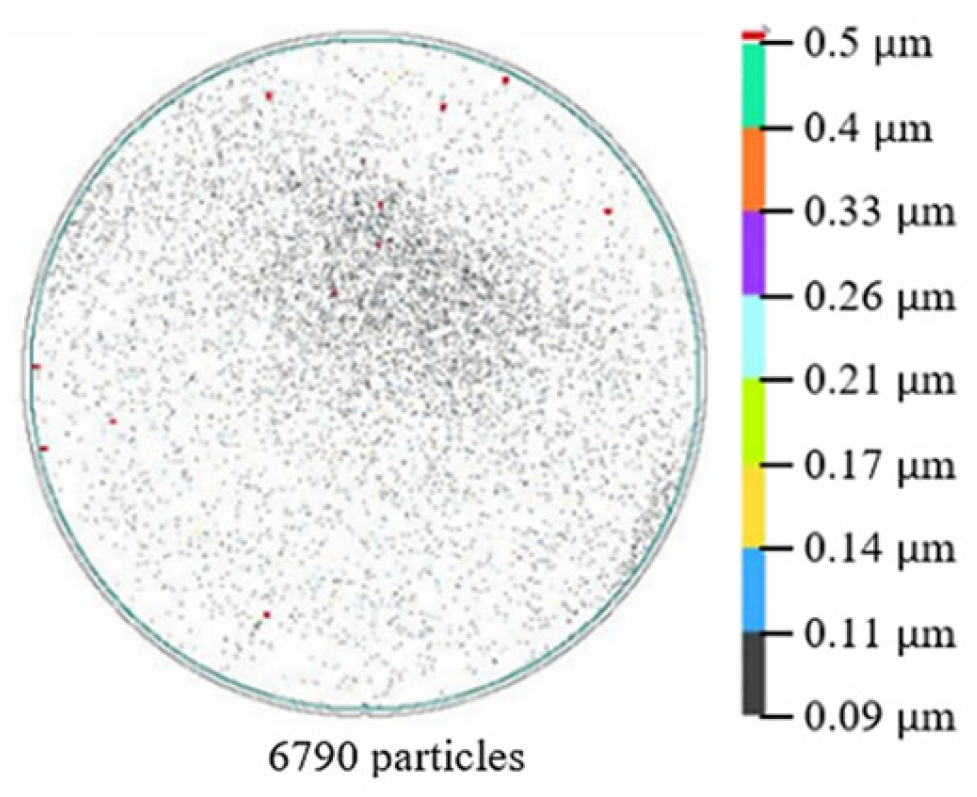
These “particles” are probably sodium hydroxide crystals. Indeed, atomic force microscopy (AFM) did not reveal any changes in roughness (see Figure 7), and after DiW rinsing (Figure 8), fewer and smaller “particles” were otherwise detected on the wafer surface.
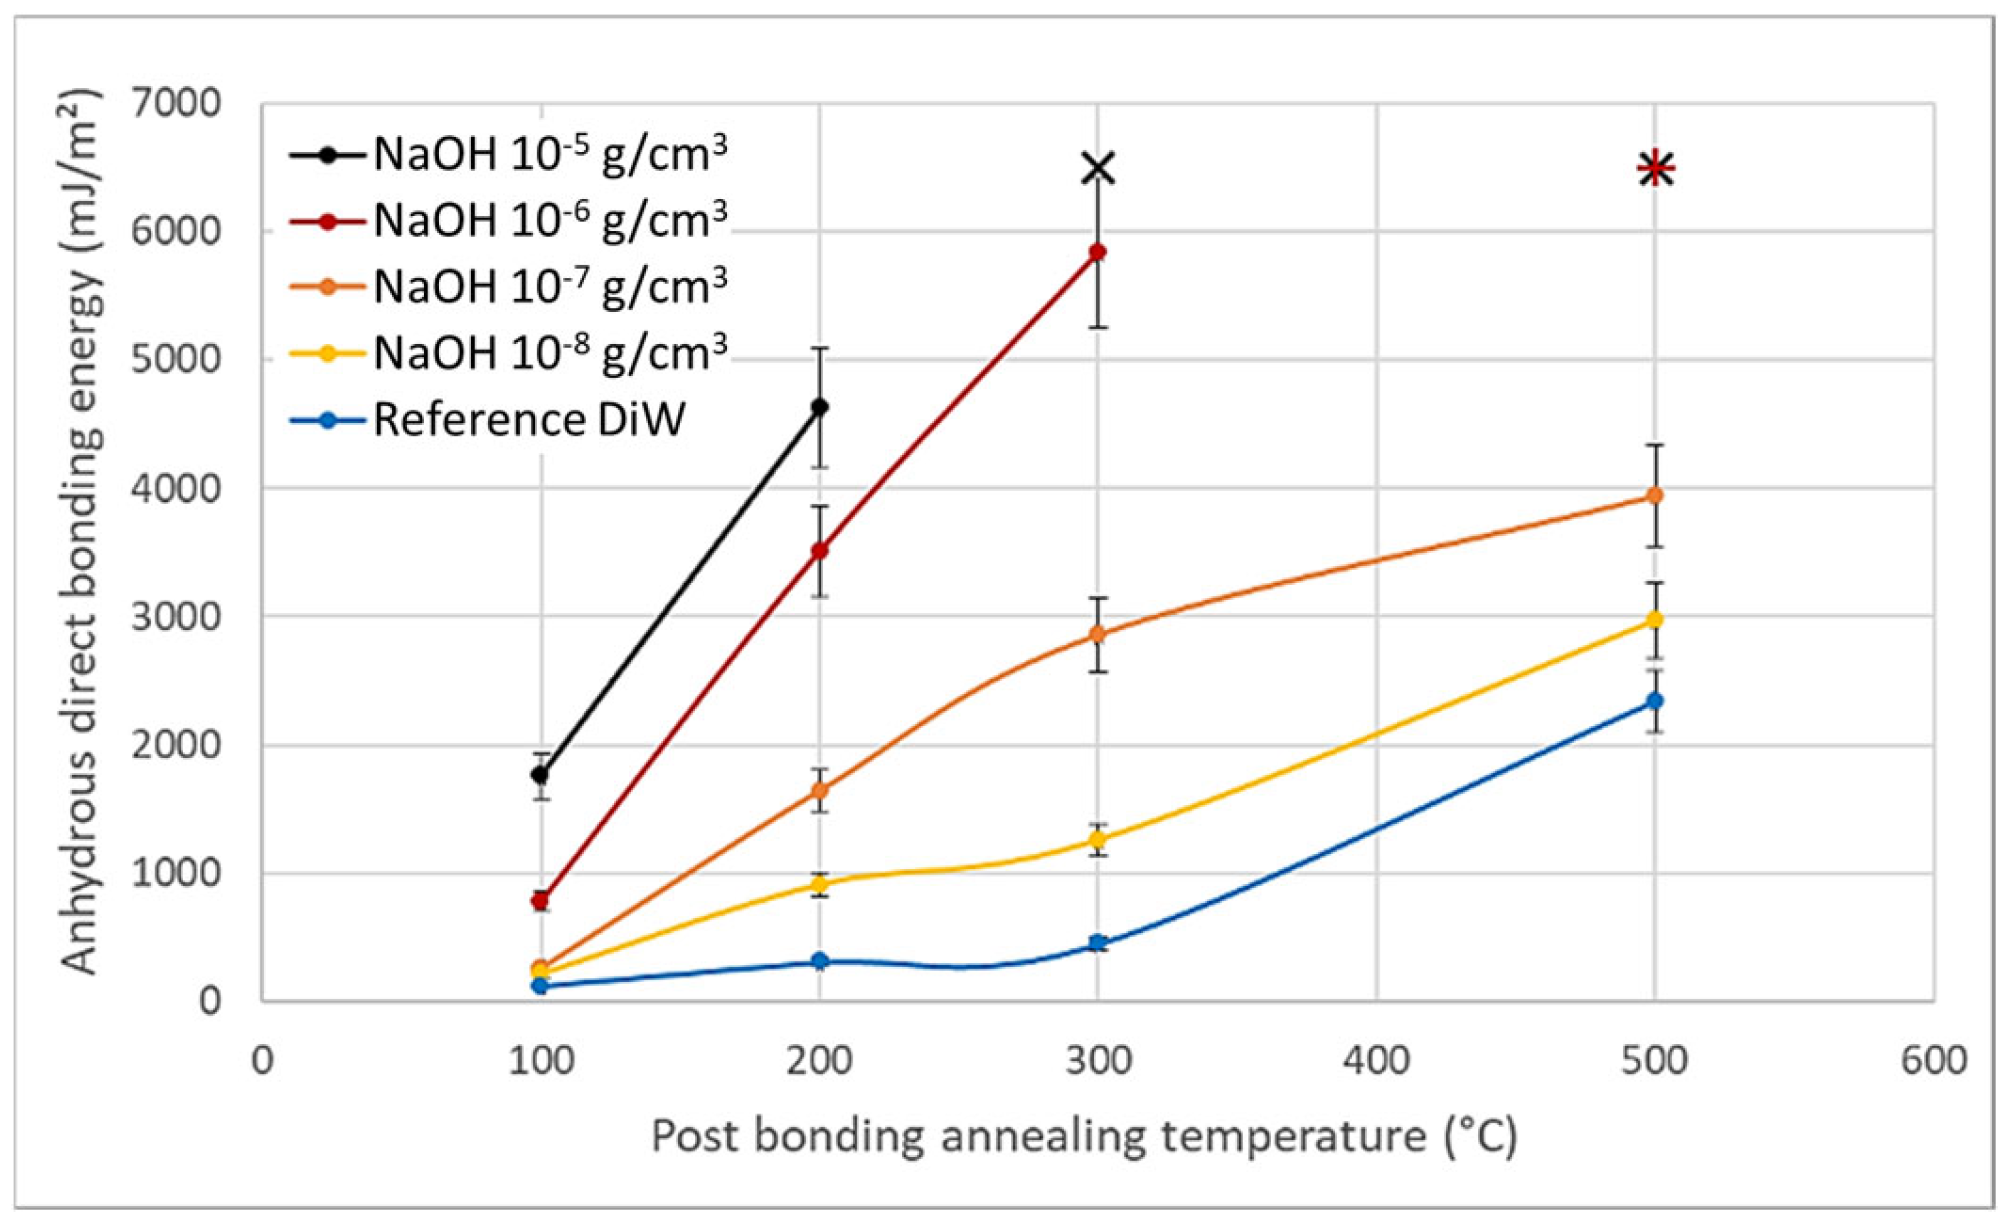
Figure 9 shows that, at concentrations below 10−5 g/cm3, higher NaOH concentrations result in higher bonding energies whatever the annealing temperature. High pH thus yields high direct bonding energies, given the calculated spreading pH solution for each NaOH mass concentration (refer to Table 2). The influence of cations will be discussed later.
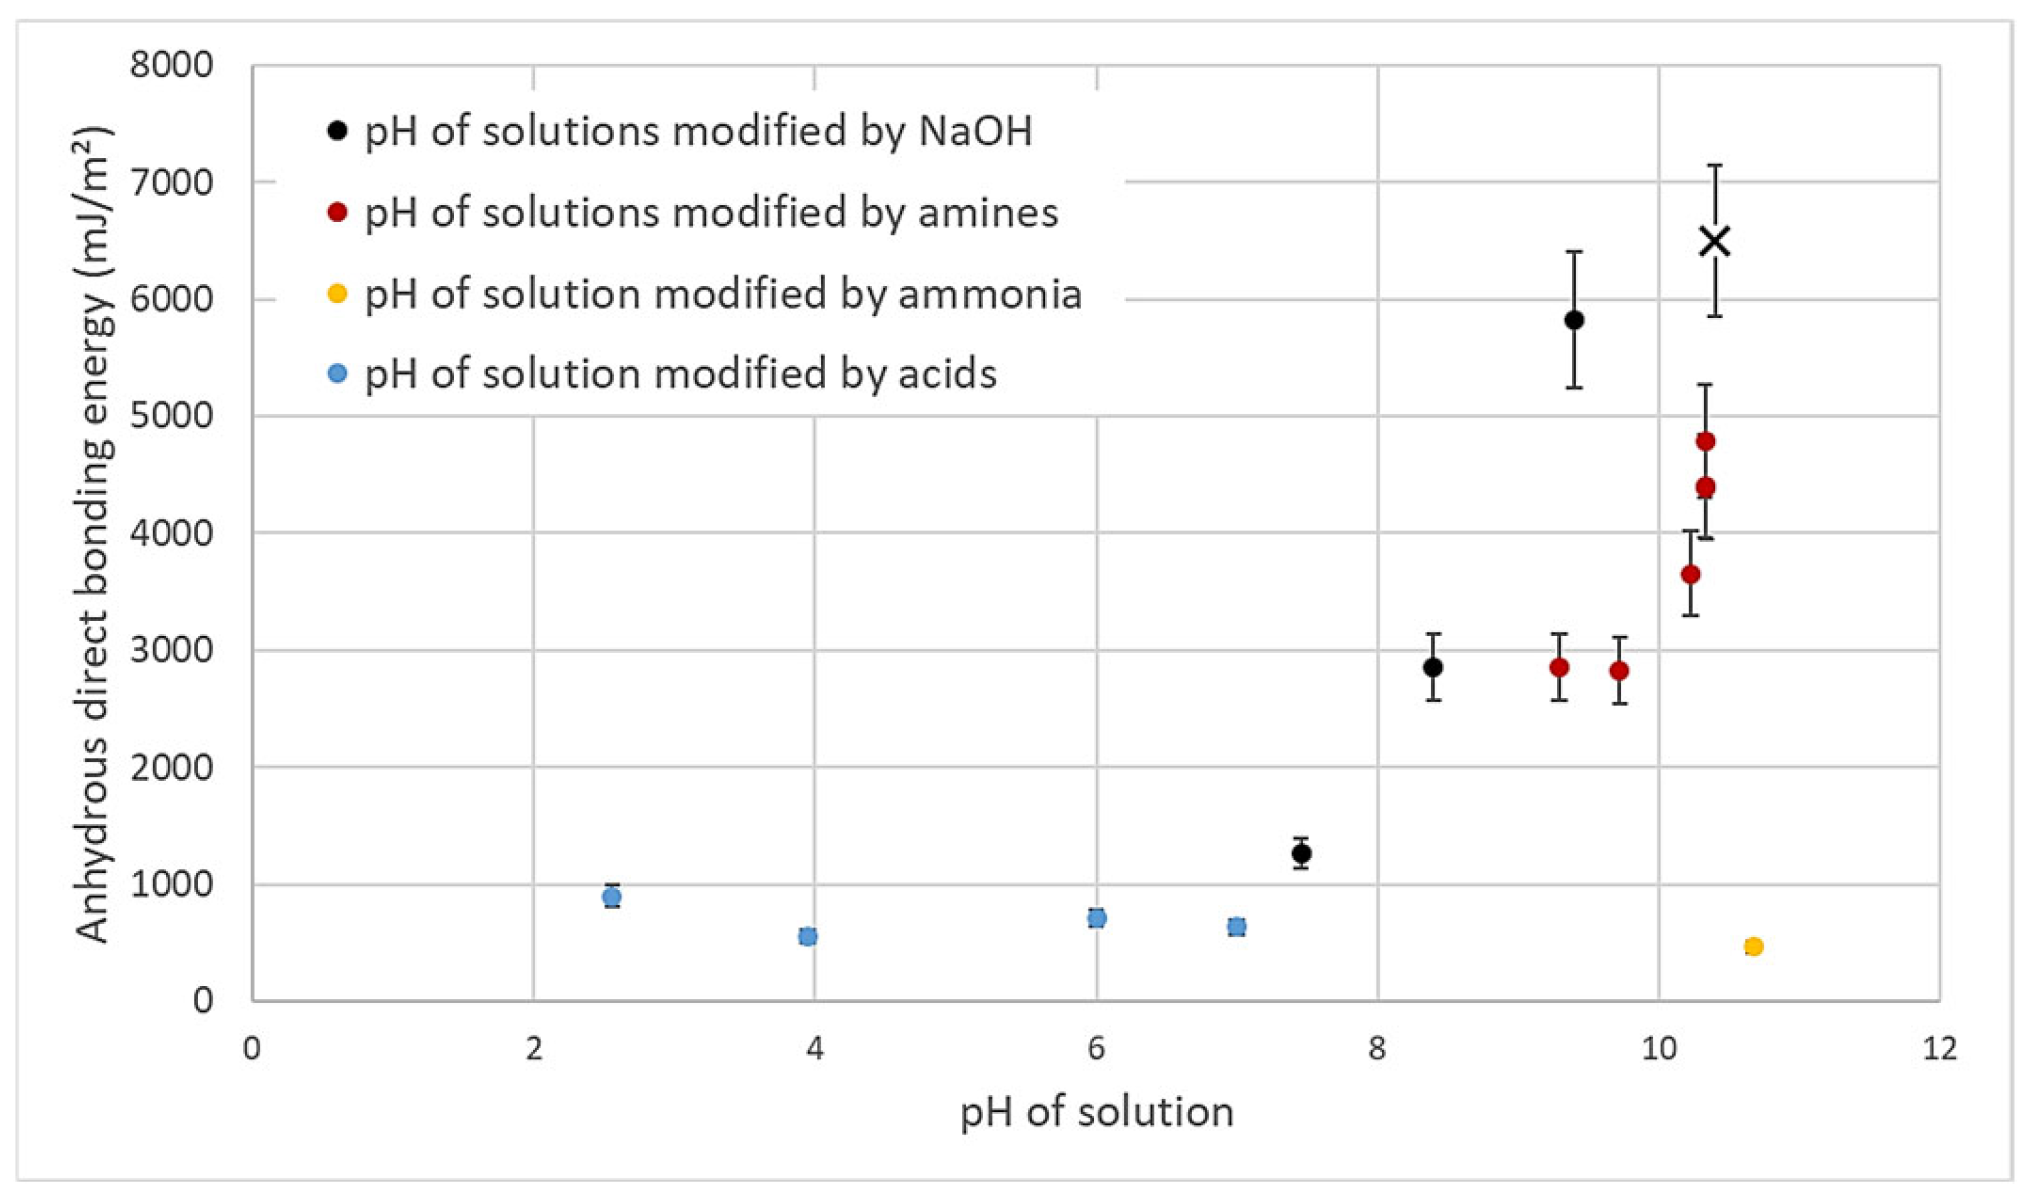
Bonding energies obtained after annealing at 300 °C for 2 h with different chemical species are plotted in Figure 10 for various pHs. From these experiments, we deduce that increasing the amount of deposited hydroxide ions enhances silicon dioxide’s direct bonding energies. A notable exception is ammonia (4.5 × 10⁻⁴ g/cm3), yielding the same bonding energy as neutral or acidic molecules. This may be attributed to its high vapor pressure; this molecule likely evaporates from wafer surfaces prior to bonding, thus no longer being present at the bonding interface in our experiment conditions. However, if a solution were found to retain ammonia at the bonding interface, an enhancement in bonding energy should be measurable.
Noteworthy, the pH value of Figure 10 is only the pH value of the solution poured on the surface, not the pH of the bonding interface water itself. In order to investigate the link between adherence and deposited salts or molecules, we first tried to measure the number of species trapped at the interface. Direct measurements after wafer debonding and prior to annealing seem the most effective way of quantifying surface concentrations of molecules. For NaOH, total reflection X-ray fluorescence (TXRF) can be used to detect sodium atoms (refer to Table 3). Indeed, the Na+ ionic concentrations vary depending on the concentration of the solution spread. As far as organic molecules are concerned, a wafer outgassing system (WOS) coupled with an automated thermal desorber–gas chromatography–mass spectrometer (ATD–GC–MS) can be used to quantify DEAE concentrations on wafer surfaces (just after wafer debonding). DEAE surface concentrations are comparable to Na concentrations (refer to Table 3 and Table 4), confirming the effective embedding of this specific molecule at the bonding interface. Of course, all these measurements could have been performed directly after the solution pouring. Especially for organic molecules, their vapor pressure is imposed to perform the measurement as soon as possible after the deposition, which is not easy to put in place. The bonding is then used here as a convenient path to protect the surface waiting for the measurement to be ready.
Clearly, the molecule concentration on the silicon surface is not easily deduced from its bulk spreading solution concentration. Indeed, from the last value, theoretical NaOH and DEAE surface concentrations can be calculated for a 1 cm2 surface, assuming 0.8 monolayers of adsorbed solution [44]. This would yield concentrations four orders of magnitude lower than actually measured surface concentrations, indicating a substantial concentration effect during drying, with water molecules evaporating more rapidly than added molecules (except for ions). However, evaporation kinetic differences are not high enough to explain such surface concentrations of molecules. High ion concentrations at the surface suggest the presence of electrostatic interactions (double layer effect) at the charged silica surface [45]. Calculations of surface concentration have been performed using Poisson Boltzmann equations. They are, however, beyond the scope of this article.
The pH value of the deposited solution is the key parameter in explaining the increase in bonding energy in this study. However, just as the concentration of molecules at the surface cannot be directly inferred from that of the solution, the pH at the bonding interface (if such a concept is meaningful) cannot be straightforwardly deduced from the pH of the spreading solution. Furthermore, knowing the molecular concentration at the surface provides limited insight, as the amount of water at the bonding interface depends on numerous factors, making it difficult to estimate an “interfacial pH” value.
Indeed, firstly, the humidity of the bonding atmosphere affects the amount of water adsorbed on the surfaces. Additionally, the propagation of the bonding wave itself could alter the water content at the interface. For example, gas compression between wafers during bonding increases its temperature, influencing the equilibrium between the surface and the atmosphere. It is the opposite of the edge bonding void generation mechanism, which is driven by gas decompression, lowering the temperature and causing water droplet condensation at the wafer edges [46,47,48]. The compression associated with bonding wave propagation explains why using dry gases like nitrogen or argon alone is insufficient to prevent voids [46], as these gases can remove water from the wafer surface. Moreover, the water quantity at the interface may vary during the queue time before annealing. As demonstrated by Tedjini et al. [44], the water content at a hydrophilic silicon dioxide bonding interface can range from 1.6 to 3.4 monolayers, partially filling surface roughness gaps.
Given these complexities, it is difficult to determine the exact water content at the bonding interface, which is thus challenging to calculate concentrations. Additionally, at an interface width of only 1 nm, water ceases to behave like a liquid and exhibits properties more akin to ice, significantly reducing atomic mobility. Even if the concentration, acid-base equilibrium, and pH value could be determined, their physical interpretation under such interfacial confinement would differ markedly from conventional conditions. Therefore, focusing on the quantity of molecules may offer more practical and meaningful insights.

4. Discussion

The lattice parameter of the (001) silicon surface is 0.543 nm with two atoms per lattice cell, resulting in a silicon surface density of about 7 atoms/nm2. A fully hydrophilic silicon dioxide has, according to Iler, a maximum silanol concentration of 5 to 8 nm−2 [49]. Even with the highest surface concentrations of molecules or cations, the wafer surface is covered by less than 1/10 of a monolayer of DEAE or NaOH. A small quantity of active molecules significantly enhances the bonding energy, suggesting that molecules act more as catalysts than directly participating to the adherence mechanism.
Three mechanisms can be proposed to elucidate the bonding energy enhancement.
  • According to the model of Rieutord et al., direct bonding relies heavily on the contact of asperities [50]. For hydrophilic bonding, at room temperature, wafer adhesion primarily results from capillary bridges, hydrogen bonds and van der Waals forces [6]. Even at room temperature, occasional covalent bonds may also form at contact points (asperity summits), accounting for the observed increase in bonding energy under specific circumstances at room temperature [39]. OH ions are known to speed up the dynamics of siloxane bond formation by condensation of silanols, as observed e.g., in silica gel formation processes [49]. In silanol condensation, OH play the role of nucleophilic agent. Increasing the pH will then increase the silanol condensation kinetics.
    It is indeed widely recognized that OH ions can initiate nucleophilic attacks on surface Si atoms, resulting in the formation of siloxane bonds [51], as shown in Equations (2) and (3).
    SiOH +   OH   SiO + H 2 O
    In presence of SiO, the formation of siloxanes bonds is favored (Equation (6)).
    SiOH +   SiO   SiOSi + OH
    As obvious from the equilibrium between Equations (5) and (6), OH ions directly catalyze the condensation reaction of silanols into covalent siloxane bonds, resulting in a bonding energy increase.
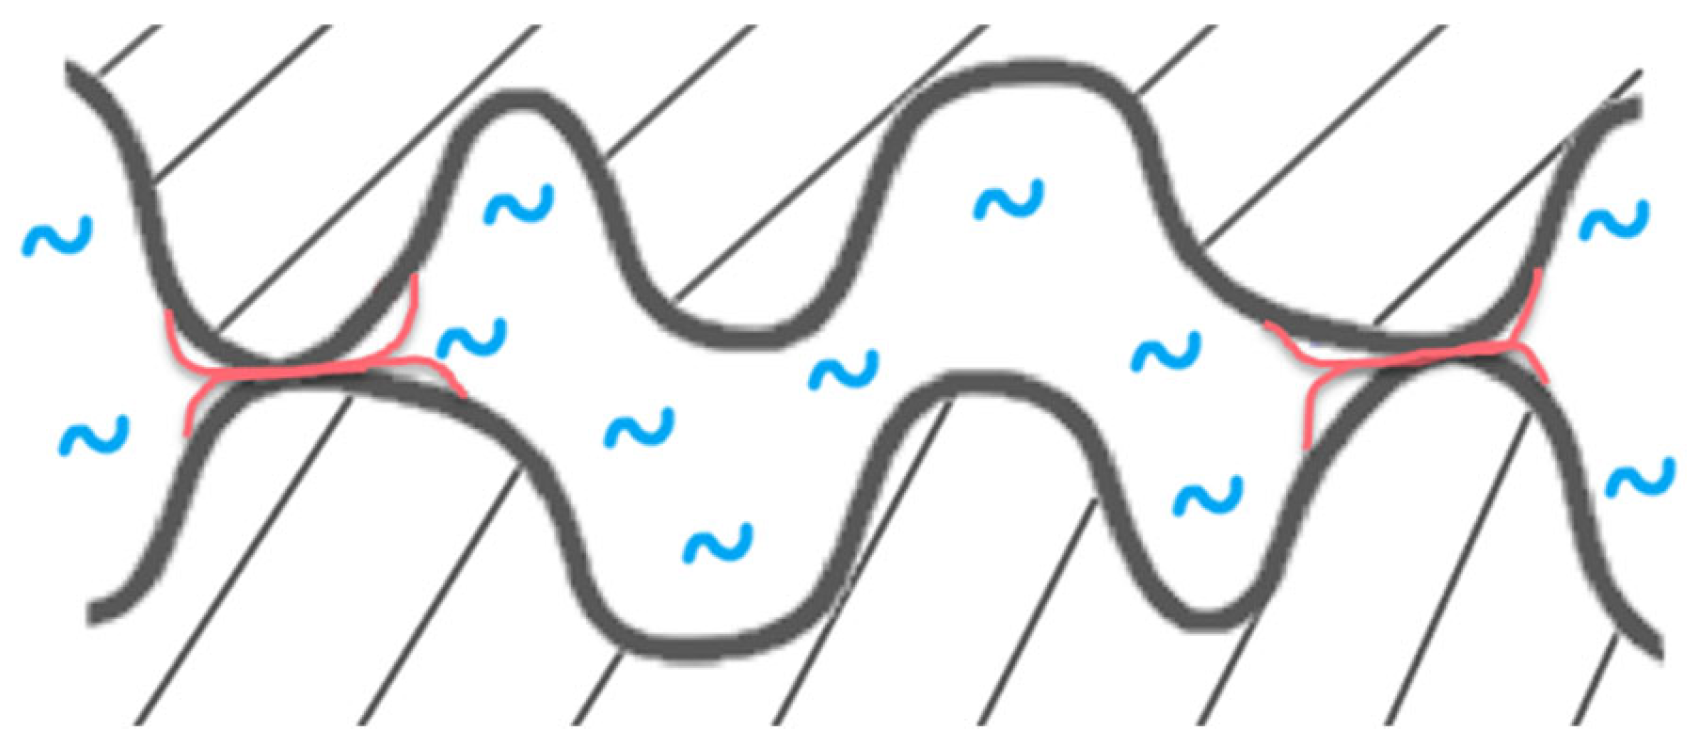
  • Based on the mechanism proposed by Fournel et al. [39], during annealing, water molecules trapped at the bonding interface hydrolyze silicon dioxide asperities. As the annealing progresses, water molecules infiltrate the oxide asperities volume and break certain silanol bonds. Consequently, asperities become more viscoplastic and are flattened, enabling the formation of new interfacial covalent bonds and thereby increasing the bonding energy (see Figure 11).
    Extensive research has been conducted on the exacerbation of silica and quartz hydrolysis under alkaline conditions [52,53]. Hydrolysis even intensifies with higher temperatures. The incorporation of basic molecules, which change the pH of interfacial water, increases hydrolysis mechanism described above and explains the bonding energy enhancement. This influence becomes even more pronounced during post-bonding anneals. Notably, the impact of alkaline ions on silica hydrolysis has also been extensively explored [54,55]. In addition to pH influence, Na+ ions could also enhance the silica hydrolysis. However, as shown by Callagon La Plante et al. [56], the influence of a high pH (≥10) predominates over the type of cation influence. The cation influence might then be neglected for the moment.
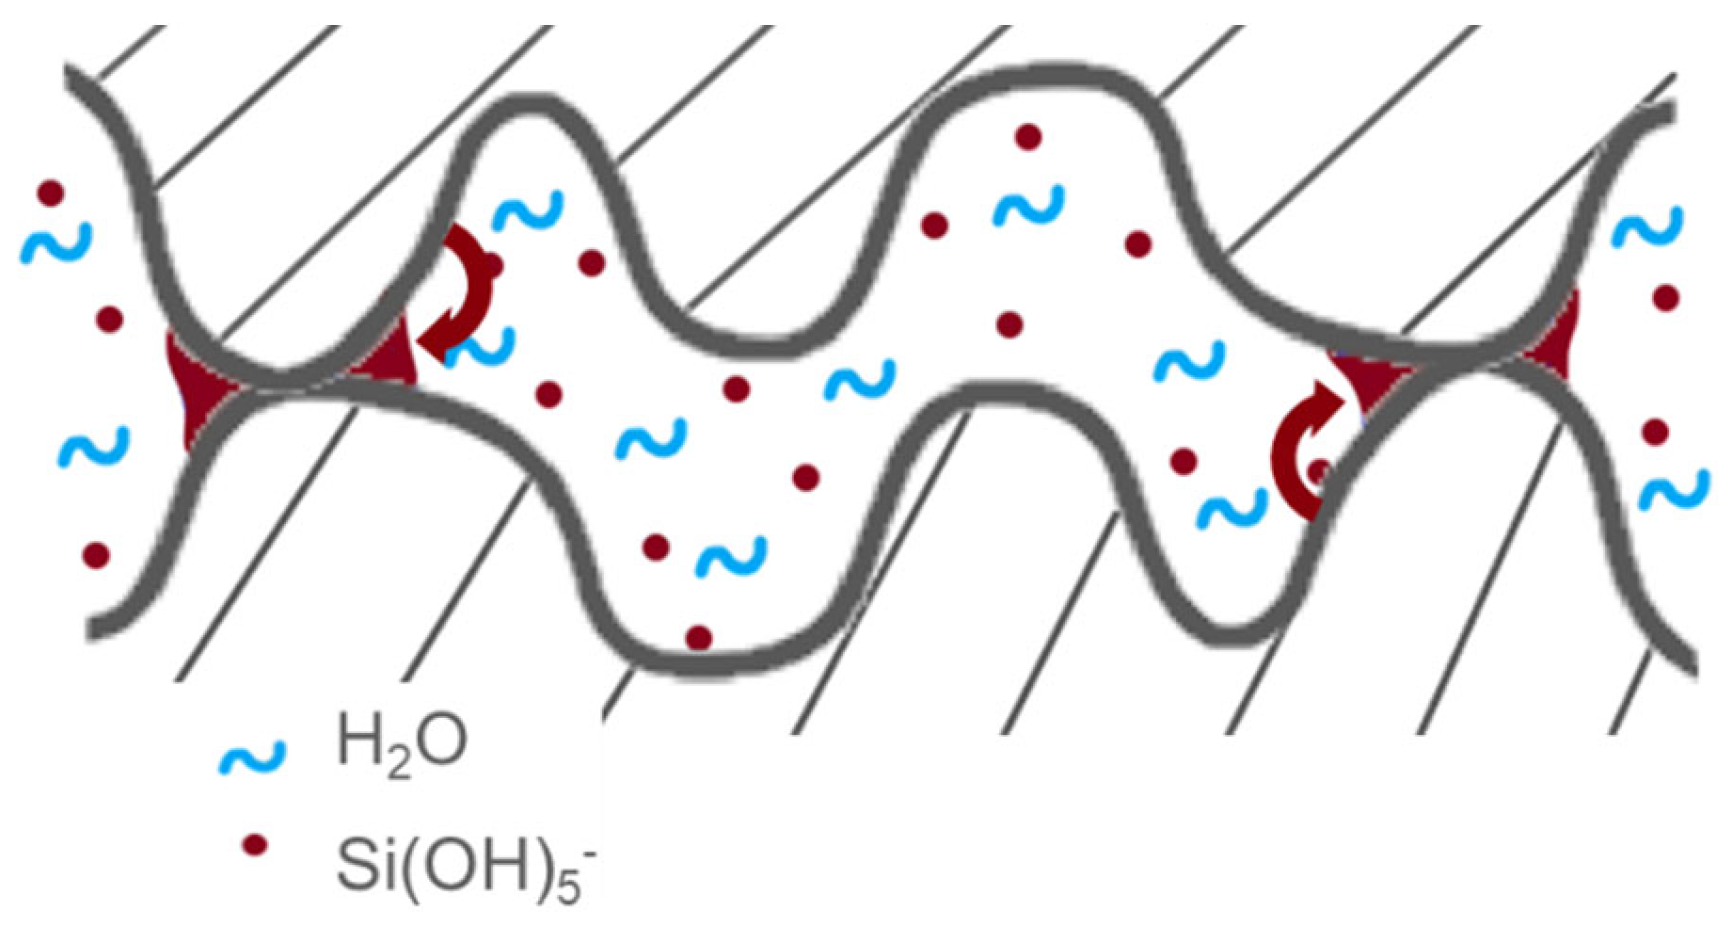
  • Another mechanism could be proposed suggesting that bonding energy enhancement can be attributed to silica dissolution and immediate condensation on the bonded asperity surface. It is well-established that OH ions attack and dissolve silica surface, as described in Equation (4) [57]:
    SiO 2 +   OH + 2 H 2 O     Si OH 5
    A portion of the silica is dissolved increasing Si OH 5 species in the interfacial water. These silicate ions subsequently form Si OH 4 (Equation (5)):
    Si OH 5   Si OH 4 +   OH
    Subsequently, Si OH 4 can change into siloxane chains, as described in Equation (6):
    Si OH 4   HO 3 SiOSi OH 3 +   H 2 O
    Given that the bonding interface is a confined system (interface width ≈ 1 nm), the silicate compound could condense elsewhere at the interface [58]. In our context, it is conceivable that condensation is more efficient around contact points, potentially due to an increased number of binding sites, thereby resulting in higher bonding energies (see Figure 12). These contact points experience compression (approximately 100 bars [50]), which could explain the localization of condensation to mitigate elastic energy. Enlarging the contact point will reduce the compression pressure inside the asperities induced by van der Waals. This will reduce the interfacial elastic mechanical energy.
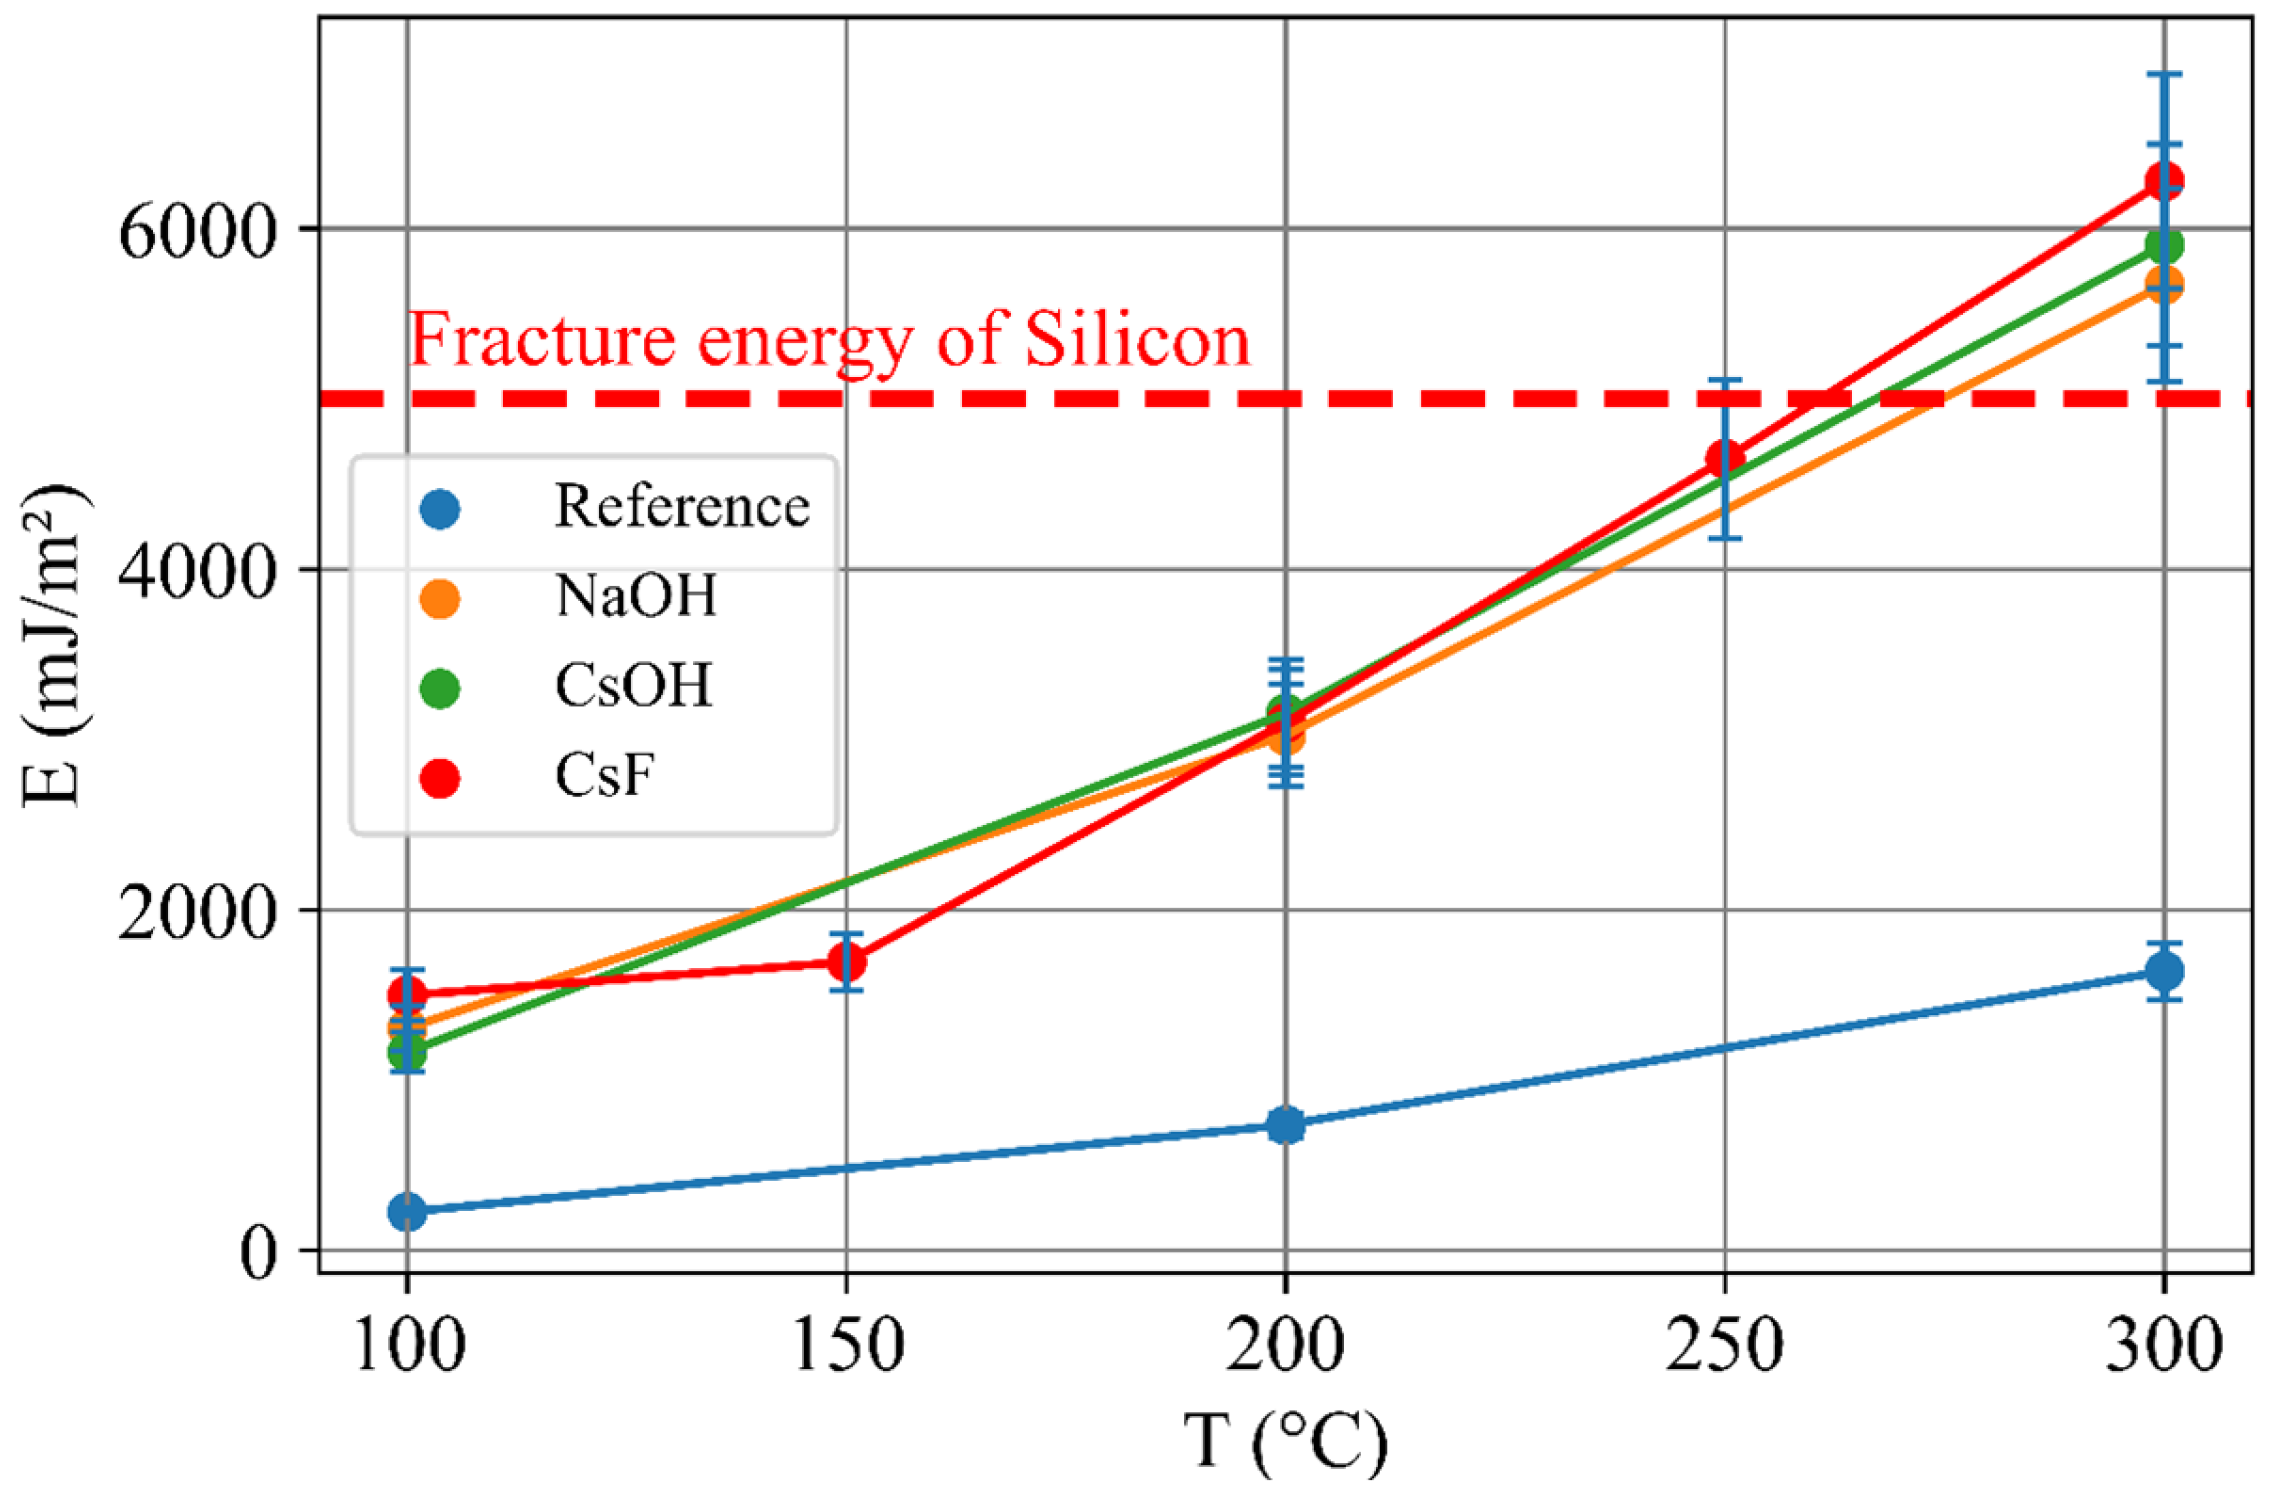
However, this third model should no longer be considered. As demonstrated by P. Noël et al. [59], certain specific molecules can boost adhesion to the same extent without etching the SiO2 layer. Obviously, without silica dissolution phenomenon, no silicates condensation could appear. P. Noël evaluated the impact of CsF, CsOH, and NaOH on bonding energy evolution during post-bonding annealing treatment.
As shown in Figure 13, all three salts have the same effect on adherence, with the fluoride ion (F⁻) exhibiting the same impact as the hydroxide ion (OH⁻).
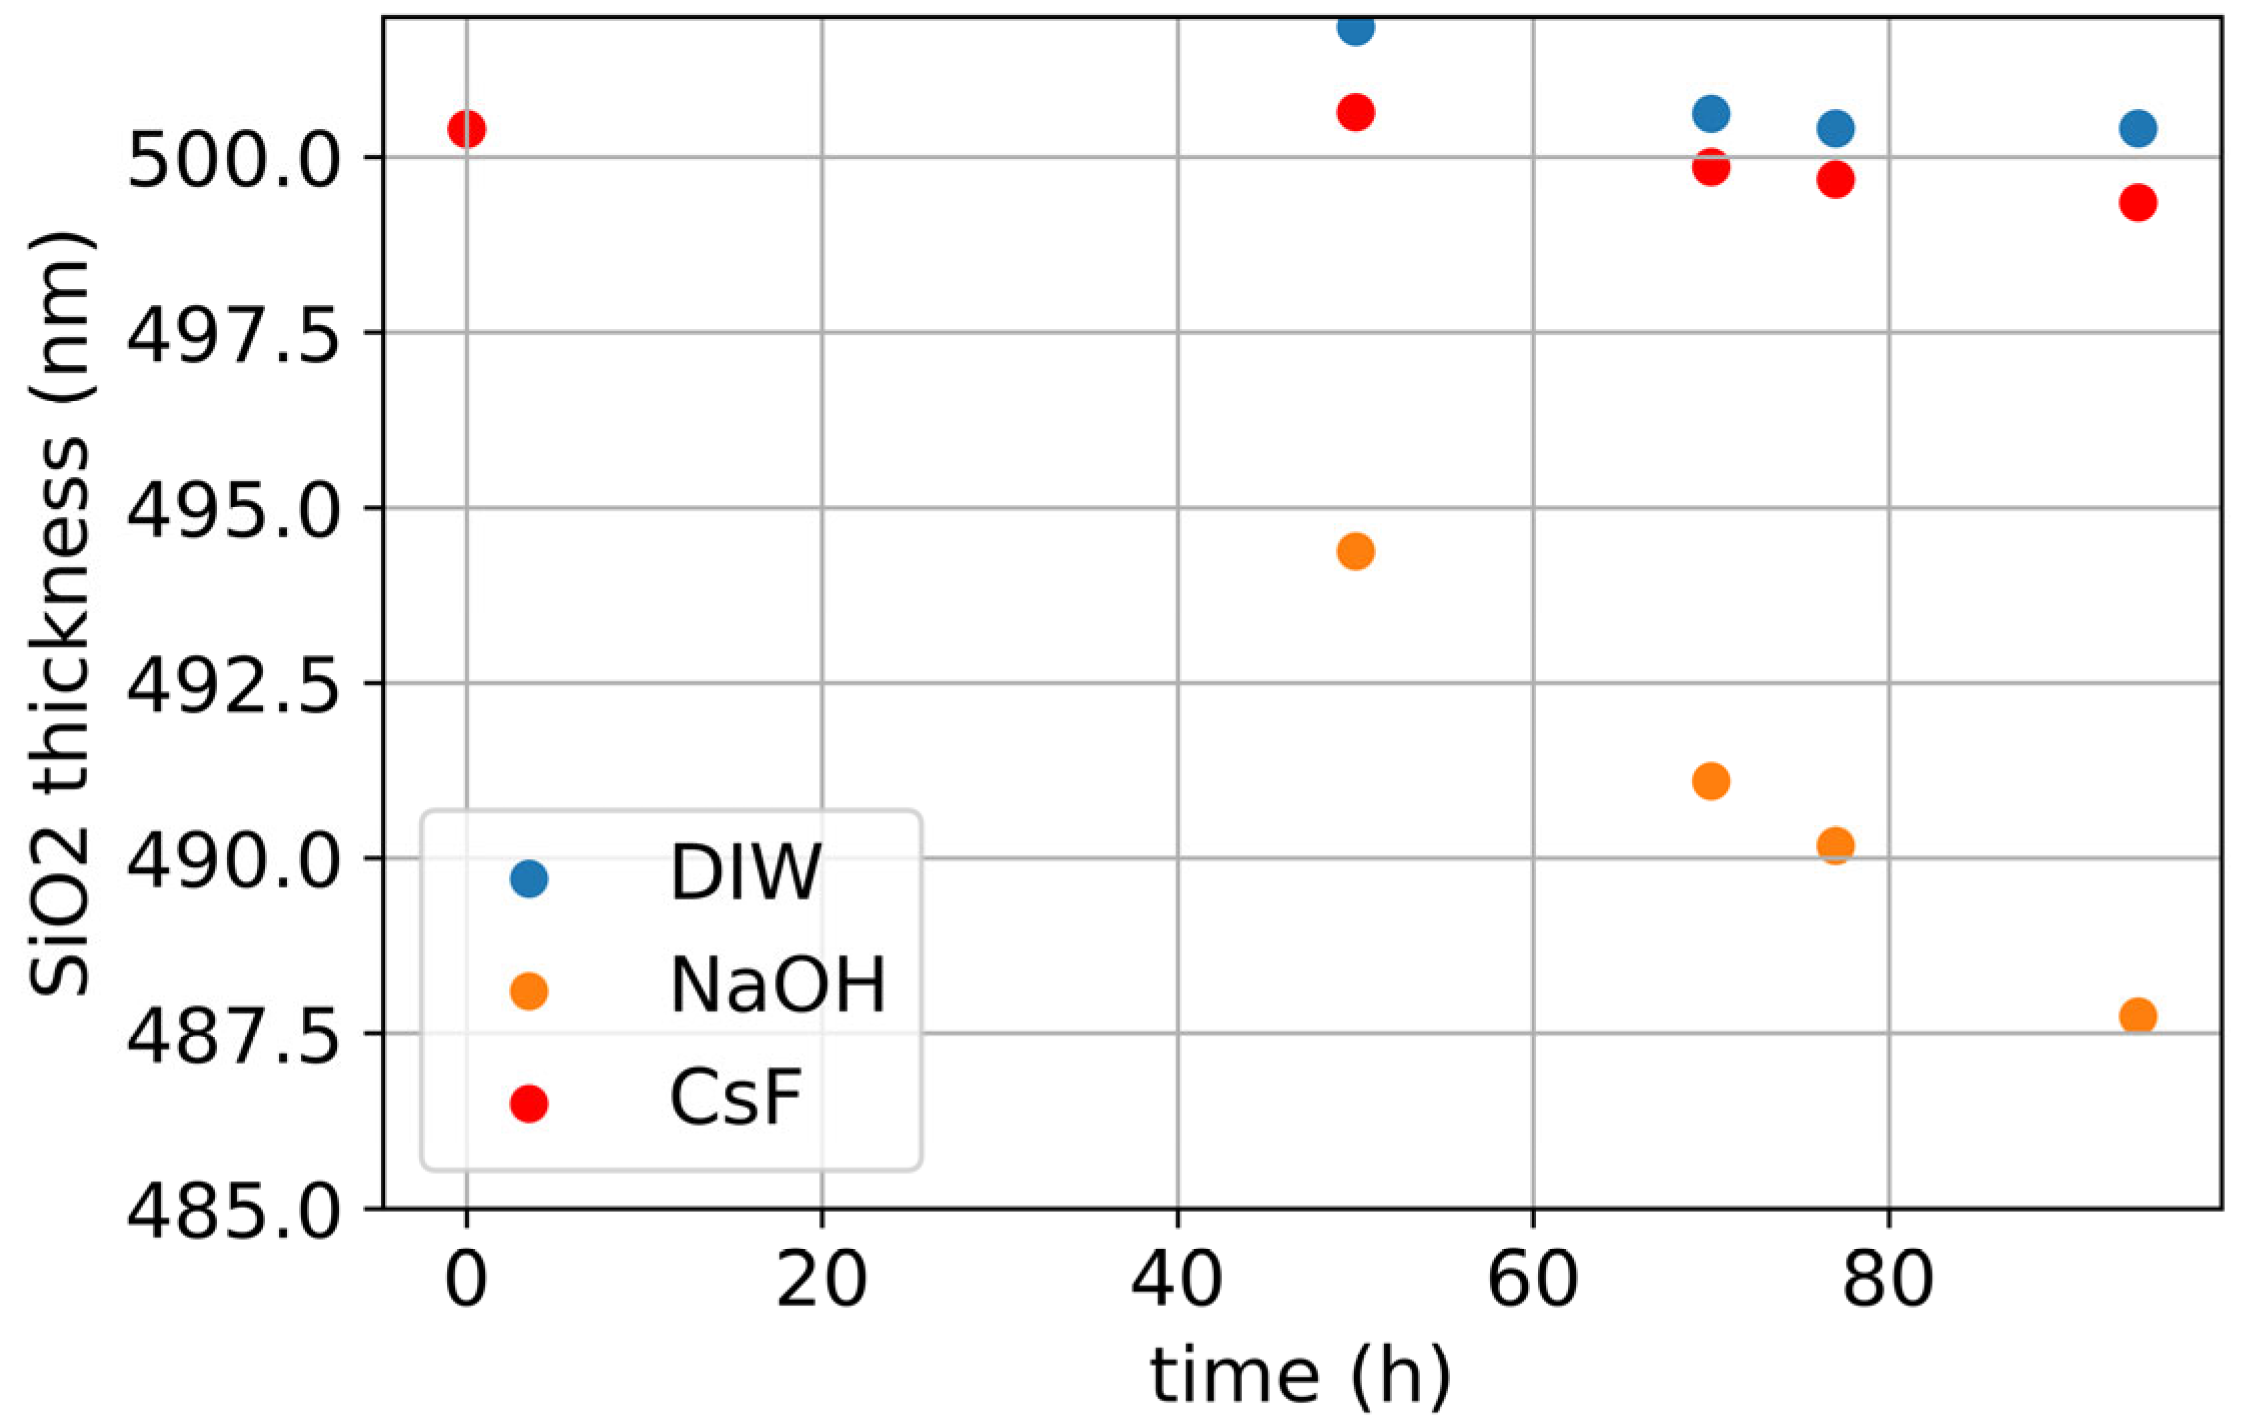
However, as depicted in Figure 14, CsF does not etch silica more than deionized water (DiW), whereas NaOH shows a significantly higher etching rate.
Therefore, the primary mechanism for bonding energy enhancement does not appear to depend on silica dissolution into silicates and condensation of these silicates on contact points.
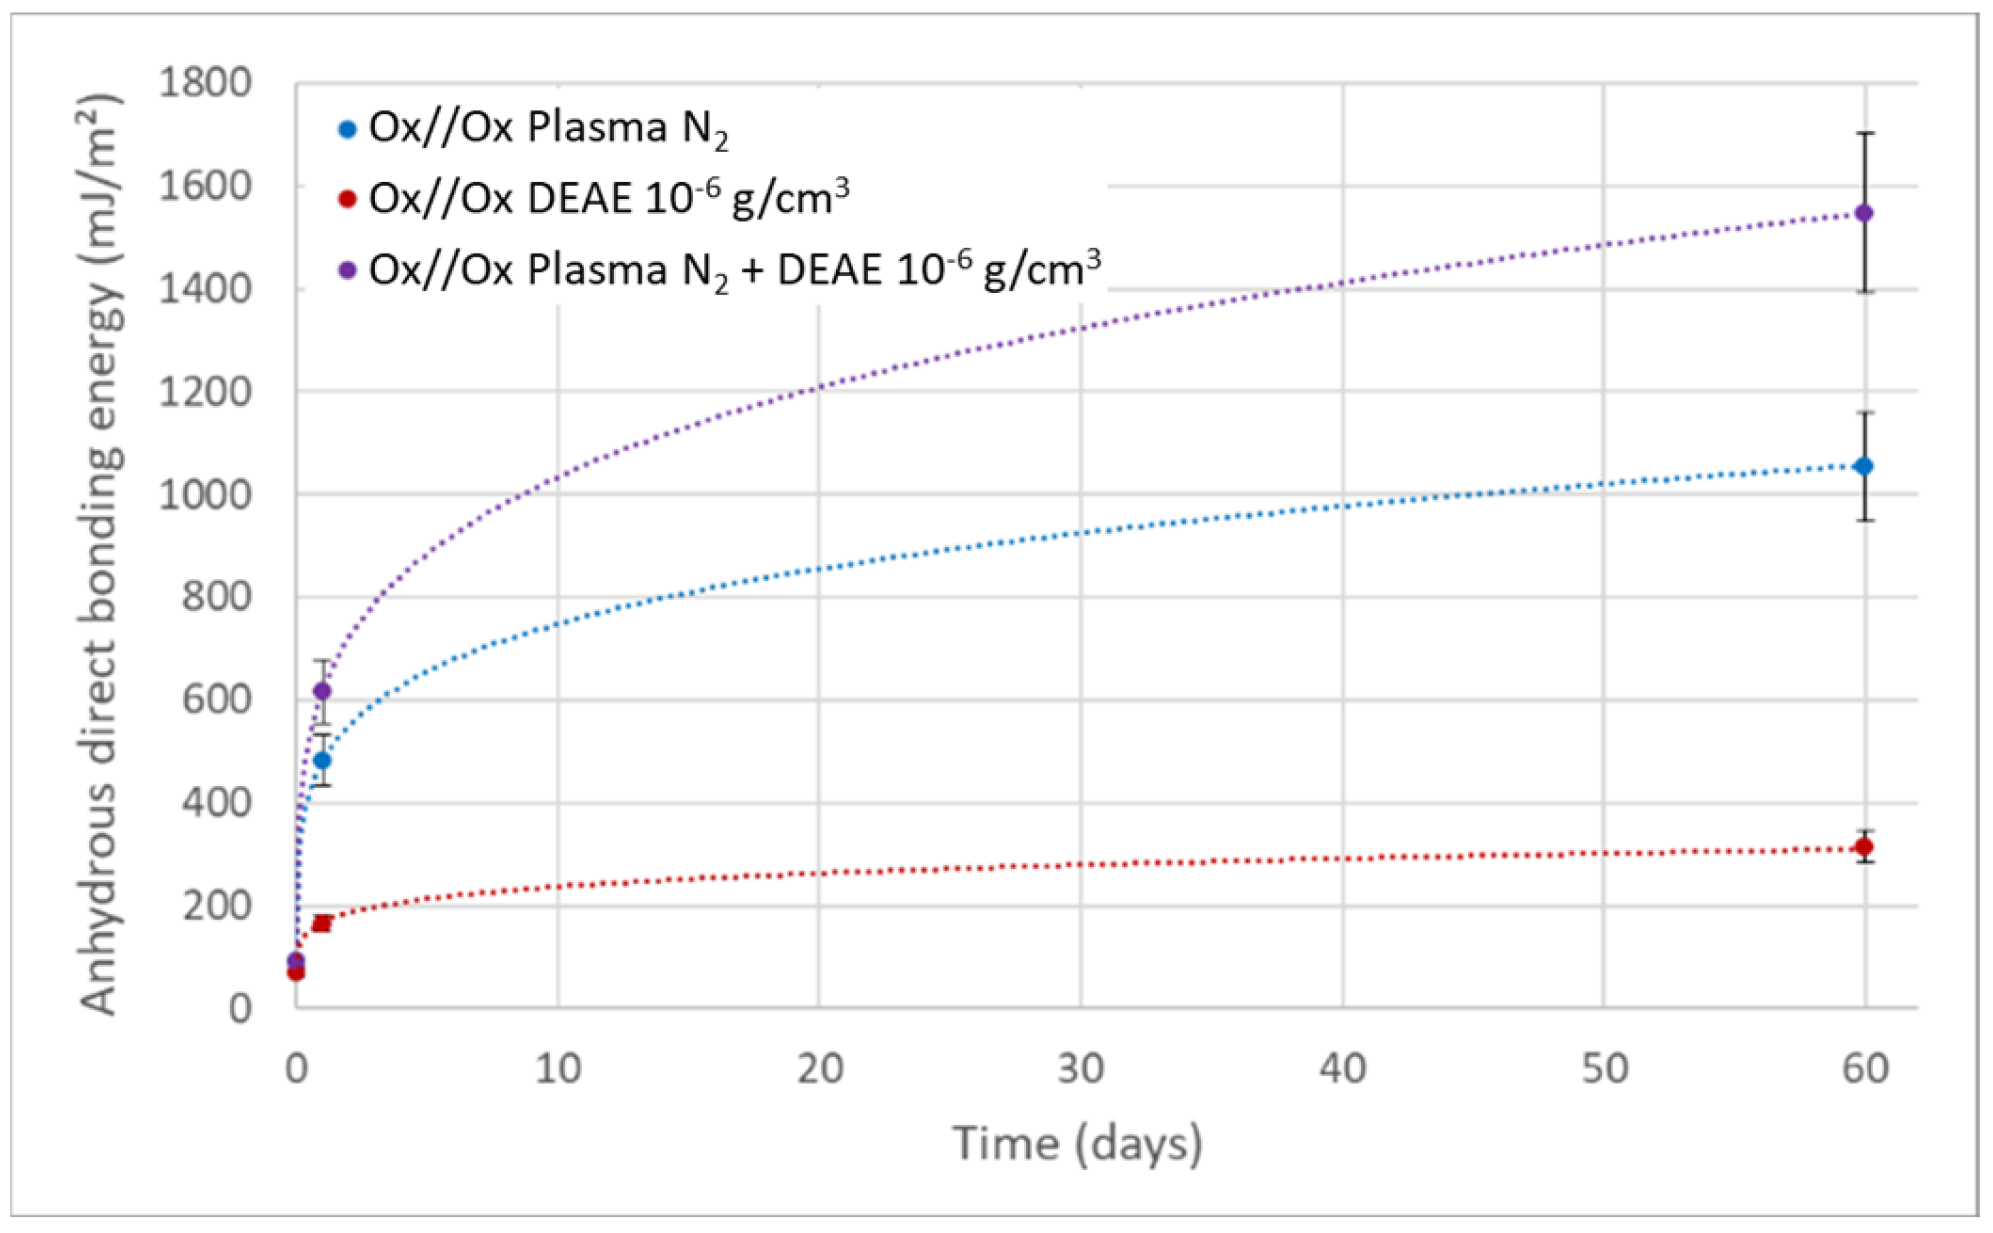
To differentiate between the two first models, a comparison with plasma effects at room temperature has been performed (see Figure 15). Indeed, a reactive ion etching (RIE) plasma surface treatment prior to bonding is known to increase direct bonding energy at room temperature while waiting in clean room environments [39]. As shown in Figure 15, an increase by a factor of 11 could be obtained after two months with bonding energy reaching 1.1 J/m2. In contrast, the addition of DEAE at the bonding interface, without plasma pre-treatment, does not yield such a bonding energy increase at room temperature. An increase by a factor of just three is obtained, with bonding energy remaining below 400 mJ/m2.
Regarding the first model—silanol condensation enhancement—our silica surfaces are cleaned using chemical treatments, particularly SC1 cleaning, which, as shown by Iler [49], fully hydrolyzes the silica surface, resulting in the maximum concentration of silanol groups. Neither plasma treatment nor the application of basic molecules alters the silanol density. Perhaps it could decrease this density, but it could not increase as it is already fully hydrolyzed due to the chemical SC1 precleaning. Now, if we consider that silanol condensation alone is responsible for the bonding energy enhancement, the lack of bonding improvement at room temperature with the basic molecule treatment suggests it would similarly fail with plasma treatment as both surfaces have the same silanol density. This implies that another mechanism must be responsible for the observed adherence increase.
On a chemically precleaned surface, the effect of plasma treatment occurs at the subsurface level. Plasma treatment modifies the surface structure over a depth of approximately three to five nanometers through ion bombardment [60]. This modification of the subsurface silica atomic order likely facilitates water penetration and enhances silica–water hydrolysis kinetics, even at room temperature. This effect is further amplified in the presence of increased pH. For instance, the addition of DEAE immediately after plasma treatment and just before bonding leads to an even more rapid increase in bonding energy at room temperature over time (see Figure 15). In the absence of plasma treatment, merely increasing the pH at room temperature is insufficient to achieve a tenfold increase in adherence. This suggests that additional energy is required for water to penetrate the asperity volume when the asperities have not been exposed to plasma treatment. Thermal annealing, in the absence of plasma treatment, could supply this energy.
The mechanism of asperity volume hydrolysis aligns most consistently with the observed results. At present, asperity hydrolysis—referred to as the second mechanism—offers the most straightforward and coherent physical explanation for these phenomena. In conclusion, based on the plasma treatment results, the second mechanism appears to be the correct one.
An additional argument supporting the asperity hydrolysis phenomenon can be drawn from the work of Lomonaco et al. on the SAB bonding mechanism [61]. In their study, the authors demonstrated that surface dangling bonds alone are insufficient to achieve high bonding energy. They used hydrophobic silicon surfaces and soft SAB activation to highlight the role of the amorphous silicon layer in the SAB mechanism. The soft SAB activation was sufficient to remove all silane bonds from the silicon surface, leaving reactive dangling bonds without producing a thick amorphous layer. One of the hydrophobic surfaces studied featured atomic terraces obtained through silicon epitaxial layer deposition, resulting in extremely low roughness.
Lomonaco et al. showed that only this exceptionally smooth surface could achieve high bonding energy, whereas a standard silicon surface with typical roughness (approximately 0.13 nm RMS) could not, even in the presence of reactive dangling bonds. If the roughness asperities of the silicon surface are not softened by the amorphization induced by SAB activation (which happened with a longer activation time), the dangling bonds remain too far apart to react effectively. Of course, for the extremely low roughness surface, the need for a soft amorphous layer is less pronounced, and a good bonding energy is obtained even after a soft SAB activation.
With a surface having a standard roughness, the presence of a soft amorphous silicon layer is therefore essential, in addition to the dangling bonds. This layer facilitates the widening of asperities and enables dangling bonds to form covalent linkages across the bonding interface.
Consequently, for the hydrophilic bonding of this study (which has similar roughness as Lomonaco’s standard silicon surface), the enhancement of adherence is not primarily dependent on the catalysis of silanol condensation. Indeed, taking as a reasonable hypothesis that the surface density of dangling bonds and silanol one is roughly equal, even if silanol condensation were as energetically favorable as the recombination of dangling bonds, the atoms from both surfaces would still need to be in close proximity to react, as observed in the Lomonaco study. Surface asperities must be softened to allow silanol condensation, even if the condensation kinetics are very fast.
Thus, silanol condensation kinetics do not appear to play the primary role. Just the catalysis of silanol condensation is not enough to explain the bonding energy enhancement. Instead, asperity softening mechanisms seem to be much more significant. The asperity hydrolysis mechanism emerges as the most plausible explanation for the enhancement of direct bonding energy.
This hydrolysis is driven by water itself, but elevated temperatures are necessary to facilitate water penetration into the roughness asperities. In this context, the addition of basic molecules catalyzes the hydrolysis, which explains the results observed during post-bonding annealing: the adherence increases more rapidly with chemical booster molecule. When plasma treatment is applied, the asperities are preemptively modified by ion bombardment, enabling water hydrolysis to occur effectively even at room temperature. This last phenomenon could be even amplified by adding chemical booster molecule.
Naturally, if plasma treatment reduces the energy barrier for water to penetrate asperities at room temperature, the effect becomes even more pronounced during annealing. This explains the remarkable efficiency of plasma treatments, even at relatively low post-bonding annealing temperatures. It is not shown in this article, but we suspect to have an amplification of this effect adding chemical booster molecule after the plasma activation and post bonding annealing.
The primary effect of plasma is to facilitate water penetration into the roughness asperities, enabling their hydrolysis. This is further supported by the observation that no enhancement in bonding energy occurs when plasma-treated surfaces are bonded within the plasma chamber without introducing water at the bonding interface, as demonstrated by Fournel et al. [39].
The system, therefore, requires water to improve silica adherence. A high concentration of water at the bonding interface and in the subsurface is beneficial for this purpose. However, excessive water concentration can weaken siloxane bonds between the wafers, shifting the equilibrium of Equation (7) to the left:
SiOH +   SiOH   SiOSi + H 2 O
It is also noteworthy that, if all the bonding energy enhancement techniques (temperature, plasma, chemical molecule) is to enable the water penetration inside the roughness asperity to hydrolyze them, this will reduce water at the bonding interface, pushing the equilibrium of Equation (7) to the right and favoring covalent bonding between the wafers. While removing water from the bonding interface increases bonding energy, it is a side effect of the primary mechanism—the need to soften the roughness asperities through silica hydrolysis.
Thus, it can be hypothesized that an optimal water amount exists that is sufficient to enable the mechanical softening of asperities but not excessive, and to minimize residual water at the bonding interface and maximize silanol condensation between the bonded surfaces.

5. Conclusions

Numerous basic amino–alcohol molecules and ions can be adsorbed onto SiO2 surfaces, increasing direct bonding energy. This likely stems from OH catalyzing silicon dioxide hydrolysis by trapped water at the bonding interface, increasing the flattening of bonding interface roughness asperities. Larger and closer contact surfaces of asperities promote then additional covalent bond formation. The introduction of such molecules after plasma treatments boosts the bonding energy even more as the plasma reduces the energy barrier for water to penetrate asperities. The influence of OH⁻ anions is clearly demonstrated. However, further and more precise experiments are needed to assess the influence of cations, particularly multivalent cations or those with varying radii.
Even if the silica asperities hydrolysis seems to be the predominant mechanism, more experiments deserve also to be performed in order to fully describe the mechanism behind this chemical bonding energy enhancement of hydrophilic silica direct bonding.

Author Contributions

Conceptualization, Methodology: A.C., V.L., P.N., F.R. and F.F. Investigation, experiment: A.C., V.L. and P.N. Validation: V.L., F.R. and F.F. Writing—original draft preparation: A.C. and F.F. Writing—review and editing: F.F. Supervision: F.R. and F.F. All authors have read and agreed to the published version of the manuscript.

Funding

This research received no external funding.

Institutional Review Board Statement

Not applicable.

Informed Consent Statement

Not applicable.

Data Availability Statement

The original contributions presented in the study are included in the article, further inquiries can be directed to the corresponding author.

Conflicts of Interest

Author François Rieutord was employed by the company SOITEC. The remaining authors declare that the research was conducted in the absence of any commercial or financial relationships that could be construed as a potential conflict of interest.

References

  1. Barth, P.W. Silicon Fusion Bonding for Fabrication of Sensors, Actuators and Microstructures. Sens. Actuators Phys. 1990, A, 919–926. [Google Scholar]
  2. Haisma, J.; Hattu, N.; Pulles, J.T.C.M.; Steding, E.; Vervest, J.C.G. Direct Bonding and Beyond. Appl. Opt. 2007, 46, 6793. [Google Scholar] [CrossRef]
  3. Plößl, A.; Kräuter, G. Wafer Direct Bonding: Tailoring Adhesion between Brittle Materials. Mater. Sci. Eng. R Rep. 1999, 25, 1–88. [Google Scholar]
  4. Tong, Q.-Y.; Gösele, U. Semiconductor Wafer Bonding: Science and Technology; The Electrochemical Society Series; John Wiley: New York, NY, USA, 1999; ISBN 978-0-471-57481-1. [Google Scholar]
  5. Bruel, M. Silicon on Insulator Material Technology. Electron. Lett. 1995, 31, 1201–1202. [Google Scholar] [CrossRef]
  6. Radisson, D. Direct Bonding of Patterned Surfaces. Ph.D. Thesis, Université de Grenoble, Grenoble, France, 2014. Available online: https://tel.archives-ouvertes.fr/tel-01362940/document (accessed on 24 March 2025).
  7. Grierson, D.; Turner, K.T. Characterization of Hysteresis of Surface Energy in Room-Temperature Direct Bonding Processes. ECS Trans. 2010, 33, 573–580. [Google Scholar] [CrossRef]
  8. Persson, B.N.J.; Mate, C.M. Role of Humidity and Surface Roughness on Direct Wafer Bonding. Eur. Phys. J. B 2024, 97, 46. [Google Scholar] [CrossRef]
  9. Turner, K.T.; Spearing, S.M. Modeling of Direct Wafer Bonding: Effect of Wafer Bow and Etch Patterns. J. Appl. Phys. 2002, 92, 7658–7666. [Google Scholar] [CrossRef]
  10. Ip, N.; Nejadsadeghi, N.; Fonseca, C.; Kohama, N.; Motoda, K. Multi-Physics Simulation of Wafer-to-Wafer Bonding Dynamics. In Proceedings of the 2022 IEEE 72nd Electronic Components and Technology Conference (ECTC), San Diego, CA, USA, 31 May–3 June 2022; pp. 502–506. [Google Scholar]
  11. Zhao, R.R.; Turner, K.T.; Bassani, J.L. Exploiting Interface Patterning for Adhesion Control. J. Mech. Phys. Solids 2022, 160, 104740. [Google Scholar] [CrossRef]
  12. Majidi, C.; Adams, G.G. A Simplified Formulation of Adhesion Problems with Elastic Plates. Proc. R. Soc. Math. Phys. Eng. Sci. 2009, 465, 2217–2230. [Google Scholar] [CrossRef]
  13. Maszara, W.P.; Goetz, G.; Caviglia, A.; McKitterick, J.B. Bonding of Silicon Wafers for Silicon-on-insulator. J. Appl. Phys. 1988, 64, 4943–4950. [Google Scholar] [CrossRef]
  14. Vallin, Ö.; Jonsson, K.; Lindberg, U. Adhesion Quantification Methods for Wafer Bonding. Mater. Sci. Eng. R Rep. 2005, 50, 109–165. [Google Scholar] [CrossRef]
  15. Gillis, P.P.; Gilman, J.J. Double-Cantilever Cleavage Mode of Crack Propagation. J. Appl. Phys. 1964, 35, 647–658. [Google Scholar]
  16. El-Zein, M.S.; Reijsnider, K.L. Evaluation of GIC in a DCB Specimen Using an Anisotropic Solution. J. Compos. Technol. Res. 1988, 10, 151–155. [Google Scholar]
  17. Masteika, V.; Rogers, T.; Santilli, R.; Fraser, S.; Aioubi, M.Y.A. Automatic Maszara Testing Jig. In Proceedings of the 2017 5th International Workshop on Low Temperature Bonding for 3D Integration (LTB-3D), Tokyo, Japan, 16–18 May 2017; p. 62. [Google Scholar]
  18. Ko, C.-T.; Chen, K.-N. Low Temperature Bonding Technology for 3D Integration. Microelectron. Reliab. 2012, 52, 302–311. [Google Scholar] [CrossRef]
  19. Kang, Q.; Wang, C.; Zhou, S.; Li, G.; Lu, T.; Tian, Y.; He, P. Low-Temperature Co-Hydroxylated Cu/SiO2 Hybrid Bonding Strategy for a Memory-Centric Chip Architecture. ACS Appl. Mater. Interfaces 2021, 13, 38866–38876. [Google Scholar] [CrossRef]
  20. Schmidt, R.; Schwarz, C.; Tamer, E.; Dieter, S. Optimization of the Copper Microstructure to Improve Copper-to-Copper Direct Bonding. IMAPSource Proc. 2023, 2022, 000280–000286. [Google Scholar] [CrossRef]
  21. Chiu, W.-L.; Lee, O.-H.; Kuo, T.-Y.; Lo, J.Y.-J.; Shih, C.-L.; Chiu, H.-Y.; Chang, H.-H. Low Temperature and Fine Pitch Nanocrystalline Cu/SiCN Wafer-to-Wafer Hybrid Bonding. In Proceedings of the 2023 IEEE 73rd Electronic Components and Technology Conference (ECTC), Orlando, FL, USA, 30 May–2 June 2023; pp. 1105–1109. [Google Scholar]
  22. Zhou, W.; Kwon, M.; Chiu, Y.; Guo, H.; Bhushan, B.; Street, B.; Parekh, K.; Singh, A. Critical Challenges with Copper Hybrid Bonding for Chip-to-Wafer Memory Stacking. In Proceedings of the 2023 IEEE 73rd Electronic Components and Technology Conference (ECTC), Orlando, FL, USA, 30 May–2 June 2023; pp. 336–341. [Google Scholar]
  23. Bayu-Aji, L.B.; Pirouz, P. Brittle-to-Ductile Transition Temperature in InP. Phys. Status Solidi A 2009, 207, 1190–1195. [Google Scholar] [CrossRef]
  24. Lee, Y.; Yang, I.; Tan, H.H.; Jagadish, C.; Karuturi, S.K. Monocrystalline InP Thin Films with Tunable Surface Morphology and Energy Band Gap. ACS Appl. Mater. Interfaces 2020, 12, 36380–36388. [Google Scholar] [CrossRef]
  25. Suni, T.; Henttinen, K.; Suni, I.; Makinen, J. Effects of Plasma Activation on Hydrophilic Bonding of Si and SiO2. J. Electrochem. Soc. 2002, 149, G348–G351. [Google Scholar]
  26. Cocheteau, N.; Maurel-Pantel, A.; Lebon, F.; Mazerolle, F.; Rosu, I.; Ait-Zaid, S.; De Larclause, I.S. Influence of Roughness on Mechanical Strength of Direct Bonded Silica and Zerodur® Glasses. Int. J. Adhes. Adhes. 2016, 68, 87–94. [Google Scholar] [CrossRef]
  27. Hahn, S.H.; Kim, W.; Shin, D.; Lee, Y.; Kim, S.; Choi, W.; Lim, K.; Moon, B.; Rhee, M. Contamination-Free Cu/SiCN Hybrid Bonding Process Development for Sub- Μm Pitch Devices with Enhanced Bonding Characteristics. In Proceedings of the 2023 IEEE 73rd Electronic Components and Technology Conference (ECTC), Orlando, FL, USA, 30 May–2 June 2023; pp. 1390–1396. [Google Scholar]
  28. Larrey, V.; Arribehaute, A.; Caulfield, B.; Acosta Alba, P.; Morales, C.; Noël, P.; Opprecht, M.; Fournel, F.; Landru, D.; Rieutord, F. Nanosecond Laser Irradiation for Interface Bonding Characterization. ECS Trans. 2023, 112, 39–49. [Google Scholar] [CrossRef]
  29. Calvez, A.; Fournel, F.; Larrey, V.; Eleouet, G.; Morales, C.; Rieutord, F. Impact of Amino-Alcohol Organic Molecule on Various Silicon Oxide Bondings. ECS J. Solid State Sci. Technol. 2021, 10, 064005. [Google Scholar] [CrossRef]
  30. Birckigt, P.; Rothhardt, C.; Zeitner, U.D.; Risse, S. Water Stress Corrosion in a Directly Bonded Borofloat Glass Interface. ECS J. Solid State Sci. Technol. 2024, 13, 123005. [Google Scholar] [CrossRef]
  31. Tabata, T.; Sanchez, L.; Larrey, V.; Fournel, F.; Moriceau, H. SiO2-SiO2 Die-to-Wafer Direct Bonding Interface Weakening. Microelectron. Reliab. 2020, 107, 113589. [Google Scholar] [CrossRef]
  32. Qi, X.; Zhou, S.; Ma, Y.; Suga, T.; Wang, C. Boosting Non-Oxide Interfacial Co/SiO2 Hybrid Bonding by Selective Surface Activation. Int. J. Extreme Manuf. 2025, 7, 035101. [Google Scholar] [CrossRef]
  33. Fournel, F.; Continni, L.; Morales, C.; Da Fonseca, J.; Moriceau, H.; Rieutord, F.; Barthelemy, A.; Radu, I. Measurement of Bonding Energy in an Anhydrous Nitrogen Atmosphere and Its Application to Silicon Direct Bonding Technology. J. Appl. Phys. 2012, 111, 104907. [Google Scholar] [CrossRef]
  34. Wiederhorn, S.M.; Freiman, S.W.; Fuller Jr, E.R.; Simmons, C.J. Effects of Water and Other Dielectrics on Crack Growth. J. Mater. Sci. 1982, 17, 3460–3478. [Google Scholar] [CrossRef]
  35. Ciccotti, M. Stress-Corrosion Mechanisms in Silicate Glasses. J. Phys. Appl. Phys. 2009, 42, 214006. [Google Scholar] [CrossRef]
  36. Martini, T.; Steinkirchner, J.; Gösele, U. The Crack Opening Method in Silicon Wafer Bonding How Useful Is It? J. Electrochem. Soc. 1997, 144, 354–357. [Google Scholar] [CrossRef]
  37. Bertholet, Y.; Iker, F.; Raskin, J.P.; Pardoen, T. Steady-State Measurement of Wafer Bonding Cracking Resistance. Sens. Actuators Phys. 2004, 110, 157–163. [Google Scholar] [CrossRef]
  38. Iwata, T.; Fuse, J.; Yoshihara, Y.; Kondo, Y.; Sano, M.; Inoue, F. Water Stress Corrosion at Wafer Bonding Interface during Bond Strength Evaluation. Mater. Sci. Semicond. Process. 2024, 184, 108820. [Google Scholar] [CrossRef]
  39. Fournel, F.; Martin-Cocher, C.; Radisson, D.; Larrey, V.; Beche, E.; Morales, C.; Delean, P.A.; Rieutord, F.; Moriceau, H. Water Stress Corrosion in Bonded Structures. ECS J. Solid State Sci. Technol. 2015, 4, P124–P130. [Google Scholar] [CrossRef]
  40. Fujino, M.; Takahashi, K.; Kikuchi, K.; Miyata, N.; Yoshida, T.; Miyazaki, T. Interfacial Analysis of Plasma Fusion Bonded Interfaces under Various Bonding Conditions by Neutron Reflectometry. ECS Trans. 2020, 98, 11–16. [Google Scholar] [CrossRef]
  41. Huang, R.; Lan, T.; Li, C.; Wang, Z. Plasma-Activated Direct Bonding at Room Temperature to Achieve the Integration of Single-Crystalline GaAs and Si Substrate. Results Phys. 2021, 31, 105070. [Google Scholar] [CrossRef]
  42. Takeuchi, K.; Suga, T. Quantification of Wafer Bond Strength under Controlled Atmospheres. Jpn. J. Appl. Phys. 2022, 61, SF1010. [Google Scholar] [CrossRef]
  43. Du, Y.; Liu, L.; Zhu, B.; Jiang, H.; Zhang, X.; Wang, C. Low-Temperature Fusion Bonding of Aluminosilicate Glass via Intermediate Water. Ceram. Int. 2024, 50, 10252–10258. [Google Scholar] [CrossRef]
  44. Tedjini, M. Gestion de L’eau à L’interface de Collage Silicium/Silicium. Ph.D. Thesis, Université de Grenoble, Grenoble, France, 2017. [Google Scholar]
  45. Behrens, S.H.; Grier, D.G. The Charge of Glass and Silica Surfaces. J. Chem. Phys. 2001, 115, 6716–6721. [Google Scholar] [CrossRef]
  46. Castex, A.; Broekaart, M.; Rieutord, F.; Landry, K.; Lagahe-Blanchard, C. Mechanism of Edge Bonding Void Formation in Hydrophilic Direct Wafer Bonding. ECS Solid State Lett. 2013, 2, P47–P50. [Google Scholar] [CrossRef]
  47. Iacovo, S.; Beyne, E.; Horiguchi, N. Bonding for Advanced 3D Logic Devices. In Proceedings of the 2024 8th International Workshop on Low Temperature Bonding for 3D Integration (LTB-3D), Nara, Japan, 30 October–1 November 2024; p. 1. [Google Scholar]
  48. Lin, W.; Shi, L.; Yao, Y.; Madan, A.; Pinto, T.; Zavolas, N.; Murphy, R.; Skordas, S.; Iyer, S. Low-Temperature Oxide Wafer Bonding for 3-D Integration: Chemistry of Bulk Oxide Matters. IEEE Trans. Semicond. Manuf. 2014, 27, 426–430. [Google Scholar] [CrossRef]
  49. Iler, R.K. The Chemistry of Silica: Solubility, Polymerization, Colloid and Surface Properties, and Biochemistry; John Wiley and Sons: Hoboken, NJ, USA, 1979. [Google Scholar]
  50. Rieutord, F.; Moriceau, H.; Beneyton, R.; Capello, L.; Morales, C.; Charvet, A.-M. Rough Surface Adhesion Mechanisms for Wafer Bonding. ECS Trans. 2006, 3, 205–215. [Google Scholar] [CrossRef]
  51. Brinker, C.J. Hydrolysis and Condensation of Silicates: Effects on Structure. J. Non-Cryst. Solids 1988, 100, 31–50. [Google Scholar] [CrossRef]
  52. House, W.A.; Hickinbotham, L.A. Dissolution Kinetics of Silica between 5 and 35 °C. Application of a titrimetric method. J. Chem. Soc. Faraday Trans. 1992, 88, 2021–2026. [Google Scholar]
  53. Crundwell, F.K. On the Mechanism of the Dissolution of Quartz and Silica in Aqueous Solutions. ACS Omega 2017, 2, 1116–1127. [Google Scholar] [CrossRef]
  54. Dove, P.M.; Nix, C.J. The Influence of the Alkaline Earth Cations, Magnesium, Calcium, and Barium on the Dissolution Kinetics of Quartz. Geochim. Cosmochim. Acta 1997, 61, 3329–3340. [Google Scholar] [CrossRef]
  55. Rimstidt, J.D.; Zhang, Y.; Zhu, C. Rate Equations for Sodium Catalyzed Amorphous Silica Dissolution. Geochim. Cosmochim. Acta 2016, 195, 120–125. [Google Scholar] [CrossRef]
  56. La Plante, E.C.; Oey, T.; Hsiao, Y.-H.; Perry, L.; Bullard, J.W.; Sant, G. Enhancing Silicate Dissolution Kinetics in Hyperalkaline Environments. J. Phys. Chem. C 2019, 123, 3687–3695. [Google Scholar] [CrossRef]
  57. Elliffe, E.J.; Bogenstahl, J.; Deshpande, A.; Hough, J.; Killow, C.; Reid, S.; Robertson, D.; Rowan, S.; Ward, H.; Cagnoli, G. Hydroxide-Catalysis Bonding for Stable Optical Systems for Space. Class. Quantum Gravity 2005, 22, S257–S267. [Google Scholar] [CrossRef]
  58. Gouze, B.; Cambedouzou, J.; Parrès-Maynadié, S.; Rébiscoul, D. How Hexagonal Mesoporous Silica Evolves in Water on Short and Long Term: Role of Pore Size and Silica Wall Porosity. Microporous Mesoporous Mater. 2014, 183, 168–176. [Google Scholar] [CrossRef]
  59. Noel, P.; Larrey, V.; Tardif, S.; Rieutord, F.; Landru, D.; Fournel, F. Hydroxide and Fluoride Catalyzed Bonding Interface Closure for Low-Temperature Wafer Bonding. Jpn. J. Appl. Phys. 2025, 64, 03SP06. [Google Scholar] [CrossRef]
  60. Rauch, N.; Andersen, E.; Vicente-Gabás, I.G.; Duchoslav, J.; Minenkov, A.; Gasiorowski, J.; Flötgen, C.; Hingerl, K.; Groiss, H. A Model for Spectroscopic Ellipsometry Analysis of Plasma-Activated Si Surfaces for Direct Wafer Bonding. Appl. Phys. Lett. 2022, 121, 081603. [Google Scholar] [CrossRef]
  61. Lomonaco, Q.; Abadie, K.; Hartmann, J.-M.; Morales, C.; Noël, P.; Marion, T.; Lecouvey, C.; Papon, A.-M.; Fournel, F. Soft Surface Activated Bonding of Hydrophobic Silicon Substrates. ECS Trans. 2023, 112, 139–145. [Google Scholar] [CrossRef]
Figure 1. Experimental liquid solution spreading process.
Applsci 15 03883 g001
Figure 2. Principle of the DCB under prescribed displacement for direct wafer bonding energy measurement. δ is the blade thickness, t the wafer thickness, and a the crack length, which is the sum of the blade bevel Xb, the IR debonded length measurement Xm, and the calculated post IR debonded length Xλ [33].
Applsci 15 03883 g002
Figure 3. Experimental setup for anhydrous DCB bonding energy characterization [33].
Applsci 15 03883 g003
Figure 4. (a) Infrared characterization of the bonding wave, taken midway through its propagation. The white spot in the middle of the first half of the image corresponds to the infrared camera’s image and is not a bonding defect. (b) Typical scanning acoustic microscopy image of the bonding studied. No bonding defects are detected. The pixel size is 10 µm.
Applsci 15 03883 g004
Figure 5. Influence of various acidic and basic molecules on anhydrous direct bonding energy as a function of the annealing temperature. The cross represents the sample breakage, meaning that the bonding energy is higher than Si bulk material fracture energy (We have chosen arbitrarily to put the cross at 6.5 J/m2).
Applsci 15 03883 g005
Figure 6. Diffusion light scattering images @1000 nm of Si wafers after water or NaOH solution dispense at two different concentrations.
Applsci 15 03883 g006
Figure 7. AFM (atomic force microscopy) images (scan size = 1 μm) of SiO2 surfaces after spreading of: (a) deionized water, (b) NaOH 10−5 g/cm3 solution, and (c) NaOH 10−4 g/cm3 solution.
Applsci 15 03883 g007
Figure 8. Diffusion light scattering images @90 nm of Si wafers after NaOH 10−4 g/cm3 solution dispense and DiW rinse.
Applsci 15 03883 g008
Figure 9. Influence of NaOH concentration in DIW on the anhydrous direct bonding energy for various annealing temperatures. Crosses represent sample breakage, meaning that the bonding energy is higher than Si bulk material fracture energy (we have chosen arbitrarily to put the cross at 6.5 J/m2).
Applsci 15 03883 g009
Figure 10. Anhydrous direct bonding energy of SiO2 bonding as a function of pH of the dispensed solution, for a 300 °C annealing during 2 h. The cross represents the sample breakage.
Applsci 15 03883 g010
Figure 11. Asperity contact model with flattened asperities through silica volume hydrolysis.
Applsci 15 03883 g011
Figure 12. Asperity contact model with surface hydrolysis condensation.
Applsci 15 03883 g012
Figure 13. Bonding energy as a function of annealing temperature for the Reference (no catalysts), NaOH, CsOH, and CsF samples for 2 h annealing [59].
Applsci 15 03883 g013
Figure 14. Silicon dioxide thickness measured by ellipsometry as a function of etching time in different solutions [59].
Applsci 15 03883 g014
Figure 15. Comparison of plasma and DEAE effects on silicon dioxide direct bonding energy at room temperature aging the bonding in the clean room environment.
Applsci 15 03883 g015
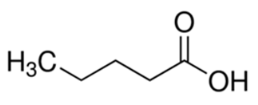
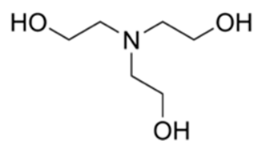
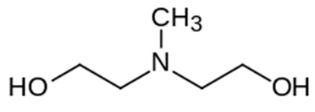
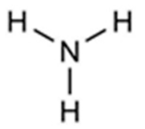
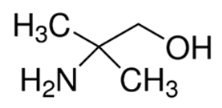
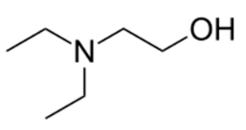
Table 1. Table of the different evaluated molecules and salts with their partial vapor pressure (Pvap), acidic constant (pKa), topological formula, and molecular weight (g/mol).
Molecule NamePvap (Pa)pKaFormulaMolecular WeightSupplier
Merck
Hydrochloric acid0 HCl361.09057
Pentanoic acid234.84Applsci 15 03883 i0011028.00821
Deionized water (DiW)2340 Applsci 15 03883 i00218
Sodium chloride<1 NaCl5859222C
Triethanolamine17.76Applsci 15 03883 i00314990279
N-Methyldiethanolamine (MDEA)<18.52Applsci 15 03883 i004119471828
Ammoniac860 × 1039.23Applsci 15 03883 i0051709859
2-ethylamino-ethanol<19.47Applsci 15 03883 i00689471461
Ethanolamine509.5Applsci 15 03883 i0076115014
2-amino-2-methyl-1-propanol<19.7Applsci 15 03883 i0088908578
N,N-Diethylethanolamine (DEAE)1909.87Applsci 15 03883 i009117471321
Sodium hydroxide0 NaOH401.09137
Table 2. Calculated pH of NaOH solutions that are spread on wafers prior to bonding.
NaOH Solution ConcentrationCalculated pH
10−5 g/cm310.4
10−6 g/cm39.4
10−7 g/cm38.4
10−8 g/cm37.4
Table 3. Na+ concentrations on wafer surfaces from TXRF. 2 × 10¹¹ at/cm2 is the TXRF detection limit for Na+.
Dispense SolutionNa+ Concentration on Wafer Surface (at/cm2)
H2O<2 × 10¹¹
NaOH 10−8 g/cm3<2 × 1011
NaOH 10−7 g/cm32.8 × 1011
NaOH 10−6 g/cm31.8 × 1012
NaOH 10−5 g/cm31.2 × 1013
NaOH 10−4 g/cm38.4 × 1013
Table 4. DEAE concentration on wafer surfaces measured by WOS/ATDGCMS.
Dispense SolutionDEAE Concentration on Wafer Surface (molecule/cm2)
H2OND
DEAE 10−6 g/cm3ND
DEAE 10−5 g/cm39.74 × 1012
DEAE 10−4 g/cm38.14 × 1013
Disclaimer/Publisher’s Note: The statements, opinions and data contained in all publications are solely those of the individual author(s) and contributor(s) and not of MDPI and/or the editor(s). MDPI and/or the editor(s) disclaim responsibility for any injury to people or property resulting from any ideas, methods, instructions or products referred to in the content.