Article

Enhanced Adaptive Sine Multi-Taper Power Spectral Density Estimation for System Performance Evaluation in Low-Frequency Gravitational Wave Detection

1
National Key Laboratory of Optical Field Manipulation Science and Technology, Chinese Academy of Sciences, Chengdu 610020, China
2
Key Laboratory of Optical Engineering, Chinese Academy of Sciences, Chengdu 610209, China
3
Institute of Optics and Electronics, Chinese Academy of Sciences, Chengdu 610209, China
4
University of Chinese Academy of Sciences, Beijing 100049, China
*
Authors to whom correspondence should be addressed.
Appl. Sci. 2025, 15(7), 3919; https://doi.org/10.3390/app15073919
Submission received: 11 February 2025 / Revised: 25 March 2025 / Accepted: 29 March 2025 / Published: 3 April 2025

Abstract

:

Featured Application

The optimized adaptive sine multi-taper algorithm proposed in this study significantly enhances the accuracy and efficiency of power spectral density estimation in system performance evaluations for low-frequency gravitational-wave-detection projects. Beyond its application in space-based gravitational wave detection, this algorithm can be extended to other low-frequency signal processing domains, such as seismic monitoring, geophysical exploration, and precision instrument noise analysis, offering new technical support for system evaluation and performance optimization in these fields.

Abstract

The power spectral density estimation algorithms, logarithmic frequency axis for power spectral density (LPSD), and the LISA-LPSD algorithm are widely utilized in the implementation of system evaluations for space-based gravitational-wave-detection projects, particularly in the low-frequency band ranging from 0.1 mHz to 1 Hz. However, existing adaptive sine multi-taper algorithms suffer from low resolution and high computational complexity in obtaining the optimal cone number across the entire frequency domain, which has hindered its application in this field. These algorithms often face challenges related to inadequate resolution when dealing with low-frequency signals, as well as the issue of high computational demands. In response to these challenges, this paper introduces an advanced adaptive sine multi-taper algorithm designed to optimize the determination of the cone number. By balancing the relationship between bias and variance, this approach facilitates gradient processing of the cone number specifically tailored for low-frequency signals. Comparative evaluations against the LPSD algorithm, the original adaptive sine multi-taper algorithm, and the LISA-LPSD algorithm reveal that the proposed method demonstrates superior spectral resolution and reduced algorithmic complexity. This improvement offers a more effective solution for the system evaluation of low-frequency gravitational-wave-detection projects.

1. Introduction

Space-based gravitational wave detection focuses on the frequency range of 0.1 mHz to 1 Hz, which encompasses information about gravitational wave sources with larger characteristic masses and scales. Currently, large-scale laser interferometric projects with varying spacecraft sizes and orbits are being progressively implemented [1]. Among these, the PAAM (Pointing Ahead Assembly Mechanism) is critical for precise beam pointing [2,3]. However, its accuracy is impacted by several noise sources, such as shot noise, pointing jitter, laser frequency fluctuations, clock jitter, and phase readout noise [4]. Therefore, accurately assessing the impact of noise within the 0.1 mHz to 1 Hz frequency range on the precise pointing measurement system is essential for evaluating system performance.
According to the Nyquist–Shannon sampling theorem, the minimum sampling rate for space-based gravitational wave detection is 2 Hz. To analyze the full noise spectrum, the minimum analysis frequency must be 0.1 mHz, requiring a sampling duration of at least 2.8 h. In practice, a sampling rate of 20 Hz is commonly used, extending the sampling duration up to 5 h. However, existing commercial instruments are limited to a minimum analysis frequency of 375 mHz, which is insufficient for full-bandwidth noise evaluation in gravitational wave detection [2]. Additionally, strain sensitivity requirements necessitate the detection of picometer-level path length changes, and the pointing noise spectral density must meet specified targets [3]. Notably, power spectral density (PSD) and amplitude spectral density (ASD) analyses are more sensitive to noise and offer a more stable representation of noise characteristics than power or amplitude spectrum analyses, which makes ASD the preferred choice for data analysis [5].
Power spectrum density (PSD) estimation methods are mainly categorized into classical and parametric approaches. Given the unknown characteristics of spectral signals, this study focuses on classical PSD estimation algorithms [6]. Since Welch’s introduction of the windowed overlapped segment averaging (WOSA) method in 1967 [7,8], various improvements have been proposed, including Thomson’s multi-taper method [9], Riedel and Sidorenko’s adaptive sine multi-tapers algorithm [10], and Tröbs and Heinzel’s logarithmic power spectrum density (LPSD) algorithm [11]. Despite these advancements, challenges remain, including high computational complexity and low-frequency resolution issues [12,13,14,15,16]. Recent developments include bandwidth optimization methods [17], taper optimization for reducing spectral leakage [18], and the multi-taper S-transform (MTST) technique [19,20], and adaptive algorithms based on low-frequency optimization [21] and have been successively proposed. In 2023, Zhang Yi-Ming et al. proposed a multi-taper spectral density estimation algorithm with an adaptive stopping criterion for taper selection [22]. However, these methods still exhibit limitations in computational efficiency and low-frequency resolution. Furthermore, recent studies have indicated that the design technology of two-dimensional leaky wave antennas can indirectly enhance the detection capability of low-frequency signals by optimizing signal directivity, providing new insights for noise suppression in space gravitational wave detection [23]. Although, since 2024, neural-network-based power spectral density estimation methods have shown potential, such as identifying complex noise patterns through multimodal deep learning [24], the high computational costs and risks of overfitting associated with these methods limit their feasibility in practical applications [25,26]. In contrast, traditional algorithms demonstrate greater applicability in this study due to their lower computational complexity and stability.
In gravitational wave detection, the existing LPSD and LISA-LPSD algorithms encounter difficulties due to limited sampling time and data availability, especially for low-frequency signals. The long periodicity of low-frequency signals leads to fewer complete cycles in fixed sampling periods, worsening resolution problems [27]. Additionally, segmentation-based PSD estimation further reduces resolution at low frequencies. Although Thomson’s multi-taper and adaptive sine multi-taper algorithms theoretically offer higher precision [28,29], their application in this field remains unexplored. Noise assessment should not only focus on algorithms; optimizing the physical systems is also important. For instance, numerical optimization studies of catalytic diesel particulate filters have demonstrated that enhancing system design can effectively reduce noise interference, offering valuable insights for noise suppression in gravitational-wave-detection hardware [30].
This study proposes a taper number-optimized adaptive sine multi-taper algorithm to improve the resolution in low-frequency bands of gravitational-wave-detection systems. Improving resolution depends on balancing bias and variance, which can be accomplished through taper number optimization.
The original algorithm employs equal weighting across all frequency bands and utilizes high taper numbers at low frequencies. However, this approach can lead to increased variance and biased estimates, resulting in poor resolution in low-frequency regions. To overcome this, our proposed algorithm introduces a full-frequency taper number optimization strategy. It begins with a uniform initialization of taper numbers across all frequencies. For low-frequency bands, a gradient-based refinement is applied to adjust the taper numbers iteratively. This iterative process continues until the optimal PSD estimate is achieved.
Performance evaluation using mean squared error (MSE) demonstrates the superiority of the proposed algorithm. By comparing it with existing methods and validating its effectiveness through practical system performance experiments, this study establishes the algorithm as a robust tool for assessing gravitational wave detection systems under complex noise conditions.
The paper is organized as follows: Section 2 describes the taper number optimization process; Section 3 compares the proposed algorithm with existing methods in simulated scenarios; Section 4 validates and discuss the algorithm through real-world system performance experiments; and Section 5 concludes with key findings. This research contributes a novel PSD estimation method with significant theoretical and practical implications for gravitational wave detection.

2. Optimization Model for the Adaptive Sine Multi-Taper Algorithm

2.1. Adaptive Sine Multi-Taper Power Spectral Density Estimation

The adaptive sine multi-taper algorithm begins with the initialization of the tapering parameter, where all frequencies are initially set to a tapering degree of 20. The zero-mean real-valued stationary random process is represented as x ( t ) = [ x 1 t x N t ] T , over the integration interval f N , f N . The refined adaptive sine multi-taper spectral estimate is formulated as:
S ^ x f = i = 0 K f 1 α i S ^ i f = 1 K f t   i = 0 K f 1 α i | v f | 2
where S ^ x f denotes the power spectral density (PSD) estimate at frequency f , α i is the taper weighting factor for the i -th window, S ^ i f is the periodogram derived from the selected data window, and K f is the optimal taper count, calculated as follows:
α i = ( K 2 i 2 ) / [ K 4 K 1 ( K + 1 ) / 6 ]
The overall taper v f is defined as follows:
v f = t r = 0 L x r t h i r t e j 2 π f r t
where   h i t is the sine taper function, r is the sample sequence number ranging from 1 to L, L is the total number of observations, and t is the sampling interval. The sine window function is given by the following:
h i t = 2 T sin i π t T , 0 t T
To ensure energy normalization in the frequency domain, the overall taper function satisfies [31,32]:
f N f N v f d f = 1
The WOSA algorithm divides the data into shorter sequences by distributing N samples into K segments, with each segment containing about N/K samples. When spectral estimates S i and S k are minimally correlated, the variance decreases. For low correlations, the variance of the equal-weighted taper is approximated as follows [7,33]:
V a r S ^ x f = 1 K 2 i = 0 K 1 V a r S ^ i f 1 K S x 2 ( f )
The LPSD algorithm addresses the discontinuity issue in WOSA but does not account for the multi-taper problem [34]. In 2021, Karnik et al. enhanced the Thomson multi-taper method by proposing K = 2NW − O(log2(NW)) tapers, reducing spectral leakage. However, the Thomson algorithm remains constrained by its single time-bandwidth product and high computational cost due to numerical eigenvalue decomposition.
Riedel and Sidorenko introduced an adaptive multi-taper algorithm based on sine tapers, which eliminates the need for eigenvalue equations. The optimal taper count K o p t f is given by following:
K o p t f = ( 12 T 2 S ( f ) | S f | ) 2 / 5 = 2.701 ( T 2 S ( f ) | S f | ) 2 / 5
where S ( f ) is the true power spectral density estimate, and S f is the second-order derivative.
While this method reduces variance, it increases bias. To minimize mean squared error (MSE), an iterative procedure optimizes taper selection. However, challenges remain in achieving sufficient resolution for low-frequency PSD estimation in gravitational wave detection.
For noise analysis in the 0.1 mHz to 1 Hz band, a sampling rate of 20 Hz was selected to balance data acquisition efficiency and hardware performance. Despite substantial data collection, resolution in the 0.1 mHz to 1 mHz range remains inadequate. The LPSD algorithm’s complexity O(N·J) and the LISA-LPSD algorithm’s complexity O(Nlog2·(N/K) + J) + O(M) highlight the need for computationally efficient solutions.

2.2. Focus of Optimization for the Adaptive Sine Multi-Taper Algorithm

In response to the aforementioned issues, this paper proposes an optimal algorithm evaluation criterion based on the mean squared error (MSE) metric, aimed at enhancing the performance of the adaptive sine multi-window power spectral density estimation algorithm in the analysis of low-frequency and sub-low-frequency signals. The optimal algorithm evaluation criterion essentially addresses the relationship between bias and variance, which is intrinsically linked to the selection of the number of tapers [35].
Therefore, the adaptive sine multi-taper algorithm focuses on two key areas: (1) optimizing taper number selection using the MSE criterion to balance bias and variance, and (2) improving computational efficiency. Bias analysis reveals the following [36,37,38]:
B i a s S ^ x f ( K ( f ) / 2 T ) 2 6 S ( f ) = K ( f ) 2 24 T 2 S ( f )
The cost function J(α) is defined as follows:
J α = ε v a r S ^ x f + 1 ε b i a s 2
The relative impact of adjusting bias and variance in the mean squared error (MSE) is represented by ε , a weighting parameter used to balance the influence of bias and variance in the cost function. The mean squared error (MSE) is defined as:
M S E     1 ε B i a s S ^ x f E S ^ x f   2 + ε V a r S ^ x f E S ^ x f 2         1 ε | K f | 4 576 T 4   S ( f ) S f   2 / 5   + ε 1 K ( f )
Minimizing MSE results in the ratio ε 1 ε = β which yields the optimal taper count:
K f = 2.70192 β ( T 2 S ( f ) | S f | ) 2 / 5
where β = 0.7 is determined via the bisection method.
For the spectral analysis at the low frequency of 1 mHz, this paper reduces bias and enhances resolution to some extent by adjusting and decreasing the taper degree. A segmented improvement approach is primarily adopted: on one hand, a fixed small taper degree is applied to the low-frequency segment; on the other hand, to mitigate the potential instability in power spectral density (PSD) estimation caused by abrupt changes in the taper degree, a gradient transition is introduced.
The optimization of the power spectral density (PSD) estimation is accomplished through a systematic sequence of steps, as detailed below:
1.
Initial Setup:
  • The adaptive sine multi-taper algorithm starts by initializing the tapering parameter, setting all frequencies to a degree of 20.
2.
Spectral Estimate Processing:
  • For frequencies below 1 mHz (f < 1 mHz): The value of K(f) is set to 1.
  • For frequencies between 1 mHz and 0.01 Hz (1 mHz < f < 0.01 Hz): A robust filtering technique is applied to smooth K(f).
  • For frequencies above 0.01 Hz (f > 0.01 Hz): K(f) is determined using parabolic weighting as specified in Equation (11).
  • For frequencies ranging from 0.01 Hz to 1 Hz (0.01 Hz < f < 1 Hz): A mild filtering technique is applied to further enhance the smoothness of K(f).
3.
Outlier Removal and Iteration:
  • Outliers are identified and removed through linear interpolation. The K(f) values are smoothed over three iterations. The PSD estimation process is iterated 15 times to yield optimal estimates for both the PSD and the amplitude spectral density (ASD).
Execute a total of 15 iterations for the PSD estimation process to derive the optimal estimates for both the PSD and the Amplitude Spectral Density (ASD). For frequencies below 1 mHz, the taper degree is set to 1 to reduce bias and enhance resolution, preventing low-frequency fluctuations from being misidentified as noise. In the 1 mHz to 10 mHz range, a smaller taper degree smoothing parameter is employed for smoothing, while in the 10 mHz to 100 mHz range, a larger smoothing parameter is used to reduce variance and improve estimation stability. On the other hand, for the sub-low-frequency range, optimization is achieved by leveraging parameter β. Considering the stationarity and steepness of the actual process, this paper adopts a bisection method to determine the optimal parameter, with the best parameter for the taper degree in the improved adaptive sinusoidal multi-taper algorithm at the sub-low frequency set to 0.7.
In terms of algorithm runtime, the computational complexity of the adaptive sinusoidal multi-taper algorithm is O(5N·log2(N)), which is significantly lower than other algorithms. Thus, through algorithmic improvements and adjustments, the adaptive sine multi-taper algorithm demonstrates superior performance in the systematic evaluation within the field of gravitational wave detection, which is one of the key focuses of this study.

3. Algorithm Simulation Comparison

3.1. Focus of Algorithm Research

This study first analyzes the performance of various multi-taper power spectral density (PSD) estimation algorithms, including LPSD and LISA-LPSD, focusing on their limitations in low-frequency resolution in the context of gravitational wave detection. The analysis is based on simulations of the amplitude spectral density (ASD) estimation. The preliminary research aims to observe and evaluate the practical performance of these algorithms, providing foundational data and initial conclusions to support subsequent in-depth studies and optimizations.
As shown in Figure 1, the simulation involves incident laser light undergoing sinusoidal jitter in the yaw direction at frequencies of 100 mHz, 10 mHz, and 1 mHz, each with an amplitude of 50 μrad, to observe the performance of the ASD estimation algorithms. The peaks at 1 mHz, 10 mHz, and 100 mHz indicate that the improved adaptive sine multi-taper algorithm provides better resolution than the LPSD, original adaptive sine multi-taper, LISA-LPSD, and Thomson algorithms. This high-resolution advantage reduces interference caused by signal energy spreading to other frequencies, thereby minimizing the spectral leakage effect, which is crucial for accurately capturing weak signals. The improved adaptive sine multi-taper algorithm shows significantly better resolution than its original version, while the Thomson algorithm has low-frequency resolution issues. Therefore, this study focuses on systematically evaluating the performance of the LPSD, LISA-LPSD, adaptive sine multi-taper algorithm, and its original version in the field of gravitational wave detection.

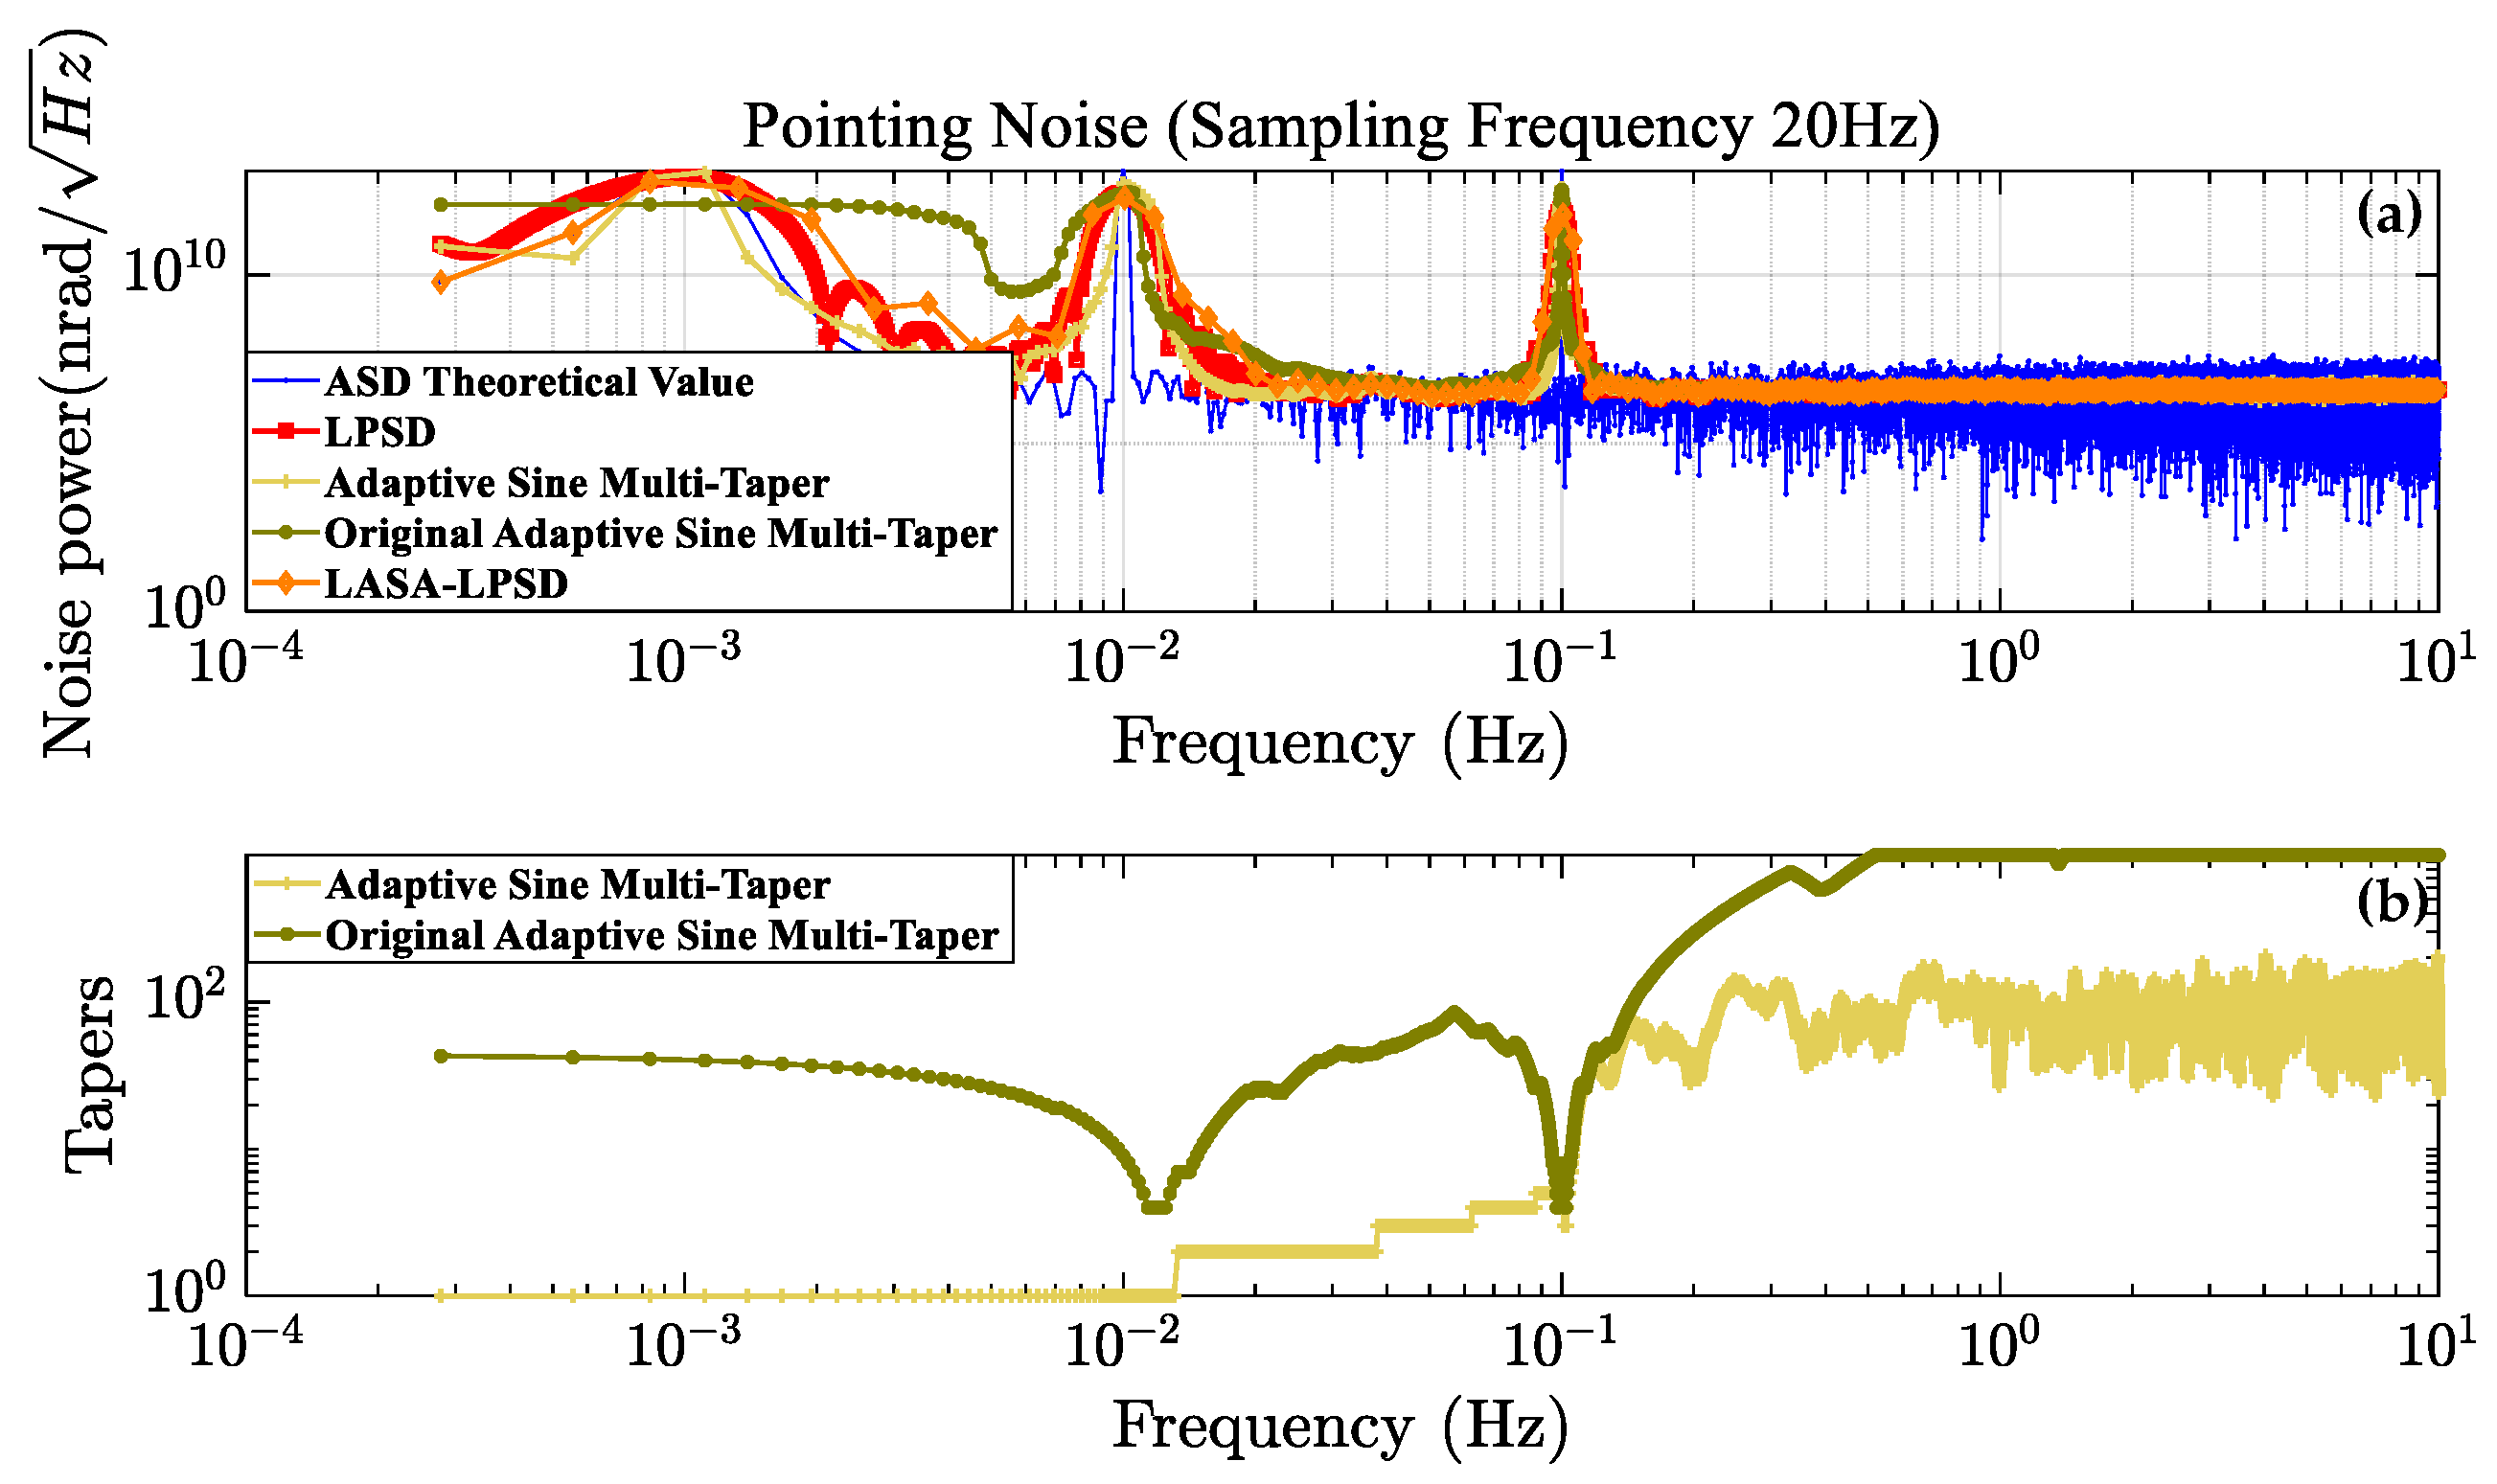
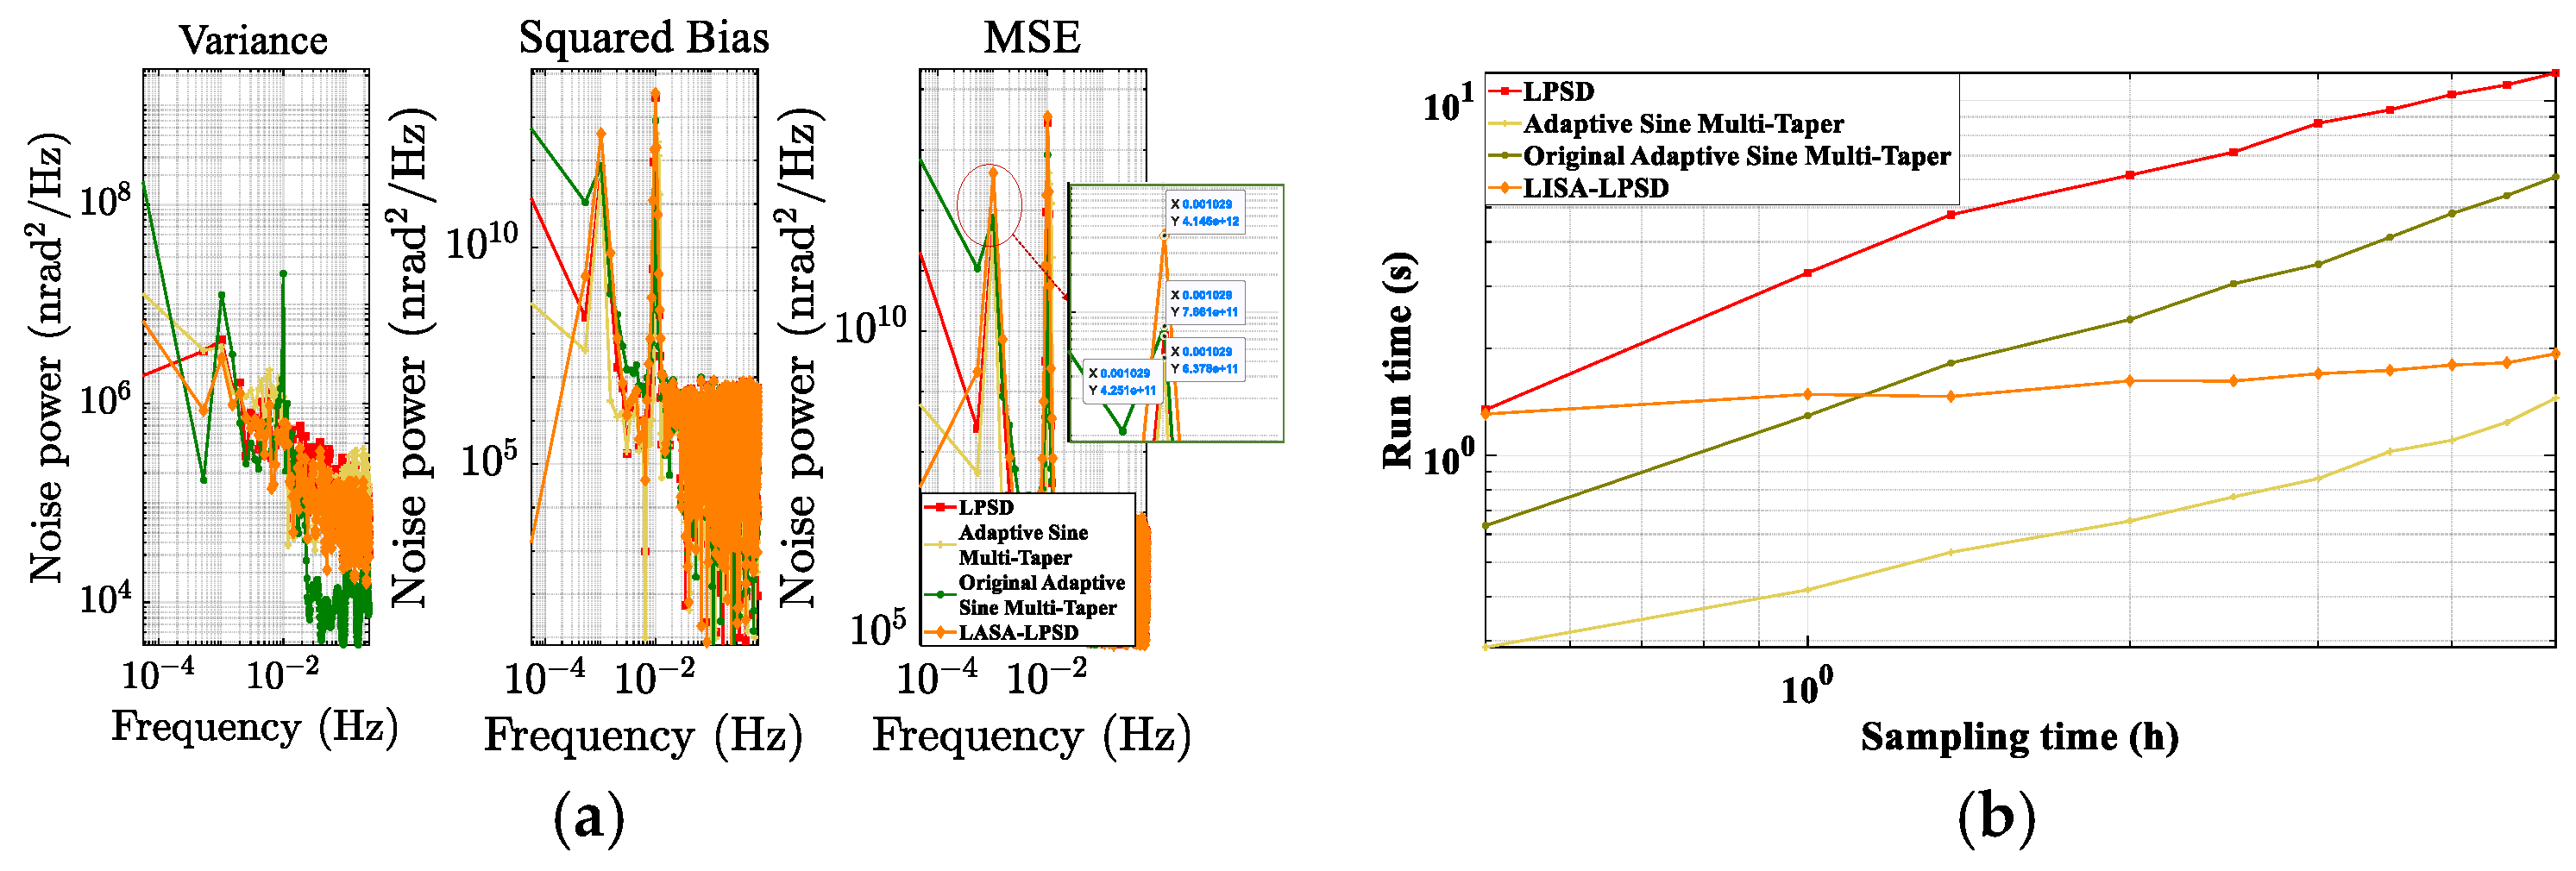
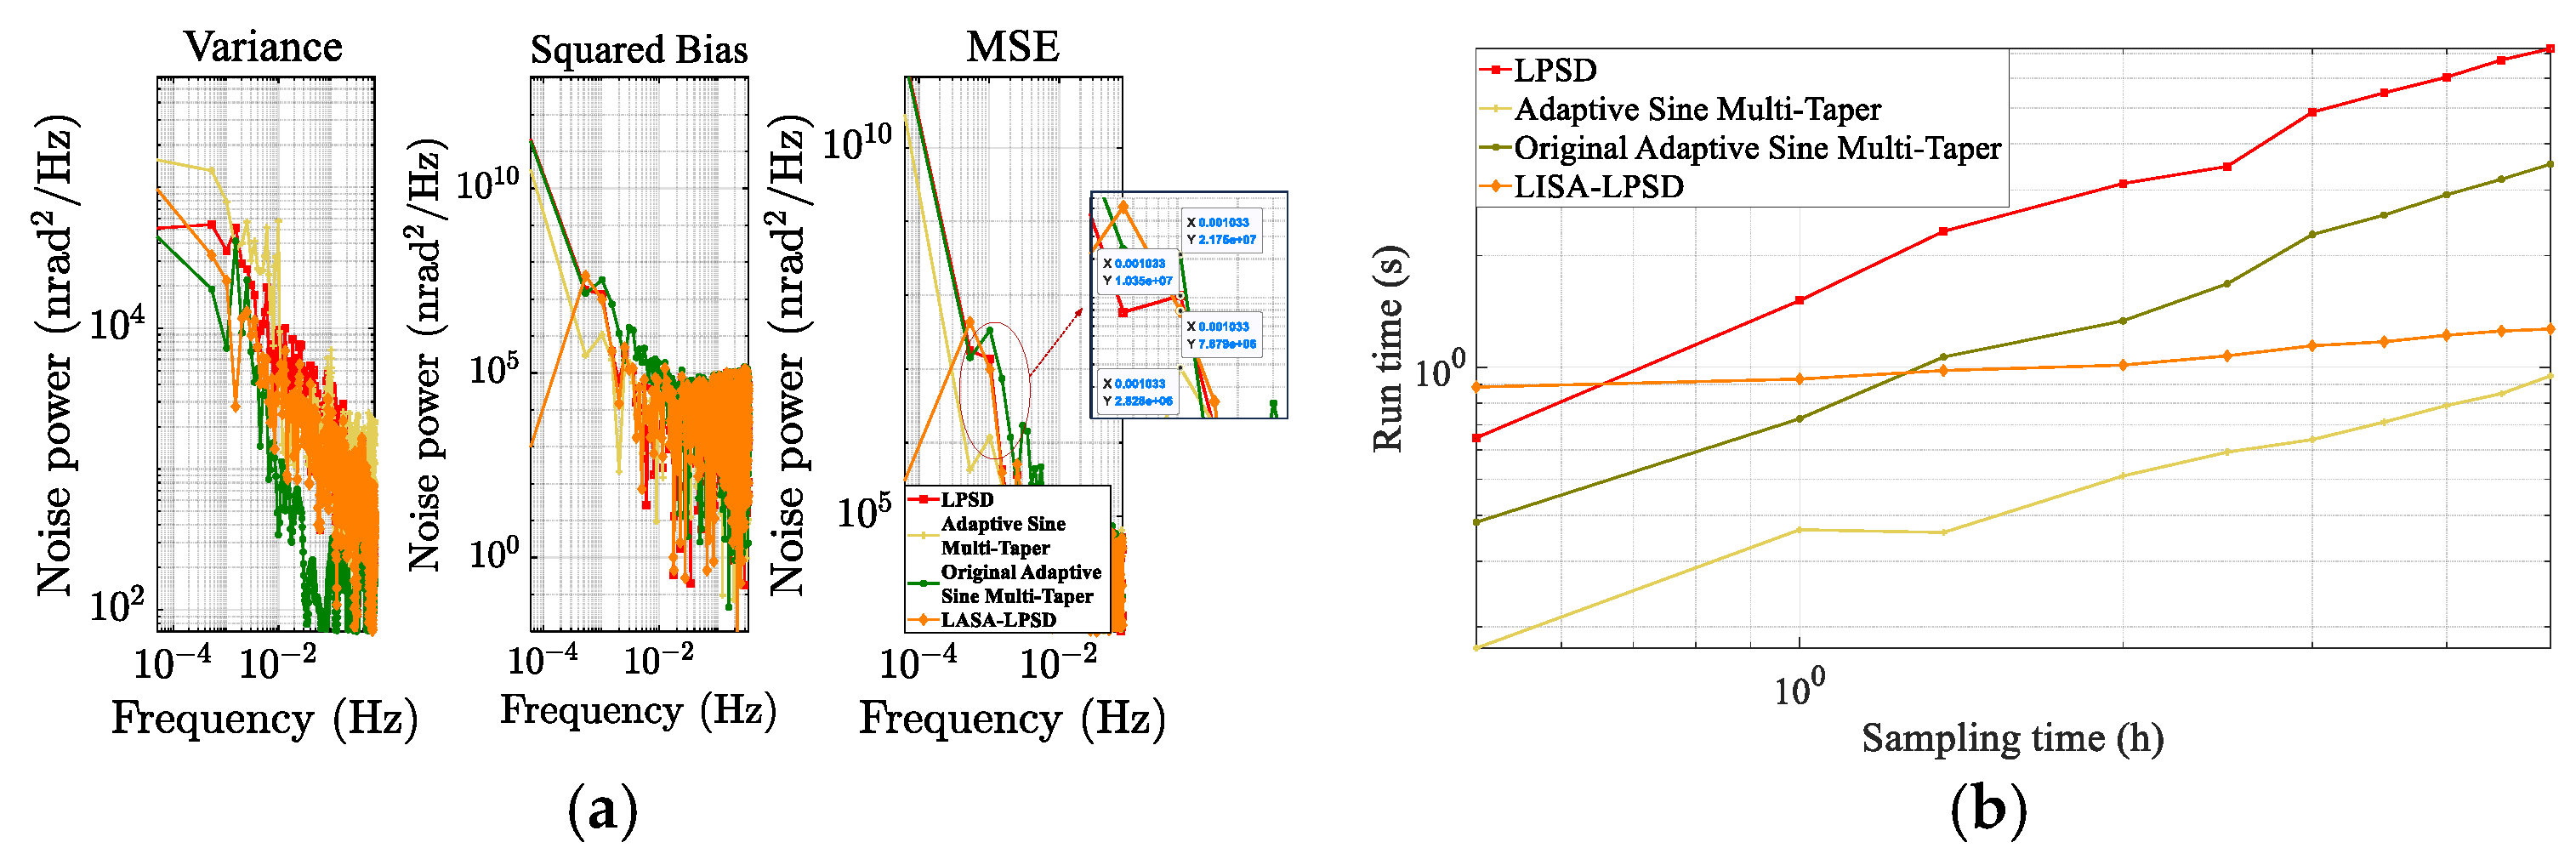
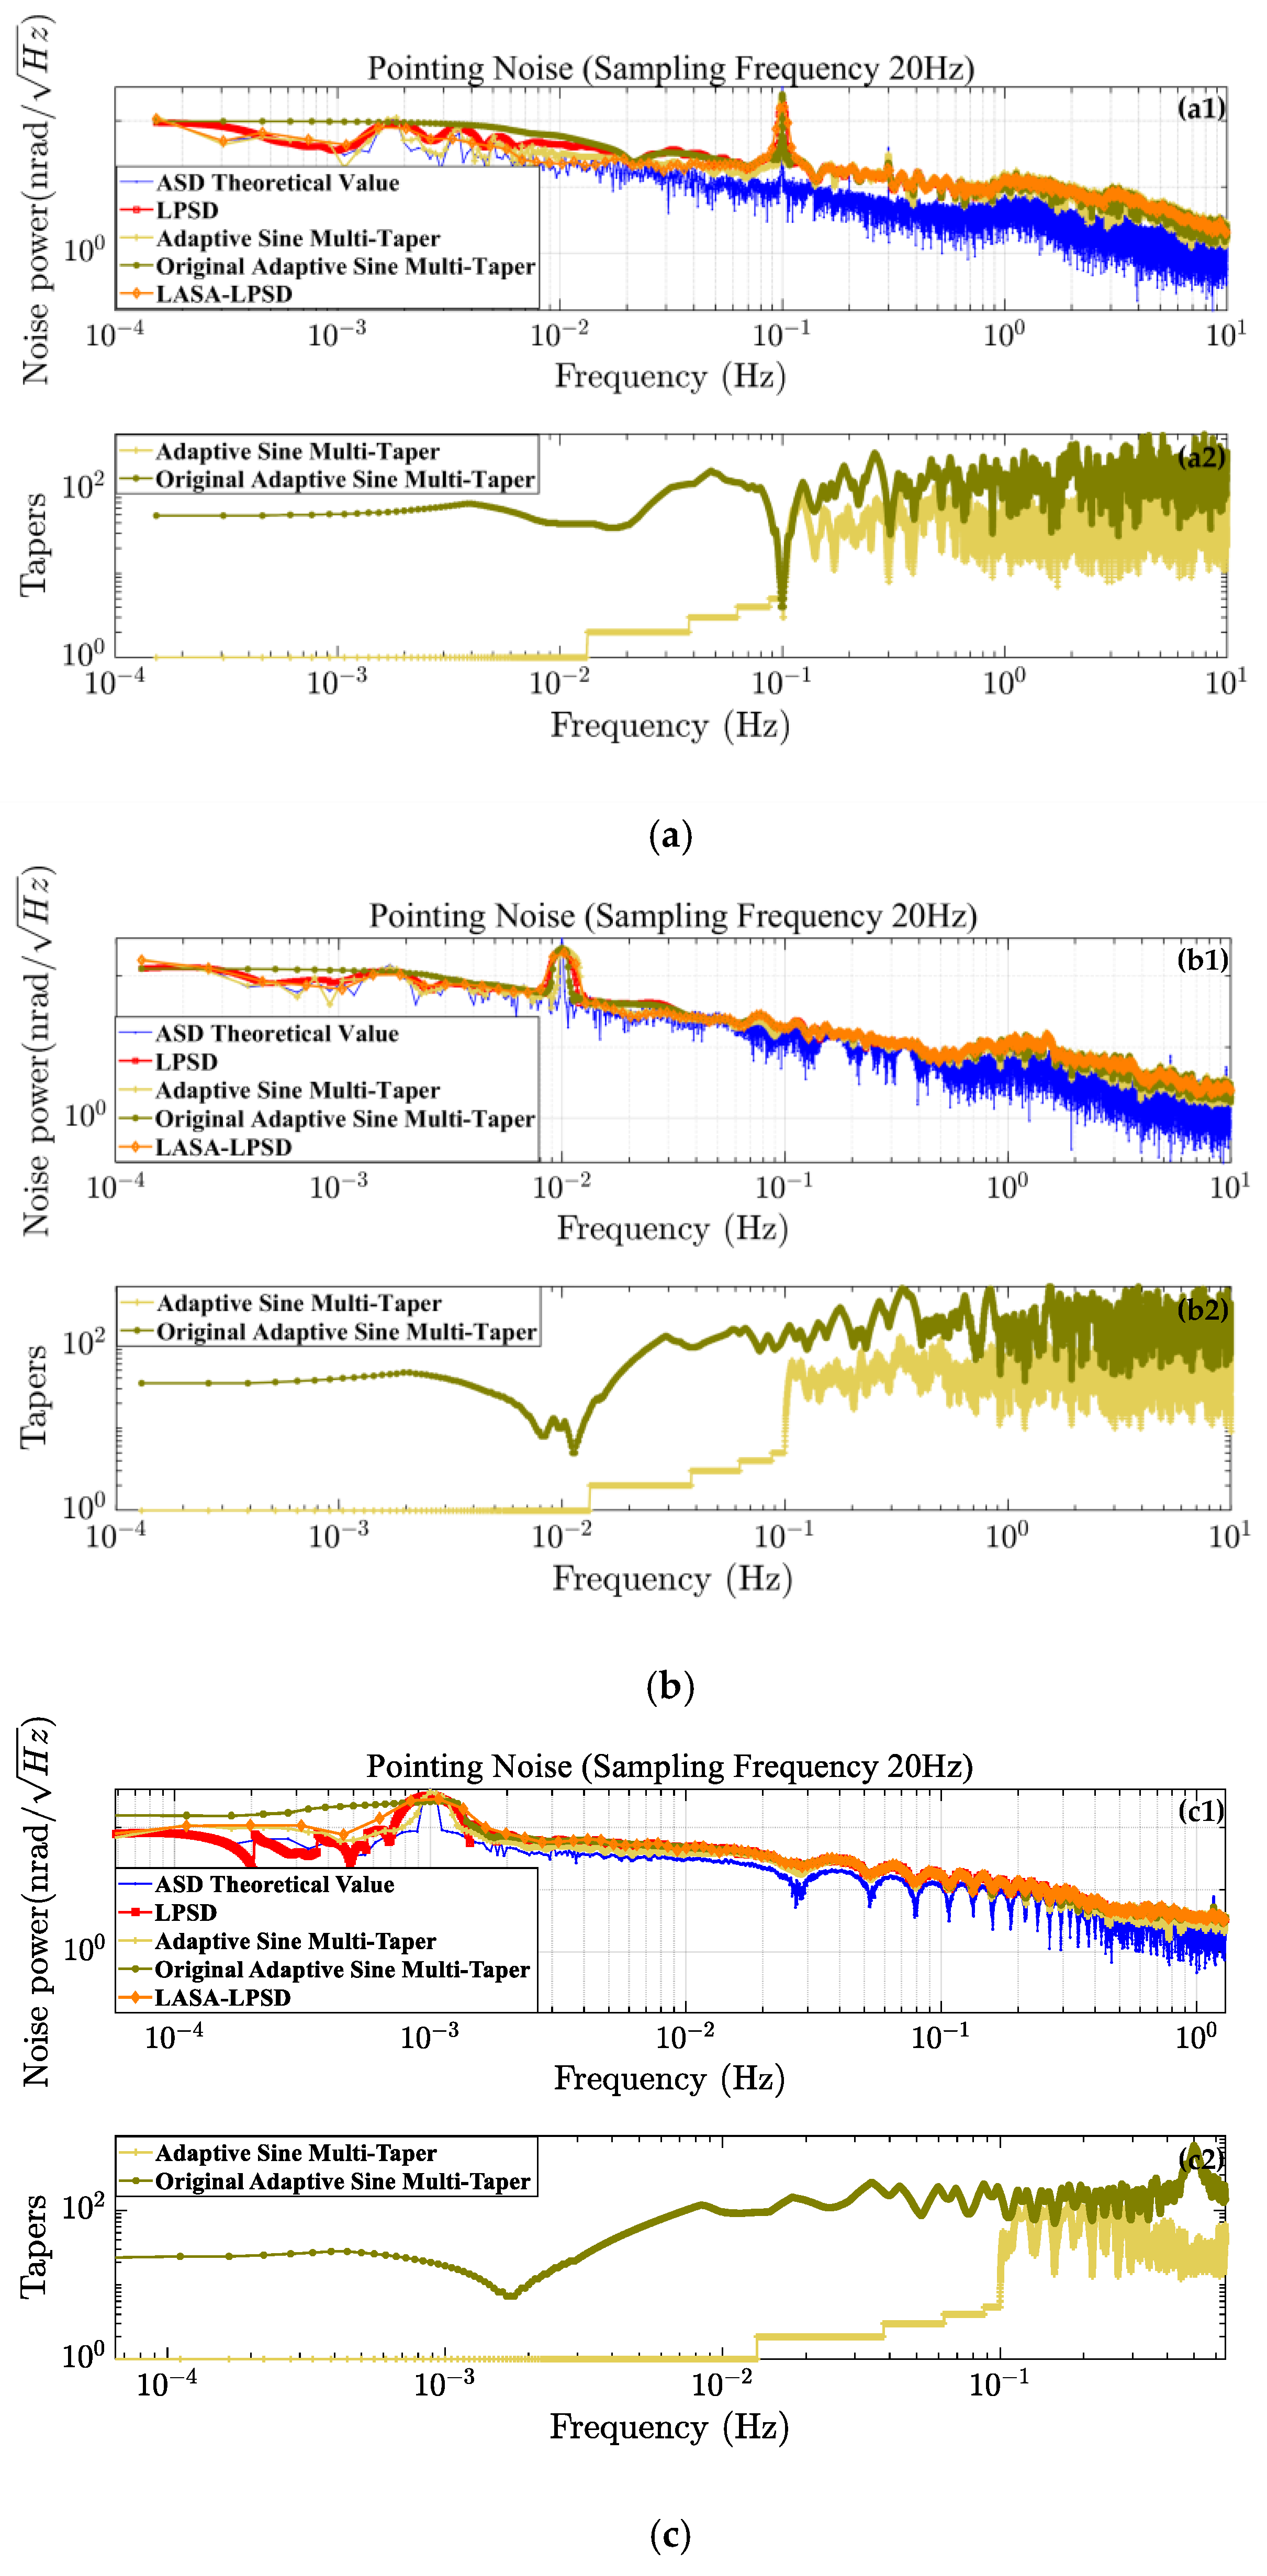
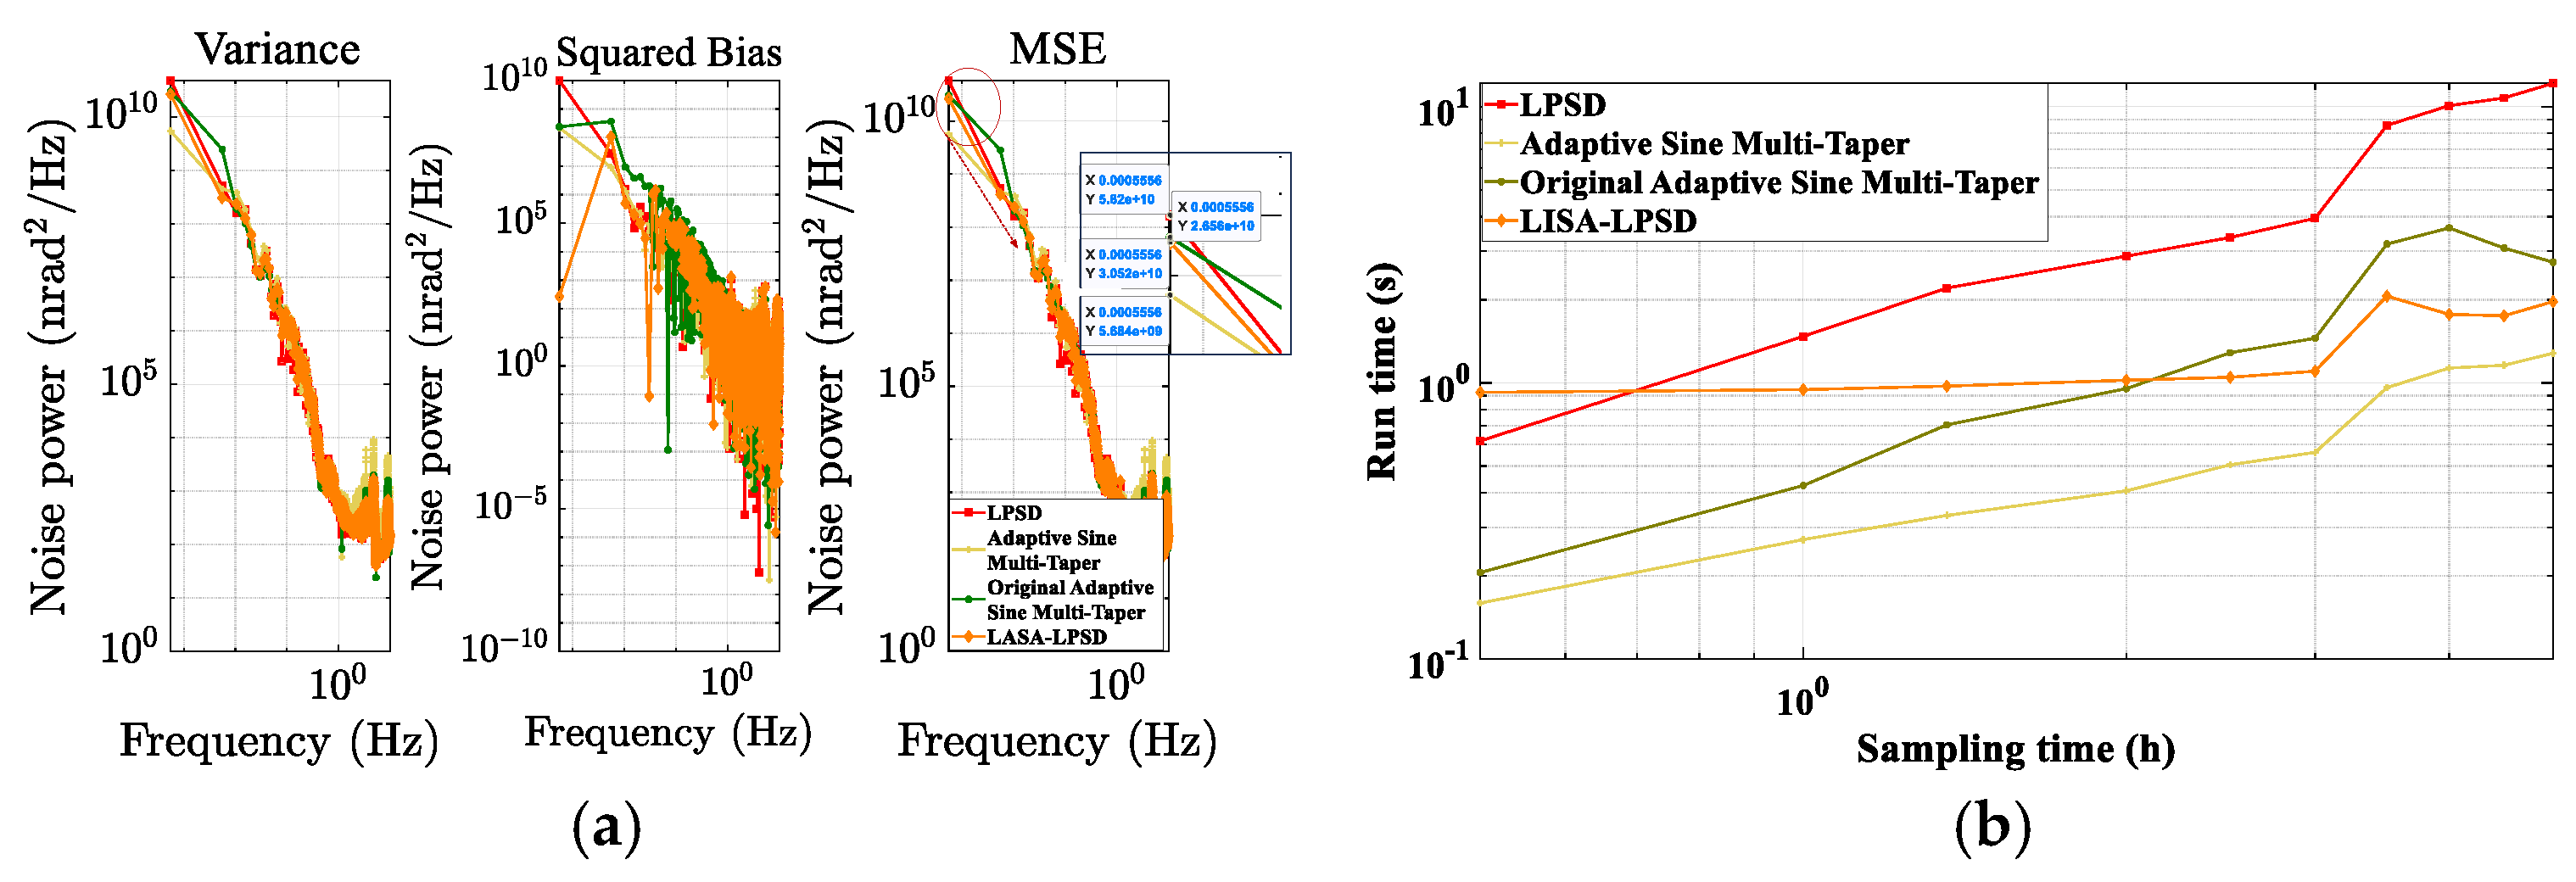
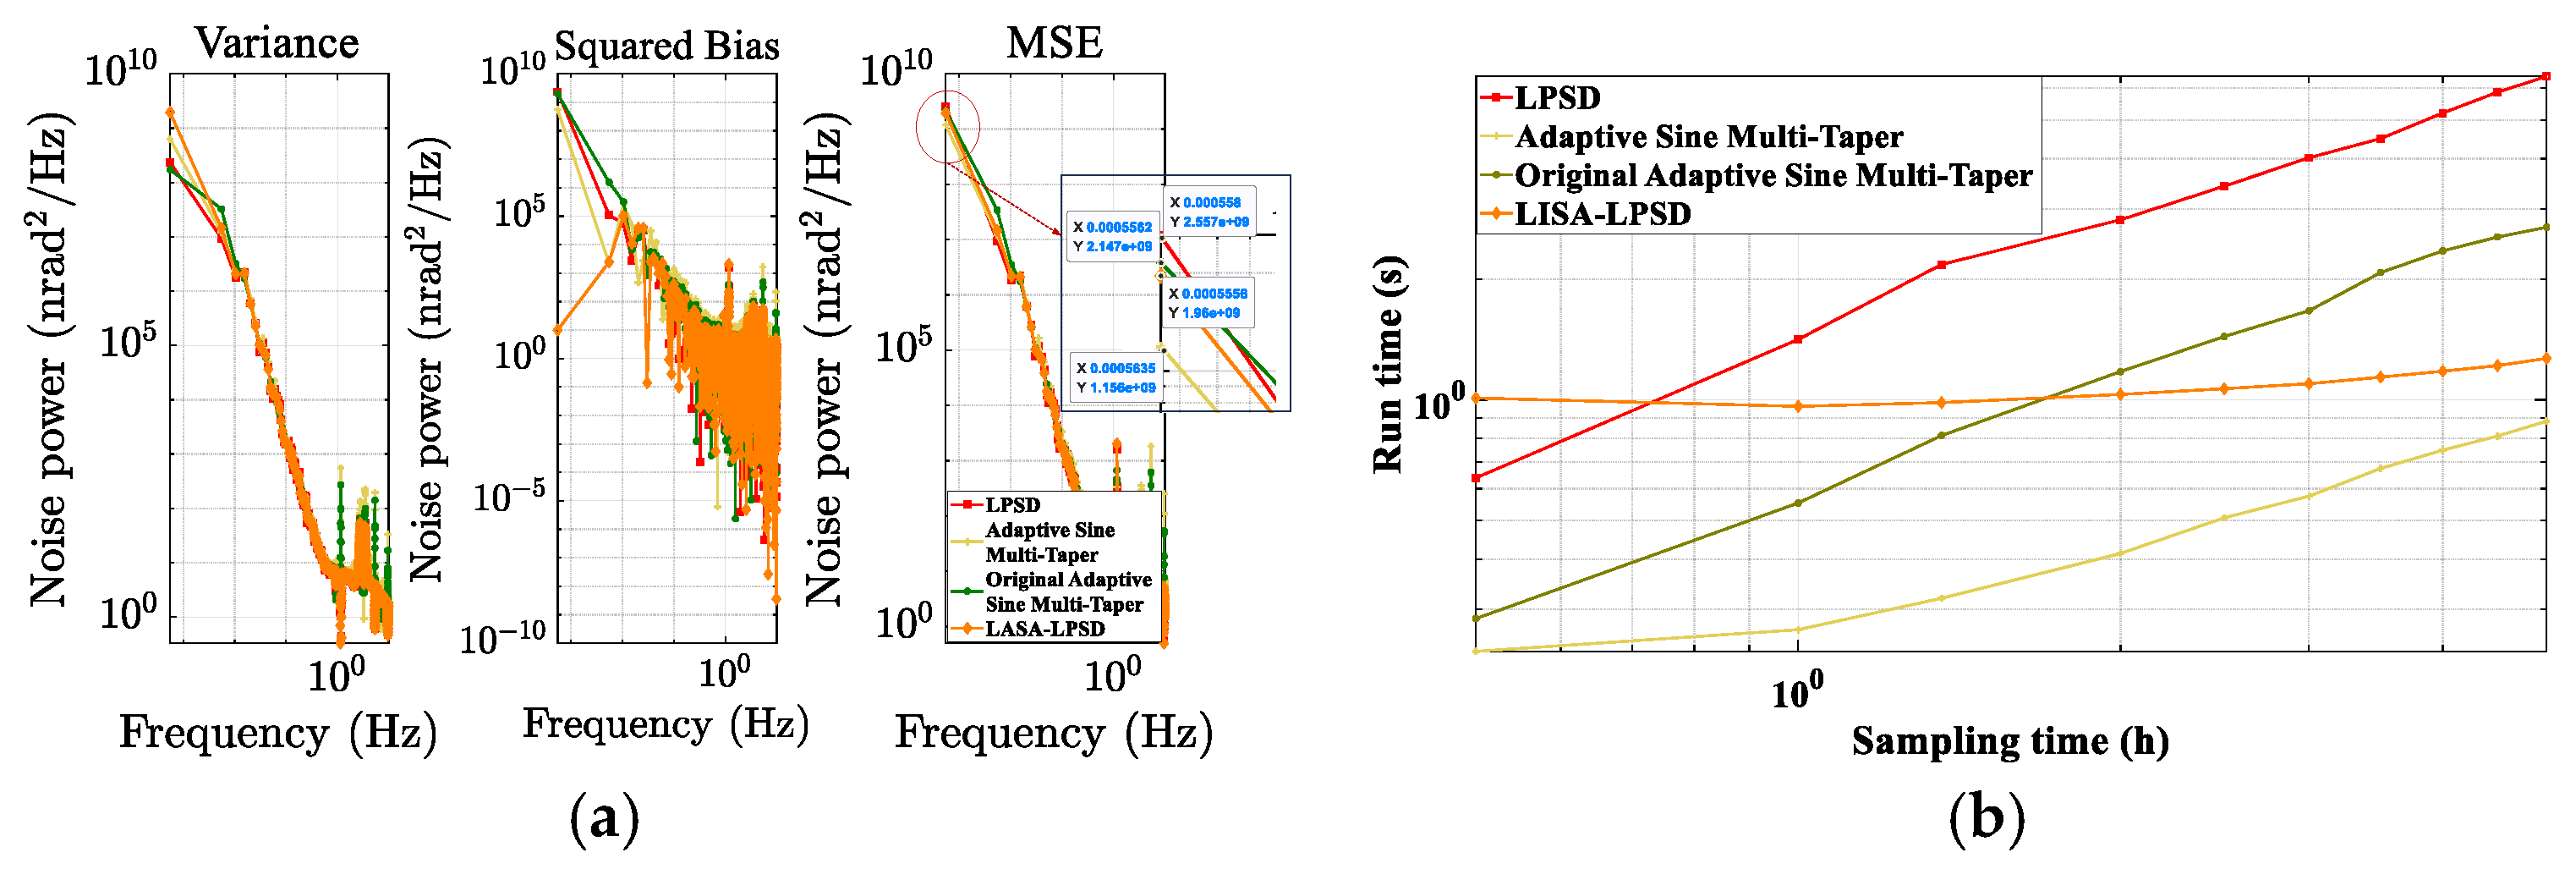
3.2. Simulation Comparison of ASD Estimation Algorithms

Simulations of mid-to-low frequency noise vibrations were conducted to evaluate the algorithms’ performance in spectral resolution and computational complexity. On one hand, sinusoidal stimuli were simulated, representing the incident laser undergoing simultaneous yaw jitter at frequencies of 100 mHz (amplitude 50 μrad), 10 mHz (amplitude 50 μrad), and 1 mHz (amplitude 50 μrad), with Gaussian noise added to emulate real-world environmental interference. On the other hand, simulations were performed to estimate the spectral density of quantification metrics for system noise.
Ten experimental sets were designed to evaluate the algorithms and obtain the true spectral density and covariance function. The mean ASD estimates derived from the standard algorithms were used as the benchmark reference and compared with the PSD estimation outcomes produced by various algorithms. By considering the mean squared error (MSE) and computational speed of each algorithm, this study provides an objective evaluation of their performance.
As illustrated in Figure 2a, the simulation results reveal that the improved adaptive sine multi-taper algorithm demonstrates exceptional performance at several critical frequency points. From Figure 2b, it can be observed that the taper numbers across the entire frequency domain are significantly reduced after the algorithm’s enhancement, with the reduction being particularly pronounced in the low-frequency range. Notably, near 1 mHz and 10 mHz, the resolution of the improved adaptive sine multi-taper algorithm is markedly superior to that of the original version. Furthermore, at the peak frequency of 1 mHz, the improved algorithm significantly mitigates spectral leakage compared to the LPSD and LISA-LPSD algorithms. These findings provide preliminary qualitative validation of the potential and superiority of the improved adaptive sine multi-taper algorithm in applications within this field.
To thoroughly assess the performance of the algorithms, further quantification was performed through metrics such as bias, variance, and overall MSE, while also comparing the computational speed of several algorithms. Figure 3a shows that the mean PSD from ten sine stimuli, with added Gaussian noise, represents the true value. Near 1 mHz, the improved adaptive sine multi-taper algorithm demonstrates a reduction in MSE compared to the original algorithm, and it exhibits a smaller MSE relative to the LPSD algorithm. At the 1 mHz point, the adaptive sine multi-taper algorithm’s MSE is approximately 55% of that of the original algorithm, reflecting a reduction of 45%. Furthermore, when compared to the LPSD algorithm, its MSE shows a reduction of approximately 34%. The LISA-LPSD algorithm’s MSE is approximately 6.5 times that of the LPSD algorithm, while the improved adaptive sine multi-taper algorithm achieves an MSE approximately 10% of that of the LISA-LPSD algorithm, reflecting a substantial reduction of 90%, as shown in Table 1 in ‘Sinusoidal Simulation: Adaptive Sine Multi-Taper vs. Others‘.
Additionally, as shown in Figure 3b, when the data sampling time is less than one hour, the original adaptive sine multi-taper algorithm runs faster than the LISA-LPSD algorithm; however, as the data sampling time increases, the advantages of the LISA-LPSD algorithm become evident. The execution time of the modified adaptive algorithm is markedly shorter than that of the LPSD algorithm, and it also surpasses the original adaptive algorithm and the LISA-LPSD algorithm in terms of efficiency. When assessing computational speed over a data processing duration of five hours, the execution time of the refined adaptive sine multi-taper algorithm is significantly reduced to just 24% of that demanded by the original algorithm, reflecting a reduction of 76%. Additionally, it requires only 12% of the time taken by the LPSD algorithm, indicating a reduction of 88%, and 75% of the time used by the LISA-LPSD algorithm, corresponding to a reduction of 25%, as shown in Table 1 in ‘Sinusoidal Simulation: Adaptive Sine Multi-Taper vs. Others’.
The refined adaptive sine multi-taper algorithm shows clear advantages in resolution and computational efficiency in ASD estimation. To further corroborate the system’s overarching performance acceptance criteria, supplementary simulations of noise density ASD estimation processes were undertaken.
As illustrated in Figure 4a, the noise spectral density function is formulated as follows: n f = 1 + 3 m H z f 4 , with f ranging from 0.1 mHz to 1 Hz and featuring a corner frequency at 3 mHz. Initially, random phases were simulated, followed by the creation of both positive and negative frequency spectra to form a complete spectrum. Subsequently, an inverse Fourier transform was applied, yielding the time series illustrated in Figure 4b. This time series serves as the foundational input for the ensuing spectral density estimation analysis.
As illustrated in Figure 5a, during the noise spectral density estimation process, the input signal exhibits a notably steep spectral slope characteristic in the low-frequency region, necessitating higher resolution demands. To address this issue, the improved algorithm enhances low-frequency resolution by setting a fixed, lower taper number for frequencies below 1 mHz, as shown in Figure 5b. A further quantitative assessment through comparative analysis of multiple algorithms confirms the improved algorithm’s performance in low-frequency resolution.
Similarly, as illustrated in Figure 6a, it is evident that in the vicinity of 1 mHz, the improved adaptive sine multi-taper algorithm exhibits an increase in variance relative to the original algorithm; however, both bias and MSE are notably reduced. Furthermore, when compared to the LPSD algorithm, the overall MSE remains comparatively lower. At the 1 mHz threshold, the MSE of the adaptive sine multi-taper algorithm is roughly 13% of that observed in the original algorithm, reflecting a reduction of 87%. Additionally, in comparison to the LPSD algorithm, its MSE is approximately 0.36 times lower, signifying a reduction of 64%. Conversely, the MSE of the LPSD algorithm is the same as that of the LISA-LPSD algorithm. Moreover, the adaptive sine multi-taper algorithm achieves an MSE approximately 0.36 times that of the LISA-LPSD algorithm, reflecting an impressive reduction of 64%, as shown in Table 1 under ‘Noise Metric Simulation: Adaptive Sine Multi-Taper vs. Others’.
Further analysis, as depicted in Figure 6b, supports conclusions akin to those drawn from Section 1, Section 2, Section 3, Section 4 and Section 5. By selecting the longest data processing duration of 5 h to assess computational speed, the enhanced adaptive sine function algorithm diminishes computation time to a mere 32% of what is necessitated by the original algorithm, reflecting a reduction of 68%. Additionally, it requires only 14% of the LPSD algorithm’s processing time, indicating a reduction of 86%, and 69% of the LISA-LPSD algorithm’s computation duration, corresponding to a reduction of 31%, as shown in Table 1 under ‘Noise Metric Simulation: Adaptive Sine Multi-Taper vs. Others’.
In both simulation scenarios, the adaptive sine multi-taper algorithm shows a reduced MSE compared to the original adaptive sine multi-taper, LPSD, and LISA-LPSD algorithms. It also features lower complexity and faster computation. Notably, in comparison to the LISA-LPSD algorithm, the MSE is reduced by approximately 64% to 90%, with run time decreasing to about 70% of the latter’s duration, as shown in Table 1. Overall, the enhanced adaptive sine multi-taper algorithm exhibits commendable performance for applications in gravitational wave detection system assessments. Nevertheless, considering the intrinsic complexity of the noise, further experimental validation is merited.

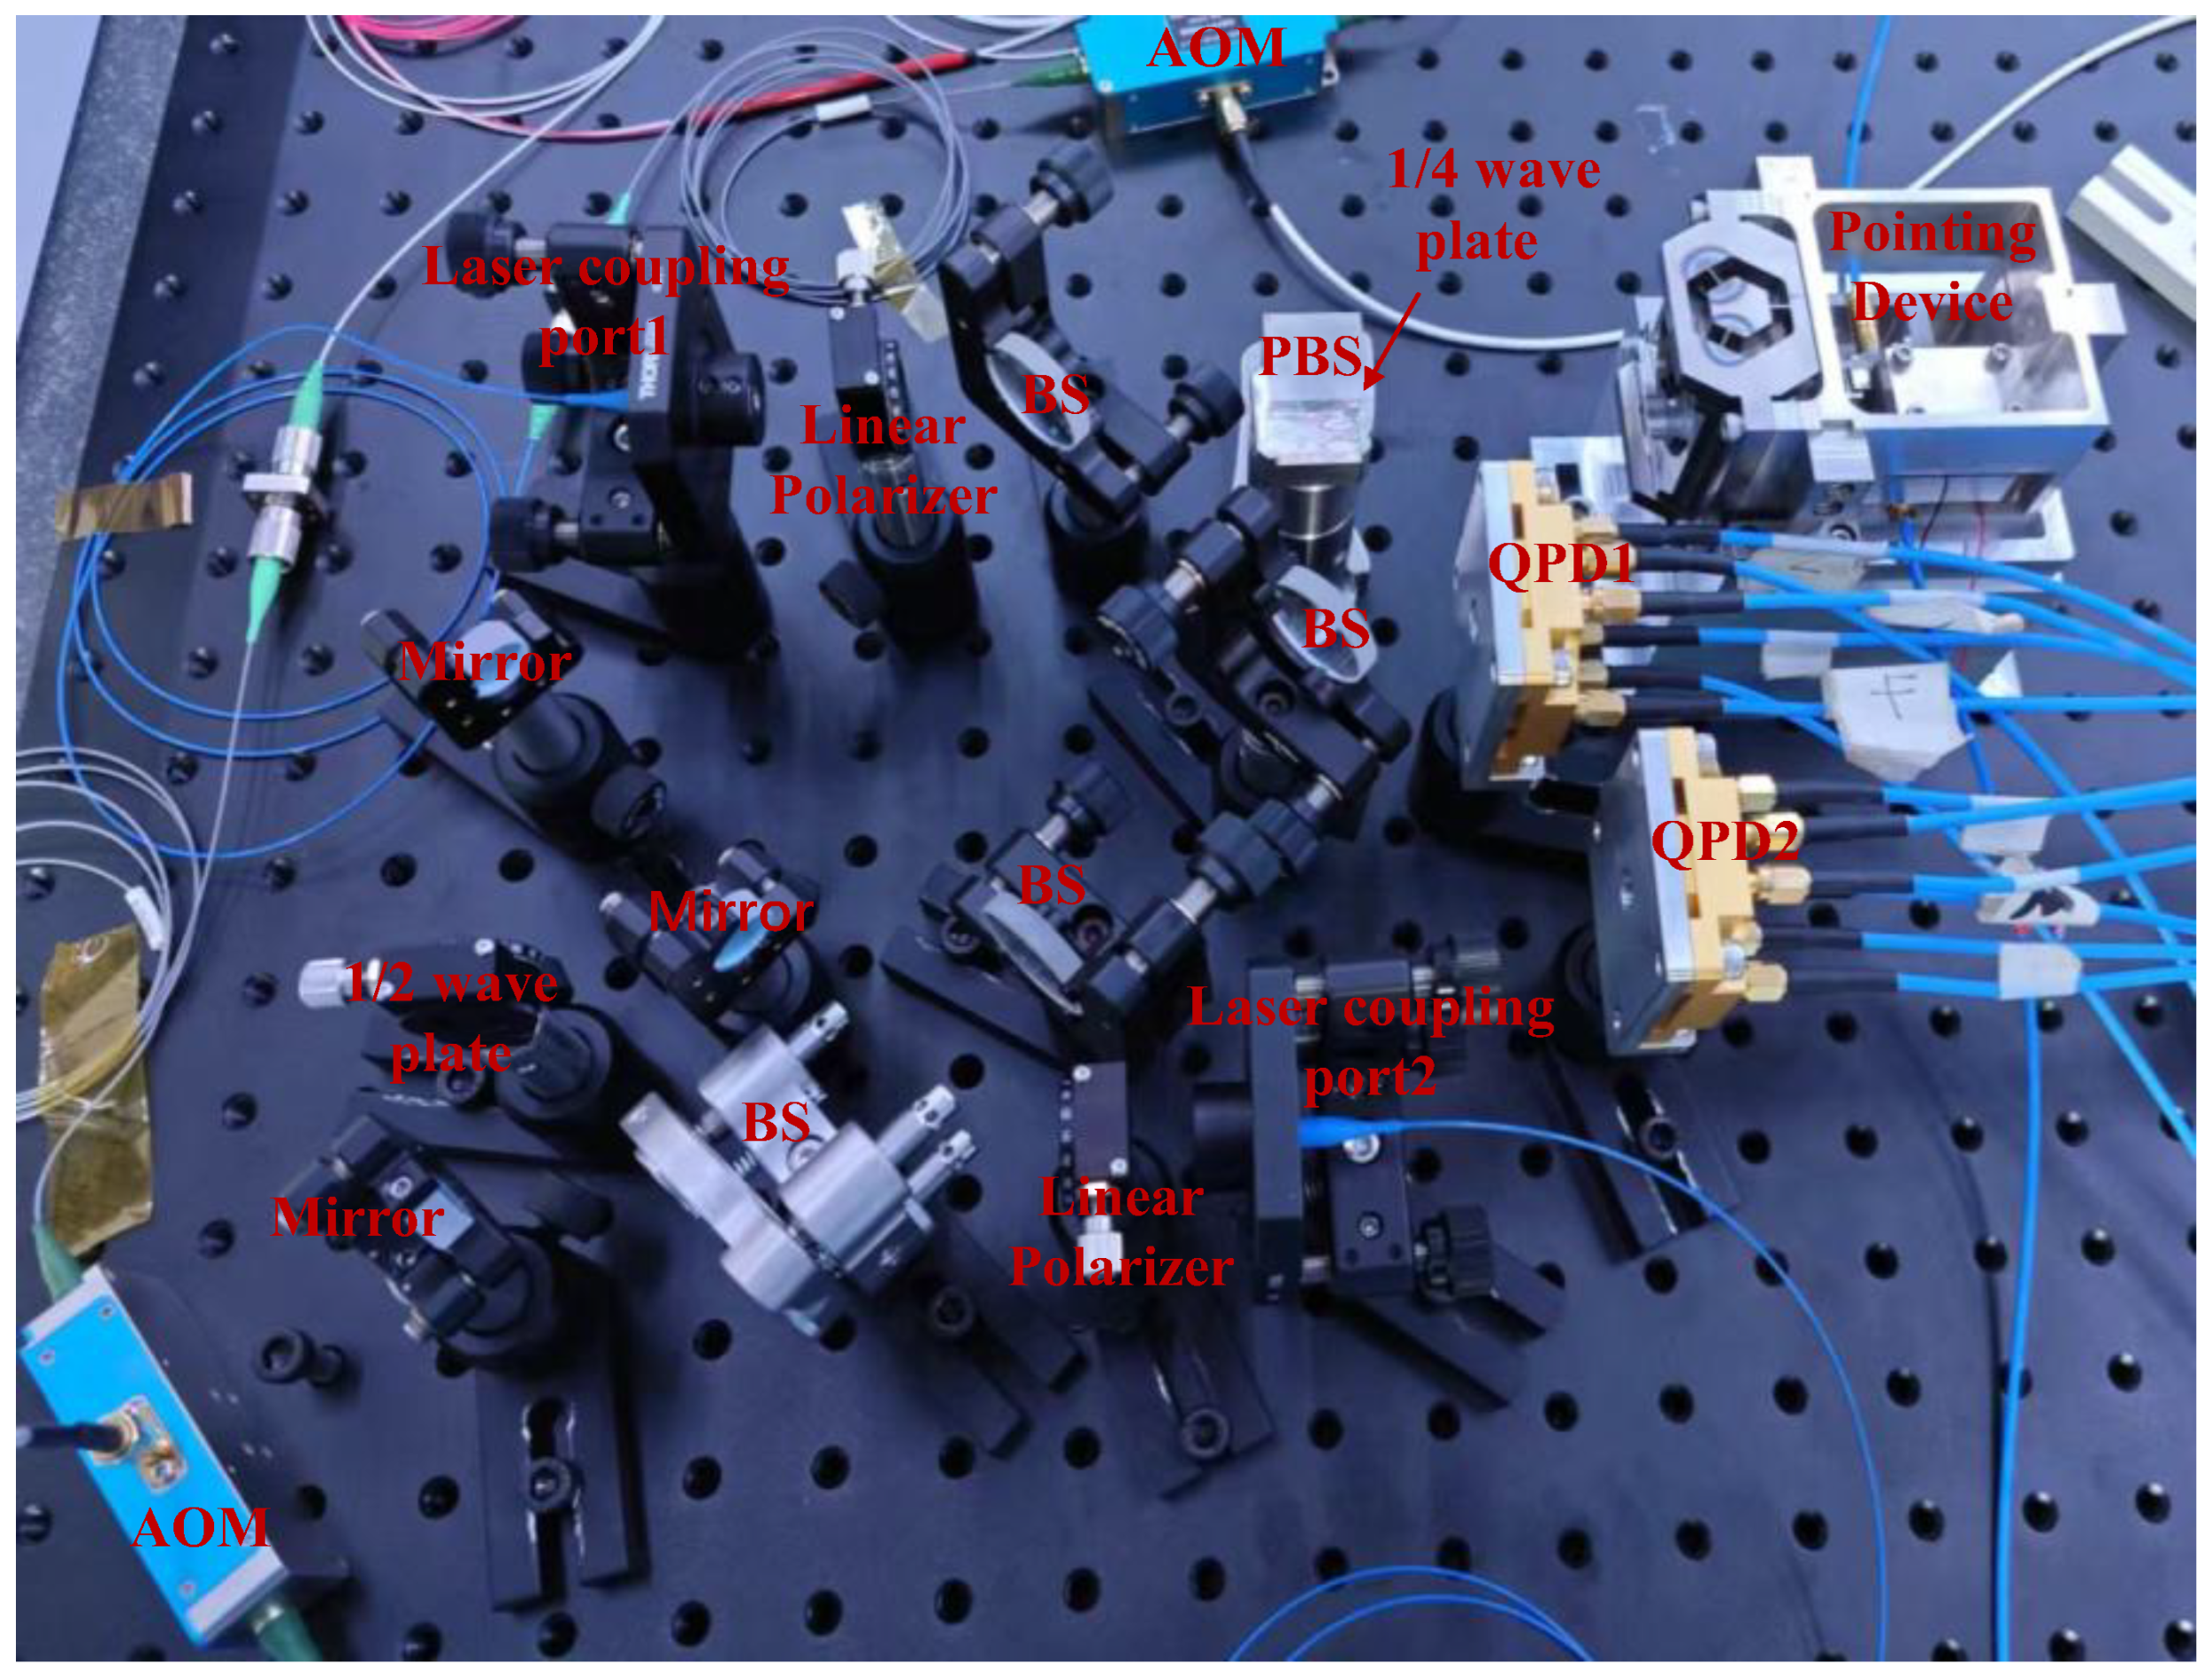
4. Validation and Discussion

As shown in Figure 7, this paper presents a high-precision angle measurement system for pointing mechanisms, utilizing the Point Ahead Angle Mechanism (PAAM) in conjunction with Differential Wavefront Sensing (DWS) technology [39]. The system includes key components such as the ultra-stable laser source SLS-INT-1064-200-1 (manufactured by Menlo Systems GmbH, Martinsried, Germany), the GD4542-20M QPD (produced by First Sensor AG, Berlin, Germany, now part of TE Connectivity), and a pointing device developed by our team. All tests were performed at an absolute temperature of around 30 degrees Celsius with a temperature control precision of 0.001 degrees Celsius, under a vacuum of 7.2 Pa.
The system analyzes pointing noise within the frequency range of 1 mHz to 1 Hz, validating the effectiveness of the algorithm. To simulate laser jitter-induced pointing, the experiment utilized PAAM to induce sinusoidal jitter in the incident laser at frequencies of 1 mHz, 10 mHz, and 100 mHz, each with an amplitude of 50 μrad in the yaw direction. After a sufficient warm-up period, the experiment was conducted under these conditions, with the PAAM deflected to specific angles for durations ranging from 1 to 5 h.
As shown in Figure 7, the DWS angular measurement system utilizes single-frequency light from an ultra-stable laser source, modulated into dual-frequency light by two AOM. The measurement beam, combined with the reference beam by the pointing mechanism, is directed onto a QPD1. The signal is then transmitted to a phase meter via a coherent radio frequency transmission line. The acquired data are processed through DWS phase conversion to yield yaw angle information, which is analyzed for amplitude spectral density (ASD) estimation using the adaptive sine multi-taper algorithm, its original version, the LPSD algorithm, and the LISA-LPSD algorithm.
As illustrated in Figure 8(a1,b1,c1), the angular variations measured under PAAM vibrations at 100 mHz, 10 mHz, and 1 mHz are presented, reflecting the system’s recorded noise. Figure 8(a2,b2,c2) indicate that the improved adaptive sine multi-taper algorithm shows fewer taper effects at these frequencies compared to the original algorithm. It also features fewer sidelobes and higher spectral resolution than both the original and other algorithms. Furthermore, the reduction in peak values appears less pronounced, suggesting that the proposed enhanced algorithm significantly mitigates pointing noise. These results provide robust support for subsequent research.
To evaluate the spectral density analysis algorithm’s effectiveness at 1 mHz, the 5 h dataset was divided into ten groups. The mean PSD derived from the PAAM’s motion serves as the true value, as shown in Figure 9a,b. Near 1 mHz, the improved adaptive sine multi-taper algorithm demonstrates reduced variance and bias compared to the original algorithm, resulting in a lower MSE. Additionally, its MSE is significantly smaller than that of the LPSD algorithm. At 1 mHz, the MSE of the adaptive sine multi-taper algorithm is approximately 19% of that of the original algorithm, reflecting a reduction of 81%, and 9.8% of that of the LPSD algorithm, representing a substantial reduction of 90%. The LISA-LPSD algorithm’s MSE is about 46% of that of the LPSD algorithm, while the adaptive sine multi-taper algorithm’s MSE is roughly 21% of that of the LISA-LPSD algorithm, indicating a 79% reduction, as shown in Table 2 in ‘Sinusoidal Excitation Experiment: Adaptive Sine Multi-Taper vs. Others’.
As shown in Figure 9b, when the data sampling duration is less than one hour, the original adaptive sine algorithm executes faster than its improved version. However, as the sampling duration increases, the LISA-LPSD algorithm’s advantages become more evident. For the longest processing time of 5 h, the improved adaptive sine algorithm’s execution time is reduced to approximately 47% of that of the original algorithm, reflecting a reduction of 53%, 10% of that of the LPSD algorithm, indicating a reduction of 90%, and 65% of that of the LISA-LPSD algorithm, corresponding to a reduction of 35%, as shown in Table 2 in ‘Sinusoidal Excitation Experiment: Adaptive Sine Multi-Taper vs. Others’.
To further evaluate the algorithm’s performance, the mechanism was deflected to 15 μrad and held in a static state, as illustrated in Figure 10a, during the noise spectral density estimation process, the input signal exhibits significant sinusoidal noise near 1 Hz, which poses challenges for accurate spectral resolution. To address this issue, the improved algorithm reduces the taper number in the vicinity of 1 Hz, as shown in Figure 10b, effectively mitigating the impact of sinusoidal noise while maintaining spectral clarity. Additionally, the improved algorithm enhances resolution in the low-frequency region below 1 mHz by setting a fixed, lower taper number, ensuring higher precision in this critical frequency range. A further quantitative assessment through comparative analysis of multiple algorithms confirms the improved algorithm’s enhanced performance in handling sinusoidal noise and its superior resolution across both the low-frequency and 1 Hz regions.
The mean PSD derived from this setup serves as the true value, as illustrated in Figure 11a. Near 1 mHz, the adaptive sine multi-taper algorithm exhibits increased variance but reduced bias, resulting in a lower MSE. Its MSE is approximately 54% of that of the original algorithm, reflecting a reduction of 46%, and 45% of that of the LPSD algorithm, indicating a significant performance enhancement with a reduction of 55%. The LISA-LPSD algorithm’s MSE is about 77% of that of the LPSD algorithm, while the adaptive sine multi-taper algorithm’s MSE is roughly 59% of that of the LISA-LPSD algorithm, reflecting a 41% reduction, as shown in Table 2 under ‘Noise Metric Experiment: Adaptive Sine Multi-Taper vs. Others’.
As depicted in Figure 11b, for the longest processing time of 5 h, the improved adaptive sine algorithm’s execution time is reduced to approximately 33% of that of the original algorithm, reflecting a reduction of 67%, 14% of that of the LPSD algorithm, indicating a reduction of 86%, and 70% of that of the LISA-LPSD algorithm, corresponding to a reduction of 30%, as shown in Table 1 under ‘Noise Metric Experiment: Adaptive Sine Multi-Taper vs. Others’.
Both experimental simulations demonstrate a significant reduction in MSE for the improved adaptive sine multi-taper algorithm compared to the original version, the LPSD algorithm, and the LISA-LPSD algorithm. The algorithm’s complexity is substantially streamlined, leading to notable improvements in computational efficiency and speed. Specifically, as shown in Table 2, the MSE relative to the LISA-LPSD algorithm decreases by 40% to 80%. For signals with sharp characteristics, such as sine noise, the improved adaptive sine multi-taper algorithm outperforms others, with experimental results aligning closely with prior simulations. Under stable conditions, the bias decreases by approximately 40%, and the execution time is reduced to 65% to 70% of that of the original algorithms, exhibiting minimal fluctuations and stable performance.

5. Conclusions

This study conducts a preliminary comparison of the Thomson algorithm, the adaptive sine multi-window power spectral density estimation algorithm, and the LPSD algorithm, identifying the LPSD algorithm, the LISA-LPSD algorithm, and the adaptive sine multi-window power spectral density estimation algorithm as the focal points of this research. Through a combination of simulation and experimental validation, an improved adaptive sine multi-window algorithm is proposed, dynamically adjusting based on low-frequency cone numbers, with performance assessed by mean square error and computational time. Experimental results indicate that the improved algorithm shows significant enhancement in mean square error metrics compared to both the original algorithm and the LISA-LPSD algorithm, achieving a maximum error reduction of up to 80% under ideal simulation conditions, while maintaining approximately 40% error reduction in actual complex noise scenarios. Additionally, the computational time is reduced to 65–70% of that required by traditional methods, demonstrating excellent real-time performance and robustness.
It is noteworthy that the optimization strategy for low-frequency cone numbers has been confirmed to play a critical role in the amplitude spectrum analysis of non-stationary signals, particularly for steep sine noise. This provides a new technical pathway for high-precision noise spectrum estimation in the context of performance evaluation for space gravitational-wave-detection systems. However, further adaptation is still necessary in practical applications to address noise complexity and non-ideal environments. Future research could focus on refined modeling of noise characteristics, enhancing algorithm adaptability in extreme spectral aliasing scenarios, and integrating optimization with other time-frequency analysis methods to expand its universality in engineering practice.

6. Patents

A patent application for “A Logarithmic-Scale Adaptive Multi-Taper Power Spectral Density Estimation Method” has been filed based on the work reported in this manuscript.

Author Contributions

Conceptualization, C.L., D.H. and Y.H.; Methodology, C.L., D.H. and Y.H.; Software, C.L.; Formal analysis, C.L.; Investigation, C.L., Y.L., C.F., H.Z., Q.W., D.H. and Y.H.; Resources, D.H. and Y.H.; Data curation, C.L., Y.L., C.F., H.Z., Q.W., D.H. and Y.H.; Writing—original draft, C.L., D.H. and Y.H.; Writing—review and editing, C.L., Y.L., C.F., H.Z., Q.W., D.H. and Y.H.; Funding acquisition, D.H. and Y.H. All authors have read and agreed to the published version of the manuscript.

Funding

This research was funded by National Key Research and Development Program of China, grant number 2022YFC2203800.

Institutional Review Board Statement

Not applicable.

Informed Consent Statement

Not applicable.

Data Availability Statement

Data can be shared if relevant researchers have a reasonable need, and they can obtain the data by contacting the corresponding author.

Conflicts of Interest

The authors declare no conflicts of interest. This study was funded by National Key Research and Development Program of China. The funders had no role in the study design; in the collection, analysis, or interpretation of data; in the writing of the manuscript; or in the decision to publish the results.

References

  1. Gong, Y.; Luo, J.; Wang, B. Concepts and Status of Chinese Space Gravitational Wave Detection Projects. Nat. Astron. 2021, 5, 881–889. [Google Scholar] [CrossRef]
  2. Cyranoski, D. Chinese Gravitational-Wave Hunt Hits Crunch Time. Nature 2016, 531, 150–151. [Google Scholar] [CrossRef] [PubMed]
  3. Li, F.; Wang, J.-W.; Gao, Z.-C.; Li, J.-B.; An, B.-N.; Li, R.-X.; Bai, Y.; Yin, W.-B.; Tian, L.; Zheng, Y.-H. Laser Intensity Noise Evaluation System for Space-Based Gravitational Wave Detection. Acta Phys. Sin. 2022, 71, 209501. [Google Scholar] [CrossRef]
  4. Amaro-Seoane, P.; Andrews, J.; Arca Sedda, M.; Askar, A.; Baghi, Q.; Balasov, R.; Bartos, I.; Bavera, S.S.; Bellovary, J.; Berry, C.P.L.; et al. Astrophysics with the Laser Interferometer Space Antenna. Living Rev. Relativ. 2023, 26, 2. [Google Scholar] [CrossRef]
  5. Percival, D.B.; Walden, A.T. Spectral Analysis for Physical Applications: Multitaper and Conventional Univariate Techniques; Cambridge University Press: Cambridge, UK, 1993; pp. 368–370. [Google Scholar]
  6. Wang, W.; Li, F.; Li, J.; Ju, M.; Zheng, L.; Tian, Y.; Yin, W.; Tian, L.; Zheng, Y. Research on Low-Noise Balanced Zero-Phasing Detection System for Space Gravitational Wave Detection (Invited). Infrared Laser Eng. 2022, 51, 20220300. [Google Scholar] [CrossRef]
  7. Stoica, P.; Moses, R.L. Spectral Analysis of Signals; Pearson/Prentice Hall: Upper Saddle River, NJ, USA, 2005; pp. 1–2. [Google Scholar]
  8. Welch, P. The Use of Fast Fourier Transform for the Estimation of Power Spectra: A Method Based on Time Averaging over Short, Modified Periodograms. IEEE Trans. Audio Electroacoust. 1967, 15, 70–73. [Google Scholar] [CrossRef]
  9. Thomson, D.J. Spectrum Estimation and Harmonic Analysis. Proc. IEEE 1982, 70, 1055–1096. [Google Scholar] [CrossRef]
  10. Riedel, K.S.; Sidorenko, A. Minimum Bias Multiple Taper Spectral Estimation. IEEE Trans. Signal Process. 1995, 43, 188–195. [Google Scholar] [CrossRef]
  11. Tröbs, M.; Heinzel, G. Improved Spectrum Estimation from Digitized Time Series on a Logarithmic Frequency Axis. Measurement 2006, 39, 120–129. [Google Scholar] [CrossRef]
  12. Guo, J.; Ma, S.; Zhou, C.; Liu, J.; Wang, B.; Pan, D.; Mao, H. Vibration Compensation for a Vehicle-Mounted Atom Gravimeter. IEEE Sens. J. 2022, 22, 12939–12946. [Google Scholar] [CrossRef]
  13. Miller, A.L.; Badaracco, F.; Palomba, C. Distinguishing Between Dark-Matter Interactions With Gravitational-Wave Detectors. Phys. Rev. D 2022, 105, 103035. [Google Scholar] [CrossRef]
  14. Joo, K.-N.; Clark, E.; Zhang, Y.; Ellis, J.D.; Guzman, F. A Compact High-Precision Periodic-Error-Free Heterodyne Interferometer. J. Opt. Soc. Am. A 2020, 37, B11. [Google Scholar] [CrossRef]
  15. Barbour, A.J.; Parker, R.L. psd: Adaptive, Sine Multitaper Power Spectral Density Estimation for R. Comput. Geosci. 2014, 63, 1–8. [Google Scholar] [CrossRef]
  16. Welford, B.P. Note on a Method for Calculating Corrected Sums of Squares and Products. Technometrics 1962, 4, 419–420. [Google Scholar] [CrossRef]
  17. Haley, C.L.; Anitescu, M. Optimal Bandwidth for Multitaper Spectrum Estimation. IEEE Signal Process. Lett. 2017, 24, 1696–1700. [Google Scholar] [CrossRef]
  18. Karnik, S.; Romberg, J.; Davenport, M.A. Thomson’s Multitaper Method Revisited. arXiv 2022, arXiv:2103.11586. [Google Scholar] [CrossRef]
  19. Huang, Z.; Xu, Y.L. A Multi-Taper S-Transform Method for Spectral Estimation of Stationary Processes. IEEE Trans. Signal Process. 2021, 69, 1452–1467. [Google Scholar]
  20. Huang, Z.; Xu, Y.L.; Tao, T. Multi-Taper S-Transform Method for Evolutionary Spectrum Estimation. Mech. Syst. Signal Process. 2022, 168, 108667. [Google Scholar]
  21. Prieto, G.A.; Thomson, D.J.; Vernon, F.L.; Shearer, P.M.; Parker, R.L. Confidence Intervals for Earthquake Source Parameters Using Multitaper Spectral Analysis. Bull. Seismol. Soc. Am. 2007, 97, 163–177. [Google Scholar] [CrossRef]
  22. Zhang, Y.M.; Huang, Z.; Xia, Y. An Adaptive Multi-Taper Spectral Estimation for Stationary Processes. Mech. Syst. Signal Process. 2023, 183, 109629. [Google Scholar] [CrossRef]
  23. Negri, E.; Fuscaldo, W.; Burghignoli, P.; Galli, A. An Overview of Design Techniques for Two-Dimensional Leaky-Wave Antennas. Appl. Sci. 2025, 15, 1854. [Google Scholar] [CrossRef]
  24. Nawaz, W.; Albert, K.; Jouvet, P.; Noumeir, R. Acute Respiratory Distress Identification via Multi-Modality Using Deep Learning. Appl. Sci. 2025, 15, 1512. [Google Scholar] [CrossRef]
  25. Buzzicotti, M.; De Santis, A.; Tantalo, N. Teaching to Extract Spectral Densities from Lattice Correlators to a Broad Audience of Learning-Machines. Eur. Phys. J. C 2024, 84, 32. [Google Scholar] [CrossRef]
  26. Valadão, M.D.M.; Costa, A.L.A.D.; Silva, É.R.D.; Mateus, A.C.; Júnior, W.S.S. Noise Power Density Estimation Based on Deep Learning Using Spectrograms Extracted from Wireless Signals. In Proceedings of the XLII Simpósio Brasileiro de Telecomunicações e Processamento de Sinais, Belém, Brazil, 1–4 October 2024. [Google Scholar] [CrossRef]
  27. Qiao, D.; Jia, F.; Li, X.; Zhou, X. A Review of Orbital Mechanics for Space-Based Gravitational Wave Observatories. Space Sci. Technol. 2023, 3, 0015. [Google Scholar] [CrossRef]
  28. Shen, J.; Wang, Q.; Zhao, M.; Hu, J.; Wang, J.; Shu, M.; Liu, Y.; Guo, W.; Qiao, H.; Niu, Q.; et al. Mapping Maize Planting Densities Using Unmanned Aerial Vehicles, Multispectral Remote Sensing, and Deep Learning Technology. Drones 2024, 8, 140. [Google Scholar] [CrossRef]
  29. Zhang, Q.; Peng, Z.; Song, Y. Performance Analysis of Spectrum Sensing Algorithms in Cognitive Radio: A Statistical Approach. Sensors 2023, 23, 1942. [Google Scholar] [CrossRef]
  30. Nakamura, M.; Yokota, K.; Ozawa, M. Numerical Calculation Optimization for Particulate Matter Trapping and Oxidation of Catalytic Diesel Particulate Filter. Appl. Sci. 2025, 15, 2356. [Google Scholar] [CrossRef]
  31. Hansson, M. Optimized Weighted Averaging of Peak Matched Multiple Window Spectrum Estimators. IEEE Trans. Signal Process. 1999, 47, 1141–1146. [Google Scholar] [CrossRef]
  32. Almstrom, M. Optimizing Weighting Factors for Multiple Window Spectrum Estimates. Bachelor’s Thesis, Lund University, Lund, Sweden, 2021. [Google Scholar]
  33. Wang, L.; Ma, L. Multi-Window Spectral Estimation Based on the Minimum Mean Square Error (MMSE) Criterion. Off. Autom. 2010, 16, 23–25. [Google Scholar]
  34. Lindgren, G.; Rootzen, H.; Sandsten, M. Stationary Stochastic Processes for Scientists and Engineers; Chapman and Hall/CRC: Boca Raton, FL, USA, 2013. [Google Scholar] [CrossRef]
  35. Wang, Y.; Liu, T.; Zhou, J. Spectrum Estimation Techniques for Cognitive Radio: Beyond Traditional Methods. Sensors 2024, 24, 1456. [Google Scholar] [CrossRef]
  36. Percival, D.B.; Walden, A.T. Spectral Analysis for Physical Applications; Cambridge University Press: Cambridge, UK, 1993; pp. 20–40. [Google Scholar]
  37. Walden, A.T. A Unified View of Multitaper Multivariate Spectral Estimation. Biometrika 2000, 87, 767–788. [Google Scholar] [CrossRef]
  38. Babadi, B.; Brown, E.N. A Review of Multitaper Spectral Analysis. IEEE Trans. Biomed. Eng. 2014, 61, 1555–1564. [Google Scholar] [CrossRef] [PubMed]
  39. Xu, X.; Tan, Y.; Mu, H.; Li, Y.; Wang, J.; Jin, J. Laser Interferometry Multi-Degree-of-Freedom Measurement Technology in Space Gravitational Wave Detection. Laser Optoelectron. Prog. 2023, 60, 0312006. [Google Scholar] [CrossRef]
Figure 1. Algorithm Performance Comparison Chart.
Applsci 15 03919 g001
Figure 2. Comparative analysis of theoretical ASD and simulation results for LPSD, Adaptive Sine Multi-Taper, Original Adaptive Sine Multi-Taper, and LISA-LPSD Algorithms in sine excitation simulation. (a) Performance comparison; (b) Taper number comparison before and after improvements for Adaptive Sine Multi-Taper Algorithm.
Applsci 15 03919 g002
Figure 3. Performance Comparison of LPSD, LISA-LPSD, and Adaptive Sine Multi-Taper Algorithms in sine excitation simulation. (a) Squared Bias, Variance, and MSE for LPSD, LISA-LPSD, and Adaptive Sine Multi-Taper Algorithms before and after improvement; (b) Computation time comparison using LPSD, Adaptive Sine Multi-Taper, Original Adaptive Sine Multi-Taper, and LISA-LPSD Algorithms.
Applsci 15 03919 g003
Figure 4. Evaluation of noise spectrum spectral density. (a) Metrics for assessing noise spectrum spectral density; (b) Temporal sequences for noise spectrum spectral density analysis.
Applsci 15 03919 g004
Figure 5. Comparison of algorithm effectiveness in estimating noise spectral density under noise metric simulation. (a) Noise spectrum spectral density comparison; (b) Taper number comparison before and after improvements for adaptive sine multi-taper algorithm.
Applsci 15 03919 g005
Figure 6. Evaluation of noise spectral density estimation under noise metric simulation. (a) Squared Bias, Variance, and MSE for LPSD, LISA-LPSD, and Adaptive Sine Multi-Taper Algorithms before and after improvement; (b) Comparison of computation time using LPSD, Adaptive Sine Multi-Taper, Original Adaptive Sine Multi-Taper, and LISA-LPSD Algorithms.
Applsci 15 03919 g006
Figure 7. Schematic of the angular measurement device (BS: Beam Splitter, PBS: Polarizing Beam Splitter, QPD: Quadrant Photodetector, AOM: Acousto-Optic Modulator).
Applsci 15 03919 g007
Figure 8. Comparison of taper numbers before and after improvements for LPSD, LISA-LPSD, and Adaptive Sine Multi-Taper Algorithm in sinusoidal excitation experiment. (a) 100 mHz, where a sinusoidal signal was applied to evaluate the algorithm’s performance at higher frequencies; (b) 10 mHz, where a sinusoidal stimulus was introduced to assess mid-frequency response and noise suppression; (c) 1 mHz, where a low-frequency sinusoidal excitation was used to test the algorithm’s effectiveness in resolving signals near the lower frequency limit.
Applsci 15 03919 g008
Figure 9. Performance analysis of PAAM in sinusoidal excitation experiment. (a) Comparison of Squared Bias, Variance, and MSE before and after improvements using LPSD, LISA-LPSD, and Adaptive Sine Multi-Taper Algorithm; (b) Comparison of Computation time for LPSD, Adaptive Sine Multi-Taper, Original Adaptive Sine Multi-Taper, and LISA-LPSD Algorithms in PAAM.
Applsci 15 03919 g009
Figure 10. Comparison of computation time for LPSD, LISA-LPSD, and Adaptive Sine Algorithm before and after improvements under noise metric experiment. (a) Noise spectrum spectral density comparison; (b) Taper number comparison before and after improvements for adaptive sine multi-taper algorithm.
Applsci 15 03919 g010
Figure 11. Performance evaluation of algorithms under noise metric experiment. (a) Squared Bias, Variance, and MSE before and after improvements for LPSD, LISA-LPSD, and Adaptive Sine Algorithm; (b) Comparison of computation time for LPSD, Adaptive Sine Multi-Taper, Original Adaptive Sine Multi-Taper, and LISA-LPSD Algorithms.
Applsci 15 03919 g011
Table 1. Performance: Adaptive Sine Multi-Taper Algorithm vs. others in sinusoidal stimulation and under noise metric simulation.
AlgorithmIn Sinusoidal Simulation Adaptive Sine Multi-Taper vs. OthersUnder Noise Metric Simulation Adaptive Sine Multi-Taper vs. Others
MSE Reduction(%)Runtime Reduction(%)MSE Reduction(%)Runtime Reduction(%)
Original Adaptive Sine
Multi-taper
45768568
LPSD34886486
LISA-LPSD90256431
Table 2. Performance: Adaptive Sine Multi-Taper Algorithm vs. others in sinusoidal excitation experiment and under noise metric experiment.
AlgorithmIn sinusoidal Excitation Experiment Adaptive Sine Multi-Taper vs. OthersUnder Noise Metric Experiment Adaptive Sine Multi-Taper vs. Others
MSE Reduction (%)Runtime Reduction (%)MSE Reduction (%)Runtime Reduction (%)
Original Adaptive Sine
Multi-taper
81534667
LPSD90905586
LISA-LPSD79354130
Disclaimer/Publisher’s Note: The statements, opinions and data contained in all publications are solely those of the individual author(s) and contributor(s) and not of MDPI and/or the editor(s). MDPI and/or the editor(s) disclaim responsibility for any injury to people or property resulting from any ideas, methods, instructions or products referred to in the content.

