Article

A Thermodynamic Model for the Solubility of SO2 in Multi-Ion Electrolyte Solutions and Its Applications

School of Earth Sciences and Resources, China University of Geoscience, Beijing 100083, China
*
Author to whom correspondence should be addressed.
Appl. Sci. 2025, 15(7), 3927; https://doi.org/10.3390/app15073927
Submission received: 10 March 2025 / Revised: 28 March 2025 / Accepted: 31 March 2025 / Published: 3 April 2025
(This article belongs to the Special Issue Recent Advances in Geochemistry)

Abstract

:
A solubility model of SO2 in multi-ion electrolyte solutions has been developed by the activity-fugacity relation at vapor-liquid equilibria. The fugacity coefficient of SO2 in the vapor phase is calculated by the equation of state (EOS) of pure SO2, and the activity coefficient of SO2 in the liquid phase is calculated by the Pitzer activity coefficient theory. The model can reproduce the reliable solubility data of SO2 in pure water and multi-ion electrolyte solutions (Na+, K+, Cl, SO 4 2 ) within or close to experimental uncertainties. Although the second-order and third-order interaction parameters between SO2 and Mg2+ and Ca2+ have been adopted by an approximation, the solubility model can also be extended to predict the SO2 solubility in seawater. In addition, combining with the EOS of a CO2-SO2 fluid mixture, the model can be used to predict the solubility of a CO2-SO2 mixture in aqueous electrolyte solutions. The calculated results are consistent with experimental data, which indicates that the solubility model has certain predictive ability.

1. Introduction

SO2 in the atmosphere mainly comes from volcanic eruptions [1], burning fossil fuels in power plants [2], metal processing and smelting [3]. In the process of CO2 capture and sequestration (CCS), SO2 is also an impurity, and to sequester it with CO2 in the deep saline aquifers can reduce the cost. Deep saline aquifers contain a variety of electrolyte ions (e.g., Na+, K+, Ca+, Mg2+, Cl, SO 4 2 ). Therefore, it is essential to study the solubility of single gases and mixed gases in multi-ion electrolyte solutions. The solubility model of CO2 in multi-ion electrolyte solutions has been reported in our previous studies [4,5], so this work focuses on the solubility model of SO2 in multi-ion electrolyte solutions under different temperature-pressure (T-P) conditions. This research is of great practical significance for the co-storage of CO2-SO2 gas mixturlles in deep saline aquifers.
Due to the strong corrosive potential of SO2, experimental solubility data for SO2 in multi-ion electrolyte solutions are difficult to collect, especially at high temperatures and pressures. Therefore, predictive SO2 solubility models are desired. In recent decades, many scholars have developed thermodynamic models to predict SO2 solubility in multi-ion electrolyte solutions (Table 1).
Hunger et al. [6] applied the methods from Meissner [16,17] and Bromley [18] to estimate activity coefficients, which can predict the solubility of SO2 in Na2SO4 or H2SO4 solutions from 10−4 to 0.1 bar at 298 K and 323 K. Xia et al. [7] developed a phase equilibrium model to calculate SO2 solubility in NaCl and NH4Cl aqueous solutions, from 313 to 393 K at total pressures up to 37 bar, which is capable of representing most of the experimental data within experimental uncertainties. Rodríguez-Sevilla et al. [8] adopted the extended Debye-Hückel theory [19] and the Pitzer [20] ion-interaction model to evaluate the activity coefficients of ionic species, which can be used to predict the absorption equilibria of dilute SO2 in seawater in the temperature range from 278.15 to 318.15 K with a pressure of up to 0.976 bar. Mondal [9] proposed a model for the solubility of SO2 using Henry’s Law in pure water with temperatures ranging between 293 and 333 K, with SO2 partially pressurized up to 0.01 bar. Zimmermann et al. [10] developed a thermodynamic model with the Pitzer activity coefficient theory and the Sechenov’s approach from Weisenberger and Schumpe [21], which can predict the SO2 solubility in HCl, NaCl, HBr and NaBr electrolyte solutions. The applicable P-T-m range is 298 K, 1.015 bar, 0–4.61 kg/mol. The developed thermodynamic model by Zimmermann et al. [10] is in good agreement with experimental data. Shaw et al. [11] developed a solubility model of SO2 in pure water with a valid T-P range of 298–313 K and 0.2–3.6 bar. The model is in good agreement with experimental data at lower pressures, but improvements are needed at higher pressures (p > 1.5 bar). Tan et al. [12] adopted the PC-SAFT/PMSA and CPA EOS to evaluate SO2 solubility in pure water and NaCl electrolyte solutions up to 393 K and 40 bar and 6 mol/kg. Miri et al. [22] applied the SAFT1 model to estimate CO2-SO2 solubility in pure water, covering a valid T-P range of 303.15–373.15 K and 60–300 bar. Cox et al. [13] developed an equilibrium model by the Pitzer and Sechenov approach, which provides a reliable prediction of SO2 solubility in seawater and brine at 298 K and 323 K with molality of electrolytes up to 1 mol/kg. Zhou et al. [14] proposed a PC-SAFT model to predict the SO2 solubility in water, covering a valid T-P range of 263.15–393.15 K and 10–300 bar, which can accurately predict the SO2 solubility in water above 10 bar and 273.15 K, but at lower temperatures and pressures, it cannot accurately calculate the SO2 solubility. Saadallah et al. [15] used the Monte Carlo (MC) molecular simulation technique to predict the vapor-liquid and liquid-liquid equilibria including the solubility data of SO2-H2O mixture in the temperature range of 293–393 K and pressures up to 25 bar, and the results from the MC simulation are in agreement with experimental data at liquid-vapor and liquid-liquid equilibria.
As mentioned above, the models of SO2 solubility in multi-ion electrolyte solutions are still lacking, and most of them either have lower accuracy or have a limited temperature-pressure-salinity range. Therefore, it is necessary to develop an accurate model for the solubility of SO2 in multi-ion electrolyte solutions. In this work, we first review experimental data of SO2 solubility in pure water and multi-ion electrolyte solutions. Then an accurate thermodynamic model is developed to predict the SO2 solubility in water and multi-ion electrolyte solutions by the activity-fugacity relationship at vapor-liquid equilibria. Finally, the applications of the model are briefly discussed.

2. Review of Experimental Data for SO2 Solubility in Pure Water and Aqueous Electrolyte Solutions

In this article, the solubility data of four different systems (SO2-H2O, SO2-NaCl-H2O, SO2-KCl-H2O and SO2-Na2SO4-H2O) have been found and compiled as shown in Table 2, where the information of each data set is provided, including the temperature, pressure, salinity and total number of data points. SO2 solubility in water represents the total amount of SO2 species dissolved in water, including SO2(aq), HSO 3 and SO 3 2 .

2.1. SO2-H2O Systems

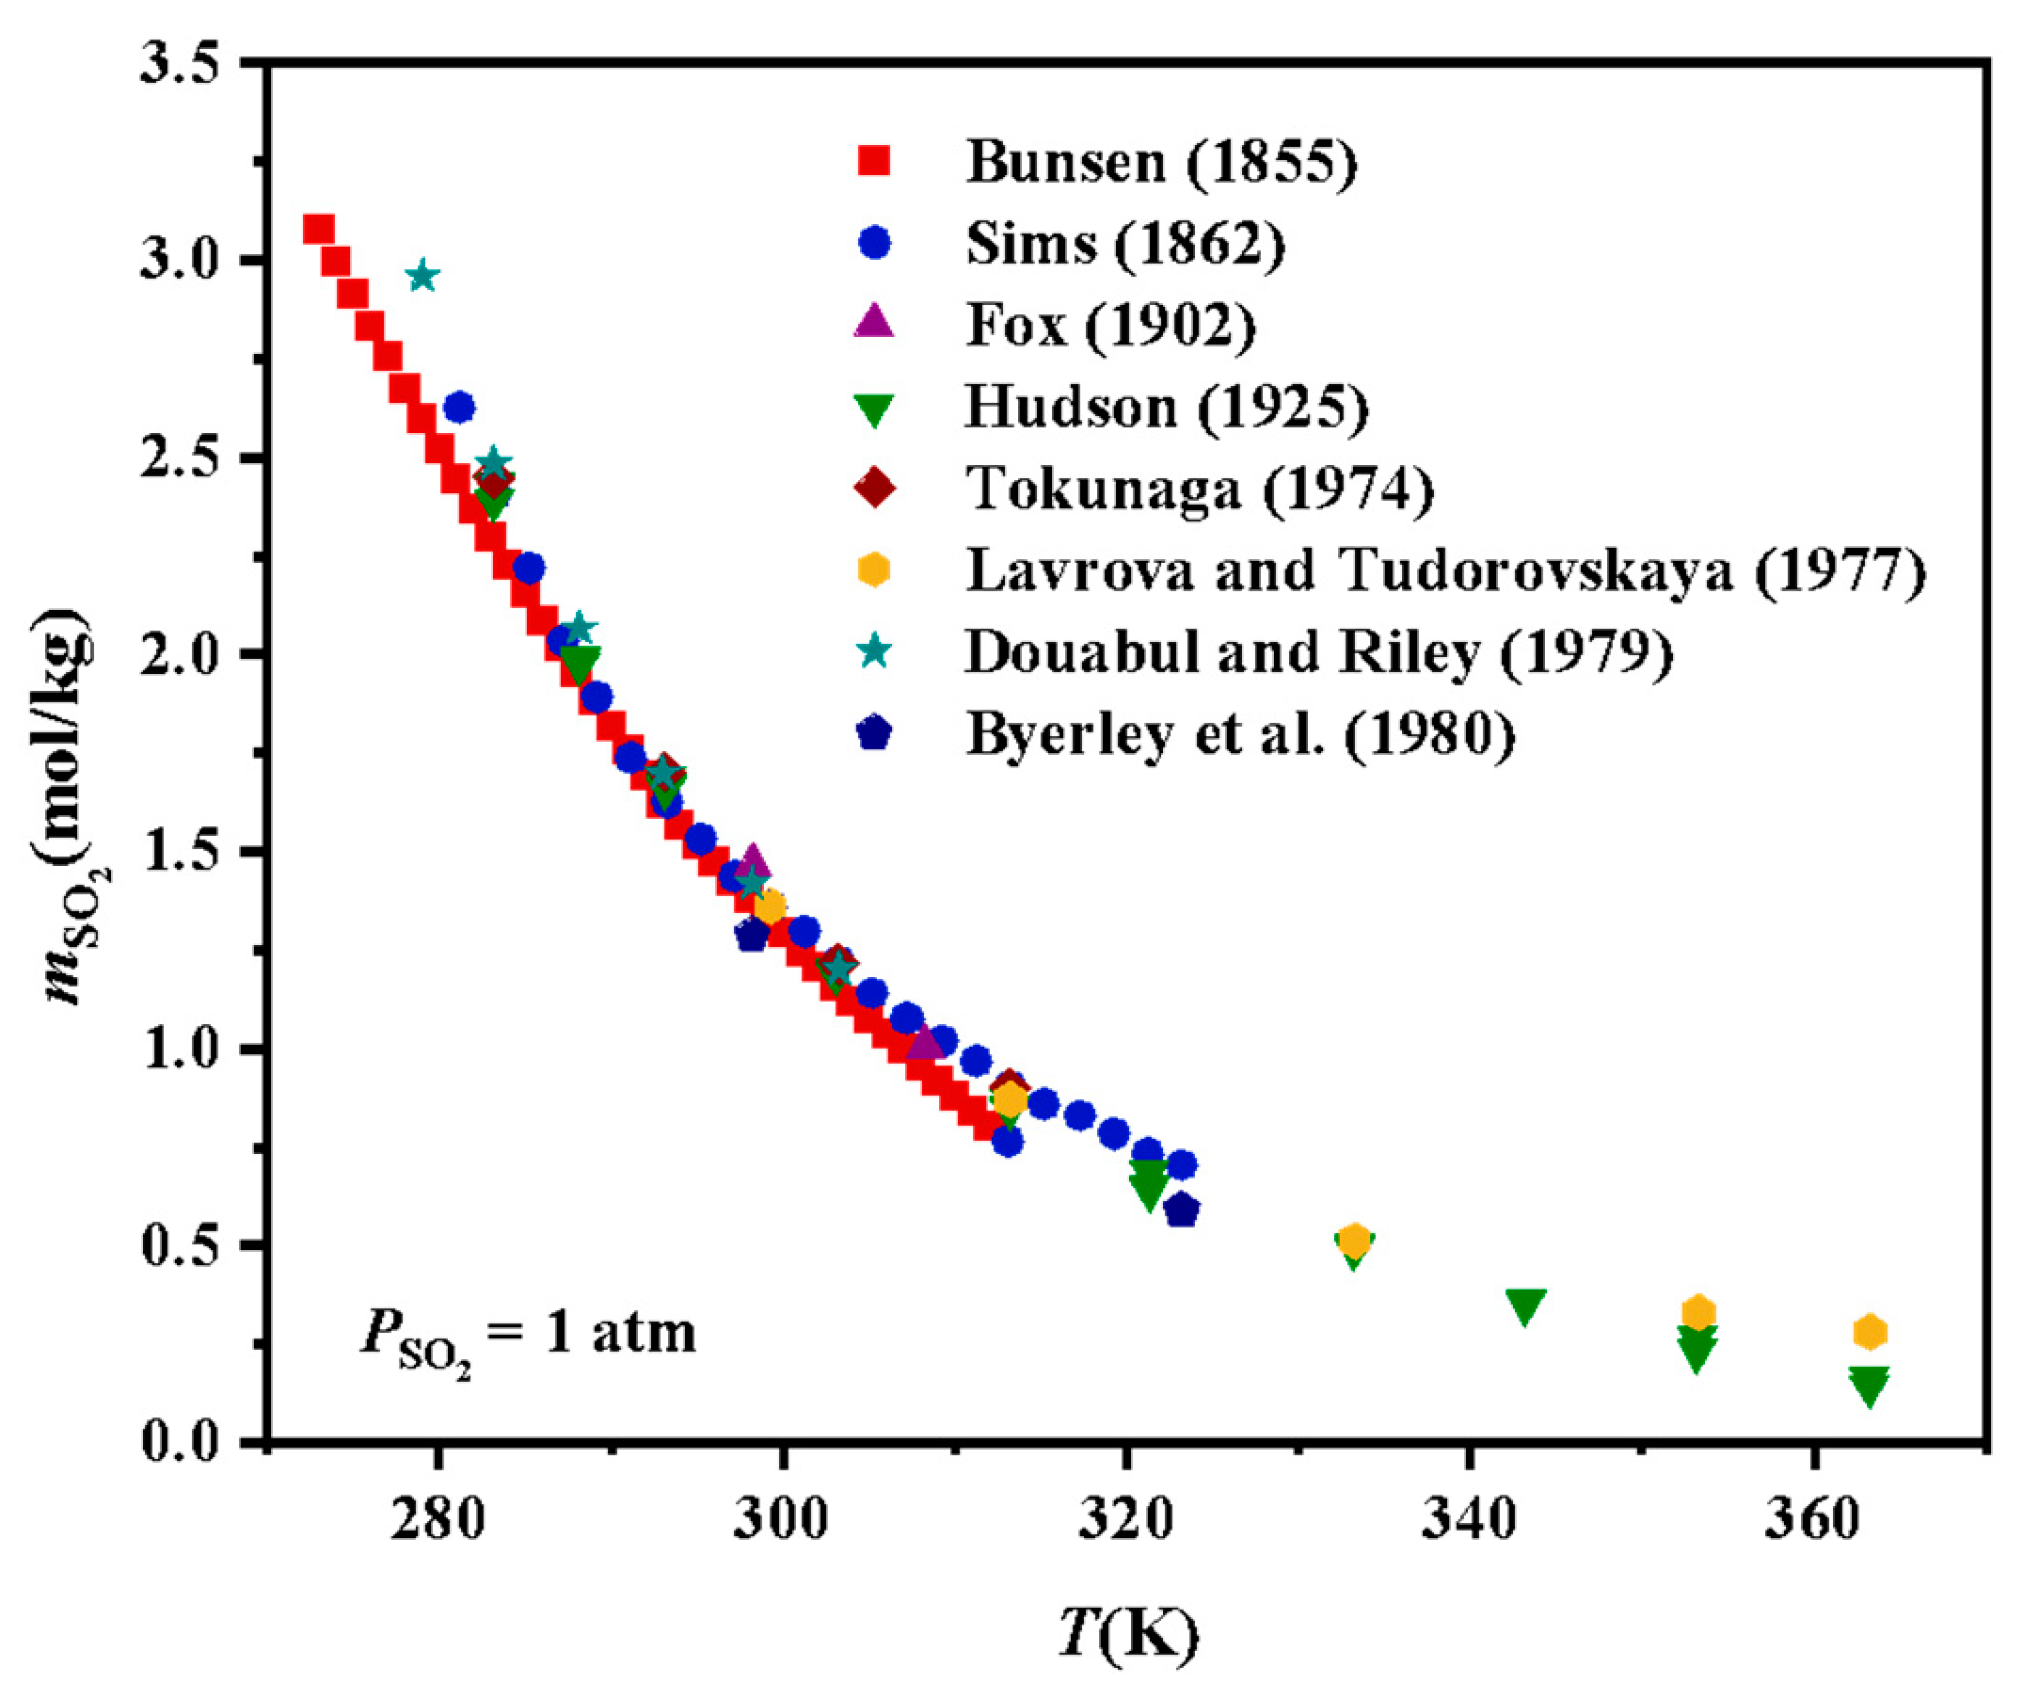
Experimental data of SO2 solubility in pure water are relatively extensive (Table 2). However, some of the solubility data are unreliable. Sherwood [28] measured the SO2 solubility in water under relatively low pressure, but the data are quite different from the reliable data of others under the same conditions. Experimental data of SO2 solubility from Johnstone and Leppla [33], Parkinson [36] and Vosolsobe et al. [38] were evaluated in the solubility data series book by Young [34]. Because their pressure is too low to be judged reasonably, experimental data of solubility have a large deviation. Experimental SO2 solubility data of Siddiqi et al. [44], Mondal [9], Shaw et al. [11] and Cox et al. [13] are measured for the SO2-N2-H2O system under extremely low pressures. The data yield big deviations when they are used in parameterization. Most of the experimental SO2 solubility data of Morgan and Maass [31], Beuschlein and Simenson [35], Rabe and Harris [37], Zhou et al. [14] and Saadallah et al. [15] are consistent with one another. Figure 1 shows that the experimental SO2 solubility data of Bunsen [23], Sims [24], Fox [25], Tokunaga [39], Lavrova and Tudorovskaya [40] and Byerley et al. [42] are consistent with each other when the partial pressure of SO2 is 1 atm, but the data of Douabul and Riley [41] at 280 K yield a slight deviation. Therefore, all the data except the unreliable data mentioned above are used in the parameterization of this model, covering a wide T-P range of 273.15–393.15 K and 0.00–300.00 bar.

2.2. SO2-NaCl-H2O Systems

There are only five experimental data sets reported for SO2-NaCl-H2O systems (Table 2). The experimental SO2 solubility data of Zimmermann et al. [10] and Cox et al. [13] are measured for SO2-N2-NaCl-H2O systems under low pressures, and they are not used in the parameterization. The partially experimental SO2 solubility data of Xia et al. [7] yield big deviations when they are used in parameterization. Therefore, the remaining reliable data are used to optimize the model parameters, covering a T-P- m NaCl range of 278.15–393.15 K, 0.00–35.07 bar and 0–6 mol/kg.

2.3. SO2-KCl-H2O Systems

Experimental data of SO2 solubility in aqueous KCl solutions are relatively scarce. Only 74 data points have been found for this type of system. Data from Cox et al. [13] for the SO2-KCl-H2O systems have the same problem as the SO2-NaCl-H2O systems. Due to the small amount of experimental data, the reliability of the experimental data cannot be determined. Therefore, the remaining two data sets are retained, covering a T-P- m KCl range of 298.00–308.00 K, 1 bar and 0.00–4.40 mol/kg.

2.4. SO2-Na2SO4-H2O Systems

Only three data sets of SO2 solubility have been reported for SO2-Na2SO4-H2O systems. When some SO2 solubility data from Hudson [27] and Rumpf and Maurer [46] are added to optimize the model parameters, this yields big deviations. Therefore, the other reliable solubility data are used to optimize the model parameters, covering a T-P- m Na 2 SO 4 range of 298.00–393.15 K, 0.63–27.69 bar and 0.13–3.22 mol/kg.

3. The Thermodynamic Model for SO2 Solubility in Multi-Ion Solutions and Parameterization

3.1. The Thermodynamic Model for SO2 Solubility in Multi-Ion Solutions

SO2 solubility in aqueous electrolyte solutions depends on the balance between the chemical potential in the liquid phase μ SO 2 l and that in the vapor phase μ SO 2 v . The chemical potential can be written in terms of fugacity in the vapor phase and activity in the liquid phase:
μ SO 2 l T , P , m salt = μ SO 2 l 0 T , P + R T ln α SO 2 T , P , m salt = μ SO 2 l 0 T , P + R T ln m SO 2 + R T ln γ SO 2 T , P , m salt
μ SO 2 v T , P , y = μ SO 2 v 0 T + R T ln f SO 2 T , P , y SO 2 = μ SO 2 v 0 T + R T ln y SO 2 P + R T ln φ SO 2 T , P , y SO 2
where μ SO 2 l 0 , the standard chemical potential of SO2 in liquid, is defined as the chemical potential in a hypothetically ideal solution of unit molarity [47], and μ SO 2 v 0 , the standard chemical potential of SO2 in vapor, is the hypothetical ideal gas chemical potential when the pressure is equal to 1 bar. T and P denote temperature and pressure, respectively. R is the molar gas constant. f SO 2 is the fugacity of SO2 in the vapor phase, y SO 2 is the mole fraction of SO2 in the vapor phase, φ SO 2 is the fugacity coefficient of SO2. α SO 2 is the activity of SO2, and m SO 2 and m salt are the molality of SO2 and salt, respectively. γ SO 2 is the activity coefficient of SO2 in the liquid phase.
At phase equilibrium μ SO 2 l = μ SO 2 v , we obtain
ln m SO 2 = ln y SO 2 P + ln φ SO 2 T , P , y SO 2 μ SO 2 l 0 T , P μ SO 2 v 0 T R T ln γ SO 2 T , P , m salt
where μ SO 2 v 0 can be assigned as zero for convenience in the parameterization because only the difference between these two chemical potentials is important. In this work, ln φ SO 2 can be calculated from EOS of pure SO2 by Li [48] (see Appendix A), which will give rise to deviations, which can be canceled out in the later parameterization. y SO 2 is calculated by the following equation:
y SO 2 = P P H 2 O salt P
where P H 2 O salt is the partial pressure of water in the vapor phase, which is approximated by Raoult’s law, defined as
P H 2 O salt = P H 2 O s x H 2 O
where P H 2 O s is the saturated pressure of pure H2O, which is calculated from the model of Wagner and Kretzschmar [49], and x H 2 O is the gas-free mole fraction of H2O in the liquid phase.
ln γ SO 2 is expressed as a virial expansion of excess Gibbs energy [20].
ln γ SO 2 = c 2 λ SO 2 c m c + a 2 λ SO 2 a m a + c a ξ SO 2 a c m c m a
where λ and ξ are second-order and third-order interaction parameters, respectively; c and a refer to cation and anion, respectively. γ SO 2 is not the real activity coefficient in aqueous salt solution. Substituting Equation (6) into Equation (3) yields
ln m SO 2 = ln y SO 2 P + ln φ SO 2 μ SO 2 l 0 R T c 2 λ SO 2 c m c a 2 λ SO 2 a m a c a ξ SO 2 a c m c m a
Following Pitzer et al. [50], we choose the following equation for the P-T dependence of λ s , ξ s and μ SO 2 l 0 / R T :
P a r ( T , P ) = c 1 + c 2 T + c 3 T + c 4 P T
Equations (7) and (8) form the basis of the solubility model.

3.2. Parameterization

Since measurements can only be made in electronically neutral solutions, one of the parameters must be assigned arbitrarily [51,52,53]. λ SO 2 Cl is set to zero for convenience and remaining parameters are fit to the experimental solubility data. μ SO 2 l 0 / R T is directly evaluated from the solubility data of SO2 in pure water. λ SO 2 Na + and ξ SO 2 Na + Cl are obtained by fitting the data to the reliable solubility data of SO2 in aqueous NaCl solution. λ SO 2 K + is determined by a linear regression to the reliable solubility data of SO2 in aqueous KCl solutions reviewed above. λ SO 2 SO 4 2 is determined from the reliable solubility data of SO2 in aqueous Na2SO4 solutions. Up to now, experimental data of SO2 solubility in aqueous MgCl2, CaCl2 solutions have not been reported. Because SO2 and CO2 are the acid gases, λ SO 2 Ca 2 + , ξ SO 2 Ca 2 + Cl , λ SO 2 Mg 2 + and ξ SO 2 Mg 2 + Cl are approximated as λ CO 2 Ca 2 + , ξ CO 2 Ca 2 + Cl , λ CO 2 Mg 2 + and ξ CO 2 Mg 2 + Cl of Shi and Mao [5], respectively. Because ξ SO 2 -K+-Cl and ξ SO 2 -Na+- SO 4 2 have little effect on the SO2 solubility, they are set as zero in this work. Table 3 lists the optimized parameters.

4. Comparison with Experimental Data

Table 4 shows the average and maximal absolute deviations of the model from each data set for the SO2 solubility in pure water and aqueous NaCl, KCl and Na2SO4 solutions. Figure 2, Figure 3 and Figure 4 show the comparisons between the experimental results and model predictions.

4.1. SO2-H2O Systems

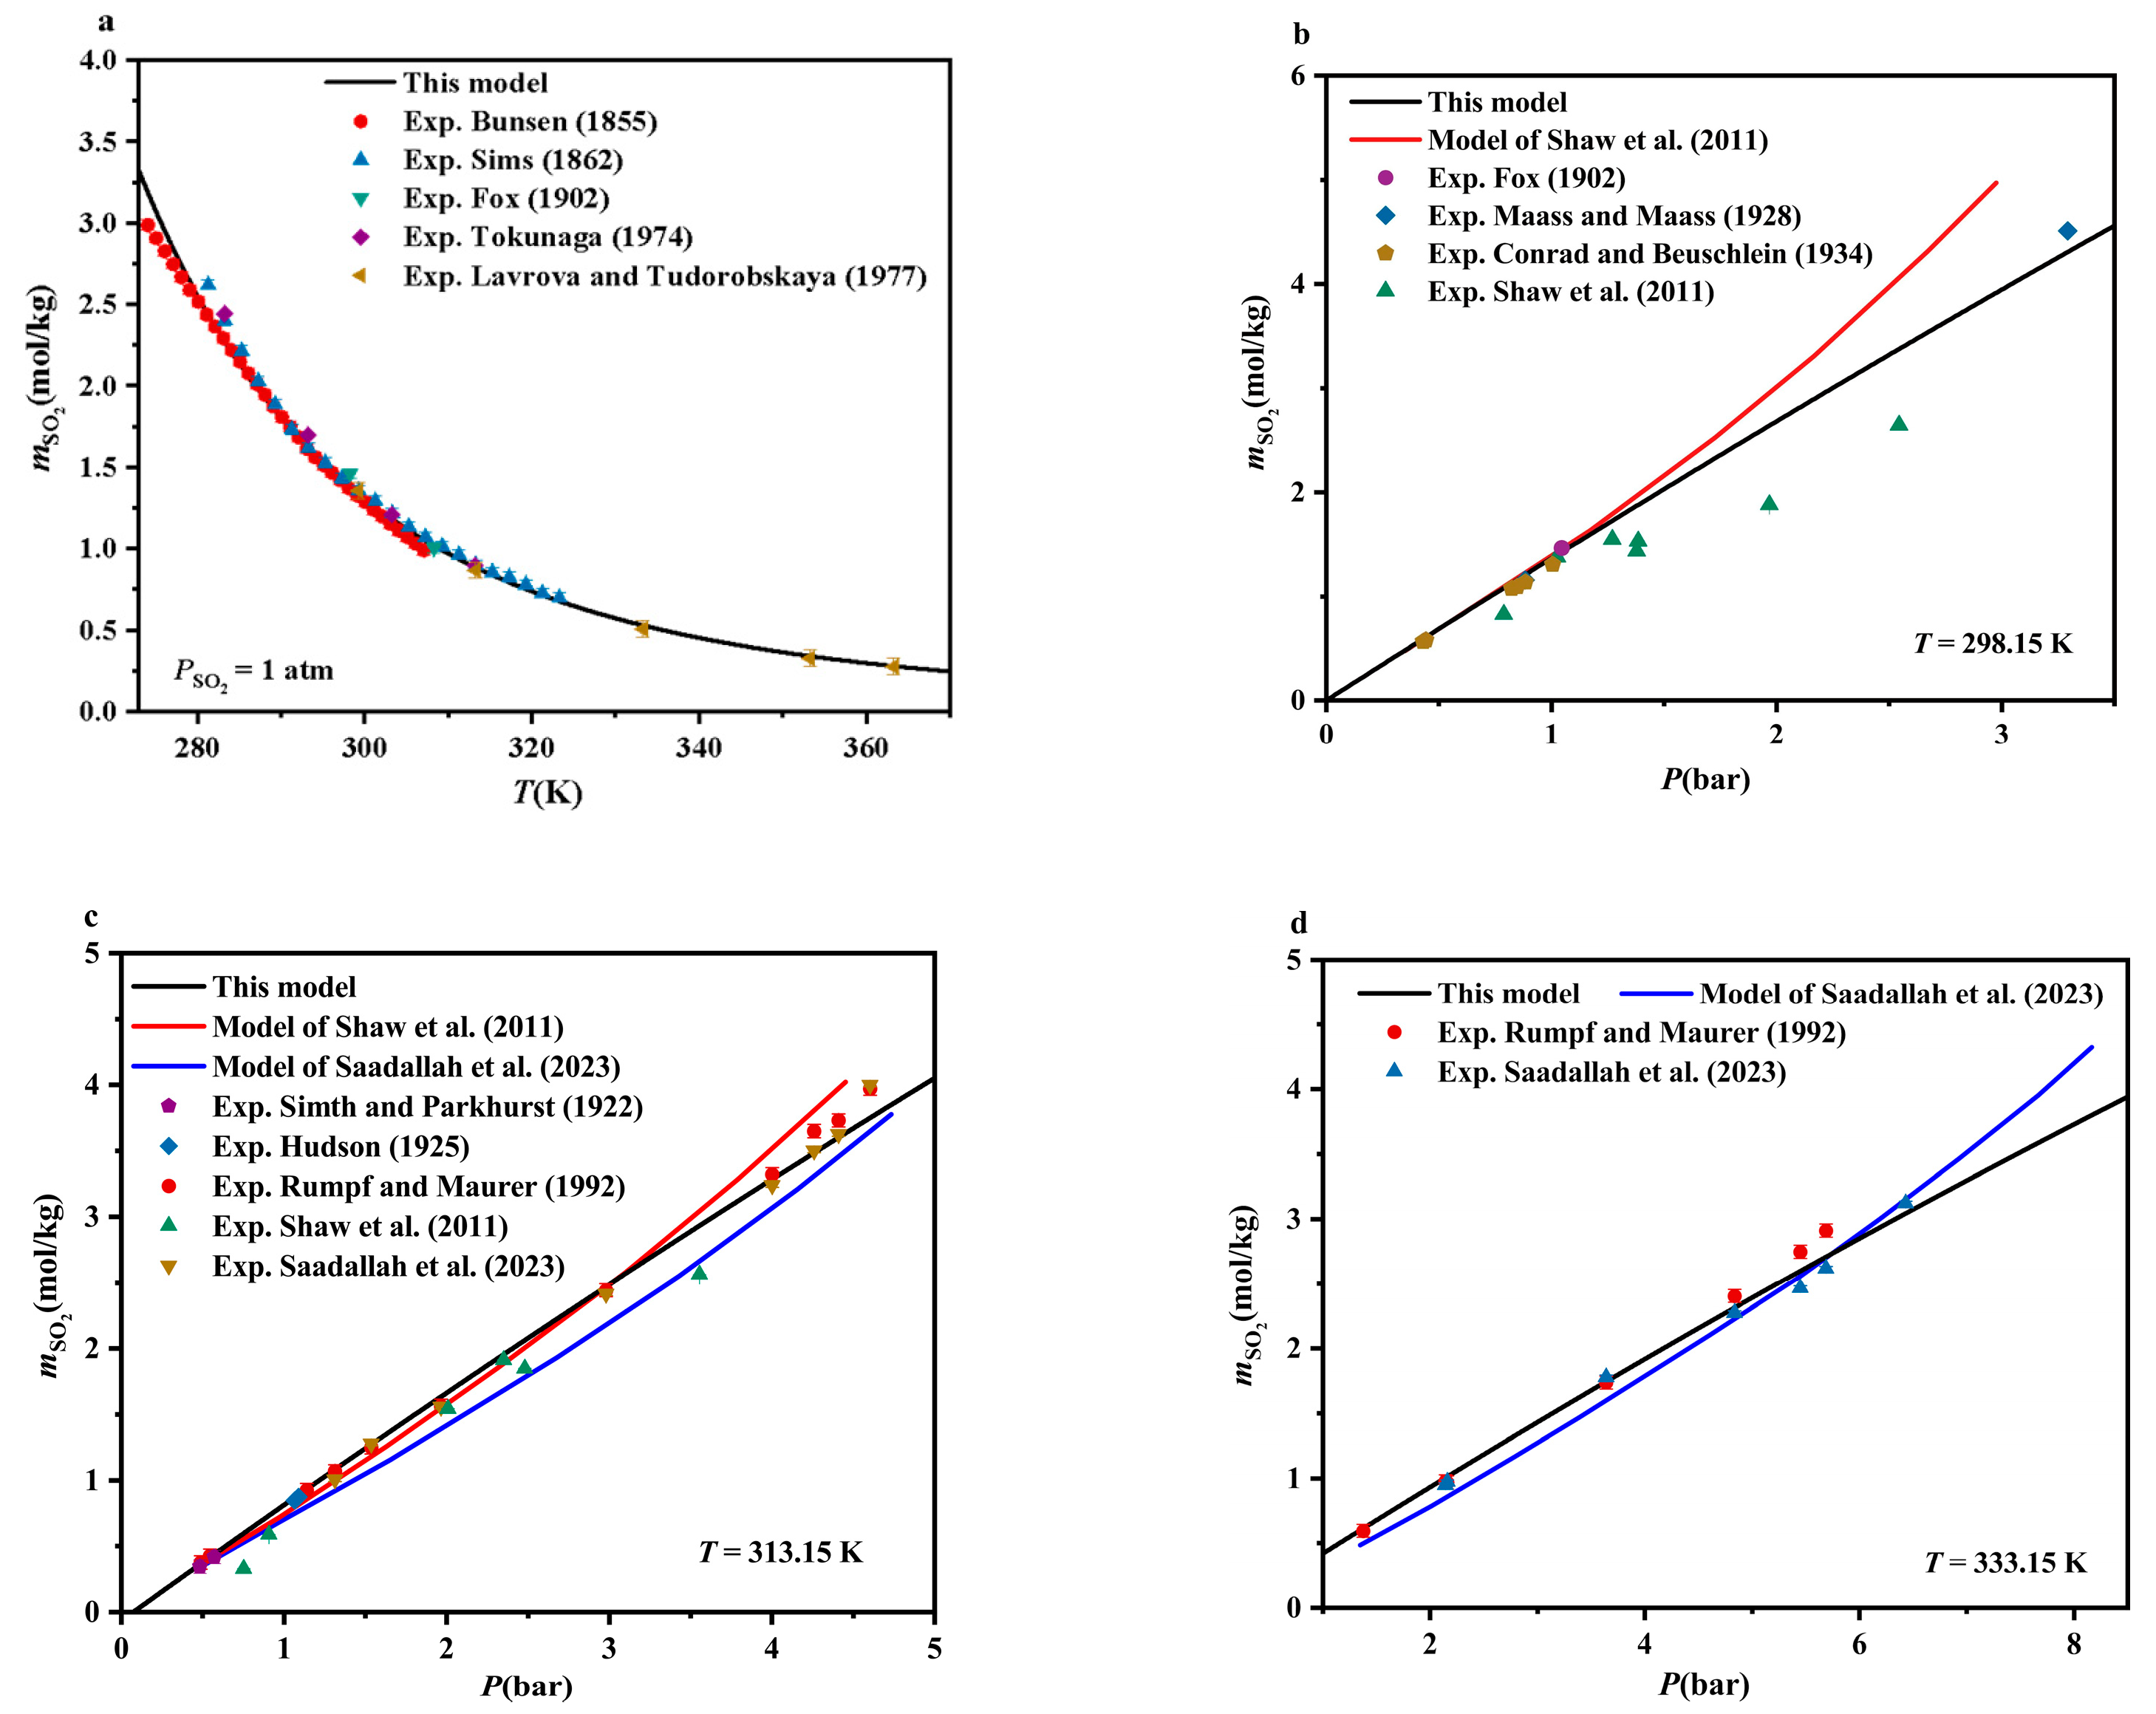
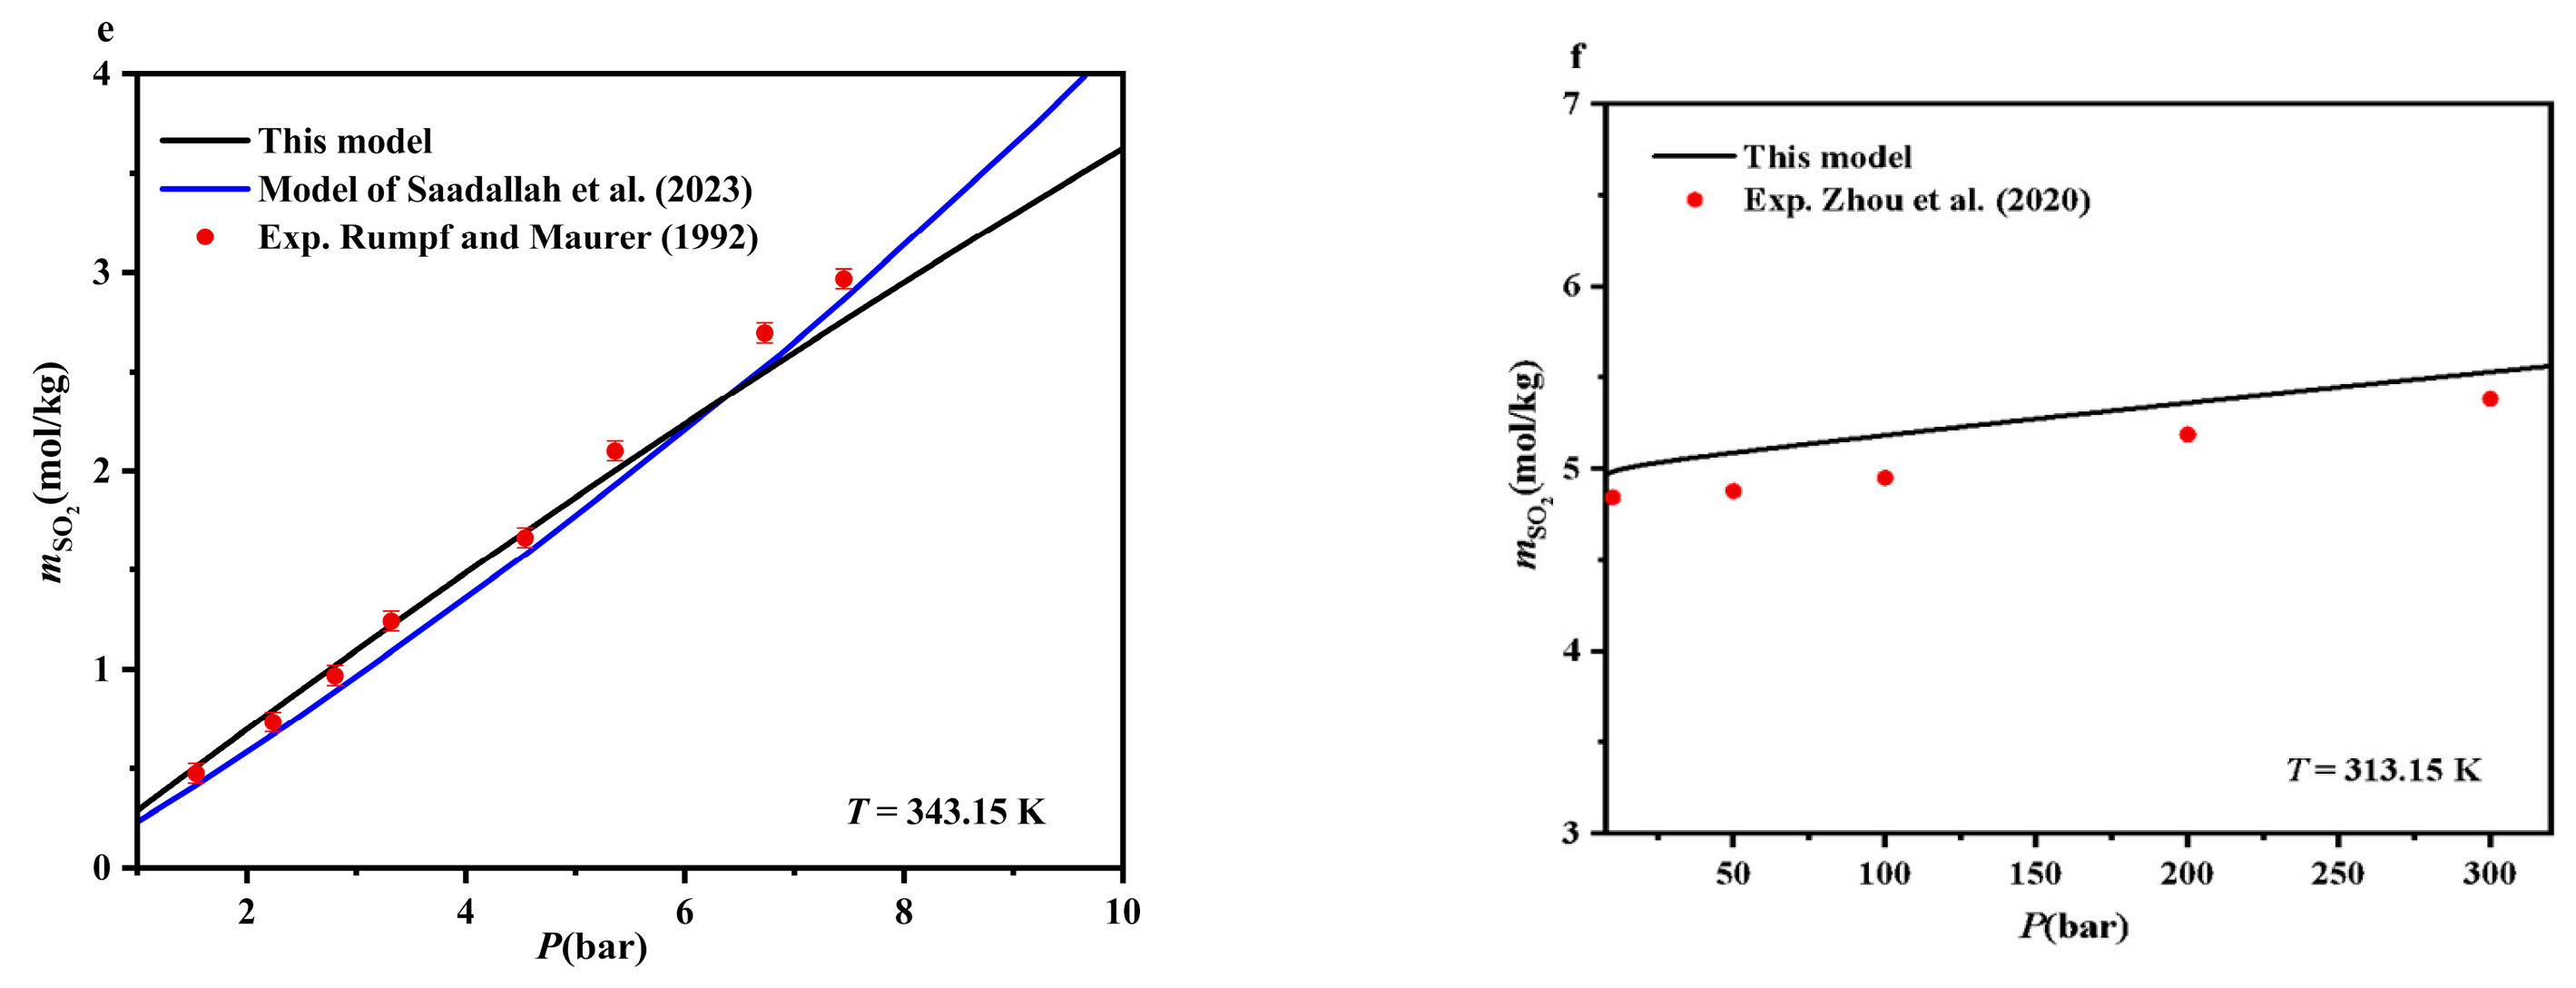
It can be seen in Table 4 and Figure 2 that the SO2 solubility in pure water calculated from this model is in good agreement with most of the experimental data. Although there are large deviations for individual experimental data, such as Bunsen [23], Campbell and Maass [30], Morgan and Maass [31], Beuschlein and Simenson [35], Rabe and Harris [37], Byerley et al. [42], Rumpf and Maurer [43], Zhou et al. [14] and Saadallah et al. [15], the average relative deviation is 5.24%, which is within the experimental uncertainties of solubility (≈7%) [43].
Figure 2b–e shows the comparison between experimental data at 298.15–343.15 K and the calculated solubility curves from this model, Shaw et al. [11] and Saadallah et al. [15]. Figure 2b,c indicates that this solubility model is better than the model of Shaw et al. [11] at high pressures. This model can reproduce most of the experimental data at low pressures, but the model of Saadallah et al. [15] yields somewhat big deviations (Figure 2c–e). In all, the model can reproduce the solubility of SO2 in water up to 423 K and 300 bar.
Figure 2. SO2 solubilities in pure water (models vs. experimental data) [11,14,15,23,24,25,26,27,29,32,39,40,43]. (a) partial pressure of SO2 = 1 atm; (b) T = 298.15 K; (c) T = 313.15 K at low pressures; (d) T = 333.15 K; (e) T = 343.15 K; (f) T = 313.15 K at high pressures. m SO 2 , T and P denote the solubility of SO2, temperature and pressure, respectively.
Applsci 15 03927 g002aApplsci 15 03927 g002b

4.2. SO2-NaCl-H2O Systems

Figure 3a–c shows that the SO2 solubilities in aqueous NaCl solutions calculated from this model are in good agreement with the experimental data. The average absolute deviation of SO2 solubility in an aqueous NaCl solution is 4.84%, within the experimental uncertainties of solubility. Figure 3 shows that the SO2 solubility curve calculated from this model is consistent with the model of Tan et al. [12] at 393.15 K, but this model is more accurate than the model of Tan et al. [12] at 353.215 K and 373.15 K. The model can be applied in the T-P-mNaCl range of 273–400 K, 0–50 bar and 0–6 mol/kg.
Figure 3. SO2 solubilities in aqueous NaCl or KCl solutions (models vs. experimental data) [7,12,27,45]. (a) molality of NaCl = 6 mol/kg; (b) molality of NaCl = 3 mol/kg; (c) T = 278.15 K and P = 1 atm; (d) partial pressure of SO2 = 1 atm and molality of KCl = 4.05 mol/kg. m SO 2 , T and P denote the solubility of SO2, temperature and pressure, respectively. m NaCl and m KCl are the molality of NaCl and KCl.
Applsci 15 03927 g003

4.3. SO2-KCl-H2O Systems

Figure 3d shows that the solubility curve of SO2 in aqueous KCl solutions calculated from this model is in good agreement with the experimental data. The average absolute deviation of SO2 solubility in an aqueous KCl solution is 3.51%, within the experimental uncertainties of solubility. The model can reproduce experimental solubility data from 298 to 308 K with a salinity of 0–4.5 mol/kg at one atmospheric pressure.

4.4. SO2-Na2SO4-H2O Systems

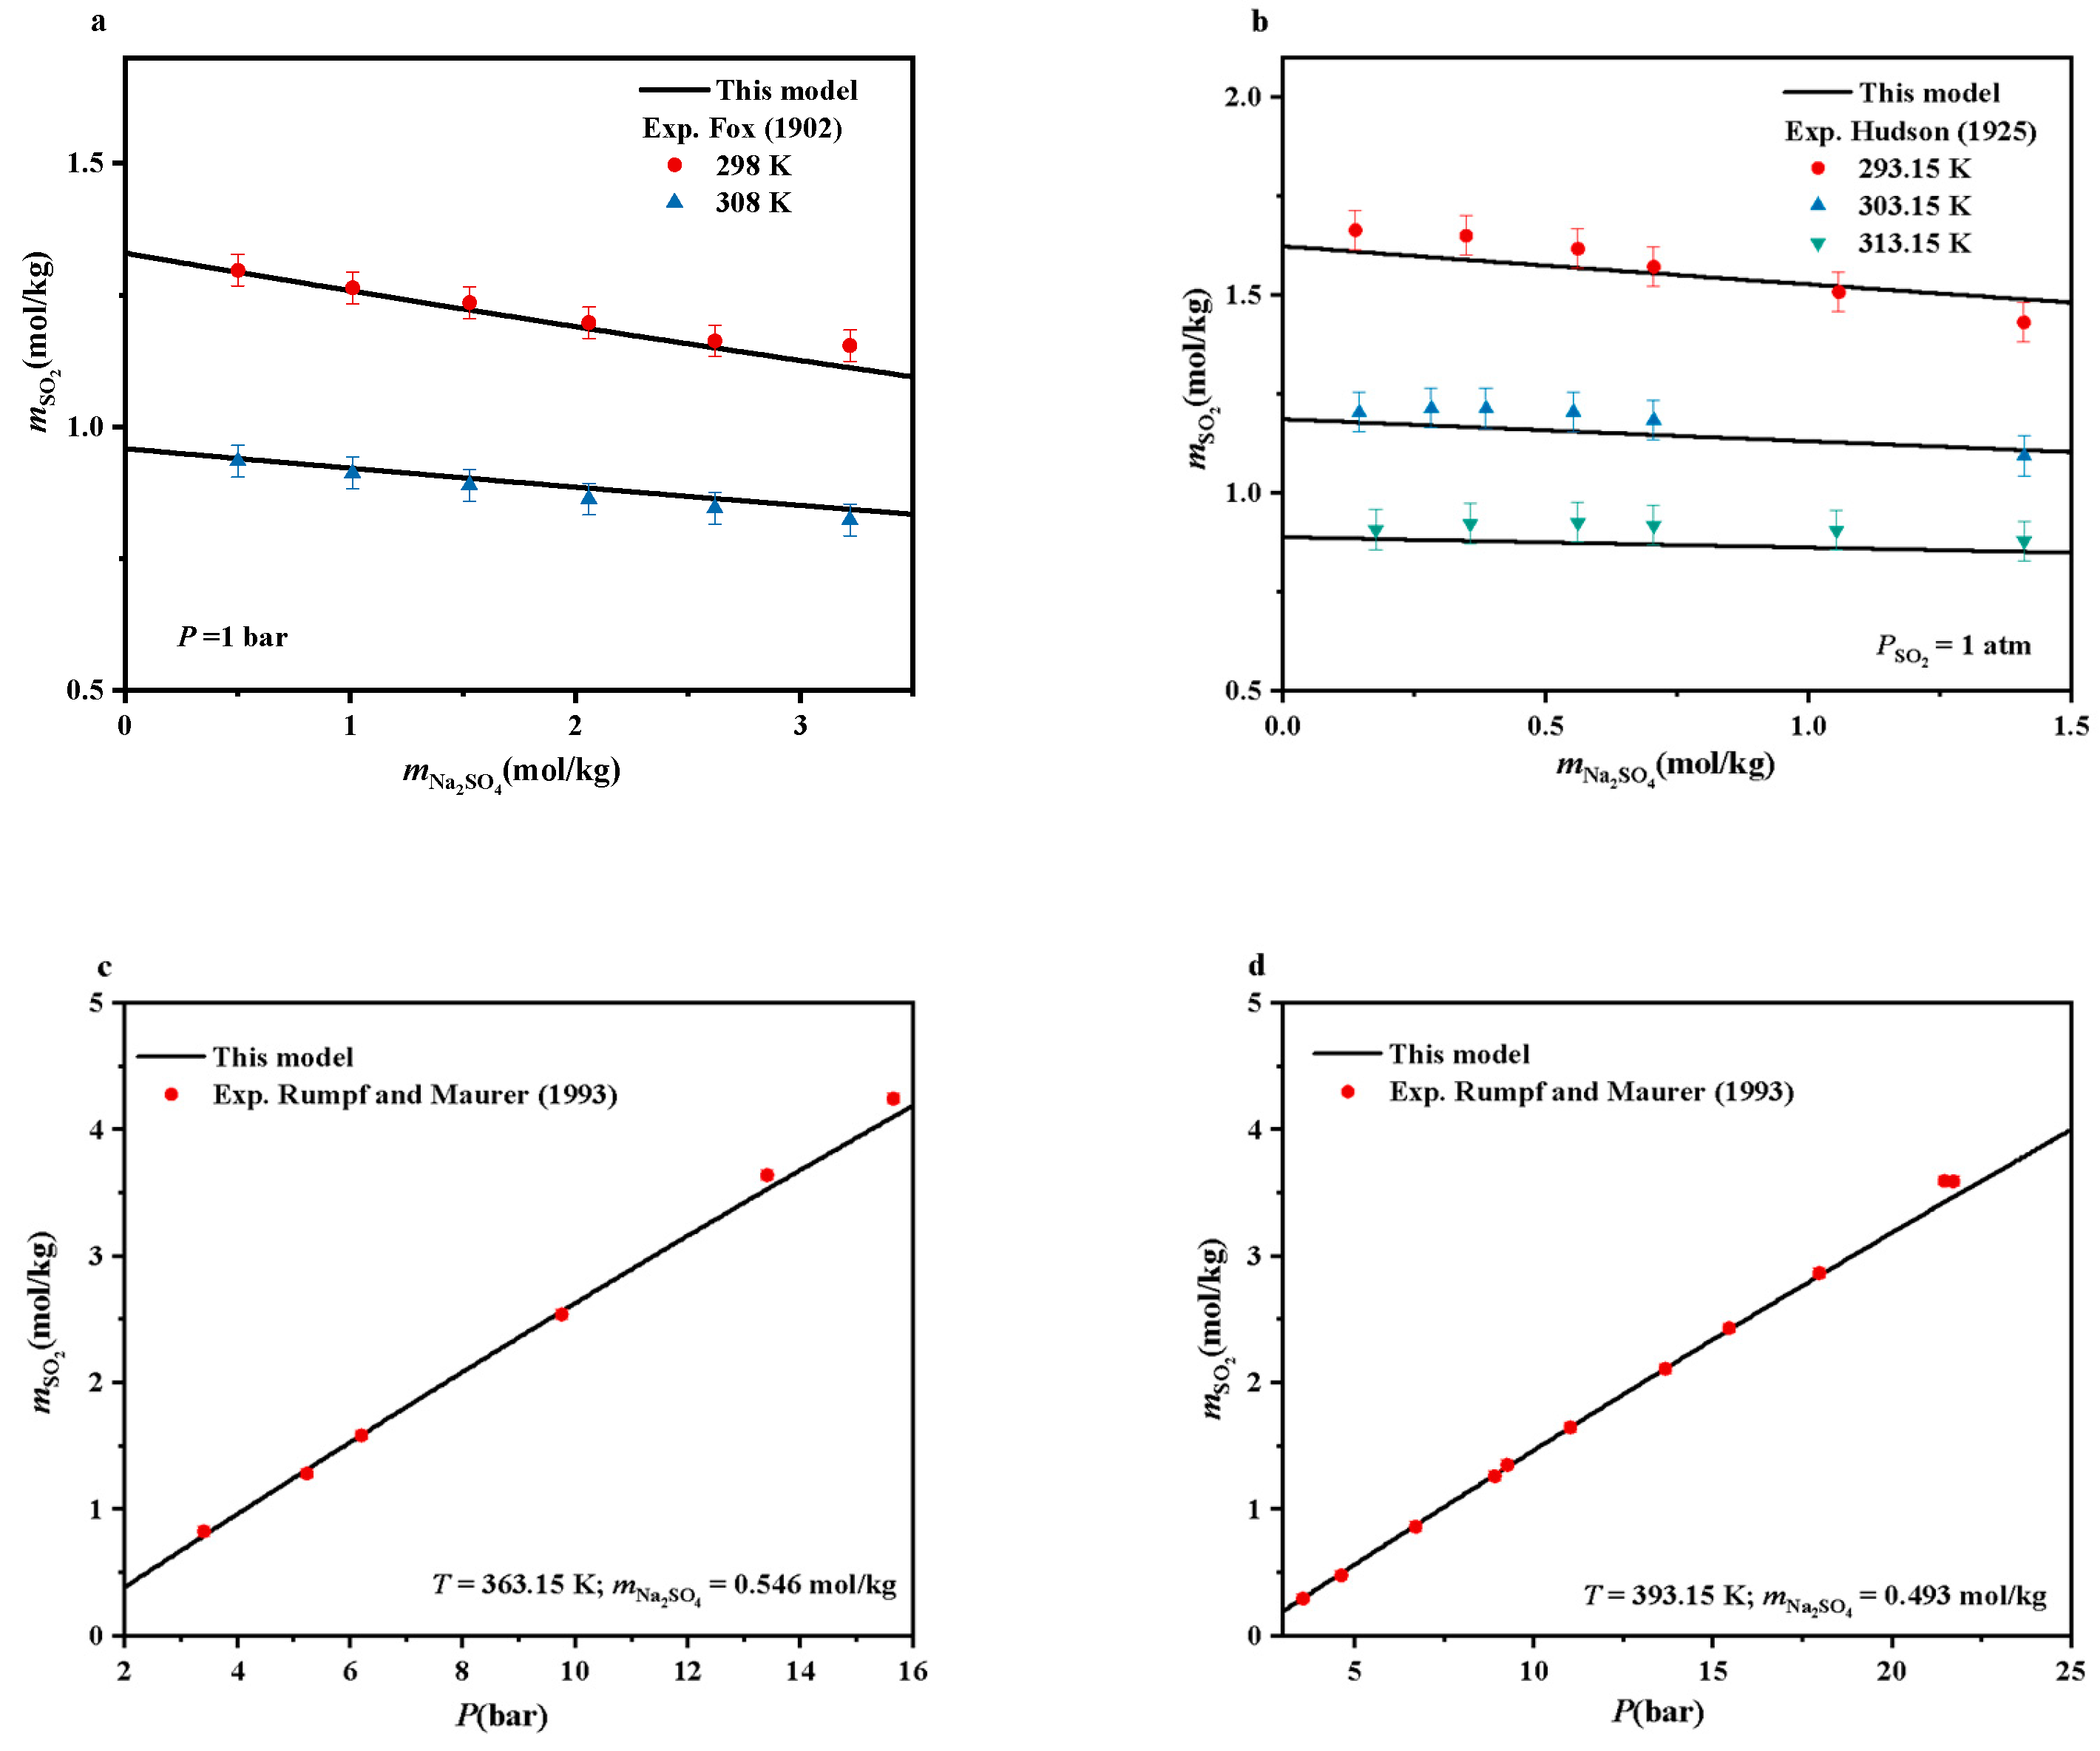
Figure 4 shows that the SO2 solubilities in aqueous Na2SO4 solutions calculated from this model are in agreement with the experimental data. The average absolute deviation of SO2 solubility in an aqueous Na2SO4 solution is 4.55%, which is within experimental uncertainties. On the whole, the model can approximately predict the solubility of SO2 in aqueous Na2SO4 solutions.
Figure 4. SO2 solubilities in aqueous Na2SO4 solutions (models vs. experimental data), [25,27,43]. (a) P = 1 bar; (b) partial pressure of SO2 = 1 atm; (c) T = 363.15 K and molality of Na2SO4 = 0.546 mol/kg; (d) T = 393.15 K and molality of Na2SO4 = 0.493 mol/kg. m SO 2 , T and P denote the solubility of SO2, temperature and pressure, respectively. m Na 2 SO 4 is the molality of Na2SO4.
Applsci 15 03927 g004

5. Applications of the Solubility Model

5.1. Prediction of SO2 Solubility in Seawater

The solubility model of SO2 in multi-ion electrolyte solutions can be used to predict the solubility of SO2 in seawater. The average absolute deviation of our model from experimental SO2 solubility in seawater is about 7.48% (Table 5). It can be seen in Figure 5 that the calculated results are a bit lower than the experimental data. It may be that the experimental solubility data of SO2 in aqueous MgCl2, CaCl2 and K2SO4 solutions have not been found, so the second-order and third-order interaction parameters between SO2 and Mg2+ and Ca2+ cannot be obtained, and they are only approximated as λ CO 2 Ca 2 + , ξ CO 2 Ca 2 + Cl , λ CO 2 Mg 2 + and ξ CO 2 Mg 2 + Cl from Shi and Mao [5].

5.2. Prediction of CO2 Solubility of the CO2-SO2 Mixture in Pure Water

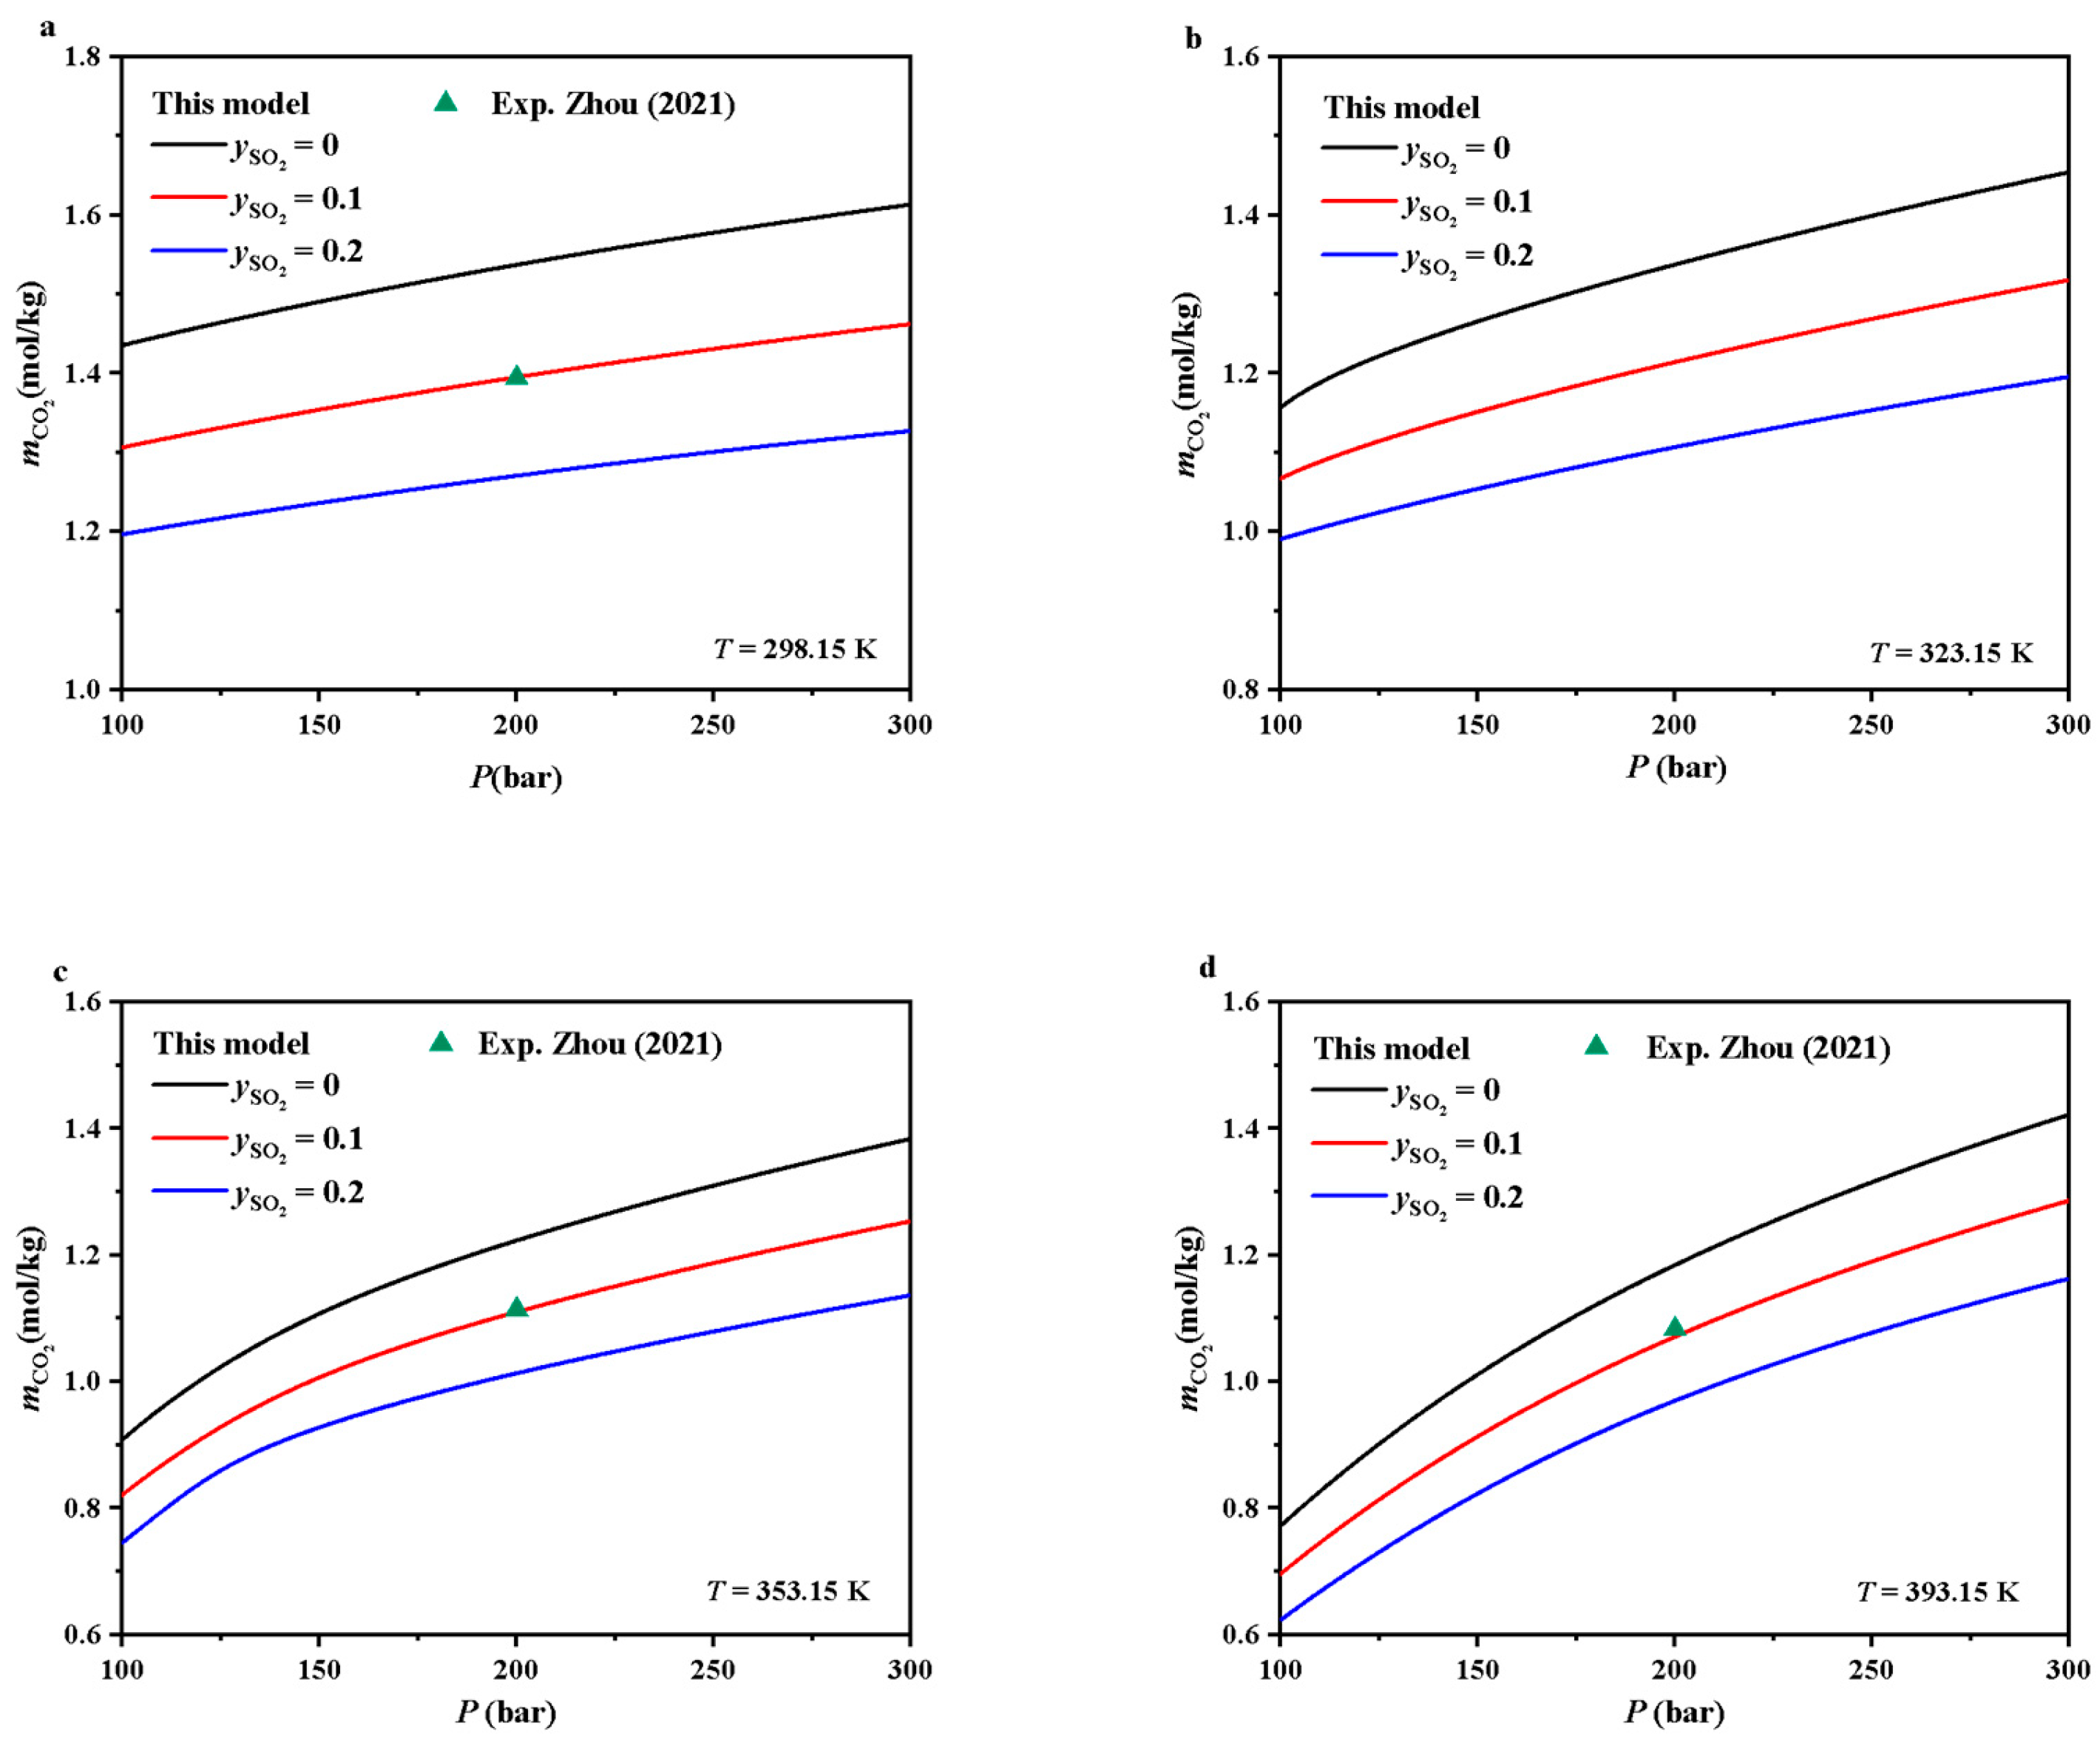
In this work, the fugacity-activity model can be used to predict the solubility of CO2-SO2 mixed gases in multi-ionic electrolyte solutions. If a fugacity coefficient of CO2 or SO2 is calculated from the EOS of CO2-SO2 of Li [48], combining the solubility model of CO2 developed by Shi and Mao [5] and the solubility model of SO2 here, we can calculate the solubility of CO2 and SO2 in multi-ion electrolyte solutions. However, only experimental CO2-SO2 solubility data in pure water have been reported [54]. Figure 6 shows the calculated solubilities of CO2 of CO2-SO2 mixtures in pure water under different T-P conditions. It can be seen in Figure 6 that the CO2 solubilities of CO2-SO2 mixtures in pure water increase with the increase of pressure at the same temperature and mole fraction of SO2, but decrease with the increase of SO2 at the same T-P conditions. The calculated solubilities of CO2 with a 0.1 mole fraction of SO2 are in agreement with the experimental data of Zhou [54] (Figure 6a,c,d).

6. Conclusions

A SO2 solubility model has been developed based on the EOS of pure SO2 and the Pitzer activity coefficient theory. This model can accurately reproduce most of the experimental data with or close to experimental accuracy. Although the second-order and third-order interaction parameters between SO2 and Mg2+ and Ca2+ have been adopted by an approximation, based on the electrolyte solution theory of Pitzer [20], this model can also be used to predict SO2 solubility in seawater. Combined with the EOS of CO2-SO2 fluid mixture, the developed model can approximately predict the solubility of CO2-SO2 mixed gases in more complex brines.
It should be noted that the experimental data on the solubility of SO2 and CO2-SO2 mixtures in aqueous CaCl2, K2SO4 and MgCl2 solutions are still lacking. Experimental studies can be focused on the solubility of these systems in the future.

Author Contributions

Methodology, writing—original draft preparation, validation and visualization: B.F.; methodology, software, formal analysis, investigation, data curation, writing—original draft preparation, validation and visualization: Z.Z.; methodology, writing—review and editing and visualization: M.X.; conceptualization, methodology, formal analysis, investigation, resources, writing—review and editing, supervision, project administration, funding acquisition and validation: S.M. All authors have read and agreed to the published version of the manuscript.

Funding

This research was funded by the National Natural Science Foundation of China grant (Numbers 42073056 and 42430813) and APC was funded by the National Natural Science Foundation of China.

Data Availability Statement

The original contributions presented in this study are included in the article. Further inquiries can be directed to the corresponding author.

Acknowledgments

We thank two anonymous reviewers for their detailed and helpful comments, which improved greatly the quality of the manuscript.

Conflicts of Interest

The authors declare no conflicts of interest.

Abbreviations

List of Symbols
mimolality (mol/kg) of component I in liquid phase
Ptotal pressure, that is P SO 2 + P H 2 O in bar
Parparameter
Runiversal gas constant (83.14472 bar·cm3·mol−1·K−1)
Tabsolute temperature in Kelvin
ximole fraction of component I in liquid phase
yimole fraction of component I in vapor phase
Greek letters
αactivity
φfugacity coefficient
γactivity coefficient
μchemical potential
ρdensity
λ SO 2 - ion interaction parameter
ξ SO 2 - cation - anion interaction parameter
Subscripts
aanion
ccation
saltsalt solution
Superscripts
vvapor
lliquid
(0)standard state

Appendix A. The EOS of Pure SO2

The dimensionless Helmholtz free energy α SO 2 of pure SO2 is divided into two parts:
α SO 2 = α SO 2 0 + α SO 2 r
where α SO 2 0 is the ideal-gas part of the Helmholtz free energy of SO2, α SO 2 r is the residual part of the Helmholtz free energy of SO2.
α SO 2 r = m = 1 6 a m δ i m τ j m + m = 7 14 a m δ i m τ j m e δ k m
where δ = ρ / ρ c , τ = T c / T , ρ c and T c are the critical density and temperature of SO2, ρ is the density, and T is the temperature. The exponents ( i m , j m , k m ) come from Sun and Ely [55], and the values of parameter a m are obtained by fitting it to thermodynamic data of SO2 (Table A1).
The natural logarithm of the fugacity coefficient of pure SO2 ( ln φ ) is calculated from the following equation:
ln φ = P ρ R T 1 ln P ρ R T + α SO 2 r
Table A1. Parameter values of EOS of pure SO2.
m a m i m j m k m
1−1.6617272 × 10−111.50
29.3106614 × 10−110.250
3−1.9592419 × 10011.250
46.1581150 × 10−230.250
51.7701346 × 10−470.8750
6−5.9686148 × 10−421.3750
71.7455469 × 10−3101
82.1284330 × 10−112.3751
95.0982105 × 10−1221
101.0299522 × 10−252.1251
11−2.5336956 × 10−113.52
12−5.4155817 × 10−216.52
13−5.9551762 × 10−244.752
14−1.6326078 × 10−2212.53

References

  1. Guo, J.; Li, F.; Zhang, Z.; Zhang, H.; Li, J.; Wu, K.; He, W. Retrieval of volcanic SO2 emission rate. J. Atmos. Environ. Opt. 2024, 19, 98–110. [Google Scholar]
  2. Wang, S.; Sun, G. Analysis of the relationship among thermal power Generation, coal-fired consumption and sulfur dioxide emission in China during 1991–2007. Resour. Sci. 2010, 32, 1230–1235. [Google Scholar]
  3. Krotkov, N.A.; McClure, B.; Dickerson, R.R.; Carn, S.A.; Li, C.; Bhartia, P.K.; Yang, K.; Krueger, A.J.; Li, Z.; Levelt, P.F. Validation of SO2 retrievals from the Ozone Monitoring Instrument over NE China. J. Geophy. Res.-Atmos. 2008, 113. [Google Scholar] [CrossRef]
  4. Mao, S.; Zhang, D.; Li, Y.; Liu, N. An improved model for calculating CO2 solubility in aqueous NaCl solutions and the application to CO2-H2O-NaCl fluid inclusions. Chem. Geol. 2013, 347, 43–58. [Google Scholar]
  5. Shi, X.; Mao, S. An improved model for CO2 solubility in aqueous electrolyte solution containing Na+, K+, Mg2+, Ca2+, Cl and SO42− under conditions of CO2 capture and sequestration. Chem. Geol. 2017, 463, 12–28. [Google Scholar]
  6. Hunger, T.; Lapicque, F.; Storck, A. Thermodynamic equilibrium of diluted SO2 absorption into Na2SO4 or H2SO4 electrolyte solutions. J. Chem. Eng. Data 1990, 35, 453–463. [Google Scholar]
  7. Xia, J.; Rumpf, B.; Maurer, G. The solubility of sulfur dioxide in aqueous solutions of sodium chloride and ammonium chloride in the temperature range from 313 K to 393 K at pressures up to 3.7 MPa: Experimental results and comparison with correlations. Fluid Phase Equilib. 1999, 165, 99–119. [Google Scholar]
  8. Rodríguez-Sevilla, J.; Álvarez, M.; Díaz, M.C.; Marrero, M.C. Absorption equilibria of dilute SO2 in seawater. J. Chem. Eng. Data 2004, 49, 1710–1716. [Google Scholar]
  9. Mondal, M.K. Experimental determination of dissociation constant, Henry’s constant, heat of reactions, SO2 absorbed and gas bubble–liquid interfacial area for dilute sulphur dioxide absorption into water. Fluid Phase Equilib. 2007, 253, 98–107. [Google Scholar] [CrossRef]
  10. Zimmermann, K.; Pasel, C.; Luckas, M.; Herbell, J.-D. Solubility of sulphur dioxide in aqueous electrolyte solutions at higher ionic strengths-Chloride and bromide containing systems. Fluid Phase Equilib. 2009, 279, 105–114. [Google Scholar] [CrossRef]
  11. Shaw, A.C.; Romero, M.A.; Elder, R.H.; Ewan, B.C.R.; Allen, R.W.K. Measurements of the solubility of sulphur dioxide in water for the sulphur family of thermochemical cycles. Int. J. Hydrogen Energy 2011, 36, 4749–4756. [Google Scholar]
  12. Tan, S.P.; Yao, Y.; Piri, M. Modeling the solubility of SO2 + CO2 mixtures in brine at elevated pressures and temperatures. Ind. Eng. Chem. Res. 2013, 52, 10864–10872. [Google Scholar]
  13. Cox, C.; Pasel, C.; Luckas, M.; Bathen, D. Absorption of SO2 in different electrolyte solutions, seawater and brine. Fluid Phase Equilib. 2015, 402, 89–101. [Google Scholar]
  14. Zhou, Q.; Guo, H.; Yang, P.; Wang, Z. Solubility of SO2 in water from 263.15 to 393.15 K and from 10 to 300 bar: Quantitative Raman spectroscopic measurements and PC-SAFT prediction. Ind. Eng. Chem. Res. 2020, 59, 12855–12861. [Google Scholar]
  15. Saadallah, K.; Lachet, V.; Creton, B.; Caumon, M.-C.; Randi, A.; Sterpenich, J. Solubility study of binary systems containing sulfur dioxide and water: A combination of Raman spectroscopy and Monte Carlo molecular simulation. Fluid Phase Equilib. 2023, 574, 113901. [Google Scholar]
  16. Meissner, H.P.; Kusik, C.L. Activity coefficients of strong electrolytes in multicomponent aqueous solutions. AIChE J. 1972, 18, 294–298. [Google Scholar]
  17. Meissner, H.P.; Tester, J.W. Activity coefficients of strong electrolytes in aqueous solutions. Ind. Eng. Chem. Process Des. Dev. 1972, 11, 128–133. [Google Scholar]
  18. Bromley, L.A. Thermodynamic properties of strong electrolytes in aqueous solution. AICHE J. 1973, 19, 313–320. [Google Scholar]
  19. Bromley, L.A. Approximate individual ion values of β (or B) in extended Debye-Hückel theory for uni-univalent aqueous solutions at 298.15 K. J. Chem. Thermodyn. 1972, 4, 669–673. [Google Scholar] [CrossRef]
  20. Pitzer, K.S. Thermodynamics of electrolytes. I. Theoretical basis and general equations. J. Phys. Chem. 1973, 77, 268–277. [Google Scholar]
  21. Weisenberger, S.; Schumpe, D.A. Estimation of gas solubilities in salt solutions at temperatures from 273 K to 363 K. AIChE J. 1996, 42, 298–300. [Google Scholar] [CrossRef]
  22. Miri, R.; Aagaard, P.; Hellevang, H. Examination of CO2–SO2 solubility in water by SAFT1. Implications for CO2 transport and storage. J. Phys. Chem. B 2014, 118, 10214–10223. [Google Scholar] [CrossRef] [PubMed]
  23. Bunsen, R. Ueber das Gesetz der Gasabsorption. Justus Liebigs Ann. Chem. 1855, 93, 1–50. [Google Scholar] [CrossRef]
  24. Sims, T.H. Contributions to the knowledge of the laws of gas-absorption. Q. J. Chem. Soc. Lond. 1862, 14, 1–22. [Google Scholar] [CrossRef]
  25. Fox, C.J.J. Über die löslichkeit des schwefeldioxyds in wässerigen salzlösungen und seine wechselwirkung mit den salzen. Z. Phys. Chem. 1902, 41, 458–482. [Google Scholar] [CrossRef]
  26. Simth, W.T.; Parkhurst, R.B. The solubility of sulfur dioxide in suspensions of calcium and magnesium hydroxides. J. Am. Chem. Soc. 1922, 44, 1918–1927. [Google Scholar] [CrossRef]
  27. Hudson, J.C. The solubility of sulphur dioxide in water and in aqueous solutions of potassium chloride and sodium sulphate. J. Chem. Soc. 1925, 127, 1332–1347. [Google Scholar] [CrossRef]
  28. Sherwood, T.K. Solubilities of sulfur dioxide and ammonia in water. Ind. Eng. Chem. Res. 1925, 17, 745–747. [Google Scholar] [CrossRef]
  29. Maass, C.E.; Maass, O. Sulfur dioxide and its aqueous solutions. I. Analytical methods, vapor density and vapor pressure of sulfur dioxide. Vapor pressure and concentrations of the solutions. J. Am. Chem. Soc. 1928, 50, 1352–1368. [Google Scholar] [CrossRef]
  30. Campbell, W.B.; Maass, O. Equilibria in sulphur dioxide solutions. Can. J. Res. 1930, 2, 42–64. [Google Scholar] [CrossRef]
  31. Morgan, O.M.; Maass, O. An investigation of the equilibria existing in gas-water systems forming electrolytes. Can. J. Res. 1931, 5, 162–199. [Google Scholar]
  32. Conrad, F.H.; Beuschlein, W.L. Some equilibrium relations in the system calcium oxide-sulfur dioxide-water (acid region) at pressures below atmospheric. J. Am. Chem. Soc. 1934, 56, 2554–2562. [Google Scholar] [CrossRef]
  33. Johnstone, H.F.; Leppla, P.W. The solubility of sulfur dioxide at low partial pressures. The Ionization constant and heat of Ionization of sulfurous acid. J. Am. Chem. Soc. 1934, 56, 2233–2238. [Google Scholar] [CrossRef]
  34. Young, C.L. Sulfur Dioxide, Chlorine, Fluorine and Chlorine Oxides, Solubility Data Series; Pergamon Press: Oxford, UK, 1983. [Google Scholar]
  35. Beuschlein, W.L.; Simenson, L.O. Solubility of sulfur dioxide in water. J. Am. Chem. Soc. 1940, 62, 610–612. [Google Scholar] [CrossRef]
  36. Parkinson, R.V. The solubility of sulfur dioxide in water and sulfuric acid. Tappi J. 1956, 39, 517–519. [Google Scholar]
  37. Rabe, A.E.; Harris, J.F. Vapor liquid equilibrium data for the binary system sulfur dioxide and water. J. Chem. Eng. Data 1963, 8, 333–336. [Google Scholar]
  38. Vosolsobe, J.; Simecek, A.; Michalek, J. Rozpusnost kyslíku siričiného ve vodě. Chem. Prum. 1965, 15, 401. [Google Scholar]
  39. Tokunaga, J. Solubilities of sulfur dioxide in aqueous alcohol solutions. J. Chem. Eng. Data 1974, 19, 162–165. [Google Scholar] [CrossRef]
  40. Lavrova, E.M.; Tudorovskaya, G.L. Solubility of sulfur dioxide in aqueous hydrochloric acid solutions. J. Appl. Chem. USSR 1977, 50, 1102–1106. [Google Scholar]
  41. Douabul, A.; Riley, J. Solubility of sulfur dioxide in distilled water and decarbonated seawater. J. Chem. Eng. Data 1979, 24, 274–276. [Google Scholar] [CrossRef]
  42. Byerley, J.J.; Rempel, G.L.; Thang, V. Solubility of sulfur dioxide in water-acetonitrile solutions. J. Chem. Eng. Data 1980, 25, 55–56. [Google Scholar] [CrossRef]
  43. Rumpf, B.; Maurer, G. Solubilities of hydrogen cyanide and sulfur dioxide in water at temperatures from 293.15 to 413.15 K and pressure up to 2.5 MPa. Fluid Phase Equilib. 1992, 81, 241–260. [Google Scholar] [CrossRef]
  44. Siddiqi, M.A.; Krissmann, J.; Petersgerth, P.; Luckas, M.; Luckas, K. Spectrophotometric measurement of the vapor-liquid equilibris of (sulphur dioxide + water). J. Chem. Thermodyn. 1996, 28, 685–700. [Google Scholar] [CrossRef]
  45. Millero, F.J.; Hershey, J.P.; Johnson, G. The solubility of SO2 of and the dissociation of H2SO3 in NaCl solutions. J. Atmos. Chem. 1989, 8, 377–389. [Google Scholar] [CrossRef]
  46. Rumpf, B.; Maurer, G. Solubility of sulfur dioxide in aqueous solutions of sodium and ammonium sulfate at temperatures from 313.15 K to 393.15 K and pressures up to 3.5 MPa. Fluid Phase Equilib. 1993, 91, 113–131. [Google Scholar]
  47. Denbigh, K. The Principles of Chemical Equilibrium; Cambridge University Press: Cambridge, UK, 1971. [Google Scholar]
  48. Li, X. The Prediction of PVTx and Vapor-Liquid Equilibrium (VLE) Properties of C-H-O-N-S Fluid Mixtures. Master’s Thesis, China University of Geosciences, Beijing, China, 2017. [Google Scholar]
  49. Wagner, W.; Kretzschmar, H. IAPWS industrial formulation 1997 for the thermodynamic properties of water and steam. In International Steam Tables: Properties of Water Steam Based on the Industrial Formulation IAPWS-IF97; Springer Vieweg: Berlin/Heidelberg, Germany, 2008; pp. 7–150. [Google Scholar]
  50. Pitzer, K.S.; Peiper, J.C.; Busey, R.H. Thermodynamic properties of aqueous sodium chloride solutions. J. Phys. Chem. Ref. Data 1984, 13, 1–102. [Google Scholar]
  51. Duan, Z.; Sun, R. An improved model calculating CO2 solubility in pure water and aqueous NaCl solutions from 273 to 533 K and from 0 to 2000 bar. Chem. Geol. 2003, 193, 257–271. [Google Scholar]
  52. Duan, Z.; Sun, R.; Liu, R.; Zhu, C. Accurate thermodynamic model for the calculation of H2S solubility in pure water and brines. Energy Fuels 2007, 21, 2056–2065. [Google Scholar]
  53. Harvie, C.E.; Møller, N.; Weare, J.H. The prediction of mineral solubilities in natural waters: The Na-K-Mg-Ca-H-Cl-SO4-OH-HCO3-CO3-CO2-H2O system to high ionic strengths at 25 °C. Geochim. Cosmochim. Acta 1984, 48, 723–751. [Google Scholar]
  54. Zhou, Q. Quantitative Raman Spectroscopic Investigation on Non-Equilibrium Dissolution and Water-Rock Reaction of SO2-CO2 Co-Injection into Pore Space. Ph.D. Thesis, China University of Geosciences, Wuhan, China, 2021. [Google Scholar]
  55. Sun, L.; Ely, J.F. Universal equation of state for engineering application: Algorithm and application to non-polar and polar fluids. Fluid Phase Equilib. 2004, 222–223, 107–118. [Google Scholar]
Figure 1. SO2 solubility in pure water (experimental data) [23,24,25,27,39,40,41,42].
Applsci 15 03927 g001
Figure 5. SO2 solubilities in seawater (models vs. experimental data) [41]. (a) seawater salinity = 10.065 g/kg; (b) seawater salinity = 20.034 g/kg; (c) seawater salinity = 30.075 g/kg; (d) seawater salinity = 40.005 g/kg. m SO 2 is the solubility of SO2, T is the temperature and P SO 2 is the partial pressure of SO2.
Applsci 15 03927 g005
Figure 6. CO2 Solubilities of CO2-SO2 mixtures in pure water (models vs. experimental data) [54]. (a) T = 298.15 K; (b) T = 323.15 K; (c) T = 353.15 K; (d) T = 393.15 K. m CO 2 , T and P denote the solubility of SO2, temperature and pressure, respectively. y SO 2 is the mole fraction of SO2 in vapor phase.
Applsci 15 03927 g006
Table 1. Thermodynamic models for calculating SO2 solubilities in pure water, aqueous salt solutions or seawater.
ReferencesSaltT (K)P (bar) m salt (mol/kg)
Hunger et al. [6]H2SO4, Na2SO4298–32310−4–0.10-saturation
Xia et al. [7]NaCl, NH4Cl313–3930–370–6
Rodríguez-Sevilla et al. [8]seawater278.15–318.150.976unstated
Mondal [9]water293–3330–0.01 *0
Zimmermann et al. [10]HCl, NaCl, HBr, NaBr2981.0150–4.613
Shaw et al. [11]water298–3130.2–3.60
Tan et al. [12]water, NaCl313–3930–400–6
Cox et al. [13]seawater, brine298.15–323.15unstated0–1
Zhou et al. [14]water263.15–393.1510–3000
Saadallah et al. [15]water293–3930–250
Notes: T, P and m salt denote the temperature, pressure and molality of salt, respectively; * is the partial pressure of SO2.
Table 2. SO2 solubility measurements in pure water and aqueous single-salt solutions.
ReferencesSolutionT (K)P (bar)Nd
Bunsen [23]water273.00–313.001+41
Sims [24]water281.20–323.201+22
Fox [25]water298.20–308.201+2
Simth and Parkhurst [26]water278.20–333.200.20–1.608
Hudson [27]water283.15–363.151+42
Sherwood [28]water273.15–323.150.00–1.00109
Maass and Maass [29]water283.20–300.200.00–3.5029
Campbell and Maass [30]water298.15–383.150.14–4.5055
Morgan and Maass [31]water273.00–298.000.00–1.2038
Conrad and Beuschlein [32]water298.200.40–1.006
Johnstone and Leppla [33]water298.20–323.200.00–0.2016
Young [34]water373.00–423.001.70–7.2022
Beuschlein and Simenson [35]water296.40–386.150.12–2.1153
Parkinson [36]water263.00–294.000.00–0.0642
Rabe and Harris [37]water303.15–353.150.09–1.2043
Vosolsobe et al. [38]water293.20–333.200.04–0.3435
Tokunaga [39]water283.15–313.151+4
Lavrova and Tudorovskaya [40]water299.15–363.151+5
Douabul and Riley [41]water278.97–303.251+6
Byerley et al. [42]water298.15–323.151+2
Rumpf and Maurer [43]water293.14–393.330.35–25.0966
Siddiqi et al. [44]water291.05–294.450.02–0.0350
Mondal [9]water293.00–333.000.02–0.2120
Shaw et al. [11]water297.05–312.250.25–1.963
Cox et al. [13]water298.15–323.150.00–0.1219
Zhou et al. [14]water273.15–373.1510.00–300.0045
Saadallah et al. [15]water293.15–353.150.00–12.0045
m NaCl (mol/kg)
Fox [25]0.50–3.22298.00–308.001+6
Millero et al. [45]0.01–6.00278.15–298.151+17
Xia et al. [7]2.90–6.00313.15–393.150.30–37.0090
Zimmermann et al. [10]0.49–4.28298.150.00–0.3037
Cox et al. [13]1.00298.15–323.150.03–0.1219
m KCl (mol/kg)
Fox [25]0.00–0.05298.00–308.001+12
Hudson [27]0.50–4.40298.00–308.001+43
Cox et al. [13]0.05–1.00298.15–323.151.0019
m Na 2 SO 4 (mol/kg)
Fox [25]0.50–3.22298.00–308.00112
Hudson [27]0.13–1.41293.15–313.151+23
Rumpf and Maurer [46]0.50–1.00313.15–393.151.00–28.0065
Notes: T, P and m salt denote the temperature, pressure and molality of salt, respectively; Salt stands for NaCl, KCl and Na2SO4, respectively; Nd is the number of experimental data. 1+ is the partial pressure of SO2.
Table 3. Interaction parameters for SO2 solubility.
T-P
Coefficient
μ S O 2 l ( 0 ) / R T λ S O 2 - N a + ξ S O 2 - N a + - C l
c10.13245076 × 102−0.11148943 × 1010.2296582 × 10−4
c2−0.69839713 × 10−40.18138955 × 10−4
c3−0.34267139 × 1040.17449283 × 103
c40.48022032 × 10−7−0.69223494 × 10⁻⁷
λ SO 2 - K + λ SO 2 - S O 4 2
c10.14460352 × 1010.46735219 × 101
c2−0.019673290 × 10⁻⁵−0.079666020 × 10⁻⁵
c3−0.27249399 × 10³−0.68220367 × 10³
* λ SO 2 - M g 2 + * ξ SO 2 - M g 2 + - C l
c11.6528428 × 10−1−1.152724 × 10⁻²
c21.4572839 × 10−4
* λ SO 2 - C a 2 + * ξ SO 2 - C a 2 + - C l
c1−5.513825 × 10−14.2222945 × 10−3
c21.0502705 × 10−3−4.44659191 × 10⁻⁵
c31.3349619 × 102
c4−1.9361945 × 10⁻⁴
c58.9529014 × 10−7
c6−3.5780857 × 10⁻¹⁰
Note: * denotes that λ SO 2 Ca 2 + , ξ SO 2 Ca 2 + Cl , λ SO 2 Mg 2 + and ξ SO 2 Mg 2 + Cl are approximated as λ CO 2 Ca 2 + , ξ CO 2 Ca 2 + Cl , λ CO 2 Mg 2 + , and ξ CO 2 Mg 2 + Cl [5], respectively.
Table 4. Calculated deviations of SO2 solubilities in pure water and aqueous single-salt solutions.
ReferencesT (K)P (bar)msalt (mol/kg)NdAAD (%)MAD (%)
Bunsen [23]273.00–313.001+0413.5816.39
Sims [24]281.20–323.201+0222.65−6.77
Fox [25]298.20–308.201+023.62−5.76
Simth and Parkhurst [26]278.20–333.200.20–1.60084.72−7.39
Hudson [27]283.15–363.151+0422.91−5.43
Maass and Maass [29]283.20–300.200.00–3.500292.53−5.67
Campbell and Maass [30]298.15–383.150.14–4.500556.95−15.82
Morgan and Maass [31]273.00–298.000.00–1.200226.75−16.90
Conrad and Beuschlein [32]298.200.40–1.00062.03−3.03
Young [34]373.00–423.001.70–7.20096.3013.72
Beuschlein and Simenson [35]296.40–386.150.12–2.110515.44−17.55
Rabe and Harris [37]303.15–353.150.09–1.200394.79−15.76
Tokunaga [39]283.15–313.151+043.78−6.76
Lavrova and Tudorovskaya [40]299.15–363.151+052.043.48
Douabul and Riley [41]278.97–303.251+065.53−10.35
Byerley, et al. [42]298.15–323.151+0211.3715.30
Rumpf and Maurer [43]293.14–393.330.35–25.090556.04−17.19
Zhou et al. [14]273.15–373.1510.00–300.000348.11−21.46
Saadallah et al. [15]293.15–353.150.00–12.000366.98−19.08
m NaCl (mol/kg)
Fox [25]298.00–308.001+0.50–3.2261.463.64
Millero et al. [45]278.15–298.151+0.01–6.00174.52−13.96
Xia, et al. [7]313.15–393.150.30–37.002.90–6.00575.33−14.11
m KCl (mol/kg)
Fox [25]298.00–308.001+0.00–0.051211.53−21.56
Hudson [27]298.00–308.001+0.50–4.40431.28−4.6
m Na 2 SO 4 (mol/kg)
Fox [25]298.00–308.0010.50–3.22121.463.64
Hudson [27]293.15–313.151+0.13–1.41183.45−5.73
Rumpf and Maurer [46]313.15–393.151.00–28.000.50–1.00356.1818.07
Notes: T, P and msalt denote the temperature, pressure and molality of salt, respectively; Nd is the number of experimental data; AAD is the average absolute deviation calculated from this model; MAD is the maximal absolute deviation calculated from this model. 1+ is the partial pressure of SO2.
Table 5. Calculated deviations of SO2 solubilities in seawater.
SystemReferenceT (K)P (bar) m Seawater
(g/kg)
NdAAD (%)MAD (%)
SO2-SeawaterDouabul and Riley [41]278.97–303.251+10.00–40.00247.4812.75
Notes: T, P and m Seawater denote the temperature, pressure and salinity of seawater, respectively; Nd is the number of experimental data; AAD is the average absolute deviation calculated from this model; MAD is the maximal absolute deviation calculated from this model. 1+ is the partial pressure of SO2.
Disclaimer/Publisher’s Note: The statements, opinions and data contained in all publications are solely those of the individual author(s) and contributor(s) and not of MDPI and/or the editor(s). MDPI and/or the editor(s) disclaim responsibility for any injury to people or property resulting from any ideas, methods, instructions or products referred to in the content.