Article

The Importance of Dunnian Runoff in Atlantic Forest Remnants: An Integrated Analysis Between Machine Learning and Spectral Indices

by
Alarcon Matos de Oliveira
1,*,
Mara Rojane Barros de Matos
1,
Marcos Batista Figueiredo
1 and
Lusanira Nogueira Aragão de Oliveira
2
1
Department of Exact and Earth Sciences II DCET II, State University of Bahia UNEB, Alagoinhas/Salvador Highway, BR110, Km 03, Alagoinhas 48000-000, BA, Brazil
2
Faculty of Philosophy, Letters, and Human Sciences, University of São Paulo (FFLCH-USP), Professor Lineu Prestes Avenue, 338 University City, São Paulo 05508-000, SP, Brazil
*
Author to whom correspondence should be addressed.
Appl. Sci. 2025, 15(7), 3977; https://doi.org/10.3390/app15073977
Submission received: 22 August 2024 / Revised: 10 October 2024 / Accepted: 19 October 2024 / Published: 4 April 2025

Abstract

:
This study investigated Dunnian runoff in the Sauípe River basin, Bahia, Brazil, analyzing the relationship between soil moisture, terrain slope, and land use. It utilized Landsat satellite images, annual water balance data, and rainfall data from the last 10 days. The Normalized Difference Water Index (NDWI) and Normalized Difference Vegetation Index (NDVI) were calculated, along with image classification using the Random Forest machine learning algorithm. (1) Saturated zones with potential for Dunnian runoff were identified, especially on steeper slopes, with a notable negative influence of eucalyptus on soil moisture, except in areas with steeper slopes. (2) Dunnian runoff was predominantly observed from the middle course to the mouth, following the east-west direction of the watershed. (3) Higher areas exhibited Dunnian runoff with high soil moisture values, while areas with less steep slopes showed low moisture levels. (4) The results indicate a positive correlation between steeper slopes and Dunnian runoff and a negative correlation between eucalyptus plantations and soil moisture. (5) Forest fragments exhibited high NDVI and NDWI values, suggesting dense forests with high moisture, especially in areas with steep slopes. This suggests that forest fragments are in good moisture conditions, acting to delay Dunnian runoff. (6) In areas with savannization or without vegetation, significant moisture content was not observed, indicating the absence of intense rainfall in the last ten days of image acquisition. This confirms the importance of this runoff for forest remnants.

1. Introduction

The preservation of the Atlantic Forest is a significant challenge, particularly due to Brazil’s colonization model, which expanded from the coast inland, resulting in the settlement of coastal regions where much of this biome is located. Consequently, areas with the highest population density coincide with the presence of the Atlantic Forest, which has undergone a drastic reduction, with less than 12% of its original cover remaining [1]. The loss of these forested areas is considered one of the main causes of the global decline in biodiversity and ecosystem services, which directly depend on the diversity of genes, species, and ecosystems [2]. Given this scenario of extreme devastation, constant monitoring of these areas through efficient and accurate methods is essential. In this context, satellite imagery and digital image processing gain relevance, allowing for robust and low-cost mapping, ideal for analyzing complex biomes such as the Atlantic Forest.
Remote sensing technologies, such as the use of satellite images, play a fundamental role in monitoring important hydrological processes, especially in fragmented biomes like the Atlantic Forest. One of these processes is Dunnian runoff, also known as saturation overland flow. This phenomenon occurs in areas where the soil reaches its maximum infiltration capacity, becoming saturated with water after intense precipitation. Dunnian runoff typically begins in riparian zones, areas close to watercourses where the water table is shallow, and is particularly common in areas with steep slopes. The importance of this runoff lies in its ability to significantly influence the hydrological dynamics and behavior of watercourses in watersheds, many of which are located in the Atlantic Forest.
With the use of satellite images, it is possible to accurately map and monitor these saturated areas, providing a detailed view of the interactions between terrain and vegetation. This includes analyzing how the remaining fragments of the Atlantic Forest impact the behavior of Dunnian runoff. This type of monitoring is essential for developing conservation strategies, helping to better understand the role of native vegetation and the impact of biome fragmentation on hydrological processes, and offering support for more sustainable and effective environmental management practices.
It is widely recognized that wetlands play a crucial ecological role, and with their importance is globally acknowledged by the scientific community [3]. Wetlands are among the most significant, dynamic, and diverse ecosystems on the planet, characterized by a unique combination of land and water in both inland and coastal environments [3]. The study of these areas becomes even more essential, given that they are increasingly being degraded [4]. Significant studies have been conducted in various regions of the world using spectral indices, machine learning, and hydrology to analyze wetlands. One example is the work by [3], which employed unsupervised machine learning algorithms (K-means—KMC) and supervised (Support Vector Machine classifier—SVMc) applied to Landsat images to model NDVI and NDWI in the Selisoo Bog area, Estonia. The researchers concluded that the bog areas stood out in terms of coverage over the swamp.
Another relevant study was conducted by [5], who used MODIS sensor images to analyze land cover changes in the Poyang Lake wetlands, China. The authors applied vegetation indices, the ISODATA method to cluster the detected differences, and decision trees to classify the data. They concluded that the classification was effective in mapping this ecosystem. Other works focusing on wetlands and remote sensing, particularly incorporating machine learning, include the study by [6], which investigated the health of wetlands in the moribund delta region of India. Using machine learning and deep learning algorithms, the authors found that the algorithms performed well and observed that the wetlands are shrinking, with areas farther from river channels becoming increasingly degraded.
Wetlands cover approximately 6% of the Earth’s surface, providing habitat for various species and contributing around 40% of global ecosystem services [6,7,8]. Ecosystem services provided by these areas include food supply, freshwater, forage, genetic and medicinal materials, as well as regulatory services such as local microclimate control, air purification, water flow regulation, nutrient cycling, soil fertility renewal, pollination, erosion prevention, and flood control, among others [6,9,10,11].
The reduction of vegetation negatively impacts the water surface, as water conservation is an essential service provided by forests. However, there is a lack of studies investigating the importance of Dunnian runoff in forests, especially in tropical ones that have suffered intense devastation. A search in Google Scholar and Science Direct using the terms “Dunnian runoff and forest” did not return any research directly studying this correlation, with most studies focusing on hydrological flows. This runoff, crucial for water recharge and soil moisture maintenance, is underestimated [12]. With the degradation of tropical forests, understanding this phenomenon is vital for conservation and environmental recovery strategies, highlighting a critical gap in current environmental research.
Therefore, this research aimed to demonstrate the importance of Dunnian runoff in the maintenance, conservation, and preservation of the remnants of the Atlantic Forest. To achieve this objective, a small watershed located on the northern coast of the state of Bahia was chosen as the pilot area. Based on fieldwork, satellite images were used for land use classification employing the Random Forest algorithm. We calculated the Normalized Difference Vegetation Index (NDVI) and the Normalized Difference Water Index (NDWI) to assess vegetation concentration and soil moisture. We also used the Digital Terrain Model (DTM) to identify areas with steeper slopes and flat areas, as pointed out by [13]. By comparing spectral indices, land use classification, and DTM, we analyzed the relationship between forest fragments and Dunnian runoff, highlighting hydrological interactions in vegetation within the context of the studied basin.
The analyses identified saturated zones with potential for Dunnian runoff, especially in areas with steep slopes, occurring predominantly from the middle course to the mouth of the watershed. Higher areas showed high soil moisture levels, while lower slope areas showed low moisture [14,15]. The results indicate a positive correlation between steeper slopes and Dunnian runoff and a negative correlation between eucalyptus plantations and soil moisture. Forest fragments with high NDVI and NDWI values suggest a positive correlation between dense vegetation and high moisture. Areas with savannization, silviculture, or no vegetation did not show high moisture levels, indicating a negative correlation.
Within a watershed, areas can exhibit runoff originating from four different flow paths driven by two distinct mechanisms. The first occurs when infiltration capacity is exceeded, and the second results from complete soil saturation [16,17,18,19,20].
Riparian zones, three-dimensional ecotones, are characterized by soil saturation, primarily due to a shallow water table for most of the year. These zones are critical to the watershed for their ecological role in biodiversity, hydrology, and promoting favorable soil conditions [21]. Also known as riparian zones, their delineation can be achieved by identifying typical vegetation of saturated areas or visual soil characteristics, such as color and type [21].
These locations maintain saturated layers at reduced depths, usually near natural watercourses and gently sloping valleys [3,7], facilitating a specific runoff type known as saturated overland flow. This behavior is described by the Dunnian mechanism (Figure 1) [20,22].
This mechanism, as proposed by [23], implies that precipitation in the higher regions of the basin infiltrates into the soil, increasing local moisture and propagating saturation to downstream areas. Thus, subsurface flow, rainfall, and initial soil moisture play crucial roles in expanding or contracting the saturated zone and drainage network (Figure 2) of the basin, making it a sensitive area of fragile hydrological balance, as highlighted by [24,25]. These complex interactions among hydrological components delineate the hydrogeological dynamics of the basin, influencing hydraulic behavior over time.
In addition, transmission is non-uniform throughout the basin, and [26] uses the term ‘near-surface flow’ to treat them collectively due to the difficulty in separating them in some situations.
Thus, the Dunnian mechanism highlights the importance of riparian zones and surface runoff in the hydrological dynamics of watersheds. Riparian zones, located along watercourses, are areas of saturated soil, often with shallow groundwater tables. They play a vital role in regulating water flow, filtering nutrients and sediments, and supporting aquatic biodiversity [27]. The Dunnian mechanism illustrates how precipitation in the higher areas of the basin infiltrates the soil, increasing local moisture and gradually propagating to lower areas, saturating the soil in this process [15]. This saturation creates conditions for surface runoff, where excess water flows over the soil surface into watercourses [3,8,15]. This directly influences water availability, affecting both base flow and flood events in rivers [28]. Understanding the Dunnian mechanism is essential for developing effective watershed management strategies, ensuring the sustainability of water resources, and protecting riparian ecosystems.

2. Materials and Methods
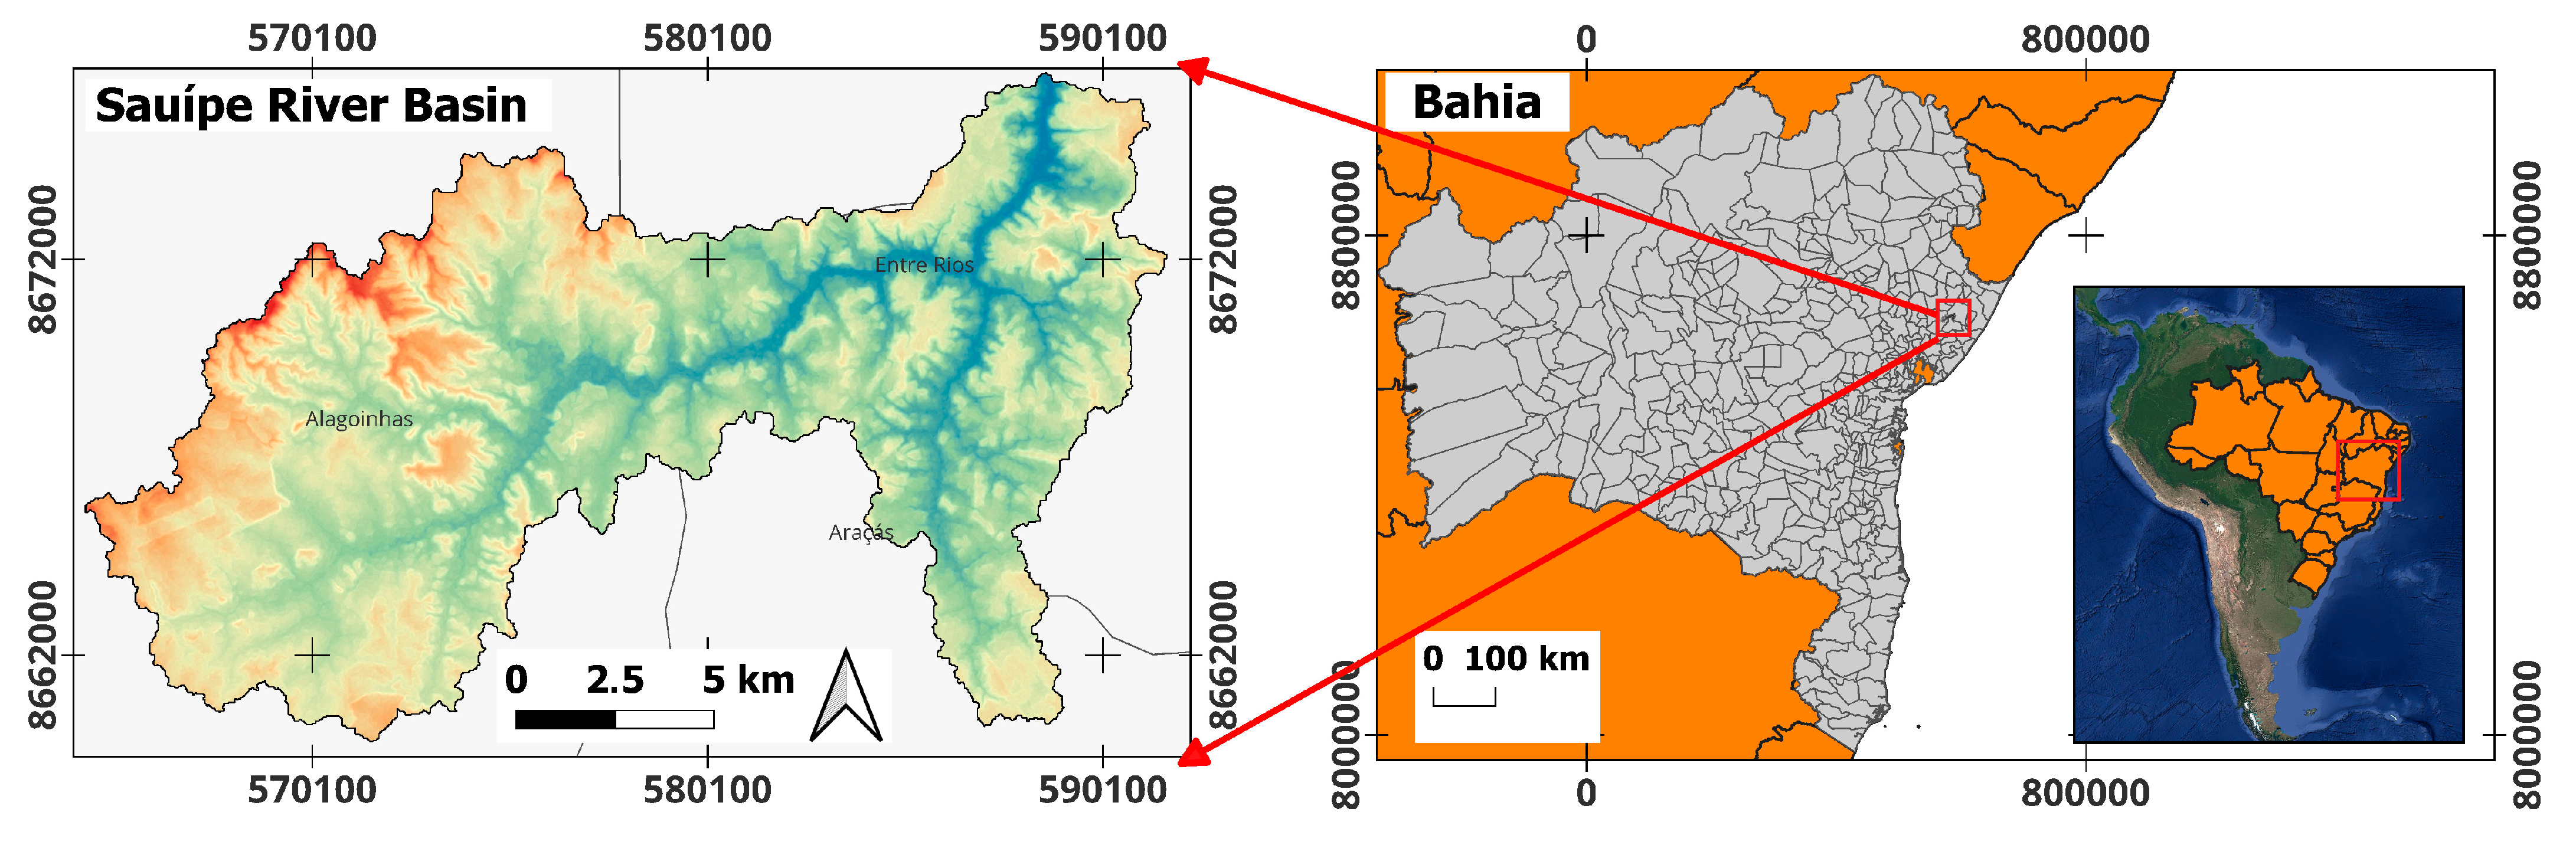
2.1. Materials

This research was conducted in a test area within the Sauípe River basin (Figure 3), located in northeastern Brazil, characterized by the presence of the Atlantic Forest, although fragmented. It covers an area of approximately 23,198.48 hectares, located between the UTM coordinates 564362.36 and 8659814.07, in the DATUM WGS84 system, zone 24S. The basin spans the municipalities of Entre Rios, Araçás, and Alagoinhas, with most of it situated in the latter. The local landscape consists of a mosaic of vegetation types, such as Cerrado, Semideciduous Seasonal Forest, and Dense Ombrophilous Forest, in addition to transitional areas with varying canopy openings. The region is surrounded by an agricultural matrix and eucalyptus cultivation areas [29]). The Sauípe River, with an approximate length of 40 km, flows through the municipalities of Alagoinhas, Araçás, and Entre Rios. In many sections, the river is dry and lacks riparian vegetation, indicating degradation of the riparian environment. Its main tributary is the Encantado Creek, along with several smaller streams.
The climate in the region ranges from humid to subhumid, with an average annual temperature of 24.7 °C and precipitation ranging from 1200 to 1800 mm, with lower rainfall values found in the eastern portion of the basin [28]. The predominant soils in the Sauípe River basin are Latossolos and Argissolos. Latossolos are deep, well-drained soils with low natural fertility due to intense leaching, a typical feature of humid climates. Argissolos, on the other hand, have a leached surface horizon and a clay-rich subsoil, making them low in fertility and prone to erosion [28]. The altitude in the basin ranges from 150 m to sea level, with the Recôncavo and Tucano sedimentary basins being predominant, alongside smaller tertiary deposits. The geomorphological formation of the region is characterized by the coastal plateaus, derived from continental sediments from the Tertiary Period, composed of sandy, sandy-clayey sediments, and pebbles, ranging from unconsolidated to slightly consolidated [30]. The terrain is highly dissected, with strongly undulating hills and convex, tabular hilltops [29].
The following materials were necessary for this research: Landsat 08 image dated 16 October 2020, obtained from USGS 2021, with WGS 84 projection system, zone 24 South. ALOS PALSAR L-band image, dated 19 November 2009, was also used. We also utilized meteorological data from the Alagoinhas station provided by [31]; the data pertain to the annual water balance for a soil storage capacity typical of oxisols, which predominate in the studied watershed.

2.2. Methods

2.2.1. Random Forest

The Random Forest (RF) classifier consists of an ensemble classifier that generates multiple decision trees using randomly selected subsets of training data variables. The RF classifier uses a set of Supervised Regression Tree Classifiers (CARTs) to make predictions, thus overcoming the weaknesses of a single decision tree [32,33,34,35]. The trees are created by drawing a subset of training samples with replacement (a bagging approach), meaning the same sample can be selected multiple times while another may not be used [33]. Approximately two-thirds of the samples (referred to as in-bag samples) are used to train the trees, and the remaining one-third (referred to as out-of-bag samples) are used for internal cross-validation, a technique to estimate the RF model’s performance [32,33,35].
The Random Forest classifier uses the Gini index as a measure of feature selection, which quantifies the impurity of a specific attribute relative to the classes [36]. The Gini index is discussed in [32]. For a given training set T , randomly selecting a case, which in our work consists of pixels, and indicating that these pixels belong to some class C i , the Gini index can be written as:
j i f C i ,   T / T f C j , T / T
where f(Ci, T)/|T| is the probability that the selected case belongs to class Ci every time the tree grows to a maximum depth on new training data using a combination of features [35]. These fully grown (uncut) trees are not pruned [33,36], which is the main advantage of the RF model. A detailed discussion on the topic can be found in [32,33,34,35,37].
Given the training vectors xiRn, I = 1,…, and a label vector yR1, a decision tree recursively partitions the spaces so that samples with the same labels or similar target values are grouped together [31,37]. Let node m represent data Qm with Nm samples. For each split of candidate trees θ = (j, tm) consisting of a feature j threshold tm, partition the data into Q m l e f t (θ) and Q m r i g h t (θ) subsets [37]:
  Q m l e f t θ = x ,   y | x j < t m Q m r i g h θ = Q m \ Q m l e f t θ
The quality of a candidate split at node m is then calculated using a sample impurity function or loss function H(), the choice of which depends on the task to be solved (classification or regression) [38]:
G Q m , θ = N m l e f t N m H Q m l e f t θ + N m r i g h t N m H Q m r i g h t θ
Select the parameters that minimize impurities:
θ   = a r g m i n θ G Q m , θ
Feature for subsets Q m l e f t and Q m r i g h t until reaching the maximum allowed depth, N m < m i n s a m p l e s or Nm = 1.
Consider the decision tree a classifier, assuming values 0, 1,…, K − 1, for node m, consider [38].
p m k = 1 / N m y Q m I y = k
Let the proportion of observations of class k at node m be a terminal node, as this region is defined as pmk. Common measures of impurity include the following, the Gini index [38]:
H Q m = k p m k 1 p m k  
The entropy is given by [37]:
H Q m = k p m k log p m k
and the misclassification rate is given by [37]:
H Q m = 1 max p m k

2.2.2. Spectral Indices: NDVI and NDWI

The Normalized Difference Vegetation Index (NDVI) is widely used in detecting and quantifying green plant biomass through the reflectance of their leaves captured by remote sensors in the visible and near-infrared spectral bands. This index rescales the image to vary between 1 and −1 [39]. When values are in the positive domain between 0 and 1, it indicates the presence of vegetation such as crops, shrubs, grasslands, and forests. Therefore, higher NDVI values indicate vigorous green vegetation cover [40,41]. In contrast, negative values (0 to −1) correspond to other land uses, such as rocks, water, and exposed soil, where vegetation is absent [42]. The index can be calculated using the following equation [41,42,43]:
N D V I = N I R R E D N I R + R E D
where NIR is the near-infrared spectral band, reflecting between 0.85 µm and 0.88 µm, and RED is the red visible band, reflecting between 0.64 µm and 0.67 µm. To perform this calculation, bands 04 (reflecting in red) and 5 (reflecting in near-infrared) of Landsat 08 were used.
The NDWI (Normalized Difference Water Index), adopted the model by Gao, where its mathematical expression was defined by [43]:
N D W I = ( I V P S W I R ) ( I V P + S W I R )
IVP is infrared ranging between 0.841 µm and 0.876 µm, and SWIR (Shortwave Infrared) is infrared medium red between 1.628 µm and 1.652 µm. We used bands 05 and 06 from the Landsat 08 satellite. Similar to NDVI, NDWI ranges from −1 to 1; however, we adopted the scale proposed by [44]: wet soil ranges from 0.23 to 0.60, water ranges from 0.35 to 0.90, and tree vegetation ranges from 0.10 to 0.4.

3. Results

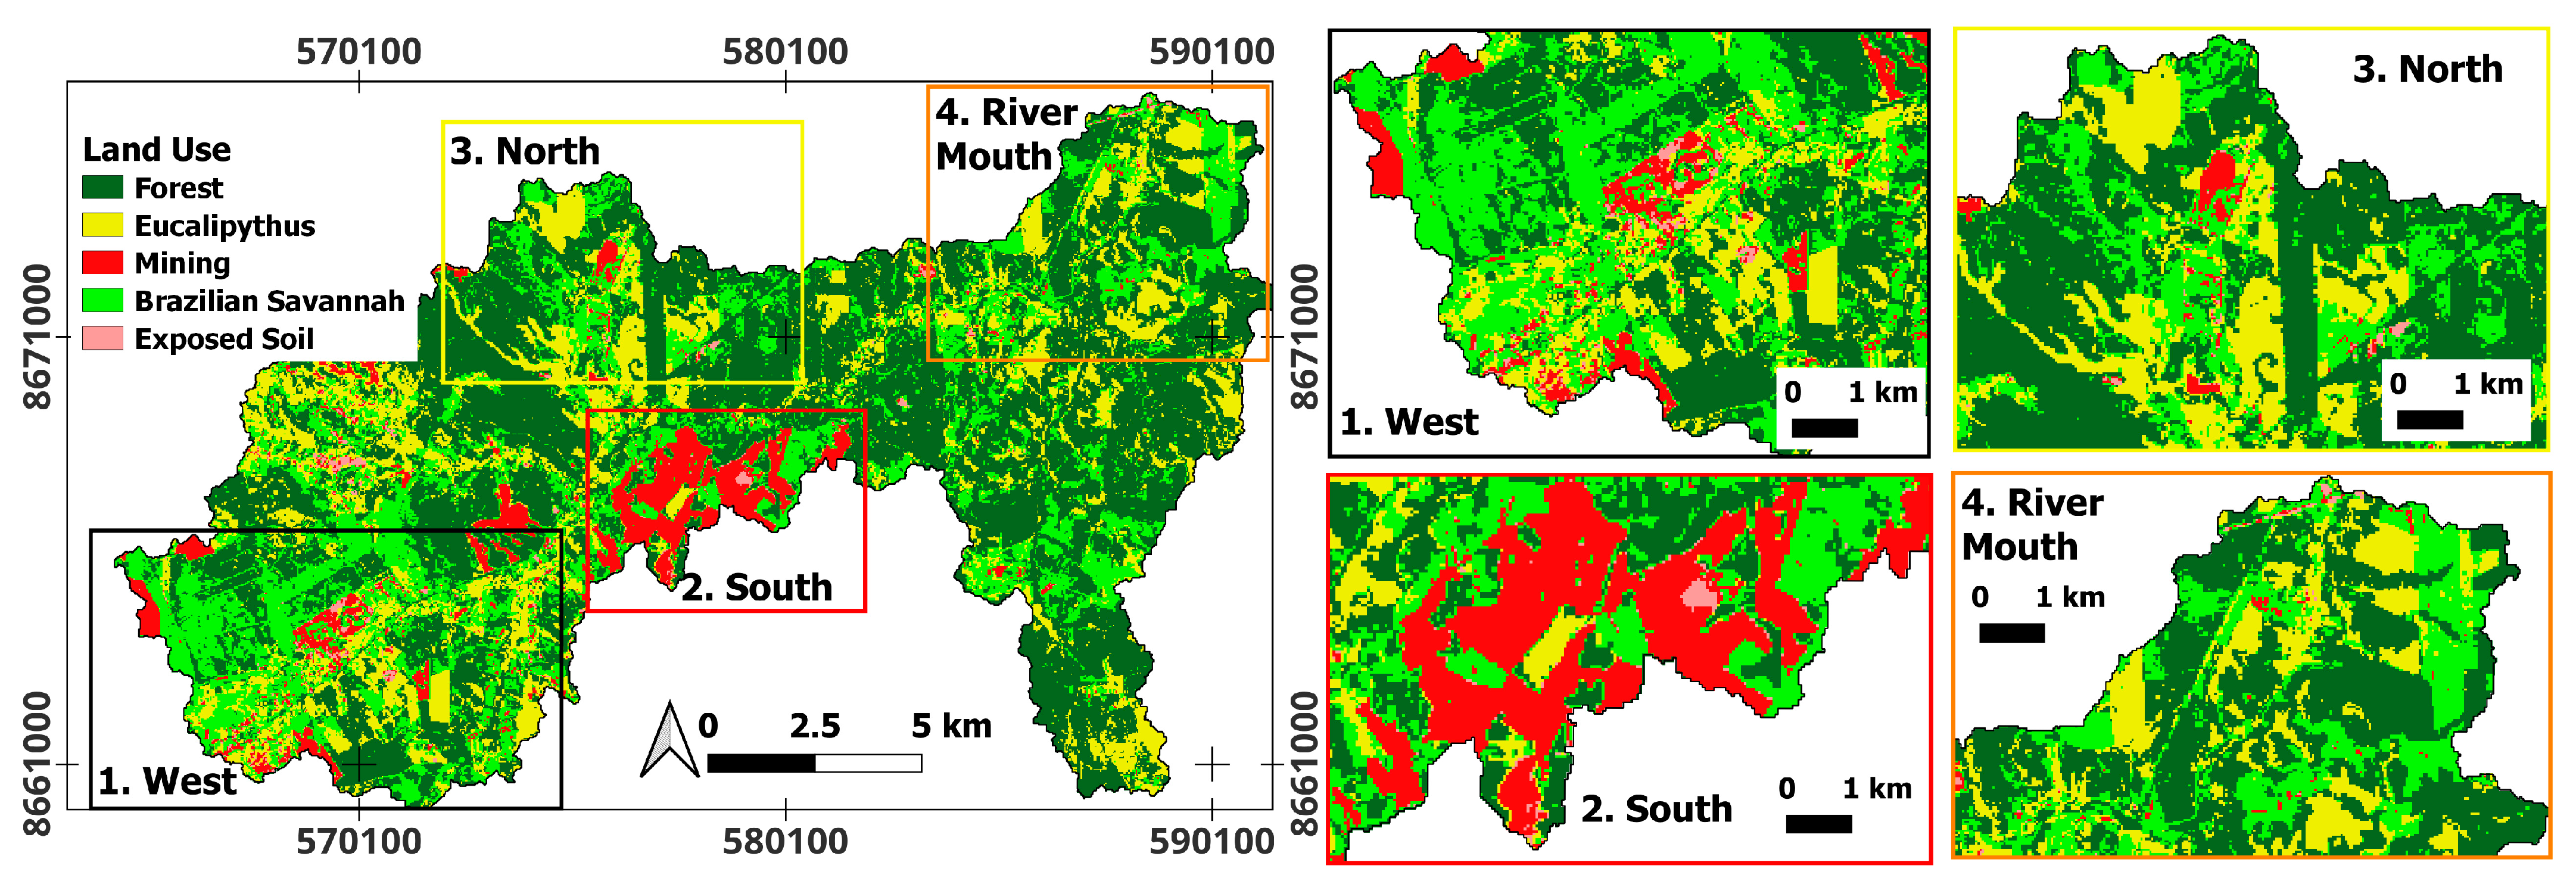
3.1. Classificatory Machine Learning: Random Forest

To assess the quality of the classification, the Kappa index and overall accuracy were used. The Kappa index is widely recognized for measuring the agreement between the obtained classification and the reference data, taking into account the possibility of random agreement. This index can range from −1 to 1, with values closer to 1 indicating excellent agreement. A more detailed explanation of the Kappa index can be found in studies such as [45,46,47,48]. Overall accuracy, on the other hand, measures the proportion of correct classifications relative to the total number of samples evaluated and is frequently used to provide an overall view of classification performance. Additional details on overall accuracy can be found in studies by [48,49,50,51].
The resulting map (Figure 4), generated using the Random Forest classifier, achieved a Kappa index of 0.993 and an overall accuracy of 0.995, indicating a high-quality classification, as confirmed by the confusion matrix (Table 1).
In Table 1, we notice some minor confusion by the RF classifier, as expected. There was a small confusion between forest, eucalyptus, and savanna, which is due to their spectral signatures being similar. Additionally, there was a slight confusion between mining and bare soil; in mining areas, there is a predominance of sand extraction for construction; hence, the spectral signatures are alike. Another minor confusion occurred between savanna and mining, especially where savannization areas result from deforestation for commercial activities, later abandoned, and subsequently undergoing natural regeneration.

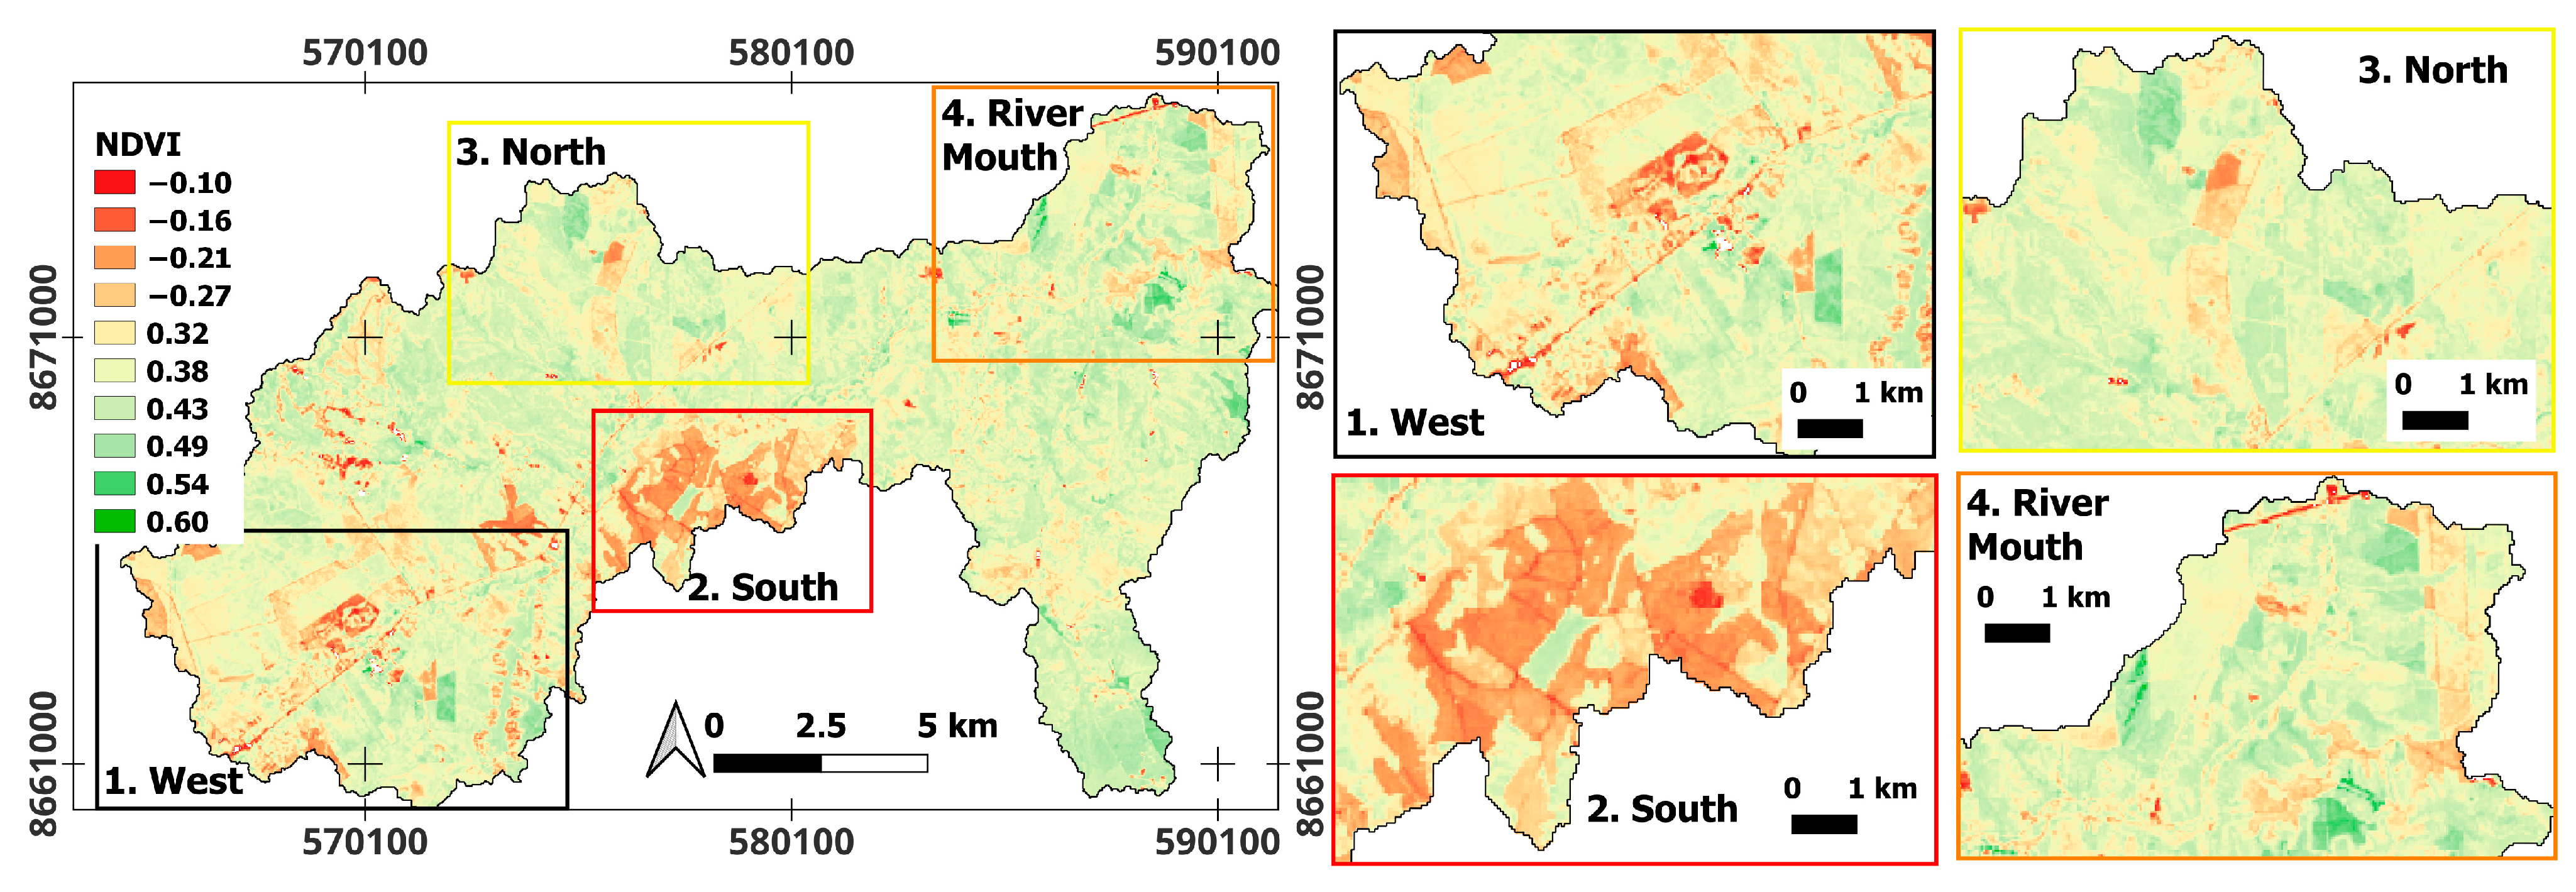
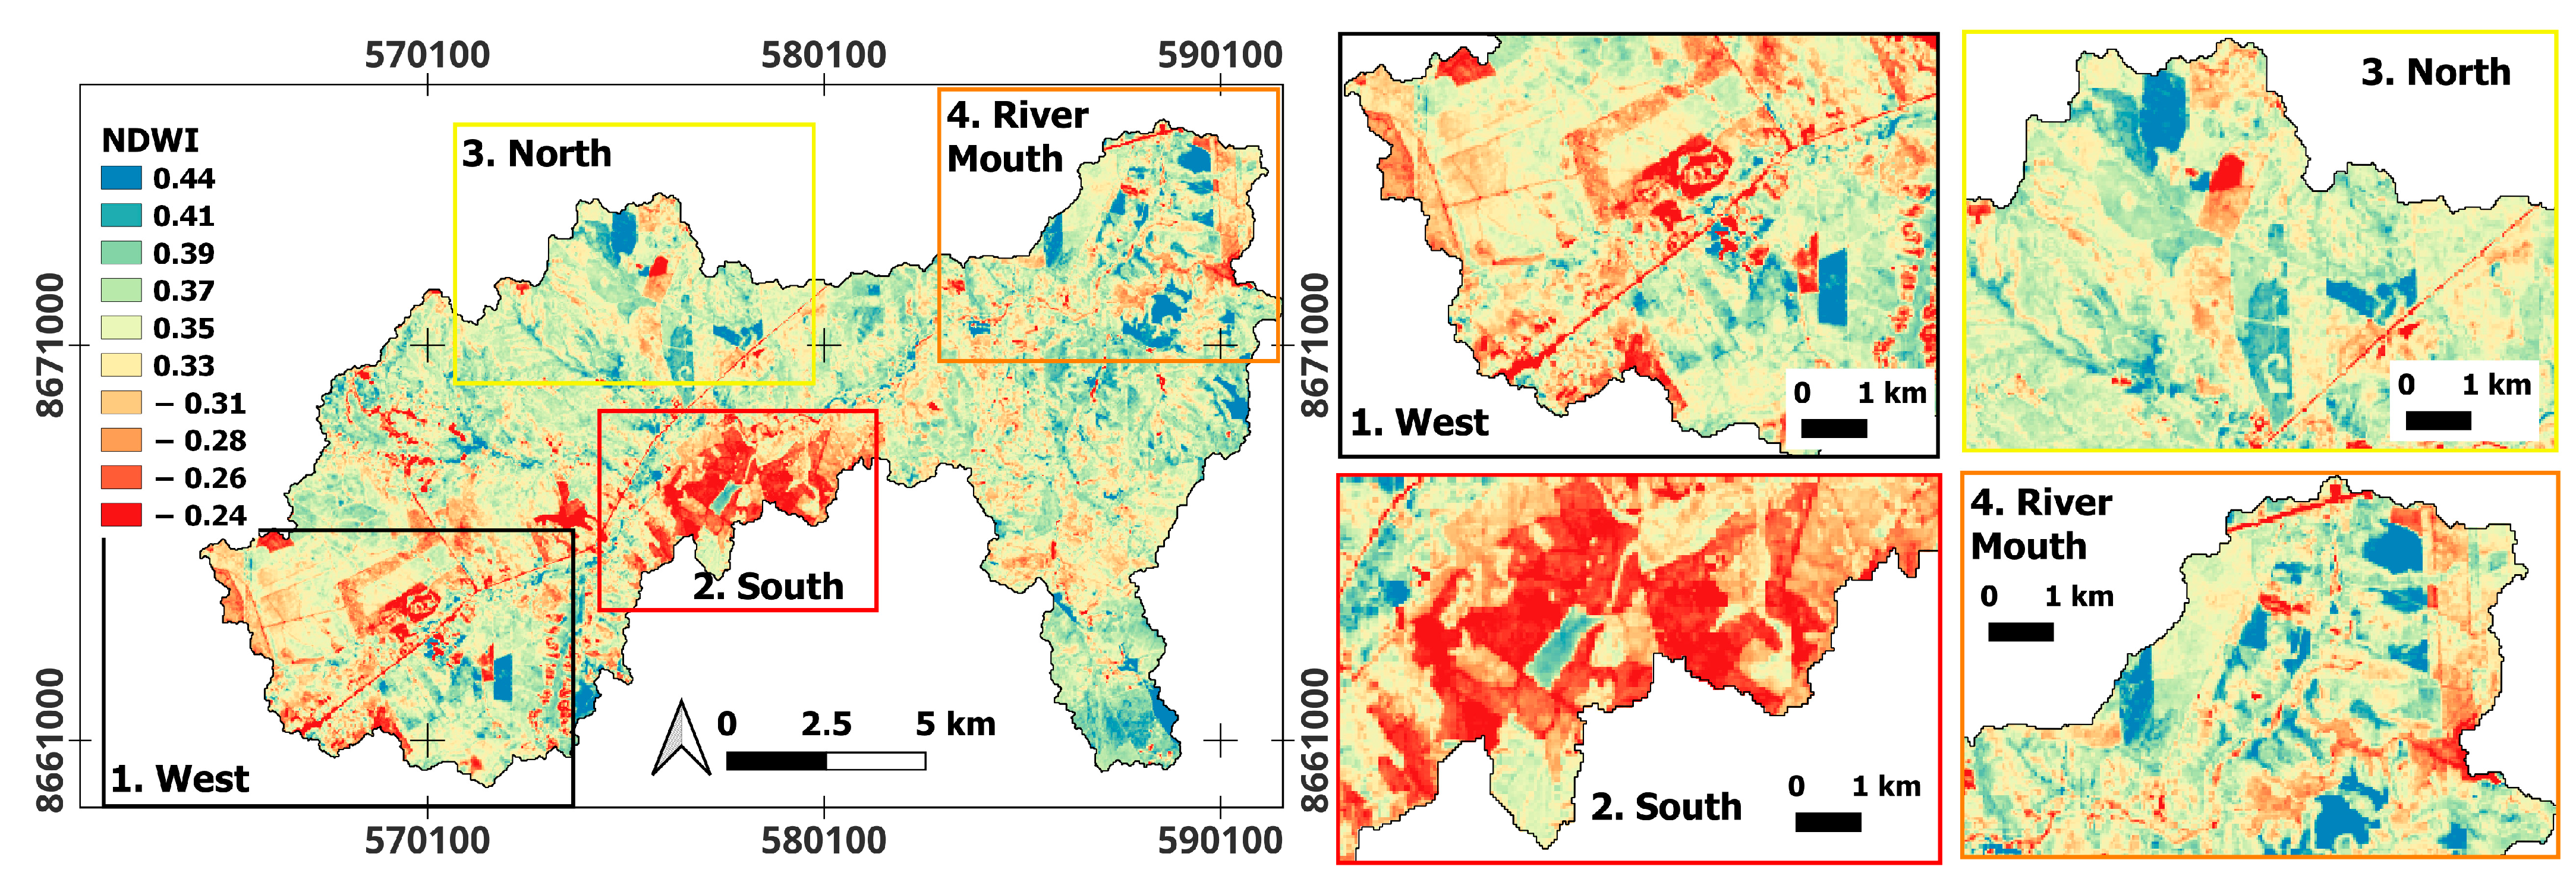
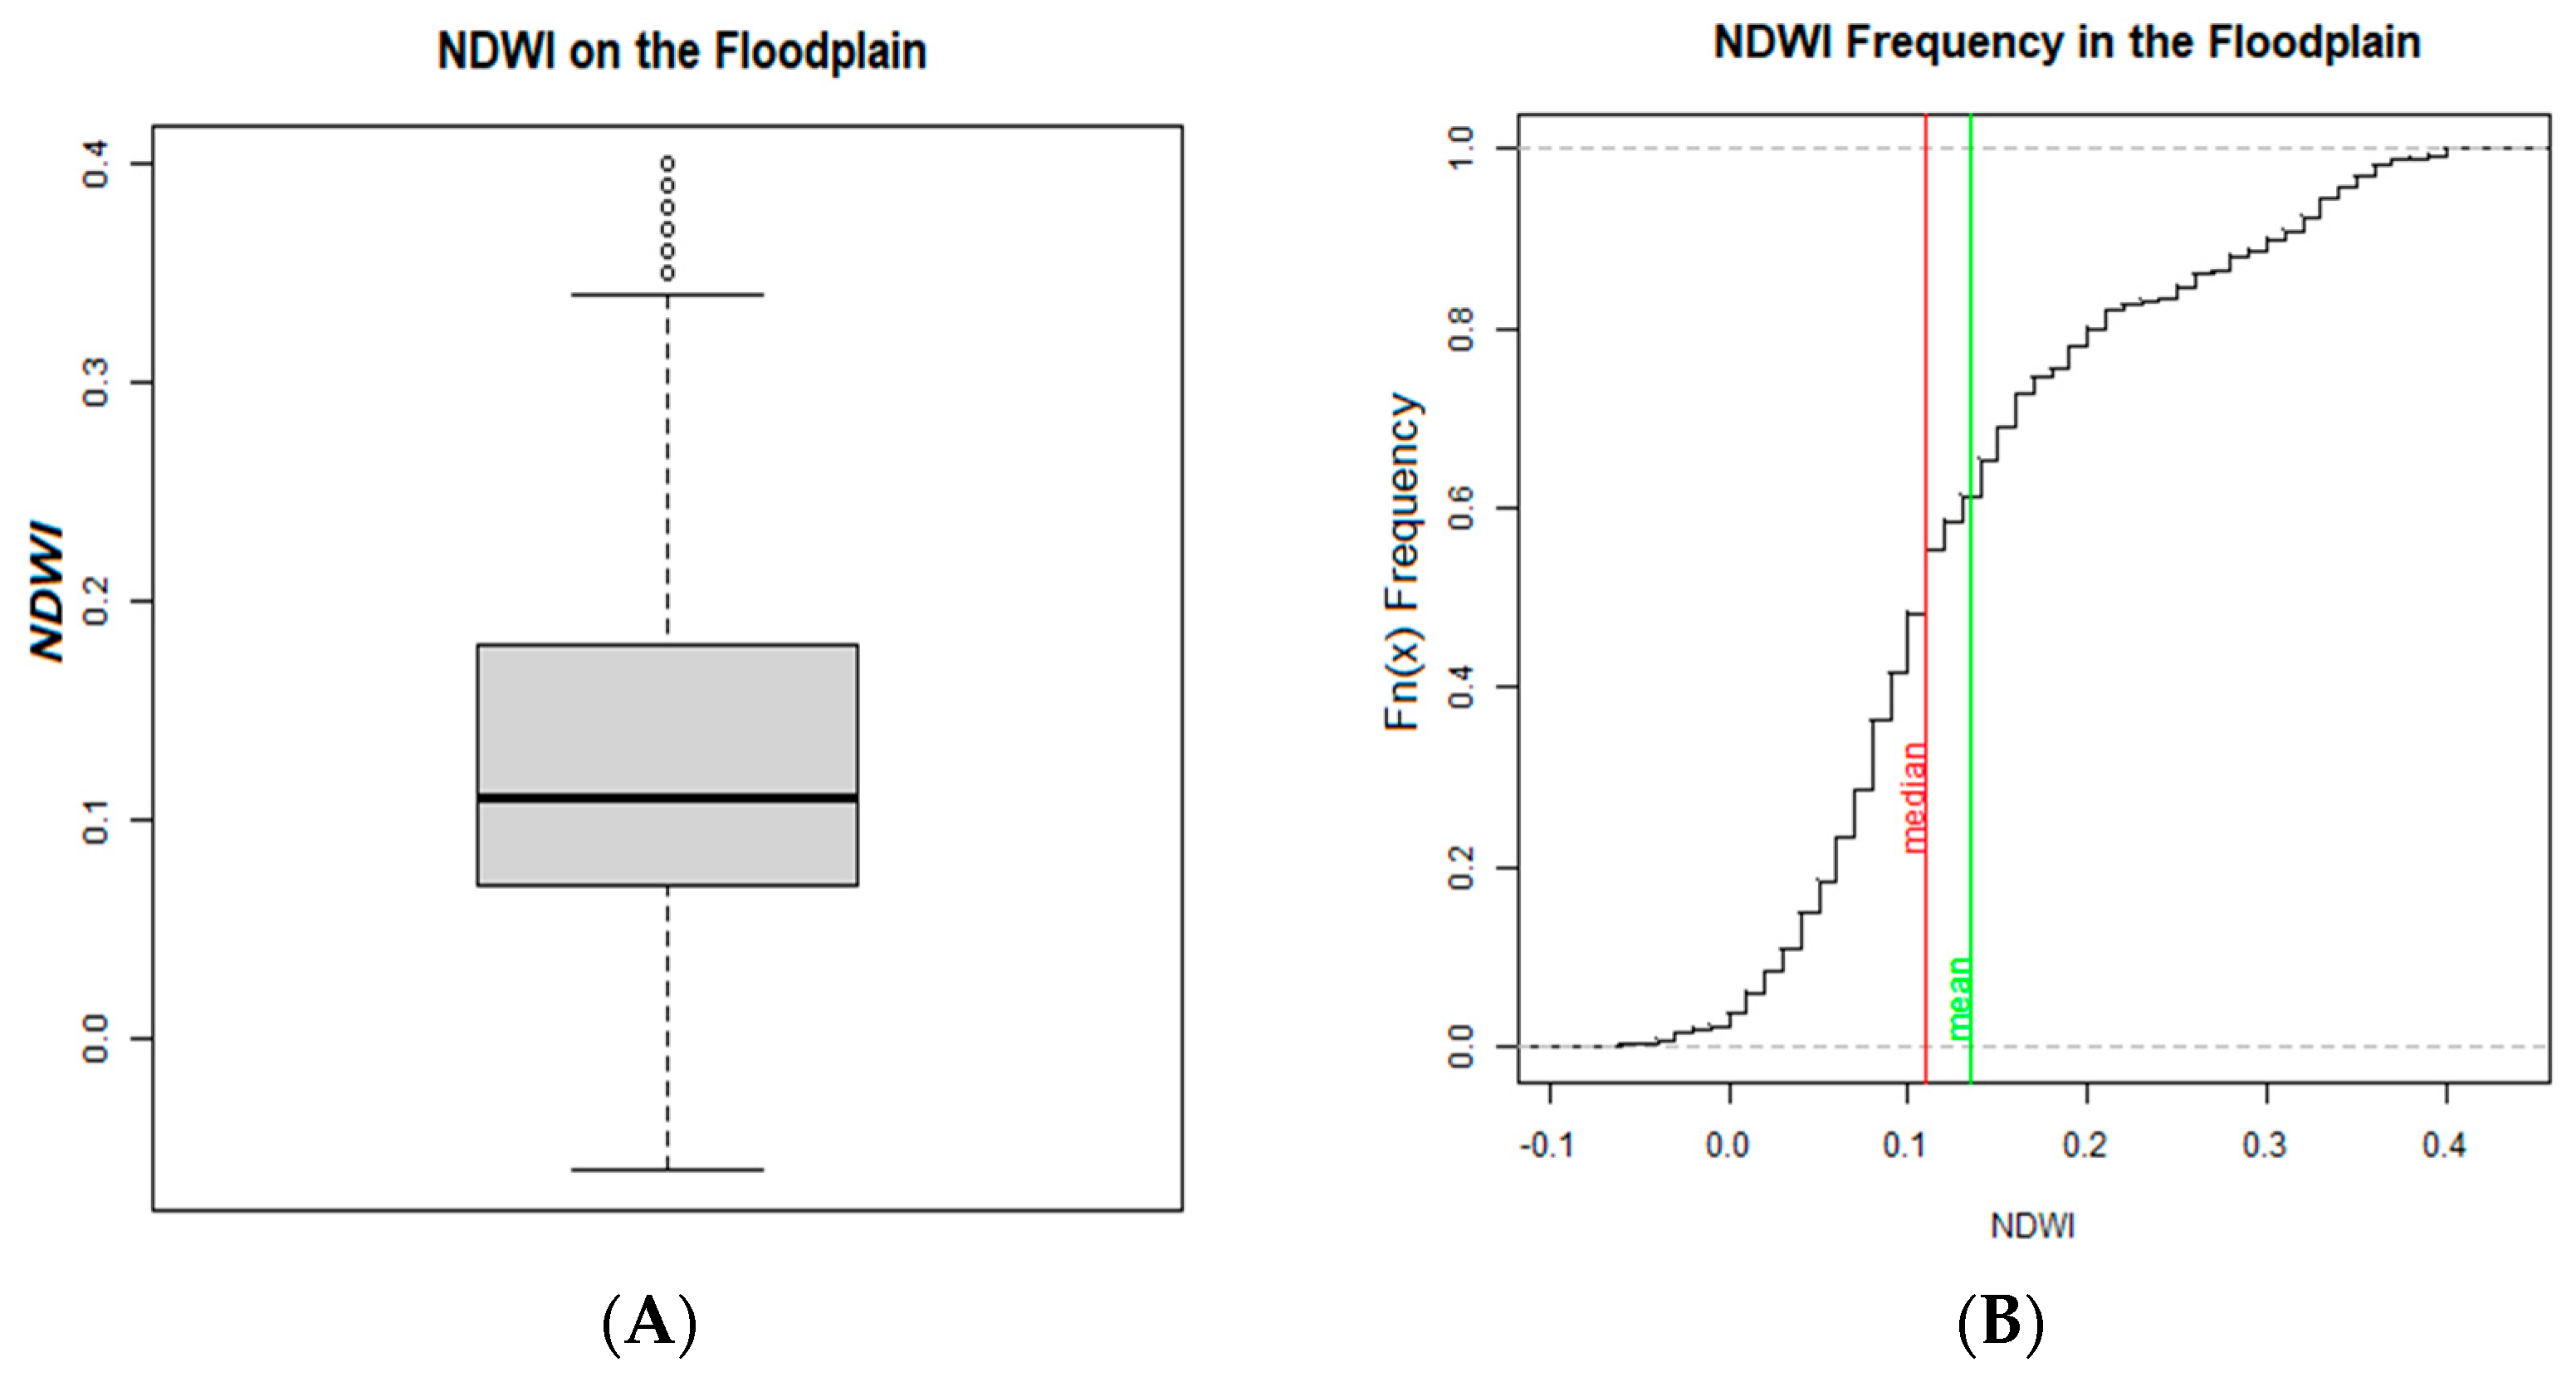
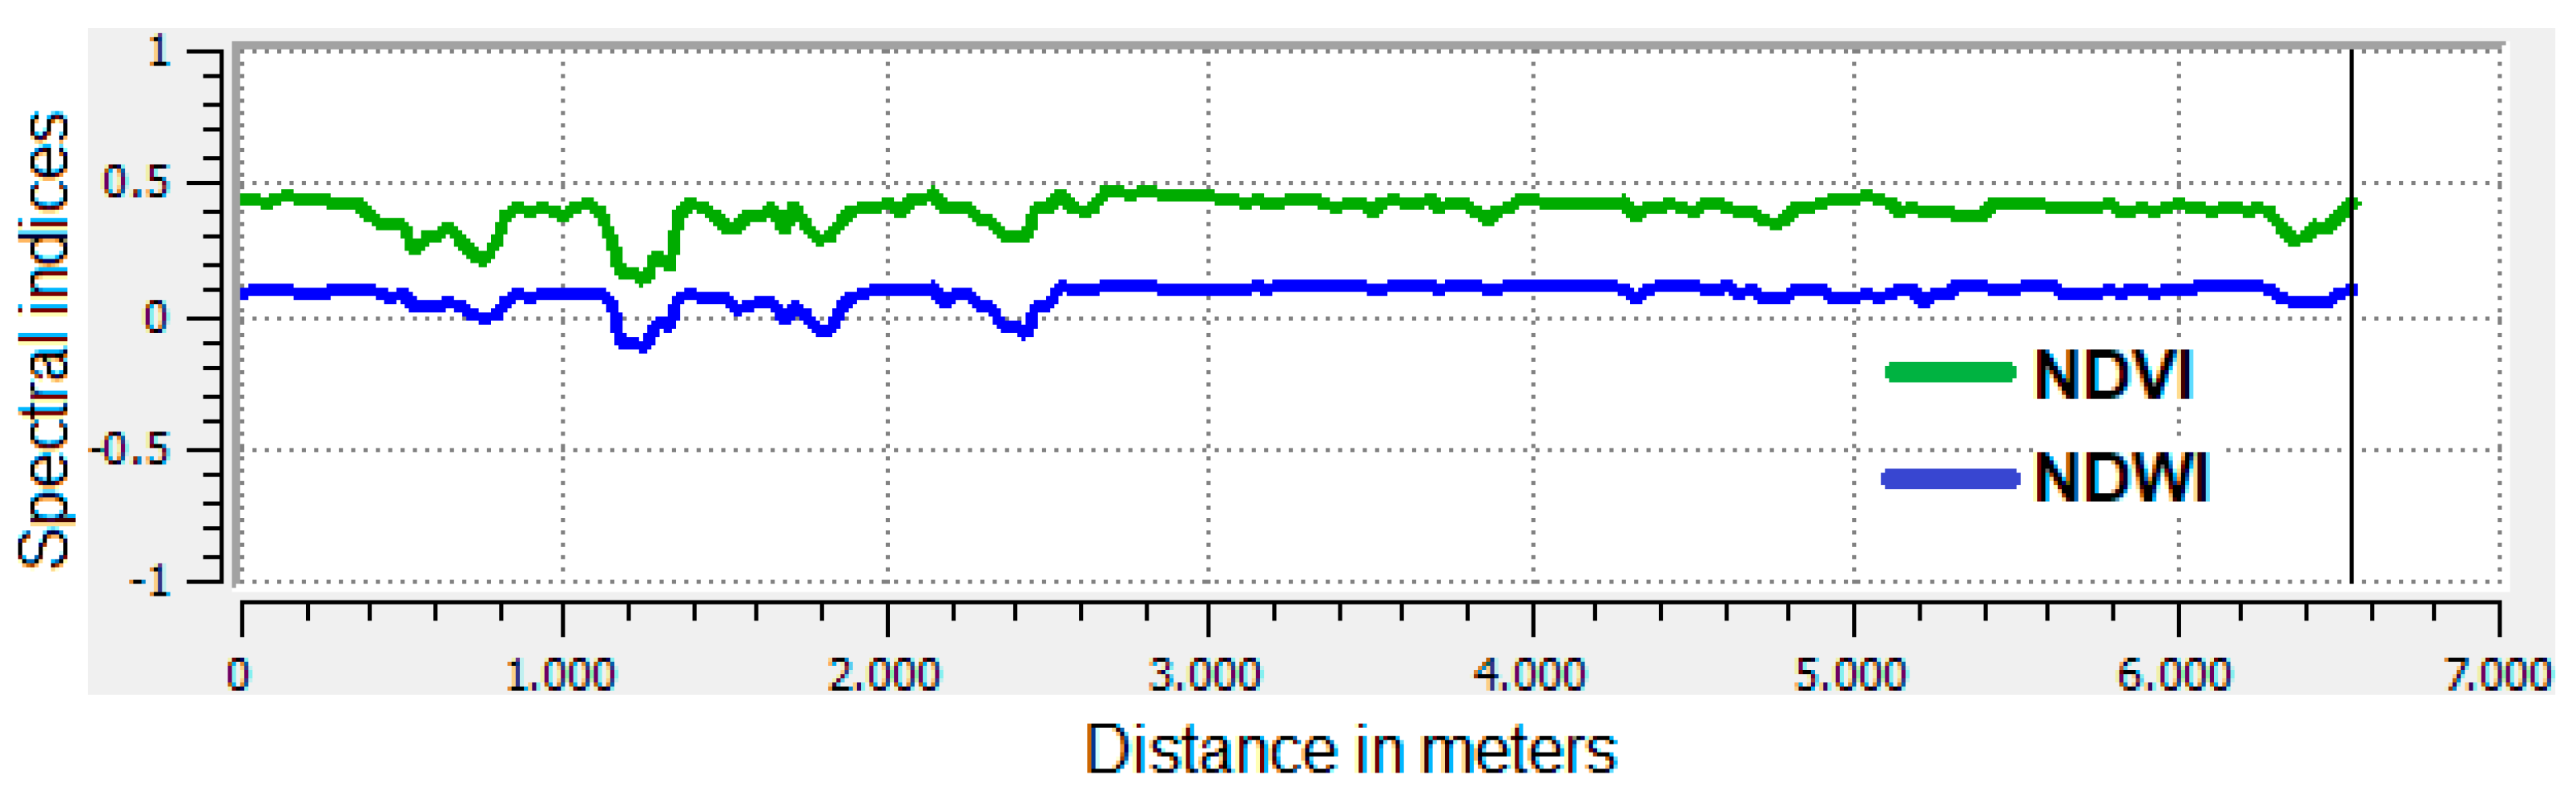
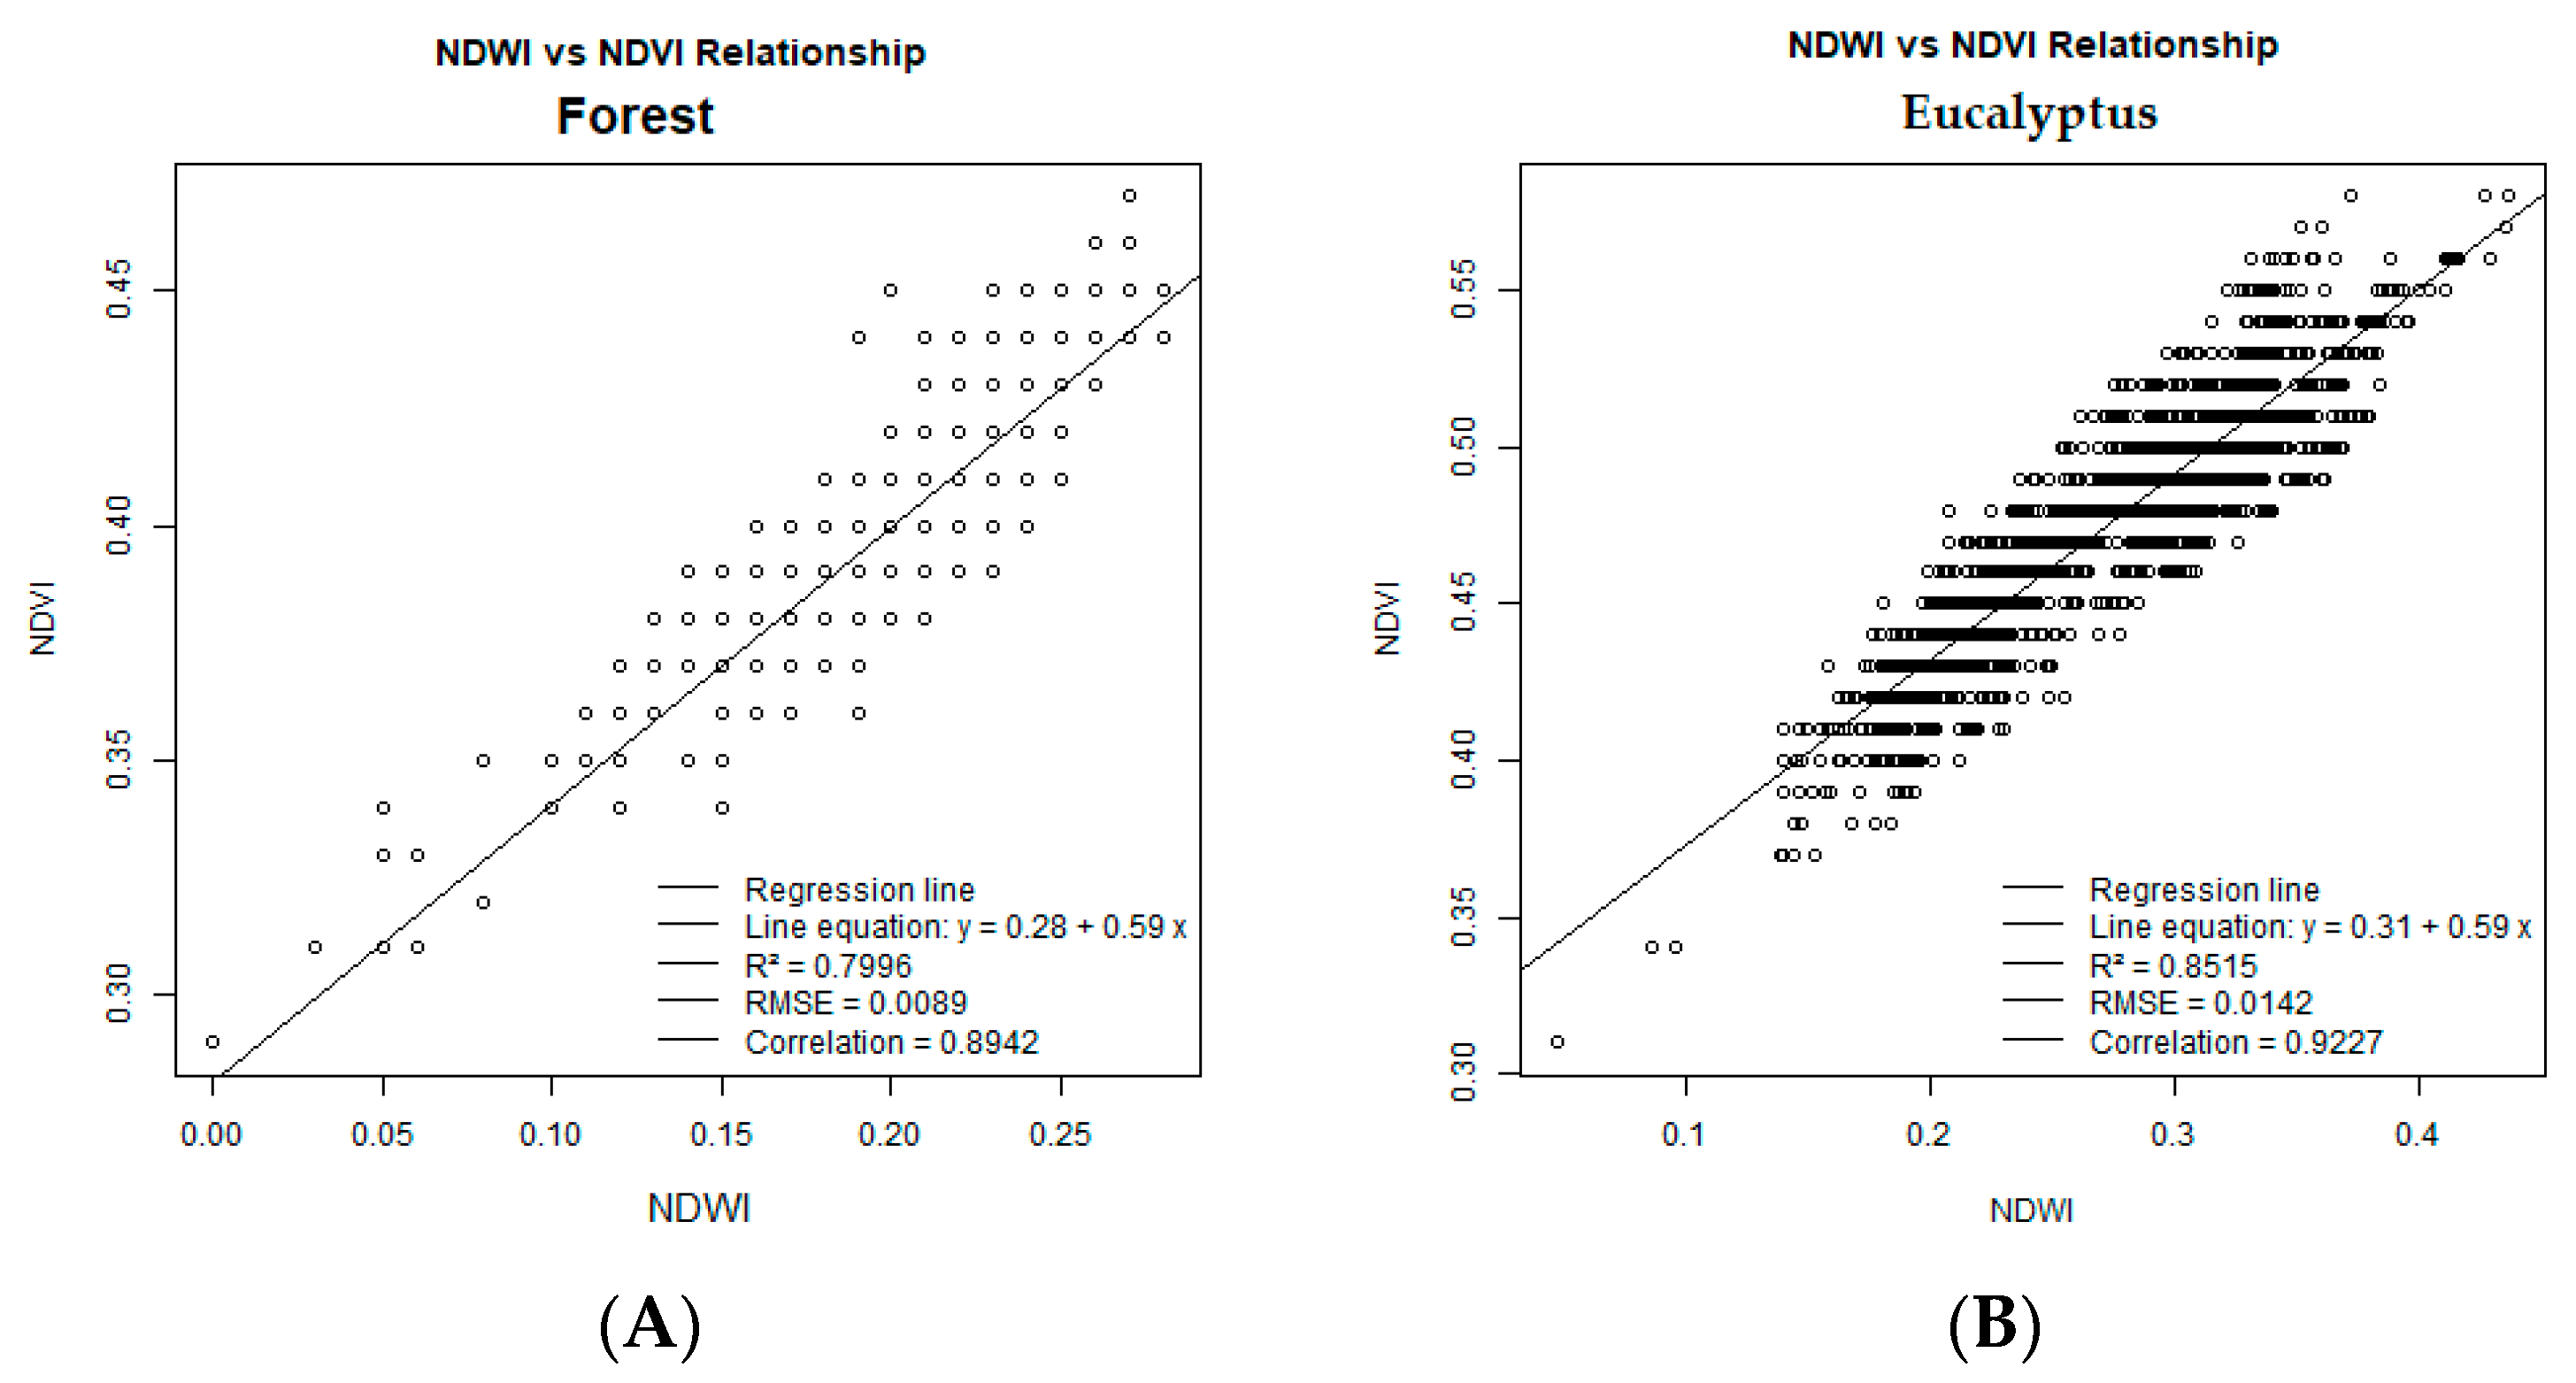
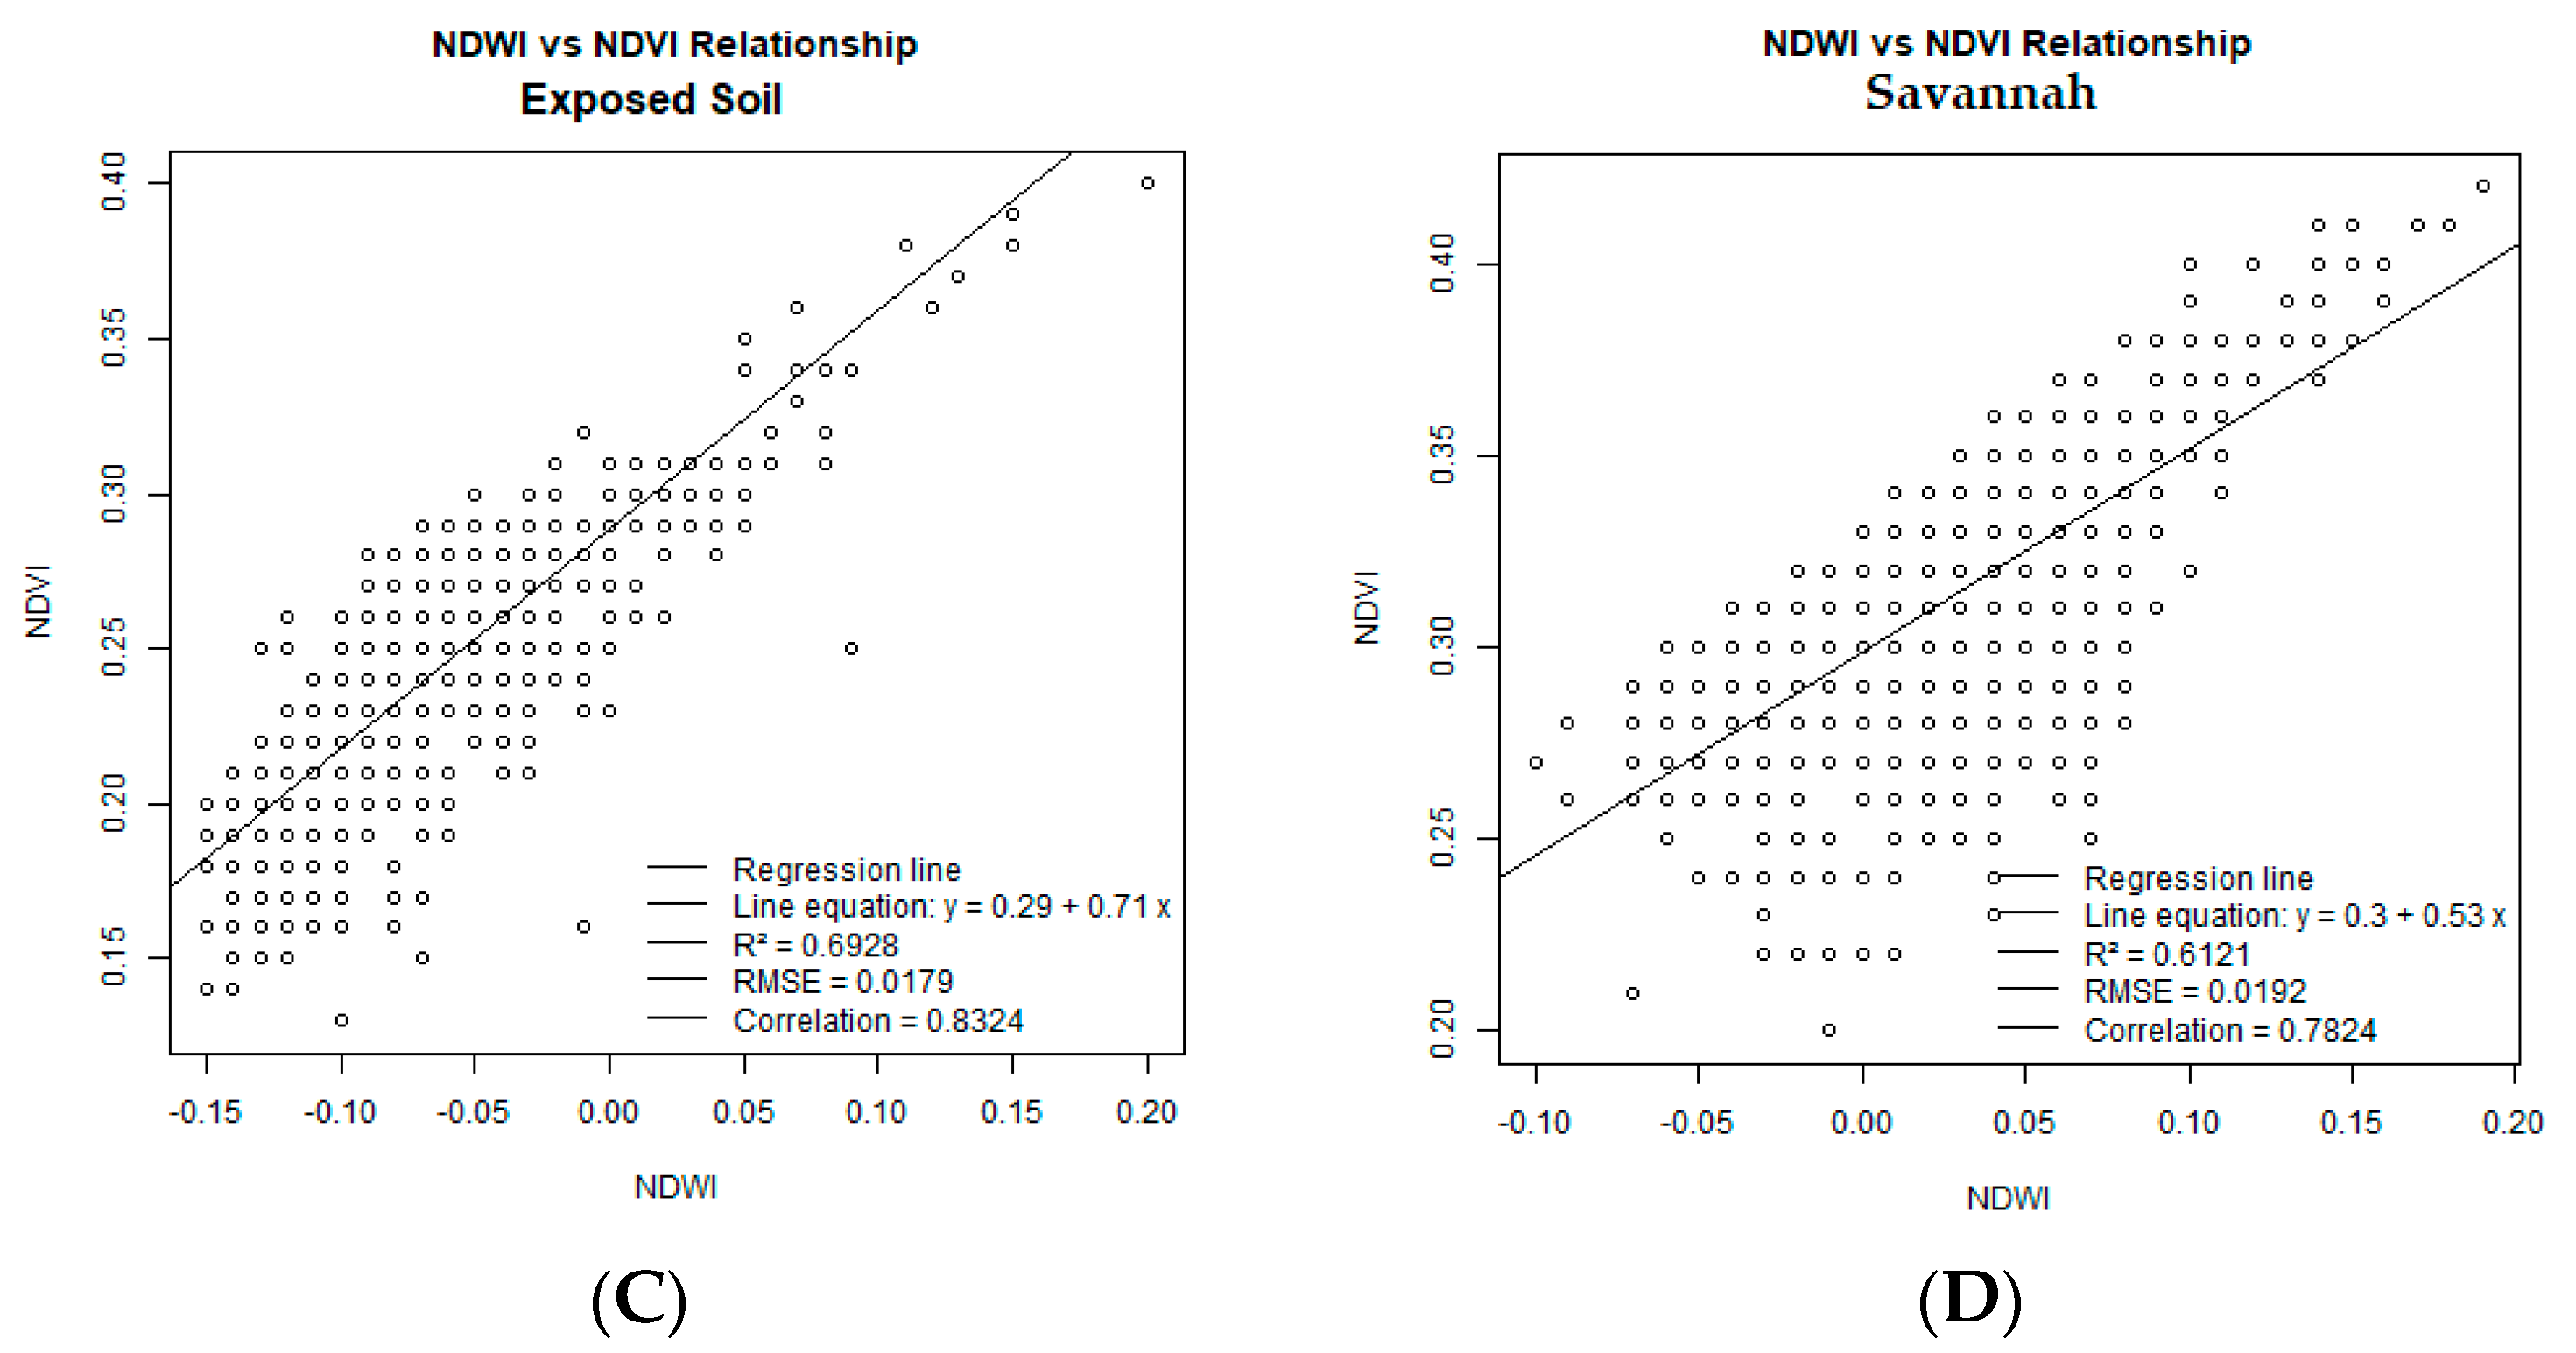
3.2. NDVI and NDWI Spectral Indices

NDVI (Normalized Difference Vegetation Index) is a dimensionless index that defines vegetation cover through the difference between visible and near-infrared reflectance [52]. It is observed that in the western zone (Figure 5) as well as in the southern sector of the watershed, the absence of vegetation is noticeable, while in the west, there is the presence of savanna areas, characterized mainly by sparse, low vegetation, resulting in low NDVI.
The southern sector is characterized by exposed soil and mining, that is, the absence of vegetation. This is prominent in the more rugged areas of the terrain (Figure 6), especially in the northern sector and at the mouth of the basin where the highest NDVI values are found. However, it is not predominantly forest but rather fragmented areas with the intrusion of forestry.
NDWI (Figure 7) follows the trend of NDVI; in other words, this index seems to directly influence the concentration of vegetation index, a topic discussed later. The counterintuitive aspect is that higher NDWI values were expected along the banks of the main channel, which is not observed except in the middle course of the river and at its mouth. The relationship between these two spectral indices seems to indicate a ‘symbiotic’ balance between fragments of Atlantic Forest and soil moisture. Several factors suggest this possibility: I—along the riverbanks, control of Dunnian runoff only occurs where there is vegetation; II—there is a spatial correlation between NDWI and NDVI; III—areas with savanna formation have little overlap with forested areas.

4. Discussion

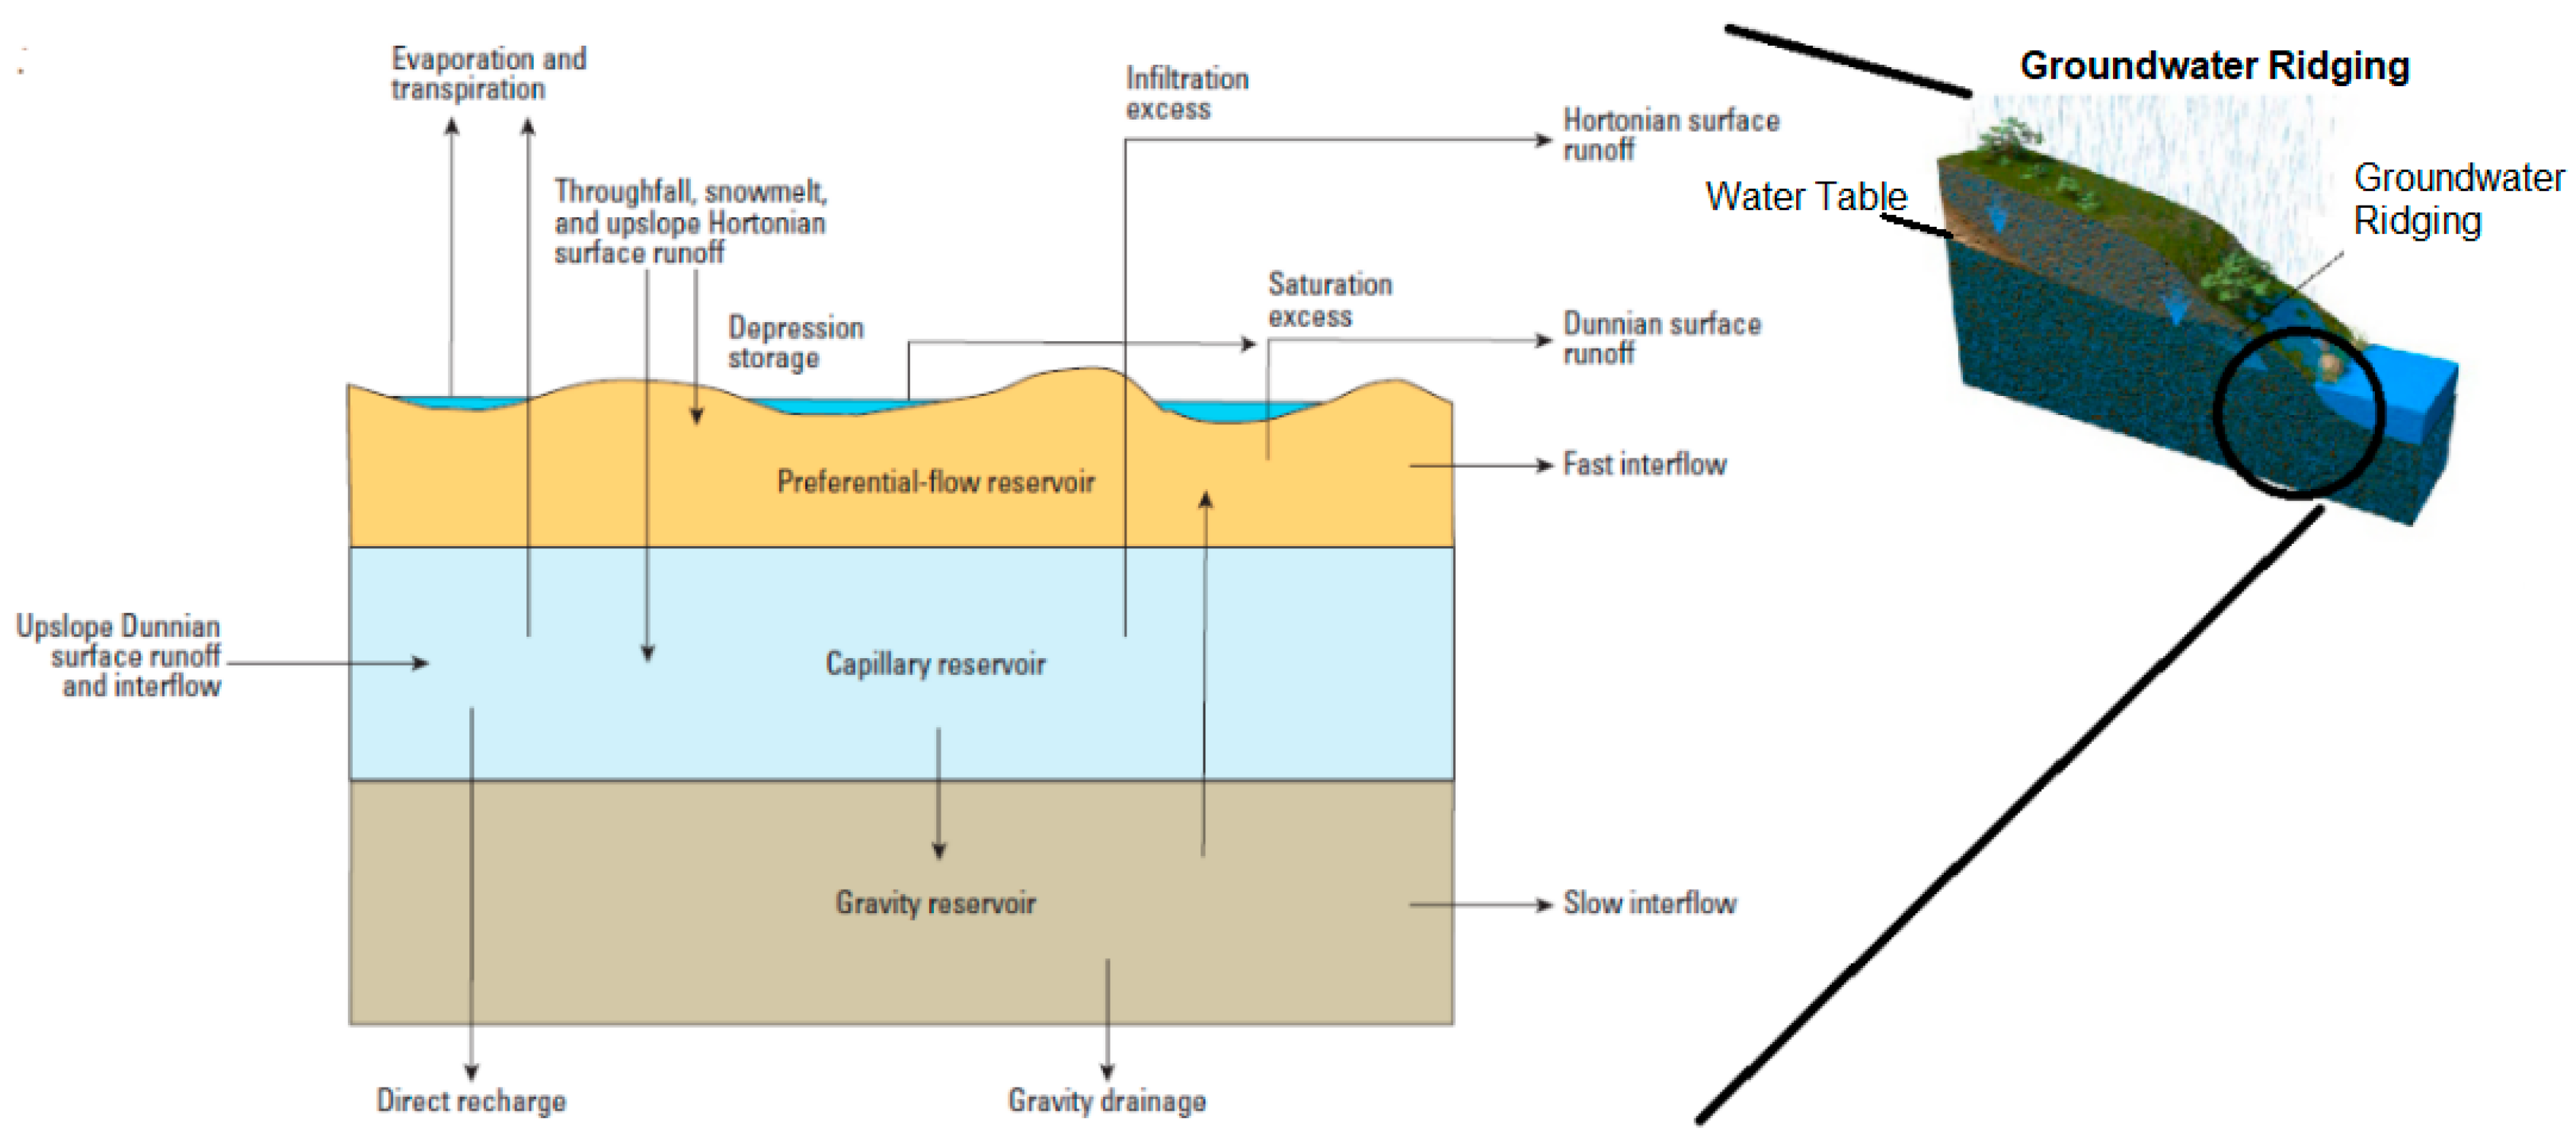
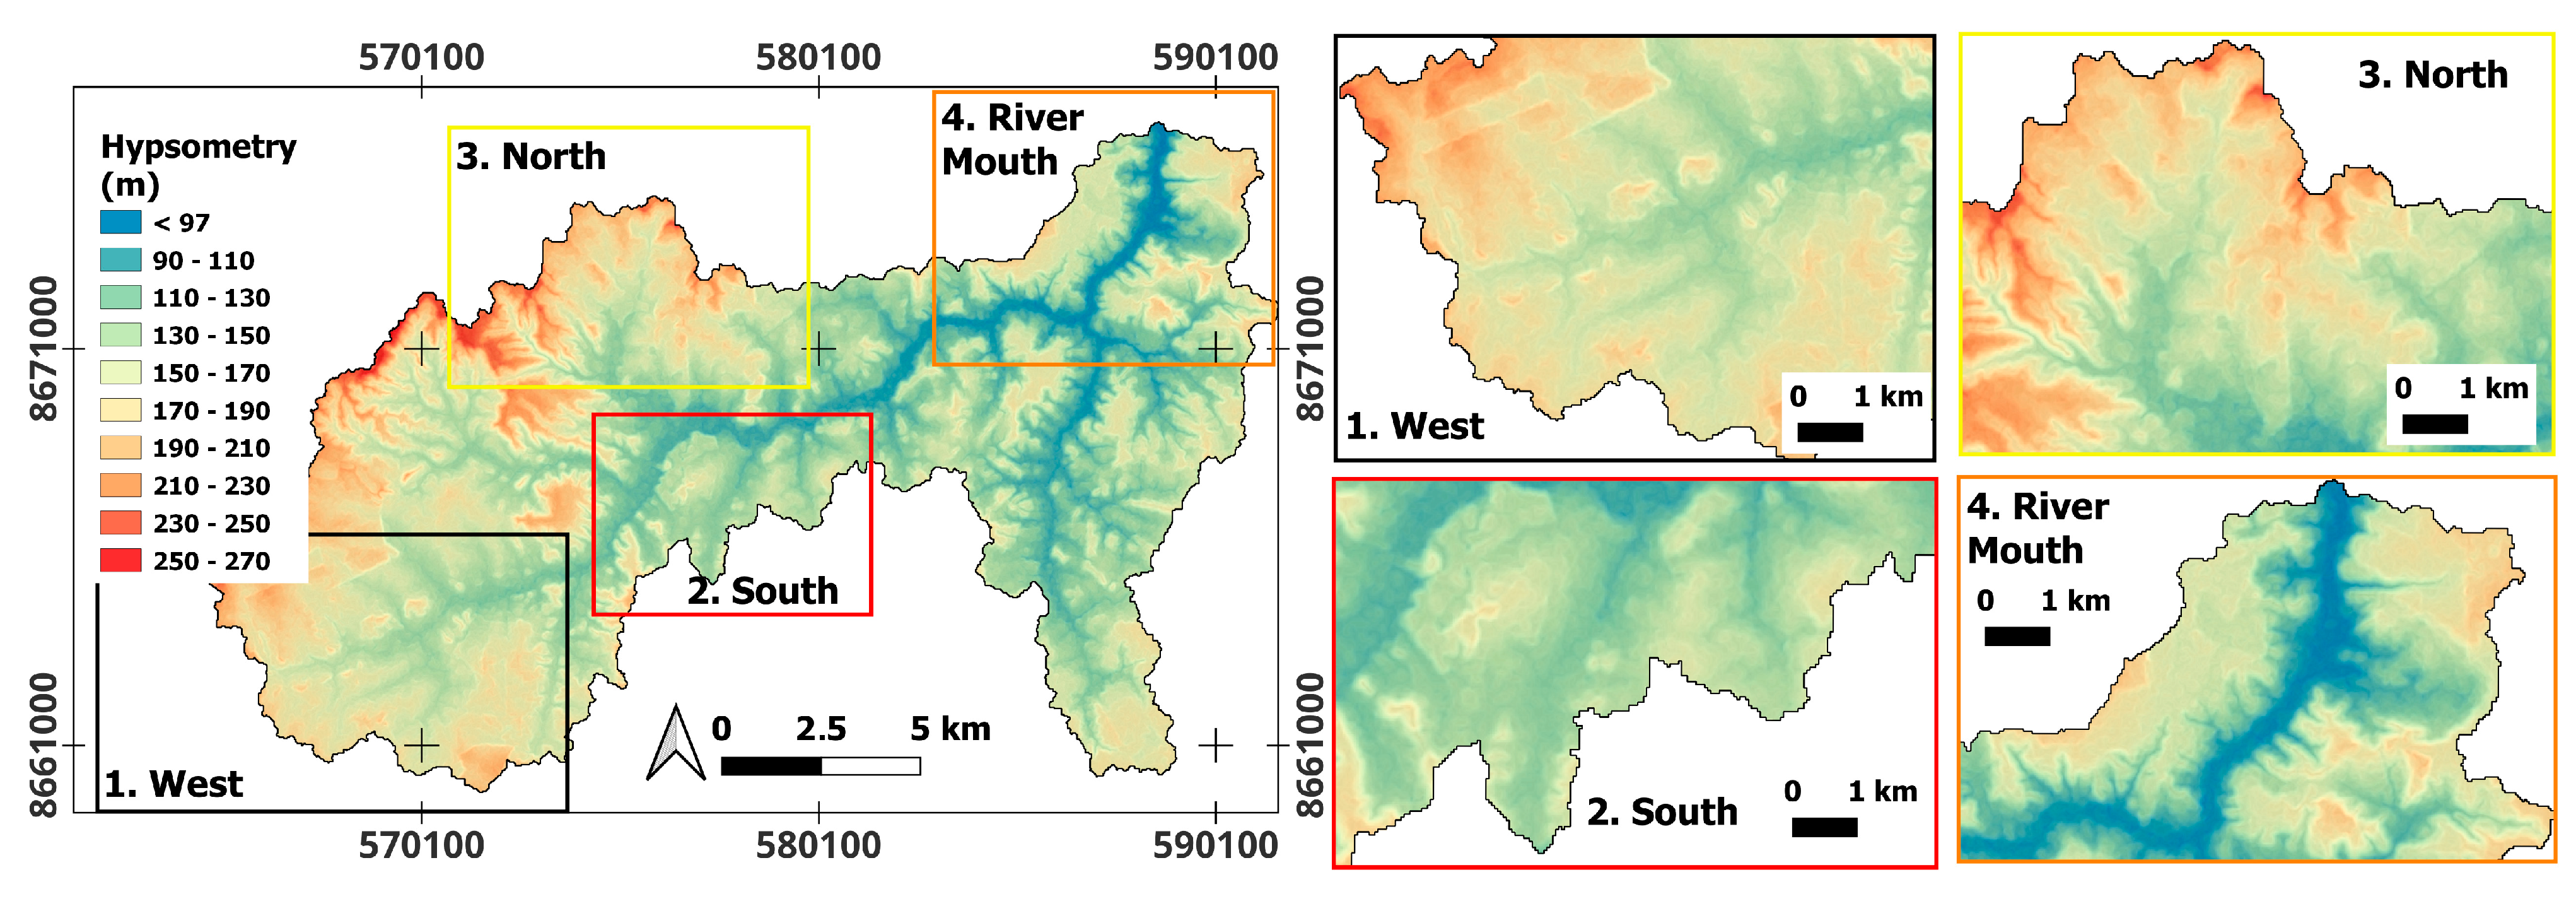
4.1. Topographic Control of Hortonian and Dunnian Flow

Surface runoff, also known as Hortonian runoff due to infiltration excess or simply Hortonian flow, refers to the hydrological process that occurs when precipitation intensity exceeds the soil’s infiltration capacity, generating surface runoff [15,53]. This type of flow was first described by Robert E. Horton in 1933 and primarily occurs in soils with low permeability or that are already compacted, where rainwater cannot infiltrate quickly, leading to surface runoff.
On the other hand, Dunnian flow, also known as saturation overland flow, occurs when the soil is fully saturated with water, meaning its infiltration capacity has been exceeded. This type of runoff typically begins in low-lying areas, such as riparian zones, where the water table is near the surface [17]. Dunnian flow is characteristic of regions with high precipitation and permeable soils, predominating in forested areas and slopes. Unlike Hortonian flow, it does not depend on rainfall intensity but rather on soil saturation, playing a significant role in groundwater recharge and the maintenance of watercourses [16,17], as well as in soil hydraulic conductivity.
According to [54], the amount of water infiltrating the soil influences the speed of surface runoff, as well as other hydrological variables. Therefore, we can expect that this perimeter of moist soil is associated with watercourses, such as floodplains and the major and minor channels of riverbeds. Based on this premise, we expected that the regions around the floodplain would have the highest NDWI values. However, this was not observed in the analysis of the longitudinal profile of the main river channel studied. According to [44], soil moisture of around 0.2 and even confusion between water and moist soil of around 0.35 were expected. However, analyzing the box plot and cumulative frequency diagram, we noticed that values above 0.2 are beyond the third quartile (Figure 8A). When we analyzed the moist perimeter, it was identified that it represents less than 20% of the cumulative frequency of NDWI (Figure 8B).
Diffusive flow, according to [55], emphasizes groundwater movement driven by piezometric pressure. Experimental studies have shown that flatter areas near watercourses are more susceptible to rapid saturation [55]. However, considering that the water deficit (Figure 9) for the image acquisition period was 4.7%, it was expected that a higher accumulation of soil moisture would be found. We attribute these low NDWI values to the removal of riparian vegetation and high evapotranspiration typical of a region located at just 12° south latitude.
At the hilltops of the geomorphological slope, as described by [56], soils are characterized by shallow depth and predominant chemical weathering, leading to slope instability. Remnants of Atlantic Forest act as soil stabilizers, delaying Dunnian flow. In contrast, the studied basin features deep soils with good drainage [57], which favor infiltration rather than subsurface flow. Therefore, the forest plays a crucial role in retaining soil moisture and supporting subsurface flow for longer periods. This can be observed in a cross-sectional cut at the top of the slope (Figure 10), where the blue line represents NDWI and the green line represents NDVI. Regions characterized by significant remnants of Atlantic Forest show high NDVI values, where NDWI values expectedly hover close to zero or even negative, as noted by [44,58], where values above 0.2 indicate soil moisture presence. It was observed that NDWI values at the hilltops were similar to those along the main channel, varying according to NDVI and indicating vegetation control over soil moisture. NDVI and NDWI values not only show a positive correlation but also exhibit high statistical agreement, with 85% concordance, highlighting the delicate dynamic balance of this ecosystem.

4.2. Dunnian Runoff: Relationships Between NDVI and NDWI in Forested Areas

Compared to the spectral indices NDVI and NDWI, both indices (Figure 11A,B) show positive values, indicating the significant presence of both vegetation and soil moisture. According to [59], the values of the first index suggest moderately healthy vegetation, which seems to align with studies by [60] regarding average values, as well as the dependence on rainfall patterns in the region. A view of the climatological water balance (Figure 9) for the year 2021, the date of image acquisition, reveals a 4.7% water deficit, explaining the water stress of the vegetation indicated by NDVI in the forested area.
On the other hand, NDWI is associated with the relative amount of water in the soil, as described on the scale in [43,44], because the accumulated water deficit for the period forces vegetation to adapt by seeking water necessary for survival in deeper soil layers.
Adjusting NDVI models based on NDWI to a regression line (Figure 12A), a cluster of data is observed where NDWI explains around 89% of NDVI. Part of this clustering, according to [44], may be associated with confusion of NDWI between values of 0.35 and 0.40, where the model confuses moist soil with tree vegetation. However, we emphasize that for the modeled region, these values are outliers within the studied dataset, which reinforces the idea of the presence of Dunnian runoff in the region.

4.3. Dunnian Runoff: Relationship Between NDVI and NDWI for Forest, Eucalyptus, Savanna, and Exposed Soil

Although we classified using mining, we chose not to include the mining land use class in this relationship, as it presents degraded soil without vegetation. Vegetation cover seems highly dependent on soil moisture, which becomes more evident when comparing soil moisture indices with a vegetation index. In native forests, there is an approximately 89% correlation between NDWI and NDVI (Figure 12A), as previously observed. This correlation is even higher in eucalyptus, reaching 92% (Figure 12B), raising a question to be investigated in future research: how much soil moisture does silviculture accumulate?
Returning to soil moisture, which influences overland flow, an 83% correlation between NDWI and NDVI can also be observed (Figure 12C) for exposed soil. However, NDWI clustering values are negative, indicating the absence of soil moisture, which in surface runoff formation would accentuate the infiltration component, whereas runoff formation would be prevalent due to lack of vegetation cover, implicating all associated environmental problems. In the forest regeneration process, the region exhibits savanna formation, where the correlation between NDWI and NDVI (Figure 12D) resembles that of exposed soil, with a 78% correlation, but with very low NDWI values falling outside the moist soil range proposed by [43,44]. This association can be explained by the fact that savannization involves exposed soil associated with vegetation, atmospheric processes, and solar radiation, leading to high soil evaporation rates.
The associations we made through clustering, with NDWI explaining NDVI, can be better supported when comparing class sample statistics (Figure 13). There is noticeable variability among quartiles for eucalyptus NDVI, denoting a certain symmetry where the dataset ranges between 0.47 and 0.5, values associated with moderately healthy plants. The statistical behavior of NDWI is quite similar to that of NDVI. NDWI for savanna areas does not fall within the range indicated in [44], except for a few outliers, implying very low NDVI values in these areas and indicating unhealthy vegetation [61]. As expected, NDVI for exposed soil areas is very low, representing only a few grasses, which correlates with negative soil moisture indices.
These data seem to indicate that forest fragments are dependent on soil moisture, which diminishes as this layer is replaced by other types of land use, hindering the vegetation regeneration process, as evidenced by the low NDVI and NDWI values in the savanna and reforestation areas. Eucalyptus silviculture tends to concentrate a significant amount of soil moisture, although this does not translate into better flora and fauna diversity, as demonstrated in [62].
In these different land uses, the behavior of overland flow is favored by the presence of vegetation, especially eucalyptus and Atlantic forest fragments. We can highlight two antagonistic vectors to overland flow: soil moisture accelerates surface runoff processes [16], while vegetation acts in the opposite direction to flow, serving as a roughness coefficient, slowing down surface runoff. Additionally, the root system facilitates water infiltration into the soil.

4.4. Limitations and Uncertainties of the Models

The statistical correlations obtained in the models present promising results, demonstrating a significant relationship between satellite-derived spectral indices, such as NDVI (Normalized Difference Vegetation Index) and NDWI (Normalized Difference Water Index). However, it is essential to highlight some inherent limitations of these indices and the resulting classifications, which can introduce uncertainties in the analysis and interpretation of the data [63].
One of the main limitations of spectral indices lies in their dependence on prevailing climatic conditions, particularly temperature and precipitation. As noted by [64], NDVI is highly sensitive to climatic interactions, implying that changes in temperature and precipitation regimes, such as those resulting from climate change, can significantly affect its outcomes. Therefore, further investigation is needed to understand how NDVI responds to these changes, especially under future climate scenarios.
Moreover, the values of spectral indices may vary among different sensors due to factors such as quality control measures, algorithm implementation, and atmospheric and geometric corrections of the sensor used [65]. This variability can introduce uncertainties when comparing NDVI and NDWI indices over time and across different regions. Studies by [64,66] also indicate that factors beyond climatic influences, such as the presence of wetlands around water bodies, irrigation practices, and anthropogenic activities, can affect vegetation growth and health. These factors are crucial when analyzing spectral indices, as they may confound the interpretation of the results obtained.
Another source of uncertainty involves the calibration of models used to estimate soil moisture from NDWI, particularly in transition areas between wet soil and vegetation and in regions with steep topography, where the so-called “background effect” occurs [65,67]. In these areas, the probability of error increases due to spectral confusion, potentially compromising the accuracy of soil moisture estimates. Therefore, although NDVI and NDWI indices exhibit high correlations, the uncertainties inherent in data collection and modeling processes need to be considered when interpreting results. This is crucial to avoid the inappropriate extrapolation of results to other areas or environmental conditions and to adequately contextualize study conclusions.
Indices based on reflectance rates tend to minimize the effects of sensor calibration, as well as bidirectional, atmospheric, and topographic effects. However, they are still sensitive to factors such as the background effect and the scale of analysis [65]. Such limitations can lead to misinterpretations when applying indices to areas with different characteristics from those used to calibrate the models.
Recognizing these limitations and uncertainties associated with satellite indices is essential for a more critical and well-founded analysis of results, allowing for a more robust discussion of the relationships between soil moisture, vegetation cover, and surface runoff. In this way, we can not only improve the quality of the inferences made but also ensure that our conclusions are appropriately contextualized, considering the uncertainties of the methods employed.

5. Conclusions

Saturated zones with potential for Dunne runoff were identified, especially on steeper slopes, highlighting the importance of topography in the hydrological dynamics of watersheds. It was observed that Dunne runoff occurs predominantly from the mid-course to the mouth, following the east-west direction of the watershed, with higher elevation areas showing elevated soil moisture values favoring Dunne runoff formation. In contrast, areas with less steep slopes exhibited low soil moisture, emphasizing the influence of terrain slope on the hydrological regime in this basin.
The results indicate a positive correlation between steeper slopes, soil moisture, and Dunne runoff, suggesting that steeper areas are more prone to this type of runoff. Additionally, a negative correlation was observed between eucalyptus plantations and soil moisture, implying that such plantations may reduce soil water retention capacity, negatively affecting runoff dynamics.
Forest fragments exhibited high NDVI and NDWI values, indicating dense forests with high moisture content, especially on steep slopes. This condition suggests that forest fragments have adequate soil moisture conditions and play a significant role in both delaying surface runoff, influenced by tree roots, and enhancing infiltration, further favoring moist soil conditions conducive to Dunne runoff formation, contributing to the hydrological balance of the basin. In contrast, areas undergoing savannization or lacking vegetation showed insignificant soil moisture levels, indicating the absence of recent heavy rainfall before image acquisition and highlighting the vulnerability of these areas to moisture loss following Atlantic Forest suppression.
These findings highlight the importance of riparian zones and forest cover in the hydrological dynamics of watersheds. The preservation and restoration of forested areas on steep slopes are crucial for sustainable water resource management, promoting hydrological balance within the watershed and ensuring a more balanced relationship between the different types of surface runoff, such as Hortonian and Dunnian flow, while preserving soil moisture and the edaphic microorganisms that depend on this systemic balance. Moreover, land use practices, such as eucalyptus planting, should be carefully evaluated and managed to avoid negative impacts on soil moisture and the hydrological behavior of the watershed.
In conclusion, topography and vegetation cover are determining factors in Dunne runoff dynamics, and environmental management strategies should consider these elements to ensure the sustainability of water resources and the resilience of watersheds in the face of environmental and climate changes. Implementation of conservation and restoration policies for native forests, alongside proper management of agricultural and forestry practices, can significantly enhance soil water retention capacity and aquatic ecosystem quality, ensuring water availability for future generations.
We emphasize that this investigation was limited to a specific area with complex and localized geo-environmental conditions, which poses a limitation on the generalizability of the results. However, the methodology proved to be robust and effective within the studied context. Therefore, we recommend applying this same methodological approach in other environments to assess its applicability under different environmental conditions. Testing its feasibility in diverse settings will help evaluate the adaptability and comprehensiveness of the methodology, determining whether it can provide equally reliable and accurate results across varied contexts. Expanding this approach to other geographic regions and environmental scenarios could contribute to the enhancement of analytical tools and foster new comparative studies, thereby increasing the scientific value and relevance of the research. Consequently, we suggest that future studies explore the use of this methodology under varying conditions to validate its applicability in diverse environmental contexts, broadening its potential for use and overall contribution.

Author Contributions

Conceptualization: A.M.d.O. and M.R.B.d.M.; methodology: A.M.d.O.; software: A.M.d.O.; validation: A.M.d.O.; formal analysis: L.N.A.d.O.; investigation: A.M.d.O., M.R.B.d.M. and M.B.F.; data curation: L.N.A.d.O.; writing—original draft preparation: A.M.d.O.; writing—review and editing: L.N.A.d.O. and M.B.F.; visualization: L.N.A.d.O. and M.R.B.d.M.; supervision: M.B.F.; project administration: A.M.d.O. All authors have read and agreed to the published version of the manuscript.

Funding

This research received no external funding for its execution, and the APC will be covered by the State University of Bahia.

Institutional Review Board Statement

Not applicable.

Informed Consent Statement

Not applicable.

Data Availability Statement

Data available in a publicly accessible repository: The original data presented in the study are openly available in Alaska Satellite Facility—Distributed Active Archive Center; United States Geological Survey—(USGS) and Instituto Nacional de Meteorologia INMET. at https://asf.alaska.edu/datasets/daac/alos-palsar/; https://earthexplorer.usgs.gov/; https://sisdagro.inmet.gov.br/sisdagro/app/monitoramento/bhs (accessed on 12 February 2022).

Conflicts of Interest

The authors declare no conflicts of interest.

References

  1. SOS Mata Atlântica. Available online: https://www.sosma.org.br/causas/mata-atlantica (accessed on 23 September 2024).
  2. Mohebalian, P.M.; Lopez, L.N.; Tischner, A.B.; Aguilar, F.X. Deforestation in South America’s Tri-National Paraná Atlantic Forest: Trends and Associational Factors. For. Policy Econ. 2022, 137, 102697. [Google Scholar] [CrossRef]
  3. Ahmed, K.R.; Akter, S.; Marandi, A.; Schüth, C. A Simple and Robust Wetland Classification Approach by Using Optical Indices, Unsupervised and Supervised Machine Learning Algorithms. Remote Sens. Appl. Soc. Environ. 2021, 23, 100569. [Google Scholar] [CrossRef]
  4. Gardner, R.C.; Finlayson, C. Global Wetland Outlook: State of the World’s Wetlands and Their Services to People, 1st ed.; Ramsar Convention Secretariat: Gland, Switzerland, 2018; Volume 1. [Google Scholar]
  5. Chen, L.; Jin, Z.; Michishita, R.; Cai, J.; Yue, T.; Chen, B.; Xu, B. Dynamic Monitoring of Wetland Cover Changes Using Time-Series Remote Sensing Imagery. Ecol. Inform. 2014, 24, 17–26. [Google Scholar] [CrossRef]
  6. Paul, S.; Pal, S. Mapping Wetland Habitat Health in Moribund Deltaic India Using Machine Learning and Deep Learning Algorithms. Ecohydrol. Hydrobiol. 2024, 24, 667–680. [Google Scholar] [CrossRef]
  7. Khatun, R.; Talukdar, S.; Pal, S.; Kundu, S. Measuring Dam Induced Alteration in Water Richness and Eco-Hydrological Deficit in Flood Plain Wetland. J. Environ. Manag. 2021, 285, 112157. [Google Scholar] [CrossRef] [PubMed]
  8. Singha, P.; Pal, S. Modelling Wetland Eco-Hydrological State and Its Role on Ecosystem Service Potentiality. Ecohydrol. Hydrobiol. 2024, in press. [Google Scholar] [CrossRef]
  9. Burkhard, B.; Kandziora, M.; Hou, Y.; Müller, F. Ecosystem Service Potentials, Flows and Demands-Concepts for Spatial Localisation, Indication and Quantification. Landsc. Online 2014, 34, 1–32. [Google Scholar] [CrossRef]
  10. Costanza, R.; De Groot, R.; Sutton, P.; Van Der Ploeg, S.; Anderson, S.J.; Kubiszewski, I.; Farber, S.; Turner, R.K. Changes in the Global Value of Ecosystem Services. Glob. Environ. Chang. 2014, 26, 152–158. [Google Scholar] [CrossRef]
  11. Keddy, P.; Gaudet, C.; Fraser, L.H. Effects of Low and High Nutrients on the Competitive Hierarchy of 26 Shoreline Plants. J. Ecol. 2000, 88, 413–423. [Google Scholar] [CrossRef]
  12. Rajwa-Kuligiewicz, A.; Bojarczuk, A. Streamflow Response to Catastrophic Windthrow and Forest Recovery in Subalpine Spruce Forest. J. Hydrol. 2024, 634, 131078. [Google Scholar] [CrossRef]
  13. Tran, T.-N.-D.; Nguyen, B.Q.; Grodzka-Łukaszewska, M.; Sinicyn, G.; Lakshmi, V. The Role of Reservoirs under the Impacts of Climate Change on the Srepok River Basin, Central Highlands of Vietnam. Front. Environ. Sci. 2023, 11, 1304845. [Google Scholar] [CrossRef]
  14. Ahmed, K.R.; Akter, S. Analysis of Landcover Change in Southwest Bengal Delta Due to Floods by NDVI, NDWI and K-Means Cluster with Landsat Multi-Spectral Surface Reflectance Satellite Data. Remote Sens. Appl. Soc. Environ. 2017, 8, 168–181. [Google Scholar] [CrossRef]
  15. Steenhuis, T.S.; Mukundan, R.; Tilahun, S.A. Overland Flow. In Encyclopedia of Soils in the Environment, 2nd ed.; Goss, M.J., Oliver, M., Eds.; Academic Press: Oxford, UK, 2023; pp. 287–293. ISBN 978-0-323-95133-3. [Google Scholar]
  16. Dunne, T. Relation of Field Studies and Modeling in the Prediction of Storm Runoff. J. Hydrol. 1983, 65, 25–48. [Google Scholar] [CrossRef]
  17. Dunne, T.; Black, R.D. An Experimental Investigation of Runoff Production in Permeable Soils. Water Resour. Res. 1970, 6, 478–490. [Google Scholar] [CrossRef]
  18. Gilbert, J.M.; Jefferson, J.L.; Constantine, P.G.; Maxwell, R.M. Global Spatial Sensitivity of Runoff to Subsurface Permeability Using the Active Subspace Method. Adv. Water Resour. 2016, 92, 30–42. [Google Scholar] [CrossRef]
  19. Hornberger, G.M.; Raffensperger, J.P.; Wiberg, P.L.; Eshleman, K.N. Elements of Physical Hydrology; Edition Unstated; Johns Hopkins University Press: Baltimore, MD, USA, 1998; ISBN 978-0-8018-5857-4. [Google Scholar]
  20. dos Santos, P.V. Impactos ambientais causados pela perfuração em busca do petróleo. Cad. Grad.-Ciênc. Exatas Tecnol. Unit 2012, 1, 153–163. [Google Scholar]
  21. Zakia, M.J.B.; Ferraz, F.F.B.; Righetto, A.M.; de Paula Lima, W. Delimitação da zona ripária em uma microbacia. Rev. Agrogeoambiental 2009, 1, 51–61. [Google Scholar] [CrossRef]
  22. Mendiondo, E.M.; Tucci, C.E.M. Escalas hidrológicas II: Diversidade de processos na bacia vertente. Hydrol. Scales II Divers. Process. Hillslope 1997, 2, 81–100. [Google Scholar]
  23. Siefert, C.A.C.; Santos, I.D. Mecanismos de geração de escoamento e áreas hidrologicamente sensíveis: Uma abordagem hidrogeomorfológica para delimitação de áreas de preservação permanente. Ra’e Ga 2012, 24, 227–257. [Google Scholar] [CrossRef]
  24. Weyman, D.R. Throughflow on Hillslopes and Its Relation to the Stream Hydrograph. Int. Assoc. Sci. Hydrology. Bull. 1970, 15, 25–33. [Google Scholar] [CrossRef]
  25. USGS. Precipitation Runoff Modeling System (PRMS) as Part of an Integrated Hydrologic Model for the Osage Nation, Northeastern Oklahoma, 1915–2014; Scientific Investigations Report; USGS: Reston, VA. USA, 2020.
  26. Santos, I. Monitoramento e Modelagem de Processos Hidrogeomorfológicos: Mecanismos de Geração de Escoamento e Conectividade Hidrológica. Ph.D. Thesis, Universidade Federal de Santa Catarina, Florianópolis, SC, Brazil, 2009. [Google Scholar]
  27. Elsenbeer, H. Hydrologic Flowpaths in Tropical Rainforest Soilscapes—A Review. Hydrol. Process. 2001, 15, 1751–1759. [Google Scholar] [CrossRef]
  28. Tran, T.-N.-D.; Lakshmi, V. Enhancing Human Resilience against Climate Change: Assessment of Hydroclimatic Extremes and Sea Level Rise Impacts on the Eastern Shore of Virginia, United States. Sci. Total Environ. 2024, 947, 174289. [Google Scholar] [CrossRef] [PubMed]
  29. Nunes, J.M.D.C.; Matos, M.R.B.D. Litoral Norte da Bahia: Caracterização Ambiental, Biodiversidade e Conservação; Edufba: Salvador, Brazil, 2021; ISBN 978-85-232-1456-2. [Google Scholar]
  30. Esquivel, M.S. A Zona Costeira dos Municípios do Litoral Norte e Entorno da Baía de Todos os Santos—Estado da Bahia: Implicações para a Gestão Ambiental; Universidade Federal da Bahia: Salvador, Brazil, 2016. [Google Scholar]
  31. INMET. Instituto Nacional de Meteorologia. SISDAGRO. Available online: https://sisdagro.inmet.gov.br/sisdagro/app/monitoramento/bhs (accessed on 29 May 2024).
  32. Breiman, L. Random Forests. Mach. Learn. 2001, 45, 5–32. [Google Scholar] [CrossRef]
  33. Belgiu, M.; Drăguţ, L. Random Forest in Remote Sensing: A Review of Applications and Future Directions. ISPRS J. Photogramm. Remote Sens. 2016, 114, 24–31. [Google Scholar] [CrossRef]
  34. Pal, M.; Mather, P.M. Support Vector Machines for Classification in Remote Sensing. Int. J. Remote Sens. 2005, 26, 1007–1011. [Google Scholar] [CrossRef]
  35. Maxwell, A.E.; Warner, T.A.; Fang, F. Implementation of Machine-Learning Classification in Remote Sensing: An Applied Review. Int. J. Remote Sens. 2018, 39, 2784–2817. [Google Scholar] [CrossRef]
  36. Pal, M. Random Forest Classifier for Remote Sensing Classification. Int. J. Remote Sens. 2005, 26, 217–222. [Google Scholar] [CrossRef]
  37. Salzberg, S.L. C4.5: Programs for Machine Learning by J. Ross Quinlan. Morgan Kaufmann Publishers, Inc., 1993. Mach. Learn. 1994, 16, 235–240. [Google Scholar] [CrossRef]
  38. Pedregosa, F.; Varoquaux, G.; Gramfort, A.; Michel, V.; Thirion, B.; Grisel, O.; Blondel, M.; Prettenhofer, P.; Weiss, R.; Dubourg, V.; et al. Scikit-Learn: Machine Learning in Python. Mchine Learn. Python 2011, 12, 2825–2830. [Google Scholar]
  39. Chandramohan, K.; Elayapillai, P.; Vijayalakshmi, G.; Kaliraj, S. Chapter 43—Evaluating the Relation of NDVI, NDWI, SMI, and LAI to Land and Soil Degradation Processes—A Case Study of Virudhunagar District, Tamil Nadu, India. In Remote Sensing of Soils; Dharumarajan, S., Kaliraj, S., Adhikari, K., Lalitha, M., Kumar, N., Eds.; Elsevier: Amsterdam, The Netherlands, 2024; pp. 689–697. ISBN 978-0-443-18773-5. [Google Scholar]
  40. Zheng, Y.; Tang, L.; Wang, H. An Improved Approach for Monitoring Urban Built-up Areas by Combining NPP-VIIRS Nighttime Light, NDVI, NDWI, and NDBI. J. Clean. Prod. 2021, 328, 129488. [Google Scholar] [CrossRef]
  41. Huang, X.; Weng, C.; Lu, Q.; Feng, T.; Zhang, L. Automatic Labelling and Selection of Training Samples for High-Resolution Remote Sensing Image Classification over Urban Areas. Remote Sens. 2015, 7, 16024–16044. [Google Scholar] [CrossRef]
  42. Montandon, L.M.; Small, E.E. The Impact of Soil Reflectance on the Quantification of the Green Vegetation Fraction from NDVI. Remote Sens. Environ. 2008, 112, 1835–1845. [Google Scholar] [CrossRef]
  43. Gao, B. NDWI—A Normalized Difference Water Index for Remote Sensing of Vegetation Liquid Water from Space. Remote Sens. Environ. 1996, 58, 257–266. [Google Scholar] [CrossRef]
  44. Pereira, L.E.; Amorim, G.; Grigio, A.M.; Paranhos, A.C. Comparative Analysis of Normalized Difference Water Index (NDWI) Methods in Continental Wetland. Anuário Instituto Geociências (Ufrj. Impresso) 2018, 41, 654–662. [Google Scholar] [CrossRef]
  45. Congalton, R.G. Assessing Landsat Classification Accuracy Using Discrete Multivariate Analysis Statistical Techniques. Photogramm. Eng. 1983, 49, 1671–1678. [Google Scholar]
  46. Rosenfield, G.H. A Coefficient of Agreement as a Measure of Thematic Classification Accuracy. Photogramm. Eng. Remote Sens. 1986, 2, 223–227. [Google Scholar]
  47. Foody, G.M. Explaining the Unsuitability of the Kappa Coefficient in the Assessment and Comparison of the Accuracy of Thematic Maps Obtained by Image Classification. Remote Sens. Environ. 2020, 239, 111630. [Google Scholar] [CrossRef]
  48. Silva, A.C.G.; Trevisan, G.d.M. Comparação da classificação de ocupação do solo do município de frederico westphalen-rs, utilizando os métodos isodata e distância mínima. Nativa 2019, 7, 727–733. [Google Scholar] [CrossRef]
  49. Fonseca, A.D.; Fernande, J.C. Detecção Remota; Edições Técnicas; Lidel: Lisboa, Portugal, 2004; ISBN 978-972-757-292-2. [Google Scholar]
  50. Mather, P.; Tso, B. Classification Methods for Remotely Sensed Data, 2nd ed.; CRC Press: Boca Raton, FL, USA, 2009; ISBN 978-0-429-19202-9. [Google Scholar]
  51. Helldén, U.; Stern, M. Monitoring land degradation in southern Tunisia: A test of LANDSAT imagery and digital data. Environ. Sci. Geogr. 1980, 1, 1601–1611. [Google Scholar]
  52. Ashok, A.; Rani, H.P.; Jayakumar, K.V. Monitoring of Dynamic Wetland Changes Using NDVI and NDWI Based Landsat Imagery. Remote Sens. Appl. Soc. Environ. 2021, 23, 100547. [Google Scholar] [CrossRef]
  53. Horton, R.E. Analysis of Runoff-Plat Experiments with Varying Infiltration-Capacity. Eos Trans. Am. Geophys. Union 1939, 20, 693–711. [Google Scholar] [CrossRef]
  54. Liu, H.; Lei, T.W.; Zhao, J.; Yuan, C.P.; Fan, Y.T.; Qu, L.Q. Effects of Rainfall Intensity and Antecedent Soil Water Content on Soil Infiltrability under Rainfall Conditions Using the Run Off-on-out Method. J. Hydrol. 2011, 396, 24–32. [Google Scholar] [CrossRef]
  55. Sinha, S.; Rode, M.; Borchardt, D. Examining Runoff Generation Processes in the Selke Catchment in Central Germany: Insights from Data and Semi-Distributed Numerical Model. J. Hydrol. Reg. Stud. 2016, 7, 38–54. [Google Scholar] [CrossRef]
  56. Dixon, J.C. 4.3 Pedogenesis with Respect to Geomorphology. In Treatise on Geomorphology; Elsevier: Amsterdam, The Netherlands, 2013; pp. 27–43. ISBN 978-0-08-088522-3. [Google Scholar]
  57. Silva, M.S.L.D.; Oliveira Neto, M.B.D. Latossolos Amarelos—Portal Embrapa. Available online: https://www.embrapa.br/agencia-de-informacao-tecnologica/territorios/territorio-mata-sul-pernambucana/caracteristicas-do-territorio/recursos-naturais/solos/latossolos-amarelos (accessed on 5 April 2024).
  58. Wang, J.; Cui, C.; Jia, Z.; Liu, M.; Pang, S.; Zhai, K. Analysis of the Responses of Surface Water Resources to Climate Change in Arid and Semi-Arid Area. Agric. Water Manag. 2024, 295, 108751. [Google Scholar] [CrossRef]
  59. Cherlink, V. NDVI FAQs: Frequently Asked Questions About the Index. Available online: https://eos.com/blog/ndvi-faq-all-you-need-to-know-about-ndvi/ (accessed on 6 May 2024).
  60. Barbosa, H.A.; Huete, A.R.; Baethgen, W.E. A 20-Year Study of NDVI Variability over the Northeast Region of Brazil. J. Arid Environ. 2006, 67, 288–307. [Google Scholar] [CrossRef]
  61. Aegro O que são mapas NDVI e como utilizá-los na fazenda. Blog da Aegro 2020. Available online: https://blog.aegro.com.br/ndvi/ (accessed on 13 May 2024).
  62. Oliveira, M.D.G.S. O Eucalipto no Município de Alagoinhas-ba: Influências na Qualidade de vida da População do Entorno Florestal e no meio Ambiente. Available online: http://famamportal.com.br:8082/jspui/bitstream/123456789/2574/1/Maria%20das%20Gra%c3%a7as%20Santos%20Oliveira.pdf (accessed on 8 November 2023).
  63. Farrar, T.J.; Nicholson, S.E.; Lare, A.R. The Influence of Soil Type on the Relationships between NDVI, Rainfall, and Soil Moisture in Semiarid Botswana. II. NDVI Response to Soil Moisture. Remote Sens. Environ. 1994, 50, 121–133. [Google Scholar] [CrossRef]
  64. Georganos, S.; Abdi, A.M.; Tenenbaum, D.E.; Kalogirou, S. Examining the NDVI-Rainfall Relationship in the Semi-Arid Sahel Using Geographically Weighted Regression. J. Arid Environ. 2017, 146, 64–74. [Google Scholar] [CrossRef]
  65. Zeng, Y.; Hao, D.; Huete, A.; Dechant, B.; Berry, J.; Chen, J.M.; Joiner, J.; Frankenberg, C.; Bond-Lamberty, B.; Ryu, Y.; et al. Optical Vegetation Indices for Monitoring Terrestrial Ecosystems Globally. Nat. Rev. Earth Environ. 2022, 3, 477–493. [Google Scholar] [CrossRef]
  66. Herrmann, S.M.; Anyamba, A.; Tucker, C.J. Recent Trends in Vegetation Dynamics in the African Sahel and Their Relationship to Climate. Glob. Environ. Chang. 2005, 15, 394–404. [Google Scholar] [CrossRef]
  67. Wang, L.; Qu, J.J. NMDI: A Normalized Multi-Band Drought Index for Monitoring Soil and Vegetation Moisture with Satellite Remote Sensing. Geophys. Res. Lett. 2007, 34, 1–5. [Google Scholar] [CrossRef]
Figure 1. Surface runoff by soil saturation through the Dunnian mechanism, highlighting the saturation process at the upper slopes and its infiltration along the longitudinal profile of the watershed, culminating in Dunnian runoff. Source: [22], modified.
Applsci 15 03977 g001
Figure 2. Conceptual model of components of the saturated soil zone model and precipitation system source [25], modified.
Applsci 15 03977 g002
Figure 3. Location of the Sauípe River basin on the northern coast of Bahia, Brazil.
Applsci 15 03977 g003
Figure 4. The result of machine learning classification, highlighting some areas of interest for Dunnian runoff. (1) Prominent presence of savanna. (2) Concentration of mining activity. (3) Concentration of the largest fragments of Atlantic Forest and intrusion of forestry. (4) River mouth, showing the complexity of spatial use with forestry, eucalyptus, and savannization.
Applsci 15 03977 g004
Figure 5. NDVI in the Sauípe River basin, highlighting the low index in 1 West and 2 South, in the former primarily due to deforestation and replacement of the Atlantic Forest by savanna, and in the latter due to sand mining activities. Areas 3 (north) and 4 (river mouth) exhibit the highest indices, driven mainly by soil moisture, as we will discuss later.
Applsci 15 03977 g005
Figure 6. Hypsometric map of the Sauípe River basin, highlighting 1 (west) and 3 (north) areas with higher elevations. Area 3 shows a greater tendency towards Dunnian runoff. In 2 (south) and 4 (mouth), elevations and slopes are lower.
Applsci 15 03977 g006
Figure 7. The soil moisture index proposed by [43]. We highlight that savanna areas 1 (west) and mining areas 2 (south) have the lowest indices. Areas 3 (north) and 4 (river mouth) show the highest indices, with area 3 having higher slopes and forest fragments, indicating the complex relationship between the Atlantic Forest, soil moisture, and hydrology in this basin.
Applsci 15 03977 g007
Figure 8. Statistical summary of NDWI in the floodplain area. (A) The bar chart of NDWI indicates that the highest concentration of these values is below 0.2; (B) The cumulative frequency of NDWI.
Applsci 15 03977 g008
Figure 9. Annual water balance for the region of the studied watershed, emphasizing the beginning of the water deficit period when the Landsat image was acquired.
Applsci 15 03977 g009
Figure 10. Relationship between NDVI and NDWI, showing a positive correlation between the two indices, presenting a value of 0.9.
Applsci 15 03977 g010
Figure 11. Box plot comparing NDVI and NDWI for the area classified as Atlantic Forest. In (A), the box plot of NDVI for the forest fragments is presented, and in (B), the box plot of NDWI for the same area is shown.
Applsci 15 03977 g011
Figure 12. The correlation between NDWI and NDVI for various sampled areas within the studied basin is presented, with NDWI plotted on the X-axis and NDVI on the Y-axis. In (A), the relationship between NDWI and NDVI for forest fragment samples is shown. In (B), the correlation between the spectral indices for the eucalyptus region is presented. (C) shows the correlation between NDWI and NDVI for exposed soil samples. Finally, in (D), the correlation between these indices for savanna area samples is presented.
Applsci 15 03977 g012aApplsci 15 03977 g012b
Figure 13. Box plot diagram showing the NDVI and NDWI values for different vegetation types (land use) found in the Sauípe River basin.
Applsci 15 03977 g013
Table 1. Confusion matrix of the classification performed by the Random Forest model applied to the Sauípe River basin, showing excellent classification results.
Random 70ForestEucalyptusExposed SoilBrazilian SavannahMining
Forest16127080
Eucalyptus31220020
Exposed Soil00112703
Brazilian Savannah8004371
Mining011069
Disclaimer/Publisher’s Note: The statements, opinions and data contained in all publications are solely those of the individual author(s) and contributor(s) and not of MDPI and/or the editor(s). MDPI and/or the editor(s) disclaim responsibility for any injury to people or property resulting from any ideas, methods, instructions or products referred to in the content.

