
Dynamometer Resistance Pad Position Influences Knee Strength and Hamstring/Quadriceps Ratio in Professional Basketball Players: Retrospective Observational Study

 , , , , and
Abstract
1. Introduction
2. Materials and Methods
2.1. Experimental Design
2.2. Subjects
2.3. Measurements
2.4. Statistical Analysis
3. Results
4. Discussion
5. Conclusions
6. Limitations and Future Lines of Research
Author Contributions
Funding
Institutional Review Board Statement
Informed Consent Statement
Data Availability Statement
Conflicts of Interest
References
- Risberg, M.A.; Steffen, K.; Nilstad, A.; Myklebust, G.; Kristianslund, E.; Moltubakk, M.M.; Krosshaug, T. Normative quadriceps and hamstring muscle strength values for female, healthy, elite handball and football players. J. Strength Cond. Res. 2018, 32, 2314–2323. [Google Scholar] [CrossRef] [PubMed]
- Brígido-Fernández, I.; José, F.G.-M.S.; Charneco-Salguero, G.; Cárdenas-Rebollo, J.M.; Ortega-Latorre, Y.; Carrión-Otero, O.; Fernández-Rosa, L. Knee isokinetic profiles and reference values of professional female soccer players. Sports 2022, 10, 204. [Google Scholar] [CrossRef] [PubMed]
- Alt, T.; Knicker, A.J.; Strüder, H.K. Assessing thigh muscle balance of male athletes with special emphasis on eccentric hamstring strength. Physician Sportsmed. 2020, 48, 327–334. [Google Scholar] [CrossRef]
- Andrade, M.S.; Junqueira, M.S.; De Lira, C.A.B.; Vancini, R.L.; Seffrin, A.; Nikolaidis, P.T.; Rosemann, T.; Knechtle, B. Age-related differences in torque in angle-specific and peak torque hamstring to quadriceps ratios in female soccer players from 11 to 18 years old: A cross-sectional study. Res. Sports Med. 2020, 29, 77–89. [Google Scholar] [CrossRef] [PubMed]
- Heinert, B.L.; Collins, T.; Tehan, C.; Ragan, R.; Kernozek, T.W. Effect of hamstring-to-quadriceps ratio on knee forces in females during landing. Int. J. Sports Med. 2021, 42, 264–269. [Google Scholar] [CrossRef]
- Larwa, J.; Stoy, C.; Chafetz, R.S.; Boniello, M.; Franklin, C. Stiff landings, core stability, and dynamic knee valgus: A systematic review on documented anterior cruciate ligament ruptures in male and female athletes. Int. J. Environ. Res. Public Health 2021, 18, 3826. [Google Scholar] [CrossRef] [PubMed]
- Collings, T.J.; Diamond, L.E.; Barrett, R.S.; Timmins, R.G.; Hickey, J.T.; DU Moulin, W.S.; Williams, M.D.; Beerworth, K.A.; Bourne, M.N. Strength and biomechanical risk factors for noncontact ACL injury in elite female footballers: A prospective study. Med. Sci. Sports Exerc. 2022, 54, 1242–1251. [Google Scholar] [CrossRef]
- Törpel, A.; Becker, T.; Thiers, A.; Hamacher, D.; Schega, L. Intersession reliability of isokinetic strength testing in knee and elbow extension and flexion using the BTE PrimusRS. J. Sport Rehabilit. 2017, 26, 1–14. [Google Scholar] [CrossRef] [PubMed]
- Kellis, E.; Sahinis, C.; Baltzopoulos, V. Is hamstrings-to-quadriceps torque ratio useful for predicting anterior cruciate ligament and hamstring injuries? A systematic and critical review. J. Sport Health Sci. 2023, 12, 343–358. [Google Scholar] [CrossRef]
- Perkins, S.; Canavan, P. Isokinetic assessment of knee flexor and extensor strength and lower extremity flexibility assessment of an NCAA Division III men’s soccer team. Int. J. Sports Phys. Ther. 2023, 18, 626–635. [Google Scholar] [CrossRef]
- Watson, M.D.; Collins, B.K.; Davies, G.J.; Riemann, B.L. The influence of hip flexion and isokinetic velocity on hamstrings-quadriceps strength ratios in healthy females. Res. Q. Exerc. Sport 2022, 93, 695–701. [Google Scholar] [CrossRef]
- Kolodziej, M.; Nolte, K.; Schmidt, M.; Alt, T.; Jaitner, T. Identification of neuromuscular performance parameters as risk factors of non-contact injuries in male elite youth soccer players: A preliminary study on 62 players with 25 non-contact injuries. Front. Sports Act. Living 2021, 3, 615330. [Google Scholar] [CrossRef]
- Sun, K.; Pan, D. Analysis on the characteristics and relationships of lower limbs strength and power of sailors in different positions and levels. PLoS ONE 2023, 18, e0289273. [Google Scholar] [CrossRef]
- Croisier, J.; Ciavatta, P.; Forthomme, B. Influence of the dynamometer and knee joint axis of rotation alignment on the isokinetic measurements. Isokinet. Exerc. Sci. 2005, 13, 3–48. [Google Scholar] [CrossRef]
- Otten, R.; Whiteley, R.; Mitchell, T. Effect of subject restraint and resistance pad placement on isokinetic knee flexor and extensor strength: Implications for testing and rehabilitation. Sports Health 2013, 5, 137–142. [Google Scholar] [CrossRef] [PubMed]
- Westwater-Wood, S.; Adams, N.; Kerry, R. The use of proprioceptive neuromuscular facilitation in physiotherapy practice. Phys. Ther. Rev. 2010, 15, 23–28. [Google Scholar] [CrossRef]
- Guiu-Tula, F.X.; Cabanas-Valdés, R.; Sitjà-Rabert, M.; Urrútia, G.; Gómara-Toldrà, N. The efficacy of the proprioceptive neuromuscular facilitation (PNF) approach in stroke rehabilitation to improve basic activities of daily living and quality of life: A systematic review and meta-analysis protocol. BMJ Open 2017, 7, e016739. [Google Scholar] [CrossRef] [PubMed]
- Bertinchamp, U. Concepto FNP: Facilitación neuromuscular propioceptiva (método Kabat-Knott-Voss) [PNF concept: Proprioceptive neuromuscular facilitation (Kabat-Knott-Voss method).]. EMC Kinesiterapia Med. FÍSica 2017, 38, 1–13. [Google Scholar] [CrossRef]
- Bonhof-Jansen, E.; van Ham, A.; Kroon, G.J.; Winter, R.W.; Brink, S.M. Validity and reliability of a portable handheld dynamometer compared to a fixed isokinetic dynamometer to assess forearm torque strength. Hand Surg. Rehabilit. 2023, 42, 147–153. [Google Scholar] [CrossRef] [PubMed]
- Nunes, J.P.; Cunha, P.M.; Mayhew, J.L.; Ribeiro, A.S.; Junior, P.S.; Fernandes, R.R.; Cyrino, E.S. Influence of handgrip stabilization during isokinetic knee strength assessment in older women. Percept. Mot. Ski. 2020, 127, 671–683. [Google Scholar] [CrossRef]
- Stumbo, T.A.; Merriam, S.; Nies, K.; Smith, A.; Spurgeon, D.; Weir, J.P. The effect of hand-grip stabilization on isokinetic torque at the knee. J. Strength Cond. Res. 2001, 15, 372–377. Available online: https://journals.lww.com/nsca-jscr/abstract/2001/08000/the_effect_of_hand_grip_stabilization_on.20.aspx (accessed on 18 January 2024).
- Guenzkofer, F.; Bubb, H.; Senner, V.; Bengler, R.K. Dependency of knee extension torque on different types of stabilization. Int. J. Hum. Factors Model. Simul. 2012, 3, 1–15. [Google Scholar] [CrossRef]
- Rouis, M.; Coudrat, L.; Jaafar, H.; Filliard, J.-R.; Vandewalle, H.; Barthelemy, Y.; Driss, T. Assessment of isokinetic knee strength in elite young female basketball players: Correlation with vertical jump. J. Sports Med. Phys. Fit. 2015, 55, 1502–1508. Available online: https://www.minervamedica.it/en/journals/sports-med-physical-fitness/article.php?cod=R40Y2015N12A1502 (accessed on 18 January 2024).
- Aagaard, P.; Simonsen, E.B.; Trolle, M.; Bangsbo, J.; Klausen, K. Isokinetic hamstring/quadriceps strength ratio: Influence from joint angular velocity, gravity correction and contraction mode. Acta Physiol. Scand. 1995, 154, 421–427. [Google Scholar] [CrossRef]
- Kellis, E.; Katis, A. Quantification of functional knee flexor to extensor moment ratio using isokinetics and electromyography. J. Athl. Train. 2007, 42, 477–485. Available online: https://www.ncbi.nlm.nih.gov/pmc/articles/PMC2140073/ (accessed on 18 January 2024). [PubMed]
- Ribeiro-Alvares, J.B.; Oliveira, G.D.S.; De Lima-E-Silva, F.X.; Baroni, B.M. Eccentric knee flexor strength of professional football players with and without hamstring injury in the prior season. Eur. J. Sport Sci. 2021, 21, 131–139. [Google Scholar] [CrossRef] [PubMed]
- Baroni, B.M.; Ruas, C.V.; Ribeiro-Alvares, J.B.; Pinto, R.S. Hamstring-to-quadriceps torque ratios of professional male soccer players: A systematic review. J. Strength Cond. Res. 2020, 34, 281–293. [Google Scholar] [CrossRef] [PubMed]
- Dauty, M.; Menu, P.; Fouasson-Chailloux, A.; Ferréol, S.; Dubois, C. Prediction of hamstring injury in professional soccer players by isokinetic measurements. Muscle Ligaments Tendons J. 2016, 6, 116–123. [Google Scholar] [CrossRef]
- Dauty, M.; Menu, P.; Fouasson-Chailloux, A. Cutoffs of isokinetic strength ratio and hamstring strain prediction in professional soccer players. Scand. J. Med. Sci. Sports 2018, 28, 276–281. [Google Scholar] [CrossRef]
- Grygorowicz, M.; Michałowska, M.; Walczak, T.; Owen, A.; Grabski, J.K.; Pyda, A.; Piontek, T.; Kotwicki, T. Discussion about different cut-off values of conventional hamstring-to-quadriceps ratio used in hamstring injury prediction among professional male football players. PLoS ONE 2017, 12, e0188974. [Google Scholar] [CrossRef]
- Carvalho, A.; Brown, S.; Abade, E. Evaluating injury risk in first and second league professional Portuguese soccer: Muscular strength and asymmetry. J. Hum. Kinet. 2016, 51, 19–26. [Google Scholar] [CrossRef] [PubMed]
- Esmaeili, H.; Sharifi, A. Bilateral asymmetry of hamstring to quadriceps isokinetic torque ratio in different angular velocities in professional basketball players. Knee 2022, 37, 3–9. [Google Scholar] [CrossRef] [PubMed]
- Yoon, T.S.; Park, D.S.; Kang, S.W.; Chun, S.I.; Shin, J.S. Isometric and isokinetic torque curves at the knee joint. Yonsei Med. J. 1991, 32, 33–43. [Google Scholar] [CrossRef] [PubMed]


| Variable 1 | Position | Mean (±SD) | Median | 25th Percentile | 75th Percentile | p-Value | Cohen d |
|---|---|---|---|---|---|---|---|
| Flexion peak strength at 30°/s | AA | 244 ± 78 | 212 | 195 | 301 | <0.001 * | −0.908 |
| PA | 277 ± 78 | 284 | 210 | 323 | |||
| Flexion peak strength at 120°/s | AA | 270 ± 70 | 272 | 208 | 332 | 0.027 * | −0.478 |
| PA | 296 ± 82 | 289 | 235 | 355 | |||
| Flexion peak strength at 240°/s | AA | 287 ± 76 | 289 | 221 | 329 | 0.602 | −0.114 |
| PA | 291 ± 86 | 275 | 231 | 329 | |||
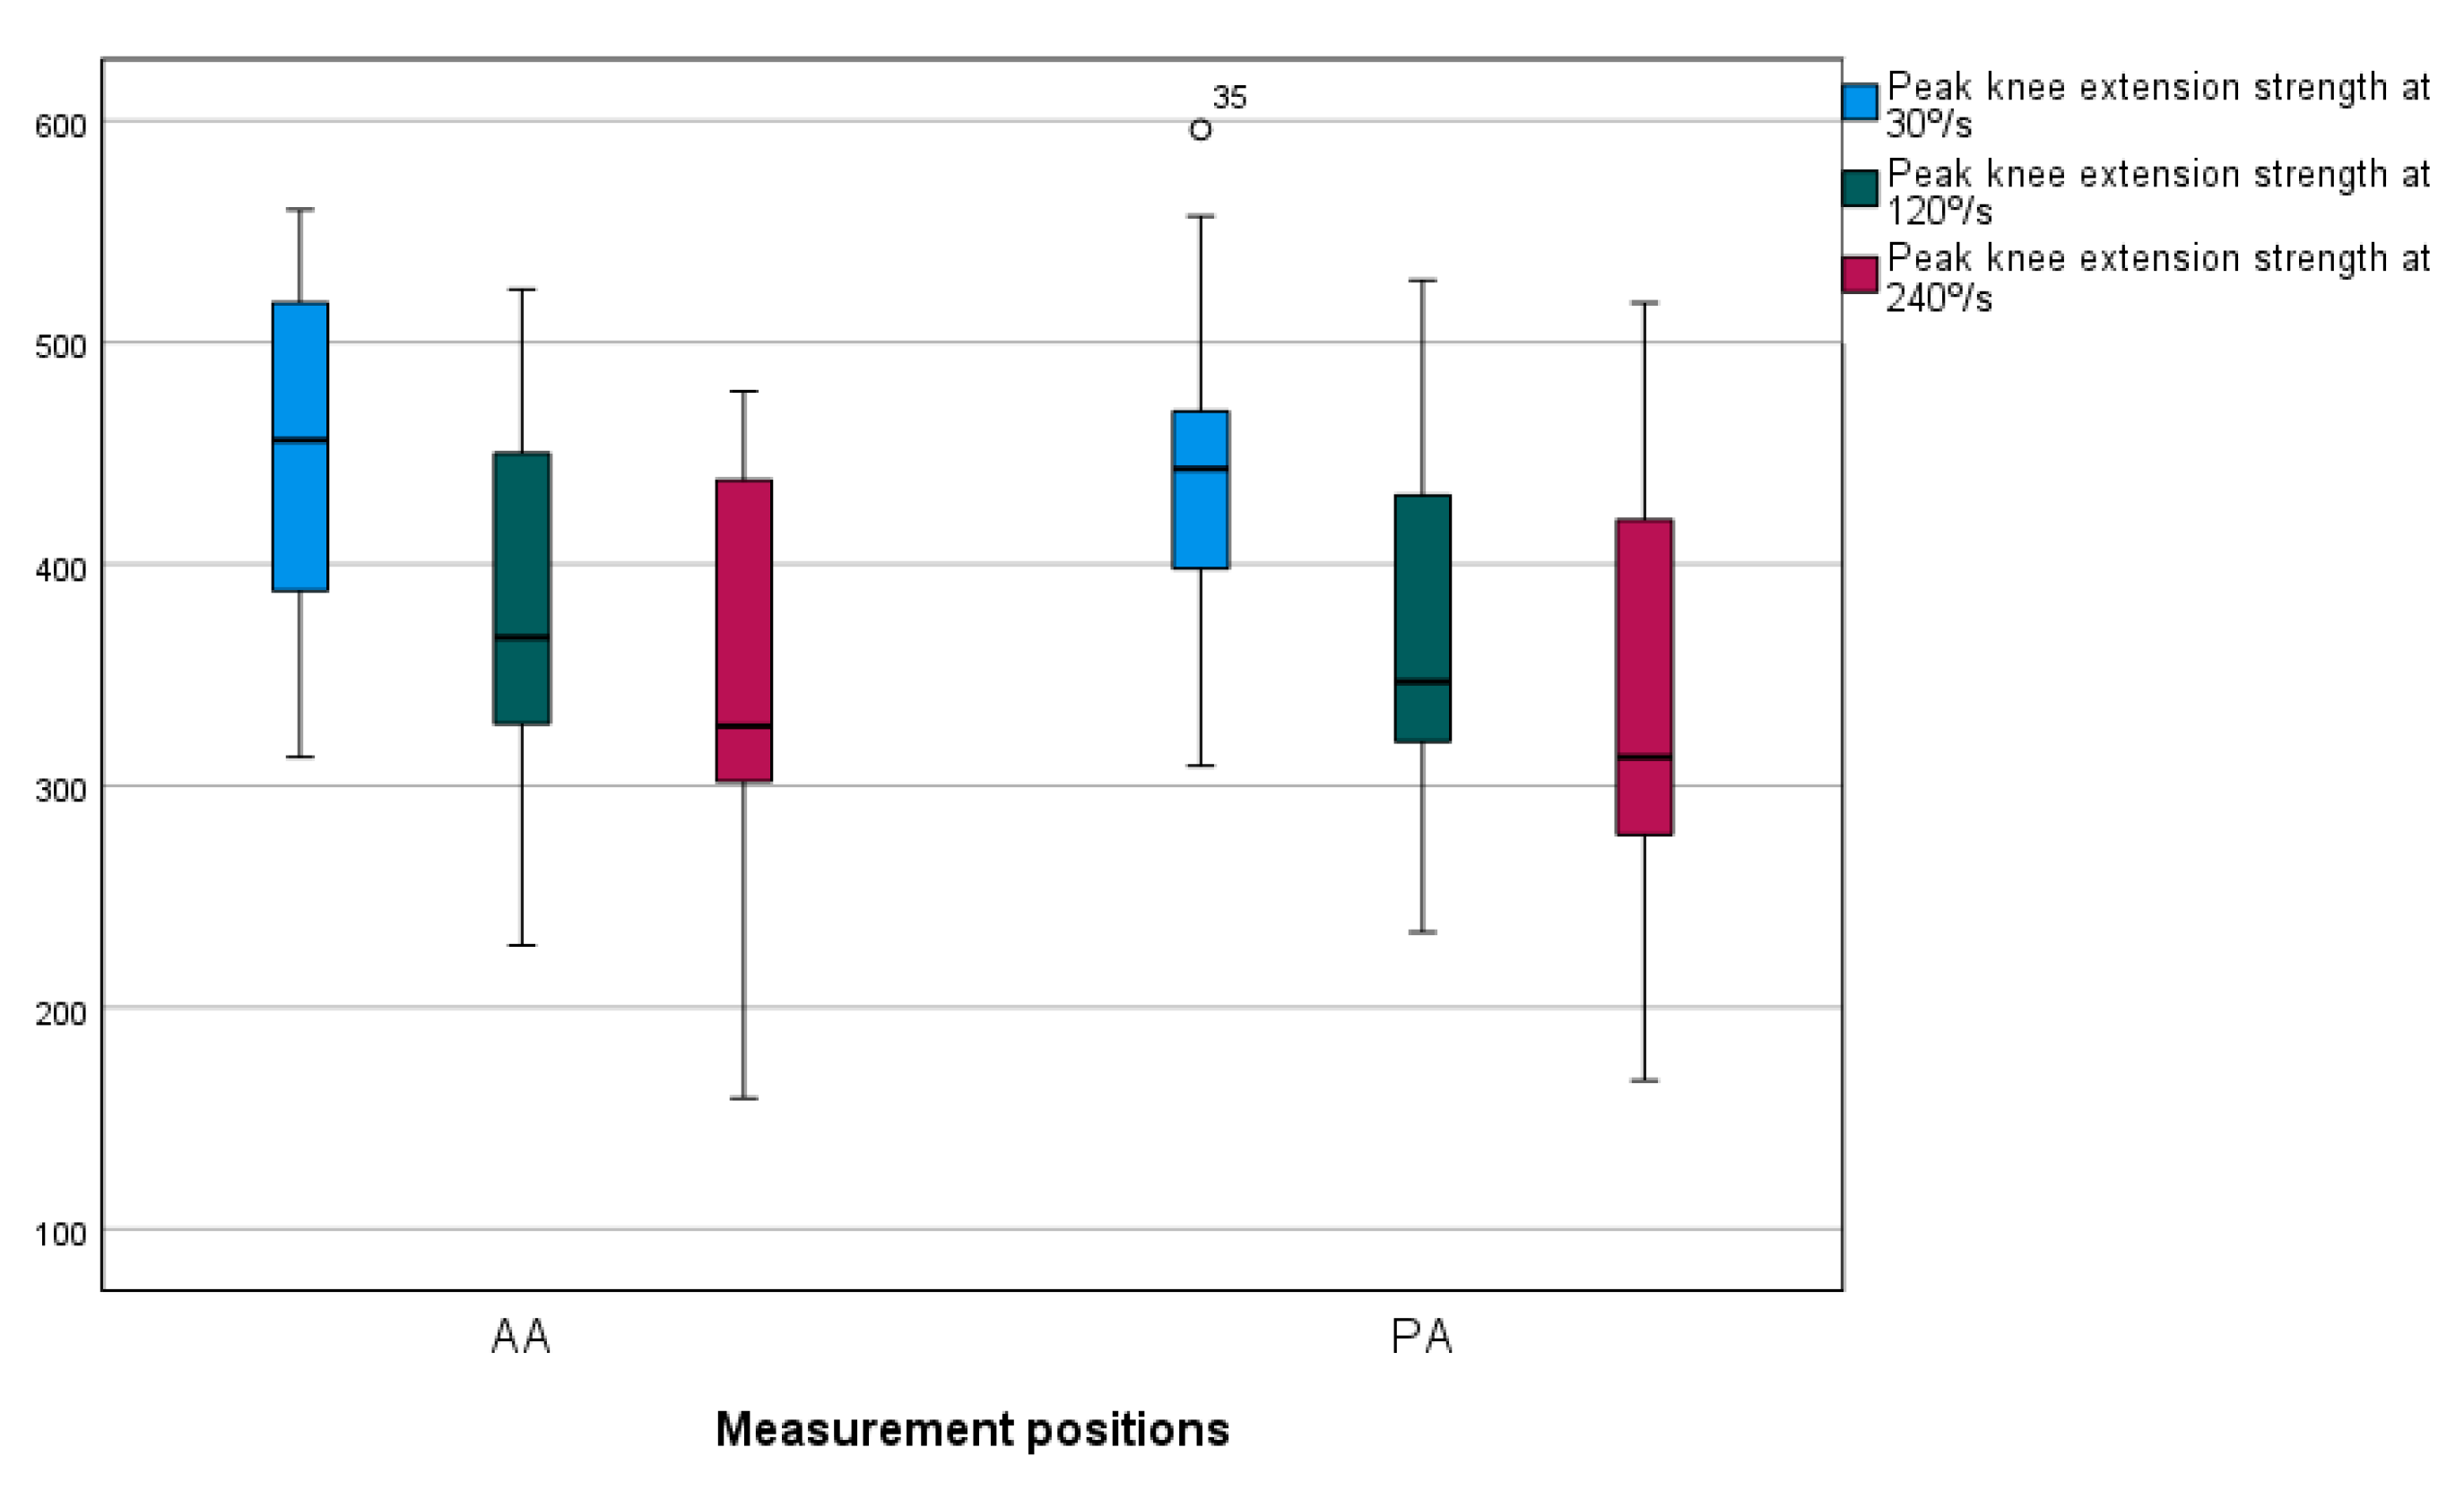
| Extension peak strength at 30°/s | AA | 449 ± 75 | 451 | 388 | 518 | 0.702 | 0.102 |
| PA | 445 ± 71 | 445 | 398 | 469 | |||
| Extension peak strength at 120°/s | AA | 375 ± 85 | 352 | 327 | 450 | 0.948 | 0.070 |
| PA | 371 ± 82 | 349 | 320 | 431 | |||
| Extension peak strength at 240°/s | AA | 350 ± 90 | 327 | 302 | 438 | 0.06 | 0.315 |
| PA | 335 ± 98 | 313 | 278 | 420 | |||
| H/Q ratio at 30°/s | AA | 0.54 ± 0.14 | 0.554 | 0.436 | 0.644 | <0.001 * | −1.087 |
| PA | 0.62 ± 0.12 | 0.622 | 0.52 | 0.712 | |||
| H/Q ratio at 120°/s | AA | 0.75 ± 0.22 | 0.709 | 0.579 | 0.954 | 0.115 | −0.338 |
| PA | 0.81 ± 0.19 | 0.789 | 0.667 | 0.918 | |||
| H/Q ratio at 240°/s | AA | 0.84 ± 0.2 | 0.792 | 0.703 | 0.985 | 0.181 | −0.287 |
| PA | 0.89 ± 0.17 | 0.923 | 0.727 | 1.023 | |||
| Work at 30°/s | AA | 663 ± 224 | 581 | 464 | 832 | 0.074 | −0.404 |
| PA | 691 ± 240 | 621 | 536 | 844 | |||
| Work at 120°/s | AA | 940 ± 339 | 886 | 700 | 1029 | 0.019 * | −0.518 |
| PA | 990 ± 362 | 973 | 697 | 1034 | |||
| Work at 240°/s | AA | 1323 ± 557 | 1195 | 974 | 1586 | 0.702 | −0.287 |
| PA | 1377 ± 607 | 1227 | 969 | 1576 |
| Variable 1 | Position | Angular Velocity | Mean (±SD) | Median | 25th Percentile | 75th Percentile | p-Value | Post hoc | p-Value | Cohen d |
|---|---|---|---|---|---|---|---|---|---|---|
| Flexion peak strength | AA | 30°/s | 244 ± 78 | 212 | 195 | 301 | 0.005 * | 30–120 | 0.495 | 0.281 |
| 120°/s | 270 ± 70 | 272 | 208 | 332 | 120–240 | 0.192 | ||||
| 240°/s | 287 ± 76 | 289 | 221 | 329 | 240–30 | 0.004 * | ||||
| PA | 30°/s | 277 ± 78 | 284 | 210 | 323 | 0.53 | 30–120 | 0.84 | 0.123 | |
| 120°/s | 296 ± 82 | 289 | 235 | 355 | 120–240 | 1 | ||||
| 240°/s | 291 ± 86 | 275 | 231 | 329 | 240–30 | 1 | ||||
| Extension peak strength | AA | 30°/s | 449 ± 75 | 451 | 388 | 518 | <0.001 * | 30–120 | <0.001 * | 0.654 |
| 120°/s | 375 ± 85 | 352 | 327 | 450 | 120–240 | 0.192 | ||||
| 240°/s | 350 ± 90 | 327 | 302 | 438 | 240–30 | <0.001 * | ||||
| PA | 30°/s | 445 ± 71 | 445 | 398 | 469 | <0.001 * | 30–120 | 0.002* | 0.699 | |
| 120°/s | 371 ± 82 | 349 | 320 | 431 | 120–240 | 0.135 | ||||
| 240°/s | 335 ± 98 | 313 | 278 | 420 | 240–30 | <0.001 * |
Disclaimer/Publisher’s Note: The statements, opinions and data contained in all publications are solely those of the individual author(s) and contributor(s) and not of MDPI and/or the editor(s). MDPI and/or the editor(s) disclaim responsibility for any injury to people or property resulting from any ideas, methods, instructions or products referred to in the content. |
© 2025 by the authors. Licensee MDPI, Basel, Switzerland. This article is an open access article distributed under the terms and conditions of the Creative Commons Attribution (CC BY) license (https://creativecommons.org/licenses/by/4.0/).
Share and Cite
Coto Martín, R.; Martínez Beltrán, M.J.; Pérez Mallada, N.; Cuéllar Marín, L.; Arroyo, O.O.; Borrás Luján, P.J.; Arribas-Marín, J.M. Dynamometer Resistance Pad Position Influences Knee Strength and Hamstring/Quadriceps Ratio in Professional Basketball Players: Retrospective Observational Study. Appl. Sci. 2025, 15, 4000. https://doi.org/10.3390/app15074000
Coto Martín R, Martínez Beltrán MJ, Pérez Mallada N, Cuéllar Marín L, Arroyo OO, Borrás Luján PJ, Arribas-Marín JM. Dynamometer Resistance Pad Position Influences Knee Strength and Hamstring/Quadriceps Ratio in Professional Basketball Players: Retrospective Observational Study. Applied Sciences. 2025; 15(7):4000. https://doi.org/10.3390/app15074000
Chicago/Turabian StyleCoto Martín, Raúl, María Jesús Martínez Beltrán, Néstor Pérez Mallada, Lucía Cuéllar Marín, Oscar Otín Arroyo, Pablo José Borrás Luján, and Juan Manuel Arribas-Marín. 2025. "Dynamometer Resistance Pad Position Influences Knee Strength and Hamstring/Quadriceps Ratio in Professional Basketball Players: Retrospective Observational Study" Applied Sciences 15, no. 7: 4000. https://doi.org/10.3390/app15074000
APA StyleCoto Martín, R., Martínez Beltrán, M. J., Pérez Mallada, N., Cuéllar Marín, L., Arroyo, O. O., Borrás Luján, P. J., & Arribas-Marín, J. M. (2025). Dynamometer Resistance Pad Position Influences Knee Strength and Hamstring/Quadriceps Ratio in Professional Basketball Players: Retrospective Observational Study. Applied Sciences, 15(7), 4000. https://doi.org/10.3390/app15074000