Article

Analysis of Vehicle–Bridge Coupling Vibration for Corrugated Steel Web Box Girder Bridges Considering Three-Dimensional Pavement Roughness

1
Shandong Hi-Speed Group Co., Ltd., Jinan 250098, China
2
Key Laboratory of New Technology for Construction of Cities in Mountain Area, School of Civil Engineering, Chongqing University, Chongqing 400030, China
*
Authors to whom correspondence should be addressed.
Appl. Sci. 2025, 15(7), 4009; https://doi.org/10.3390/app15074009
Submission received: 27 February 2025 / Revised: 31 March 2025 / Accepted: 3 April 2025 / Published: 5 April 2025

Abstract

:
This study investigates the vehicle–bridge coupling vibration performance of corrugated steel web box girder bridges under three-dimensional pavement roughness conditions. To effectively account for these roughness characteristics, a three-dimensional contact constraint method is proposed. The accuracy of the proposed method is first verified, followed by an analysis of a 30 m span corrugated steel web box girder bridge to evaluate the influence of vehicle speed, pavement grade, roughness dimensions, and box girder configurations on the impact factor. The results show that the impact factor does not consistently increase with vehicle speed. As pavement conditions worsen, the impact factor shows an upward trend, with each grade of road surface deterioration resulting in an average 19.1% increase in the impact factor. In most scenarios, three-dimensional pavement roughness results in smaller impact factors compared to two-dimensional pavement roughness, with average reductions of 2.4%, 7.3%, and 13.5% for grade A, B, and C roads, respectively. Replacing the corrugated steel web with a flat steel web leads to an average reduction of 4.2% in the mid-span dynamic deflection of the bridge, despite the impact factors of both configurations being relatively similar. Substituting the concrete bottom slab with an equivalent steel bottom slab increases the mid-span dynamic deflection by an average of 28.4% and nearly doubles the impact factor. The impact factors determined by most national standards generally fall within the range for grade A pavement, suggesting that the calculation methods in these standards are mainly suited for newly constructed bridges or those in good maintenance.

1. Introduction

The corrugated steel web box girder bridge is a composite structure comprising concrete top and bottom slabs connected to corrugated steel webs via connectors, with a prestressing system as a reinforcement. The corrugated steel web replaces the traditional concrete webs of prestressed concrete box girders, allowing each material to fully utilize its strengths [1]. Its advantages lie in the bending resistance provided by the concrete top and bottom slabs and the shear resistance of the corrugated steel webs, which reduce the self-weight of the box girder and enhance the efficiency of prestress application [2]. Consequently, corrugated steel web box girder bridges have been widely adopted worldwide. Since the completion of the Cognac Bridge in France in 1986, Japan has taken the lead in conducting extensive research on this type of bridge. It has also successively constructed several corrugated steel web box girder bridges, including the Shinkai Bridge, Hontani Bridge, and Himiyume Bridge [3].
Currently, research on corrugated steel web box girders has primarily focused on static performance aspects such as bending resistance [4], shear resistance [5,6], torsional resistance [7,8], buckling behavior [9], and shear lag effects [10], while studies on dynamic performance have been relatively limited [11,12]. He et al. [13] studied the influence of geometric parameters on the natural vibration characteristics of corrugated steel web box girders. Zhang et al. [14] derived an analytical formula for the natural vibration frequencies of corrugated steel web box girders based on the principle of energy variation. They obtained analytical solutions for the natural frequencies of various modes while considering shear deformation and shear lag effects. Liu et al. [15], through model tests and finite element analysis, found that the torsional stiffness of corrugated steel web box girders is lower than that of traditional concrete box girders. Additionally, they also discovered that adding diaphragms in the end regions can enhance torsional stiffness. Li et al. [16] studied the influence of cross-sectional configurations on the dynamic characteristics of corrugated steel web box girders. They revealed that the torsional stiffness of a twin-box, twin-cell section is lower than that of a single-box, twin-cell section.
Existing studies have demonstrated that, compared to traditional concrete box girders, corrugated steel web box girders exhibit some different dynamic characteristics, including reduced lateral bending stiffness and torsional stiffness. Therefore, investigating the vehicle–bridge coupling vibration of corrugated steel web box girder bridges is essential. However, related studies remain limited. Wang [17] found that installing diaphragms improves the overall stability and vibration performance of box girders. Li et al. [18] examined the influence of damping ratios on the vehicle–bridge coupling vibration response of corrugated steel web box girders. Ji et al. [19] investigated the differences between local and global dynamic impact factors of corrugated steel web box girder bridges. The above studies all assume that the pavement roughness in contact with the left and right wheels is the same, namely two-dimensional pavement roughness. However, this assumption does not accurately reflect the real-world conditions of highway bridges. Han et al. [20] measured the three-dimensional pavement roughness of highway bridges, and the results showed that the inconsistency in roughness between the left and right wheels was common in highway bridges. Therefore, three-dimensional pavement roughness should be considered in vehicle–bridge coupling studies to better reflect actual pavement conditions.
Vibration issues in engineering structures are very common [21], and vehicle–bridge coupling vibration analysis is beneficial for studying bridge damage identification methods based on vehicle-induced vibration responses [22]. The study of vehicle–bridge coupling vibration, a time-varying dynamic problem, primarily relies on numerical analysis methods. The research on vehicle–bridge coupling for highways gradually developed after the study of vehicle–bridge coupling for railways [23]. Based on the process of establishing the motion equations for the vehicle–bridge coupling system, these methods can be categorized into the “integrated method” and the “segregated method” [24,25]. Liu [26] considered pavement roughness by adjusting the constant terms in the displacement constraint equations between the wheels and bridge nodes. This approach to considering pavement roughness is referred to as the displacement coupling method. When the wheels and bridge nodes coincide, this method can effectively simulate pavement roughness. However, when the wheels and bridge nodes do not coincide, interpolation with element shape functions determines the bridge node displacement. This method may lead to overly complicated shape functions in complex cases. Therefore, this study adopts the displacement contact method [27] on the basis of the displacement coupling method to address the challenge of coupling vibration analysis within elements. Furthermore, most previous studies have focused on two-dimensional pavement roughness [28,29]. This assumption does not adequately represent the real-world pavement conditions of highway bridges. In light of this, this study proposes a three-dimensional contact constraint method. The contact constraint method integrates and improves upon the previous methods, enabling convenient vehicle–bridge coupling simulation analysis that considers the three-dimensional pavement roughness of highway bridges. This study establishes a spatial vehicle–bridge vibration coupling model. Both the vehicle and the bridge are spatial models, and three-dimensional pavement roughness is considered. Moreover, it does not require complex secondary programming work. Additionally, the calculation methods for impact factors in codes from various countries are mostly based on statistical data from traditional concrete bridges. There is no specific consideration for corrugated steel web box girder bridges [30]. Nevertheless, existing studies have shown that due to the influence of shear deformation in steel webs, corrugated steel web box girder bridges exhibit certain differences in dynamic characteristics compared to concrete box girder bridges [31]. Therefore, it is necessary to study the applicability of the impact factor calculation methods in international codes to corrugated steel web bridges. In summary, this study aims to investigate vehicle–bridge coupling vibration in corrugated steel web box girder bridges, considering the three-dimensional pavement roughness.
This study proposes a method for vehicle–bridge coupling vibration analysis that facilitates the consideration of three-dimensional pavement roughness of highway bridges. Then, based on the three-dimensional contact constraint method, a vehicle–bridge coupling vibration analysis is conducted for the corrugated steel web box girder bridge. The influence of vehicle speed, pavement grade, pavement roughness dimensions, and box girder configurations on coupling vibration performance is examined. A filtering method is used to extract the high-frequency vibration amplitudes from the bridge’s dynamic response, which allows for the calculation of the impact factor. Finally, the calculated impact factors under different conditions are compared with the values specified in international standards to assess the applicability of these standards.

2. Vehicle–Bridge Coupling Vibration Analysis Method Based on the Three-Dimensional Contact Constraint Method

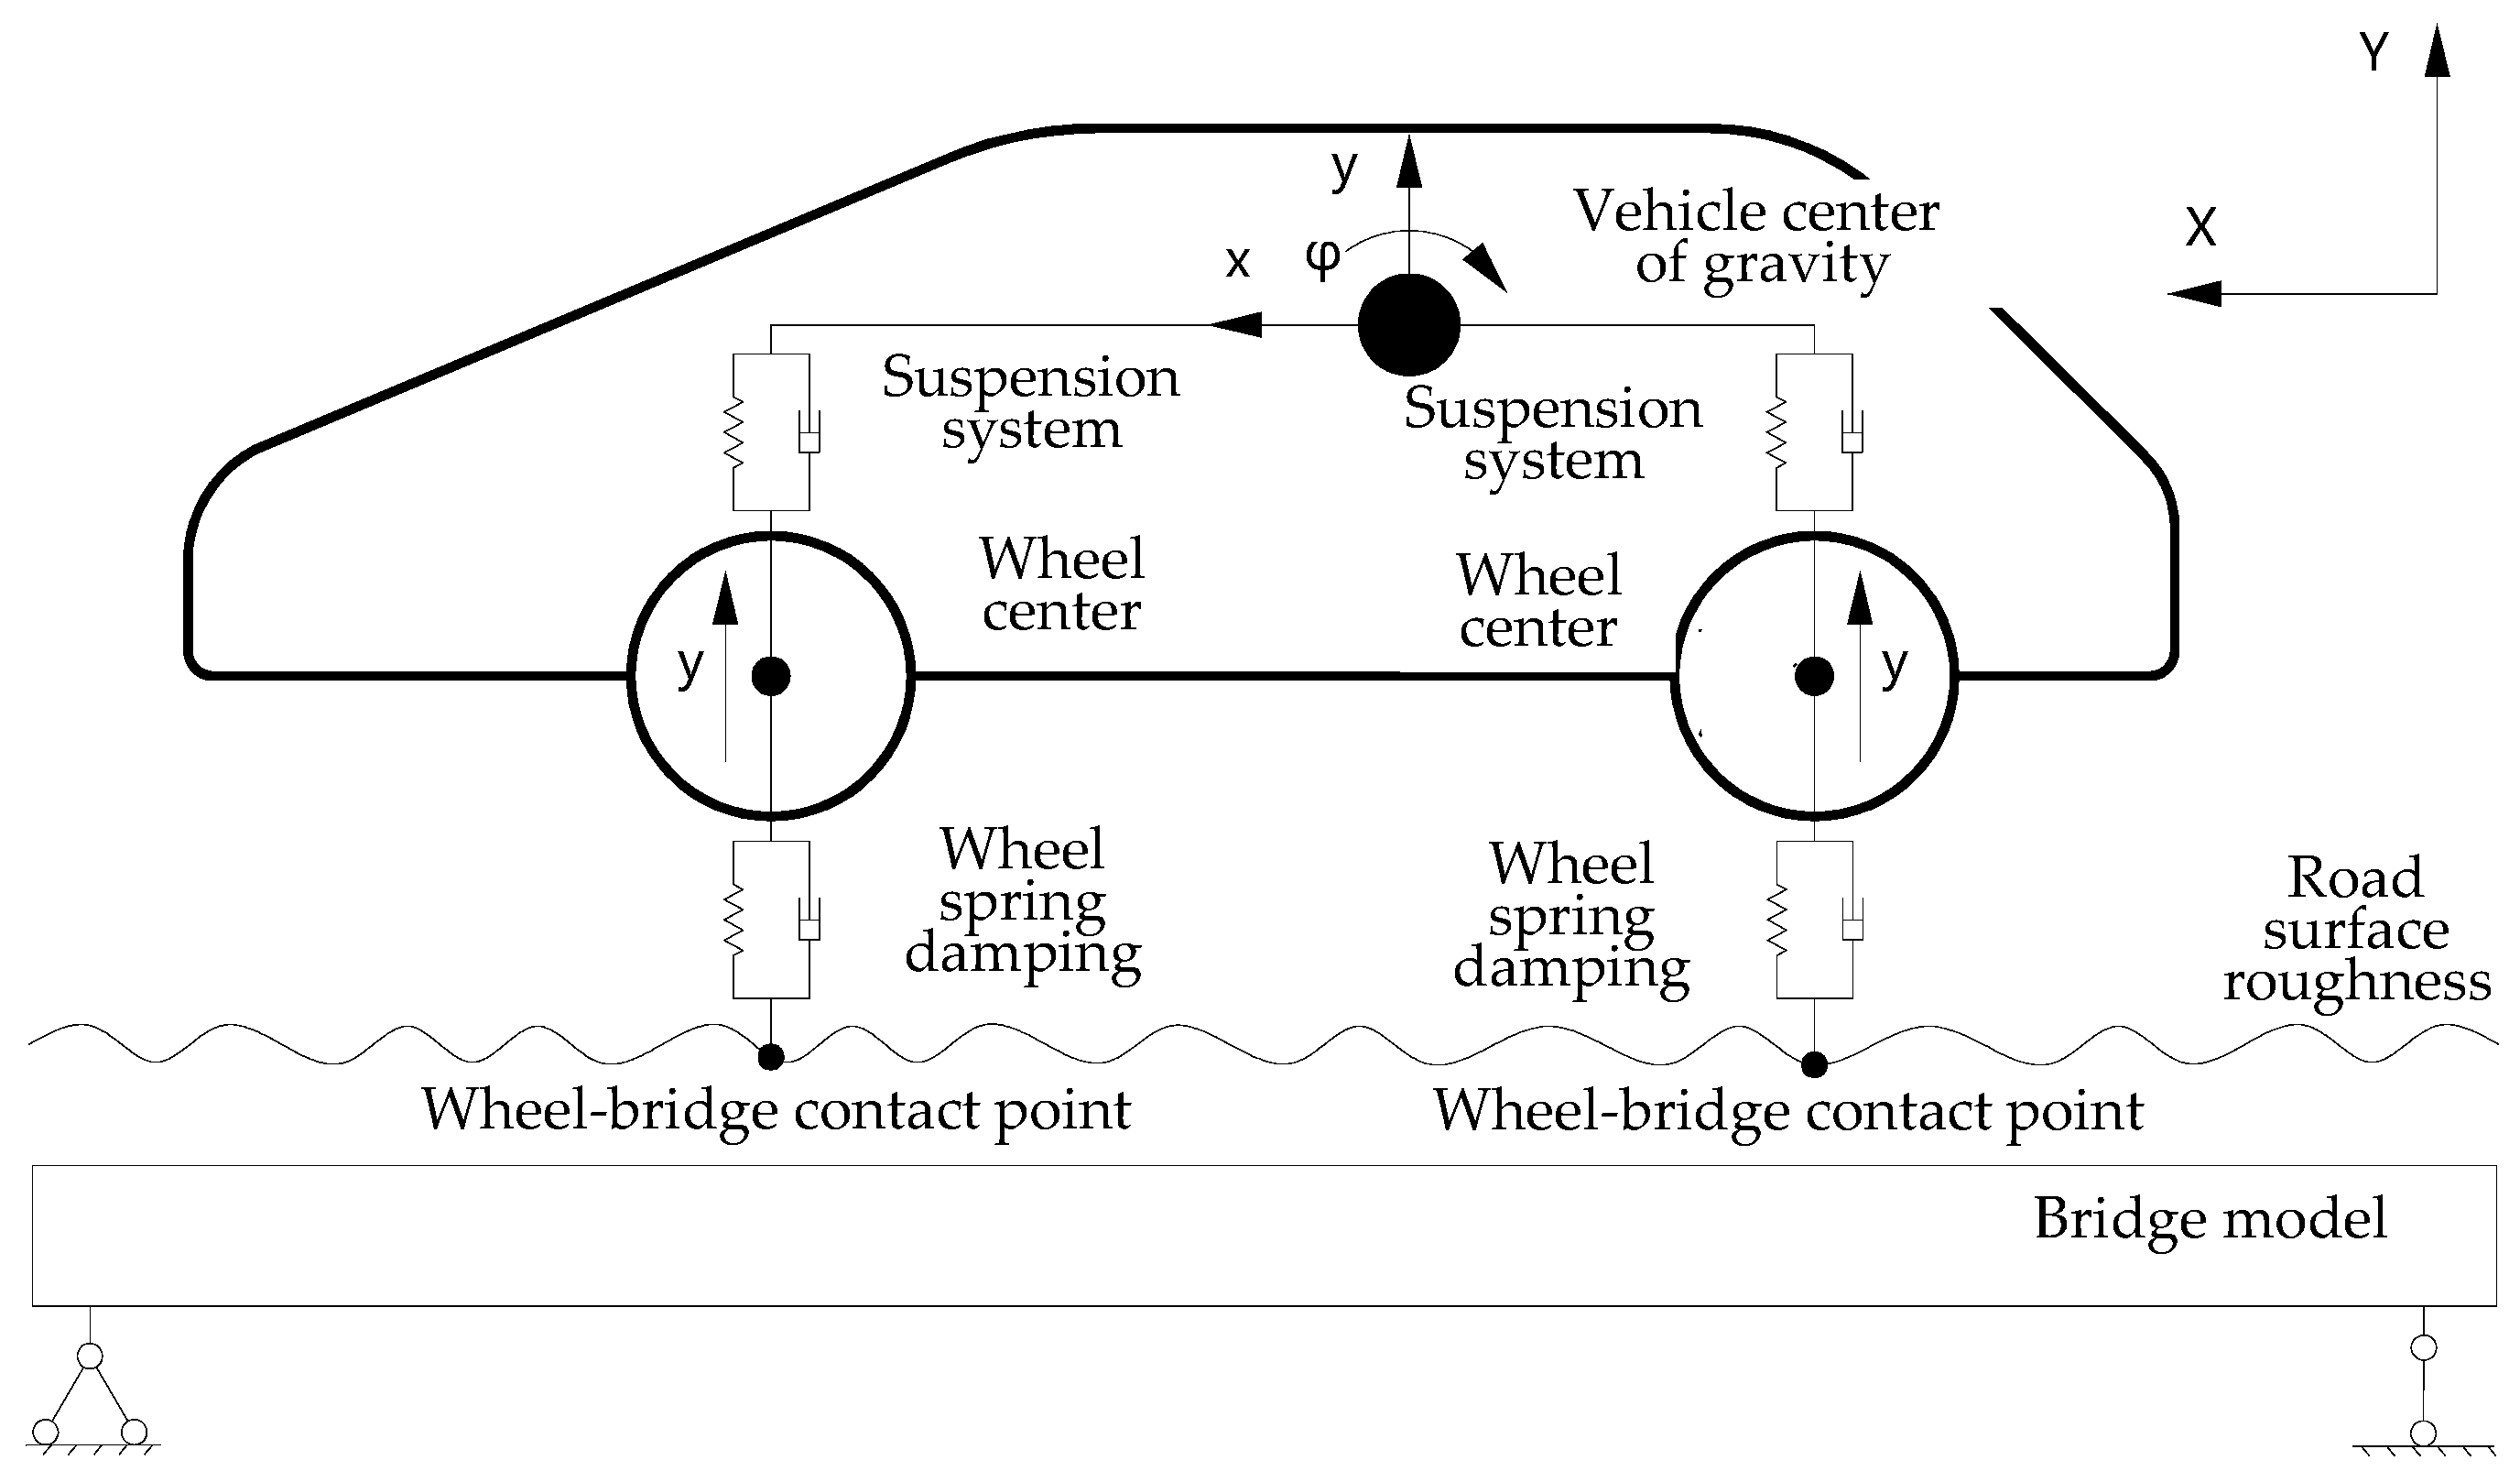
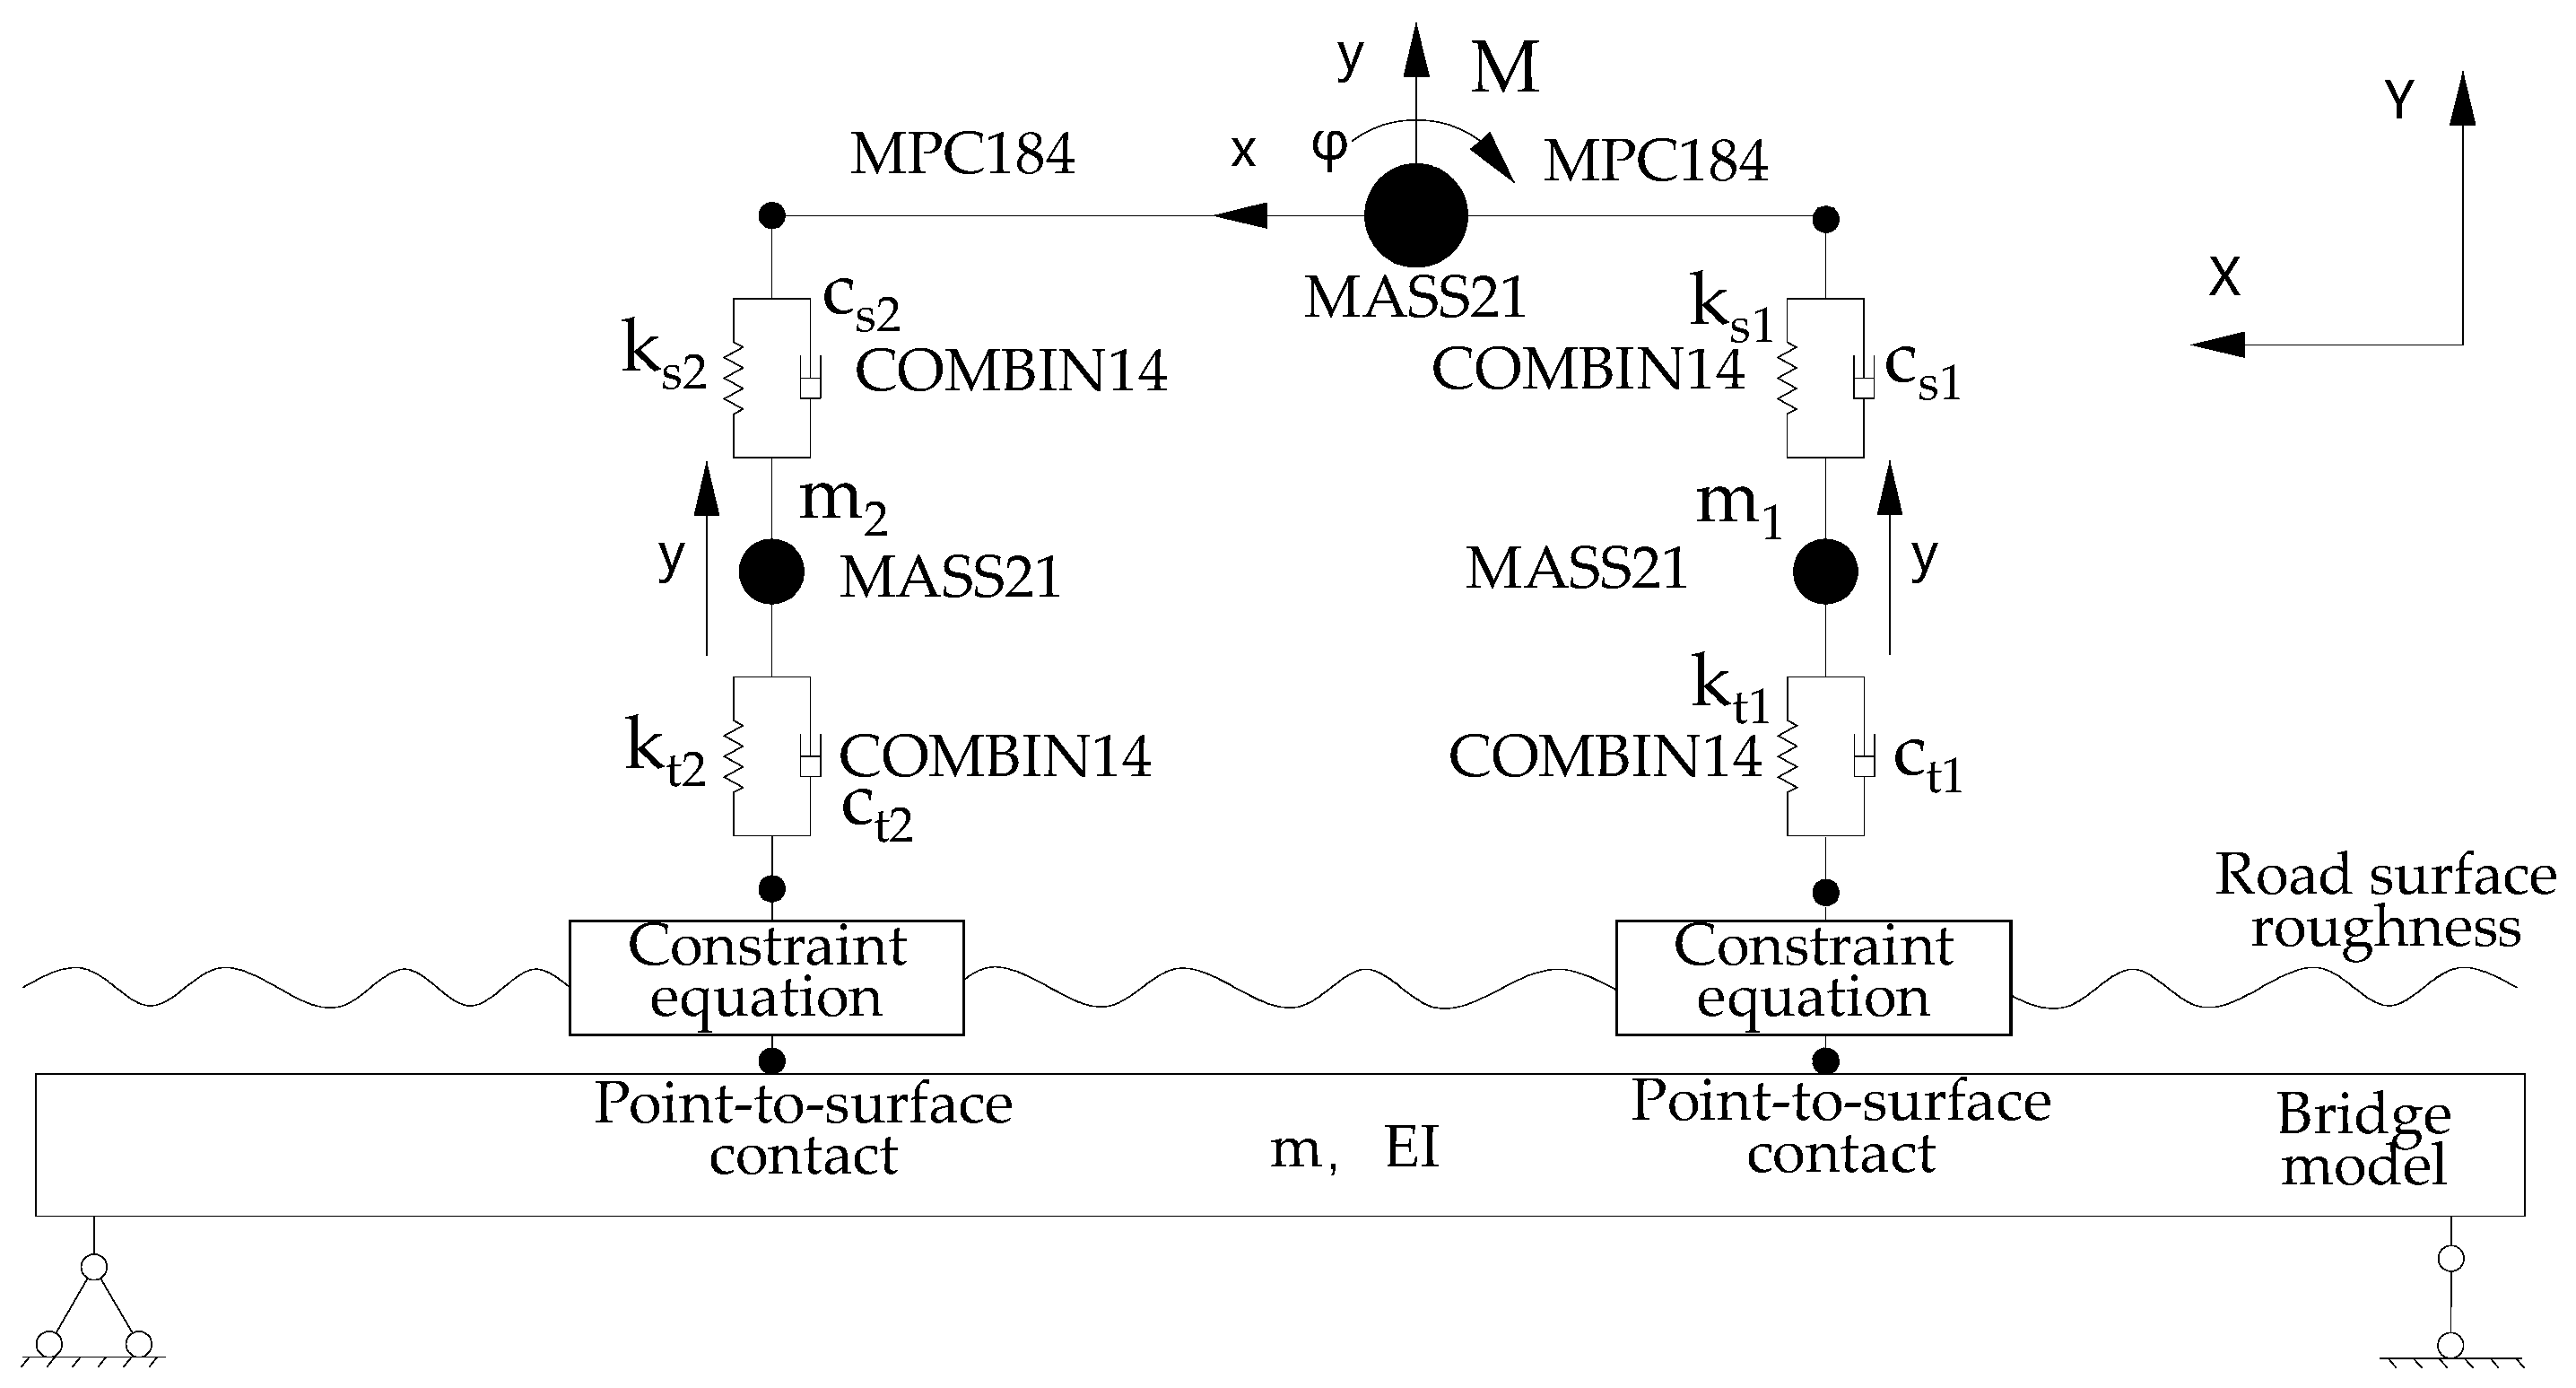
2.1. Vehicle–Highway Bridge Coupling System Model

A four-degree-of-freedom half-vehicle model and a simply supported beam model are used to illustrate the mechanical mechanism of vehicle–highway bridge coupling vibration analysis, as shown in Figure 1. In this model, the vehicle body and wheelsets are treated as rigid bodies [19,32]. The suspension and dampers are positioned between the vehicle body and the wheelsets. The tires are located between the wheelset centers of mass and the highway bridge pavement. The interactions between the rigid bodies are established using springs and dampers. The connection between the wheelset centers of mass and the highway bridge pavement is represented by the tires, which are also modeled using springs and dampers, as shown in Figure 2. The motion of the vehicle model can be expressed by the dynamic differential equation, as shown in Equation (1).
M v Y ¨ v + C v Y ˙ v + K v Y v = G v + F vb
where M v is the vehicle mass matrix; C v is the vehicle damping matrix; K v is the vehicle stiffness matrix; G v is the vehicle gravitational load vector; F vb is the instantaneous coupling force vector at the vehicle–bridge contact point; and Y ¨ v , Y ˙ v and Y v are the acceleration, velocity, and displacement vectors of the vehicle model, respectively.
For the bridge model, its motion can also be described by its dynamic differential equation, as shown in Equation (2).
M b Y ¨ b + C b Y ˙ b + K b Y b = F bg + F bv
where M b is the bridge mass matrix; C b is the bridge damping matrix; K b is the bridge stiffness matrix; F bg is the load vector applied to the bridge, unrelated to the vehicle–bridge coupling; F bv is the wheel force vector applied to the bridge nodes, which is the action-reaction pair to F vb ; and Y ¨ b , Y ˙ b , and Y b are the acceleration, velocity, and displacement vectors of the bridge nodes, respectively.

2.2. Contact Constraint Method for Three-Dimensional Pavement Roughness

Pavement roughness has long been regarded as one of the primary excitations influencing vehicle–bridge coupling vibration systems [33,34]. Currently, pavement roughness simulation is primarily based on measured road roughness samples [35] and the power spectral density function of pavement roughness [36]. Measured roughness samples are highly specific and accurately represent the roughness of the surveyed road but are less applicable to other roads. Therefore, this study simulates pavement roughness using the power spectral density function. According to the fitting expression of road surface power spectral density recommended by the Chinese standard GB/T 7031-2005 [37]:
G q ( n ) = G q ( n 0 ) n n 0 w
where the G q ( n ) is the pavement displacement power spectral density, in units of m2/m−1; G q ( n 0 ) represents the pavement roughness coefficient at spatial frequency n 0 , which depends on the pavement grade; n 0 is the spatial reference frequency, typically set to 0.1 m−1; w is the frequency exponent, determining the spectral structure of the power spectral density function; and n denotes a specific frequency within the effective spatial frequency band.
This study employs the harmonic superposition method to generate pavement roughness samples, representing road roughness as the sum of numerous cosine functions with random phases. The two-dimensional pavement roughness can be expressed by Equation (4).
r x = i = 1 N 2 G q n i n cos 2 π n i x + φ i
where r x represents the two-dimensional pavement roughness; x is the longitudinal coordinate of the road surface; N is a sufficiently large integer; n is the spatial frequency interval; n i represents a specific frequency within the effective frequency band of the spatial frequencies; φ i is a random phase between [0, 2π].
To better reflect the real-world pavement conditions of highway bridges, it is necessary to consider three-dimensional pavement roughness. It is assumed that the lateral pavement roughness also follows a zero-mean, ergodic Gaussian distribution [38]. The two-dimensional pavement roughness is extended laterally to obtain the three-dimensional pavement roughness, as shown in Equation (5).
r x , y = i = 1 N 2 G q n i n cos 2 π n i ( x 2 + y 2 ) + φ i ( x , y )
where r x , y represents the three-dimensional pavement roughness, x is the longitudinal coordinate of the pavement, y is the transverse coordinate of the pavement, and the other symbols are the same as those in the previous equation.
Using the harmonic superposition method, three-dimensional pavement roughness of levels A, B, and C was simulated, as shown in Figure 3. It can be seen that under the same pavement grade, the pavement roughness for the left and right wheels is rarely the same. Moreover, the higher the pavement grade, the greater the fluctuation in pavement roughness amplitude. Due to the considerable randomness of the road surface samples generated by the method detailed above, multiple pavement roughness samples are used under the same pavement grade. The average of the vehicle–bridge coupling system’s multiple dynamic responses for the same pavement grade is then taken as the bridge’s response value.
When studying complex issues such as vehicle–bridge coupling, it is also necessary to start with certain simplified assumptions. This study assumes that the vehicle moves in a straight line and that the wheels remain in vertical contact with the bridge deck. As shown in Figure 4, suppose the vehicle travels along the positive X-axis. Then, the Xi coordinate of the i-th wheel at any given moment can be obtained as follows:
X i = X i 0 + V c T + 1 2 A c T 2
where Xi0 is the initial coordinate of the i-th wheel; Vc is the vehicle speed; T is the travel time; and Ac is the vehicle acceleration, which is not considered in this study and is set to zero.
At any given moment, the vertical displacement of the wheel–bridge contact point Zi, the vertical displacement of the bridge surface at the corresponding contact node ZQi, and the pavement roughness ZRi are related by the displacement coordination equation given as follows:
Z i - Z Q i - Z R i = 0 , ( i = 1 , 2 , 3 , 4 )
Figure 4 shows the vehicle–bridge coupling system based on the three-dimensional contact constraint method proposed in this study. The figure provides a detailed explanation of the displacement coordination and force equilibrium relationships between the vehicle model and the bridge model in this method. Point-to-surface contact is established between the wheel–bridge contact points and the bridge model, making it more convenient to achieve force equilibrium. Constraint equations are then established between the wheel bottom nodes and the wheel–bridge contact points according to Equation (7). The pavement roughness for the left and right wheels is derived from Equation (5). This allows for the convenient establishment of displacement coordination relationships that consider three-dimensional pavement roughness of highway bridges. Compared to the displacement contact method [27], the contact constraint method more easily incorporates three-dimensional pavement roughness. Compared to the displacement coupling method [26], the contact constraint method avoids the issue of complex mechanical coupling within the elements of the vehicle–bridge system. The three-dimensional contact constraint method combines the advantages of both approaches, making it easier to perform three-dimensional vehicle–highway bridge system coupling analysis. The constraint equation is a linear equation that satisfies the relationship between the node degrees of freedom. Therefore, the impact of pavement roughness can be considered by establishing the displacement coordination relationship between the wheel bottom node at the corresponding location and the wheel–bridge contact point.

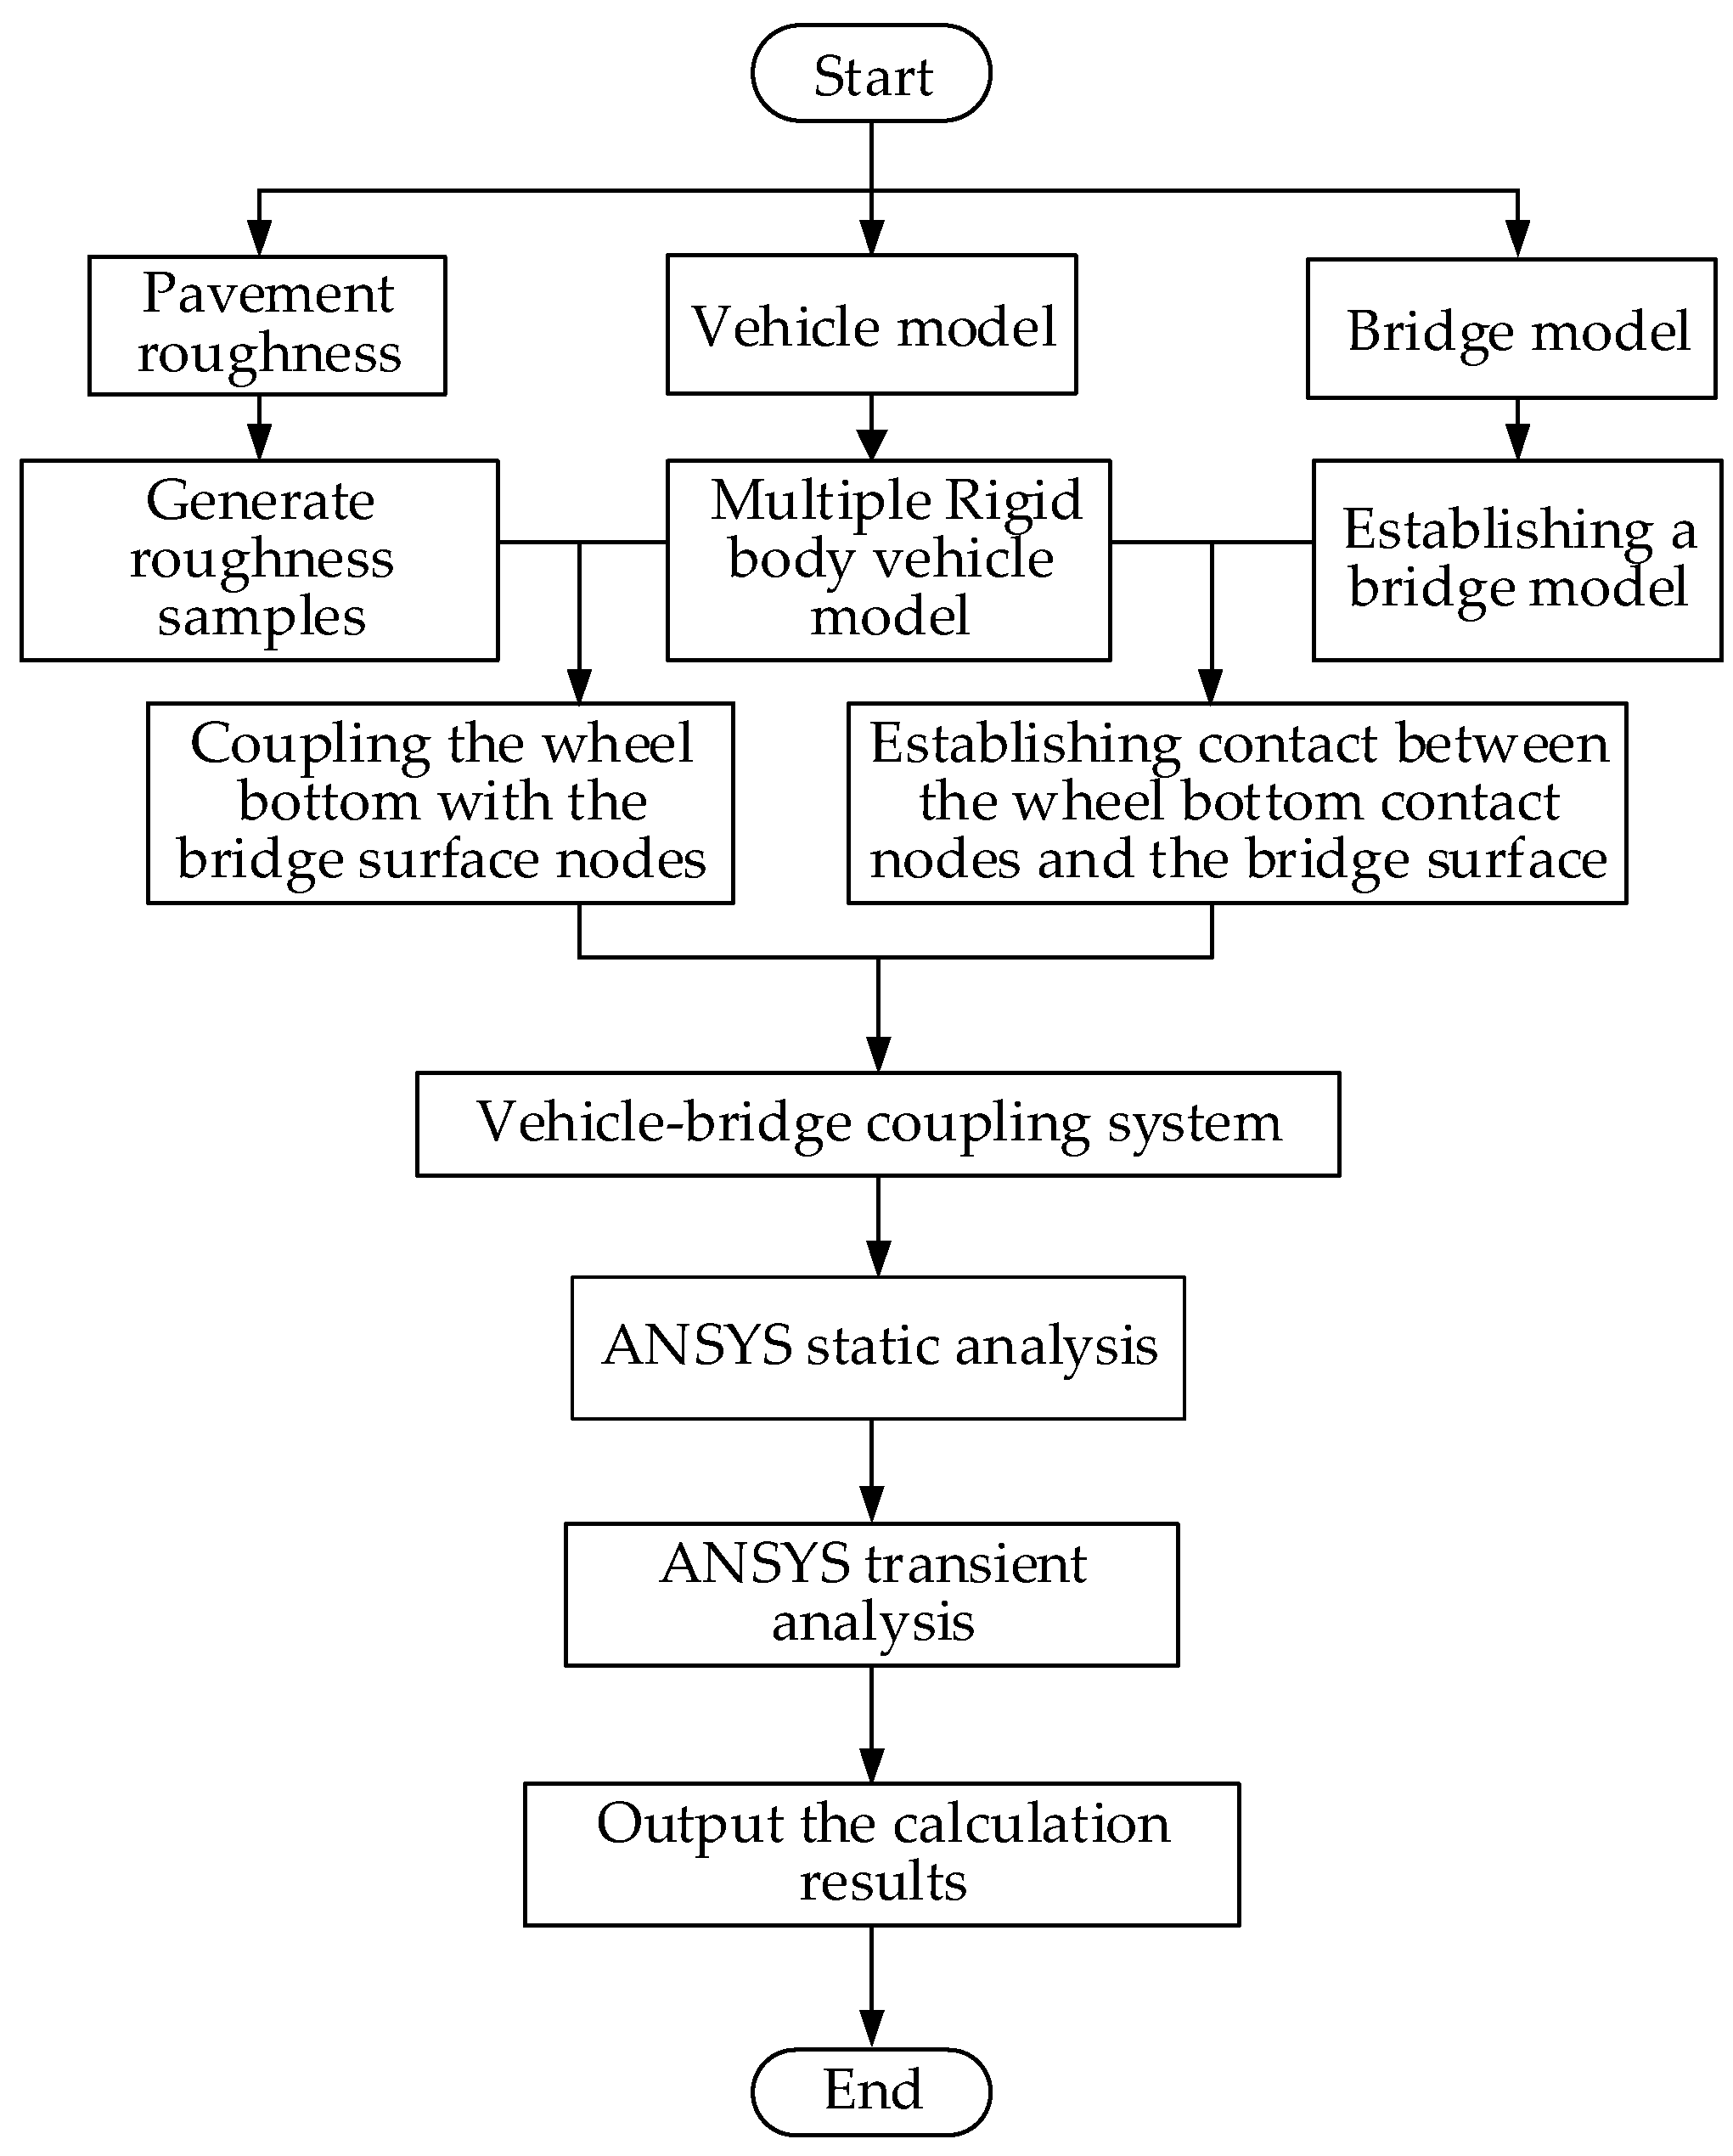
2.3. Implementation Process of the Contact Constraint Method in ANSYS

Vehicle–bridge coupling analysis falls within the scope of multi-degree-of-freedom dynamic analysis. The finite element method has been applied to the structural analysis of full-scale bridge engineering [39]. Some scholars have even employed a hybrid simulation method that combines the finite element method with experiments [40,41]. In this study, the vehicle–bridge coupling vibration analysis method based on the contact constraint approach is implemented on the ANSYS R18.0, as shown in Figure 5. The steps are as follows:
  • Step 1. Establish the bridge model based on the model data.
  • Step 2. Determine the lane information, including lane positions, number, and direction, and create lanes at a certain distance from both ends of the bridge to ensure vehicles enter the bridge with stable vibration states.
  • Step 3. Determine the vehicle information, including the number of vehicles, types, initial positions, and vehicle speeds. Establish a multi-rigid-body vehicle model at the initial position.
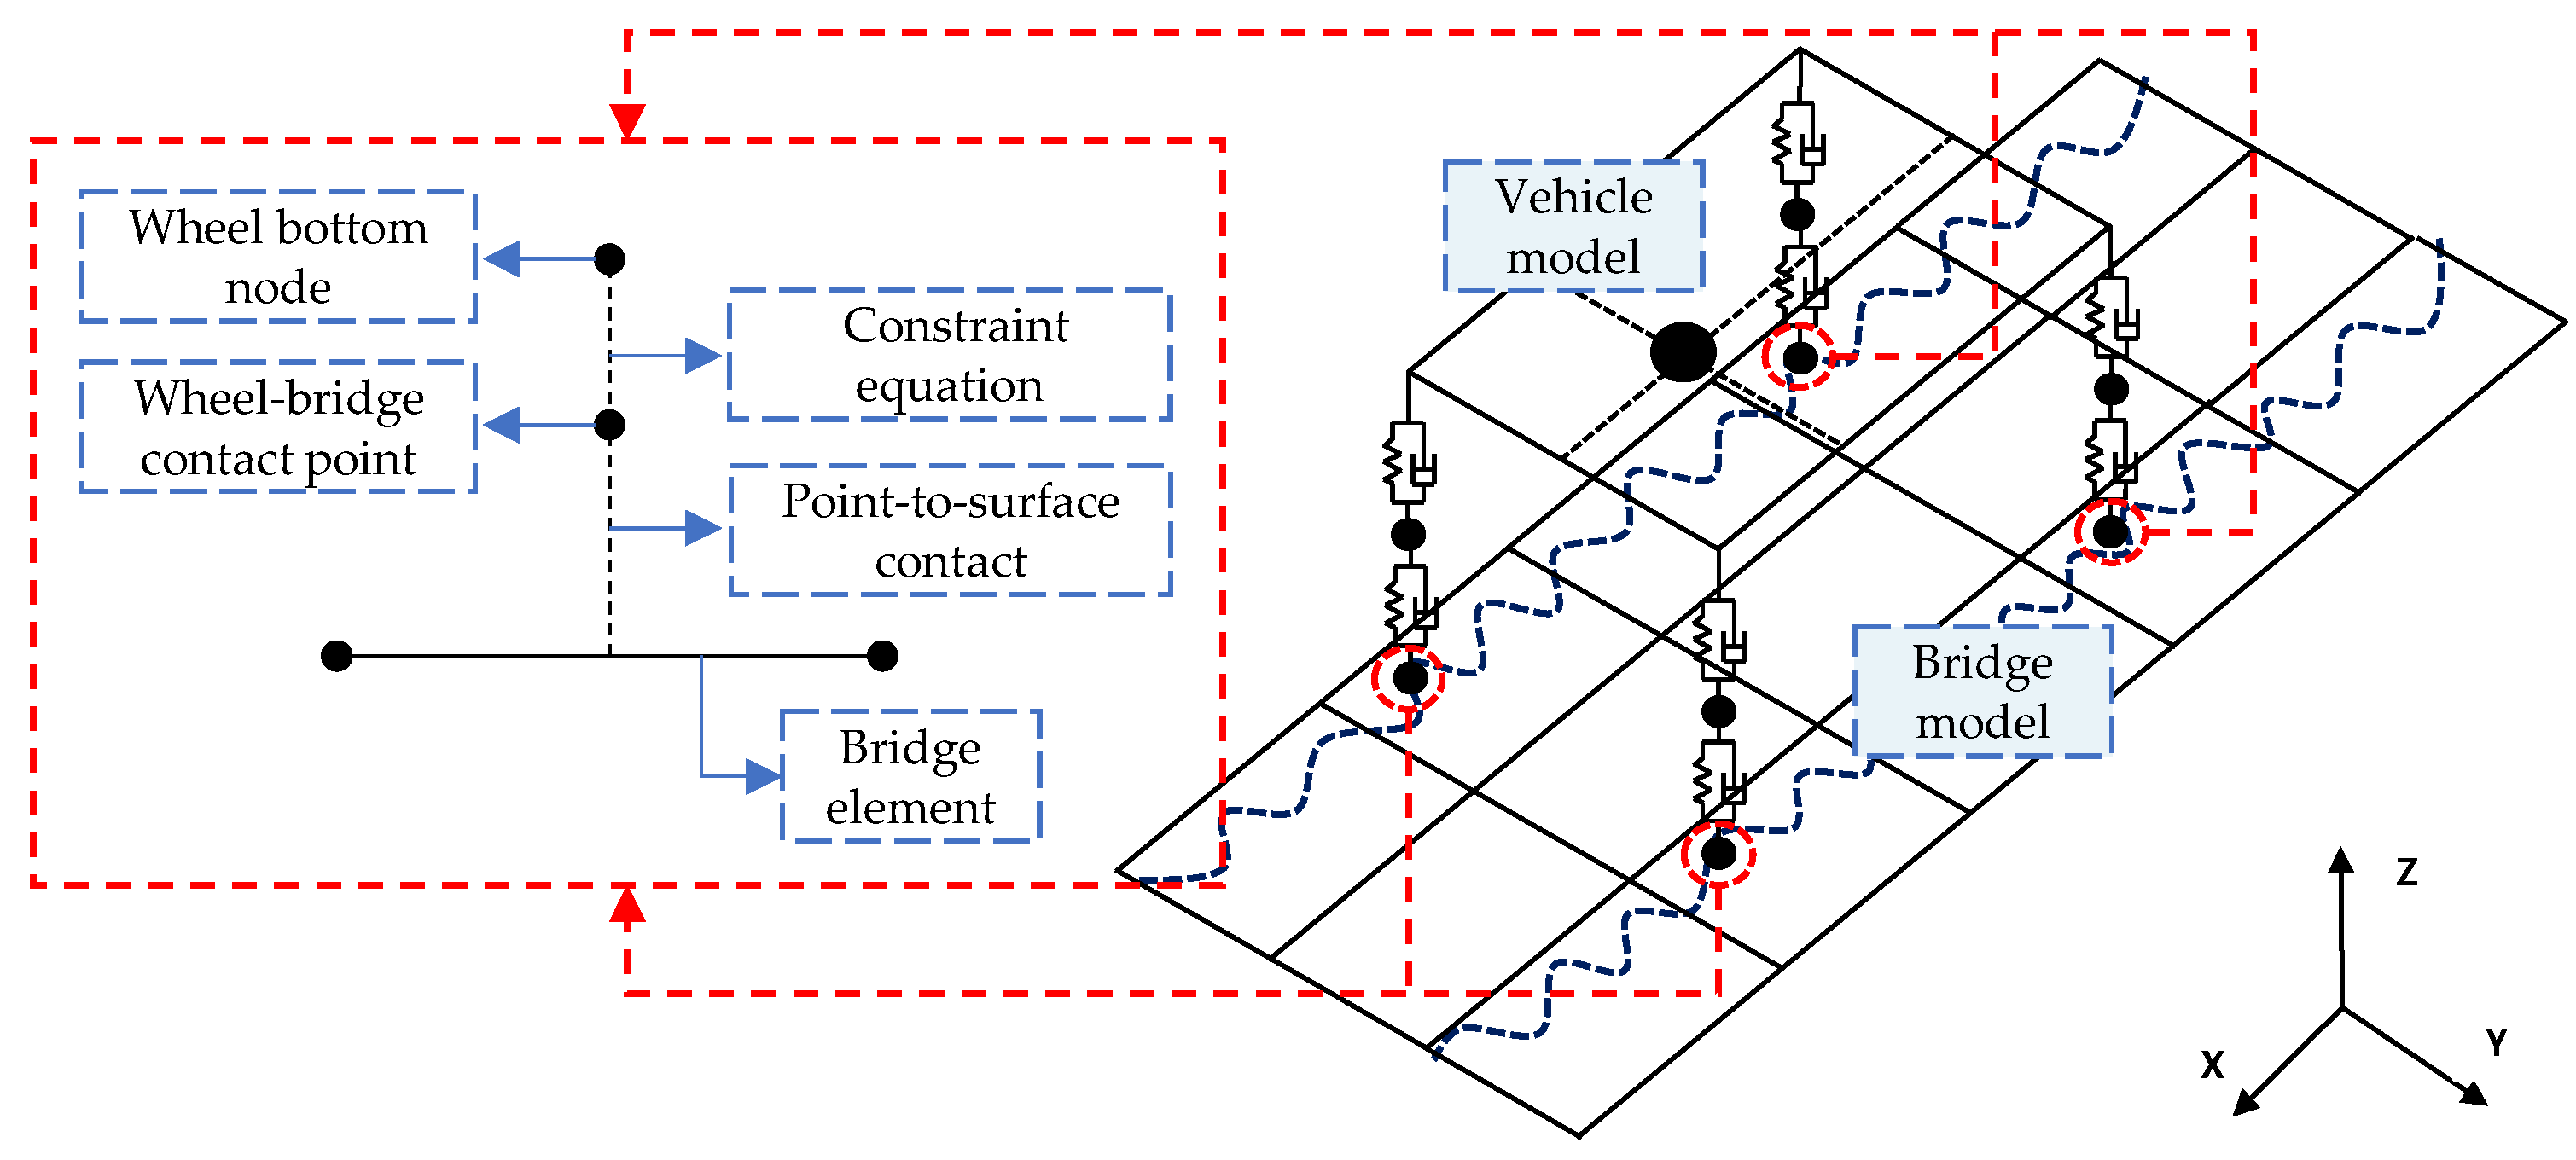
  • Step 4. Input the three-dimensional pavement roughness sample into ANSYS, and couple the wheel bottom nodes with the wheel–bridge deck contact points using constraint equations, with the constant term of the constraint equation being the pavement roughness value.
  • Step 5. Establish point-to-surface contact between the wheel–bridge contact points and the bridge deck, forming the vehicle–bridge coupling system.
  • Step 6. Enter the static analysis module, apply gravitational acceleration, and bring the spring-damping system of the vehicle model into a balanced position.
  • Step 7. Enter the transient dynamic analysis module and apply displacement in the driving direction to the vehicle model. The displacement within one time step is determined by the vehicle speed. The time step is automatically adjusted by ANSYS to optimize computational accuracy and efficiency. The displacement coordination condition between the wheel and the wheel–bridge deck contact points at any moment is established by changing the constant term of the constraint equation, thus considering the effect of pavement roughness.
  • Step 8. After completing the solution, enter the time history post-processing to examine the system’s dynamic response.
With the gradual development of the finite element method, various finite element analysis software packages are available for researchers and engineers [42]. ANSYS provides extensive element and material libraries for numerical simulation [43]. Vehicle is a complex vibration system often simplified to consist of rigid components such as the body and wheels. Vehicle models have now evolved to allow simulation of various parameters, such as vehicle load and axle spacing [24]. Figure 1 shows a simplified model of a two-axle plane vehicle, considering the heave and pitch degrees of freedom for the vehicle body, as well as the heave degree of freedom for the wheelset. The mechanical model is illustrated in Figure 2, taking the multi-body model of a two-axle plane vehicle as an example. In this study, the vehicle body and bogie are represented using MASS21 mass elements, the suspension system is modeled with COMBIN14 spring-damper elements, and the vehicle body and suspension elements are connected by MPC184 rigid beam elements. In this study, bridge damping is not considered. The Newmark-β method is used for vehicle–bridge coupling analysis, with the key parameters of γ and β set to 0.5 and 0.25, respectively.

2.4. Verification of Method Accuracy

To verify the correctness and accuracy of the method presented in this paper, a vehicle–bridge coupling vibration calculation is performed. A two-axle half-vehicle model traveling at a constant speed over a simply supported beam is used, based on the data from [44]. The vehicle–bridge coupling model is shown in Figure 6. The parameter values of the vehicle and bridge model are provided in Table 1. The mesh size of the bridge model is 0.1 m.
The dynamic responses of the vehicle are calculated when traveling at speeds of 120 km/h and 160 km/h across the bridge. The vertical displacement at the center span of the bridge is shown in Figure 7a,b. The accuracy is calculated by dividing the difference between the displacement results from this paper and the reference case by the displacement results from the reference case. The results show that the degree of agreement exceeds 95%, indicating that the method presented in this paper has good accuracy.

3. Vehicle–Bridge Coupling Analysis for Corrugated Steel Web Box Girder Bridge

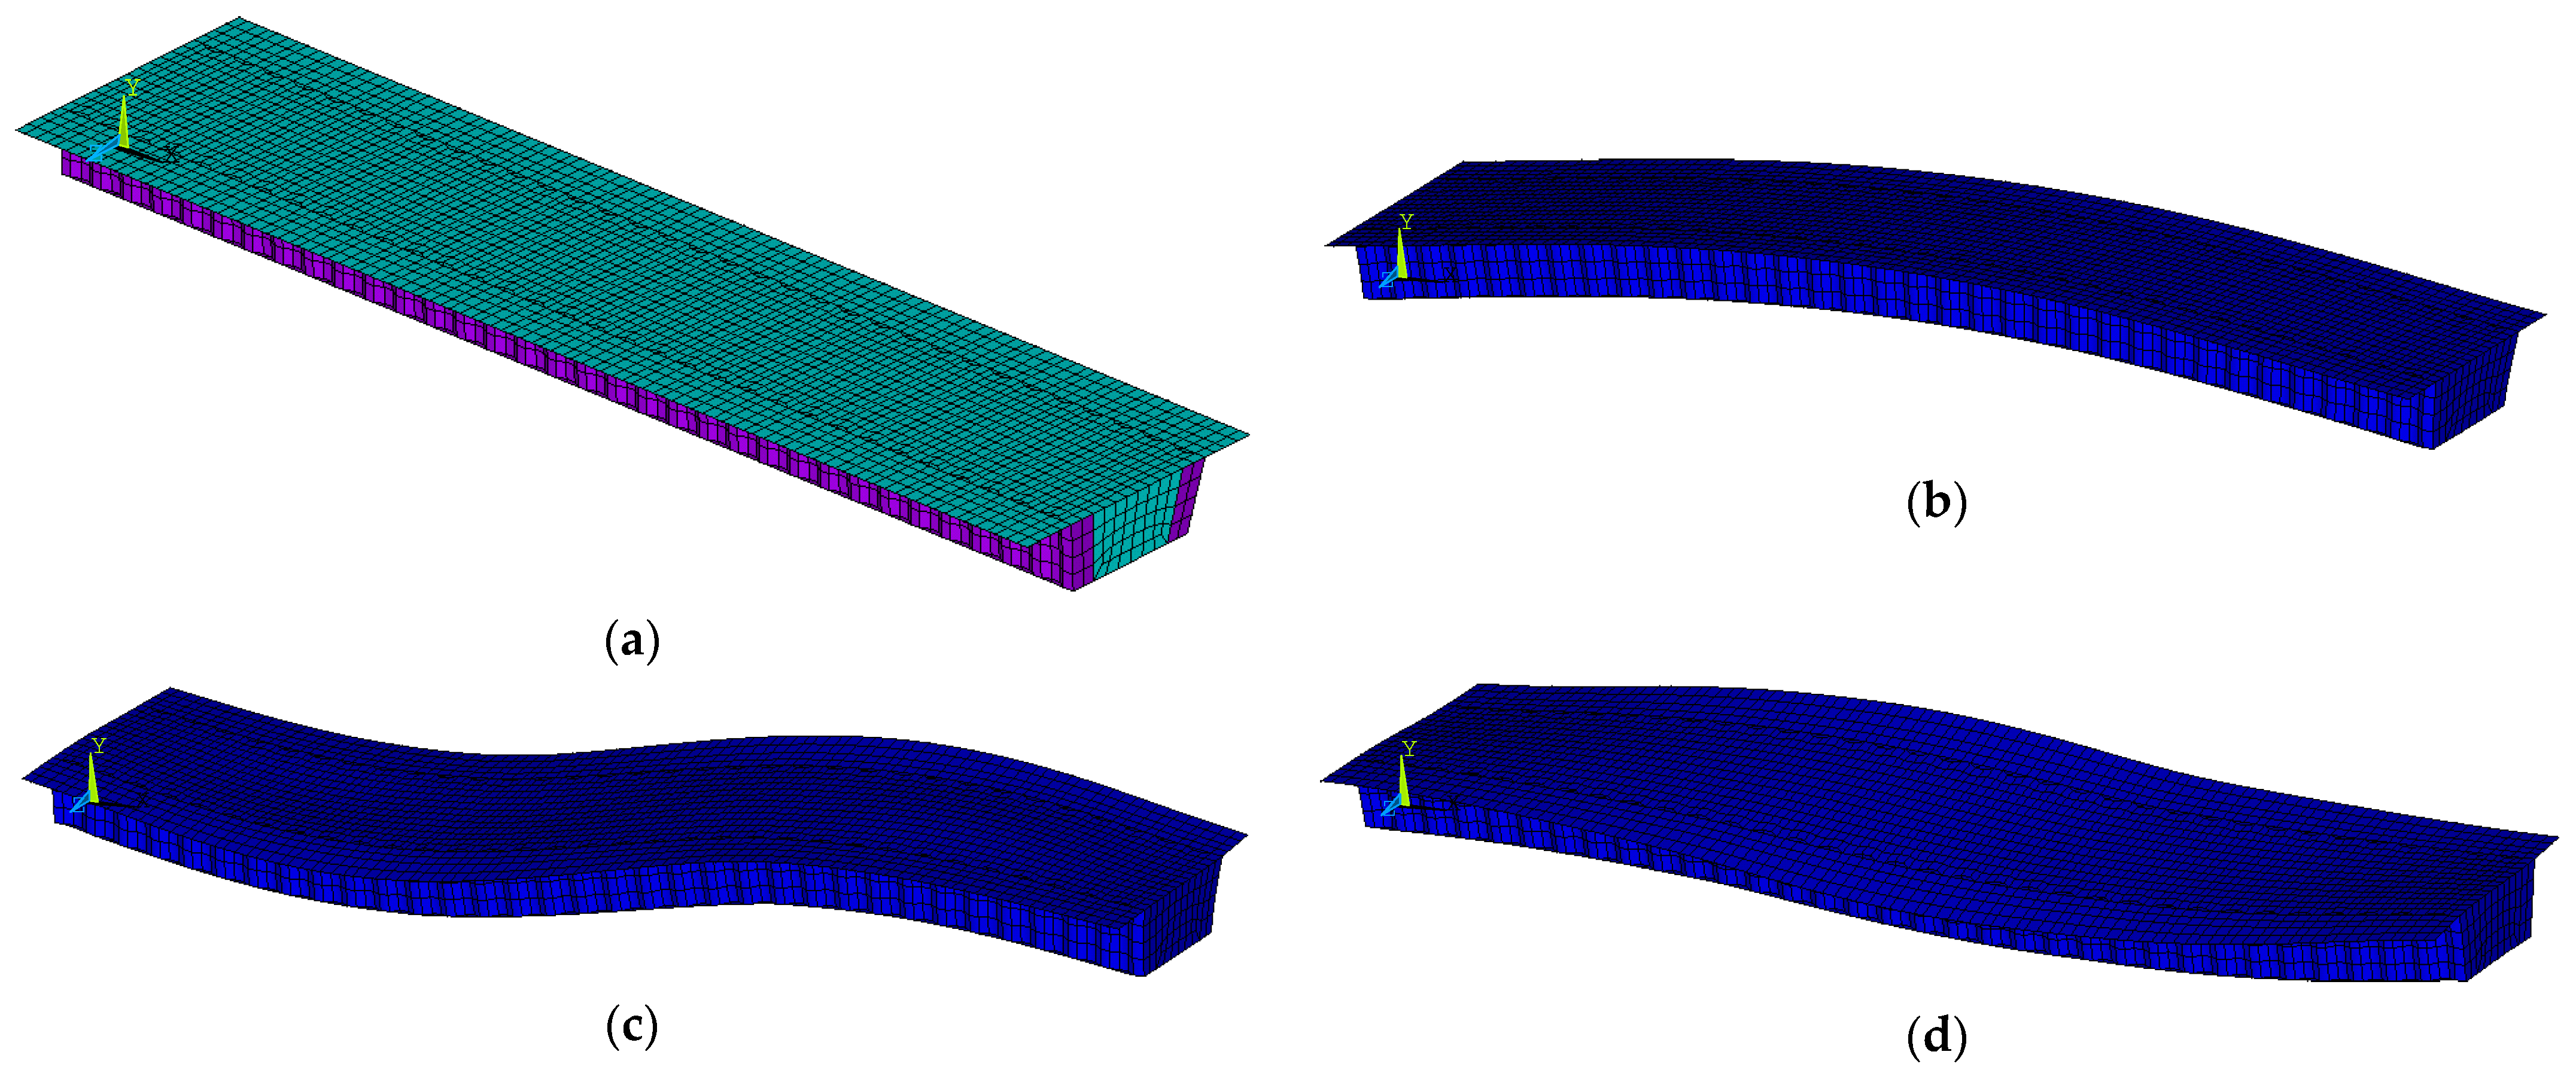
3.1. Vehicle–Bridge Coupling System Model

The calculation span of the corrugated steel web simply supported box girder bridge in this paper is 30 m, with two internal transverse diaphragms and two end transverse diaphragms set along the longitudinal direction of the bridge. The box girder cross-section and the details of the corrugated steel web are referenced from the design of the Shinkai Bridge in Japan [19,45], as shown in Figure 8a. The main girder uses C50 concrete, while the corrugated steel web is made of Q345 steel plates with a thickness of 9 mm, as shown in Figure 8b.
To account for the spatial effects of corrugated steel web bridges without significantly increasing the computational burden, we used a spatial shell element for the bridge model. The top and bottom plates, web, and transverse diaphragms of the box girder are all simulated using the thick shell elements SHELL181, with connections between them achieved through shared nodes. Simply supported beam boundary conditions are applied to the bottom plate nodes at both ends of the beam model. The detailed parameters of the corrugated steel web girder bridge model are shown in Table 2. The bridge model and modal analysis are shown in Figure 9, with a mesh size of 0.5 m. Its dynamic characteristics are shown in Table 3. It can be seen that the first mode shape is first-order symmetric vertical bending, the second mode shape is first-order antisymmetric vertical bending, and the third mode shape is bending–torsion coupling.
This paper selects the standard two-axle spatial vehicle model commonly used by scholars [19,32] in the study of vehicle–bridge coupling vibration. The model considers the pitch, roll, and the floatation and sinking degrees of freedom between the vehicle body and the wheelset. The detailed parameters are shown in Table 4.

3.2. Simulation Conditions and Calculation Results

Based on the three-dimensional contact constraint method, the dynamic response of the vehicle–bridge coupling system of the corrugated-web box girder bridge is analyzed. To investigate the effect of vehicle speed, pavement grade, and the dimension of pavement roughness on the impact factor of the corrugated steel web bridge, a total of 36 simulation conditions were considered. The vehicle speed ranges from 20 km/h to 120 km/h, covering the typical driving speeds of vehicles on bridges. The ABC-level pavement roughness was designed according to the Chinese standard GB/T 7031-2005 [37]. Additionally, two-dimensional and three-dimensional pavement roughness were specifically considered to investigate the effect of pavement roughness dimension on the impact factor. All simulation conditions are summarized in Table 5. The vertical displacement time history data of the bridge deck node at the mid-span of the bridge’s central axis is output, as shown in Figure 10. Due to space limitations, only a partial set of response results is presented.
In the mid-span node vertical displacement time history curve, three stages can be identified: vehicle entry onto the bridge, crossing the bridge, and exit from the bridge. The entry stage appears as a horizontal segment in the time history curve, indicating that the vehicle has not yet exerted force on the bridge. During the crossing stage, the bridge is in a forced vibration phase, where the time history curve of the bridge nodes includes both the static load effect from the vehicle on the bridge and the bridge vibration induced by the vehicle. Since bridge damping is not considered, after the vehicle exits the bridge and the excitation ends, the bridge enters a free vibration phase.

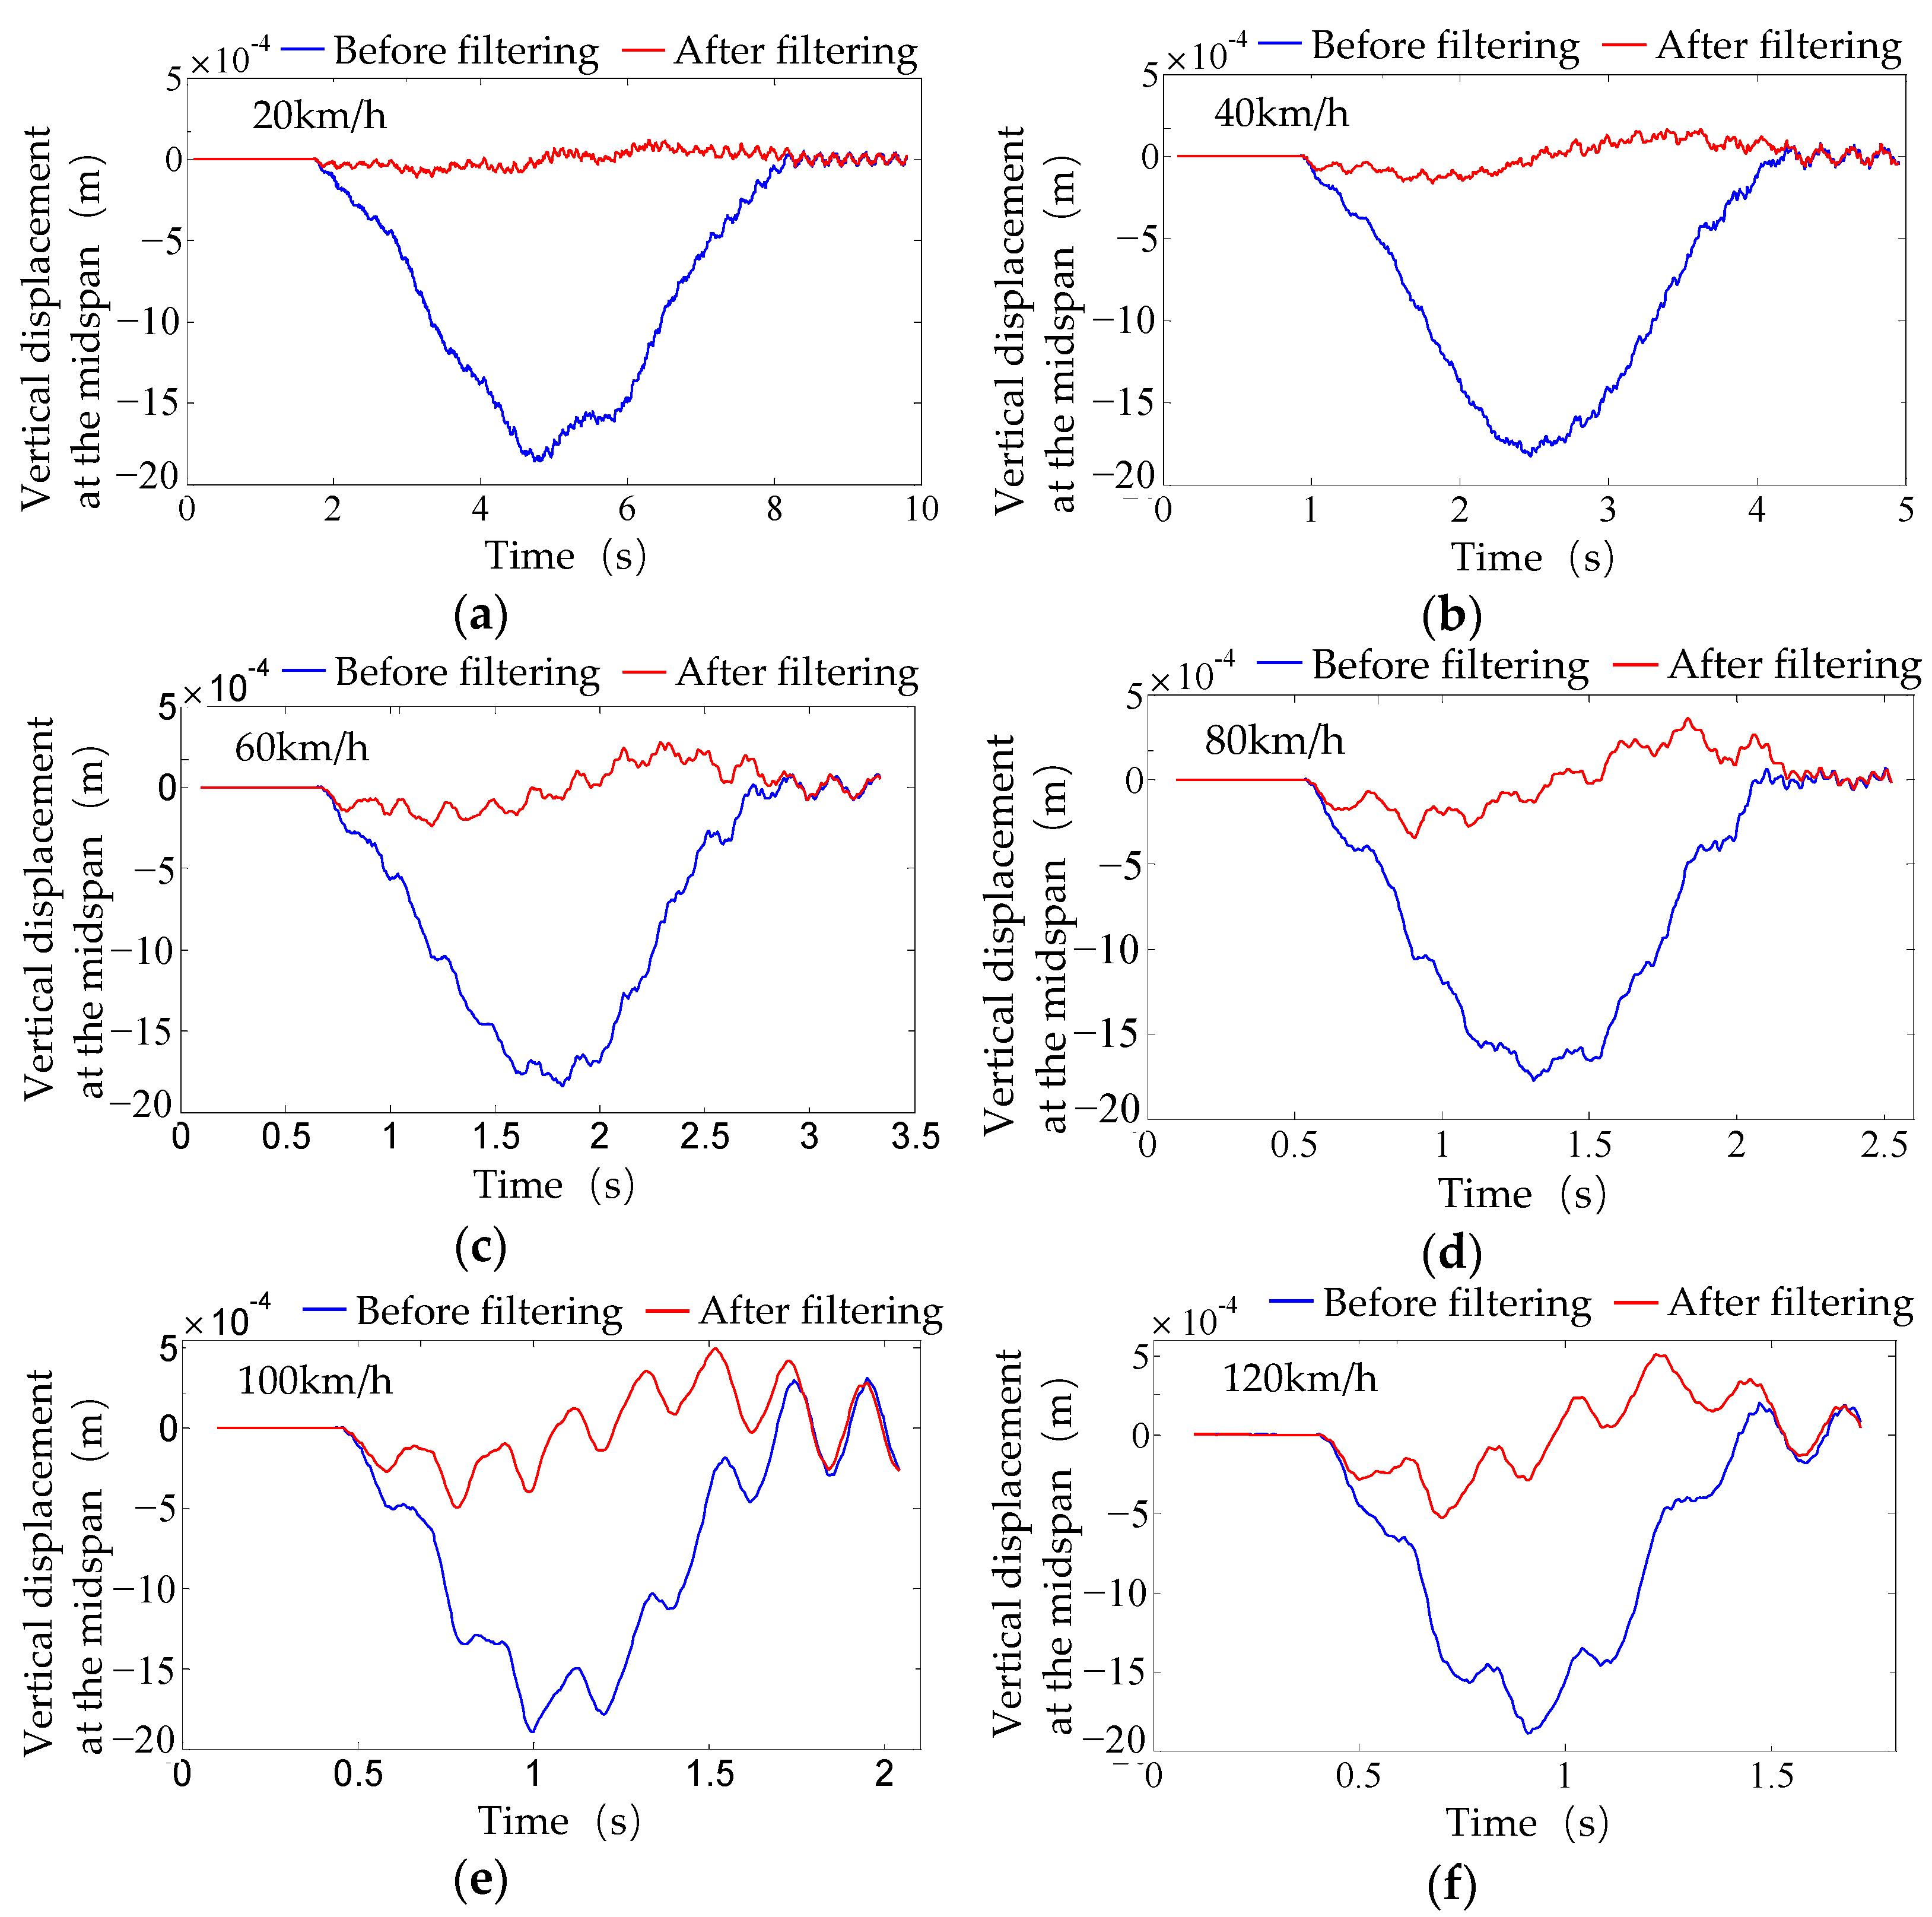
3.3. Calculate the Impact Factor

The impact effect of vehicle load on the bridge is generally represented by multiplying the standard value of the vehicle load by the impact factor. In the Chinese standard (JTG D60-2015) [46], the impact factor is defined as:
μ = Y d max Y j max 1
Here, Y d max represents the maximum peak of the sectional dynamic response when the vehicle load crosses the bridge, and Y j max represents the maximum static response at the same section when the same vehicle load is applied statically. However, vehicle–bridge coupling vibration is a dynamic problem. If the bridge happens to be in an upward vibration phase when the vehicle passes the measurement point, Y d max will decrease. In this case, directly calculating the impact factor using the definition method may not accurately reflect the impact effect of the vehicle load on the bridge.
In the Chinese standard (JTG/T J21-01-2015) [47], the impact factor is calculated based on the time history curve of the bridge’s dynamic deflection or dynamic strain, using the following formula:
μ = f d max f j max 1 = f d max f d max + f d m i n 2 1
where f d max represents the maximum dynamic deflection amplitude, f j max is the peak value of the waveform amplitude center trajectory, or it can be obtained through low-pass filtering, and f d m i n is the dynamic deflection valley value corresponding to f d max .
Drawing on the idea of separating dynamic and static responses in the methods above, the dynamic load effect of the vehicle on the bridge is obtained by processing the dynamic deflection time history curve through filtering. This approach is used to calculate the impact factor. Deriving Formula (9) yields the following:
μ = f d max f j max 1 = f d max f j max f j max = f i max f j max
where f i max is the maximum value of the bridge vibration amplitude obtained through high-pass filtering, and f j max is the maximum value of the static deflection time history curve at the corresponding position from static analysis.
The purpose of high-pass filtering is to remove low-frequency static deflection from the bridge vibration response. After this operation, the remaining high-frequency response is the dynamic deflection caused by the impact effect, which will be used to calculate the impact factor. The determination of the cutoff frequency is crucial before performing high-pass filtering. According to the abovementioned principle, the ideal filtering condition is achieved when the removed low-frequency response is exactly equal to the static response obtained from the bridge static analysis. The specific method can be divided into two steps. First, a spectral analysis is performed on the dynamic deflection time history curve to estimate the approximate frequency range. Then, the high-pass filter cutoff frequency is determined based on the principle that the maximum static deflection value obtained by low-pass filtering should be equal to the maximum static deflection value calculated by the static analysis module. Based on trial calculations, a cutoff frequency of 2 Hz is selected to process the mid-span node deflection time history curve with high-pass filtering in this paper. As shown in Figure 11, the high-pass filtering effect of the mid-span deflection under class A pavement is presented. Due to space limitations, only a partial set of response results is presented. After high-pass filtering, the time history curve effectively reflects the vibration situation in the bridge’s dynamic response.
The maximum vibration amplitude of the time–history curve after high-pass filtering for each condition is substituted into Equation (10) to calculate the impact factor for each condition. A total of 36 working conditions were set based on the three influencing factors, and the calculation results are shown in Table 6. When considering three-dimensional pavement roughness, the pavement roughness values at the contact points between each wheel of the spatial vehicle model and the pavement are different. When three-dimensional pavement roughness is not considered, it is assumed that the pavement roughness values experienced by the left and right wheels of the spatial vehicle model are the same, i.e., two-dimensional pavement roughness.

4. Analysis of Factors Affecting the Impact Factor

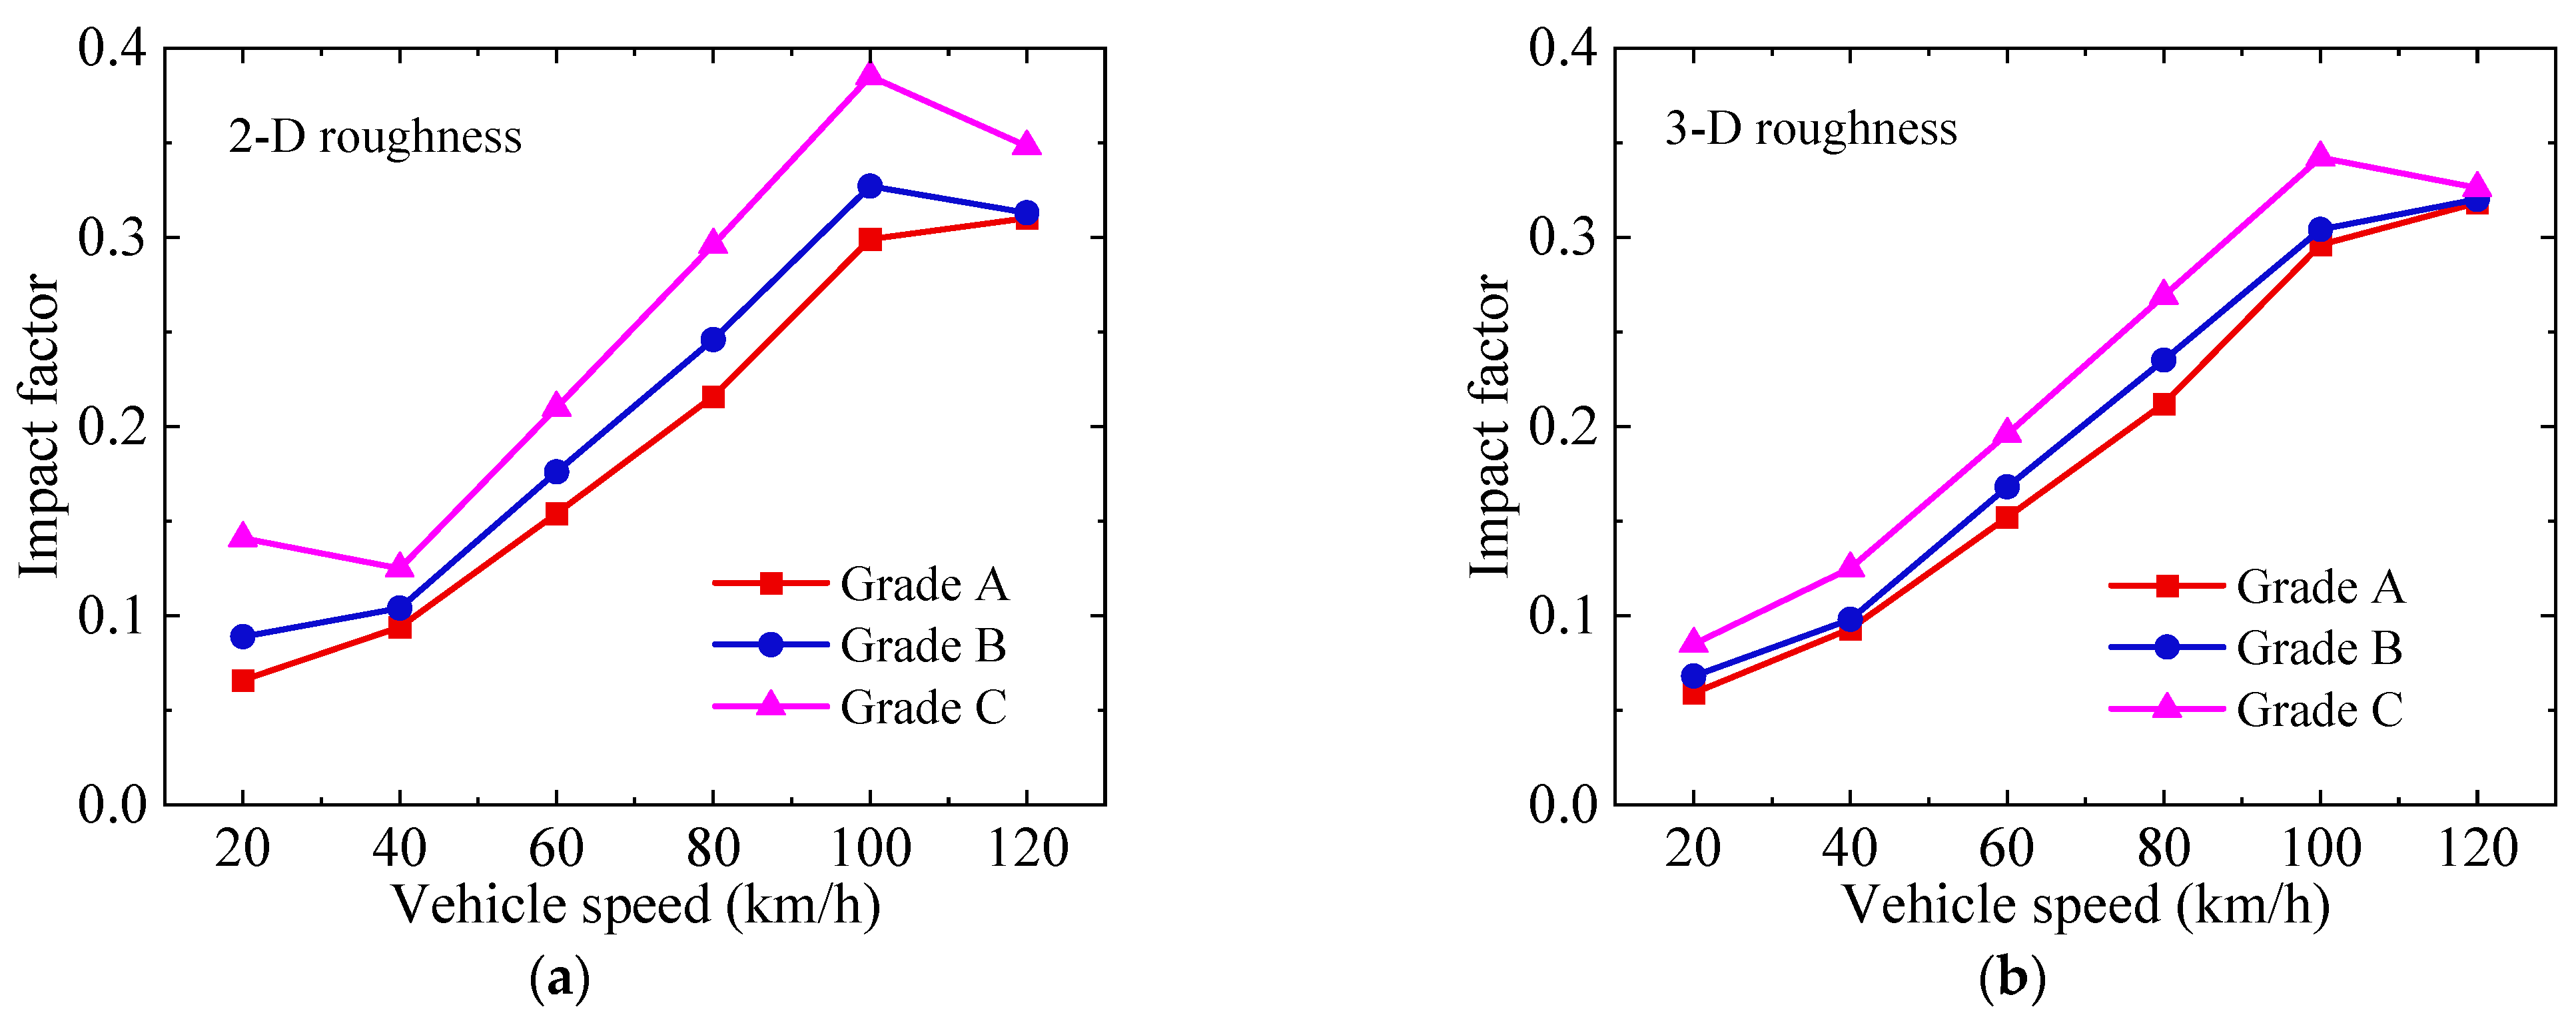
4.1. Effect of Vehicle Speed

Under different pavement grades, the variation in the impact factor with vehicle speed is not consistent. As shown in Figure 12a, it presents the impact factor under the two-dimensional pavement roughness condition. On grade A pavement, the impact factor increases with rising vehicle speed, but within the 100 km/h to 120 km/h range, the growth rate of the impact factor slows down. On grade B pavement, the impact factor increases with vehicle speed in the range of 20 km/h to 100 km/h, but decreases as speed increases from 100 km/h to 120 km/h. On grade C pavement, the impact factor increases with vehicle speed between 40 km/h and 100 km/h, while it decreases with increasing speed in the ranges of 20 km/h to 40 km/h and 100 km/h to 120 km/h. As shown in Figure 12b, it presents the impact factor under the three-dimensional pavement roughness condition. When the pavement grade is grade A and grade B, the impact factor increases with the vehicle speed. In the speed range of 100 km/h to 120 km/h, the increase in the impact factor slows down. When the pavement grade is grade C, the impact factor increases with speed in the range of 20 km/h to 100 km/h but decreases with speed in the range of 100 km/h to 120 km/h. Overall, in most cases, the impact factor increases with the rise in vehicle speed. Therefore, in most cases, maintaining a lower vehicle speed can reduce the impact effect on the bridge.

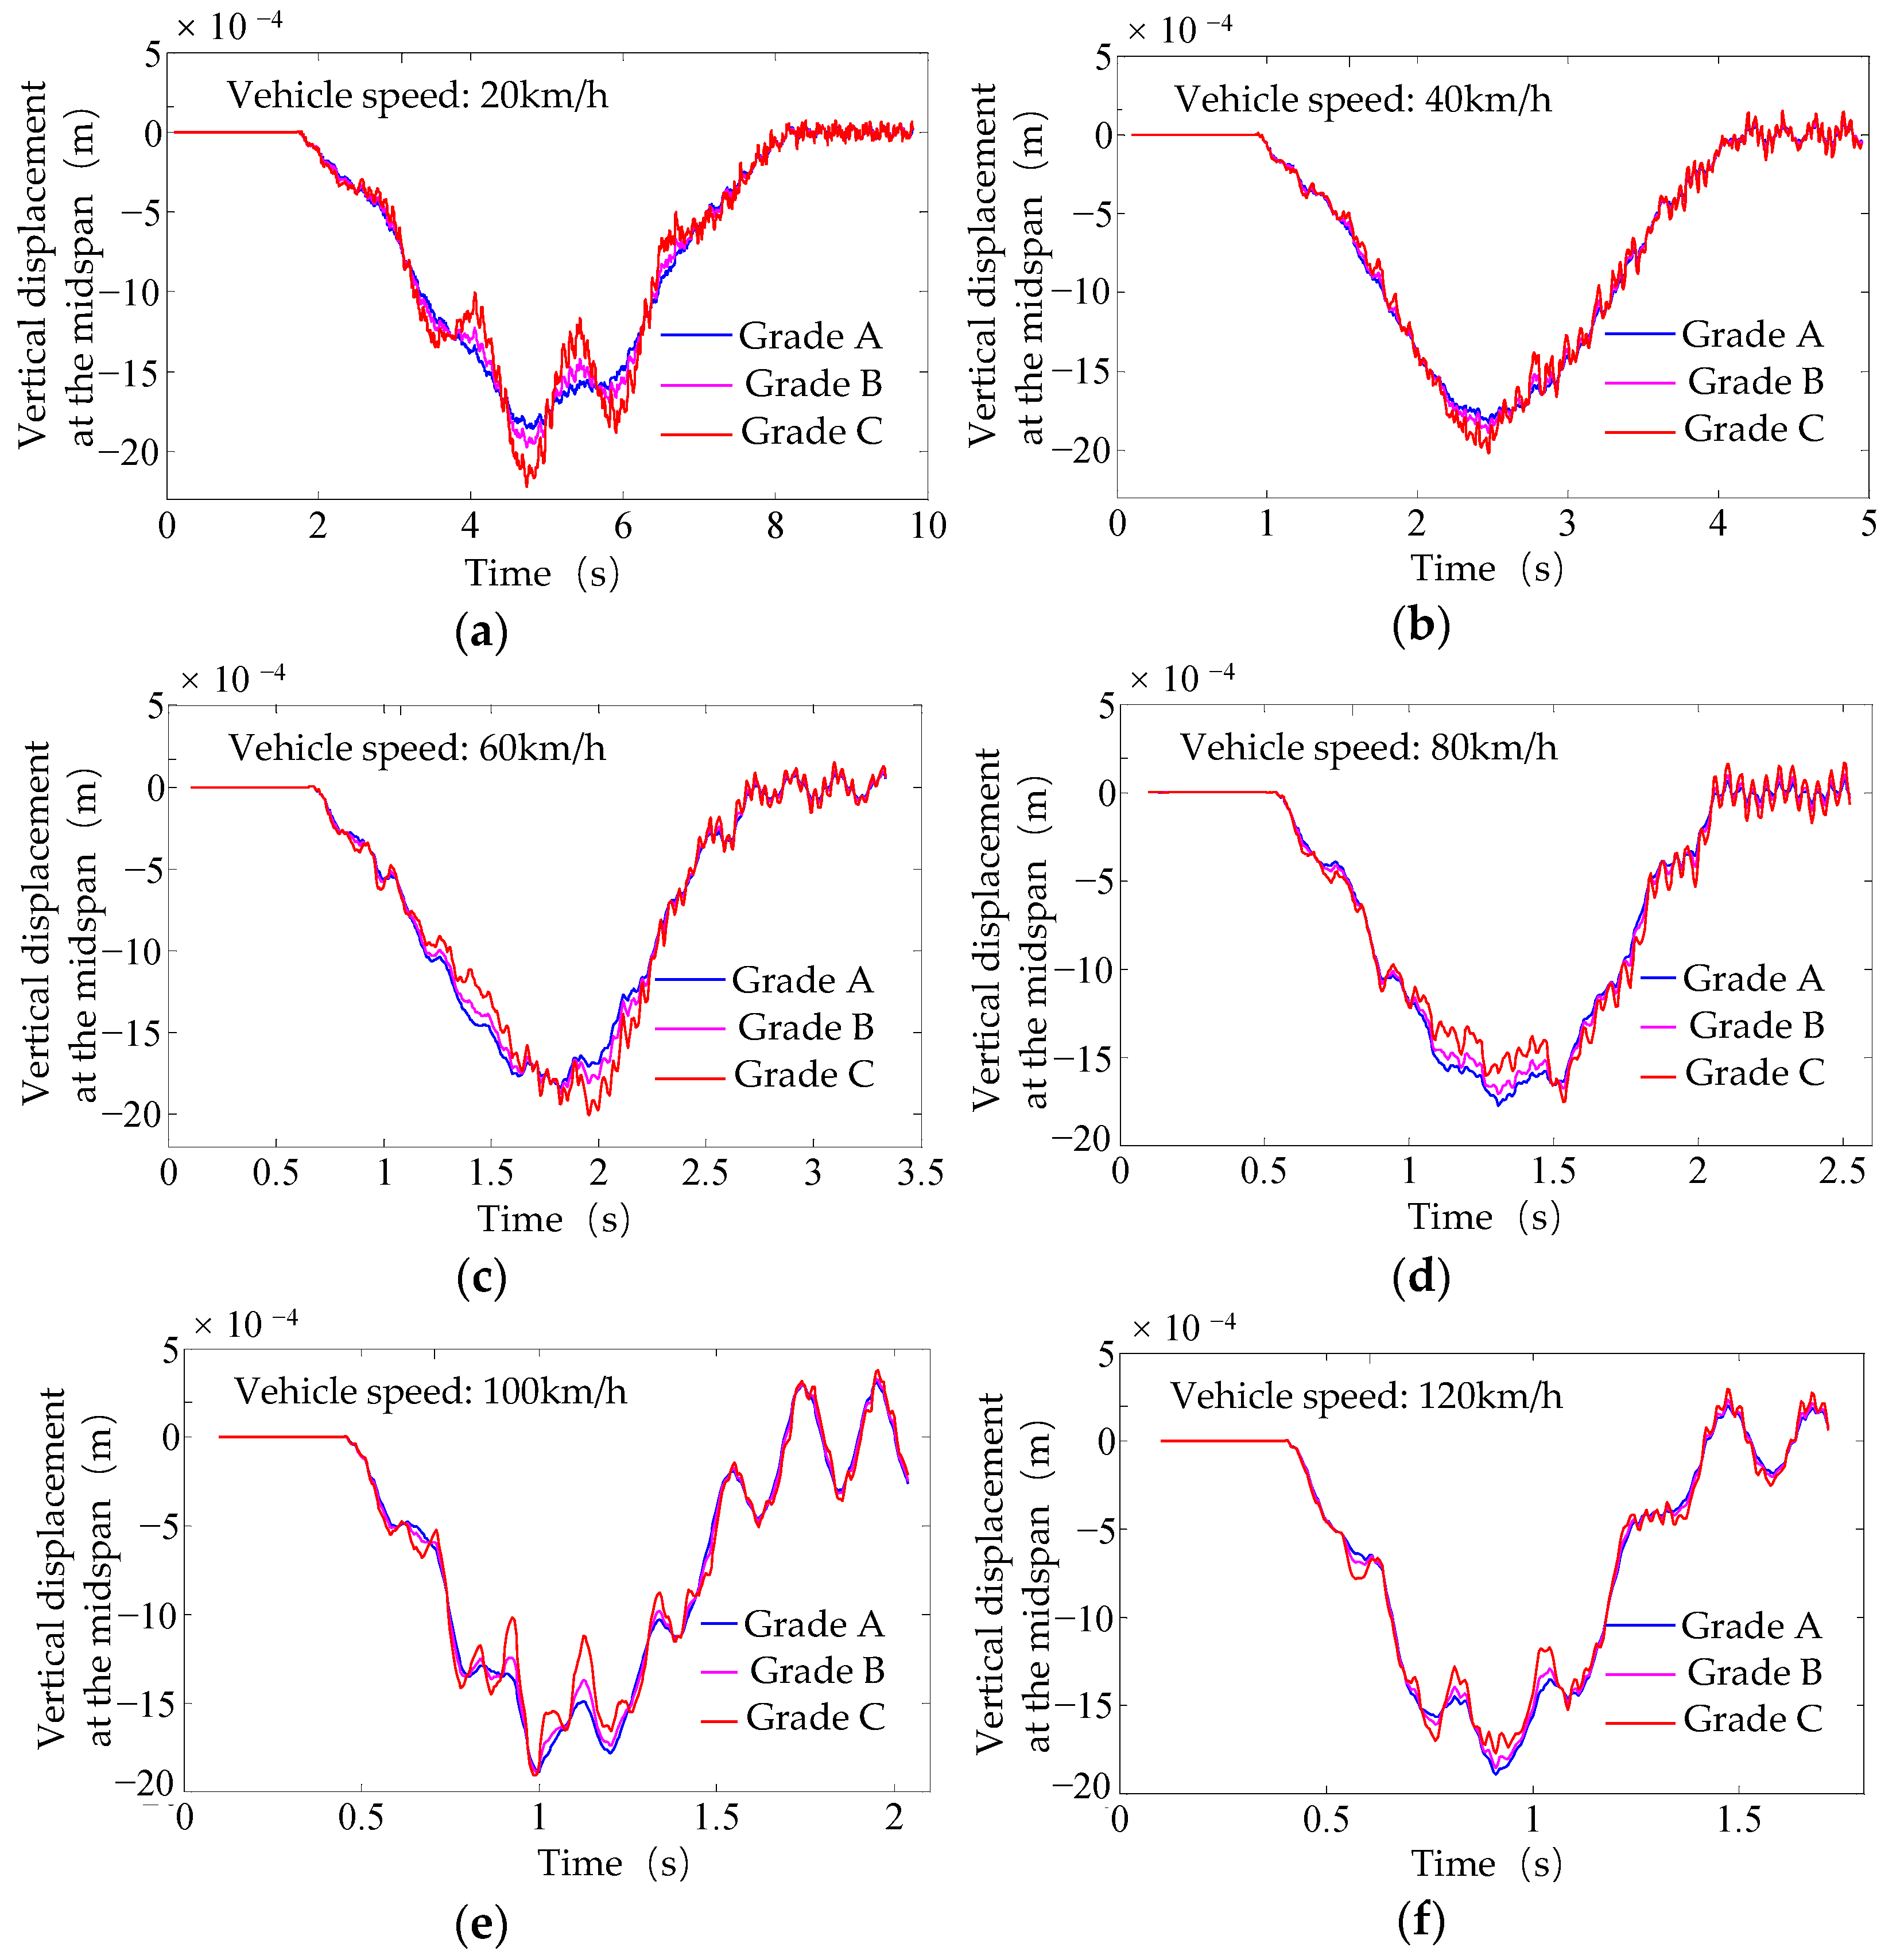
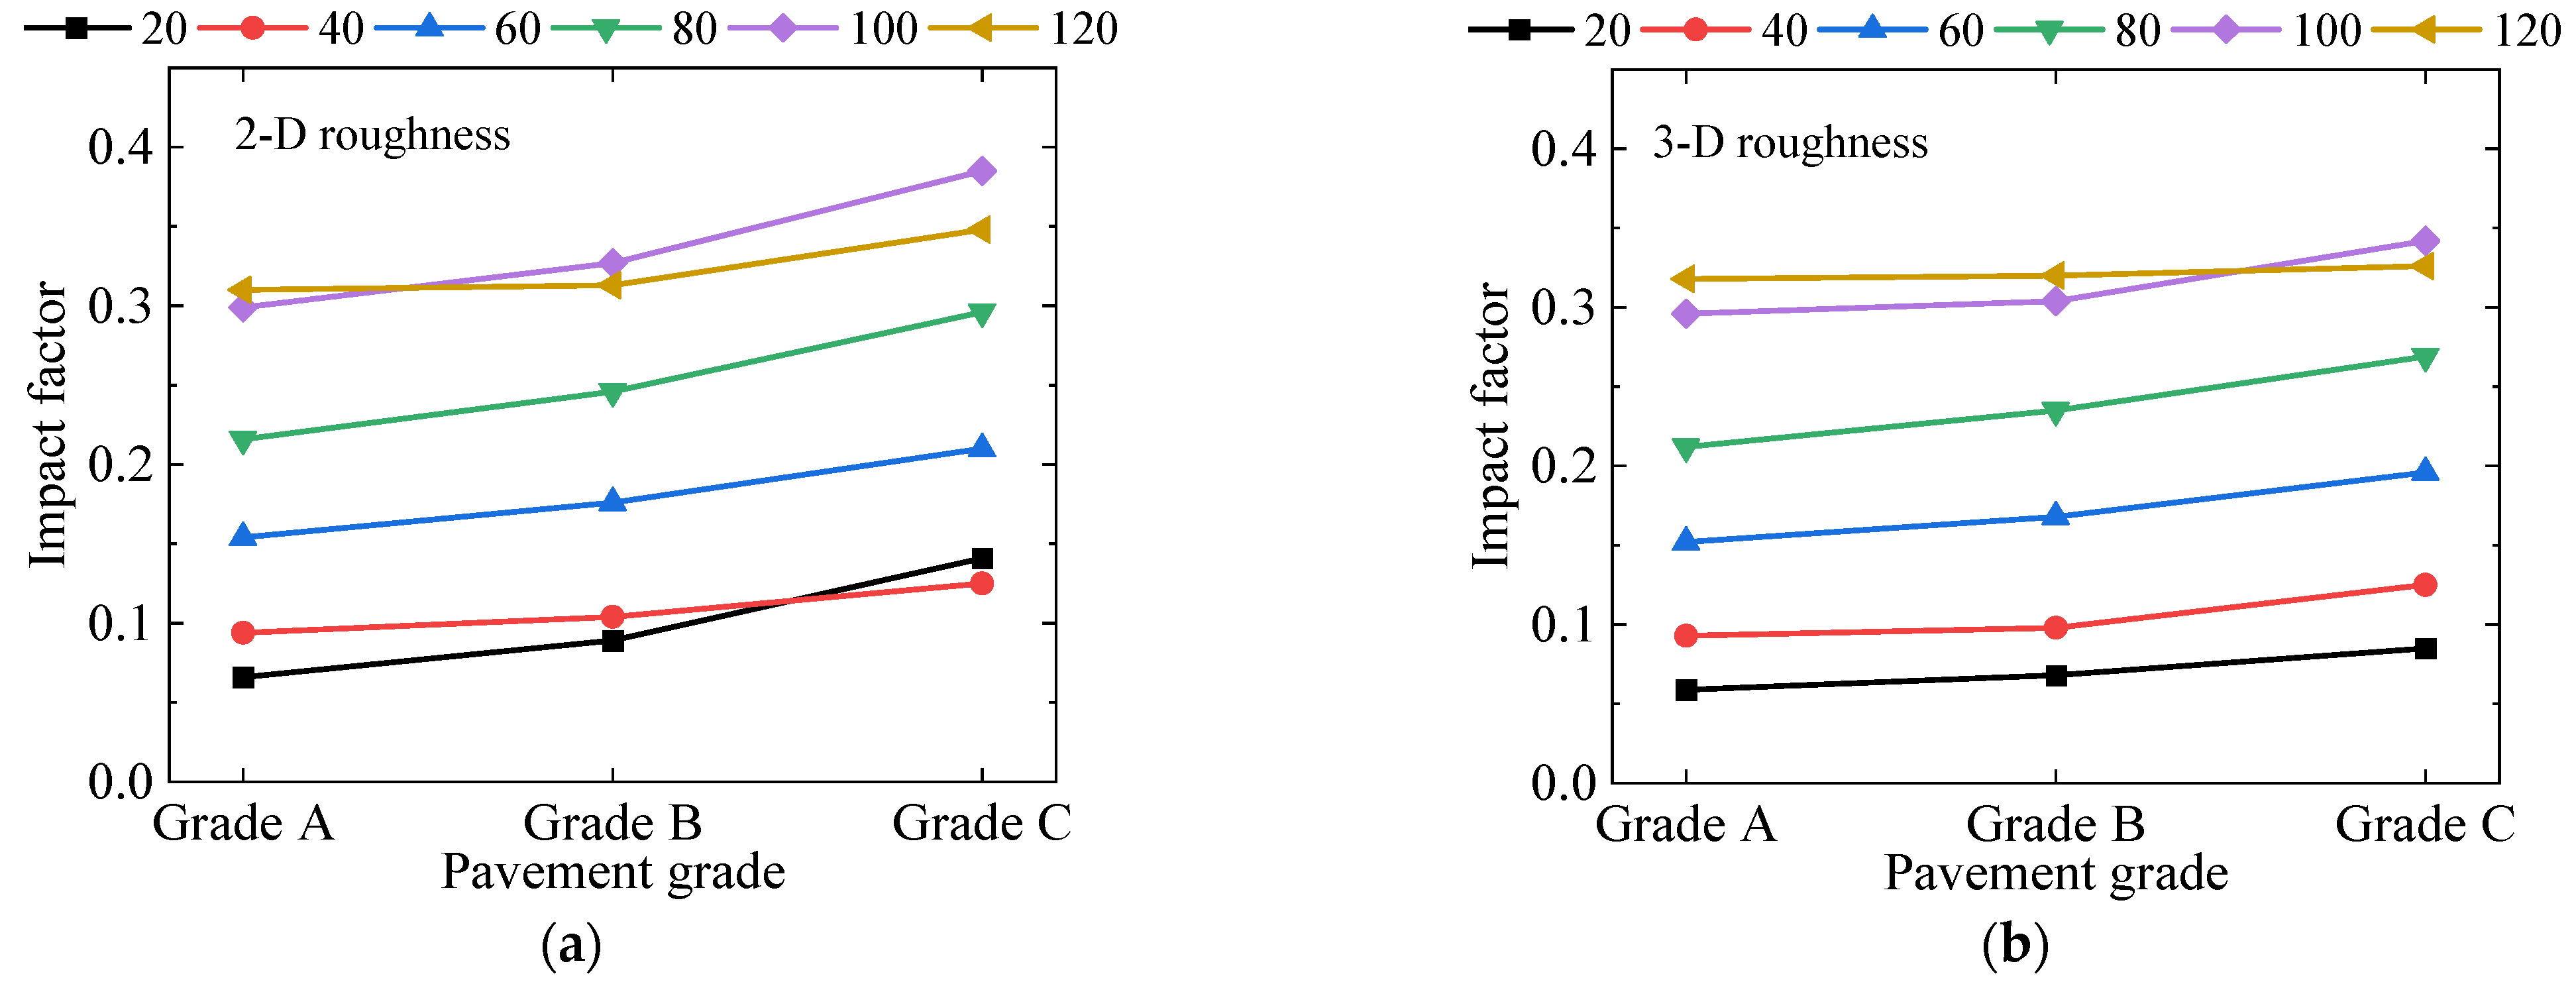
4.2. Effect of Pavement Grade

As shown in Figure 13, the graph illustrates the relationship between the impact factor and pavement grade. As shown in Figure 13a, it presents the impact factor under the two-dimensional pavement roughness condition. It can be observed that the impact factor is smallest on grade A pavement and largest on grade C pavement, indicating that the impact factor increases as pavement conditions worsen. With each increase in pavement grade, the impact factor grows by an average of 19.1%. As shown in Figure 13b, it presents the impact factor under the three-dimensional pavement roughness condition. Similarly to the two-dimensional pavement roughness condition, the impact factor increases successively with the pavement grade. The findings in this study align with those of other previous research [48], further validating the accuracy of the method used here. The reason for this phenomenon can be explained by the coupling force. The greater the pavement roughness, the stronger the coupling force between the vehicle and the bridge, and the larger the impact factor [48]. Therefore, regular pavement maintenance is beneficial for extending the service life of the bridge.

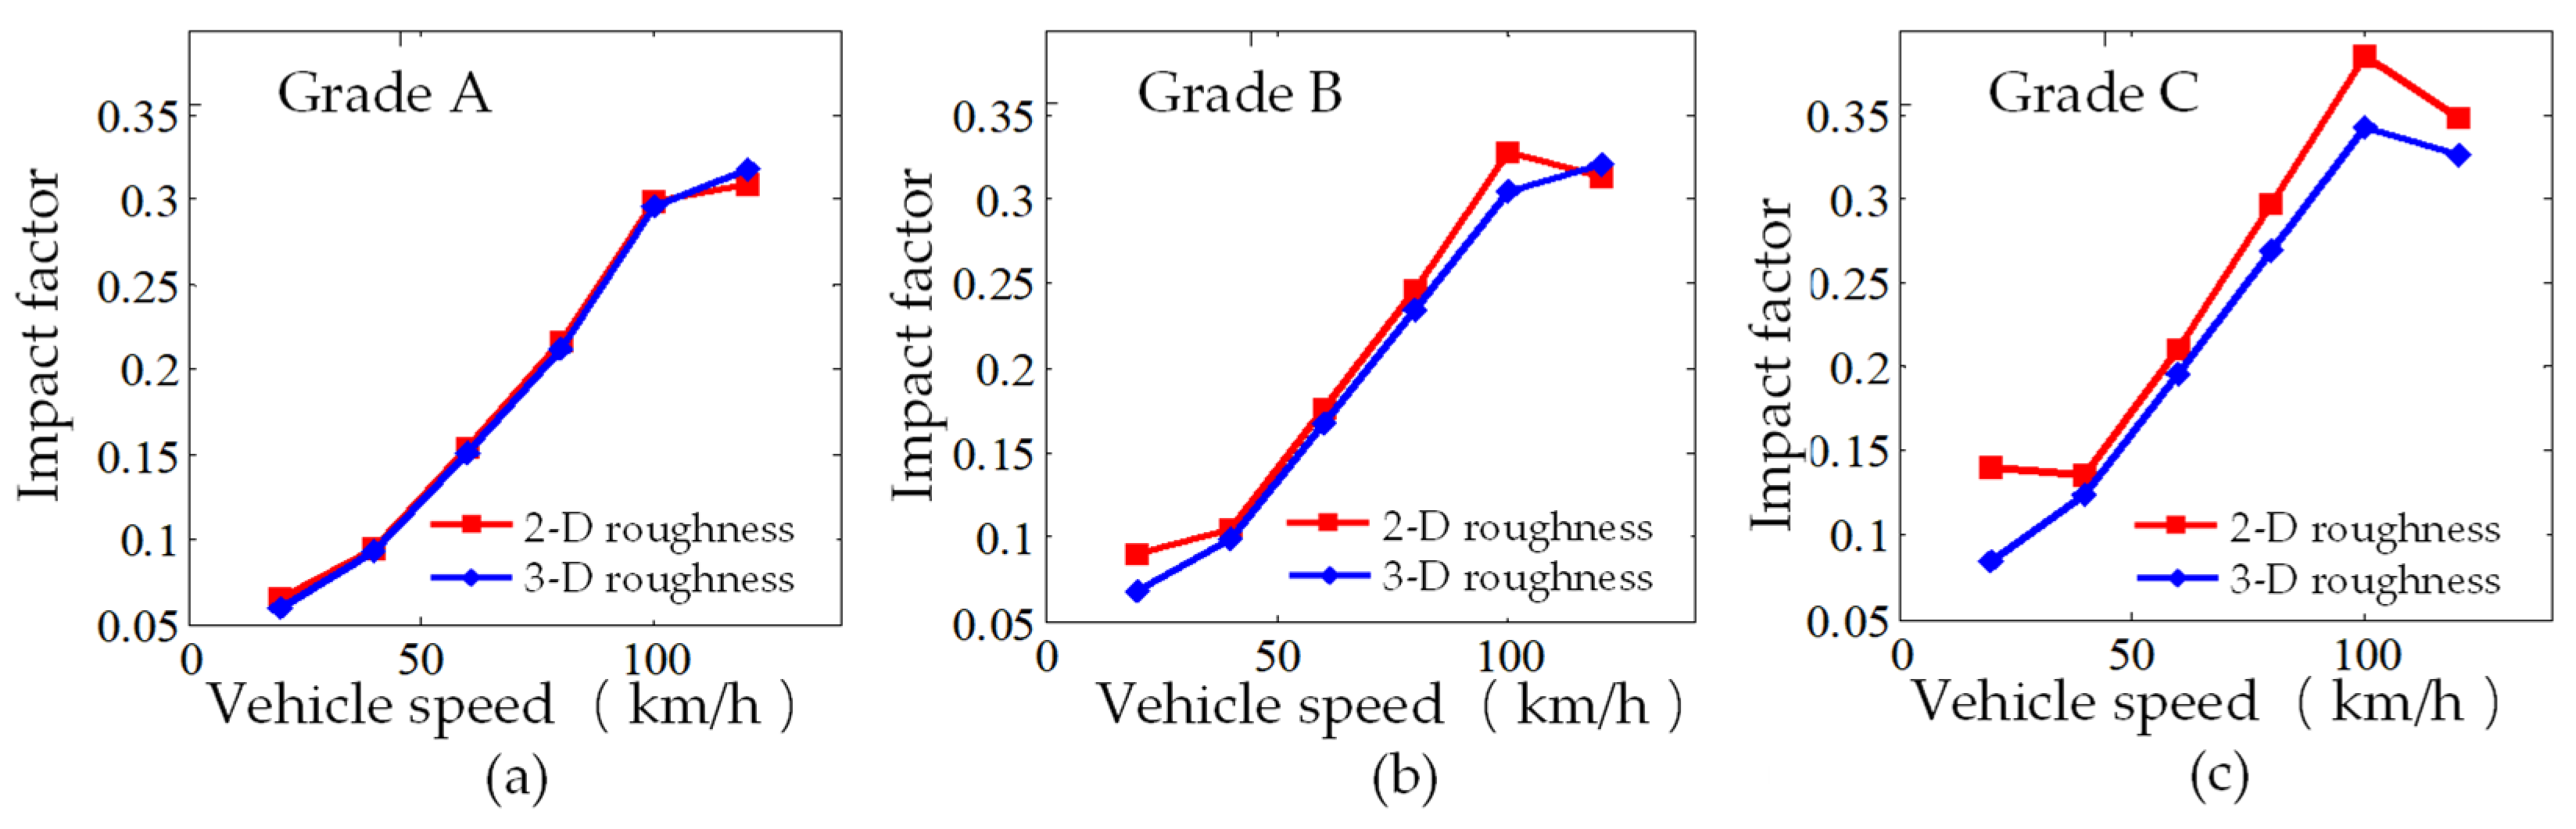
4.3. Effect of Pavement Roughness Dimensions

As shown in Figure 14, the graph illustrates the relationship between the impact factor and vehicle speed on two-dimensional and three-dimensional pavement roughness under different pavement grades. It can be observed that within the speed range of 20 km/h to 100 km/h, the impact factor on three-dimensional pavement roughness is smaller than that on two-dimensional pavement roughness for pavement grades A, B, and C. At a vehicle speed of 120 km/h, the impact factor on three-dimensional pavement roughness is greater than that on two-dimensional pavement roughness for pavement grades A and B. The occurrence of these individual opposite phenomena can be attributed to the randomness of pavement roughness samples. For grade C pavement, the impact factor on three-dimensional pavement roughness is smaller than that on two-dimensional pavement roughness. Calculating the average impact factor for each pavement grade reveals that, on average, the impact factor on three-dimensional rough pavements is reduced by 2.4%, 7.3%, and 13.5%. These reductions are observed when compared to two-dimensional rough pavements for grades A, B, and C, respectively. Therefore, overall, the impact factor on three-dimensional pavement roughness tends to be generally smaller than on two-dimensional pavement roughness. This can be explained by the frequency of the coupling force between the vehicle and the bridge. When the pavement roughness is two-dimensional, the coupling force frequency of the left and right wheels is more consistent [20]. Therefore, it is more likely to increase the dynamic response of the bridge.

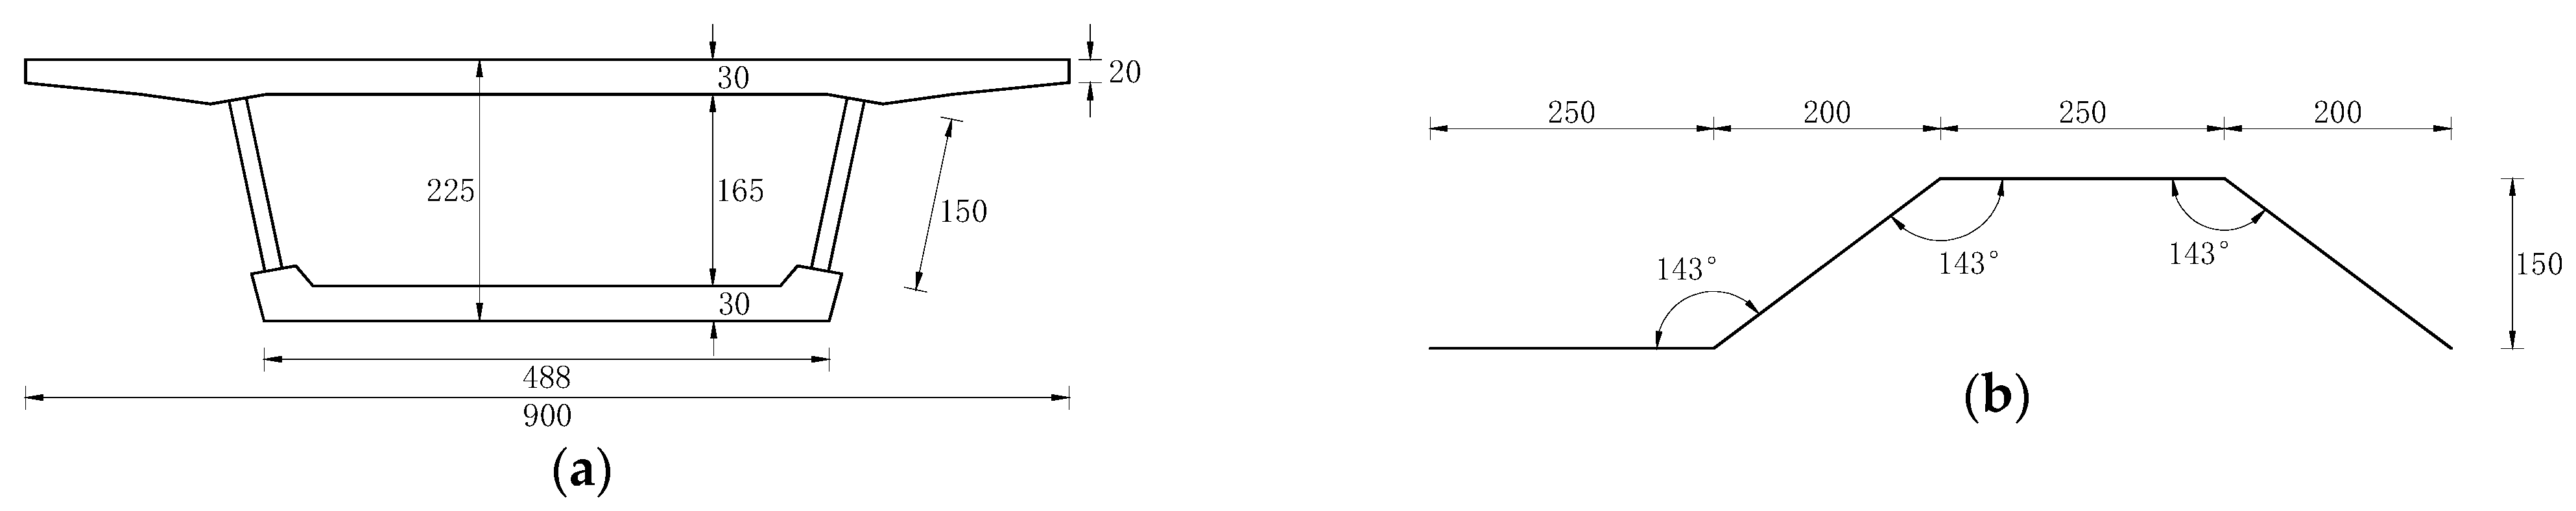
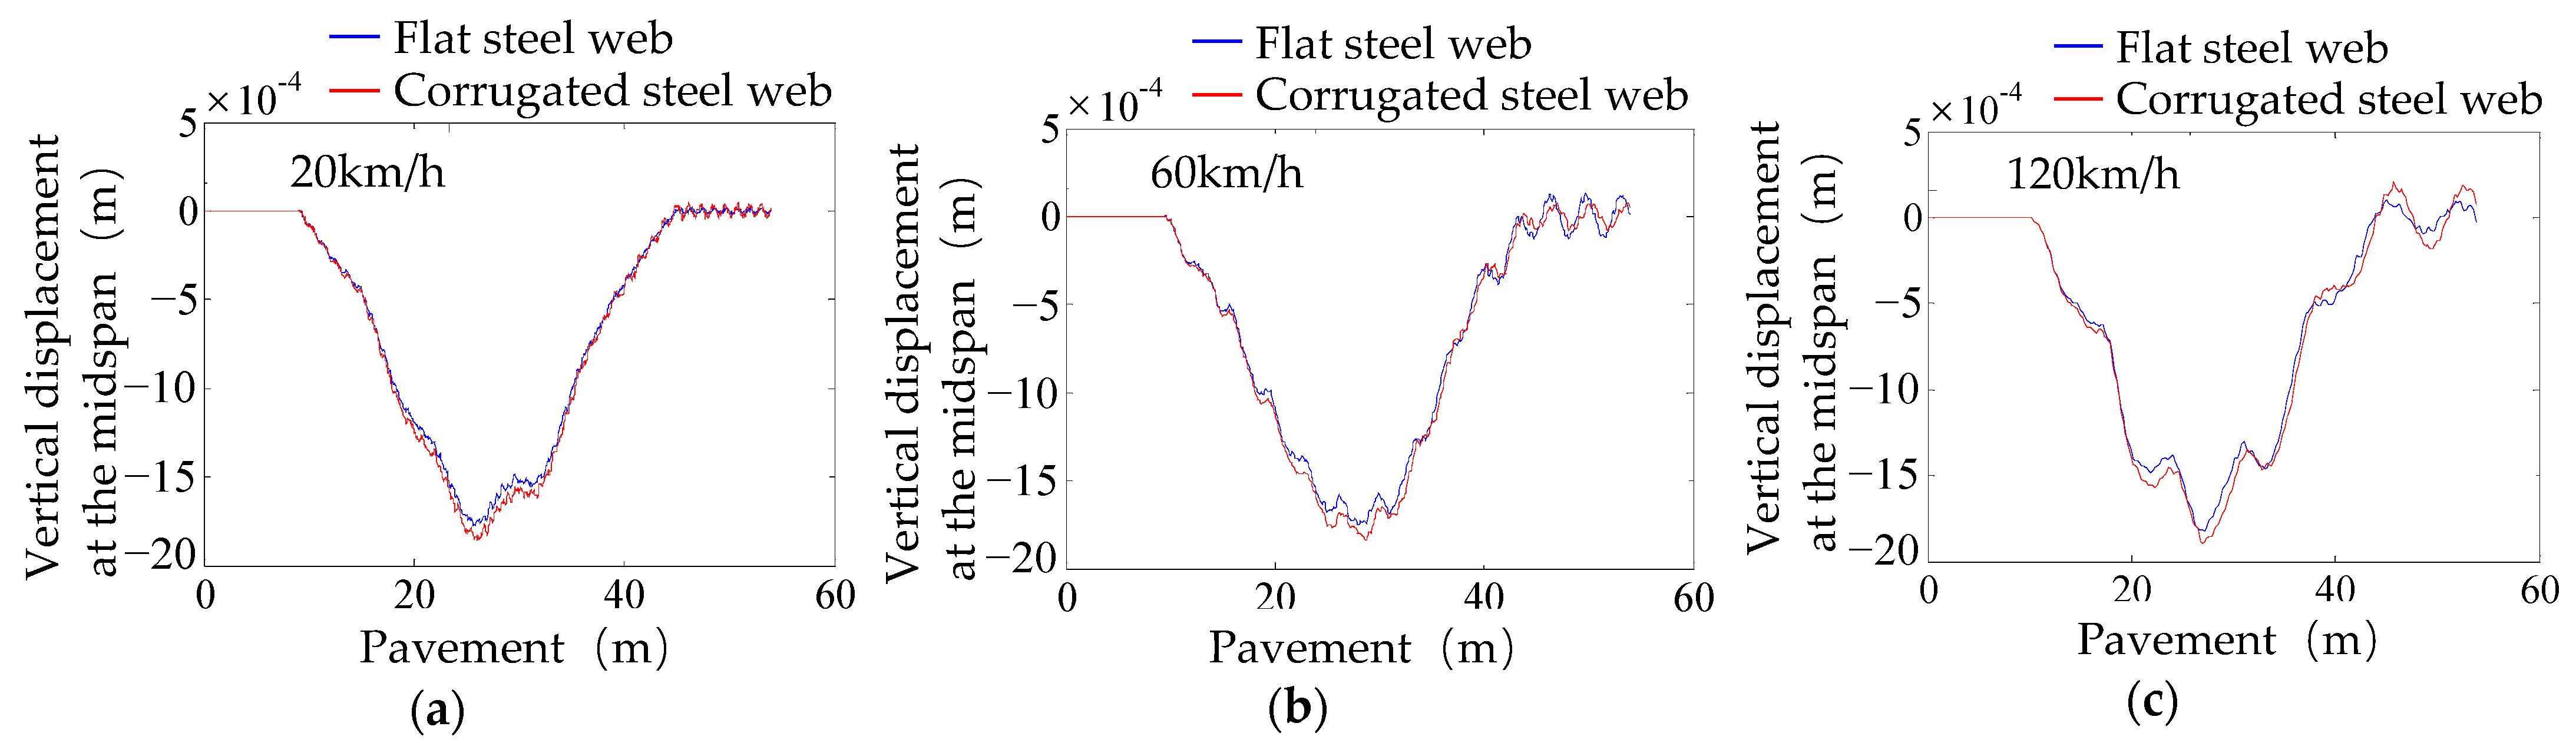
4.4. Effect of Box Girder Configurations

To study the effect of box girder configurations on the impact factor, this paper examines the impact factors of box girders with flat steel webs and steel bottom plates. The flat steel web box girder replaces the corrugated steel web with a flat steel web of equivalent thickness. The steel bottom plate box girder replaces the concrete bottom plate with a steel bottom plate on the corrugated steel web box girder. The equivalency criterion is based on equal mid-span static deflection under live load. Following this equivalency principle, a 20 mm thick steel plate replaces the concrete bottom plate in the corrugated steel web box girder model to obtain the steel bottom plate box girder, and the beam height is adjusted to 2.6 m.
As shown in Figure 15, a comparison is made between the dynamic responses of flat steel web box girder bridges and corrugated steel web box girder bridges on grade A pavement. The comparison considers vehicle speeds of 20 km/h, 60 km/h, and 120 km/h. The results reveal that the maximum dynamic deflection of the flat steel web box girder decreases by 4.2%, 4.7%, and 3.7%, respectively, compared to the corrugated steel web box girder bridge, which aligns with expectations. According to the research in paper [2], the effective elastic modulus of corrugated steel webs is approximately 1/700 of the original elastic modulus, meaning that they bear minimal axial force and bending moment in the box girder. However, as the static deflection of the flat web box girder is also relatively reduced, the impact factor between the two is not significantly different, as shown in Table 7.
As shown in Figure 16, under pavement grade A, the dynamic response of the steel bottom plate box girder bridge is compared with that of the concrete bottom plate box girder bridge. This comparison is made at vehicle speeds of 20 km/h, 60 km/h, and 120 km/h. It can be observed that although the static deflections under live load are nearly identical for both bridges, the dynamic deflection of the steel bottom plate box girder bridge increased. The increases were 21.7%, 30.3%, and 33.4% relative to the concrete bottom plate box girder bridge. As shown in Table 7, the impact factor of the steel bottom plate box girder bridge increased by 274.2%, 196.8%, and 116.8% compared to the concrete bottom plate box girder bridge. This shows that, while replacing the concrete bottom plate with a steel bottom plate can further reduce the self-weight of the box girder while maintaining static load-bearing capacity, it also introduces vibration issues for the bridge.

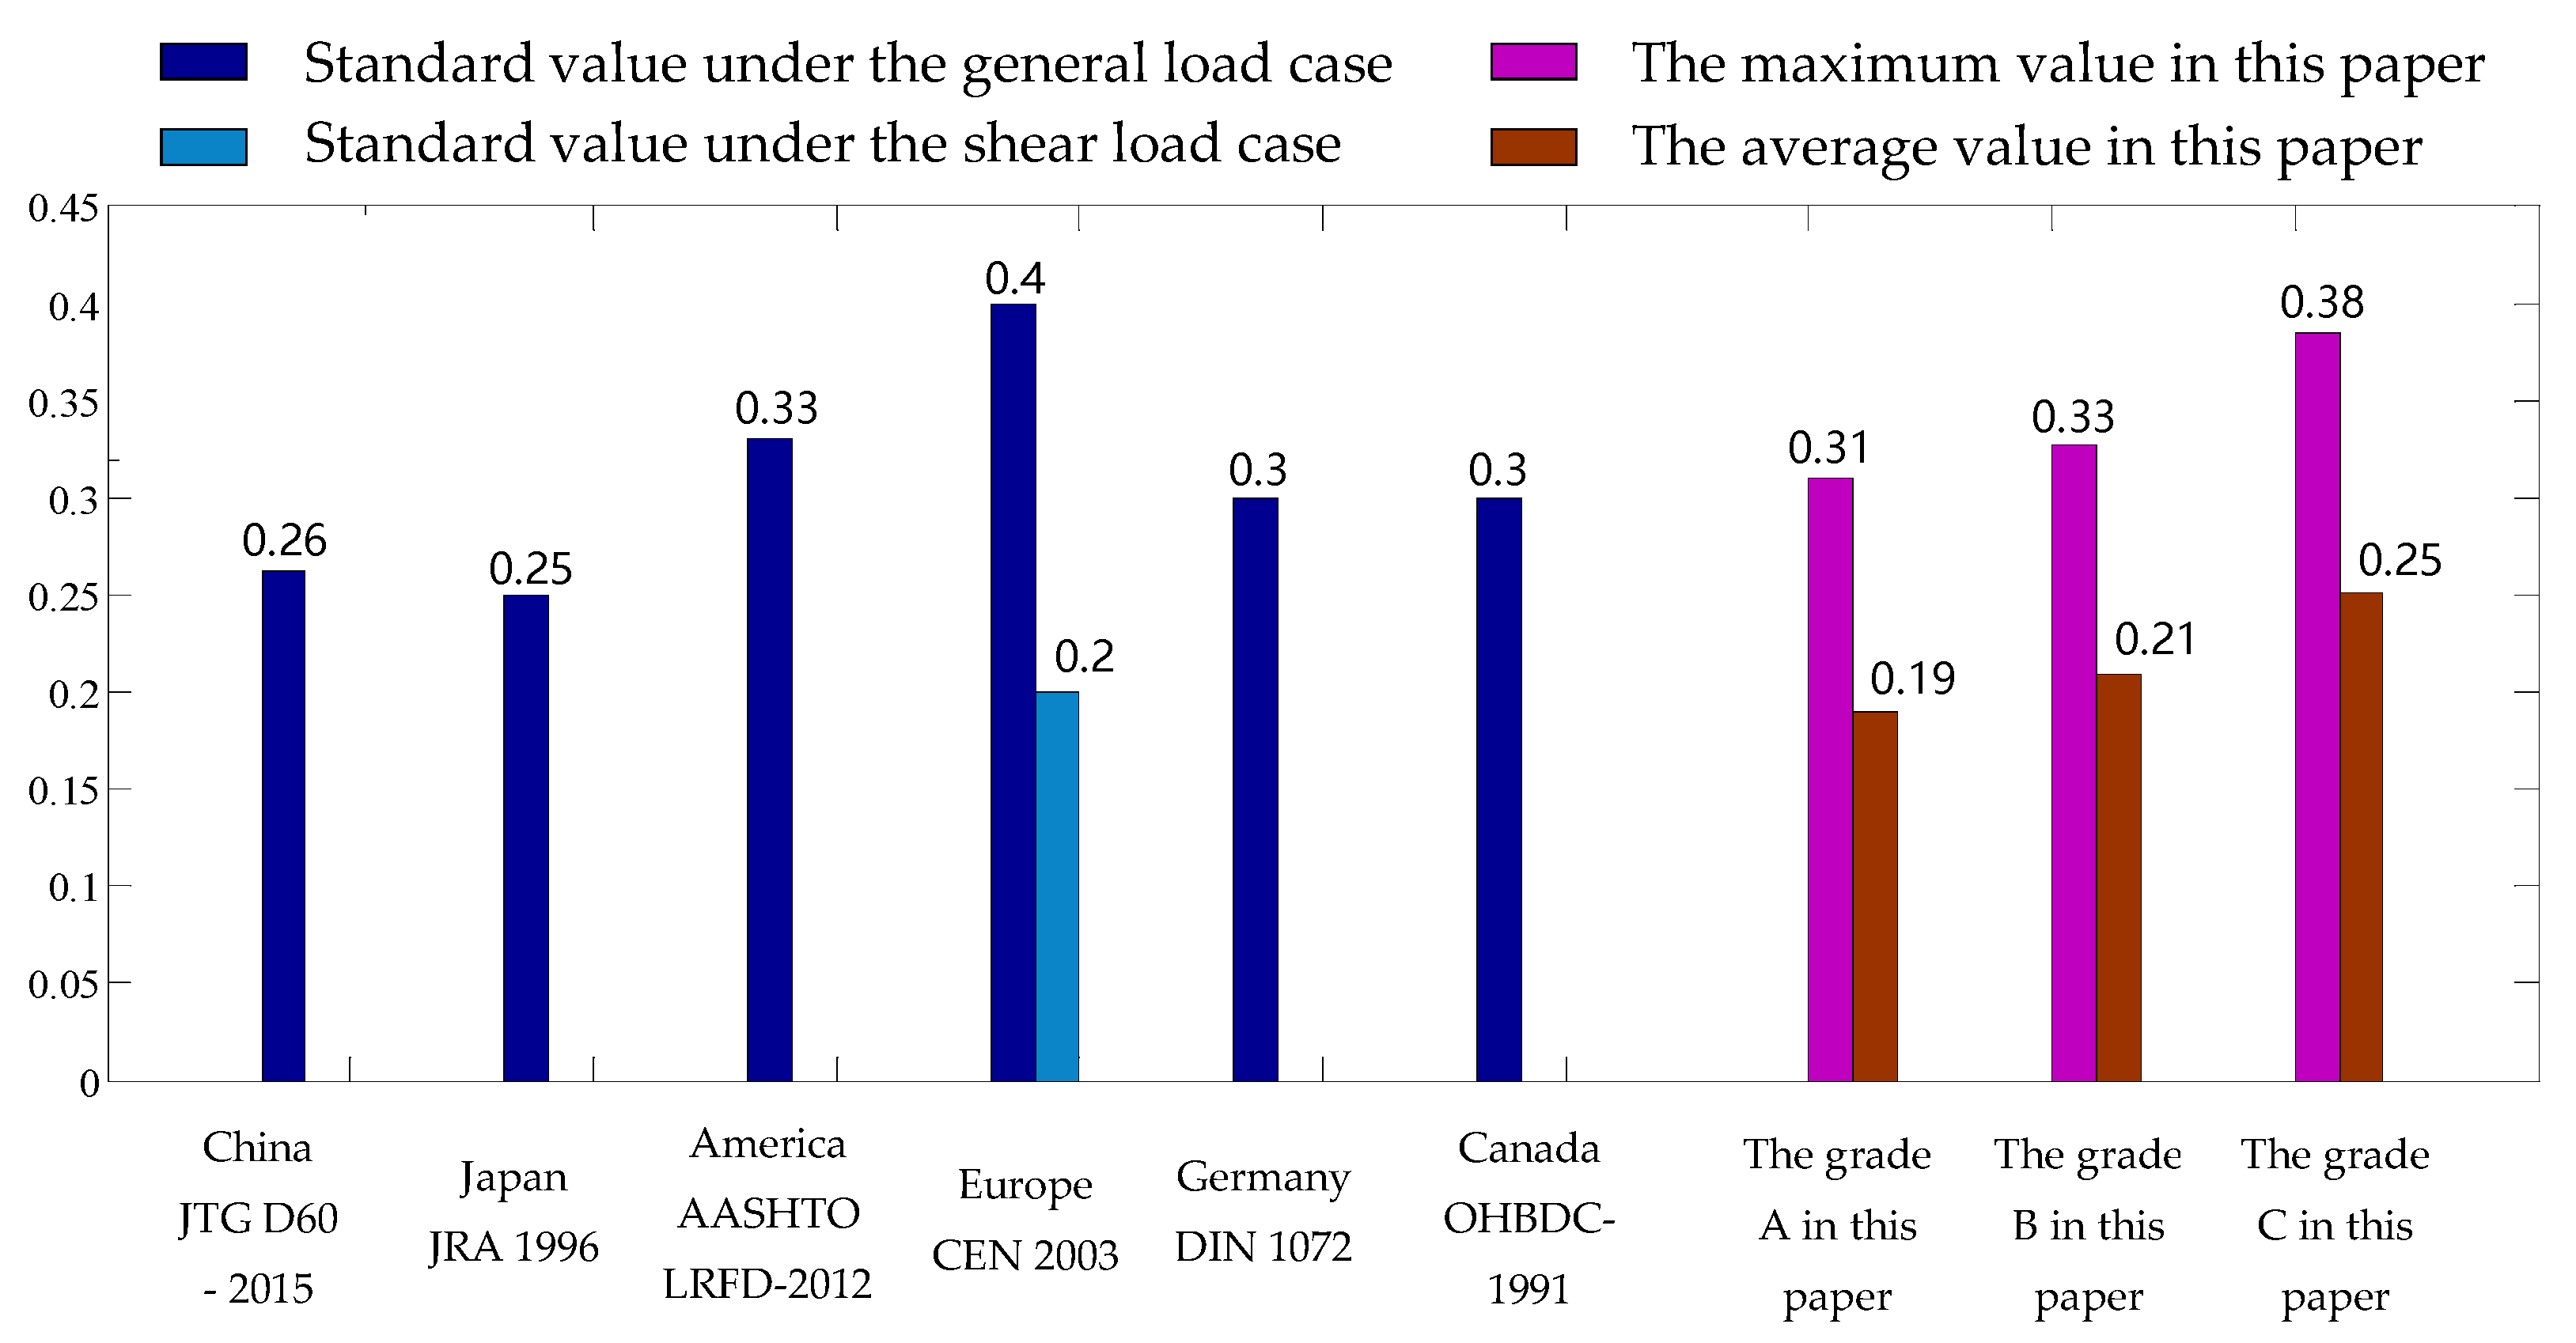
4.5. Comparison of Impact Factor in This Study with International Standards

The definitions of impact factor vary across international standards [30,49] and can be grouped into three main types: those related to span length, those based on bridge natural frequency, and others. This study compares standards tied to bridge span length, including the Japanese standard [50], German standard DIN1072 [51], and European standard [52]; the Chinese standard (JTG D60-2015) [46], which is related to bridge natural frequency; and the American standard AASHTO LRFD (2012) [53], which is based on component location, and the Canadian standard OHBDC (1991) [54], which considers the number of vehicle axles. The maximum and average impact factors of the corrugated steel web box girder under grade A, B, and C pavement conditions were calculated and compared with the values specified by various international standards, as shown in Figure 17. The European standard CEN 2003 specifies impact factors separately for shear and bending moment, which are 0.2 and 0.4 for the bridge model used in this study. The impact factors calculated according to the standards of the United States, Canada, and Germany tend to be close to 0.3. The impact factors obtained from the Chinese and Japanese standards are relatively similar, at 0.26 and 0.25, respectively.
Comparing the calculated impact factors in this study with those specified by various international standards reveals the following: For the average impact factor, the mean values across all pavement grades, except for the shear impact factor specified by the European standard, are less than or equal to the calculated values of all standards. Regarding the maximum impact factor, the peak value for the grade A road is only lower than those specified by the American and European standards. For grades B and C, the maximum values are only lower than the bending moment impact factor specified by the European standard. Furthermore, it can be observed that the mean impact factor values across all pavement grades are lower than the values calculated by the Chinese standard. However, the maximum impact factor values for all road grades exceed those calculated by the Chinese standard. Therefore, it can be seen that the impact factor calculation methods in most national standards seem to favor scenarios with good pavement conditions. When pavement conditions deteriorate, some standards may underestimate the impact response of corrugated steel web bridges. For bridges with poor pavement roughness, it is more appropriate to analyze their dynamic performance through finite element vehicle–bridge coupling vibration simulation.

5. Conclusions

This paper proposes the three-dimensional contact constraint method, which facilitates the consideration of three-dimensional pavement roughness in vehicle–bridge coupling analysis. Three-dimensional vehicle–bridge coupling vibration analysis was conducted on a simply supported corrugated steel web box girder bridge. The effects of vehicle speed, pavement grade, pavement roughness dimension, and box girder configurations on the impact factor are analyzed. The calculated results are then compared with those of international standards. The conclusions are as follows:
  • After verifying the correctness of the method, a vehicle–bridge coupling vibration study on corrugated steel web box girder bridges was conducted. The effect of vehicle speed on the impact factor is not entirely positively correlated and is often influenced by other factors. For example, under different pavement grades, the variation pattern of the impact factor with vehicle speed is inconsistent. Within the range of operating speeds, there is a peak value for the impact factor. It is recommended to avoid the speed corresponding to this peak during operation to reduce excessive impact vibrations on the bridge.
  • At all speed levels, the influence pattern of pavement grade on the impact factor is consistent, with the impact factor increasing as pavement conditions deteriorate. For each upgrade in pavement grade, the impact factor increases by an average of 19.1%. Therefore, regular maintenance of the bridge pavement significantly promotes the service performance of the bridge.
  • The comparison of impact factors between three-dimensional and two-dimensional pavement roughness reveals notable differences. In most cases, the impact factors on the three-dimensional pavement roughness are smaller than those for the two-dimensional pavement roughness. The average reduction is 2.4%, 7.3%, and 13.5% for grade A, B, and C surfaces, respectively.
  • In the grade A pavement condition, when passing through the box beam at speeds of 20 km/h, 60 km/h, and 120 km/h, the mid-span dynamic deflection of the flat steel web box beam is reduced by 4.2%, 4.7%, and 3.7% compared to the corrugated steel web box beam, respectively. However, the impact factors are quite similar; the difference between the two models is within 0.005. For the steel bottom plate box girder, the mid-span dynamic deflection increases by 21.7%, 30.3%, and 33.4% compared to the concrete bottom plate box girder. Meanwhile, the impact factors increase by 274.2%, 196.8%, and 116.8%, respectively. Therefore, after replacing the concrete bottom plate in the corrugated steel web box beam with a steel bottom plate, the static load-bearing capacity remains unchanged. However, the vibration problem of the box beam is significantly exacerbated.
  • A comparison of impact factors calculated based on various national standards reveals that most of the standard calculated impact factors exceed the average impact factors obtained in this study. They are also closer to the maximum impact factor calculated under grade A pavement conditions. Therefore, standard methods for calculating impact factors are more applicable to new bridges and well-maintained bridges. For older bridges with poorer maintenance conditions, simulation calculations based on vehicle–bridge coupling are recommended.
  • This research has not yet conducted vehicle–bridge coupling analysis under multiple vehicles, vehicle–bridge coupling analysis of continuous multi-span bridges, and wheel–bridge separation assumption analysis. Additionally, the method used in this paper has been validated through numerical simulation experiments, and bridge testing validation is also part of our future plans to enhance the applicability of the method.

Author Contributions

Conceptualization, J.D.; Methodology, L.C., H.X., J.D. and X.C.; Validation, H.M., F.Q. and J.W.; Formal analysis, H.X., F.Q. and J.W.; Investigation, H.M., H.X., X.C. and J.W.; Resources, L.C.; Writing—original draft, L.C., H.M., H.X. and X.C.; Visualization, H.M. and X.C.; Supervision, L.C., F.Q., J.D. and J.W.; Project administration, F.Q.; Funding acquisition, L.C. and J.D. All authors have read and agreed to the published version of the manuscript.

Funding

The authors gratefully acknowledge the financial support provided by the Shandong Provincial Transportation Science and Technology Project (2018B48).

Institutional Review Board Statement

Not applicable.

Informed Consent Statement

Not applicable.

Data Availability Statement

Data are contained within the article.

Conflicts of Interest

Authors Luchuan Chen and Haixia Ma were employed by Shandong Hi-speed Group Co., Ltd., Jinan 250098, China. The remaining authors declare that the research was conducted in the absence of any commercial or financial relationships that could be construed as a potential conflict of interest. There are no conflicts of interest to declare.

References

  1. Chen, B.; Huang, Q. A summary of application of prestressed concrete box-girder bridges with corrugated steel webs. Highway 2005, 7, 45–53. (In Chinese) [Google Scholar]
  2. Di, J.; Zhou, X.; Zhang, Z. Research on the mechanical performance of prestressed concrete corrugated steel web composite box girders. J. China Foreign Highw. 2007, 3, 79–83. (In Chinese) [Google Scholar]
  3. He, J.; Wang, S.; Liu, Y.; Dai, L.; Lyu, Z.; Li, C.; Xin, H.; Tan, C. The development of composite bridges with corrugated steel webs in China. Bridge Eng. 2019, 174, 1–44. [Google Scholar]
  4. Elgaaly, M.; Seshadri, A.; Hamilton Robert, W. Bending strength of steel beams with corrugated webs. J. Struct. Eng. 1997, 123, 772–782. [Google Scholar]
  5. Elgaaly, M.; Hamilton Robert, W.; Seshadri, A. Shear strength of beams with corrugated webs. J. Struct. Eng. 1996, 122, 390–398. [Google Scholar]
  6. Zhou, X.; Kong, X.; Hou, J.; Cheng, D.; Jin, D. Shear Mechanical Property of Composite Box Girder with Corrugated Steel Webs. China J. Highw. Transp. 2007, 2, 77–82. (In Chinese) [Google Scholar]
  7. Di, J.; Zhou, X.; You, J.; Kong, X. Torsional property of prestressed concrete composite beam with corrugated steel webs. J. Change Univ. (Nat. Sci. Ed.) 2009, 29, 58–63+76. (In Chinese) [Google Scholar]
  8. Ding, Y.; Jiang, K.B.; Shao, F.; Deng, A.Z. Experimental study on ultimate torsional strength of PC composite box-girder with corrugated steel webs under pure torsion. Struct. Eng. Mech. 2013, 46, 519–531. [Google Scholar] [CrossRef]
  9. Hassanein, M.F.; Kharoob, O.F. Shear buckling behavior of tapered bridge girders with steel corrugated webs. Eng. Struct. 2014, 74, 157–169. [Google Scholar]
  10. Wu, W.; Wan, S.; Ye, J.; Fang, T. Spatial Finite Element Analysis on Shear Lag Effect in Composite box Girder With Corrugated Steel Web. China Civ. Eng. J. 2004, 9, 31–36. (In Chinese) [Google Scholar]
  11. Wang, Y.; Zhou, Y.; Zhao, Y.; Zhao, Y.; Xue, Y.; Feng, W. Comparison of Dynamic Amplification Factor of Deflection and Bending Moment of Highway Continuous Box-Girder Bridges by Mode Superposition. Materials 2024, 17, 1041. [Google Scholar] [CrossRef] [PubMed]
  12. Chen, X. The Vehicle-Bridge Interaction Analysis of Corrugated Steel Web Box Girder Based on Contact-Constraint Method. Master’s Thesis, Chongqing University, Chongqing, China, 2019. [Google Scholar]
  13. He, G.J.; Xie, L. The Research of Dynamic Characteristic for Box-girder Bridge with Corrugated Webs. Adv. Mater. Res. 2013, 639, 554–564. [Google Scholar] [CrossRef]
  14. Zhang, Y.; Huang, P.; Di, J.; Zhou, X. Free vibration characteristics and experiment study of composite box girder with corrugated steel webs. J. Traffic Transp. Eng. 2008, 5, 76–80. (In Chinese) [Google Scholar]
  15. Liu, B.; Chen, H.; Ren, H. Improvement Study of the Dynamic Characteristics for Concrete Box-Girder with Corrugated Steel Webs. China Railw. Sci. 2008, 3, 29–33. (In Chinese) [Google Scholar]
  16. Li, P.; Liu, B.; Xiao, Y. Influence of Different Pier Types on Dynamic Performance of Continuous Rigid-Frame Bridges with Corrugated Steel Webs. Bridge Constr. 2011, 2, 27–29. (In Chinese) [Google Scholar]
  17. Yan, W. Vehicle-Bridge Coupling Vibration of Continuous Box Girder Bridge with Corrugated Steel Webs. Master’s Thesis, Beijing Jiaotong University, Beijing, China, 2012. [Google Scholar]
  18. Li, P.F.; Liu, B.D.; Xiao, Y.N. Influence of Variation of Damping Ratio on Vehicle-bridge Coupling Vibration Responses of Bridge with Corrugated Steel Webs. In Civil Engineering in China—Current Practice and Research Report; Aussino Academic Publishing House: Sydney, Australia, 2010; pp. 139–144. [Google Scholar]
  19. Ji, W.; Deng, L.; He, W.; Liu, S.; Lin, P. Local and global impact factors analysis for PC box girder bridges with corrugated steel webs. J. Vib. Shock. 2017, 36, 22–28. (In Chinese) [Google Scholar]
  20. Han, W.; Ma, L.; Yuan, S.; Zhao, S. Analysis of the effect of inconsistent stimulus of surface roughness on vehicle-bridge coupling vibrations. China Civ. Eng. J. 2011, 44, 81–90. (In Chinese) [Google Scholar]
  21. Xu, Z.-D.; Ge, T.; Miao, A. Experimental and theoretical study on a novel multi-dimensional vibration isolation and mitigation device for large-scale pipeline structure. Mech. Syst. Signal Process. 2019, 129, 546–567. [Google Scholar]
  22. Xu, Z.-D.; Wu, Z. Energy damage detection strategy based on acceleration responses for long-span bridge structures. Eng. Struct. 2007, 29, 609–617. [Google Scholar]
  23. Erduran, E.; Nordli, C.; Gonen, S. Effect of Elastomeric Bearing Stiffness on the Dynamic Response of Railway Bridges Considering Vehicle–Bridge Interaction. Appl. Sci. 2022, 12, 11952. [Google Scholar] [CrossRef]
  24. Li, X.; Zhang, L.; Jie, Z. State-of-the-Art Review and Trend of Studies on Coupling Vibration for Vehicle and Highway Bridge System. Eng. Mech. 2008, 3, 230–240. (In Chinese) [Google Scholar]
  25. Liu, Y.; Wang, L.; Jiang, C.; Shu, H. Research on Mechanical Performance of In-Service Continuous Rigid-Frame Bridge Based on Vehicle-Bridge Coupling Vibration. Appl. Sci. 2024, 14, 6950. [Google Scholar] [CrossRef]
  26. Liu, S. Research on Vehicle-Bridge Coupled Vibration of Double-Deck Highway Steel Truss Bridge. Ph.D. Thesis, Chang’an University, Xi’an, China, 2015. [Google Scholar]
  27. Wang, X. Structural Dynamic Analysis and Application with ANSYS; China Communications Press: Beijing, China, 2014. [Google Scholar]
  28. Zhao, Y.C. Analysis and Research on Coupled Vibration of Highway Vehicle Bridge Considering the Influence of Deck Irregularity. Master’s Thesis, Central South University, Changsha, China, 2011. [Google Scholar]
  29. Qiao, P.; Ma, C.; Duan, C.-J.; Lei, H.; Zhao, H.; He, J. Vehicle–Bridge Interaction Dynamic Analysis of Continuous Rigid Frame Composite Box Girder Bridge with Corrugated Steel Webs under Seismic Excitation. Adv. Civ. Eng. 2024, 2024, 3870669. [Google Scholar]
  30. Deng, L.; Yu, Y.; Zou, Q.L.; Cai, C.S. State-of-the-Art Review of Dynamic Impact Factors of Highway Bridges. J. Bridge Eng. 2015, 20, 04014080. [Google Scholar]
  31. Yuan, L.L. Vertical Flexural Mechanical Characteristics and Experimental Study of Composite Box Girder with Corrugated Steel Web Considering Shear Deformation. Ph.D. Thesis, Lanzhou Jiaotong University, Lanzhou, China, 2019. [Google Scholar]
  32. Deng, L.; Cai, C.S. Identification of parameters of vehicles moving on bridges. Eng. Struct. 2009, 31, 2474–2485. [Google Scholar]
  33. Michaltsos, G.T.; Konstantakopoulos, T.G. Dynamic response of a bridge with surface deck irregularities. J. Vib. Control 2000, 6, 667–689. [Google Scholar]
  34. Broquet, C.; Bailey, S.F.; Fafard, M.; Bruehwiler, E. Dynamic Behavior of Deck Slabs of Concrete Road Bridges. J. Bridge Eng. 2004, 9, 137–146. [Google Scholar]
  35. Shi, X.; Cai, C.S.; Chen, S. Vehicle induced dynamic behavior of short-span slab bridges considering effect of approach slab condition. J. Bridge Eng. 2008, 13, 83–92. [Google Scholar]
  36. Dodds, C.J.; Robson, J.D. The description of road surface roughness. J. Sound Vib. 1973, 31, 175–183. [Google Scholar]
  37. GB/T 7031-2005 C-P; Mechanical Vibration-Road Surface Profiles-Reporting of Measured Data. National Standardization Administration: Beijing, China, 2005.
  38. Bin, X. Analysis and Application on the Vehicle-Bridge Coupling Vibration for Existing Reinforced Concrete Arch Bridges. Master’s Thesis, Central South University, Changsha, China, 2013. [Google Scholar]
  39. Xu, Z.-D.; Liu, M.; Wu, Z.; Zeng, X. Energy Damage Detection Strategy Based on Strain Responses for Long-Span Bridge Structures. J. Bridge Eng. 2011, 16, 644–652. [Google Scholar]
  40. Xu, Z.-D.; Chen, B.-B. Experimental and Numerical Study on Magnetorheological Fluids Based on Mixing Coated Magnetic Particles. J. Mater. Civ. Eng. 2016, 28, 04015198. [Google Scholar] [CrossRef]
  41. Tao, Y.X.; Xu, Z.D.; Wei, Y.X.; Liu, X.Y.; Dong, Y.R.; Dai, J. Integrating Deep Learning Into an Energy Framework for Rapid Regional Damage Assessment and Fragility Analysis Under Mainshock-Aftershock Sequences. Earthq. Eng. Struct. Dyn. 2025. [Google Scholar] [CrossRef]
  42. Xiao, H.; Huang, Y. Detection of grout sleeve defects based on the time domain dimensionless indicators of component signals. J. Build. Eng. 2023, 65, 105795. [Google Scholar] [CrossRef]
  43. Gohery, S.; Sharifi, S.; Burvill, C.; Mouloodi, S.; Izadifar, M.; Thissen, P. Localized failure analysis of internally pressurized laminated ellipsoidal woven GFRP composite domes: Analytical, numerical, and experimental studies. Arch. Civ. Mech. Eng. 2019, 19, 1235–1250. [Google Scholar] [CrossRef]
  44. Shen, H.; Xiao, X. Numerical Method for Vehicle-Bridge Coupled Vibrations. J. Southwest Jiaotong Univ. 2003, 16, 658–662. (In Chinese) [Google Scholar]
  45. Shinichi, M.K.K. Design and Construction of the Shinkai Bridge. Prestressed Concrete Bridge Using Corrugated Steel Webs. Bridges Found. 1994, 28, 13–20. (In Japanese) [Google Scholar]
  46. D60-2015 J; General Specifications for Design of Highway Bridges and Culverts. Ministry of Transport of the People’s Republic of China: Beijing, China, 2015.
  47. JTG/TJ21-01-2015; Load Test Ethods for Highway Bridge. Ministry of Transport of the People’s Republic of China: Beijing, China, 2015.
  48. Mao, Y.-N.; Ma, C.; Liu, S.-Z.; Li, L.-Y. Study on the Dynamic Response of Composite Box Girder Bridges with Corrugated Steel Webs. Adv. Civ. Eng. 2023, 2023, 5104132. [Google Scholar] [CrossRef]
  49. Leyi, W. Calculation Method and Experimental Study on lmpact Coefficient of Simply Supported Bridge Span Structures. Master’s Thesis, Jilin University, Jilin, China, 2009. [Google Scholar]
  50. JRA1996; Specifications for Highway Bridges. Japan Road Association: Tokyo, Japan, 1996.
  51. DIN1072; Straßen- und Wegbrücken Lastannahmen. Deutsches Institut für Normung: Berlin, Germany, 1985.
  52. CEN2003; Eurocode 1: Actions on Structures. Comité Européen de Normalisation: Brussels, Belgium, 2003.
  53. LRFDUS-6; AASHTO LRFD Bridge Design Specifications. American Association of State Highway and Transportation Officials: Washington, DC, USA, 2012.
  54. OHBDC1991; Ontario Highway Bridge Design Code. Ontario Ministry of Transportation: Downsview, Canada, 1991.
Figure 1. Simplified model of the vehicle–bridge coupling system.
Applsci 15 04009 g001
Figure 2. Mechanical model of the vehicle–bridge coupling system.
Applsci 15 04009 g002
Figure 3. Three-dimensional pavement roughness samples.
Applsci 15 04009 g003
Figure 4. The principle of the three-dimensional contact constraint method.
Applsci 15 04009 g004
Figure 5. The flowchart of the contact constraint method in ANSYS.
Applsci 15 04009 g005
Figure 6. Validation case model diagram.
Applsci 15 04009 g006
Figure 7. Deflection response at the center span for various vehicle speeds: (a) 120 km/h; (b) 160 km/h.
Applsci 15 04009 g007
Figure 8. Corrugated steel web box girder. (a) Cross-sectional size (unit: cm); (b) corrugated steel web (unit: mm).
Applsci 15 04009 g008
Figure 9. The corrugated steel web girder bridge model. (a) The bridge model; (b) the first mode shape; (c) the second mode shape; (d) the third mode shape.
Applsci 15 04009 g009
Figure 10. Mid-span vertical displacement at different speeds. (a) 20 km/h; (b) 40 km/h; (c) 60 km/h; (d) 80 km/h; (e) 100 km/h; (f) 120 km/h.
Applsci 15 04009 g010
Figure 11. Filtering effect of mid-span vertical displacement under various speed conditions: (a) 20 km/h; (b) 40 km/h; (c) 60 km/h; (d) 80 km/h; (e) 100 km/h; (f) 120 km/h.
Applsci 15 04009 g011
Figure 12. Impact factor variation with vehicle speed chart. (a) Two-dimensional roughness; (b) three-dimensional roughness.
Applsci 15 04009 g012
Figure 13. Impact factor variation with pavement grade chart. (a) Two-dimensional roughness; (b) three-dimensional roughness.
Applsci 15 04009 g013
Figure 14. Comparison of impact factors between two- and three-dimensional rough pavements. (a) Grade A; (b) grade B; (c) grade C.
Applsci 15 04009 g014
Figure 15. Mid-span vertical displacement of flat steel web and corrugated steel web box girder bridges: (a) 20 km/h; (b) 60 km/h; (c) 120 km/h.
Applsci 15 04009 g015
Figure 16. Mid-span vertical displacement of steel bottom plate and concrete bottom plate box girder: (a) 20 km/h; (b) 60 km/h; (c) 120 km/h.
Applsci 15 04009 g016
Figure 17. Impact factor comparison chart.
Applsci 15 04009 g017
Table 1. Two-axle half-vehicle model and bridge model parameter values.
Model ParameterSymbolUnitParameter Value
Bridge line massMbkg/m5.41 × 103
Bridge bending stiffnessEIN·m23.5 × 1010
Bridge spanLbm32
Vehicle body massMvkg3.85 × 104
vehicle pitch moment of inertiaIαkg·m22.466 × 106
Wheelset massmikg4330
Upper spring-damper system stiffnessKsiN·m−12.535 × 10⁶
Upper spring-damper system dampingCsikg·s−11.96 × 10⁵
Lower spring-damper system stiffnessKtiN·m−14.28 × 10⁶
Lower spring-damper system dampingCtikg·s−19.8 × 10⁴
Distance between front and rear axlesLvm8.4
Table 5. Summary of simulation conditions.
Influence FactorsParameter Values
Vehicle speed20 km/h, 40 km/h, 60 km/h, 80 km/h, 100 km/h, 120 km/h
Pavement roughness dimension2D pavement, 3D pavement
Pavement gradeGrade A, Grade B, Grade C
Table 6. Impact factors under various conditions.
Speed (km/h)3-D Pavement RoughnessPavement Grade
Grade AGrade BGrade C
20No0.0660.0890.141
Yes0.0590.0680.085
40No0.0940.1040.125
Yes0.0930.0980.125
60No0.1540.1760.210
Yes0.1520.1680.196
80No0.2160.2460.296
Yes0.2120.2350.269
100No0.2990.3270.385
Yes0.2960.3040.342
120No0.3100.3130.348
Yes0.3180.3200.326
Table 2. The parameters of the corrugated steel web bridge model.
Model ParameterUnitC50 Concrete PlateQ345 Steel PlatePrestressed Steel Reinforcement
Element type-SHELL181SHELL181LINK8
Elastic modulusMPa34,500206,0001.95 × 1010
Poisson’s ratio-0.20.30.3
Densitykg/m3241078507850
Table 3. Dynamic characteristics of the bridge model.
Order FrequencyMode Characteristics
14.84 HzFirst-order symmetric vertical bending
212.92 HzFirst-order antisymmetric vertical bending
312.94 HzBending-torsion coupling
Table 4. Vehicle model parameters.
Model ParameterSymbolUnitParameter Value
Vehicle body massM1t24.81
Pitching moment of inertiaIzxkg·m2172,160
Rolling moment of inertiaIzykg·m231,496
Suspension and wheel massmit0.73
Upper spring stiffnessKukN/m727.81
Upper damping coefficientCukN·s/m2.19
Lower spring stiffnessKdkN/m1972.9
Lower damping coefficientCdkN·s/m0
Distance from the front axle to the vehicle center of massL1m4.56
Distance from the rear axle to the vehicle center of massL2m1.69
Table 7. Impact factor of each box girder.
Box Girder TypeWorking Conditions
20 km/h60 km/h120 km/h
Corrugated steel web box girder0.0660.1540.310
Flat web box girder0.0610.1580.311
Steel bottom plate box girder0.2470.4570.672
Disclaimer/Publisher’s Note: The statements, opinions and data contained in all publications are solely those of the individual author(s) and contributor(s) and not of MDPI and/or the editor(s). MDPI and/or the editor(s) disclaim responsibility for any injury to people or property resulting from any ideas, methods, instructions or products referred to in the content.

