
Thermo-Mechanical Behavior Simulation and Experimental Validation of Segmented Tire Molds Based on Multi-Physics Coupling
Abstract
1. Introduction
2. Theoretical Foundations
2.1. The Control Equations of the Fluid Domain
2.2. Governing Equations for the Solid Domain
2.3. Fluid–Solid Coupling Boundary Conditions
3. Numerical Simulations
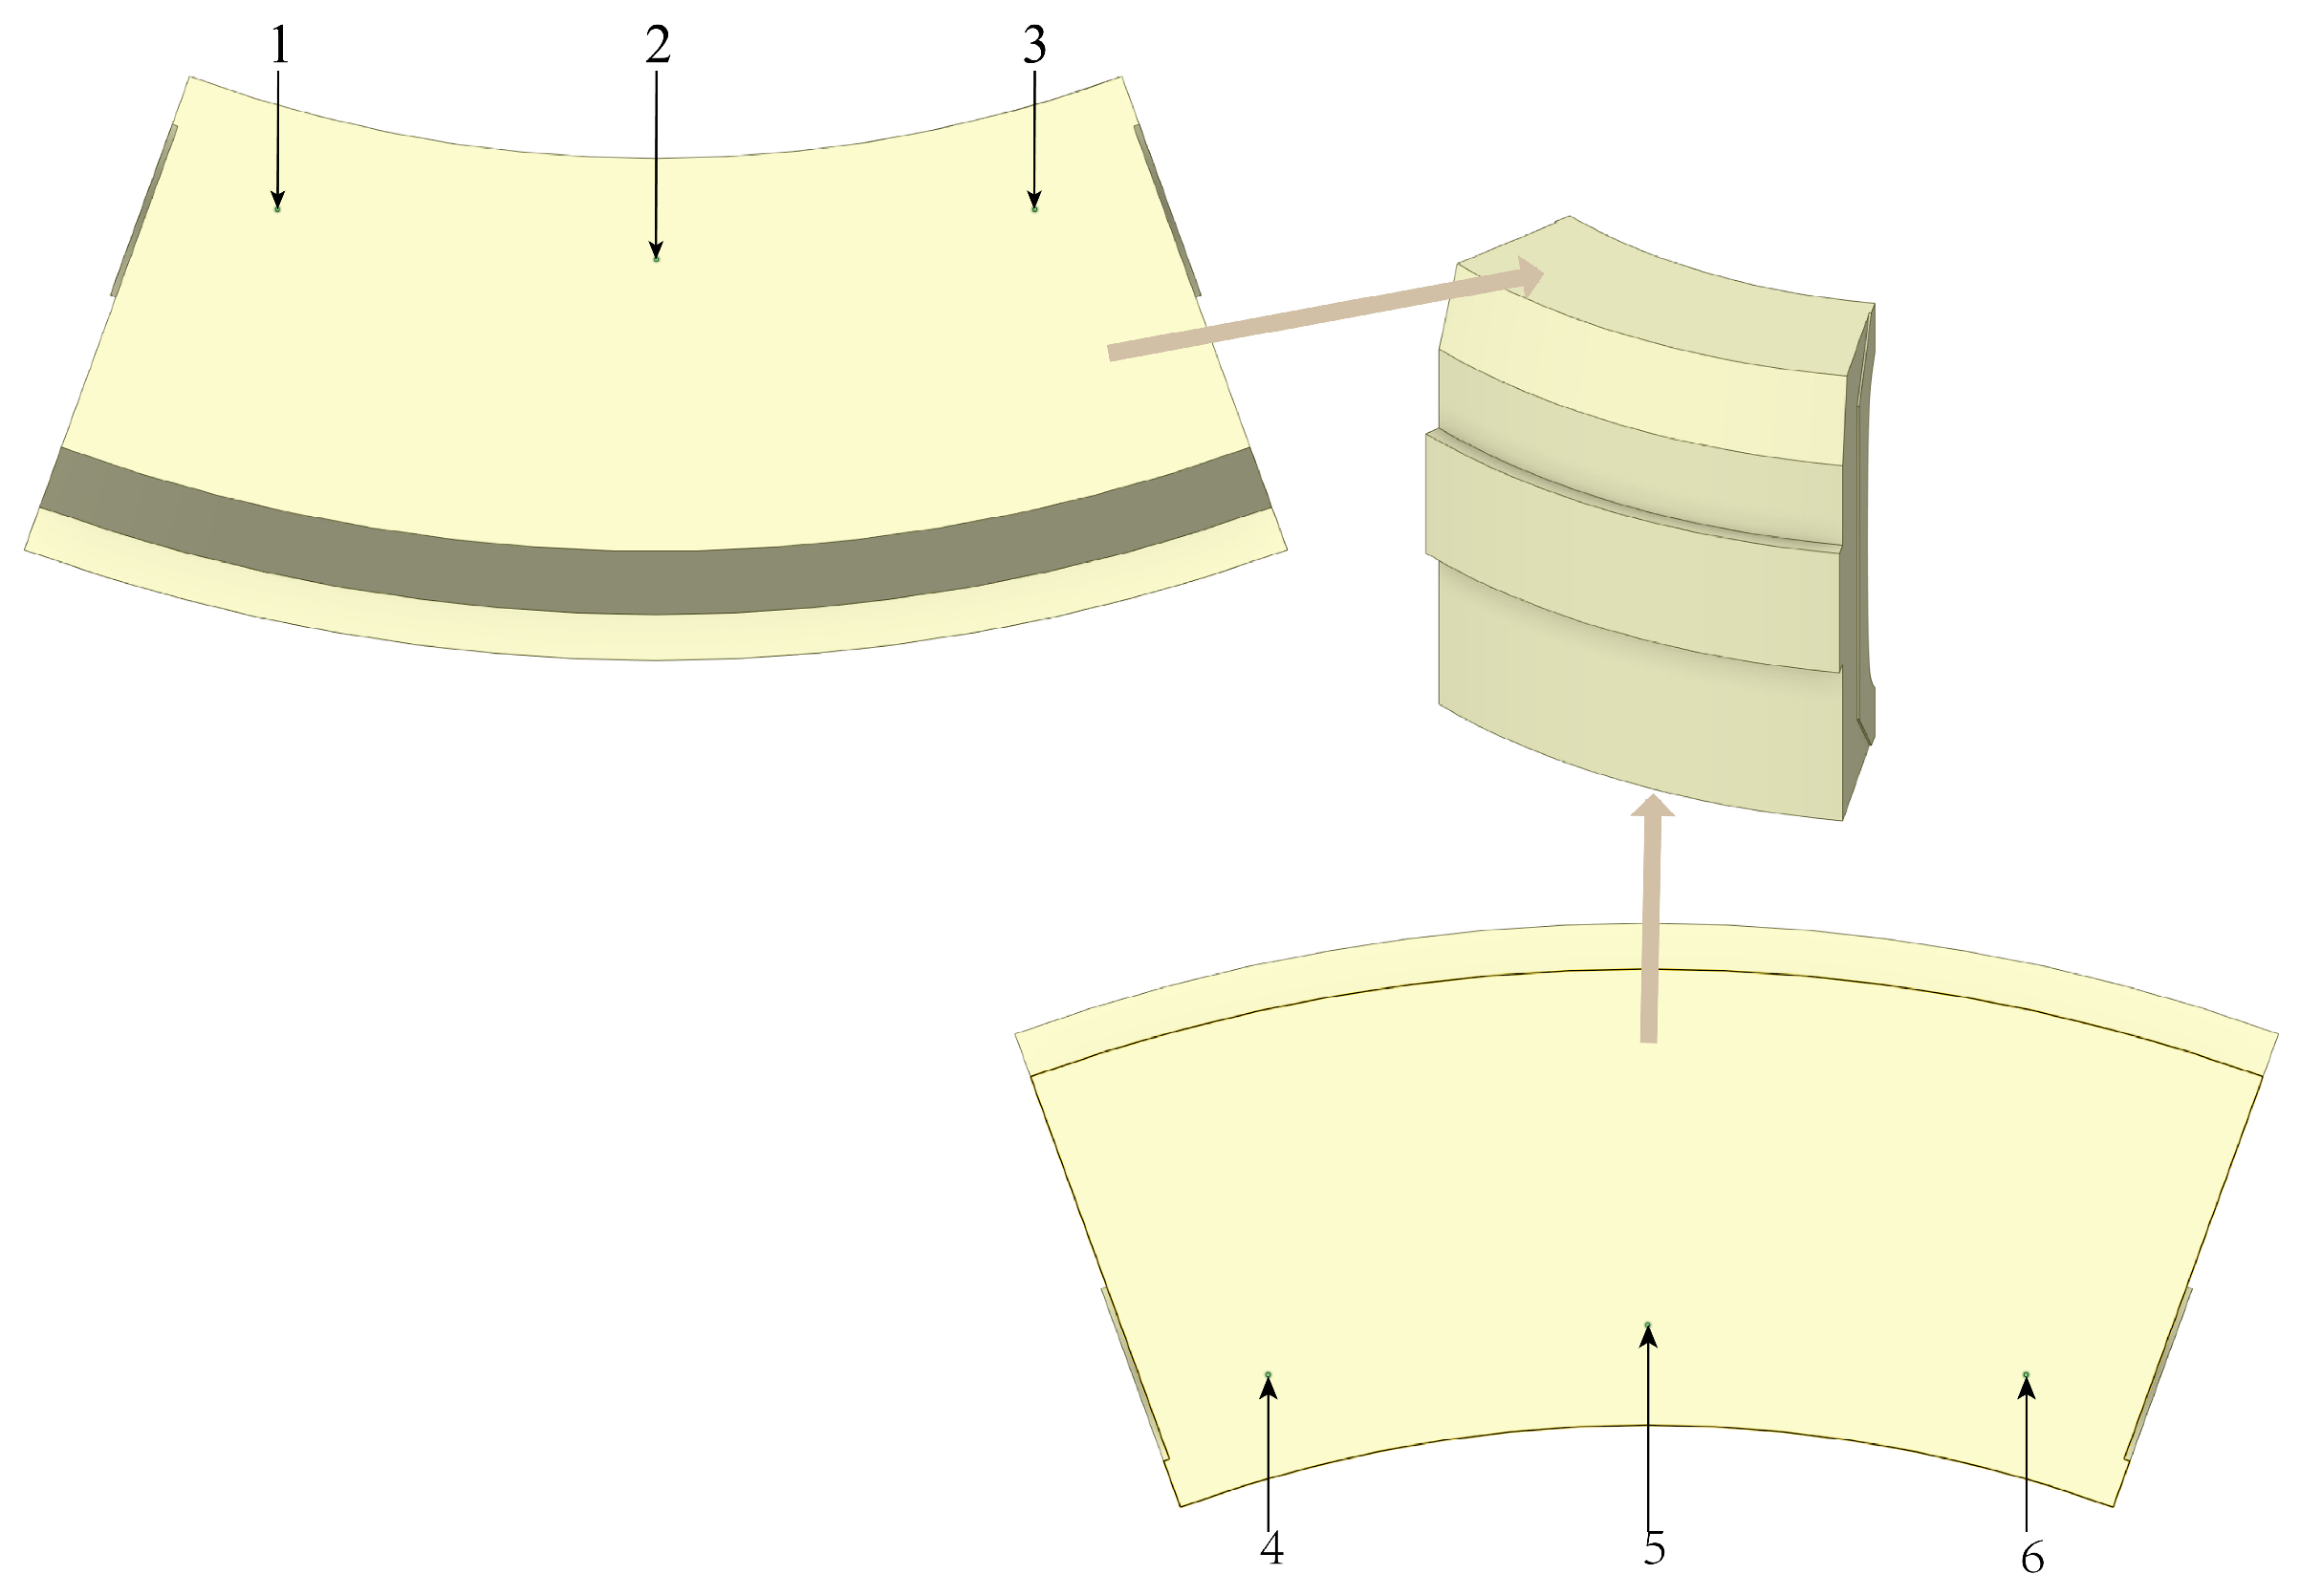
3.1. Establishment of Simulation Model
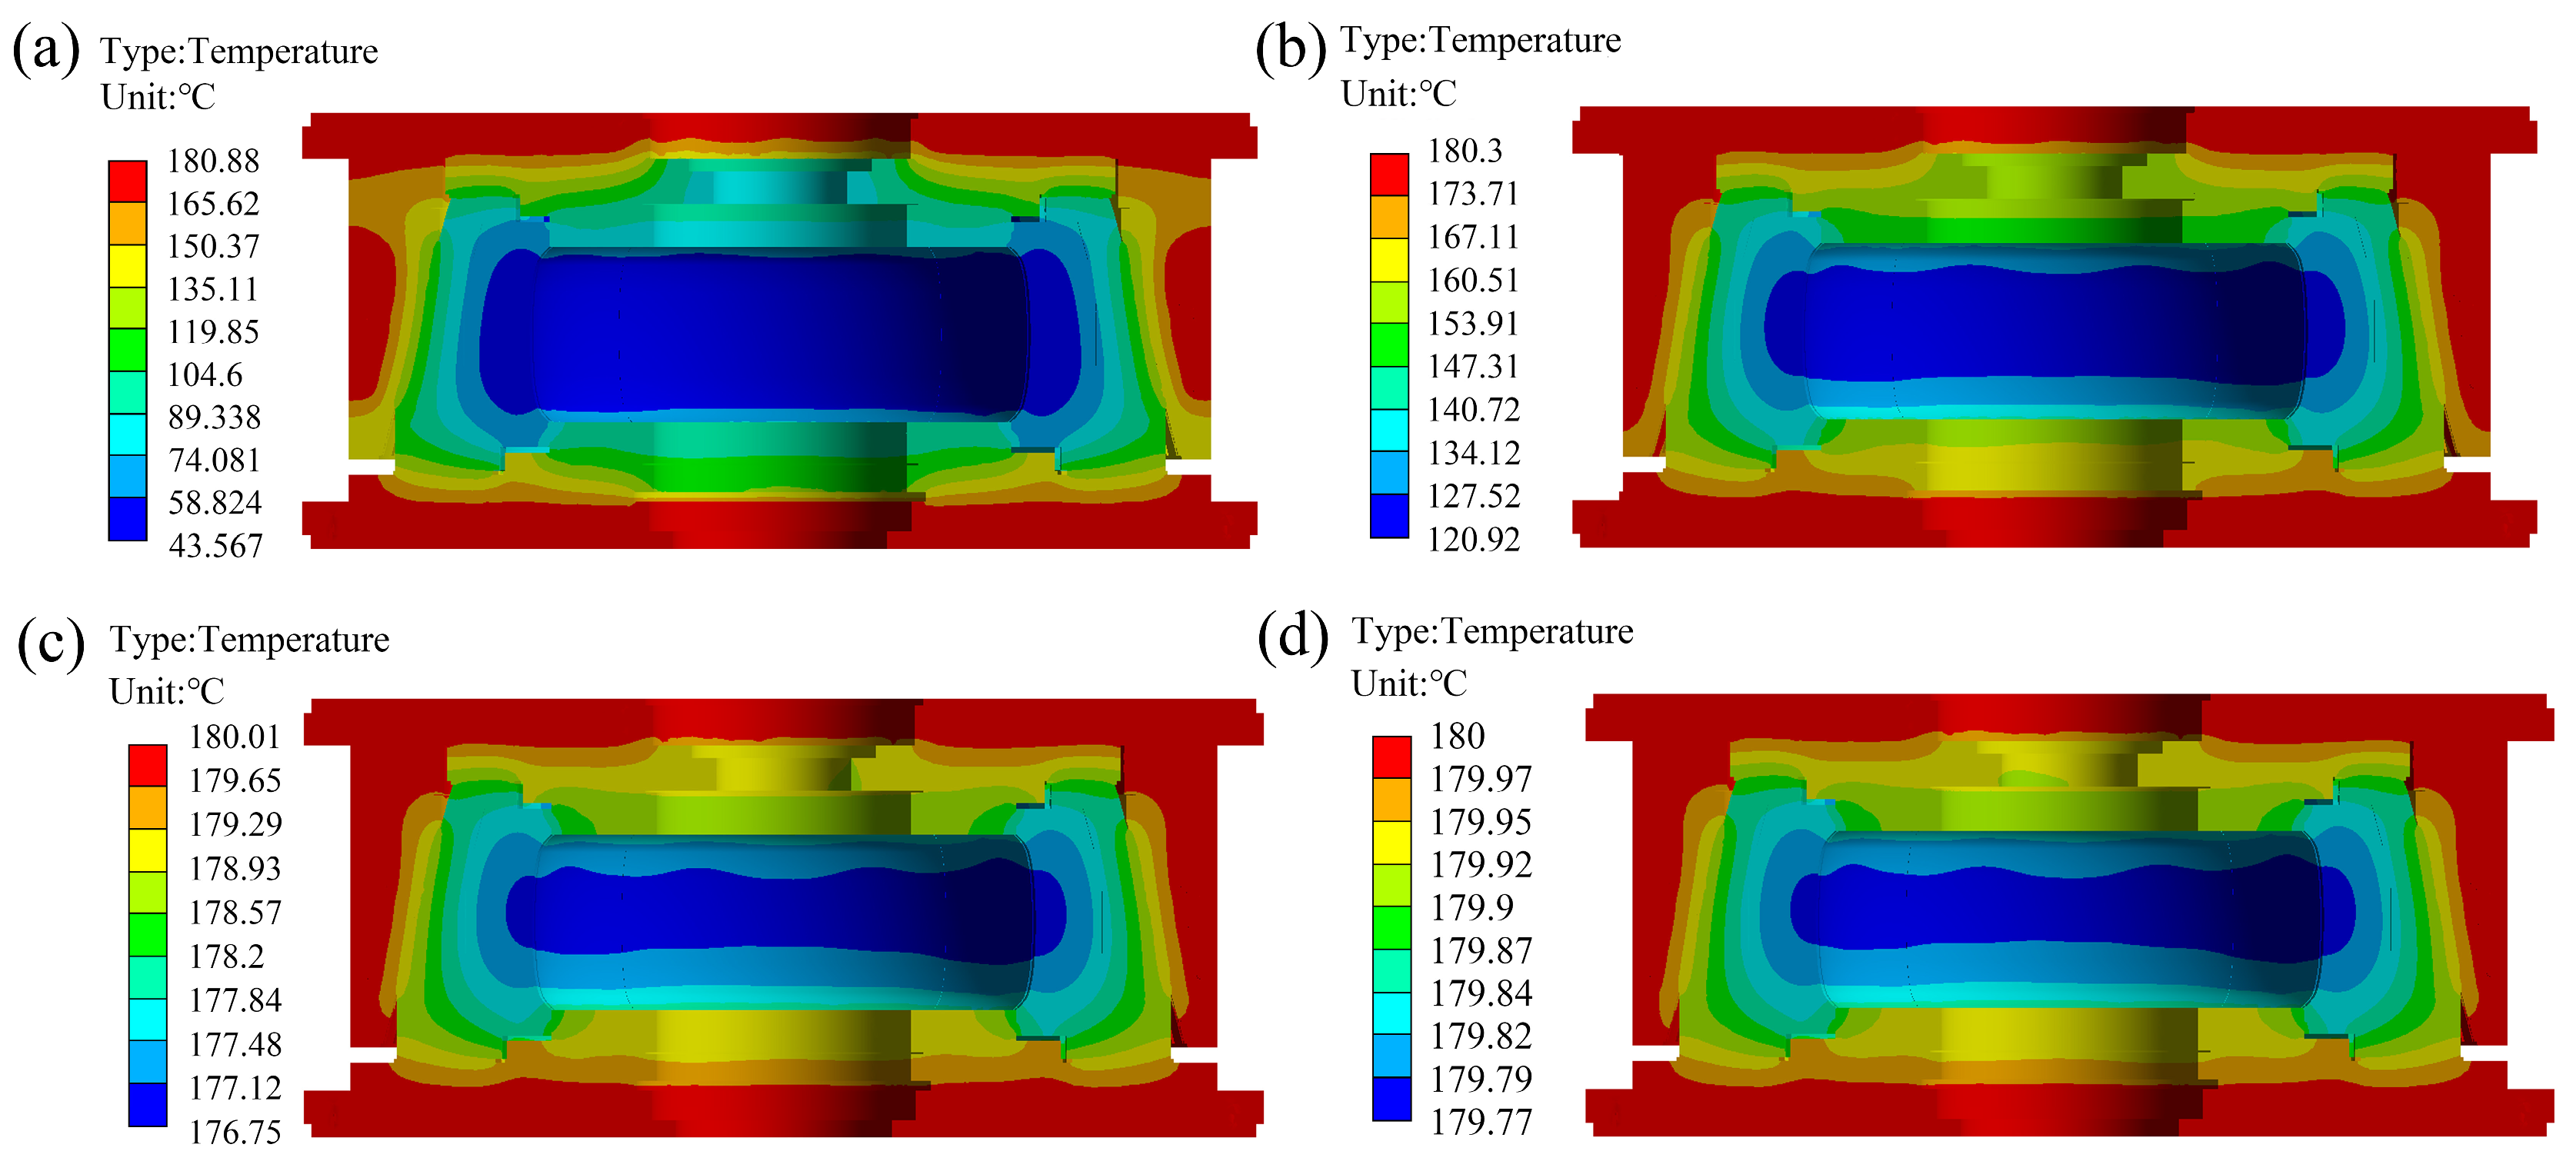
3.2. Multi-Field Coupled Temperature Field Analysis
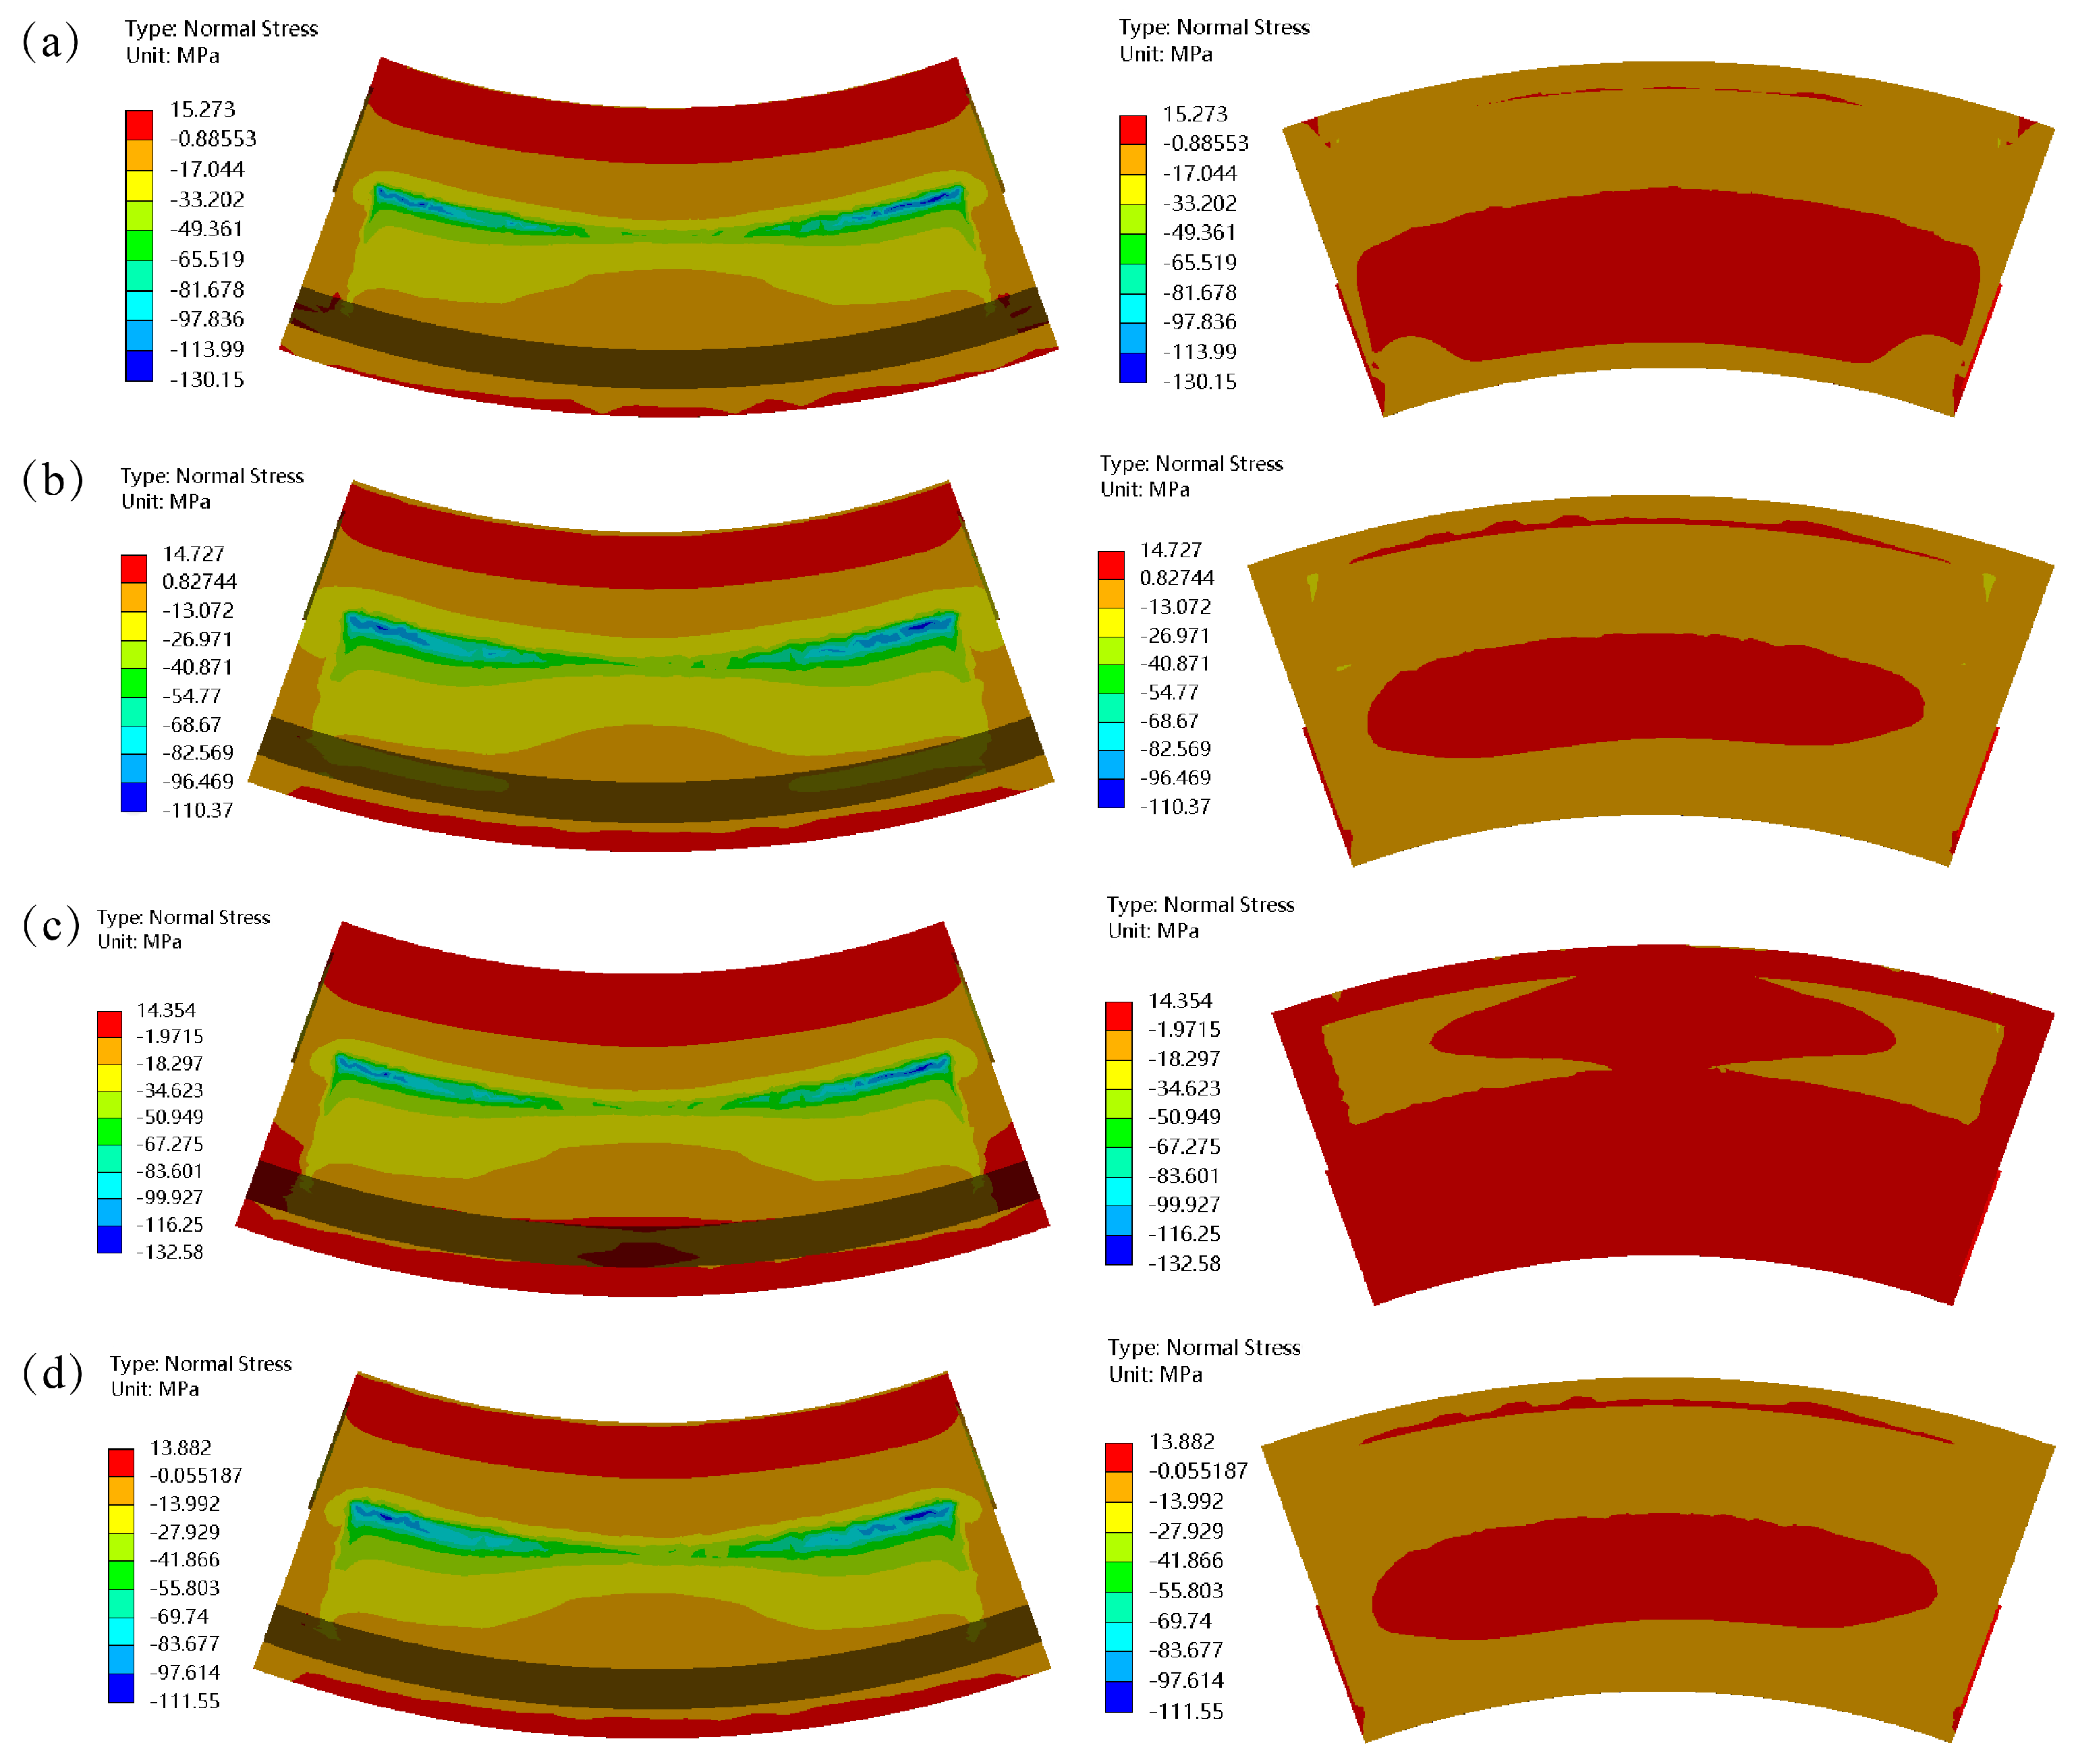
3.3. Stress Analysis Based on Multi-Field Coupling
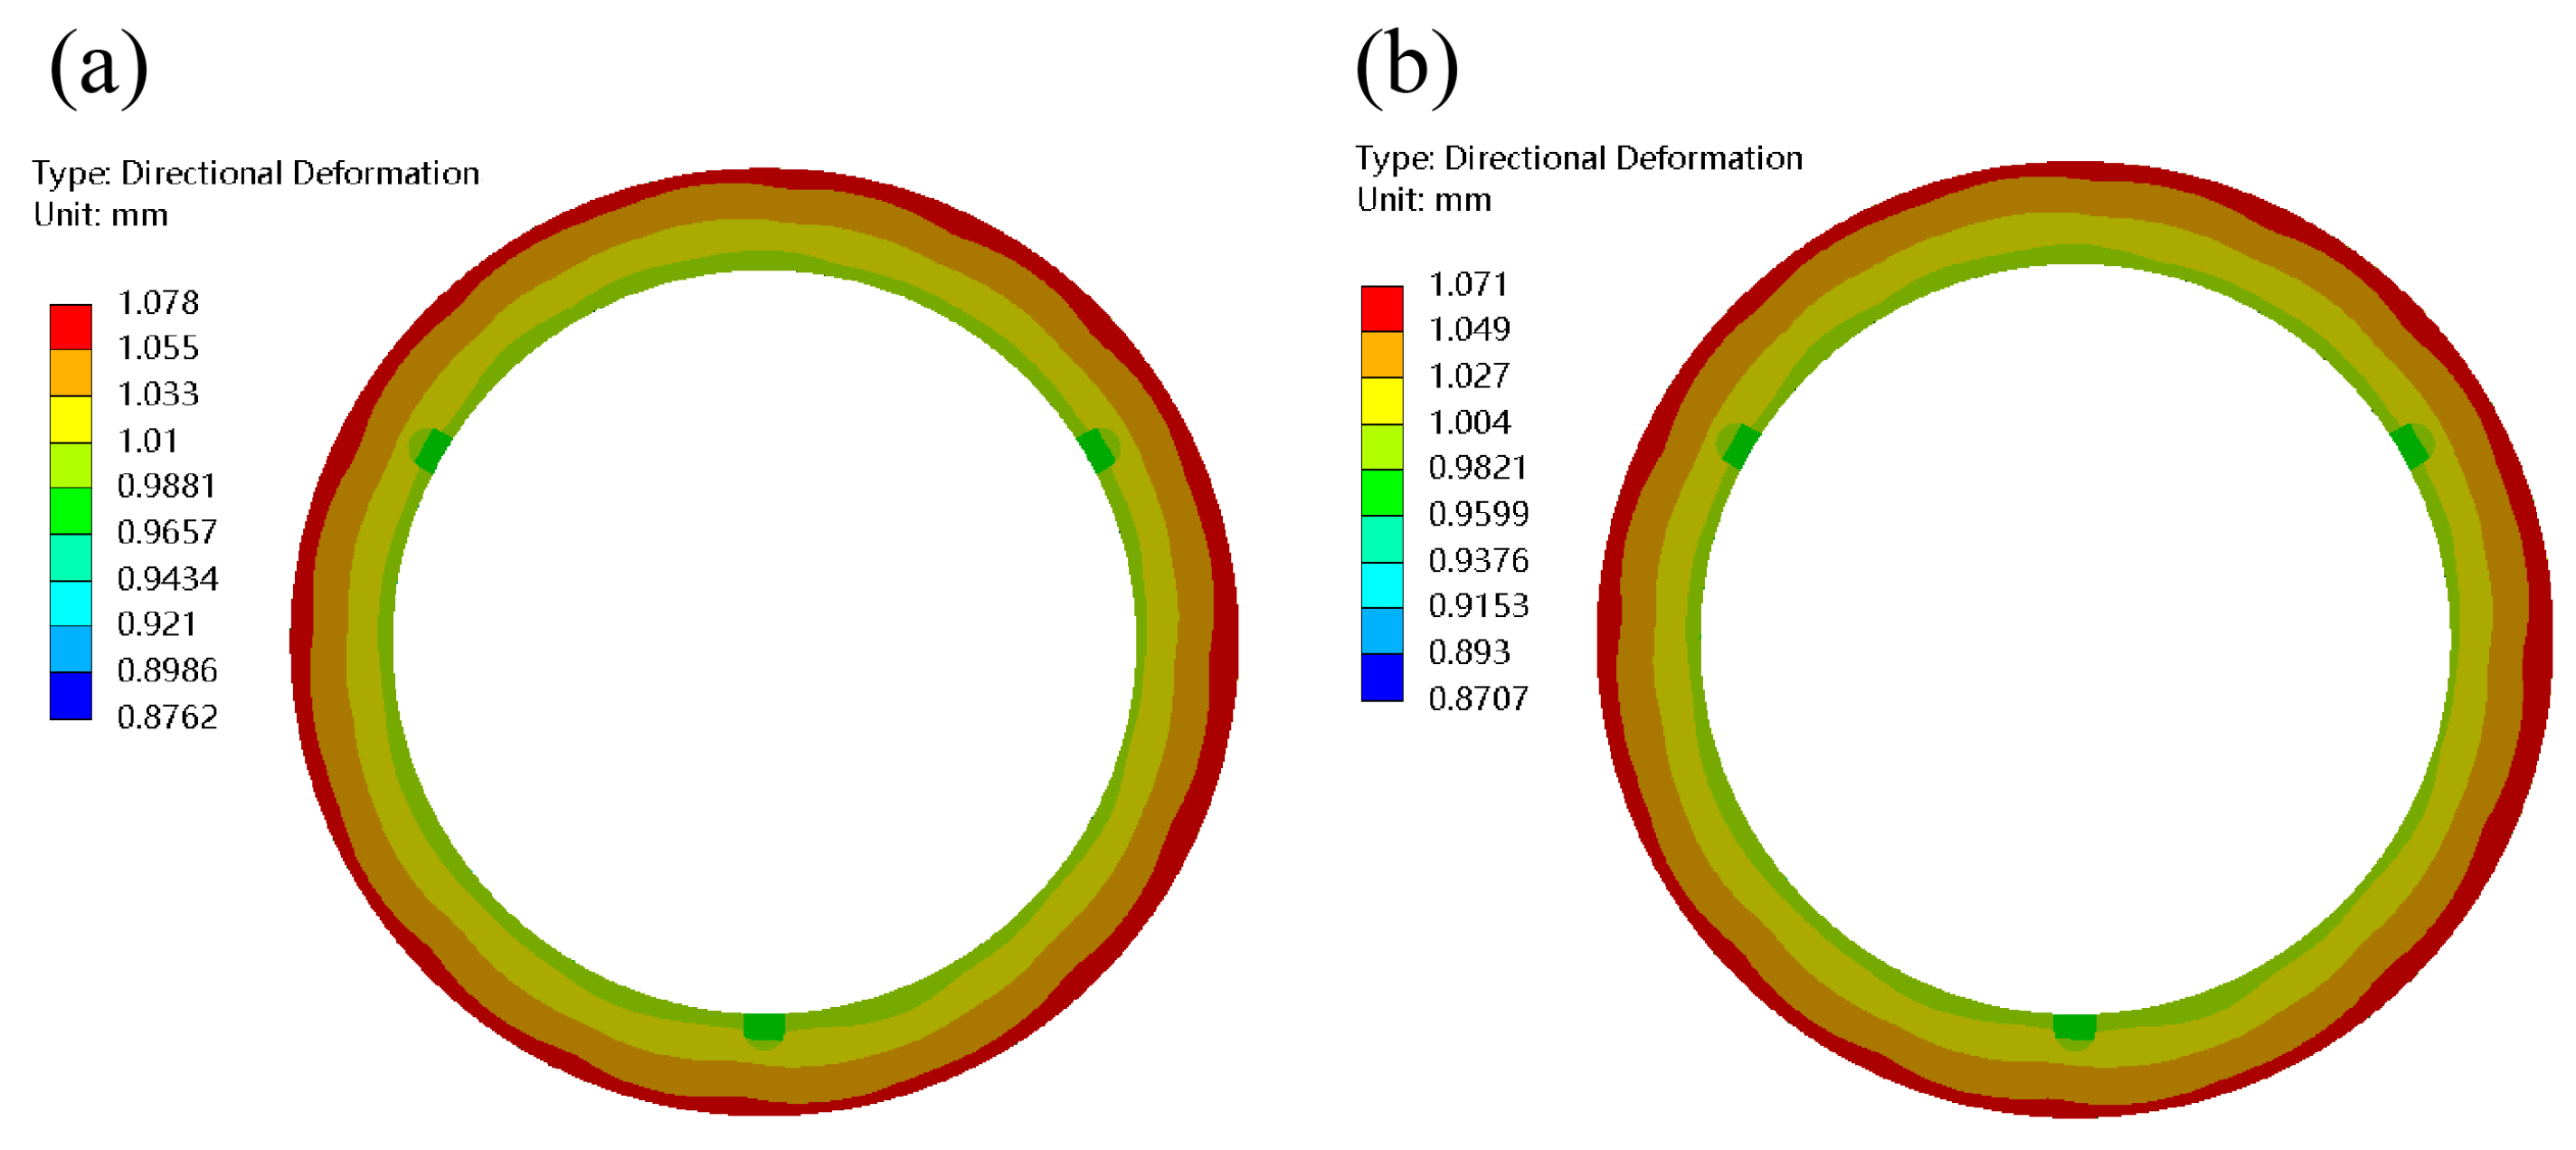
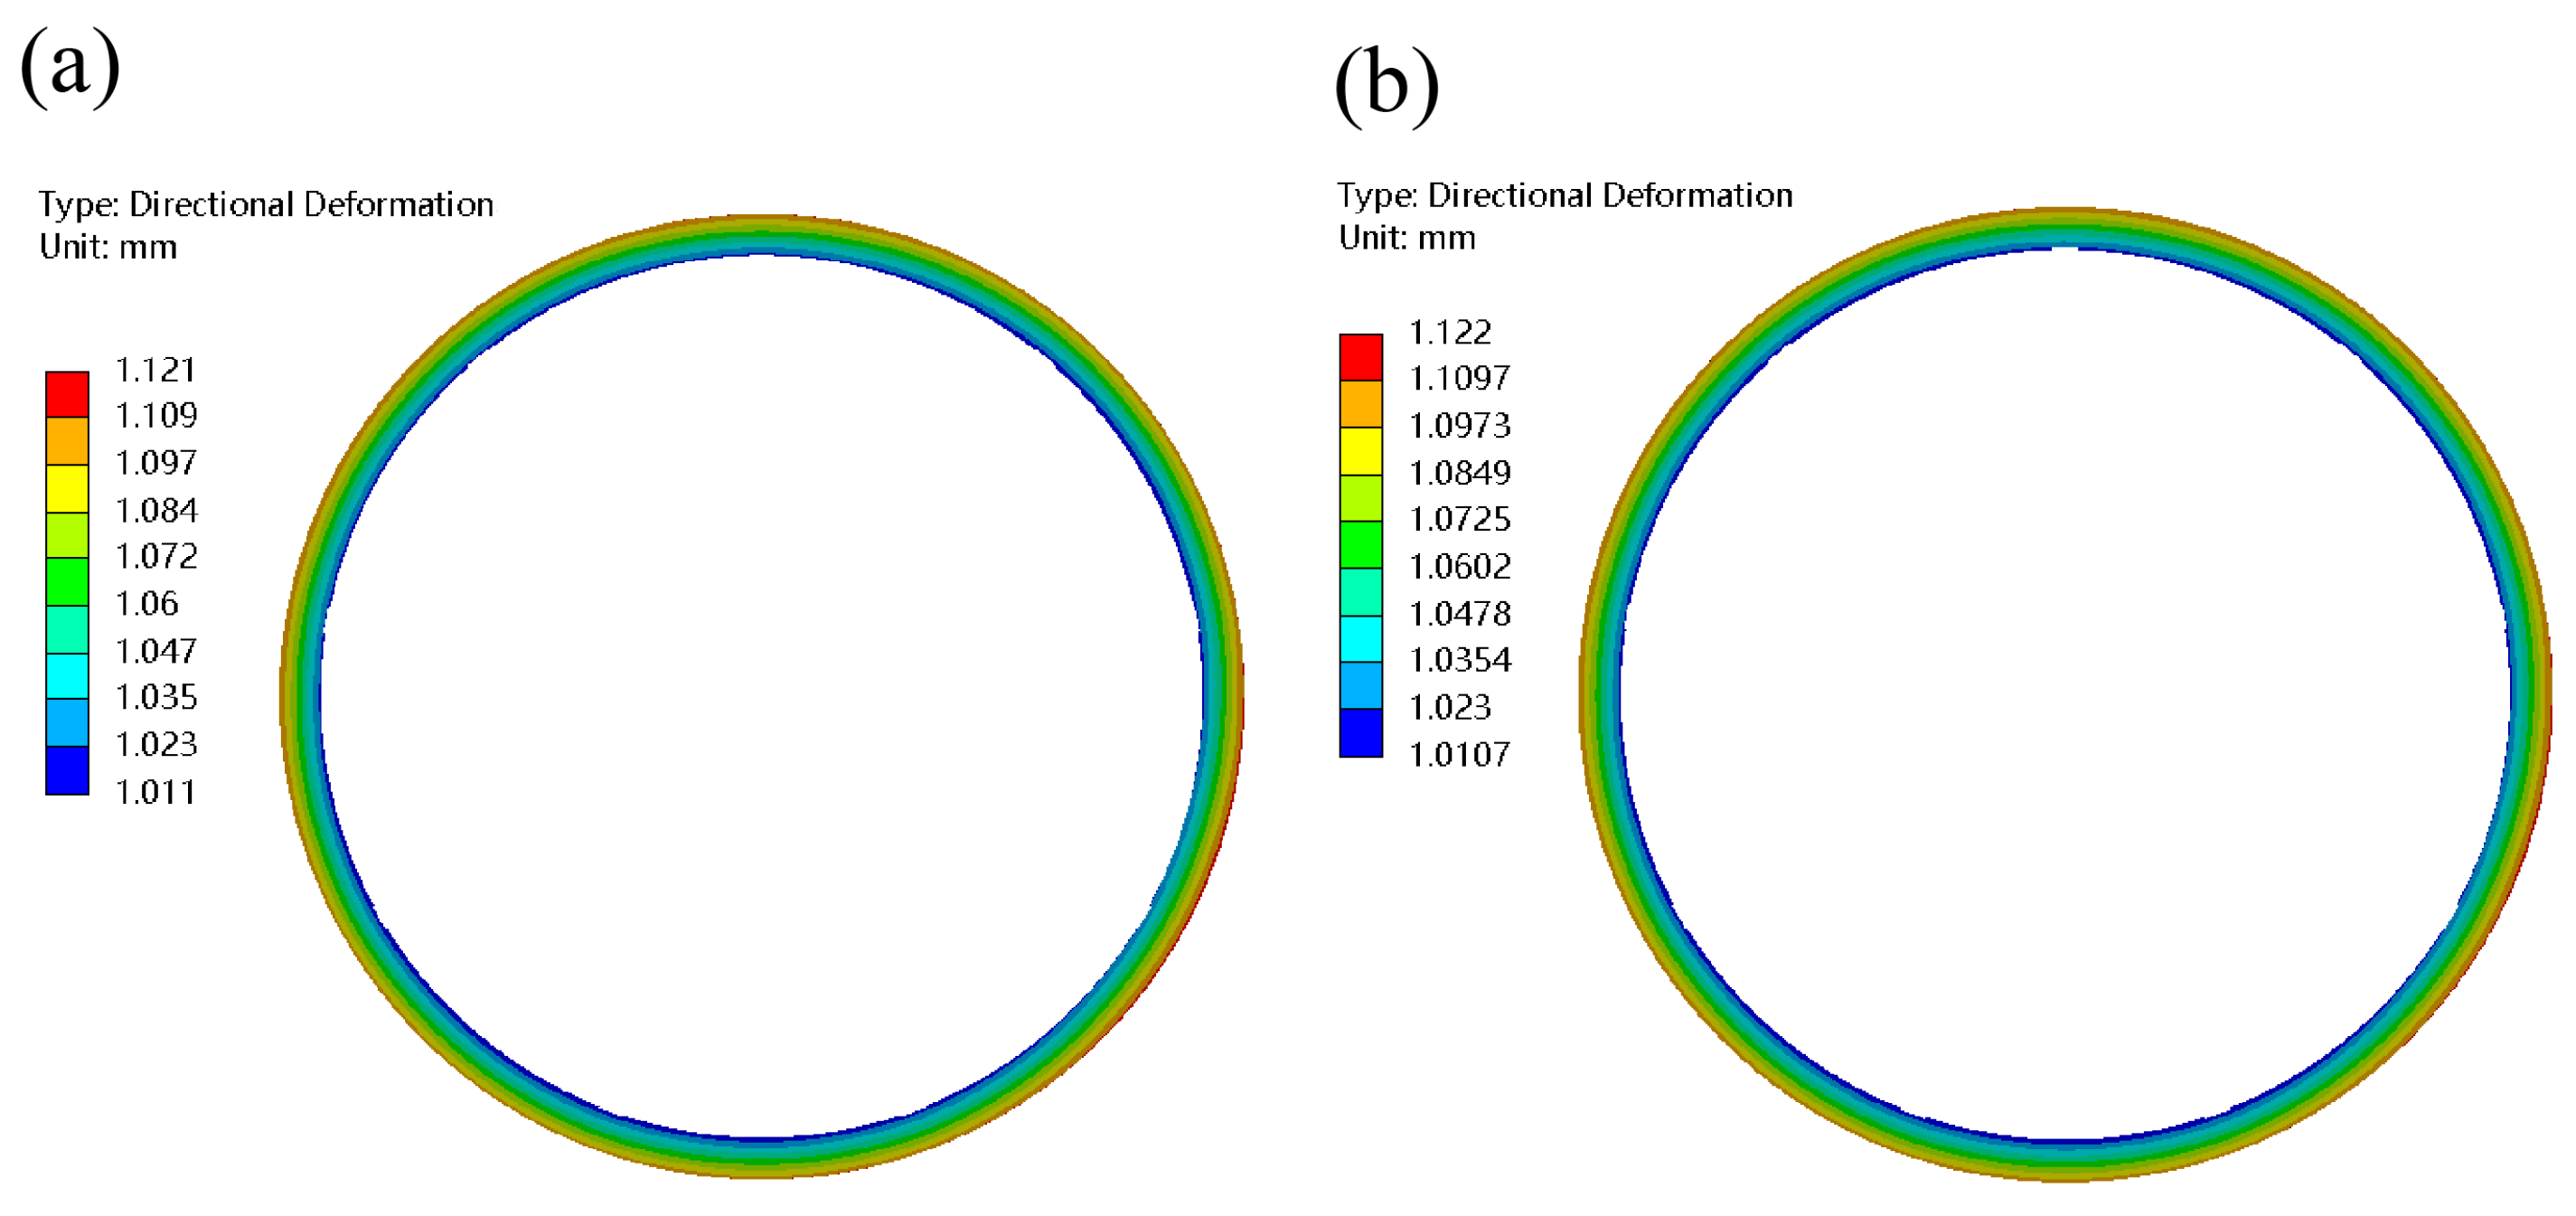
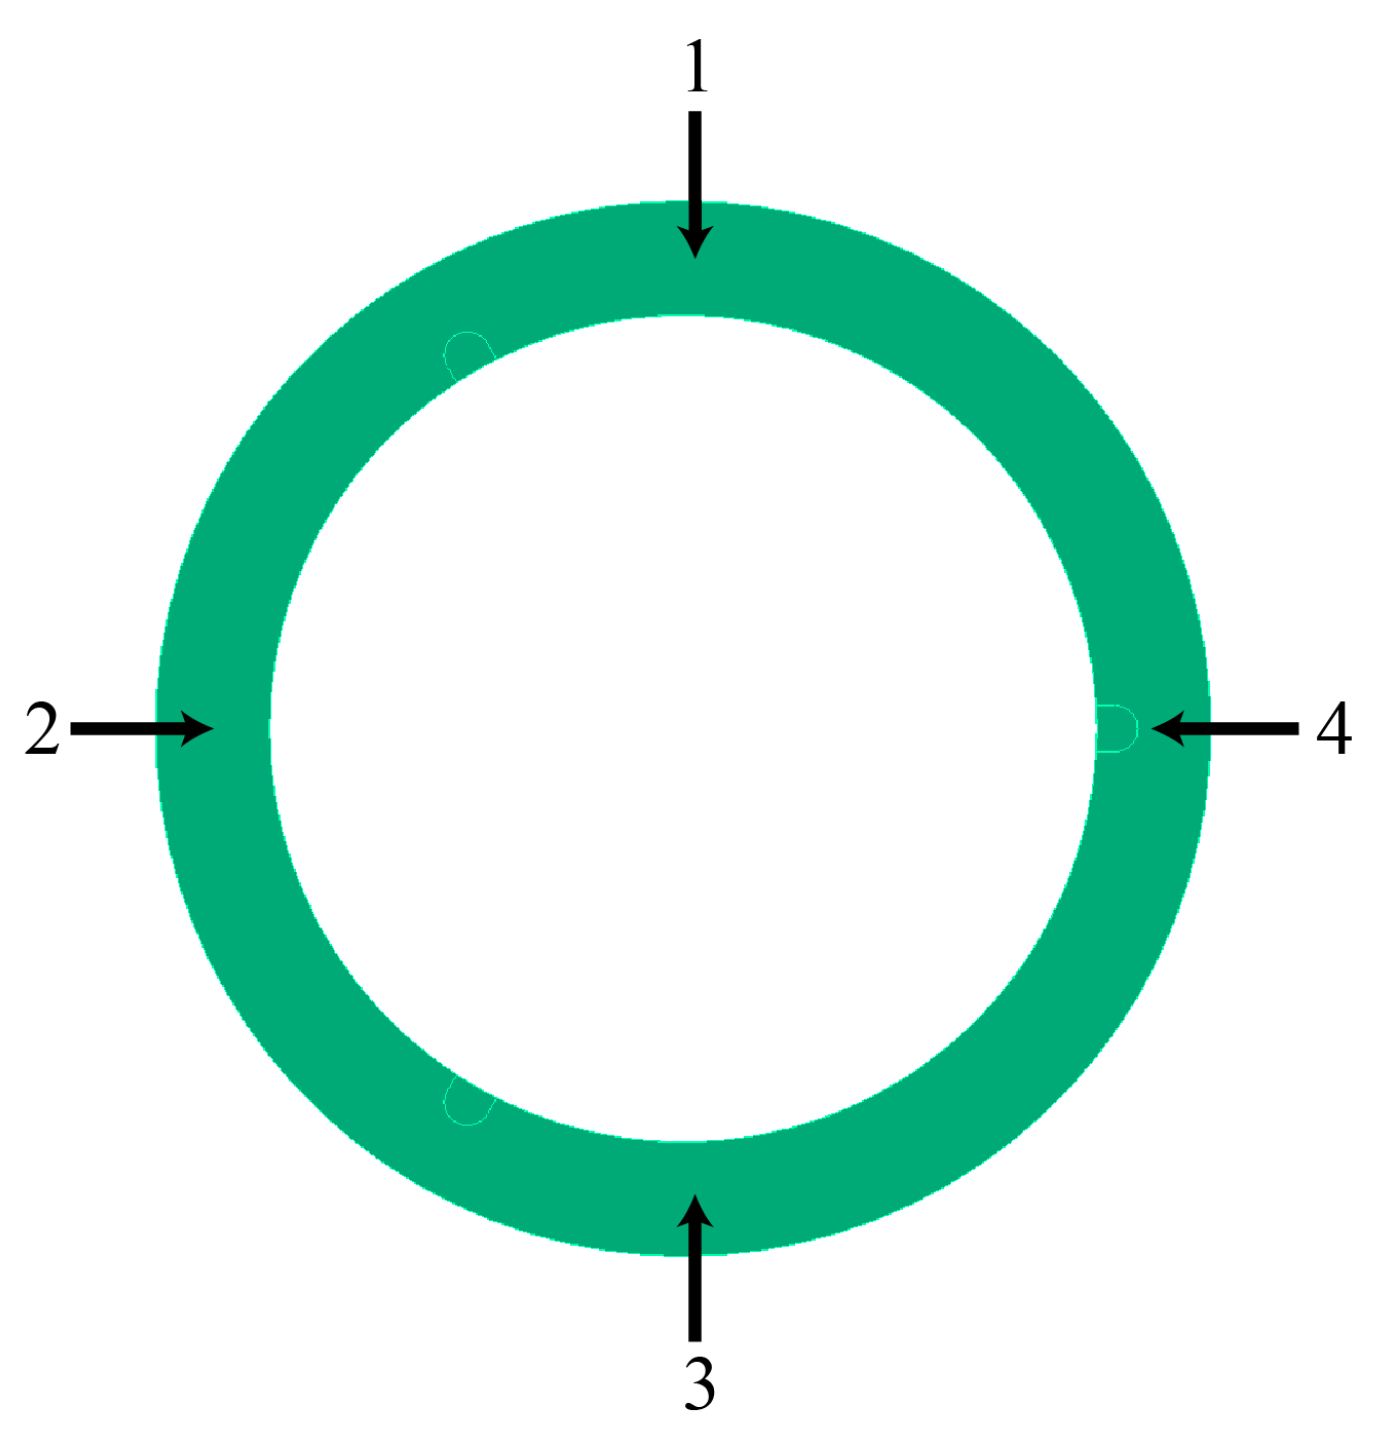
3.4. Deformation Analysis Based on Multi-Field Coupling
4. Experimental Section
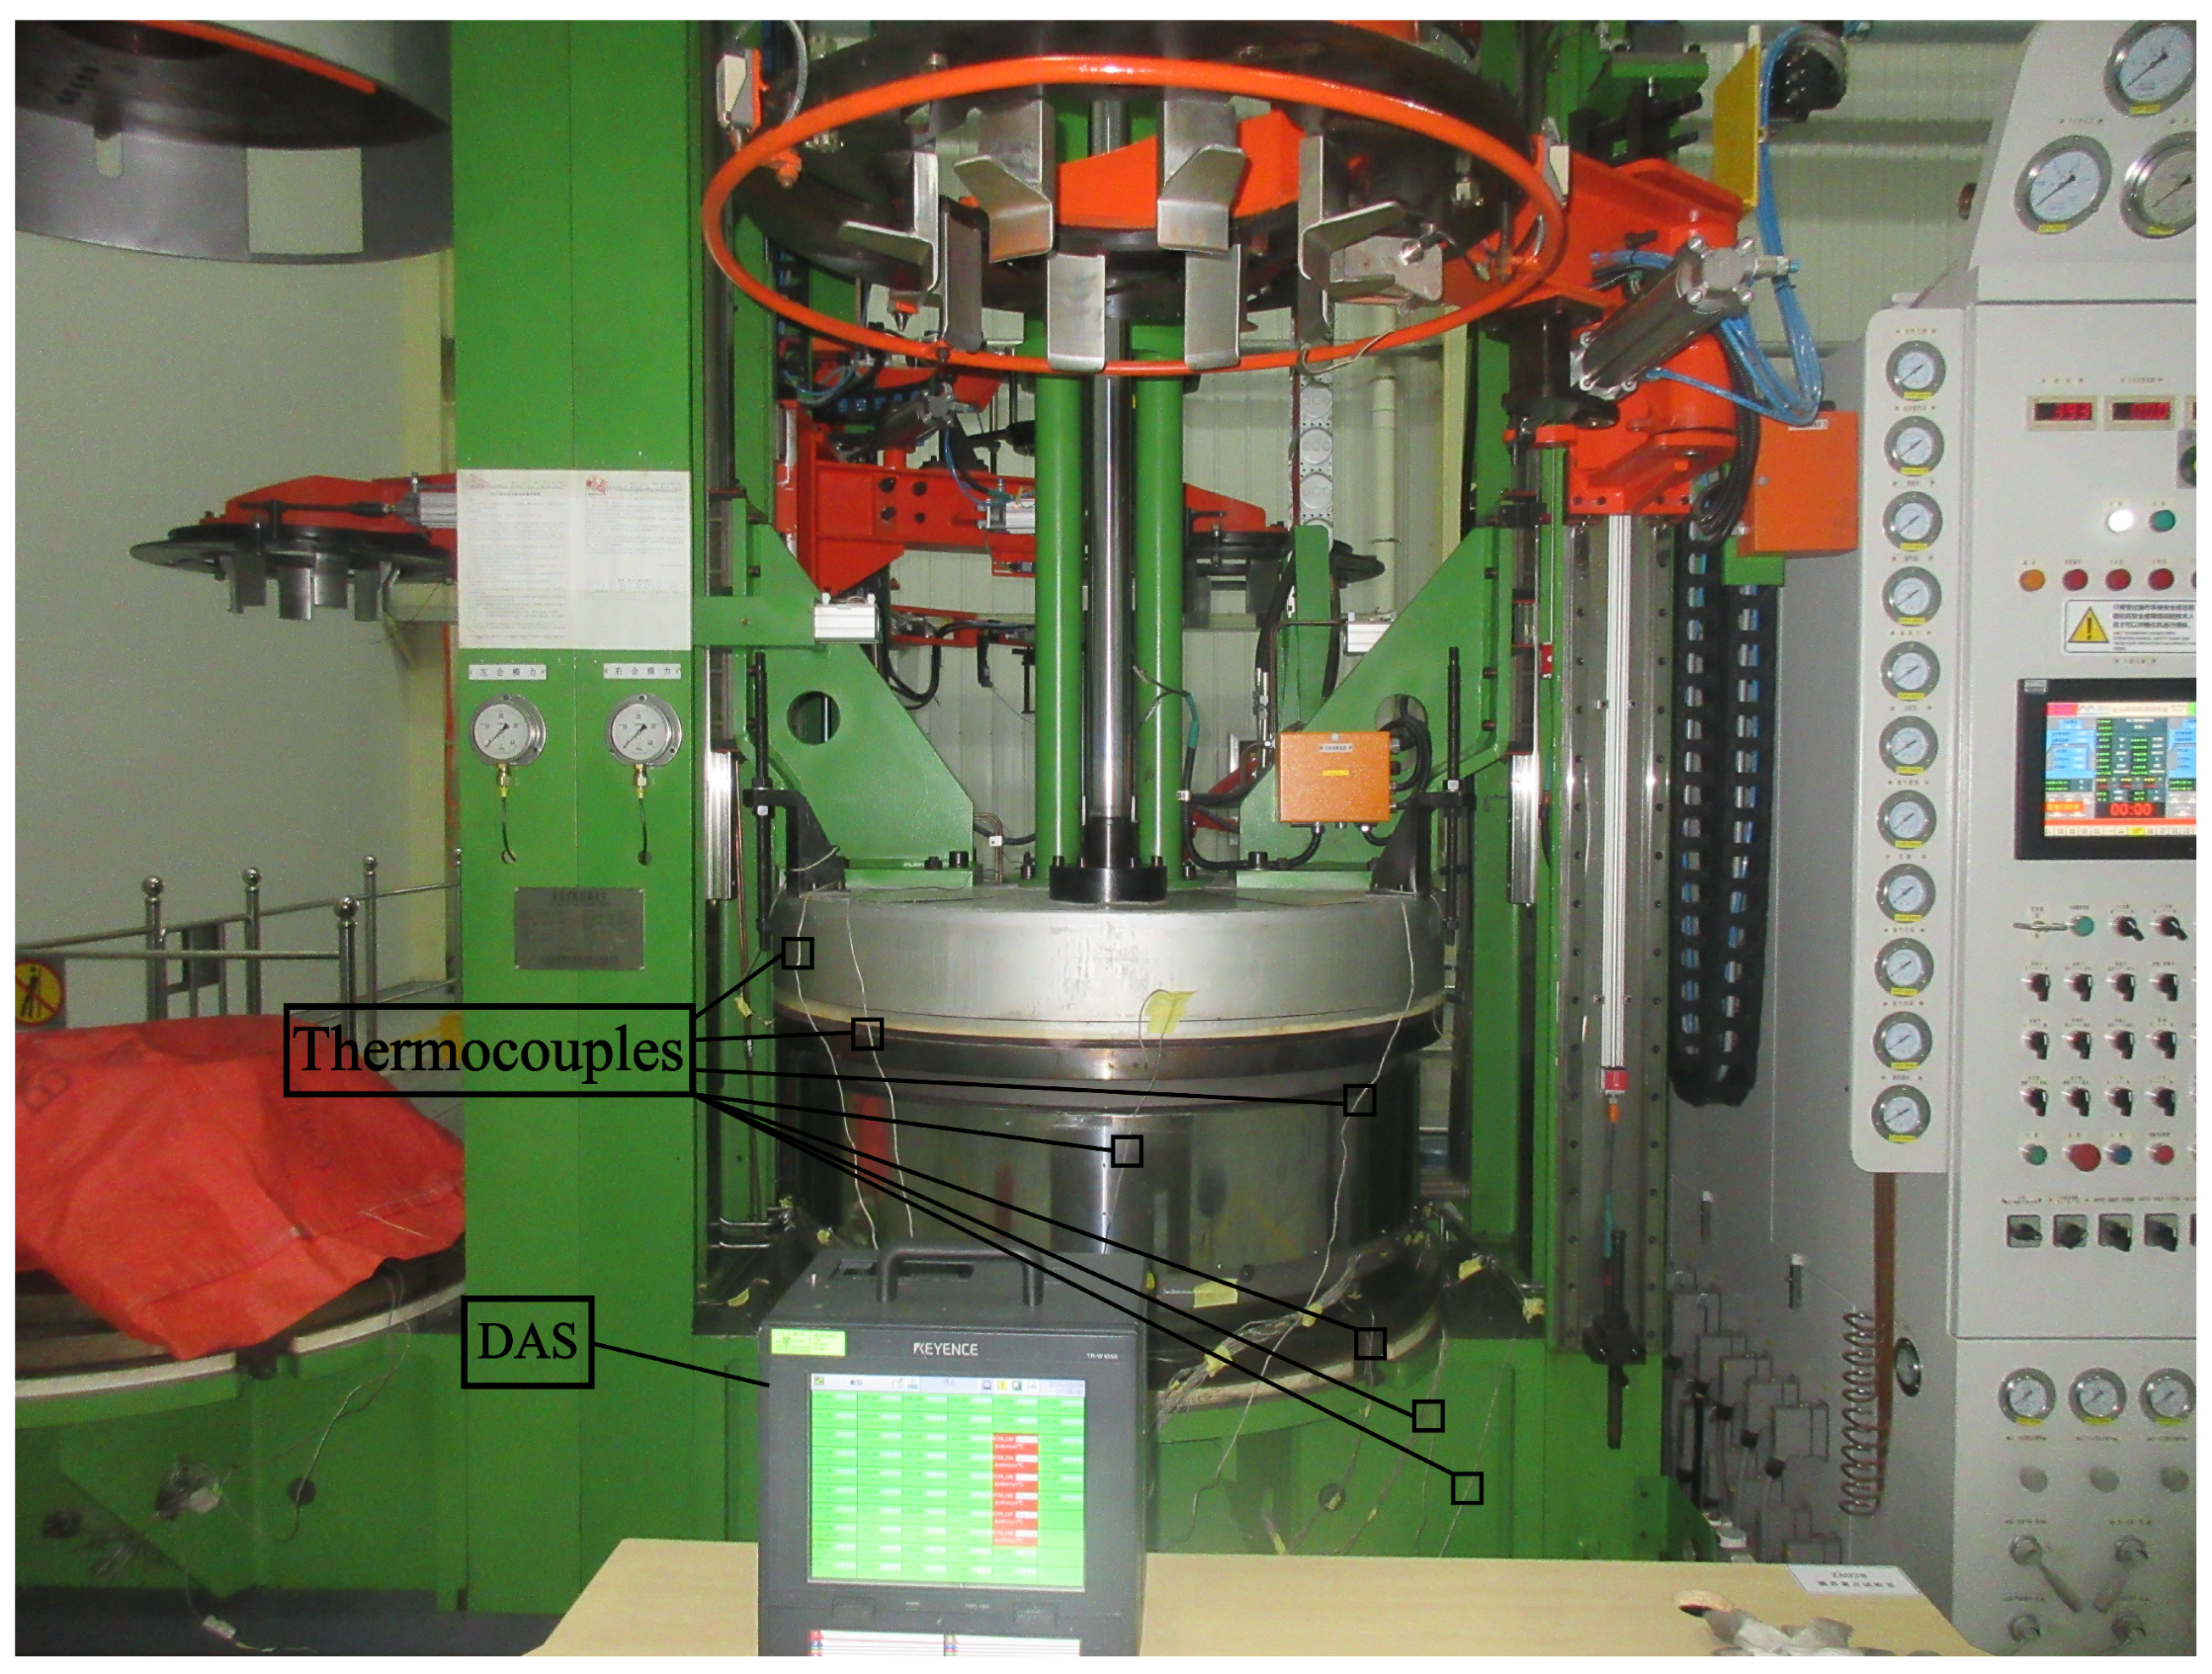
4.1. Testing System
4.2. Experimental Conditions
4.3. Uncertainty Assessment of Experimental and Simulation Results
- (1)
- Measurement Errors
- (2)
- Repeatability Verification
- (3)
- Combined Uncertainty
- (1)
- Fluctuation ranges of key parameters are listed in the Table 3 below.
- (2)
- Simulation of key parameters
- (1)
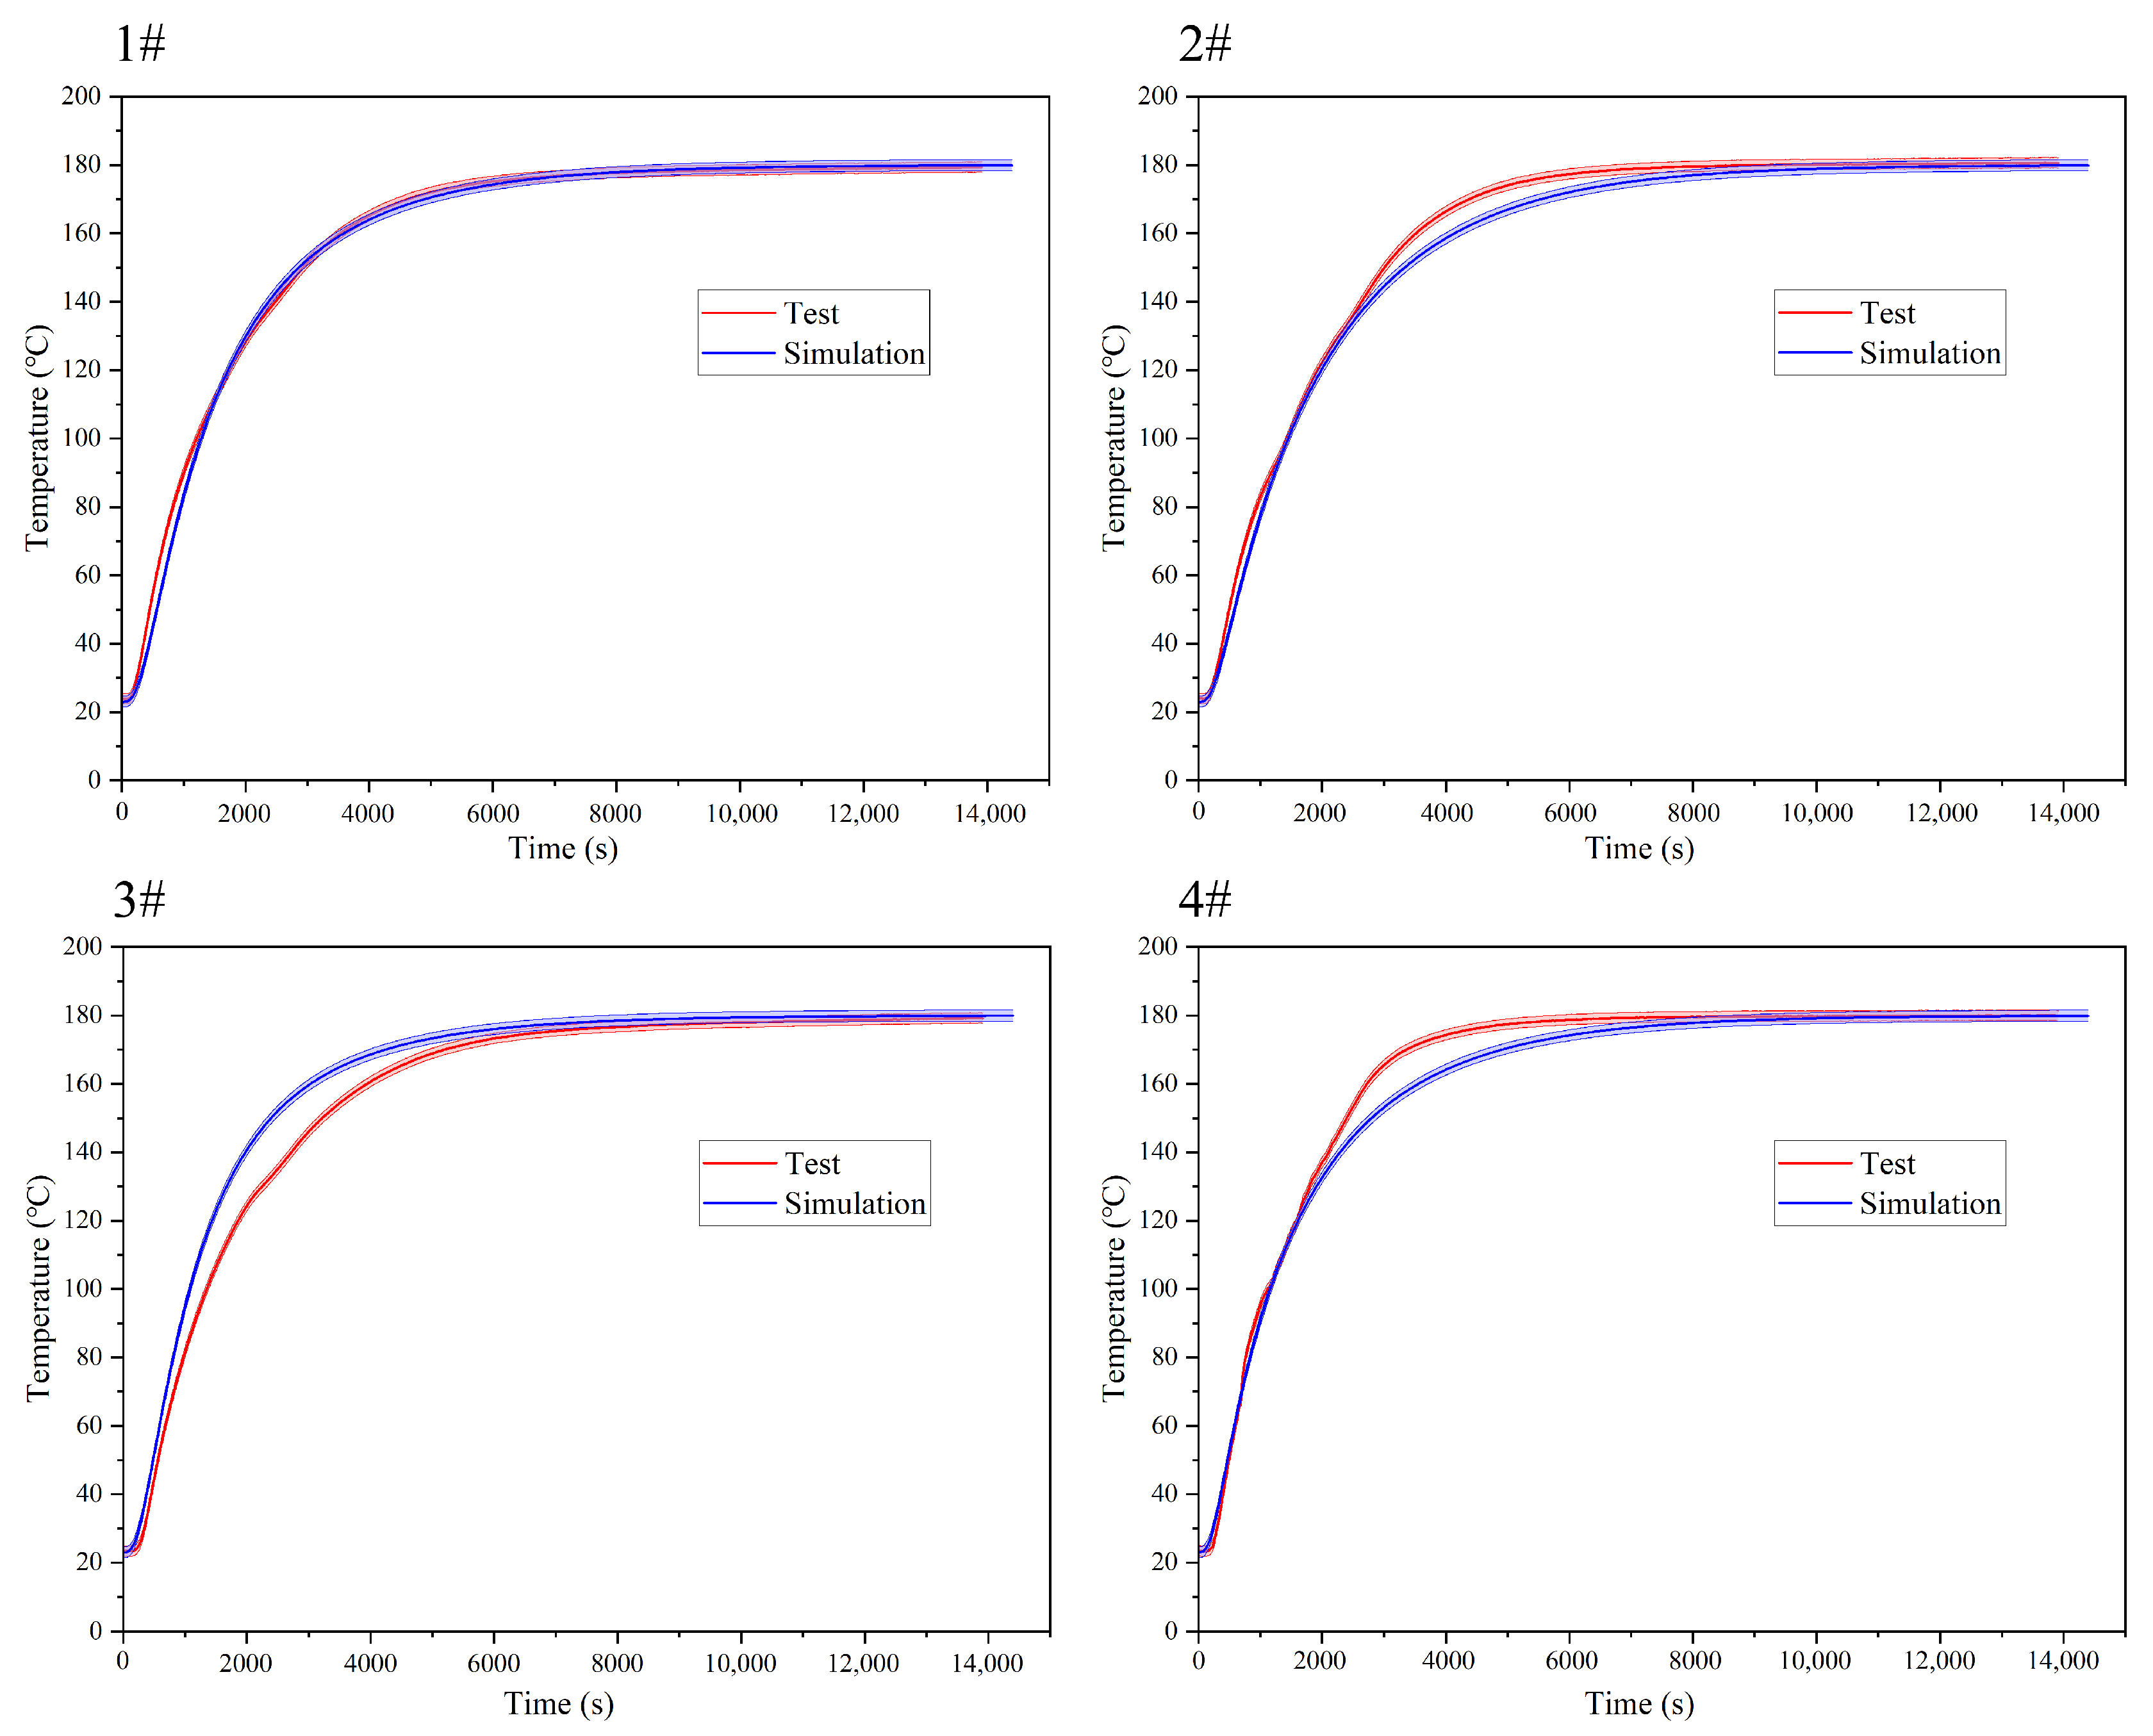
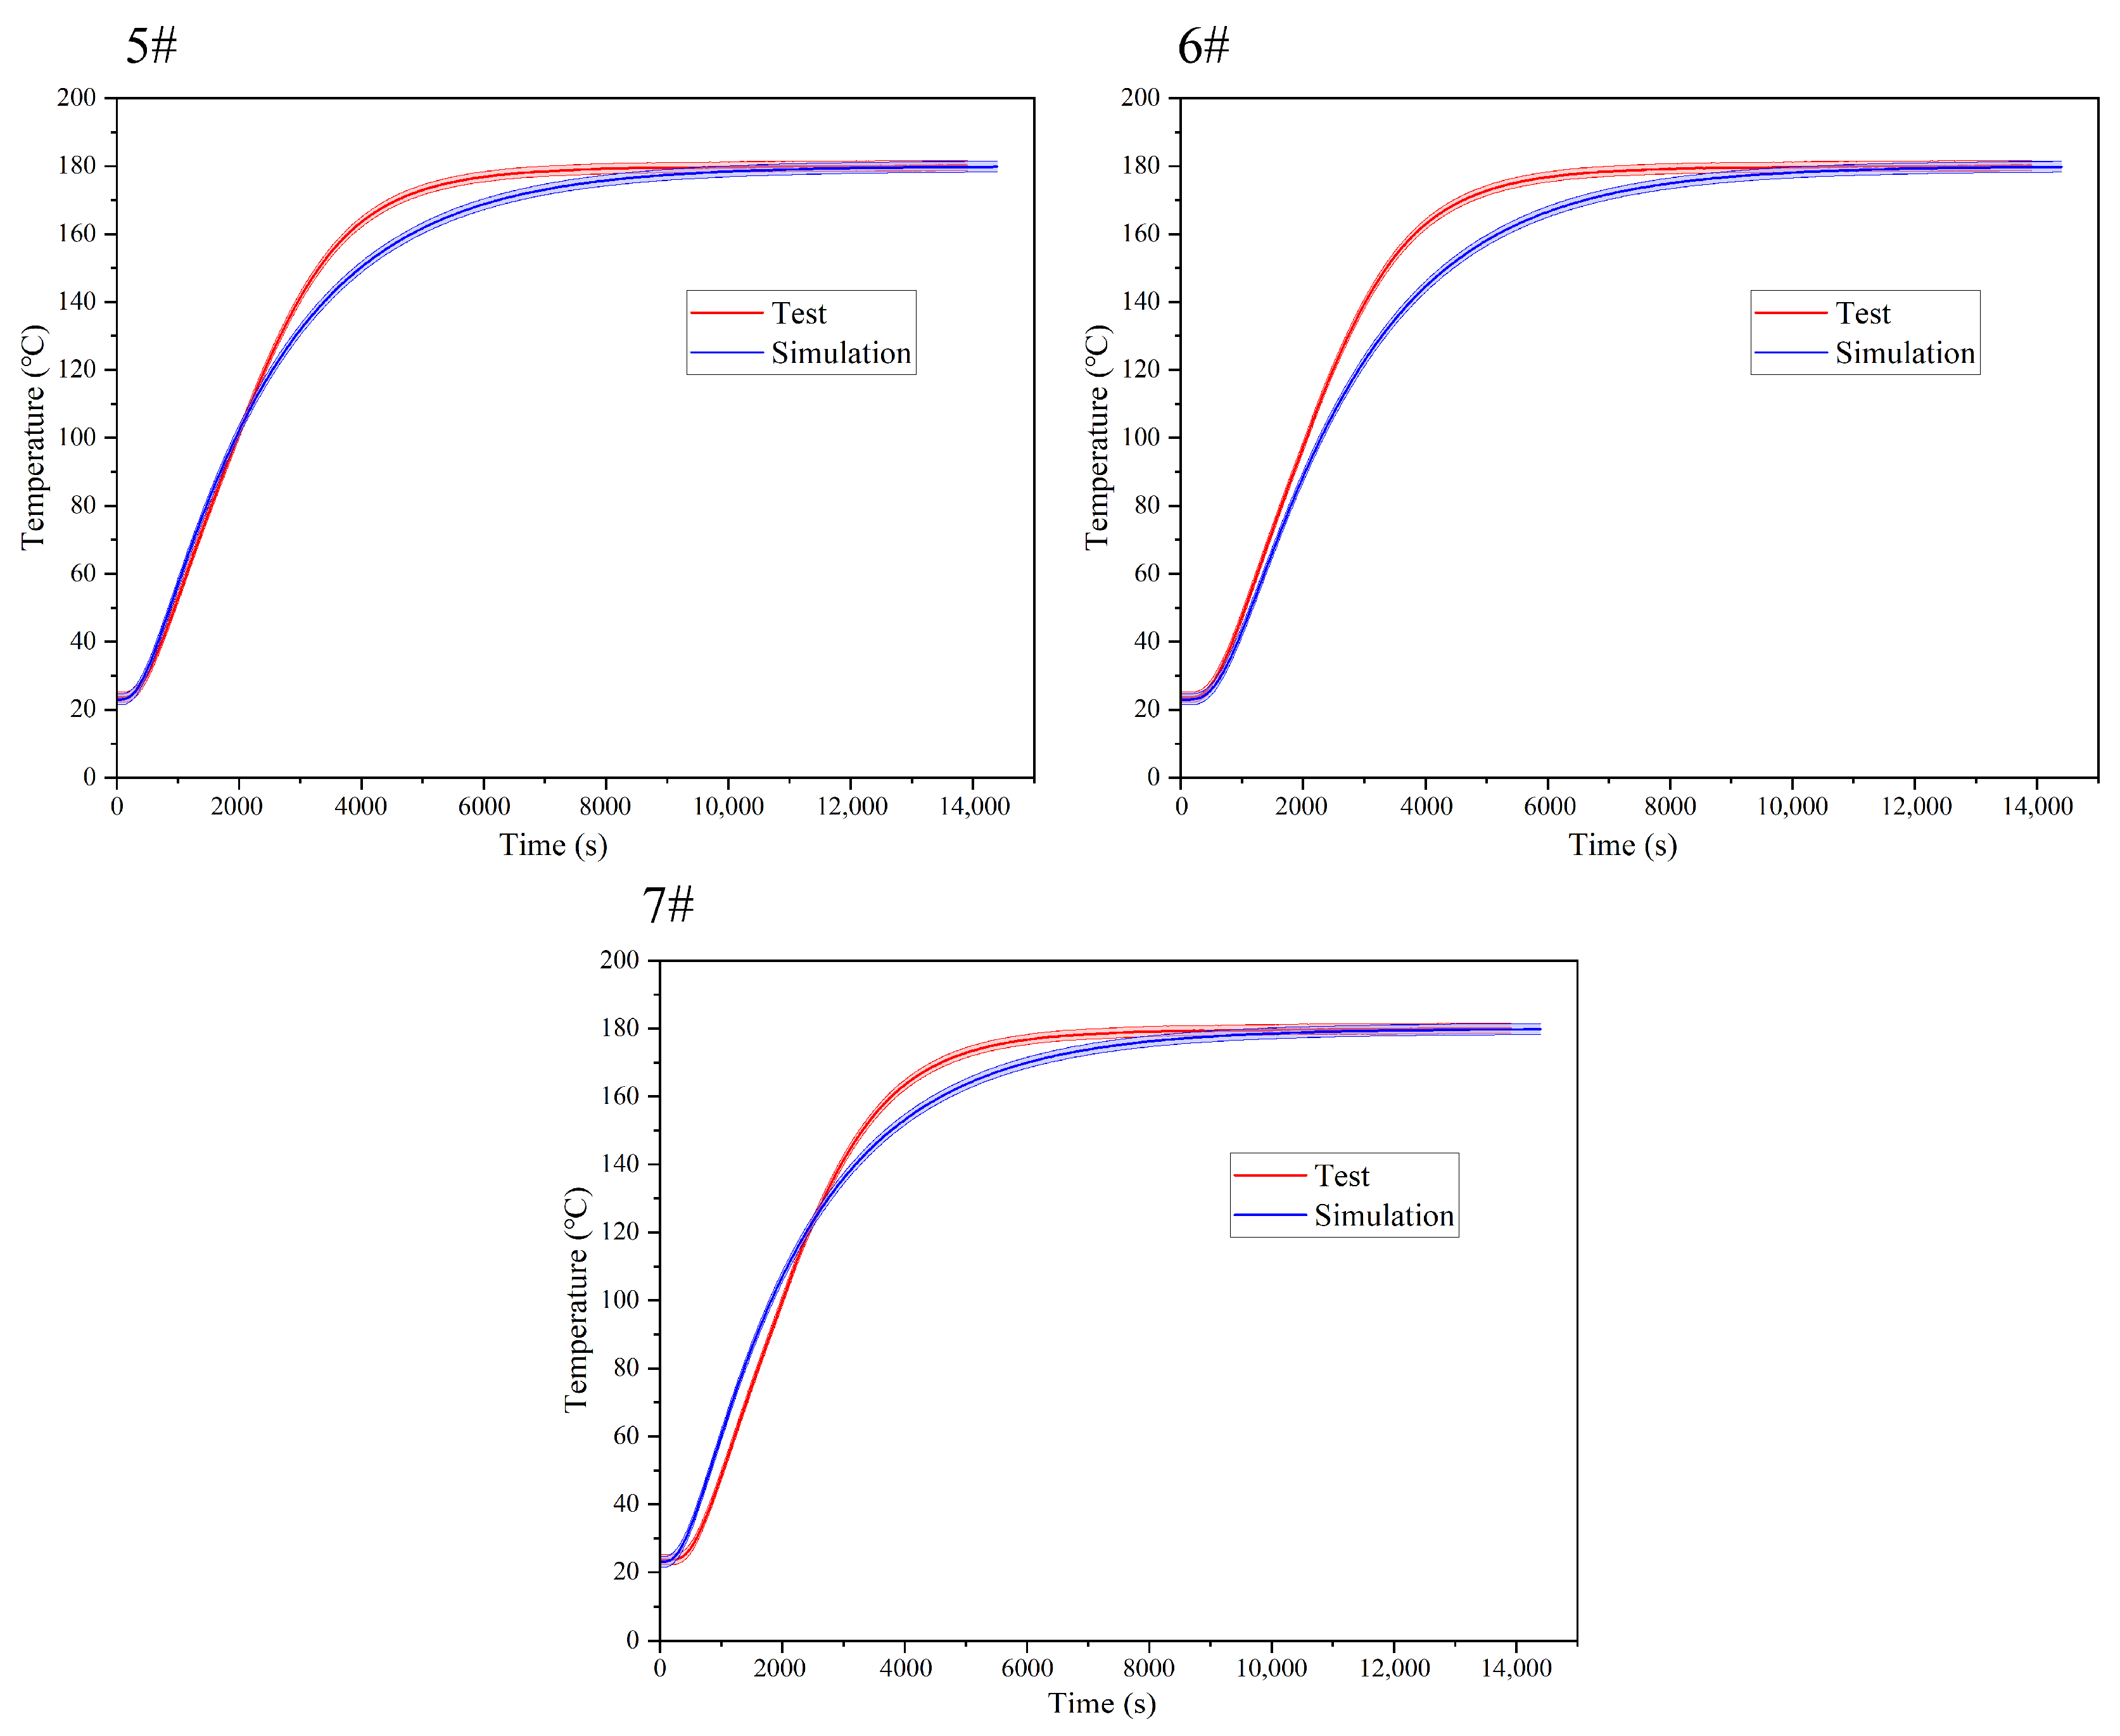
- Temperature Field Validation
- (2)
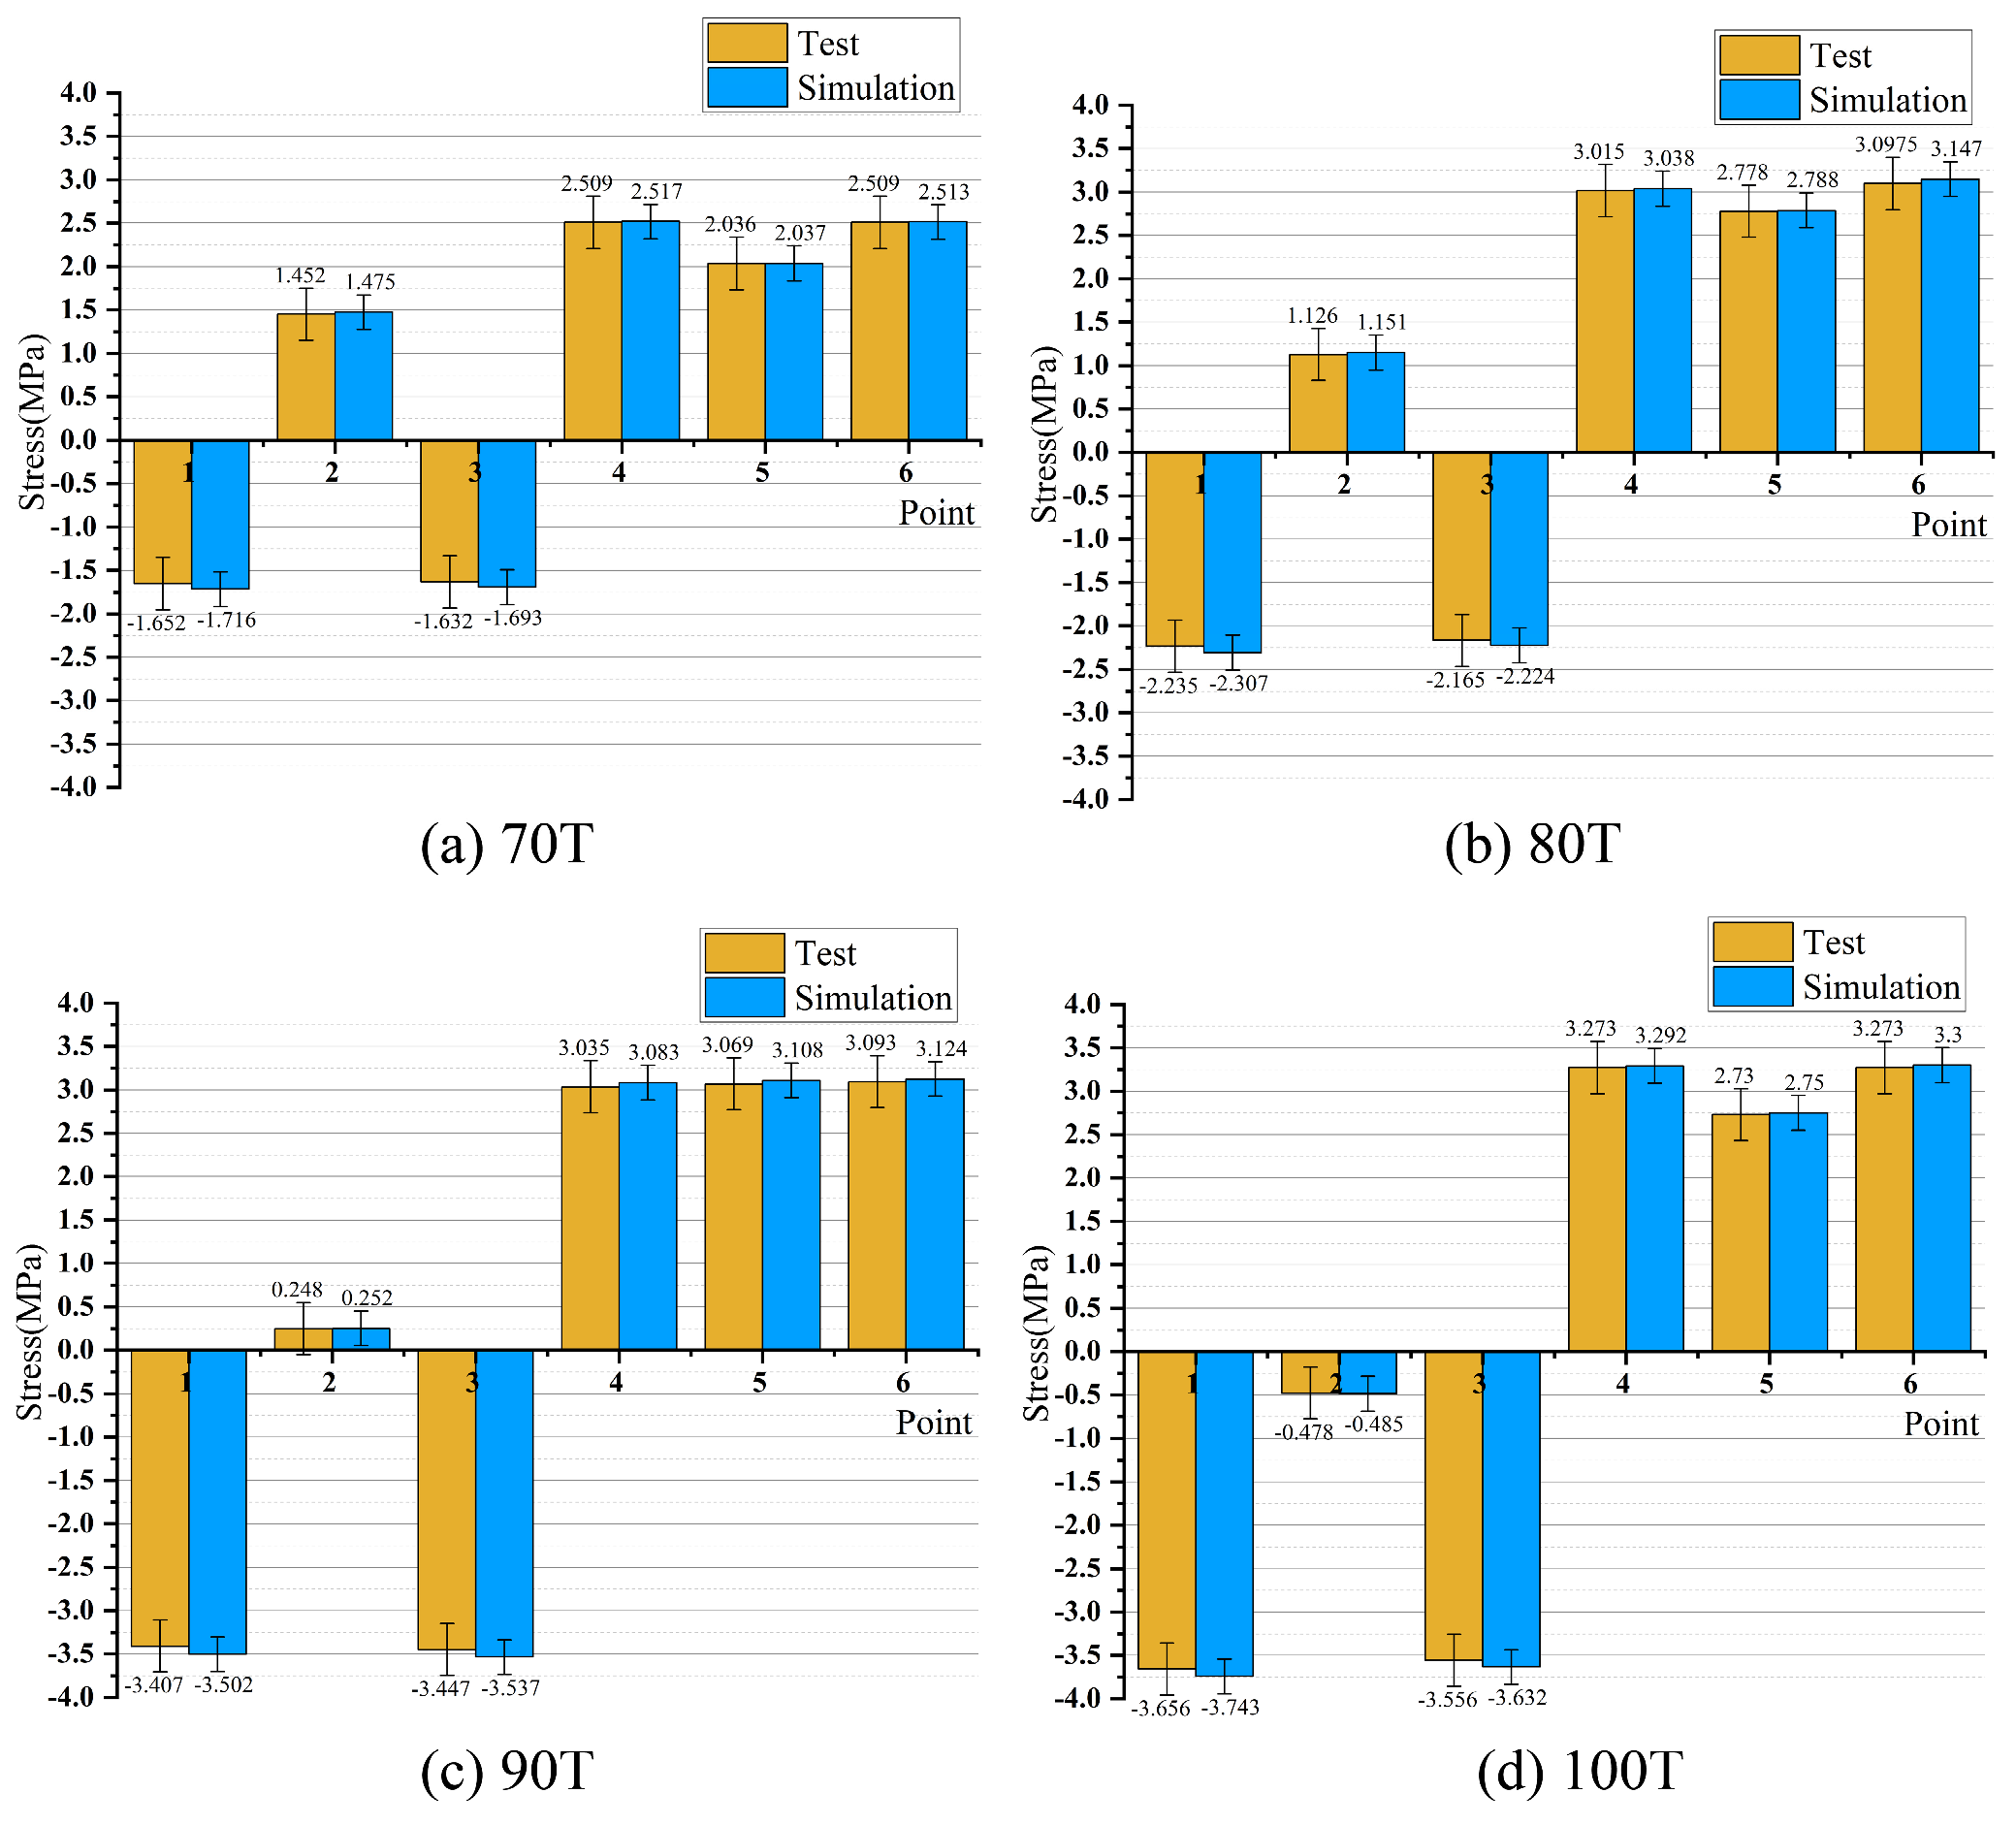
- Stress Validation
5. Simulation and Experimental Results Verification
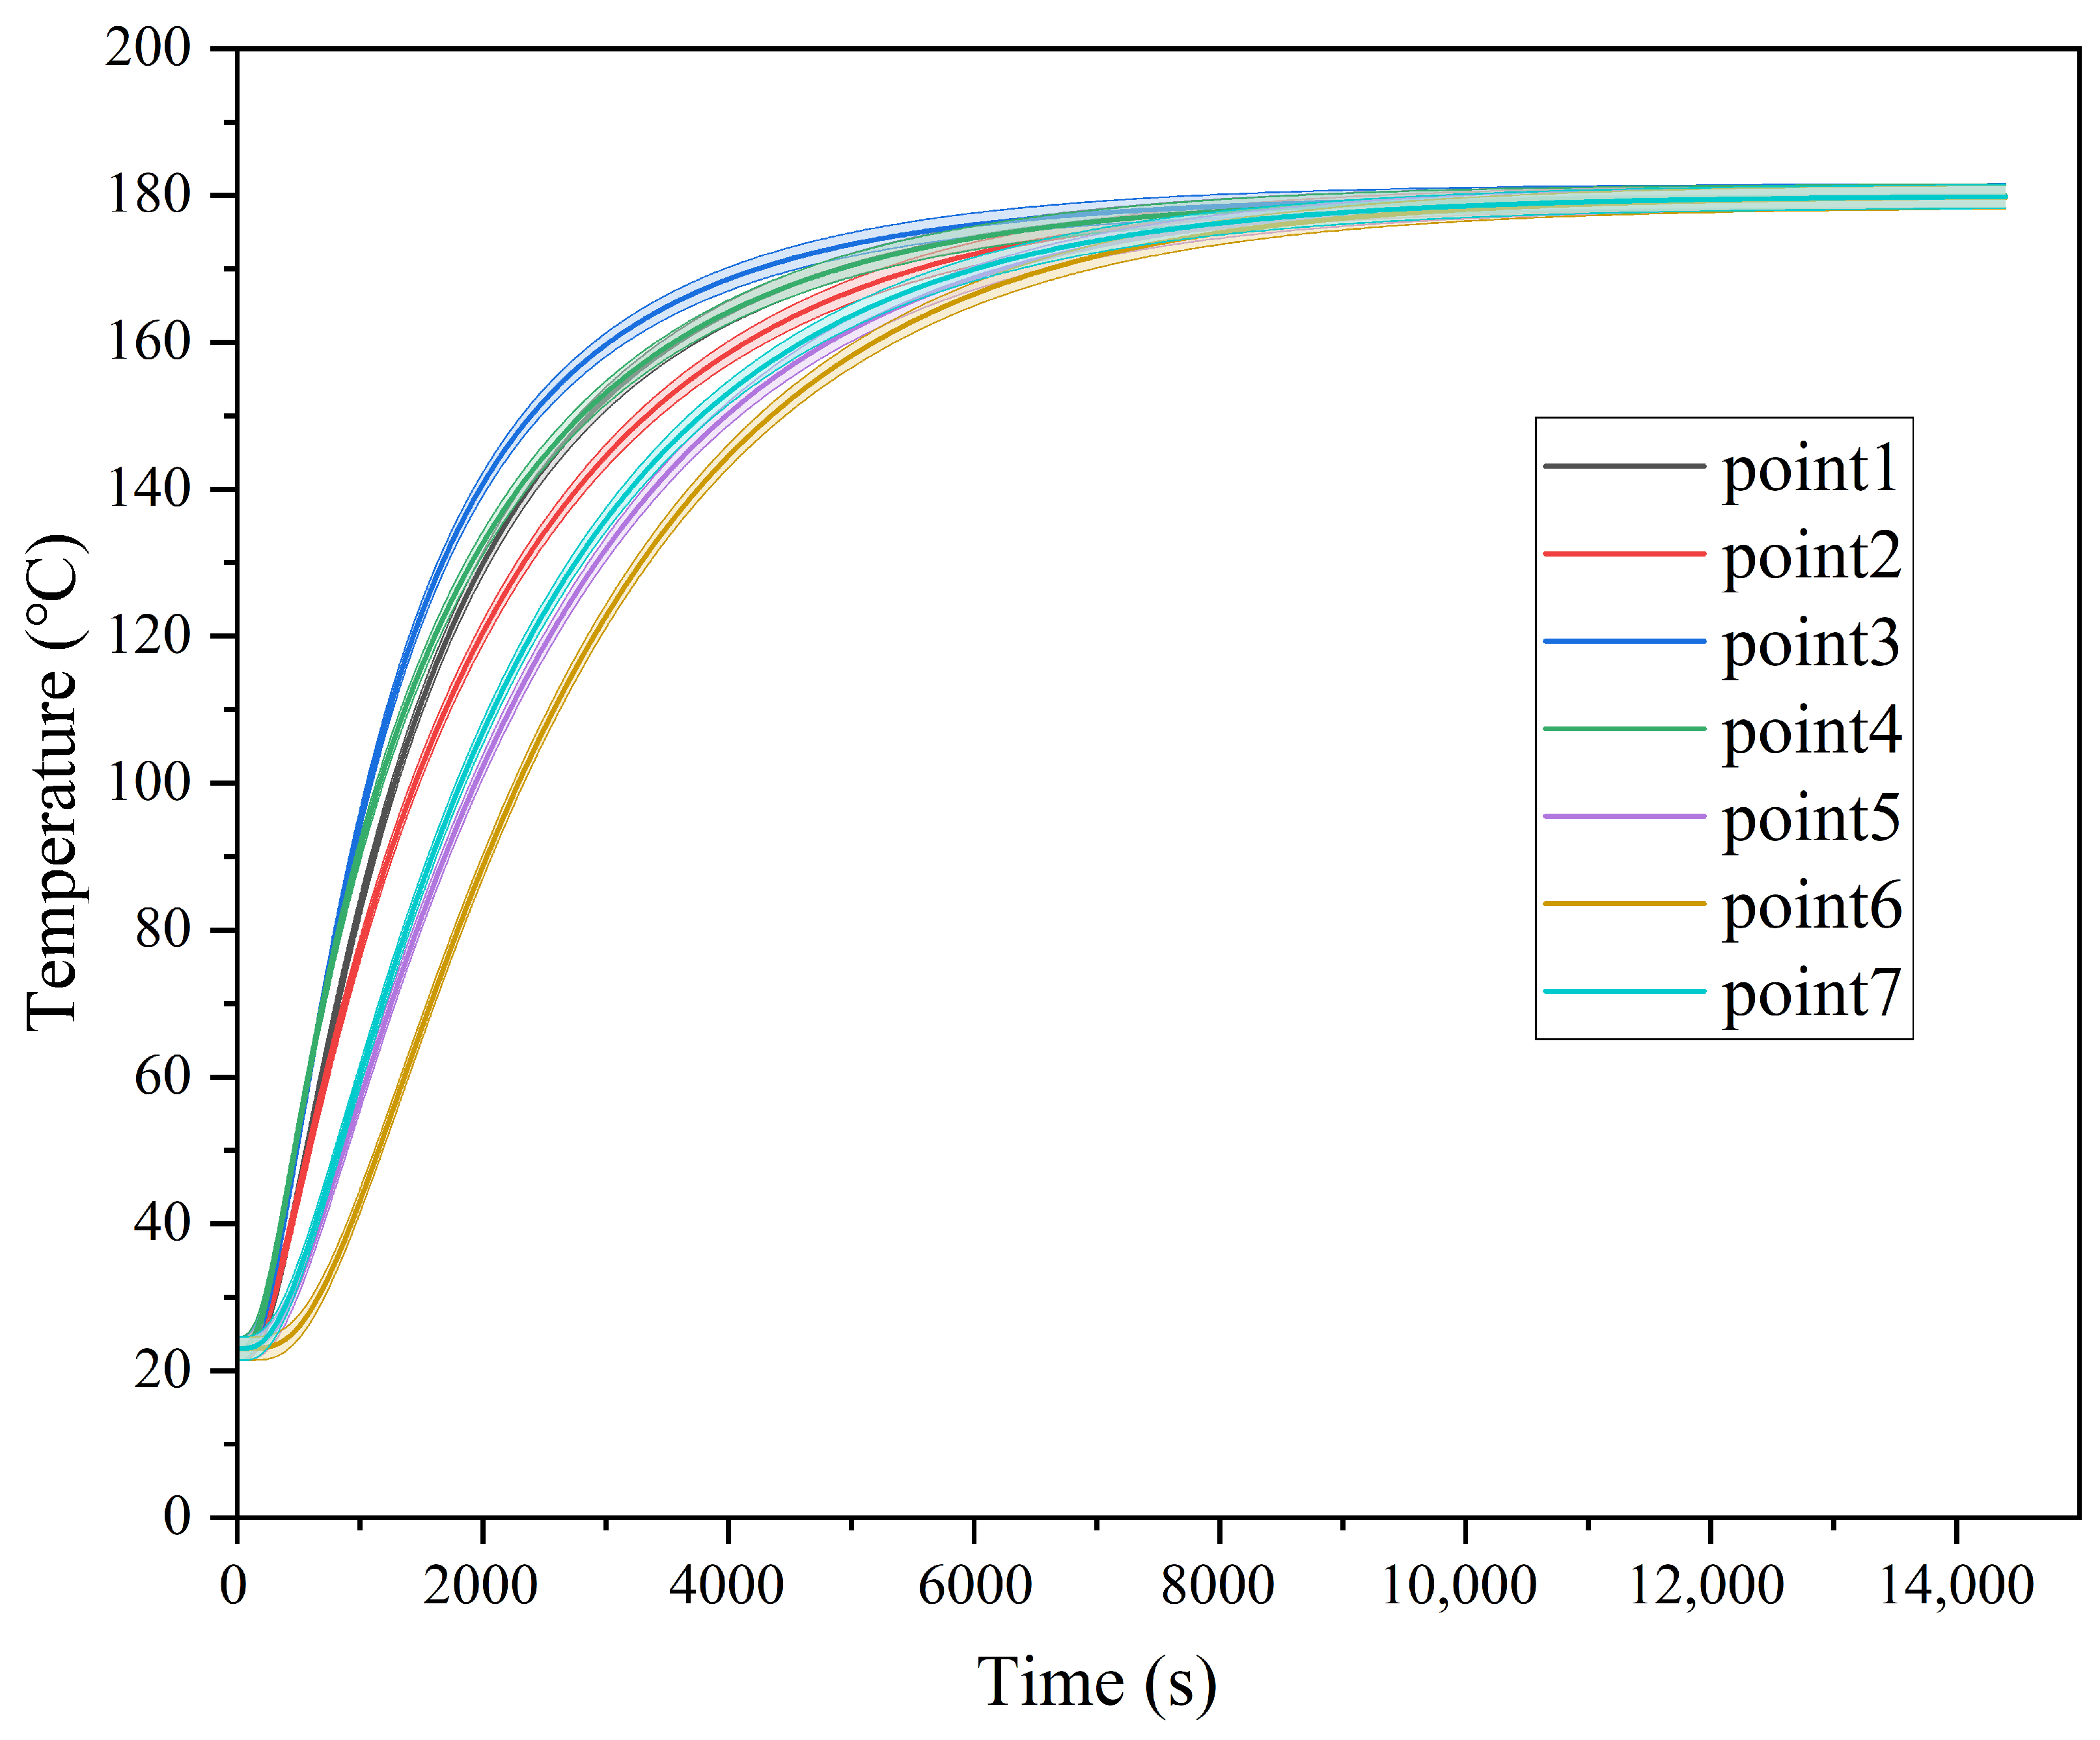
5.1. Temperature Rise Process Comparison and Verification
5.2. Stress Value Comparison and Verification
5.3. Deformation Comparison and Verification
6. Conclusions
- (1)
- This investigation establishes a multi-physics coupling framework integrating steam heat transfer, mold thermodynamics and fluid-structure coupling boundary conditions. It achieves the research on complex segmented tire molds based on multi-physics field coupling, overcoming the limitations of traditional single-field analysis. Compared to the simplified method of assigning heat source values directly, the model incorporates heat transfer analysis of the fluid domain, reducing the temperature field prediction error to 0.13%. The results are approximately 2% lower than those obtained in previous studies by other researchers [9], significantly enhancing the predictive capability of heat transfer and mechanical behavior in complex molds.
- (2)
- The study reveals that the influence of thermal loads on mold deformation far exceeds that of mechanical loads. The expansive deformation of the guide ring under high temperatures reaches 1.1 mm, which is 50 times greater than that under ambient molding forces. This phenomenon highlights the central role of temperature factors in the vulcanization process: the impact of the temperature field must be prioritized in mold design to mitigate thermal stress accumulation and extend mold lifespan.
Author Contributions
Funding
Institutional Review Board Statement
Informed Consent Statement
Data Availability Statement
Conflicts of Interest
Abbreviation
| DAS | Data Acquisition System |
References
- Çağlıyan, A.Ç.; Akyüz, F.; Feyzioğlu, A.; Ersoy, S. Thermal and flow optimization and generative design simulations of the curing press manifold used in tire production. J. Mechatron. Artif. Intell. Eng. 2024, 5, 191–198. [Google Scholar] [CrossRef]
- Chu, C.-H.; Song, M.-C.; Luo, V.C. Computer aided parametric design for 3D tire mold production. Comput. Ind. 2006, 57, 11–25. [Google Scholar]
- Stîngă, F.; Severin, I.; Mitrache, I.A.; Lascu, E. Redesign of the curing area of the tire manufacturing process. Sustainability 2020, 12, 6909. [Google Scholar] [CrossRef]
- Adam, Q.; Behnke, R.; Kaliske, M. A thermo-mechanical finite element material model for the rubber forming and vulcanization process: From unvulcanized to vulcanized rubber. Int. J. Solids Struct. 2020, 185–186, 365–379. [Google Scholar] [CrossRef]
- Chen, Y.; Yang, X.; Li, M.; Mei, M. Influence of working temperatures on mechanical behavior of hybrid joints with carbon fiber reinforced plastic/aluminum lightweight materials for automotive structure. J. Manuf. Process. 2019, 45, 392–407. [Google Scholar]
- Zhang, Z.; Guo, F.; Ke, Y.; Xiang, C.; Jia, X. Effect of vulcanization on deformation behavior of rubber seals: Thermal–mechanical–chemical coupling model, numerical studies, and experimental validation. Mater. Des. 2022, 224, 111314. [Google Scholar] [CrossRef]
- Feng, S.; Yibin, W.; Kaihua, S.; Haiming, H.; Lin, L. Performance analysis of movable mold pattern block based on sequential thermodynamic coupling. Manuf. Technol. Mach. Tool 2022, 12, 88–93. [Google Scholar]
- Tang, Y.; Cui, L.; Li, Q. Parameters Optimization Design and Analysis of Bow-shape Seat in Segmented Tire Mould Structure. In Proceedings of the 2015 International Conference on Intelligent Systems Research and Mechatronics Engineering, Zhengzhou, China, 11–13 April 2015; pp. 1608–1611. [Google Scholar]
- Shi, P.; Du, P.; Riwen, S.; Cuixiang, Y.; Zhao, Y.; Zhang, W.; Zhilan, L.; Maoyuan, L.; Zhang, Y.; Huamin, Z. Heat transfer simulation and experimental study of segmented tire mold. China Plast. Industry 2021, 49, 96–102. (In Chinese) [Google Scholar]
- Gorobets, V.; Trokhaniak, V.; Bohdan, Y.; Antypov, I.; Mechanics, C. Numerical modeling of heat transfer and hydrodynamics in compact shifted arrangement small diameter tube bundles. J. Appl. Comput. Mech. 2021, 7, 292–301. [Google Scholar]
- Liu, Z.; Lu, D.; Shen, T.; Guo, H.; Bai, Y.; Wang, L.; Gong, M. New configurations of absorption heat transformer and refrigeration combined system for low-temperature cooling driven by low-grade heat. Appl. Therm. Eng. 2023, 228, 120567. [Google Scholar] [CrossRef]
- Yu, Q.; Yang, X.; Niu, J.; Sui, Y.; Du, Y.; Yuan, Y. Thermal effects on the wall surfaces of transonic evacuated tube maglev transportation. Appl. Therm. Eng. 2023, 222, 119876. [Google Scholar] [CrossRef]
- Li, Q.; Dillard, D.A.; Batra, R.C. Kearsley-type instabilities in finite deformations of transversely isotropic and incompressible hyperelastic materials. Int. J. Solids Struct. 2020, 196, 171–178. [Google Scholar] [CrossRef]
- Park, Y.; Hong, G.; Jun, S.; Choi, J.; Kim, T.; Kang, M.; Jang, G. Thermo-Fluid–Structural Coupled Analysis of a Mechanical Seal in Extended Loss of AC Power of a Reactor Coolant Pump. Lubricants 2024, 12, 212. [Google Scholar] [CrossRef]
- Yun, S.; Lee, D.; Jang, D.S.; Lee, M.; Kim, Y. Numerical analysis on thermo-fluid–structural performance of graded lattice channels produced by metal additive manufacturing. Appl. Therm. Eng. 2021, 193, 117024. [Google Scholar] [CrossRef]
- Chen, C.; Yang, S.; Pan, M. Microchannel structure optimization and experimental verification of a plate heat exchanger. Int. J. Heat Mass Transf. 2021, 175, 121385. [Google Scholar] [CrossRef]
- Christ, H.-J.; Bauer, V. Adapting a multi-component model to cyclic stress–strain behaviour under thermomechanical fatigue conditions. Comput. Mater. Sci. 2012, 57, 59–66. [Google Scholar] [CrossRef]
- Malzbender, J. Mechanical and thermal stresses in multilayered materials. J. Appl. Phys. 2004, 95, 1780–1782. [Google Scholar] [CrossRef]
- Zhao, P.; Feng, Z.-J. Thermal deformation of granite under different temperature and pressure pathways. Adv. Mater. Sci. Eng. 2019, 2019, 7869804. [Google Scholar] [CrossRef]
- Xie, J.; Yan, J.-B. Tests and analysis on thermal expansion behaviour of steel strand used in prestressed concrete structure under low temperatures. Int. J. Concr. Struct. Mater. 2018, 12, 5. [Google Scholar] [CrossRef]
- Sun, G.; Chen, Z.; Liu, Z. Analytical and experimental investigation of thermal expansion mechanism of steel cables. J. Mater. Civ. Eng. 2011, 23, 1017–1027. [Google Scholar] [CrossRef]


| Component | Material | Density (kg/m3) | Thermal Expansion Coefficient (/K) | Elastic Modulus (GPa) | Poisson’s Ratio |
|---|---|---|---|---|---|
| Guide Ring/Upper Side Plate/Lower Side Plate | 35# Steel | 7850 | 1.2 × 10⁻⁵ | 203 | 0.3 |
| Mounting Ring/Lower Base/Upper Cover | 45# Steel | 7850 | 1.2 × 10⁻⁵ | 210 | 0.27 |
| Guide Strip/Slide Block/Upper Slide Block | 40Cr Steel | 7850 | 1.2 × 10⁻⁵ | 195 | 0.3 |
| Tread Segment | A514 Steel | 7850 | 1.2 × 10⁻⁵ | 60 | 0.32 |
| 1# | 2# | 3# | 4# | 5# | 6# | 7# | |
|---|---|---|---|---|---|---|---|
| 4000 s | 164.1 | 158.8 | 168.8 | 164.3 | 150.6 | 144.9 | 153.4 |
| 9000 s | 179.1 | 178.9 | 179.4 | 179.1 | 178.3 | 178.0 | 178.5 |
| 14,400 s | 179.9 | 179.8 | 179.9 | 179.9 | 179.8 | 179.8 | 179.8 |
| Parameter | Standard Value | Fluctuation Range | Basis |
|---|---|---|---|
| Steam Temperature | 180 °C | ±2 °C | Vulcanizer control accuracy |
| Thermal Conductivity | 50 W/m·K | ±5% | Material handbook tolerance |
| Molding forces | 80 T | ±3% | Hydraulic system error |
| 70 T | 80 T | |||||
|---|---|---|---|---|---|---|
| Test | Simulation | Error | Test | Simulation | Error | |
| 1 | −0.17 | −0.18 | 6% | −0.21 | −0.21 | 0% |
| 2 | −0.21 | −0.22 | 5% | −0.24 | −0.24 | 4% |
| 3 | −0.16 | −0.17 | 6% | −0.19 | −0.19 | 5% |
| 4 | −0.20 | −0.21 | 5% | −0.23 | −0.24 | 4% |
| 70 T | 80 T | |
|---|---|---|
| 1 | 1.04 | 1.04 |
| 2 | 1.03 | 1.04 |
| 3 | 1.04 | 1.04 |
| 4 | 1.03 | 1.04 |
| 70 T | 80 T | |||||
|---|---|---|---|---|---|---|
| Test | Simulation | Error | Test | Simulation | Error | |
| 1 | 0.020 | 0.021 | 5% | 0.021 | 0.022 | 4.8% |
| 2 | 0.018 | 0.019 | 6% | 0.020 | 0.021 | 5% |
| 3 | 0.019 | 0.020 | 5% | 0.019 | 0.020 | 5.3% |
| 4 | 0.020 | 0.021 | 5% | 0.021 | 0.022 | 4.8% |
| 70 T | 80 T | |
|---|---|---|
| 1 | 1.104 | 1.104 |
| 2 | 1.103 | 1.103 |
| 3 | 1.102 | 1.102 |
| 4 | 1.104 | 1.104 |
Disclaimer/Publisher’s Note: The statements, opinions and data contained in all publications are solely those of the individual author(s) and contributor(s) and not of MDPI and/or the editor(s). MDPI and/or the editor(s) disclaim responsibility for any injury to people or property resulting from any ideas, methods, instructions or products referred to in the content. |
© 2025 by the authors. Licensee MDPI, Basel, Switzerland. This article is an open access article distributed under the terms and conditions of the Creative Commons Attribution (CC BY) license (https://creativecommons.org/licenses/by/4.0/).
Share and Cite
Xiao, W.; Cao, F.; Lin, J.; Wang, H.; Liu, C. Thermo-Mechanical Behavior Simulation and Experimental Validation of Segmented Tire Molds Based on Multi-Physics Coupling. Appl. Sci. 2025, 15, 4010. https://doi.org/10.3390/app15074010
Xiao W, Cao F, Lin J, Wang H, Liu C. Thermo-Mechanical Behavior Simulation and Experimental Validation of Segmented Tire Molds Based on Multi-Physics Coupling. Applied Sciences. 2025; 15(7):4010. https://doi.org/10.3390/app15074010
Chicago/Turabian StyleXiao, Wenkang, Fang Cao, Jianghai Lin, Hao Wang, and Chongyi Liu. 2025. "Thermo-Mechanical Behavior Simulation and Experimental Validation of Segmented Tire Molds Based on Multi-Physics Coupling" Applied Sciences 15, no. 7: 4010. https://doi.org/10.3390/app15074010
APA StyleXiao, W., Cao, F., Lin, J., Wang, H., & Liu, C. (2025). Thermo-Mechanical Behavior Simulation and Experimental Validation of Segmented Tire Molds Based on Multi-Physics Coupling. Applied Sciences, 15(7), 4010. https://doi.org/10.3390/app15074010