Article

A Health Status Identification Method for Rotating Machinery Based on Multimodal Joint Representation Learning and a Residual Neural Network

1
School of Mechanical Engineering, Xi’an University of Science and Technology, Xi’an 710054, China
2
Shaanxi Key Laboratory of Intelligent Detection and Control of Mechanical and Electrical Equipment, Xi’an 710054, China
*
Author to whom correspondence should be addressed.
Appl. Sci. 2025, 15(7), 4049; https://doi.org/10.3390/app15074049
Submission received: 5 March 2025 / Revised: 23 March 2025 / Accepted: 3 April 2025 / Published: 7 April 2025

Abstract

:
Given that rotating machinery is one of the most commonly used types of mechanical equipment in industrial applications, the identification of its health status is crucial for the safe operation of the entire system. Traditional equipment health status identification mainly relies on conventional single-modal data, such as vibration or acoustic modalities, which often have limitations and false alarm issues when dealing with real-world operating conditions and complex environments. However, with the increasing automation of coal mining equipment, the monitoring of multimodal data related to equipment operation has become more prevalent. Existing multimodal health status identification methods are still imperfect in extracting features, with poor complementarity and consistency among modalities. To address these issues, this paper proposes a multimodal joint representation learning and residual neural network-based method for rotating machinery health status identification. First, vibration, acoustic, and image modal information is comprehensively utilized, which is extracted using a Gramian Angular Field (GAF), Mel-Frequency Cepstral Coefficients (MFCCs), and a Faster Region-based Convolutional Neural Network (RCNN), respectively, to construct a feature set. Second, an orthogonal projection combined with a Transformer is used to enhance the target modality, while a modality attention mechanism is introduced to take into consideration the interaction between different modalities, enabling multimodal fusion. Finally, the fused features are input into a residual neural network (ResNet) for health status identification. Experiments conducted on a gearbox test platform validate the proposed method, and the results demonstrate that it significantly improves the accuracy and reliability of rotating machinery health state identification.

1. Introduction

Rotating machinery health status assessment is a key factor for the safe operation of equipment [1,2]. Once a fault occurs, it is often difficult to quickly identify the specific cause, which may lead to equipment damage, downtime, and production halts, resulting in economic losses or even major accidents that threaten workers’ safety. As a crucial aspect of fault prediction and health management, health status assessment enables the accurate and timely evaluation of a machine’s current degradation state and prediction of its remaining useful life, ensuring operational safety. This not only directly improves the working efficiency of mechanical equipment but also indirectly reduces maintenance costs through early warnings. Therefore, researching health status identification methods for rotating machinery is of great practical significance for enhancing its operational reliability and stability.
Currently, health state identification methods can be broadly categorized into three main types: knowledge-based, model-driven, and data-driven approaches. Knowledge-based methods are applied in systems where model development is challenging or where nonlinearity is significant. These methods rely on theoretical knowledge and expert experience for state assessment. Prominent techniques include expert systems (ESs) [3,4], fault tree analysis (FTA) [5,6,7], the analytic hierarchy process (AHP) [8], and fuzzy comprehensive evaluation [9,10]. Although these methods provide a comprehensive system evaluation with strong interpretability and relatively simple operation, they are limited to qualitative analysis, are highly subjective, and lack generalizability. Furthermore, they exhibit low levels of digitization and intelligence, resulting in generally lower accuracy. The core idea of model-driven methods is to develop performance degradation models based on physical and chemical principles or operational data analysis to characterize the system’s health state. These methods rely on analyzing mechanical system operations and fault mechanisms to construct models that describe equipment performance degradation, facilitating health state assessment. Common techniques include the cloud center of gravity method [11], mechanism-based modeling [12,13], and state estimation approaches [14,15,16]. Although these approaches provide relatively accurate assessment results, they involve complex modeling processes, high operational costs for large and intricate machinery, and challenges in model validation and practical implementation. Additionally, they exhibit poor adaptability and generalization capabilities. To overcome the limitations of knowledge-based methods, which require extensive prior knowledge, and model-driven methods, which struggle with complex mathematical degradation modeling, the use of data-driven health state identification methods has gained significant attention [17]. Researchers have primarily concentrated on the two aspects outlined below.
Research on Single-Modality Feature Extraction for Equipment Operational State. Ong P [18] proposed a one-dimensional deep convolutional neural network (1D-DCNN), which directly learns features from vibration signals to identify the various health conditions of gears. Similarly, Singh M K [19] employed efficient machine learning techniques to extract acoustic features from sound data related to the operational state of automotive gearboxes, thereby developing a systematic approach for gearbox state identification. In a different approach, Park J [20] introduced a feature extraction method based on time–frequency image data, representing both the time and frequency information of signals through two-dimensional time–frequency images. Additionally, Kong Yun [21] proposed a novel Sparse-Assisted Intelligent Recognition method, which utilizes prior knowledge of shift-invariance prediction. Through the application of an overlapping segmentation strategy, class-specific dictionaries were designed to exploit both local and non-local features in data segmentation, ultimately enabling health state identification through a sparsity-based diagnostic approach. Furthermore, Storti Gustavo Chaves [22] developed an automatic recognition algorithm to extract structural state information from rotating machinery foundation systems under various operating conditions, including ramp-up (accelerated shaft rotation). This algorithm integrates Operational Modal Analysis (OMA), hierarchical clustering, and k-means clustering to automatically identify stable states. In another study, Fan H [23,24] converted vibration signals into gray texture images and explored intelligent fault diagnosis methods for rotor-bearing systems in motors with variable working conditions, focusing on improving model generalization and reducing model complexity. Through the enhancement of the CNN model and introduction of AdaBN, the transfer diagnosis of the motor rotor-bearing system from known to unknown conditions was successfully conducted. Through techniques such as adaptive activation, classifier structure optimization, and multi-scale feature extraction, the accurate diagnosis of the motor rotor-bearing system was achieved while reducing model parameters and FLOPs.
Research on Multimodal Feature Extraction for Equipment Operational State. Babak V [25] presented a comprehensive mathematical framework for the analysis and diagnostic application of vibration and acoustic emission (AE) signals in electrical equipment (EE). Key contributions include the establishment of a vibration model that simulates the multi-resonant system’s response to generating impulses, reflecting the dynamics of rolling bearings, and a model for AE that integrates continuous and discrete signal components. Ma Y [26] addressed the issue of inadequate modality representation and insufficient exploration of intrinsic characteristics by proposing a multimodal neural network model. After a two-dimensional modal transformation of time-domain signals was performed, an information fusion mechanism was introduced that combines a continuous wavelet transform with symmetric point diagrams, resulting in a two-level information fusion-based multimodal CNN architecture. Babak V [27] provided effective tools and theoretical support for assessing equipment conditions by establishing mathematical models and identification methods for vibroacoustic signals and utilizing the Pearson curve system to statistically analyze vibroacoustic signals from power industry objects. Similarly, Wu Z [28] proposed an end-to-end, deep clustering-based health state identification method for rotating machinery using multimodal fusion, specifically designed to handle completely unlabeled application scenarios. In another approach, Cao X [29] introduced a multimodal recognition method that combines vibration signals with thermal images. This method leverages thermal imaging technology to intuitively capture thermal changes during gearbox operation and integrates vibration signals to provide a comprehensive reflection of state features. Tong J [30] developed a rotating machinery health state identification method based on multimodal information fusion and coordinate attention mechanisms. By integrating information at the data, feature, and decision levels, the method enhances the accuracy of state identification. Furthermore, Cui J [31] designed an end-to-end, multi-task, multimodal fusion network (M2FN) for intelligent state diagnosis. This approach extracts discriminative features from multimodal data to achieve accurate and reliable diagnoses. Lastly, Xu Y [32] proposed a collaborative fusion convolutional neural network. This method incorporates a multi-scale shrinkage denoising module to extract hierarchical, modality-specific features from different modalities. Additionally, a central fusion module was introduced to explore intrinsic correlations and integrate crossmodal features. An online label-smoothing training strategy was also employed to reduce overfitting and improve classification performance.
The methods discussed above have spurred notable progress in mechanical equipment health state identification. However, they still exhibit several limitations. First, the construction of feature sets using single-modal data results in information loss, hindering the comprehensive extraction of relevant equipment characteristics. Additionally, the characteristics of different modal data can vary significantly, and existing state feature extraction methods fail to effectively capture the correlations between multiple modalities.
To address the aforementioned issues, the objective of this study is to design a deep learning model that integrates multimodal features, fully leveraging the complementary characteristics among modalities to enhance the accuracy and robustness of rotating machinery health state recognition. To achieve this objective, the following three specific research tasks were undertaken:
(1)
Construction of a multimodal feature set: to address the heterogeneity of different modal data, we integrated multiple source signals (e.g., vibration signals, temperature signals) to construct a comprehensive and representative multimodal feature set for equipment condition characterization.
(2)
Design of a joint representation learning layer: Considering the complementarity and consistency among modalities, we designed a joint representation learning layer that combines orthogonal projection with a Transformer-based architecture. This enables the joint learning of multimodal features within a shared subspace, resulting in more generalizable and discriminative feature representations.
(3)
Development of a health state assessment model: we proposed a health state assessment model based on a ResNet, which effectively utilizes deep feature information to achieve the efficient and accurate recognition of equipment health states.

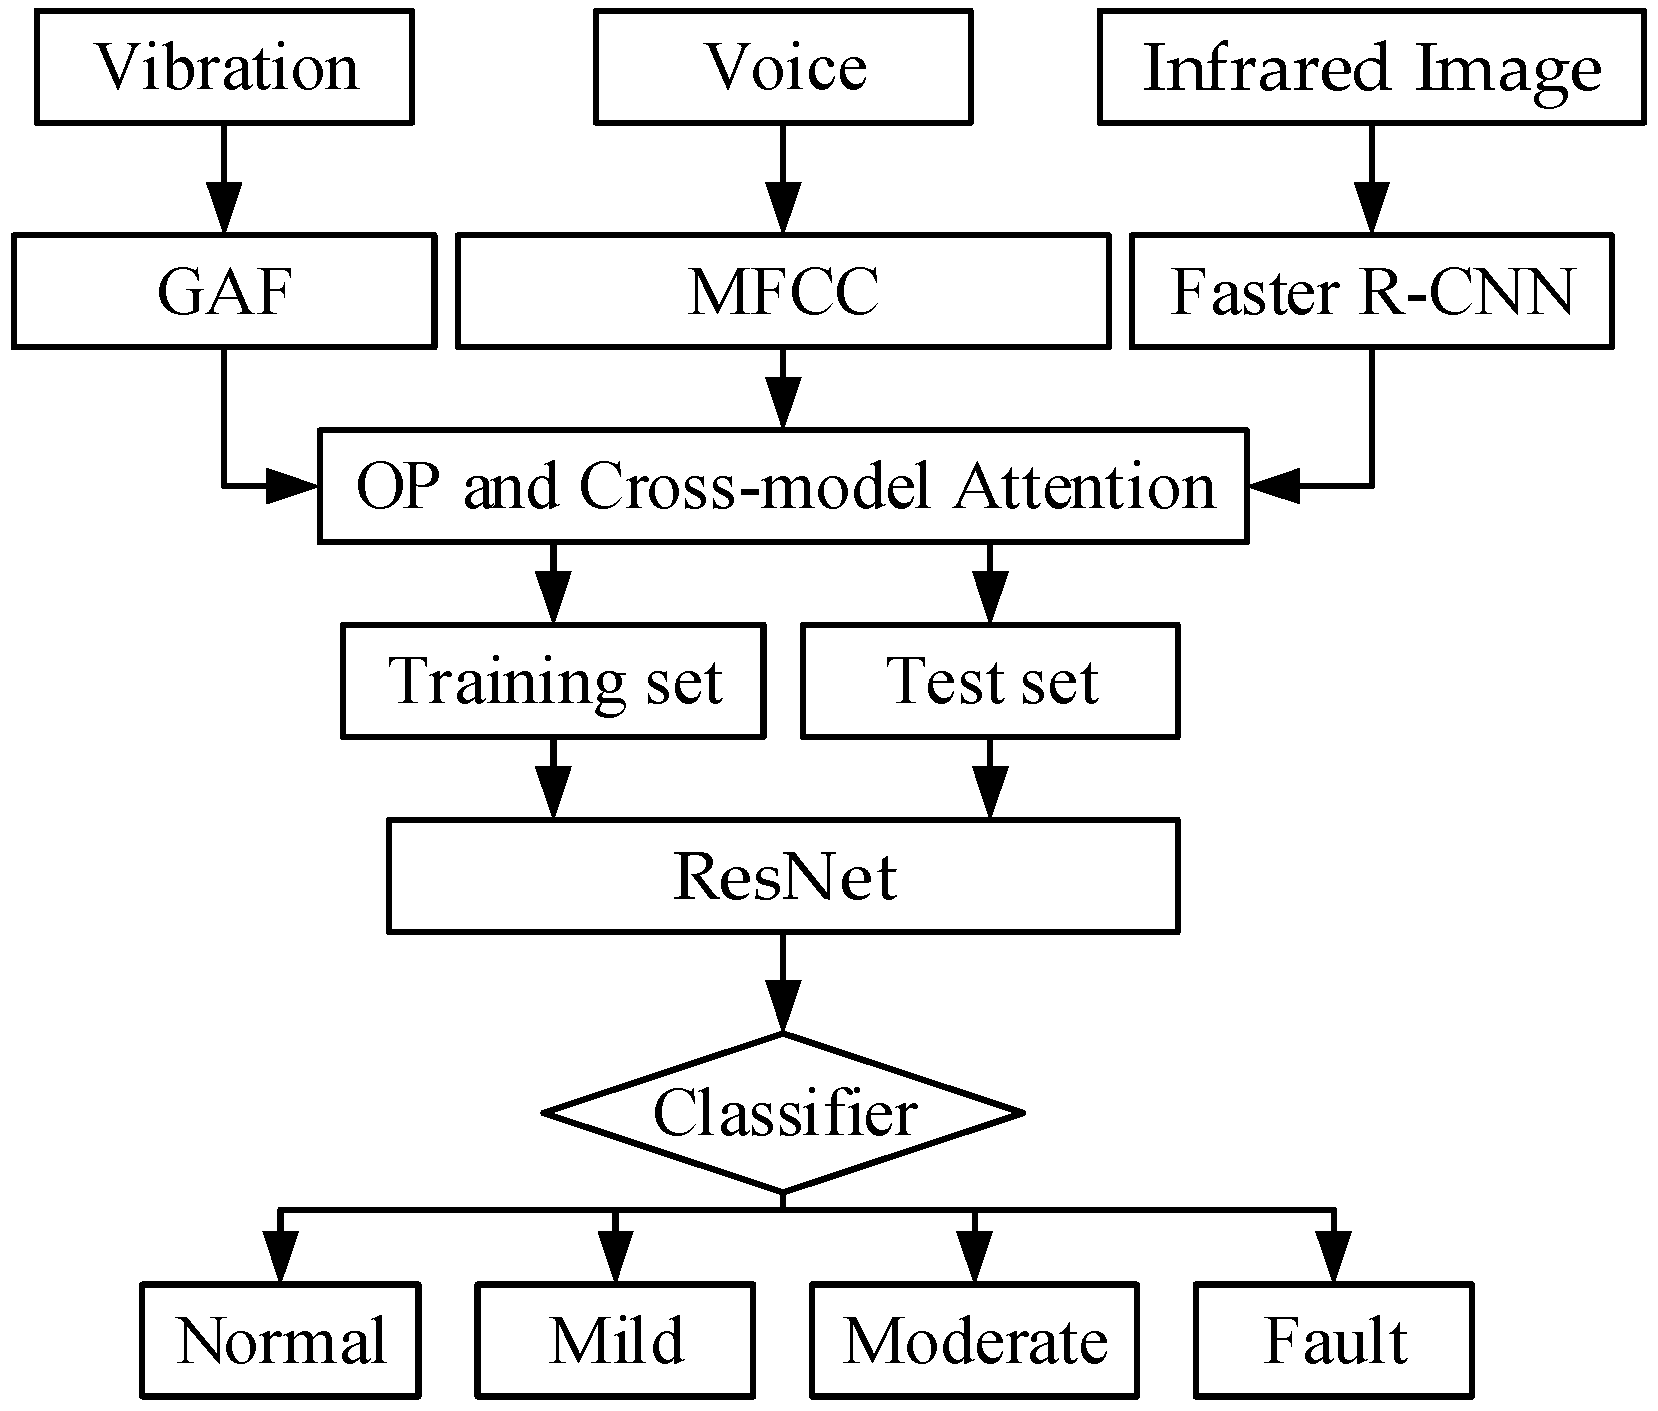
2. Multimodal Joint Representation Learning and Residual Neural Network-Based Health Status Recognition Method

Our goal is to obtain effective feature representations for health state recognition using vibration, sound, and image modal information. Initially, we extract features from vibration, sound, and image data using a GAF, MFCCs, and a Faster RCNN, respectively, to construct a comprehensive feature set. Considering the complementarity and consistency between modalities, we propose a joint representation learning layer that employs orthogonal projection in combination with the Transformer model. This approach enables the learning of more generalized feature representations within a shared subspace. Finally, the extracted features are input into a ResNet model for health state recognition. The overall architecture, as illustrated in Figure 1, consists of three main components: feature set construction, multimodal joint representation learning, and health state evaluation based on the residual neural network.

2.1. Single Modal Feature Construction Method

2.1.1. Vibration Signal Feature Extraction Based on GAF

The vibration signal of rotating machinery, represented as a one-dimensional time series, contains valuable feature information and is extensively used in fault detection and health state analysis. The GAF is a technique that transforms one-dimensional time series into two-dimensional images [33]. This method first normalizes the time series in the Cartesian coordinate system to a range of [−1, 1], then converts the scaled sequence into polar coordinates, and finally constructs a GAF matrix using trigonometric functions [34]. In this process, the time and amplitude of each point correspond to the radius and angle in the polar coordinate system, which effectively preserves the temporal correlation of the original signal and its features. The detailed encoding process is illustrated in Figure 2.
  • Data Normalization: since there is no significant disparity within the latent feature sequences, mean normalization is applied to map the data in the range of [−1, 1] without altering their inherent distribution characteristics.
  • Encoding Mapping in Polar Coordinates: after normalization, the latent feature sequence is re-encoded from Cartesian coordinates to polar coordinates using coordinate transformation formulas.
  • Gram Matrix Computation and Feature Map Construction: once converted to the polar coordinate system, the normalized latent feature sequence is used to compute a Gram matrix, where the correlations over different time intervals are represented using trigonometric sum or difference relationships between points.

2.1.2. Voice Signal Feature Extraction Based on MFCCs

The Mel frequency scale [35] characterizes the nonlinear perception of speech frequencies by the human ear. This is reflected in the Mel filter bank, where filters are denser at lower frequencies and sparser at higher frequencies, placing greater emphasis on the resolution of low-frequency signals. This allows for a more refined representation of both high- and low-frequency spectral features. As a result, MFCCs are particularly effective at extracting low-frequency acoustic features and are widely used in sound signal analysis, such as feature extraction, speech recognition, and voiceprint identification.
Human frequency perception is nonlinear, with individuals being more sensitive to low-frequency signals than high-frequency ones. The relationship between the Mel scale and the actual signal frequency F in the frequency domain is given by the following equation:
F m e l = 2595 lg ( 1 + f / 700 )
In the equation, F m e l represents the perceived frequency in Mel units, while f denotes the actual frequency in hertz (Hz).
After preprocessing, each frame of the sound signal undergoes a fast Fourier transform to obtain Y i ( k ) , and the spectral energy E i ( k ) of each frame of the sound signal is calculated.
Y i ( k ) = n = 0 N 1 y i ( n ) e j 2 π n k / N
E i ( k ) = Y i ( k ) 2
E i ( k ) is passed through Mel filter banks, and the logarithmic energy S i ( m ) of the output of the filter banks is calculated as follows, realizing the nonlinear Mel mapping of the frequency dimension and enhancing the features of low-frequency signals:
S i ( m ) = lg n = 0 N 1 E i ( k ) H i ( k ) , 0 m M
where H i ( k ) represents the response of the m-th filter in the Mel filter bank, and M denotes the total number of filters in the bank.
The l-th-order MFCC M ( l ) can be calculated from S i ( m ) using a Discrete Cosine Transform (DCT).
M ( i , l ) = 2 M n = 0 N 1 S i ( m ) cos ( π l ( 2 m 1 ) 2 M ) , 0 l L
where M ( i , l ) represents the i-th frame of l-th MFCC for sound signal.
In the case of most rotating machinery sound signals, the frequency range typically spans from a few hertz to several thousand hertz. The information carried by higher-order MFCCs is often negligible. Therefore, this paper uses a maximum Mel frequency of 8000 Hz and selects the first 13 MFCCs as feature extraction parameters for sound data.

2.1.3. Image Signal Feature Extraction Based on Faster R-CNN

For the image modality, we focus primarily on the thermal radiation intensity of the device. The preprocessed image is input into the Faster R-CNN [36] model. The Region Proposal Network (RPN) generates multiple potential Region of Interest (RoI) candidate boxes at each image location using a sliding window approach. We then combine the bounding box B of the target region with the feature representation x extracted by Faster R-CNN to obtain the image feature embedding z i l i × h i .
z i = A v g P o o l R o I A l i g n x , B
where RoIAlign extracts a fixed-size feature map based on the bounding box B. AvgPool is used to unify the length and width of the feature map. l i represents the sequence length of key frames, and h i represents the feature dimension of each frame.

2.2. Multimodal Joint Representation Learning

Modalities exhibit both complementarity and consistency. When information from multiple modalities is used together to represent a device’s state, it reflects intermodal consistency. Simultaneously, through the integration of vibration data with information from other modalities, a more comprehensive understanding of the device’s condition can be achieved, revealing the complementary characteristics between modalities. To this end, we have designed a multimodal joint representation learning method that incorporates orthogonal projection combined with a Transformer architecture, a joint representation learning layer, and modality-specific encoders. This framework is designed to learn both shared and unique features from vibration, acoustic, and visual data. Such representations provide a holistic perspective of multimodal information, laying the foundation for subsequent health status identification.

2.2.1. Orthogonal Projection

Our orthogonal projection can be described in the following steps (here, we set vibration as the target modality):
  • First, L2 normalization is applied to encode each sequence, obtaining z v t , z a t , and z i t , as well as z v t , z a t , and z i t . Then, we measure the correlation between the corresponding positions of two modality vectors by computing the dot product, as follows:
    C o r r v a t = z v t z a t
    C o r r v i t = z v t z i t
  • Second, we use the SoftMax operation to approximate the correlation between modality v and modality a (or i) at corresponding positions, as well as the correlation between each element in C o r r v a (or C o r r v i ) and modality v (or i).
    C o r r v a t = S o f t M a x ( C o r r v a t )
    C o r r v i t = S o f t M a x ( C o r r v i t )
  • Third, we perform a 1 − x operation on the correlation values (for each input x), returning 1 − x, performing subtraction at each position to obtain a dissimilarity vector. This vector measures the degree of difference between the two modality representations at corresponding positions. Then, we multiply the original representations ( z a t and z i t ) with these dissimilarity vectors to obtain the information components that are orthogonal to the target modality. These components eliminate redundant information between other modalities and the target modality, thereby preserving only the parts that are orthogonal to the target modality vector for further processing.
    O r t h v a t = z a t ( 1 C o r r v a t )
    O r t h v i t = z i t ( 1 C o r r v i t )
  • Then, these orthogonal components are added to the target modality, obtaining the fused latent adaptation from modality a and i to v. In this process, the original representation of modality v is preserved while incorporating complementary information from other modalities.
    M v t = O P ( z v t , z a t , z i t ) = z v t + O r t h v a t + O r t h v i t
  • After this, M v t can participate in the cross-attention process of the t-th encoder of modality v (serving as the source for K and V).

2.2.2. Joint Representation Learning Layer

With the aid of the orthogonal model, information from the other two modalities is incorporated (see Section 2.2.1). In this process, Q retains the information from the current modality, while the orthogonal projection model enriches it with information from the other modalities to form K and V. This joint representation layer facilitates the interaction of multimodal information at the same level and can be stacked multiple times to generate more hierarchical representations. For each modality, there are N cross-attention layers, and we define all modalities at the same hierarchical level as the joint representation layer, as illustrated in Figure 3.
To process inputs from the three modalities (vibration, sound, and image), we use a 1D temporal convolution layer to capture sequential information and adjust its dimension to fit the subsequent encoder. Then, the representations pass through N (N = 6) stacked joint representation layers to acquire additional information from other modalities. The forward process of our joint representation layer (t = 0, 1,…, N − 1) can be described as follows:
z v t + 1 = B a s i c _ B ( z v t W Q v t , M v t W K v t , M v t W V v t ) , M v t = O P M ( z v t , z a t , z i t )
z a t + 1 = B a s i c _ B ( z a t W Q a t , M a t W K a t , M a t W V a t ) , M a t = O P M ( z a t , z v t , z i t )
z i t + 1 = B a s i c _ B ( z i t W Q i t , M i t W K i t , M i t W V i t ) , M i t = O P M ( z i t , z v t , z a t )
where W Q m t , W K m t , and W V m t ( m ( v , a , i ) ) are the weights, and the input of Basic_B corresponds sequentially to the query (Q), key (K), and value (V) in the cross-attention mechanism.
In the final joint representation layer, the hidden states of the three modalities are input into three self-attention encoders, respectively, to obtain the final fused representation for each modality, containing both multimodal and self-attention information.

2.2.3. Modality-Specific Representation

After inputting the vibration feature z v , sound feature z a , and image feature z i into the joint representation learning layer, we obtain u v , u a , and u i , respectively. To learn the specific features of different modalities, we construct modality-specific encoders E P u v ; θ p v , E P u a ; θ p a , and E P u i ; θ p i for vibration, sound, and image, respectively. The encoders transform u v , u a , and u i into a unique feature space to obtain the specific features h p v , h p a , and h p i :
h p v = E P u v ; θ p v
h p a = E P u a ; θ p a
h p i = E P u i ; θ p i

2.2.4. Decoding

To ensure that the specific features obtained by the encoder preserve the essential properties of the original feature space, a decoder D h p m ; θ d is designed to take both the shared features and specific features as input, aiming to reconstruct the original feature space.
u v ^ = D h p v ; θ d
u a ^ = D h p a ; θ d
u i ^ = D h p i ; θ d
We use the mean squared error (MSE) to estimate the reconstruction error.
L r e c o n = 1 3 u v u v ^ 2 + u a u a ^ 2 + u i u i ^ 2 + λ 2 W 2
where 2 denotes the squared L2 norm, λ 2 W 2 is the regularization term to prevent overfitting, and W represents the decoder parameters.

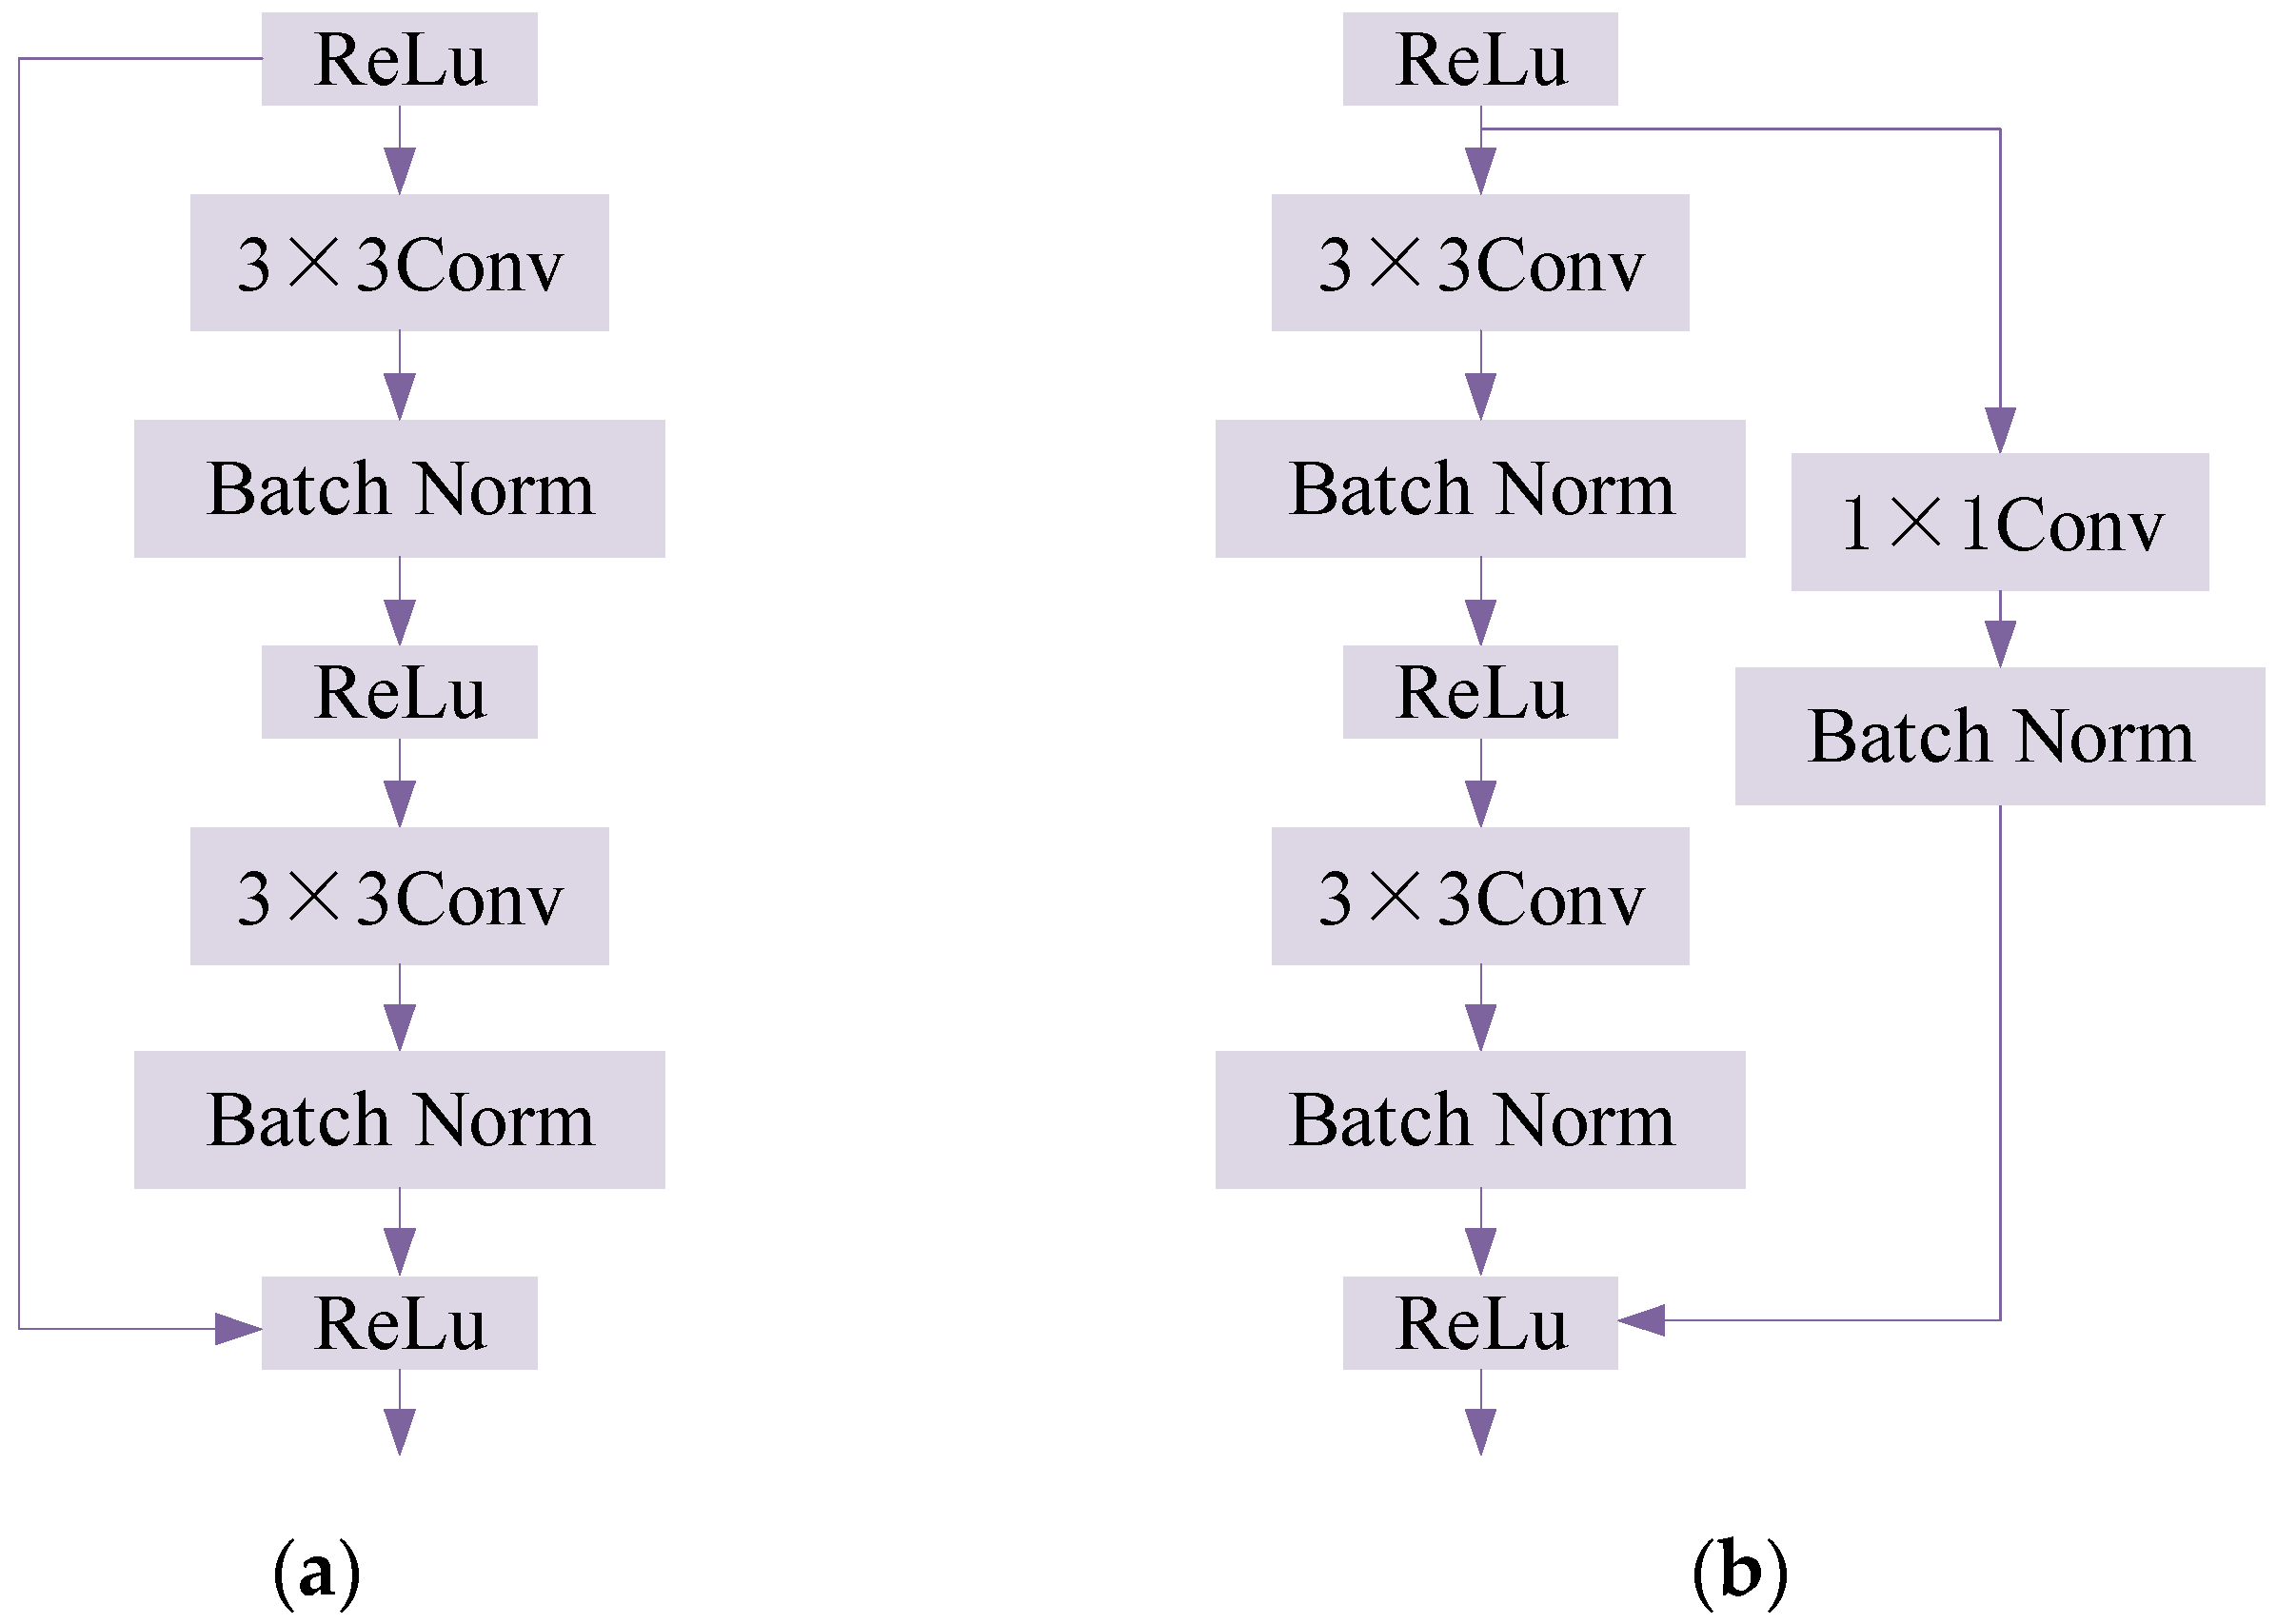
2.3. Health Condition Assessment Model Based on Residual Neural Network

In this paper, the classic ResNet18 [37,38] network structure is adopted to train new parameters for the classification and evaluation of the health state of rotating machinery. The residual network model for transfer learning outputs two types of residual blocks as shown in Figure 4.
The residual block is formulated as
y n = h ( x n ) + F ( x n , w n )
In the equation, y n represents the data passed to the next residual block; x n denotes the input data to the residual block; w n is the bias term; h ( x n ) represents the direct mapping of the residual block, facilitating the transfer transformation x n ; and F ( x n , w n ) signifies the convolutional network processing within the residual block, enabling the transfer transformation x n .
ResNet18 is a typical residual network model, aiming to avoid the problem of network degradation by learning the features of the first two layers of the network. Even if the residual is 0, the performance of the residual network can still remain stable. In fact, the absolute value of the residual is usually greater than 0, which also enables the stacked layers to learn new features on the basis of the input features, thereby achieving better performance. The typical structure of the ResNet18 network consists of two residual blocks outputting through the activation function (Relu), combined with the residual structure to output the activation layer (+ Relu) and pass it back. Among the two residual blocks, one is the identity mapping residual block, which includes two convolutional layers processed with a convolution kernel (Conv) of 3 and a padding of 1 (Figure 4a); the other is the downsampling convolution mapping residual block, which uses a 1 × 1 convolution kernel to perform a convolution transformation on the input (Figure 4b).
Based on the identity mapping residual block and the downsampling convolution mapping residual block, a deep residual network model is constructed for identifying the health status of equipment. The model contains a total of eight layers of network, including one convolutional layer, one identity mapping residual block, two downsampling convolution mapping residual blocks, one BN + GeLu, one dropout layer, one GAP, and one SoftMax layer. The sample set is processed in batches. To prevent overfitting, a dropout is added to the dense layer of the network here, and its value is set to 0.75. Combined with the SoftMax classifier, the mapping of the sample label space is achieved, and four label spaces are output. The sparse categorical cross-entropy is selected as the loss function, and the Adam algorithm is used as the optimizer. Its learning rate is 0.001, the epoch is 50, and the batch size is 64.

2.4. Model Evaluation Metrics

To illustrate the performance of the model, the evaluation metrics selected include the model’s recognition accuracy, loss value, recall rate, precision rate, F1-score, and confusion matrix. Accuracy represents the proportion of correctly identified samples among all classification results; the loss value indicates the error of the model; the recall rate is the proportion of correctly predicted positive samples out of all actual positive samples; the precision rate is the proportion of samples with true labels matching a particular state among all predicted samples for that state; the F1-score represents the harmonic mean of precision and recall; and the confusion matrix provides a detailed display of the recognition results for each state, showing correctly identified results, incorrect results, and the specific states with which they were incorrectly identified. The values on the diagonal of the matrix represent the number and proportion of correctly identified instances, while the off-diagonal values indicate the number and proportion of instances incorrectly identified as a particular state. The specific parameter descriptions are detailed in Table 1.
The formulas involved in these calculations are as follows:
A ccuracy = T P + T N T P + F P + F N + T N
Re c a l l = T P T P + F N
Pr e c i s i o n = T P T P + F P
F 1 s c o r e = 2 Pr e c i s i o n Re c a l l Pr e c i s i o n + Re c a l l

3. Example Analysis and Experiment

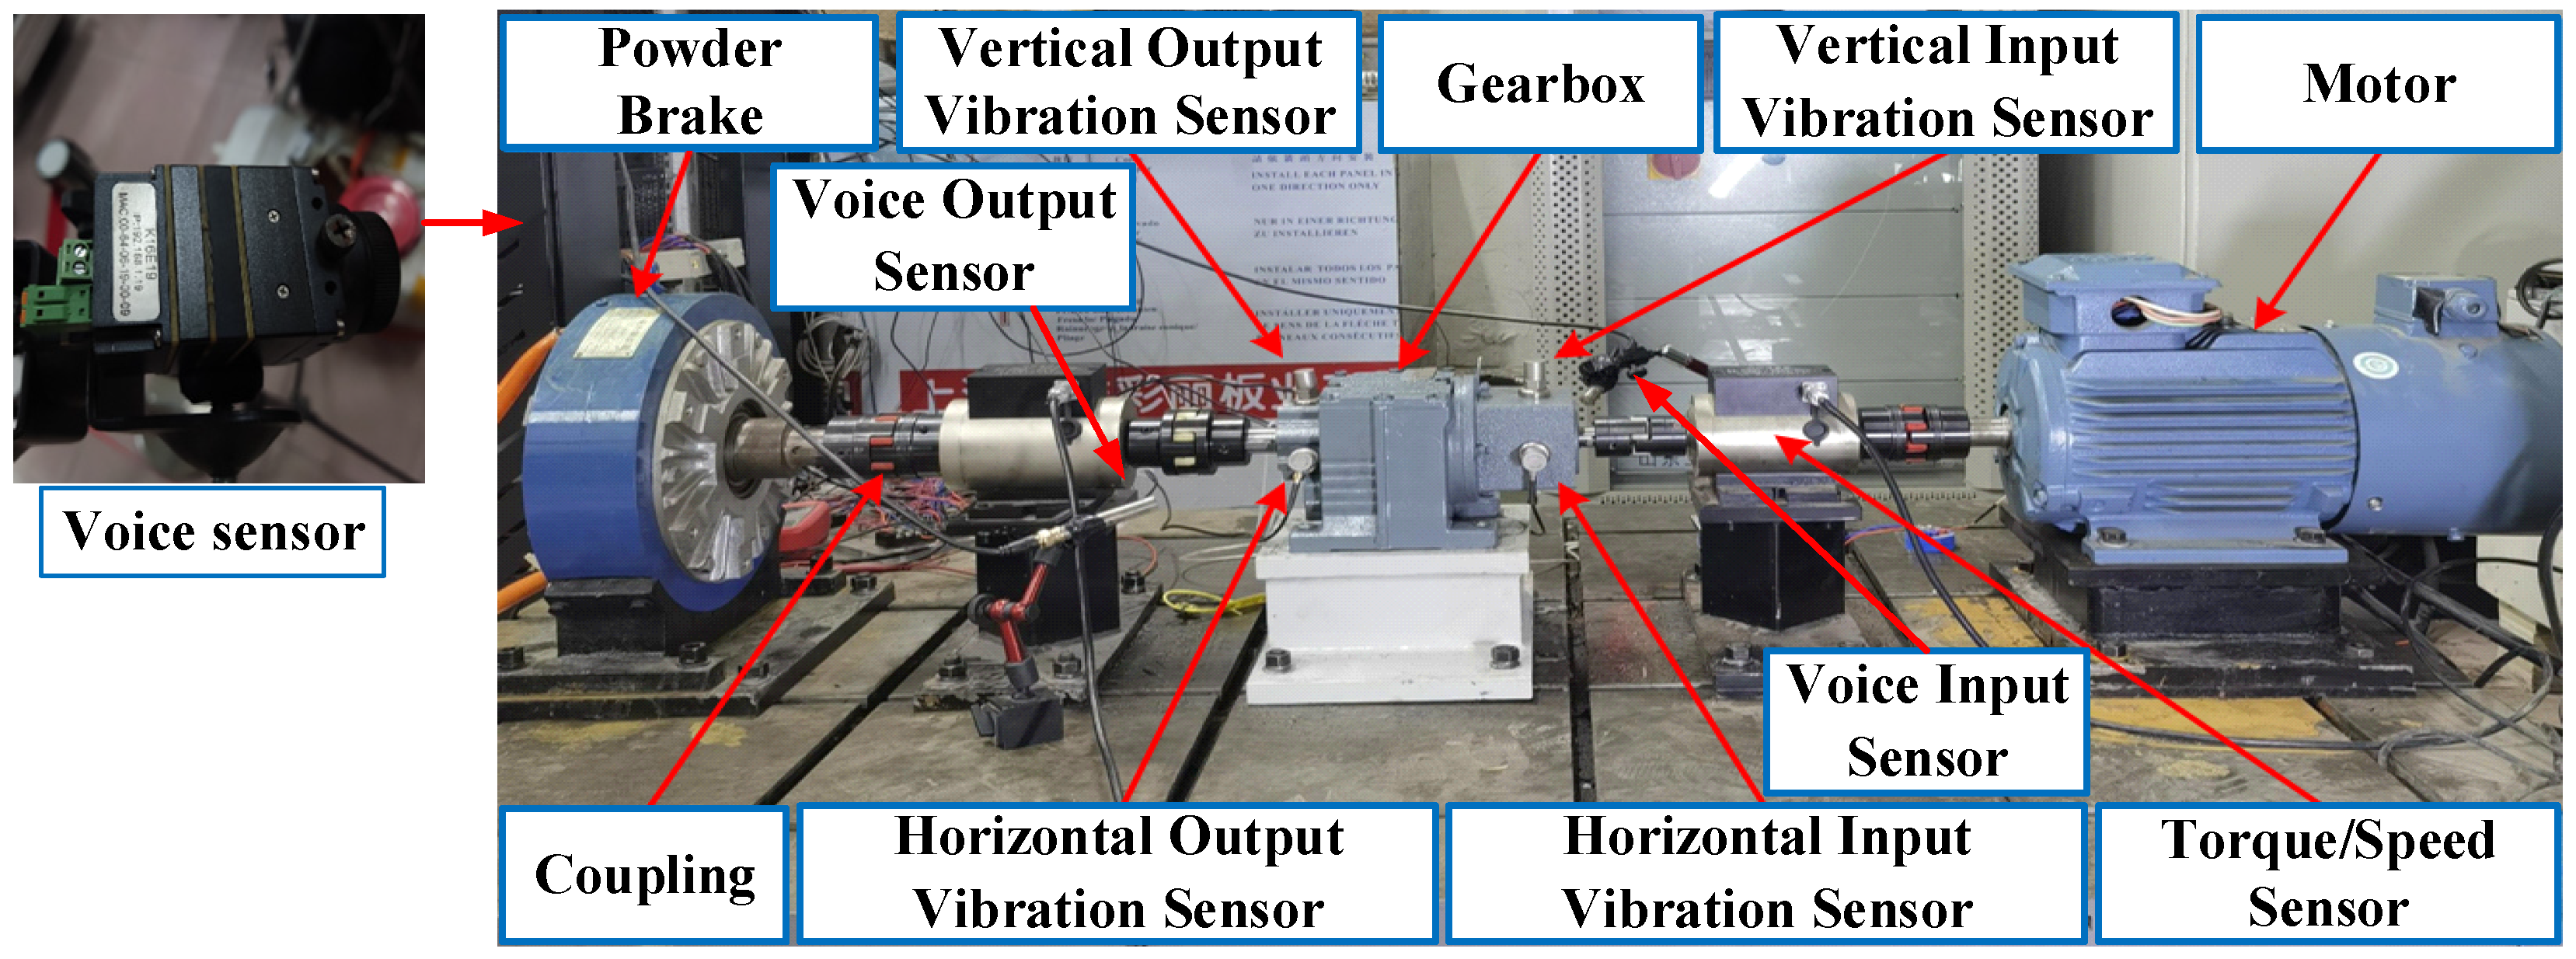
3.1. Platform Introduction

To verify the effectiveness of the proposed method, a rotational machinery (reducer) experimental platform was built. This platform mainly consists of an AC motor, a gear reducer, a powder brake, a coupling, and various sensors. Through the installation of speed, vibration, sound, and infrared sensors, real signals from the reducer’s operation are collected. The specific types and installation positions of the sensors are shown in Figure 5.
The experiment used the QABP100L4A model electric motor (Shanghai Yaqi Electric Co., Ltd., Shanghai, China), the MCC USB-1608FS-Plus data acquisition card (Measurement Computing Corp (MCC), Norwood, MA, USA), and the CZ-20 magnetic powder brake (Hai’an County Aerospace Electromechanical Manufacturing Co., Ltd., Haian City, China). The reducer is a three-stage helical gear reducer with a safety factor of 0.79. The entire experiment was conducted under constant speed and rated load conditions.
In this paper, the following seven parameters were selected as the data basis for gearbox health condition monitoring and identification. The sampling frequency, sampling interval, and sampling duration were set to 20,480 Hz, 30 s, and 1 s, respectively. The experiment was conducted using the horizontal vibration signal at the input end, the sound signal of the input shaft, and infrared images. The specific experimental data parameters and their units are listed in Table 2. The sensors used in the experiment are described in Table 3.

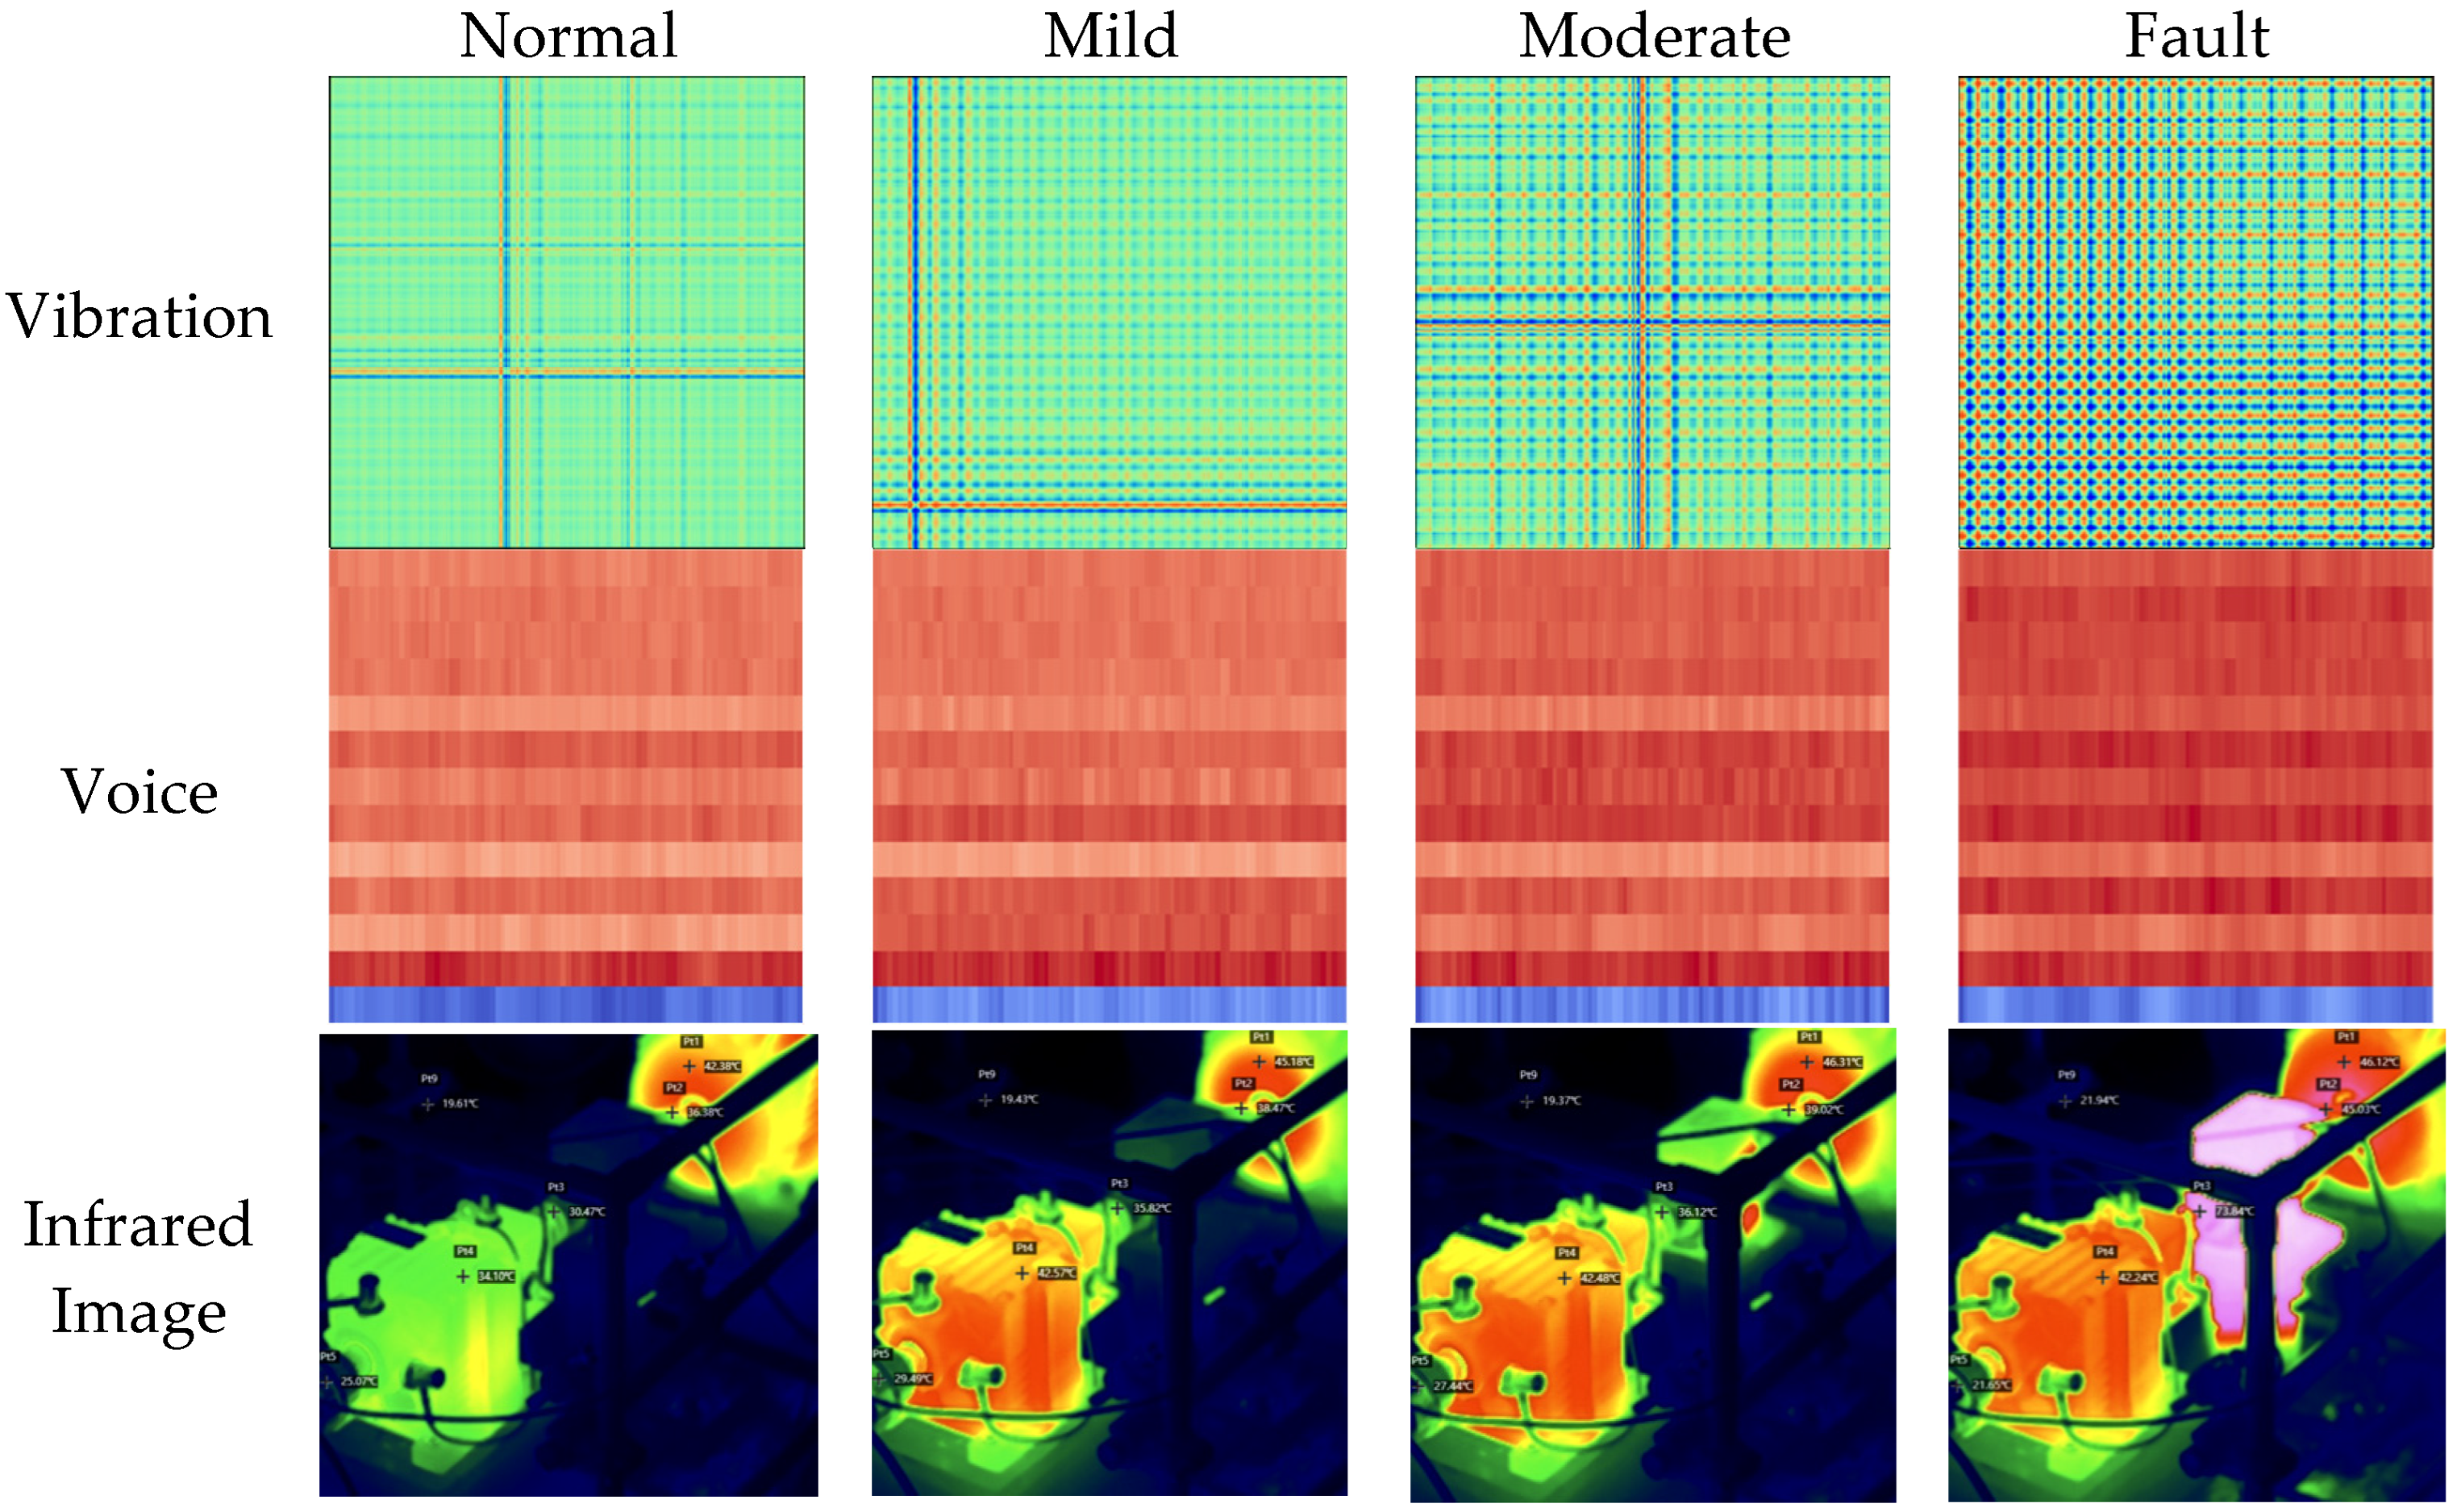
3.2. Feature Set Construction

The international standard ISO 10816-1:1995 [39] provides an industry benchmark based on the magnitude of mechanical vibrations. According to this standard, when the RMS value of vibration signals for small machinery exceeds 1.8, the equipment is considered to be in a dangerous state. Given the ambiguity and unclear boundaries between different condition levels, the Fuzzy C-Means (FCM) clustering algorithm was applied to cluster the RMS values of input shaft vibrations. According to a review of the domestic and international literature on equipment health assessment [40], the health status of rotating machinery is typically categorized into four levels. Therefore, the number of clusters was set to 4. Based on the clustering results and the industry standard, the final classification of the gearbox’s health condition is shown in Figure 6.
Detailed descriptions of each health status level are presented in Table 4.
Based on the aforementioned classification, the label information for multimodal samples is constructed, culminating in a total sample size of 8382. This includes 5192 samples in the normal state, 895 samples in the mild state, 494 samples in the moderate state, and 1801 samples in the fault state. The sample construction integrates the GADF, MFCCs, and the Faster RCNN. The multimodal sample sets under different states are illustrated in Figure 7.

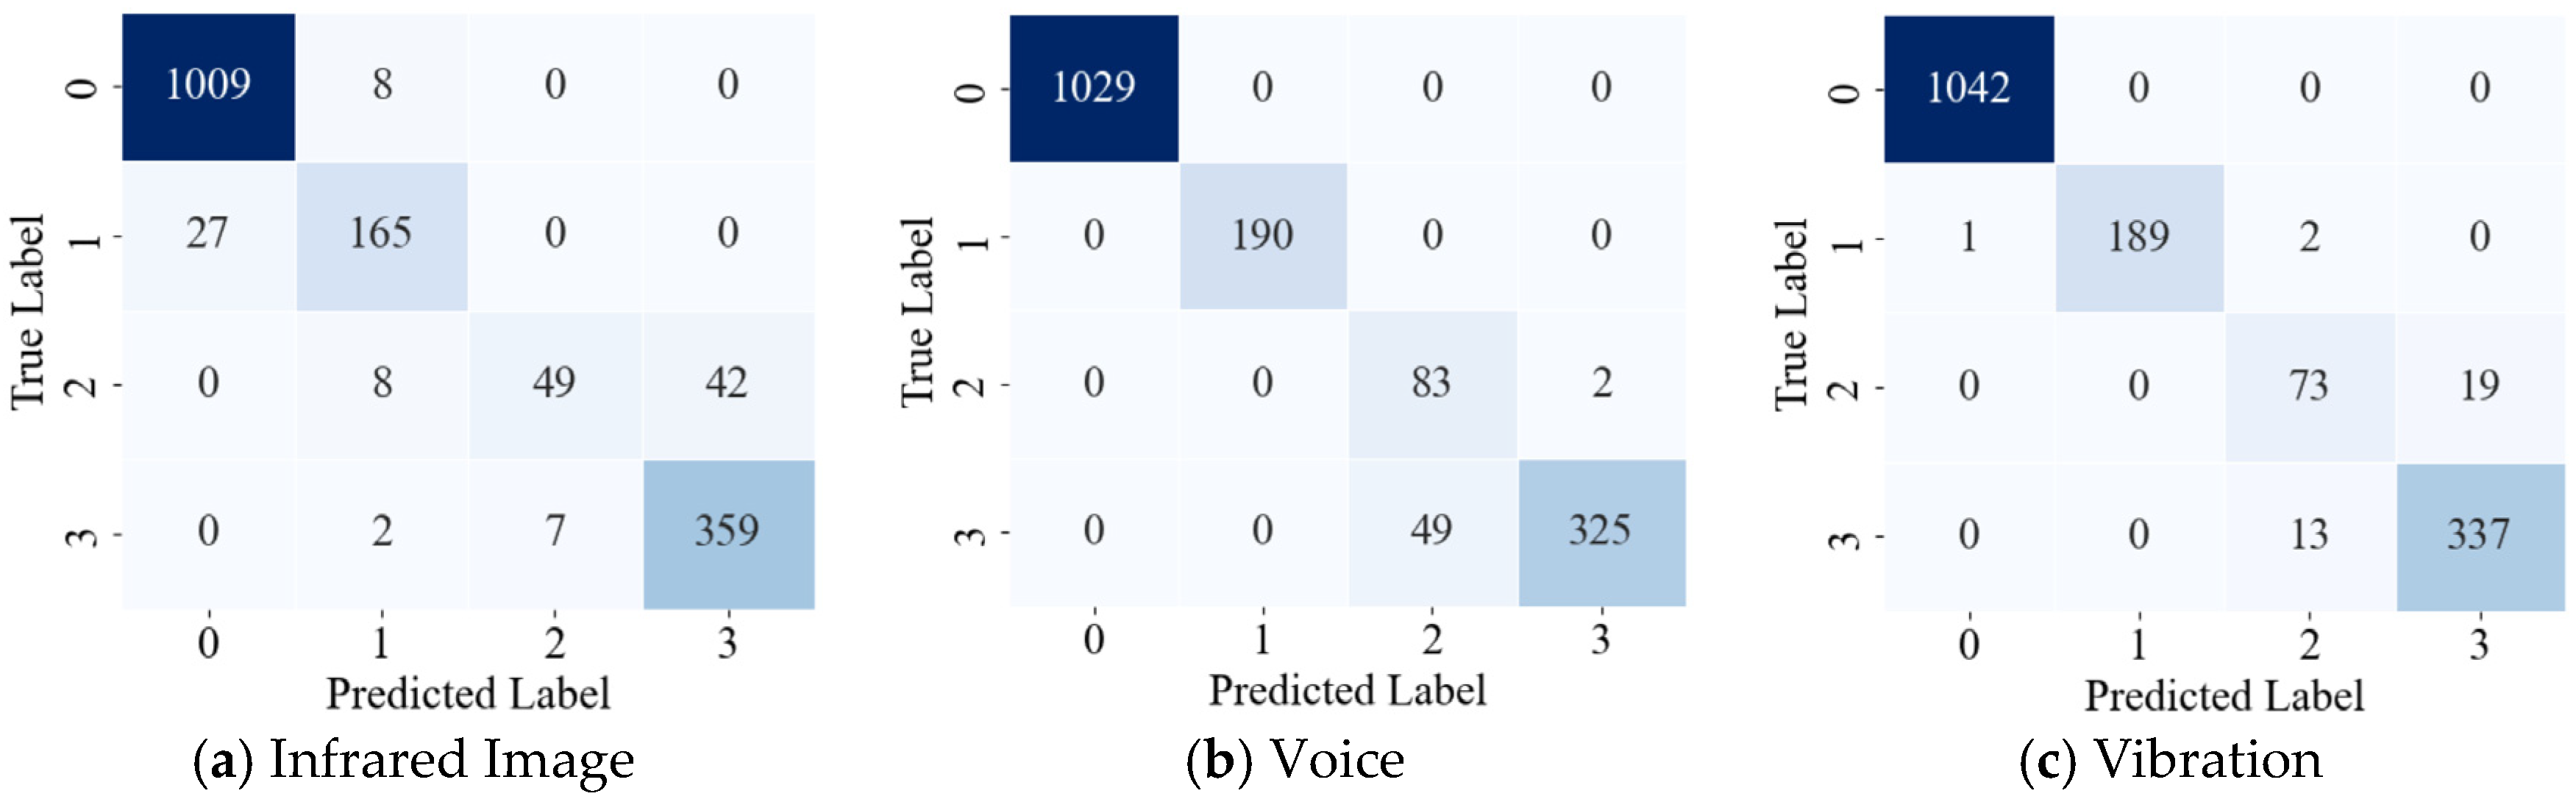
3.3. Experimental Validation

All experiments in this paper are based on the following environment configuration: 13th Gen Intel (R) Core (TM) i9-13900HX processor, 16 GB memory (Intel, Santa Clara, CA, USA), NVIDIA GeForce RTX 3060 GPU (Nvidia, Santa Clara, CA, USA), CUDA version 12.6.65, Python 3.9.1, Pytorch 2.0.0+cu118, MATLAB R2019a, and Windows 10 Professional Edition operating system. The specific experimental process is shown in Figure 8.
All samples were divided into five equal parts, and 5-fold cross-validation was used for experimental verification. The total number of samples is 8382, with 80% (6706) used as the training set and the remaining 20% (1676) as the test set in each fold. The confusion matrix on the test set is shown in Figure 9.
As shown in Figure 9, the test set consists of 1676 samples, including 1034 samples in the “normal” state, 201 samples in the “mild degradation” state, 95 samples in the “moderate degradation” state, and 346 samples in the “fault” state. Due to the similarity between late-stage moderate degradation samples and fault samples, the model tends to misclassify these two states. Ultimately, the model achieves an accuracy of 99.64% and an error rate of 0.36%.
The choice of different optimizers affects the model’s recognition efficiency. To compare their performance, a contrast experiment was conducted using various optimizers. The standard deviation (SD) was used as the evaluation criterion to measure the standard error in each training iteration. A smaller SD value indicates higher model stability. The recognition loss and accuracy curves during model training are shown in Figure 10 and Figure 11, where the shaded areas represent the standard error bands.
As shown in Figure 10 and Figure 11, the Adam optimizer outperforms SGD and Adadelta in terms of model convergence speed and accuracy, as evidenced by the smallest shaded area, indicating the most stable model training process.

3.4. Method Comparison

To better validate the effectiveness of the proposed multimodal representation method, we input the vibration, sound, and image features (after feature representation) into a ResNet. The training and testing of the samples were conducted, and the recognition accuracy and average loss value for each modality on the test set were compared. The results are shown in Figure 12 and Figure 13.
As shown in Figure 12 and Figure 13, when the image modality is used as input, the model achieves the lowest recognition accuracy. This phenomenon occurs because the temporal information in the image modality is not fully represented. When the vibration modality is used as input, the model’s recognition accuracy and loss values are closest to those of the multimodal input. However, the multimodal approach achieves a higher average recognition accuracy than the vibration modality. The confusion matrix for the recognition results of different modality performances is shown in Figure 14.
As shown in Figure 9 and Figure 14, the recognition performance of the four compared modalities is arranged in ascending order as follows: image, sound, vibration, and multimodal. Additionally, in the confusion matrix in Figure 14, it can be observed that among the misclassified health states, the early degradation state is most often misclassified as the healthy state. This is because the feature changes in the early degradation stage are relatively subtle, making it harder to distinguish. On the other hand, the fault state has the highest recognition rate, as its feature differences are more pronounced, making it easier for the model to accurately identify.
The comparison of average recognition accuracy, average precision, average recall, and other evaluation metrics for different modalities (vibration, sound, image, and multimodal) is presented in Table 5.
As shown in Table 3, although the sound modality achieves relatively high recognition accuracy, its training speed is slower. The vibration modality has a recognition accuracy close to the multimodal approach, but it requires a longer training time. In contrast, the multimodal approach not only maintains high recognition accuracy and low loss values but also exhibits a faster convergence speed, making it the superior choice in terms of both efficiency and performance.

4. Discussion

The proposed multimodal joint representation learning method integrated with a residual neural network demonstrates superior performance in rotating machinery health state recognition compared to traditional methods. The model effectively addresses the challenges of multimodal signal fusion, achieving a recognition accuracy of 99.64% on the gearbox dataset—outperforming single-modality baselines such as image (94.39%), sound (96.96%), and vibration (97.91%). These results underscore the critical role of multimodal fusion in enhancing classification accuracy.
The incorporation of residual connections further mitigates the vanishing gradient issue in deep networks, enabling the model to maintain high accuracy while reducing computational complexity and parameter count. Despite its effectiveness under controlled experimental conditions, the model may encounter limitations in complex environments characterized by variable and multiple operating conditions.
Future research will focus on the following: (1) extending the model to variable and multi-condition scenarios to enhance robustness and generalizability; (2) adopting transfer learning or self-supervised learning to address performance degradation due to insufficient labeled data; and (3) introducing lightweight architectural designs to meet the real-time and resource constraints of edge computing and other practical applications.

5. Conclusions

This study presents a multimodal joint representation learning and residual neural network-based method for rotating machinery health state recognition. The approach achieves outstanding accuracy (99.64%) and computational efficiency, effectively overcoming the limitations of single-modality features and reducing false alarms. The proposed method demonstrates significant potential for industrial applications. Future work will aim to further improve the model’s generalization under variable working conditions and promote its deployment in real-world settings through transfer learning and self-supervised learning strategies.

Author Contributions

Study conception and design: X.C.; Data collection: K.S.; Analysis and interpretation of results: K.S.; Draft manuscript preparation: X.C. All authors have read and agreed to the published version of the manuscript.

Funding

This work was supported by the Natural Science Foundation of National Natural Science Foundation of China (Nos. 52274158) and Shaanxi Provincial Science and Technology Plan Project: Research and Application Demonstration of Intelligent Operation and Maintenance Large Model Technology for Complete Coal Mining Equipment (Project Number: 2024QY2-GJHX-09, 2024.11.01-2027.10.31).

Institutional Review Board Statement

Not applicable.

Informed Consent Statement

Not applicable.

Data Availability Statement

The data and materials used in this research are available upon reasonable request to the corresponding author. The data are not publicly available due to privacy concerns.

Conflicts of Interest

The authors declare no conflicts of interest.

Abbreviations

The following abbreviations are used in this manuscript:
GAFGramian Angular Field
MFCCsMel-Frequency Cepstral Coefficients
RCNNRegion-based Convolutional Neural Network
ESExpert System
AHPAnalytic Hierarchy Process
AdaBNAdaptive Batch Normalization
M2FNMultimodal to Fusion Network
GASFGramian Angular Summation Field
GADFGramian Angular Difference Field
ResNetResidual Neural Network
TPTrue Positive
FPFalse Positive
FNFalse Negative
TNTrue Negative
DCTDiscrete Cosine Transform
RPNRegion Proposal Network
RoIRegion of Interest
MSEMean Squared Error
FCMFuzzy C-Means
SDStandard Deviation

References

  1. Zhou, F.; Shen, J.; Yang, X.; Liu, X.; Liu, W. Modified hierarchical multiscale dispersion entropy and its application to fault identification of rotating machinery. IEEE Access 2020, 8, 161361–161376. [Google Scholar] [CrossRef]
  2. Luo, P.; Hu, N.; Zhang, L.; Shen, J.; Cheng, Z. Improved phase space warping method for degradation tracking of rotating machinery under variable working conditions. Mech. Syst. Signal Process. 2021, 157, 107696. [Google Scholar] [CrossRef]
  3. Sotnik, S.; Deineko, Z.; Lyashenko, V. Key Directions for Development of Modern Expert Systems. Int. J. Eng. Inf. Syst. 2022, 6, 4–10. [Google Scholar]
  4. Kafeel, A.; Aziz, S.; Awais, M.; Khan, M.A.; Afaq, K.; Idris, S.A. An expert system for rotating machine fault detection using vibration signal analysis. Sensors 2021, 21, 7587. [Google Scholar] [CrossRef]
  5. Degroff, J.; Hou, G.J.W. Fault Tree Analysis for Robust Design. Designs 2025, 9, 19. [Google Scholar] [CrossRef]
  6. Chen, K.; Chen, H.; Bisantz, A.; Shen, S.; Sahin, E. Where failures may occur in automated driving: A fault tree analysis approach. J. Cogn. Eng. Decis. Mak. 2023, 17, 147–165. [Google Scholar] [CrossRef]
  7. Abdulhamid, A.; Rahman, M.M.; Kabir, S.; Ghafir, I. Enhancing safety in iot systems: A model-based assessment of a smart irrigation system using fault tree analysis. Electronics 2024, 13, 1156. [Google Scholar] [CrossRef]
  8. Chorol, L.; Gupta, S.K. Evaluation of groundwater heavy metal pollution index through analytical hierarchy process and its health risk assessment via Monte Carlo simulation. Process Saf. Environ. Prot. 2023, 170, 855–864. [Google Scholar] [CrossRef]
  9. Ma, L.; Li, N.; Zhu, P.; Tang, K.; Khan, A.; Wang, F.; Yu, G. A novel fuzzy neural network architecture search framework for defect recognition with uncertainties. IEEE Trans. Fuzzy Syst. 2024, 32, 3274–3285. [Google Scholar] [CrossRef]
  10. Wei, F.F.; Chi, T.; Chen, X. A multi-feature fusion and situation awareness-based method for fatigue driving level determination. Electronics 2023, 12, 2884. [Google Scholar] [CrossRef]
  11. Guo, L.; Wang, T.; Dong, X.; Zhang, P.; Zeng, H.; Zhang, J. A Dynamic Cloud Center of Gravity Model for Real-Time System-Level Health Status Assessment of Intelligent Ship. J. Mar. Sci. Eng. 2025, 13, 384. [Google Scholar] [CrossRef]
  12. Ren, L.; Ma, H.; Zhou, W.; Huang, S.; Wu, X. A Condition Monitoring Method of Hydraulic Gear Pumps Based on Multilevel Mechanism-Data Fusion. Int. J. Aerosp. Eng. 2024, 2024, 5587168. [Google Scholar]
  13. Yang, L.; He, X.; Zhang, C.; Lai, X.; Li, J.; Song, X. Crack identification driven by the fusion of mechanism and data for the variable-cross-section cantilever beam. Mech. Syst. Signal Process. 2023, 196, 110320. [Google Scholar]
  14. Liu, W.; Xu, J.; Dong, J. A state estimation method for multisensor uncertain systems based on sequential fusion and zonotope. IEEE Sens. J. 2023, 23, 13301–13310. [Google Scholar]
  15. Wu, D.; Zhong, X.; Peng, X.; Hu, H.; Liu, Q. Multimodal information fusion for high-robustness and low-drift state estimation of UGVs in diverse scenes. IEEE Trans. Instrum. Meas. 2022, 71, 8505115. [Google Scholar]
  16. Nisha, A.S.; Manohar, C.S. Dynamic state estimation in nonlinear stiff systems using implicit state space models. Struct. Control. Health Monit. 2022, 29, e2959. [Google Scholar]
  17. Duan, Y.; Cao, X.; Zhao, J.; Li, M.; Yang, X. A Spatiotemporal Fusion Autoencoder-Based Health Indicator Automatic Construction Method for Rotating Machinery Considering Vibration Signal Expression. IEEE Sens. J. 2023, 23, 24822–24838. [Google Scholar]
  18. Ong, P.; Tan, Y.K.; Lai, K.H.; Sia, C.K. A deep convolutional neural network for vibration-based health-monitoring of rotating machinery. Decis. Anal. J. 2023, 7, 100219. [Google Scholar] [CrossRef]
  19. Singh, M.; Kumar, S.; Nandan, D. Faulty voice diagnosis of automotive gearbox based on acoustic feature extraction and classification technique. J. Eng. Res. 2023, 11, 100051. [Google Scholar]
  20. Park, J.; Kim, Y.; Na, K.; Youn, B.D.; Chen, Y.; Zuo, M.J.; Bae, Y.C. An image-based feature extraction method for fault diagnosis of variable-speed rotating machinery. Mech. Syst. Signal Process. 2022, 167, 108524. [Google Scholar]
  21. Kong, Y.; Han, Q.; Chu, F. Sparsity assisted intelligent recognition method for vibration-based machinery health diagnostics. J. Vib. Control 2022, 29, 4230–4241. [Google Scholar]
  22. Storti, G.; Martini, V.; Okabe, E.P.; Machado, T.H.; Cavalca, K.L. Enhancing Structural Health Monitoring Through Automatic Modal Parameter Identification for Rotating Machinery on Flexible Foundation Structures. Lect. Notes Civ. Eng. 2024, 514, 196–208. [Google Scholar]
  23. Fan, H.; Ren, Z.; Zhang, X.; Cao, X.; Ma, H.; Huang, J. A gray texture image data-driven intelligent fault diagnosis method of induction motor rotor-bearing system under variable load conditions. Measurement 2024, 233, 114742. [Google Scholar]
  24. Fan, H.; Ren, Z.; Cao, X.; Zhang, X.; Huang, J. A GTI&Ada-act LMCNN method for intelligent fault diagnosis of motor rotor-bearing unit under variable conditions. IEEE Trans. Instrum. Meas. 2024, 73, 3508314. [Google Scholar]
  25. Babak, V.; Babak, S.; Zaporozhets, A. Stochastic Models of Diagnostic Signals Arising During the Operation of Electrical Equipment. In Statistical Diagnostics of Electric Power Equipment; Springer Nature: Cham, Switzerland, 2024; Volume 571, pp. 75–122. [Google Scholar]
  26. Ma, Y.; Wen, G.; Cheng, S.; He, X.; Mei, S. Multimodal convolutional neural network model with information fusion for intelligent fault diagnosis in rotating machinery. Meas. Sci. Technol. 2022, 33, 125109. [Google Scholar]
  27. Babak, V.; Zaporozhets, A.; Kuts, Y.; Fryz, M.; Scherbak, L. Identification of Vibration Noise Signals of Electric Power Facilities. In Noise signals: Modelling and Analyses; Springer Nature: Cham, Switzerland, 2024; Volume 567, pp. 143–170. [Google Scholar]
  28. Wu, Z.; Xu, R. A Modal Fusion Deep Clustering Method for Multi-sensor Fault Diagnosis of Rotating Machinery. J. Electron. Inf. Technol. 2025, 47, 244–259. [Google Scholar]
  29. Cao, X.; Li, Y.; Yu, K.; Zhang, Y. Integrated Multimodal Fault Diagnosis of Industrial Gearboxes Using Vibration Signals and Infrared Thermal Imaging. In Proceedings of the 2024 Global Reliability and Prognostics and Health Management Conference, Beijing, China, 11–13 October 2024; pp. 1–5. [Google Scholar]
  30. Tong, J.; Liu, C.; Zheng, J.; Pan, H. Multi-sensor information fusion and coordinate attention-based fault diagnosis method and its interpretability research. Eng. Appl. Artif. Intell. 2023, 124, 106614. [Google Scholar]
  31. Cui, J.; Xie, P.; Wang, X.; Wang, J.; He, Q.; Jiang, G. M2FN: An end-to-end multi-task and multi-sensor fusion network for intelligent fault diagnosis. Measurement 2022, 204, 112085. [Google Scholar]
  32. Xu, Y.; Feng, K.; Yan, X.; Yan, R.; Ni, Q.; Sun, B.; Lei, Z.; Zhang, Y.; Liu, Z. CFCNN: A novel convolutional fusion framework for collaborative fault identification of rotating machinery. Inf. Fusion 2023, 95, 1–16. [Google Scholar]
  33. Chen, J.; Duan, N.; Zhou, X.; Wang, Z. Diagnostic Model for Transformer Core Loosening Faults Based on the Gram Angle Field and Multi-Head Attention Mechanism. Appl. Sci. 2024, 14, 10906. [Google Scholar] [CrossRef]
  34. Song, N.; Du, S.; Wu, Z.; Zhong, L.; Yang, L.T.; Yang, J.; Wang, S. GAF-Net: Graph attention fusion network for multi-view semi-supervised classification. Expert Syst. Appl. 2024, 238, 122151. [Google Scholar]
  35. Cabrera, D.; Medina, R.; Cerrada, M.; Sánchez, R.V.; Estupiñan, E.; Li, C. Improved Mel Frequency Cepstral Coefficients for Compressors and Pumps Fault Diagnosis with Deep Learning Models. Appl. Sci. 2024, 14, 1710. [Google Scholar] [CrossRef]
  36. Yan, S.; Chen, P.; Liang, S.; Zhang, L.; Li, X. Target Detection in Infrared Image of Transmission Line Based on Faster-RCNN. In International Conference on Advanced Data Mining and Applications; Springer International Publishing: Cham, Switzerland, 2022; pp. 276–287. [Google Scholar]
  37. Jia, Y.; Dong, L.; Qi, J.; Li, Q. Research on Improving ResNet18 for Classifying Complex Images Based on Attention Mechanism. In China Intelligent Networked Things Conference; Springer Nature: Singapore, 2024; pp. 123–139. [Google Scholar]
  38. Cao, X.; Xu, X.; Duan, Y.; Yang, X. Health Status Recognition of Rotating Machinery Based on Deep Residual Shrinkage Network under Time-varying Conditions. IEEE Sens. J. 2022, 22, 18332–18348. [Google Scholar]
  39. Blake, M.P.; Mitchel, W.S. Vibration and Acoustic Measurement; Spartan Books: New York, NY, USA, 1972. [Google Scholar]
  40. Rai, A.; Upadhyay, S.H. An integrated approach to bearing prognostics based on EEMD-multi feature extraction, Gaussian mixture models and Jensen-Rényi divergence. Appl. Soft Comput. 2018, 71, 36–50. [Google Scholar]
Figure 1. Main architecture.
Applsci 15 04049 g001
Figure 2. Gramian Angle Field conversion process.
Applsci 15 04049 g002
Figure 3. Joint representation learning layer.
Applsci 15 04049 g003
Figure 4. Residual block structure of the ResNet18 network: (a) identity mapping residual block; (b) downsampling convolutional mapping residual block.
Applsci 15 04049 g004
Figure 5. Reducer experimental platform.
Applsci 15 04049 g005
Figure 6. The health status index of the gearbox is constructed.
Applsci 15 04049 g006
Figure 7. Construction of multimodal sample set for different states.
Applsci 15 04049 g007
Figure 8. Experimental process.
Applsci 15 04049 g008
Figure 9. Confusion matrix.
Applsci 15 04049 g009
Figure 10. Comparison of recognition loss for different optimizers.
Applsci 15 04049 g010
Figure 11. Comparison of recognition accuracy for different optimizers.
Applsci 15 04049 g011
Figure 12. Comparison of recognition accuracy for different modalities.
Applsci 15 04049 g012
Figure 13. Comparison of loss values for different modalities.
Applsci 15 04049 g013
Figure 14. Confusion matrix of recognition results for different methods.
Applsci 15 04049 g014
Table 1. Confusion matrix description.
Actual PositiveActual Negative
Predict positiveTrue Positive (TP)False Positive (FP)
Predict negativeFalse Negative (FN)True Negative (TN)
Table 2. Gearbox health condition monitoring data.
NumberParameter NameUnit
1Vertical Output Vibration m / s 2
2Vertical Input Vibration m / s 2
3Horizontal Output Vibration m / s 2
4Horizontal Input Vibration m / s 2
5Voice Output d B
6Voice Input d B
7Infrared Image ° C
Table 3. The sensors used in the experiment.
Sensor TypeModelSensitivityMeasurement Range
Vibration SensorCT1020LC200 mV/g ± 25   g
Voice SensorAWA1442350 mV/Pa3.15–20 k/Hz
Infrared Image SensorK16E196500 V/W−50~+125 °C
Table 4. Health status grade of gearbox.
Health LevelOperating ConditionLevel Label
NormalOperating normally, no maintenance needed0
MildStable operating condition, scheduled maintenance1
ModerateSigns of deterioration in operating condition, timely maintenance required2
FaultCannot operate normally, requires shutdown for repair3
Table 5. Comparison of average recognition for different modalities.
ModalityAverage Recognition AccuracyAverage PrecisionAverage RecallAverage F1-Score
Infrared Image93.2791.6193.1891.71
Voice96.3297.7596.3393.48
Vibration98.0298.1798.0298.05
Multimodal99.1899.2599.1899.13
Disclaimer/Publisher’s Note: The statements, opinions and data contained in all publications are solely those of the individual author(s) and contributor(s) and not of MDPI and/or the editor(s). MDPI and/or the editor(s) disclaim responsibility for any injury to people or property resulting from any ideas, methods, instructions or products referred to in the content.

