Article

Evaluation of Hydrogen Bubble Growth on a Platinum Microelectrode Under Varying Electrical Potential

Faculty of Mechanical Engineering, University of Ljubljana, Aškerčeva Cesta 6, SI-1000 Ljubljana, Slovenia
*
Author to whom correspondence should be addressed.
Appl. Sci. 2025, 15(8), 4107; https://doi.org/10.3390/app15084107
Submission received: 11 March 2025 / Revised: 3 April 2025 / Accepted: 6 April 2025 / Published: 8 April 2025
(This article belongs to the Special Issue Advancements and Innovations in Hydrogen Energy)

Abstract

:

Featured Application

Production of green hydrogen by utilizing electricity generated from renewable energy sources.

Abstract

Green hydrogen, produced via electrolysis using renewable energy, is a zero-emission fuel essential for the global transition to sustainable energy systems. Optimizing hydrogen production requires a detailed understanding of bubble dynamics at the cathode, which involves three key stages: nucleation, growth, and detachment. In this study, hydrogen bubble growth was investigated in a custom-built electrolysis cell with microelectrodes, combining high-speed imaging and electrochemical measurements with a potentiostat. The results reveal distinct growth regimes governed by a potential-dependent time exponent, captured through a power law. Within the evaluated range of potentials, three regions with different bubble departure behaviors were identified: (i) at low potentials (2.0–2.6 V), bubbles depart without coalescing, (ii) in the transitional region (2.6–3.2 V), bubbles coalesce to varying degrees before detachment, and (iii) at high potentials (≥3.2 V), large, coalesced bubbles dominate. These findings highlight the significant impact of coalescence on bubble growth and departure behavior, affecting electrode coverage with gas and, consequently, electrolysis efficiency. Understanding these interactions is crucial for improving hydrogen evolution efficiency by mitigating bubble-induced mass transport limitations. The findings contribute to advancing electrolysis performance, offering insights into optimizing operating conditions for enhanced hydrogen production.

1. Introduction

Hydrogen is emerging as a versatile and sustainable energy carrier, set to play a key role in the global transition to cleaner energy systems. As a zero-emission fuel, it can be used across multiple sectors, including transportation, industry, and power generation, reducing reliance on fossil fuels. The European Union (EU) is at the forefront of hydrogen development, establishing policies and initiatives to accelerate its adoption. An important part of these efforts is the “Hydrogen Backbone”, a pan-European network of pipelines connecting hydrogen production, storage, and consumption locations. This infrastructure is aimed at creating a robust market and ensuring cost-effective hydrogen distribution. While hydrogen combustion or utilization in fuel cells does not produce CO2, it is not necessarily a clean energy carrier since its production (e.g., from methane) may be associated with notable CO2 emissions. Therefore, hydrogen is assigned to “colors” based on its production method and associated environmental impact. Gray hydrogen is derived from natural gas through steam methane reforming, emitting significant amounts of CO2. Blue hydrogen also originates from natural gas but incorporates carbon capture and storage (CCS) to reduce emissions, making it a lower-carbon alternative. Brown or black hydrogen is produced from coal, resulting in even higher CO2 emissions. Other colors (turquoise, purple, etc.) are associated with specific production methods. Most notably, green hydrogen is produced via water electrolysis powered by renewable electricity, making it entirely carbon-free and thus the most desirable type of hydrogen in the long run.
Green hydrogen is produced through water electrolysis, using renewable electricity to split water (H2O) into hydrogen (H2) and oxygen (O2). The process involves applying electrical potential across electrodes submerged in water, causing oxidation at the anode (producing O2) and reduction at the cathode (producing H2). Three main electrolysis technologies include (i) alkaline electrolysis, (ii) proton exchange membrane (PEM), and (iii) solid oxide electrolysis (SOEC) [1,2]. Alkaline electrolysis is the most mature technology and uses liquid electrolytes such as potassium hydroxide solution. It is also less expensive but slower to respond to dynamic loads [3]. PEM electrolysis relies on a proton-conducting membrane, offering high efficiency, reliability, and flexibility, but at a higher cost [4]. Finally, SOEC is an emerging technology, which operates at high temperatures, improving efficiency but requiring durable materials [5].
To optimize hydrogen production via electrolysis, intensive research efforts are ongoing. The main focus is on the behavior of hydrogen bubbles on the cathode, as their formation and detachment significantly influence the efficiency of the electrolysis process. Although previous studies examined the impact of bubble dynamics on electrical current density, several research gaps remain. Specifically, the transitional behavior between different bubble coalescence regimes under varying applied potentials has not been comprehensively characterized. Moreover, the direct correlation between applied potential, bubble departure size, frequency, and current density fluctuations requires further quantification. Our study addresses these gaps by combining high-speed imaging with potentiostat measurements to systematically analyze bubble departure behavior and its impact on the electrochemical hydrogen production.
The main reason for this is the fact that the volume ratio between H2 and O2 emerging from electrodes is 2:1, meaning that what is happening on the cathode side is the limiting factor from the hydrodynamic point of view. Accumulated bubbles can prevent the electrolyte from accessing the active electrode surface, increasing resistance and reducing current density, while uneven bubble departures may disrupt the operational stability of the system. Parameters such as bubble nucleation frequency, departure diameter, departure dynamics, and surface properties of the electrode are being closely studied to enhance electrolysis performance [6,7,8,9,10]. In the field of enhancing electrolysis, new procedures for hydrogen evolution reaction (HER) catalysts production are being proposed [11,12] along with several approaches for surface structure modifications [13,14,15,16,17]. The key information allowing for optimization of the electrode and entire electrolysis process down the line is an in-depth understanding of the bubble nucleation, coalescence, and departure from the surface on the microscale. In several studies, the effect of departing bubbles is considered and evaluated both in PEM and alkaline electrolysis systems, the conclusions can be applied to the cathode as well as the anode electrode [18,19,20,21,22].
Several recent studies explored hydrogen bubble growth and departure dynamics, with a focus on microscale analysis and with the use of microelectrodes. Park et al. [23] investigated hydrogen bubble dynamics during electrolysis on a platinum microelectrode by varying the electrolyte composition. Key findings include the observation that microbubble coalescence efficiency aligns with the Hofmeister series for anions, leading to distinct bubble evolution behaviors. The results highlight the critical role of the solutal Marangoni convection, driven by anion concentration gradients. In a further study, Park et al. [24] demonstrated that hydrogen bubble detachment during electrolysis can be controlled and optimized by adjusting electrolyte composition. They have shown that microbubble coalescence efficiency, which determines whether detachment occurs randomly or as single bubbles, is strongly influenced by the electrolyte, again following the Hofmeister series for anions, and is inhibited by alkali metal cations. Guo et al. [25] also explored the effect of the electrolyte concentration on single hydrogen bubble evolution dynamics at a microelectrode during electrolysis. They used different H2SO4 electrolyte concentrations (0.2–1.0 M) under various applied voltages, focusing on bubble departure diameter, average current, and bubble lifetime. They found that the highest gas production at a potential of −6 V was achieved at an intermediate concentration of 0.6 M. Furthermore, they proposed a force balance model incorporating the Marangoni force for single bubbles on the microelectrode surface, noting the critical role of the solutal Marangoni force beyond a certain electrolyte concentration value. Similarly, Lu et al. [26] varied the electrolyte temperature and concentration to study single hydrogen bubble evolution on a microelectrode. A notable reduction in bubble departure diameter and growth time with decreasing electrical potential and increasing reaction temperature was observed. A model for estimating the bubble coverage on a microelectrode was also presented, incorporating bubble radius and current as key influencing factors. Moreover, the dominance of bubble-induced micro convection as the primary mass-transfer mechanism for gas products at high current densities was reported. Finally, the inertia-controlled bubble growth stage was found to increase the mass transfer coefficient, while the latter decreased during the growth stage controlled by chemical reactions. Duan et al. [27] performed measurements using 1.2 M H2SO4 with ethylene glycol added as a surfactant and found that under the influence of electrode adsorption, the departure diameter of the hydrogen bubble is independent of the current density, but the bubble departure frequency increases with the increase in current density. This points to the observation that pinning forces that counteract buoyancy are independent of the rate of electrochemical reaction. Hossain et al. [28] investigated the force balance of hydrogen bubbles growing and oscillating on a microelectrode, confirming the role of the Coulomb force caused by the adsorption of hydrogen ions at the bubble interface. Bashkatov et al. [29] performed further work on the growth regimes of hydrogen bubbles at microelectrodes, identifying new bubble growth regimes that differ in terms of whether the bubble evolution proceeds in the presence of a monotonic or oscillatory variation in the electric current and a carpet of microbubbles underneath the bubble. Furthermore, Bashkatov et al. [30] also studied the interaction between adjacent hydrogen bubbles using cyclical modulation of the electrical potential applied to the microelectrode. Three scenarios of interactions were identified, with the most notable one involving the reversal of bubble rising motion and its coalescence with the second bubble on the microelectrode surface. This contactless motion reversal was explained through competition between buoyancy and thermocapillary effects.

Bubble Growth Dynamics

Bubble dynamics is characterized by three key stages: nucleation, growth, and detachment [31]. Additionally, a fourth stage, i.e., coalescence of bubbles, can be evaluated as one of the growth stages. When two bubbles come into mutual proximity, they can merge via coalescence into a single bubble, resulting in a decrease in the surface energy from the reduction in the total area of the gas–liquid interface [32]. Nucleation occurs due to the elevated chemical potential of dissolved gas molecules near the electrode. Subsequent bubble growth proceeds through distinct regimes dominated by specific mechanisms. In general, the growth phase of bubbles can be represented by a power-law dependence of bubble radius rb versus t:
r b ( t ) = b t x ,
where b is the growth coefficient and x is the growth exponent [33]. As growth progresses, the exponent reflects the dominant mechanism. The initial stage is governed by inertia from the surrounding liquid, with bubble radius (rb) scaling linearly with time:
r b = b t .
Experimental evidence of bubble growth during the initial stage [6,33,34,35] is usually limited by the spatiotemporal resolution of the acquisition system. The second stage is a diffusion-controlled regime, where bubble growth roughly approaches a square root dependence, as described by [33,35,36,37,38,39]
r b = b t 1 2 .
This occurs as the surrounding liquid becomes locally saturated with gas, and diffusion from the bulk electrolyte toward the bubble drives its growth. Higuera et al. [40] also noted that a possible deviation from this diffusion-controlled law is due to the non-uniform distribution of gas concentration that decreases with the distance from the electrode. Some studies have further shown that the mass transfer of the dissolved hydrogen is not the limiting factor of bubble growth rate [6,36,39,41], particularly for high current densities. A third stage of bubble growth is reaction-limited, where bubble growth is constrained by the electrochemical reaction rate at the electrode surface. The bubble radius now scales as
r b = b t 1 3 ,
resulting in a constant gas generation rate. Bubble growth is driven by the direct injection of gas at the bubble foot [33,42]. In studies on micro- and nanoelectrodes, the bubble is usually larger compared to the size of the electrode during most of the bubble growth time, resulting in the typical presence of the direct injection [40]. Yang et al. [6] have shown that the reaction-limited regime (i.e., smaller bubbles coalescing at the foot of the bigger bubble) is an important mechanism of the bubble growth, despite previous certainty regarding the validity of the growth laws being restricted to cases where bubbles do not mutually interfere.
Bubble detachment represents the final phase, when the bubble unpins from the electrode surface. The process of detachment is often triggered by the breaking of the bubble neck [31], or by the loss of contact with an underlying “carpet” of microbubbles [43]. The bubble detachment can be enhanced via several methods and technologies, including hydrophilic surfaces, and the use of magnetic, supergravity, and ultrasonic fields [44]. The theoretical maximum radius of a bubble detaching from an upward-facing electrode in stagnant electrolyte can be described by Fritz’s formula [45,46]:
r d * = 3   r 0 σ sin θ 2   Δ ρ g 1 3 ,
where r0 represents the radius of the contact area between the bubble and the electrode, σ the surface tension, θ the contact angle, Δρ represents the density difference between the liquid and the gas phase, and g is the gravitational acceleration.
In gas-evolving electrochemical processes, bubbles significantly influence system performance, particularly through overpotential losses. Key processes affected include mass transport, with migration of H+ ions toward the cathode, their reduction into H2 gas at the electrocatalytic surface, and the subsequent transport of products away from the electrode via diffusion and convection [31]. The presence of bubbles reduces the effective active surface area of the electrode, leading to a non-uniform current density distribution. This localized increase in current density accelerates bubble growth and the depletion of reactants at active sites. Bubbles continue growing via diffusion-driven gas transfer and induce moderate convective flows, which can enhance mass transport.
Once detached, bubbles generate wake flows that locally mix the electrolyte, reducing concentration gradients and improving reactant supply. However, bubbles also obstruct ion conduction pathways, increasing the effective resistance of the electrolyte and contributing to ohmic losses [31]. The relationship between current density ( j ) and fractional bubble coverage (σ) can be described as [47]
j = I A   ( 1 σ ) ,
where I presents electrical current and A area of the electrode surface, therefore I/A presents a superficial current density, which must be strictly distinguished from the actual current density. At low current densities, kinetic overpotentials dominate, and bubble coverage (σ) primarily determines the total overpotential. In contrast, at higher current densities, ohmic losses become the dominant factor due to dynamic changes in resistance as bubbles nucleate, grow, and detach. Periodic bubble behavior influences the overall resistance of the electrolyte, while associated convective flows mitigate concentration overpotentials by enhancing mass transport and reducing local concentration gradients. The turbulence induced by bubble detachment further improves mixing efficiency, amplifying the positive effects on mass transport. However, this periodic bubble activity also adds complexity to the dynamic electrochemical environment.
The formation of multiple bubbles in practical electrochemical systems is typically uncontrolled. Lu et al. [48] suggested some guidelines and provided simulations, showing that engineering cavity sizes and modifying the gas diffusion layer thickness can tune the process of bubble nucleation. Their numerical simulation was later used for theoretical model validation by Zhao et al. [49], where good agreement of the lower and the upper bound for the size of the effective nucleation cavity was confirmed, as the results proved consistent with experimental findings. For in-depth research on hydrogen bubble evolution, isolated bubble events, and the study of their impact on gas-evolving electrodes is the main objective, leading researchers to develop methods that enable the observation of single bubbles. This is often achieved using nano- or micro-sized electrodes that facilitate desired phenomena and allow for detailed investigations of individual bubble behavior associated with electrochemical phenomena [6,31,36]. From the applicative point of view, research on microelectrodes is fundamental for understanding and optimizing processes on porous electrodes, their modeling, and a better understanding of the forces that determine bubble detachment, and further provides guidelines for porous catalyst research and development [29,50,51].
The present study aims to provide further information on the bubble growth regimes and related parameters, such as the departure frequency and diameter. Specifically, the effect of the electrical potential on the aforementioned parameters is focused on. A series of experiments is performed with 100 μm platinum microelectrodes operating in a 0.5 M aqueous solution of H2SO4. High-speed visualization is coupled with data acquisition to analyze the behavior of the hydrogen bubbles during their growth, coalescence with adjacent bubbles, and departure from the microelectrode. Bubble departure frequencies and diameters are extracted from the high-speed footage, and several regimes with different bubble growth characteristics are identified.

2. Materials and Methods

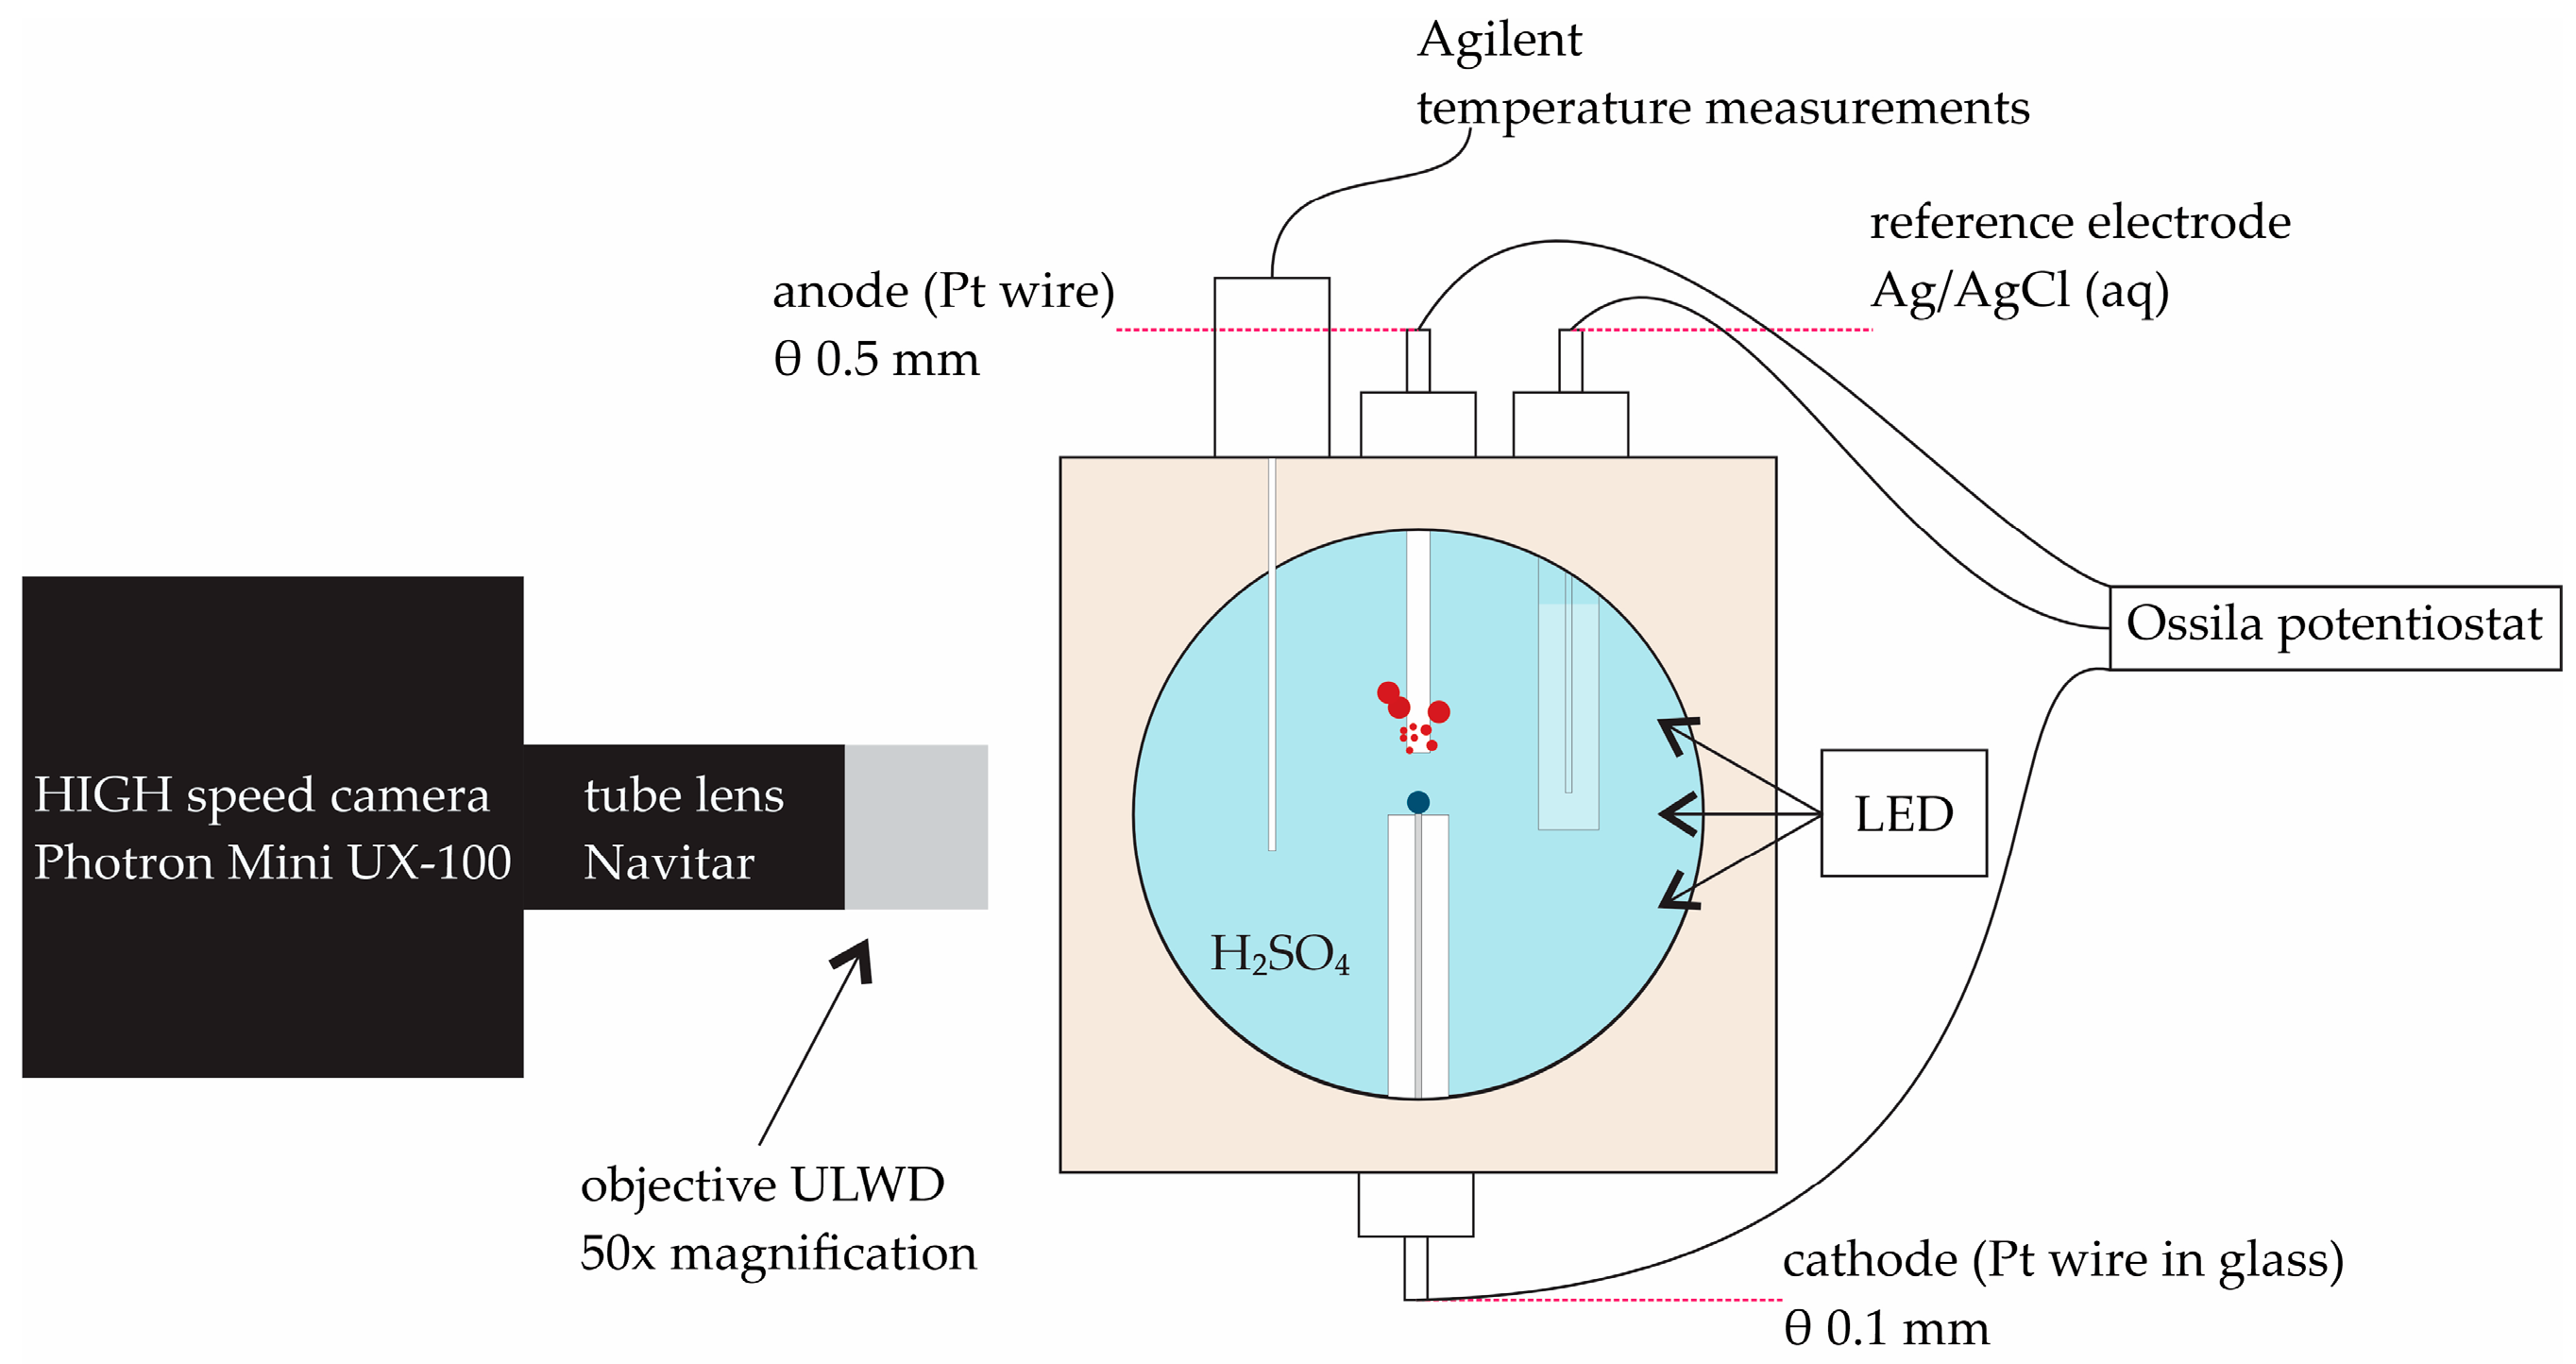
2.1. Experimental Setup

To perform the experiments, a custom-made experimental cell was utilized and is schematically shown in Figure 1. The cell consists of a PEEK housing (volume ~50 mL) with large flat windows on the front and the back to allow for illumination and high-speed visualization. The cathode upon which hydrogen bubbles grow is inserted through the bottom of the chamber, while the anode and the reference electrode are inserted from the top. The reference electrode serves as a stable and well-defined potential point, maintaining constant potential and allowing for reliable measurement of the working electrode’s potential relative to the reference electrode, resulting in accurate measurement and control of the working electrode’s potential. Additionally, an in-liquid temperature sensor and a pressure relief valve are connected to the top part of the chamber.
The platinum microelectrode (redox.me, Norrköping, Sweden) used as the cathode is a round platinum wire with a diameter of 100 μm, encapsulated in a glass rod with an outside diameter of 6 mm. The anode consists of an unsheathed platinum wire with a diameter of 0.5 mm, positioned 2 mm above the cathode surface and held in the same position throughout all measurements. The reference electrode is a standard Ag/AgCl electrode. A potentiostat (Ossila, Sheffield, UK) is used to provide a constant electric potential; applied potential accuracy is defined within ±10 mV offset. The potentiostat monitors the temporal variations in the electric current with a current measurement accuracy of ±2 μA in the measurement range of ±2 mA, and an accuracy of ±200 nA in the measurement range of ±0.2 mA. High-speed visualization is performed with a Photron Mini UX-100 camera (Photron, Tokyo, Japan) using an LED backlight and a 50× magnification ultra-long-working-distance (ULWD) objective with a lens tube.

2.2. Measurement Protocol

Before every set of measurements, the cathode was polished using a three-step process. First, polishing was performed with 1200-grit paper and an alumina polishing powder with 1 μm particles. In the second step, a nylon polishing cloth was used with an alumina polishing powder with 0.3 μm particles. Finally, a micro-polishing cloth was used with an alumina polishing powder with 0.05 μm particles to finalize the polishing process. After polishing, the cathode was rinsed with deionized water and sonicated in an ultrasonic bath for 20 min. Finally, the cathode was rinsed with 0.5 M H2SO4 and inserted into the experimental cell. The anode was polished using a 1200-grit paper, rinsed with deionized water, and sonicated in an ultrasonic bath for 20 min.
After the polished cathode was inserted into the experimental cell, the latter was filled with degassed 0.5 M H2SO4 solution. Degassing was performed through 1 h of sonification in an ultrasonic bath. To further degas the cathode in situ, a potential of 3 V was applied to it for 10 min to remove any surface-entrapped gas bubbles that could trigger nucleation and thus affect the measurements. Prior to each experimental run, the potentiostat was first switched off to remove the existing hydrogen bubbles from the surface. To conduct an experimental run, the potential was set to the desired value, and the current was recorded for at least 150 s to reach a stable value. A high-speed recording was made during the last 20 s of each run. Each series of experimental runs started at the lowest potential (typically 2.0 V), which was then incrementally increased by 0.1 V for each subsequent run. The potentiostat was temporarily turned off between each run to stop the electrolytic activity. When the highest potential was reached (3.5 V), the series was concluded, and the cathode was repolished and the electrolyte replaced.
All measurements were conducted at ambient temperature (27–29 °C) and ambient pressure, confirmed by temperature measurements inside the electrolyte and with the pressure relief valve fully open, respectively.

2.3. Data Reduction

High-speed recordings were processed using custom-developed algorithms in the MathWorks MATLAB R2022b environment. Calibration of the pixel size was performed using a microscope stage micrometer (Olympus OBM-1/100, Tokyo, Japan) and high-speed camera software PFV4 (Photron, version 4.0.5.2), while keeping the optical hardware and software settings the same as later during experiments. The bubble diameter during detachment from the surface was evaluated in PFV4 through manual tracking. We simultaneously determined the period between the detachment of two consecutive bubbles.
Using a MATLAB script, the positions of the electrode surface and the solid–liquidliquid–gas interface were manually determined for each evaluated frame. Bubble radius, centroid position, and the bubble index were determined for each frame, while the bubble growth rates were determined from forward difference calculation between two consecutive frames.

3. Results and Discussion

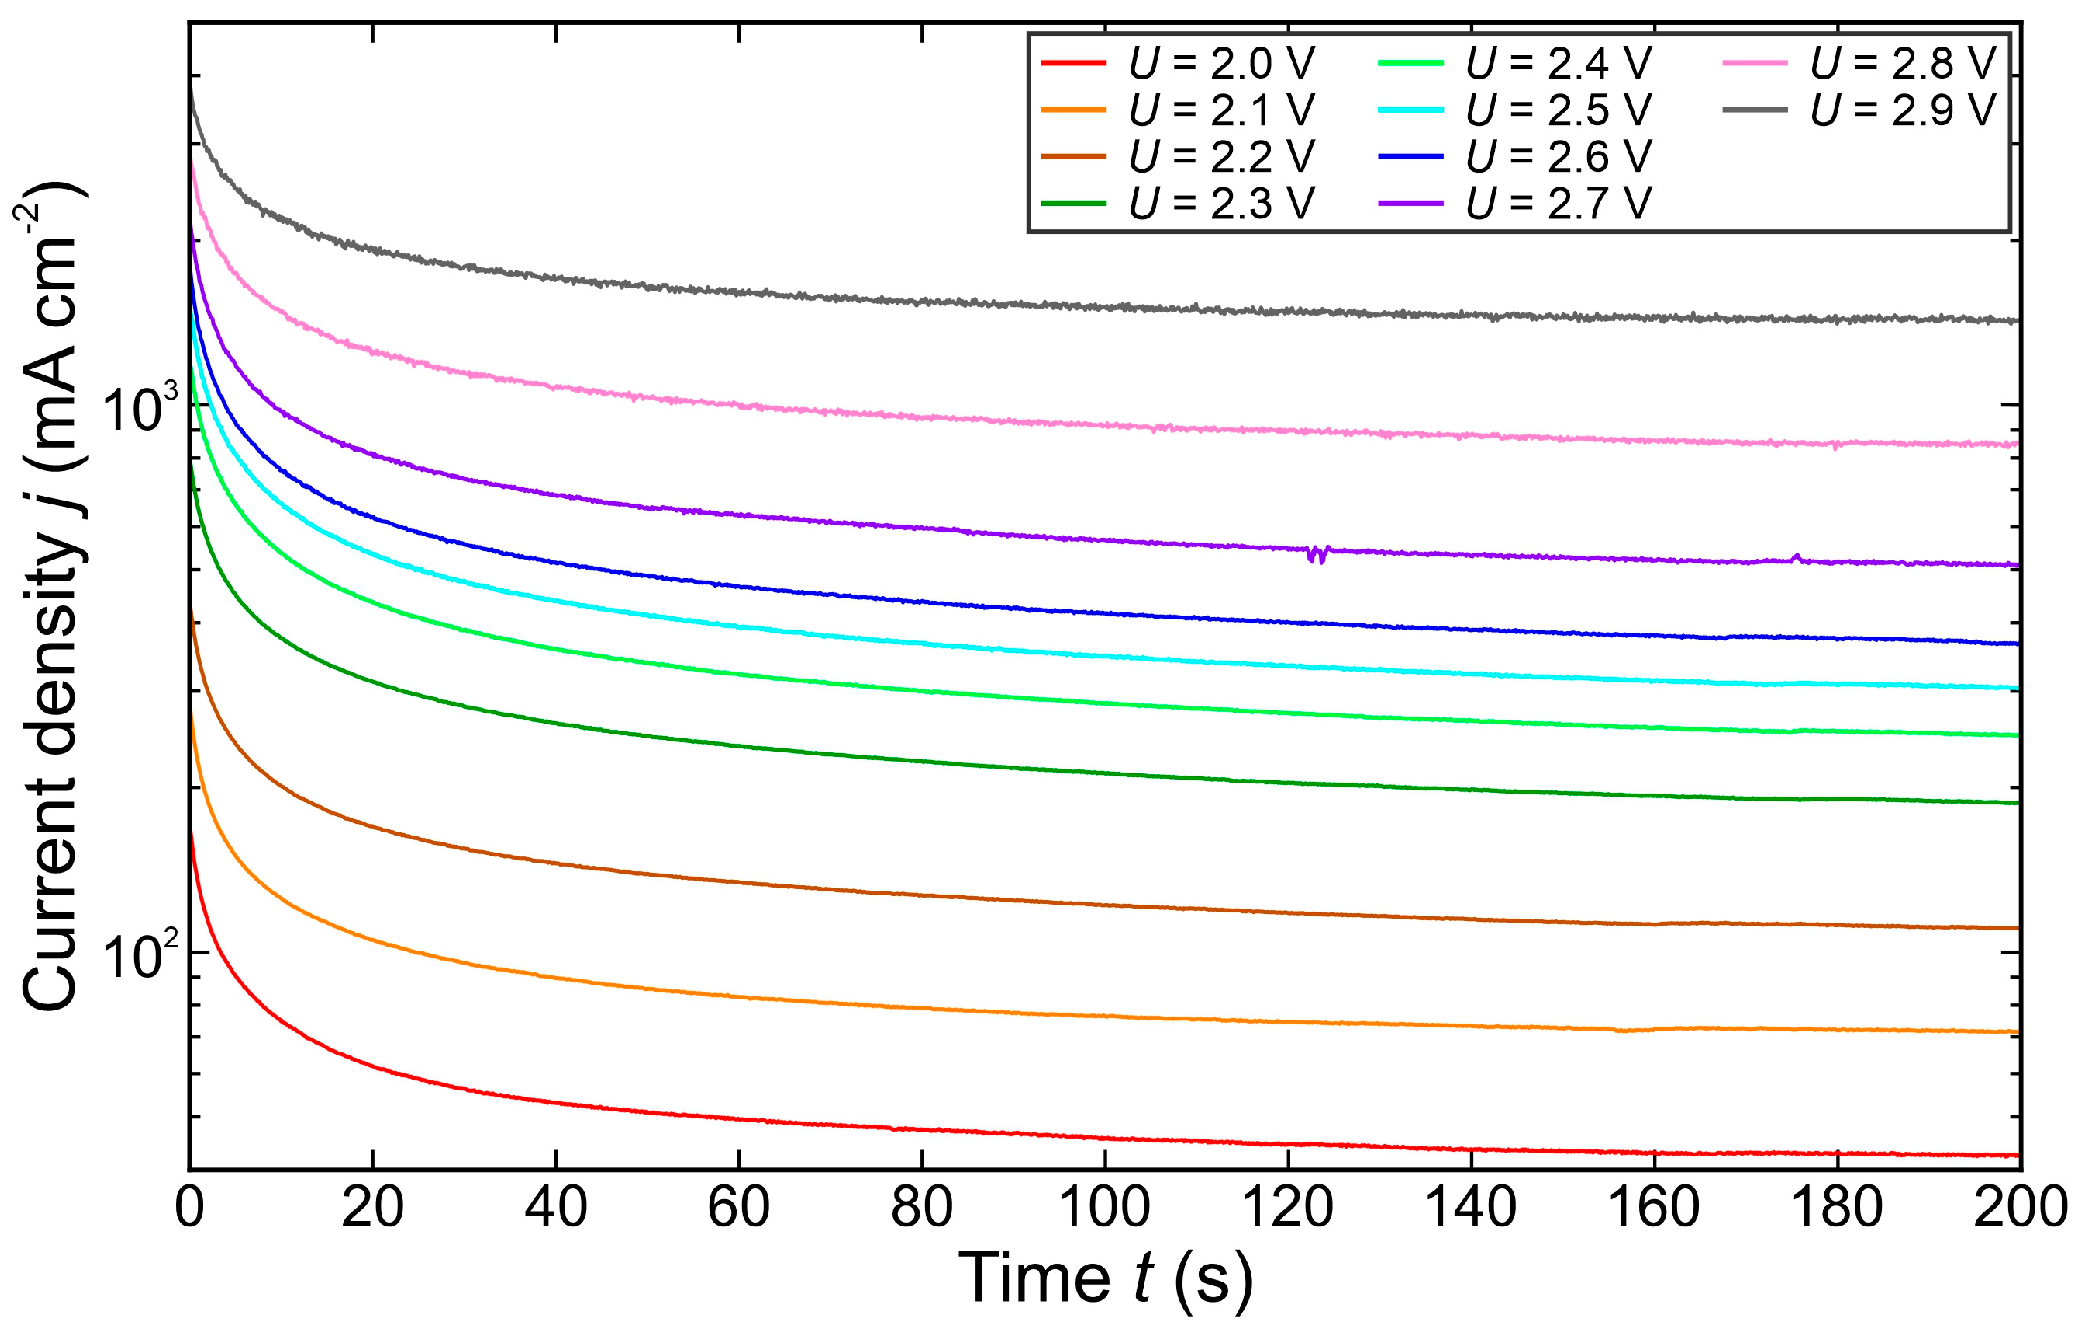
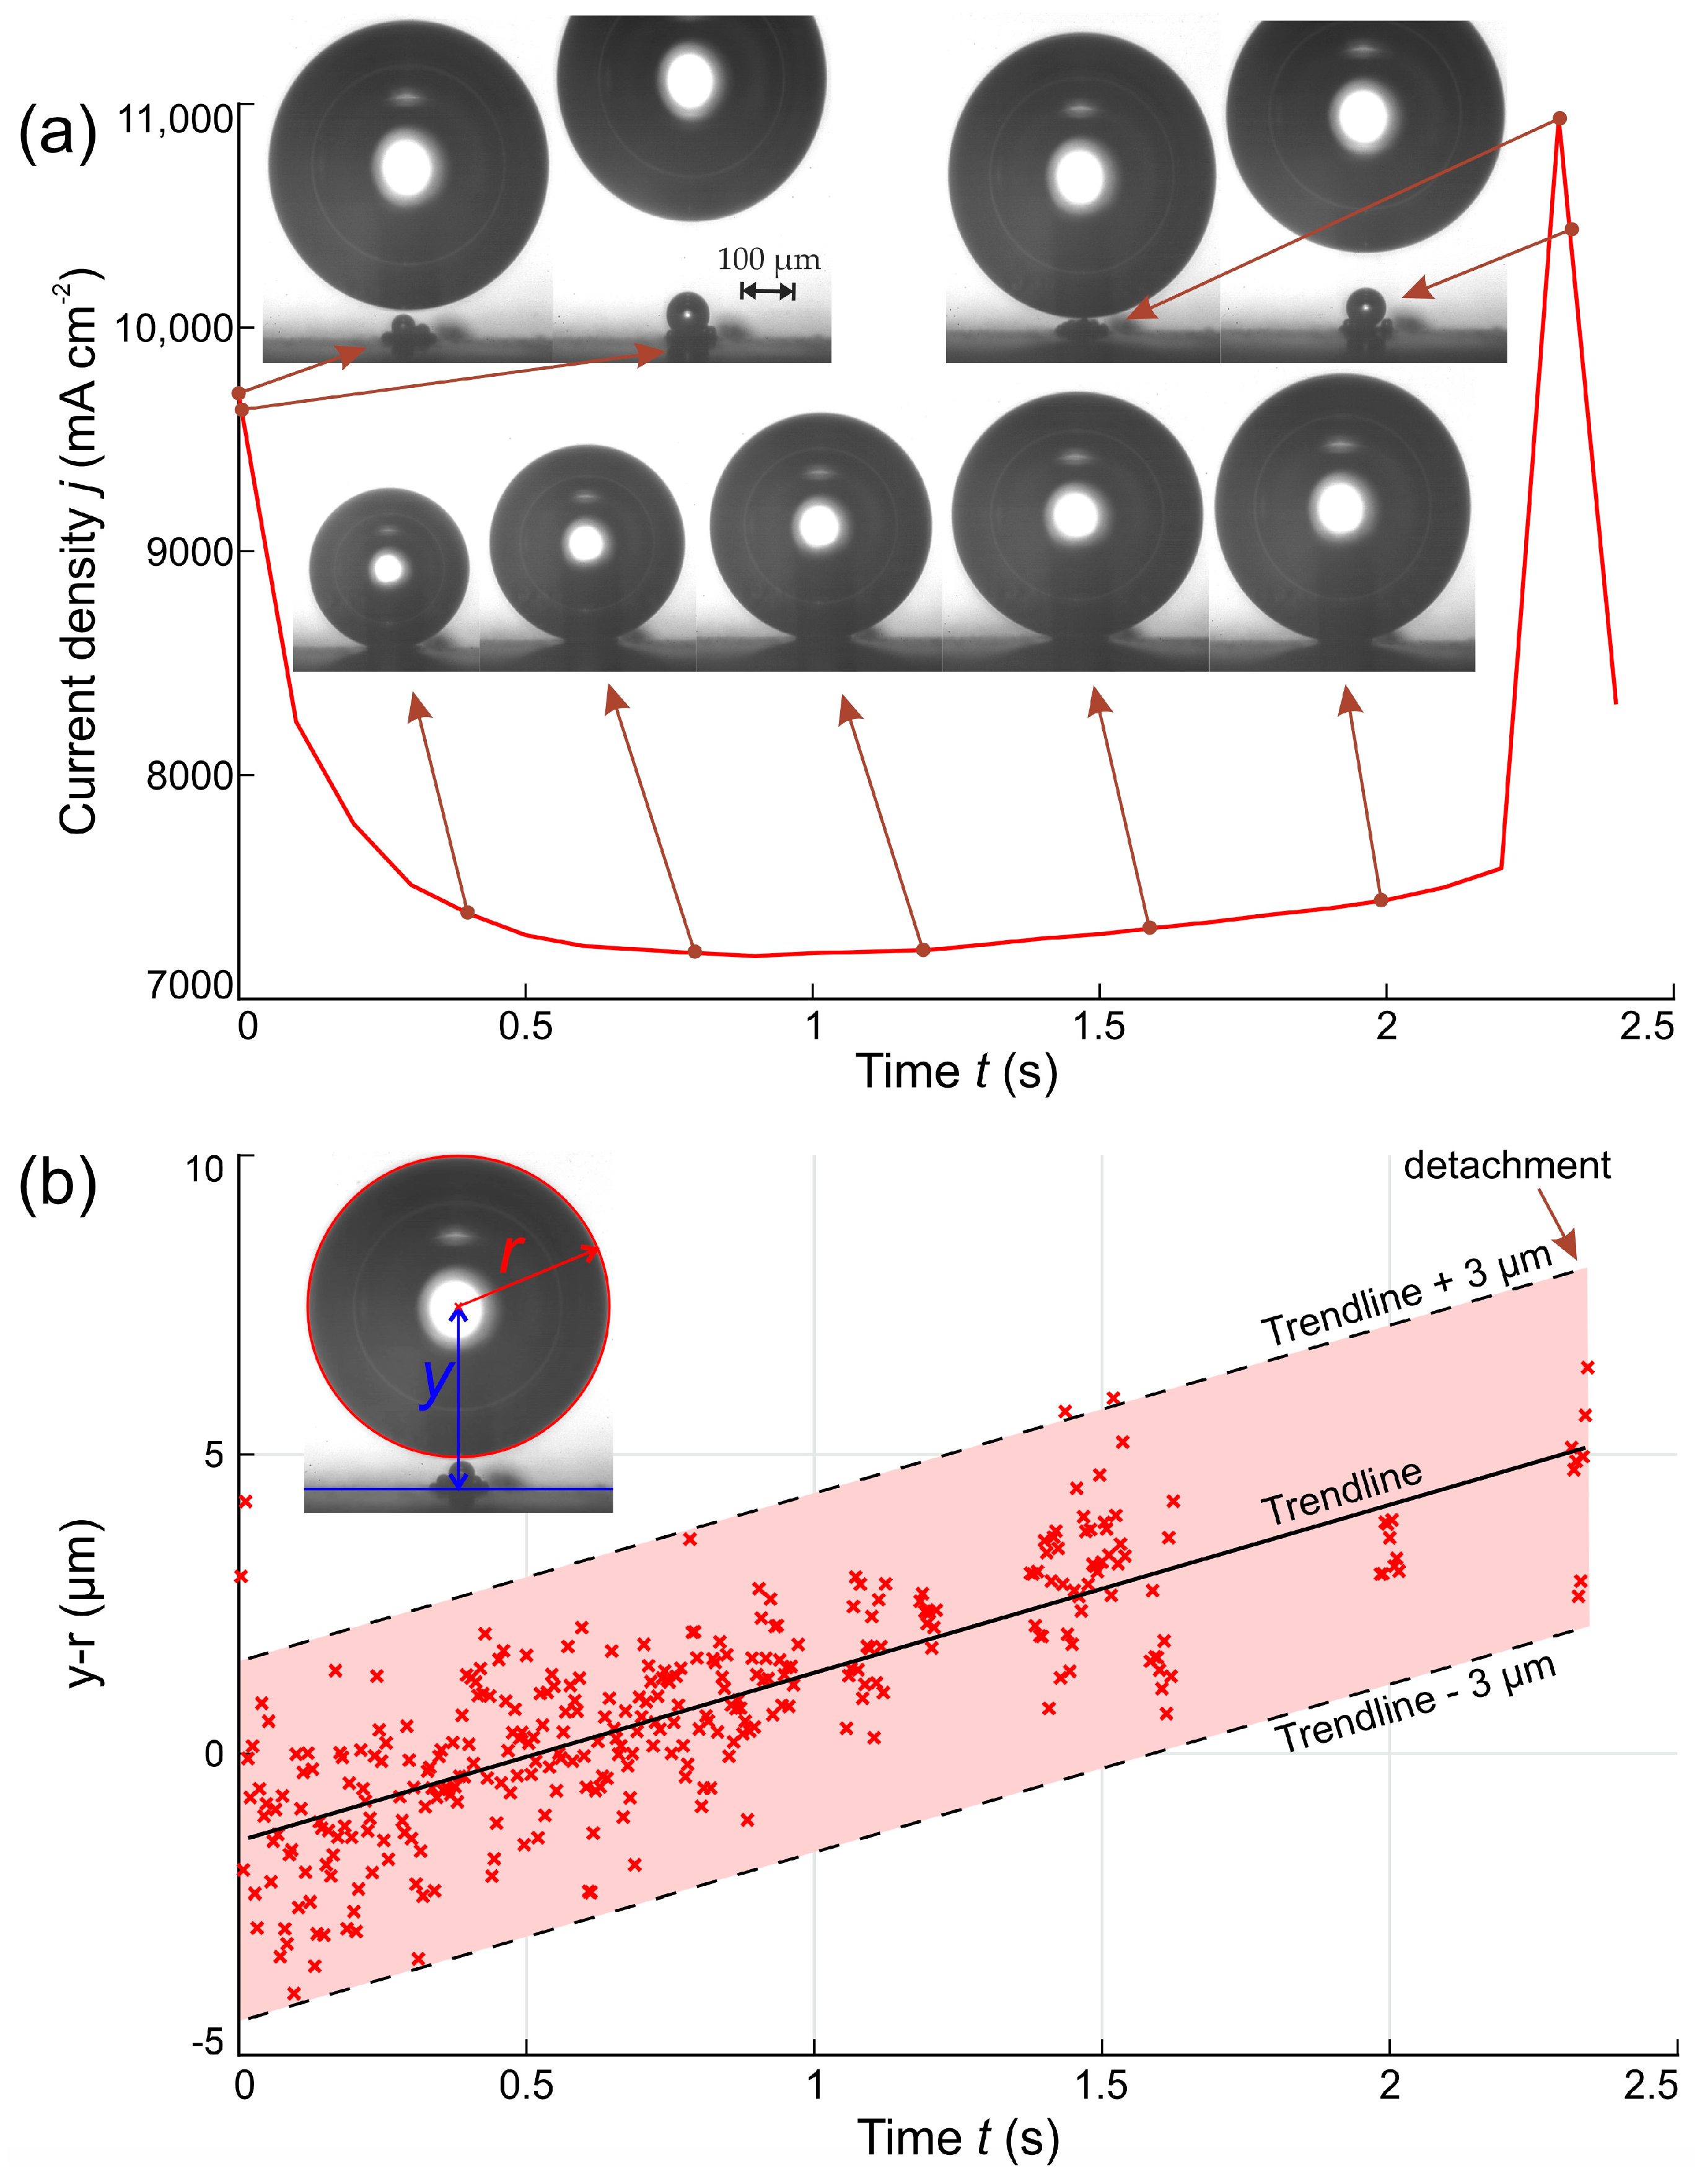
3.1. Temporal Dynamics of the Electrical Current Density

First, the temporal changes in the electrical current were studied to determine how the electrical potential influences the bubble evolution cycle. Figure 2 shows the electrical current density achieved on the microelectrode at low applied potentials (below 3.0 V). The potential of 2.0 V was the lowest potential at which stable emergence of bubbles during the whole measurement period was observed. At potentials below 2.0 V, bubbles start to emerge at the beginning of the measurement and stop emerging after a few seconds, depending on the applied potential. At increasing electrical potentials, the periodic growth and departure of small bubbles start to affect the temporal dynamics of the electrical current, which is evident as ripples in the recorded current density in Figure 2 (e.g., at 2.9 V).
Figure 3 shows the temporal dynamics of the electrical current density on the microelectrode at six electrical potentials. At low voltages (U < 3.2 V), solitary bubbles are generated at a high frequency, resulting in high-frequency fluctuations in the current density. These indistinct peaks of current density led to a high standard deviation (up to 200%) of the nominal average bubble departure diameter. However, at higher potentials (U ≥ 3.3 V), a clear bubble evolution cycle appears due to strong coalescence of the small bubbles on the electrode surface. The resulting larger bubble only departs the surface when its size is sufficient for the buoyancy to overcome the pinning forces [25,29,43]. At U = 3.2 V, a transition between the two regimes was observed approx. 25 s after the start of the measurement. Above 3.2 V, the standard deviation of the determined bubble frequency is below 7% of the average value.
In all measurements, 95% of the electrical current density drop towards the final value was found to occur within the first 50 s of the measurement. As the bubble growth was recorded and evaluated within the last 20 s of the measurement (i.e., after 150 s), steady state conditions can safely be assumed.
Figure 4 provides a side-by-side comparison of bubble generation regimes as snapshots from the high-speed videos, clearly showing small, mostly uncoalesced bubbles departing the microelectrode surface at lower electrical potentials and the emergence of a large, coalesced bubble at increased electrical potentials.
During each measurement, the electrical current density decreased asymptotically. In general, a lower normalized reduction in the electrical current density was observed at higher potentials, except for the transition region at potentials of 3.2 and 3.3 V, where the reduction was notably higher. As observed in Figure 3, the first part of the measurement at these potentials represents the emission of microbubbles with limited coalescence, while a notable reduction in the electrical current density occurs when the coalescence regime with the emission of a large coalesced bubble is established. This trend is clearly observable at 3.2 V, whereas at 3.3 V it is not obvious due to the rapid establishment of the bubble coalescence regime within the first 2 s of the measurement.
The ratio between the first and the last peak in the measured electrical current density at different potentials is presented in Figure 5, providing a quick evaluation of the total decrease in electrical current density over the measurement period. These peaks correspond to moments when bubbles detach from the electrode surface, temporarily increasing the measured current density, a phenomenon that is shown in detail in Figure 6a. The comparison highlights how the current density evolves over the 200 s measurement. The peak value was evaluated for potentials from 2.9 to 3.5 V, and a comparison between several measurements is provided for the highest applied potential, showing that the scatter is considerably lower than the difference between measurements at different potentials. The highest ratio represents the smallest difference between the first and the last peak. The low ratio at potentials of 3.2 and 3.3 V indicates that although bubbles merge into a single bubble detaching from the electrode surface, this region is unstable.
Figure 6a presents an example of one bubble growth cycle at a potential of 3.4 V, where a single coalesced bubble forms. As the previous coalesced bubble detaches from the microelectrode, small bubbles immediately start growing on the surface. For the presented example, the rapid bubble diameter growth in the first half of a second is well correlated with Equation (2) and observed through the drop of electrical current density. Afterwards, the growth rate decreases as well as the current density variation during the rest of the coalesced bubble’s growth.
The detachment of coalesced bubbles from the electrode surface is primarily driven by buoyancy forces [25,26,52]. As the bubble grows, the buoyancy force increases until it surpasses the adhesive forces holding the bubble to the electrode, leading to detachment. As the bubble detaches from the surface, the electrode surface is exposed to the electrolyte, enhancing the active area available for the HER, resulting in an increase in the electrical current density. The minimum value of electrical current for the given example is reached approximately at the halfway point of the bubble growth period, indicating that bubble is slowly reaching the final departure diameter and the buoyancy force is starting to prevail, causing the large, coalesced bubble to start lifting from the electrode surface, resulting in enhanced active area of the electrode surface. Figure 6b presents the difference between the vertical distance of the bubble center from the electrode (y) surface and the bubble radius (r). At the beginning of the growth cycle, bubbles on the surface have the shape of a truncated sphere, resulting in negative y-r values. After the 0.5 s time mark, a bubble starts to form into a complete sphere and starts detaching from the surface, while the emerging microbubbles beneath prevent a full detachment. Based on the provided trend, we postulate that growing current density prior to the bubble detachment, i.e., see Figure 6a between 1.2 and 2.2 s, is due to the slowly and continuously rising bubble that, at some point, creates enough space for enhanced nucleation of microbubbles. This enhancement might be due to improved diffusion of the supersaturated liquid that governs the microbubble growth. This effect, partially observed in previous studies [29,53], remains to be further analyzed and would require advanced diagnostics of nucleation site distribution where microbubbles form.
Once the coalesced bubble detaches from the surface, a rapid increase in the electrical current density occurs, resulting in a local maximum and providing maximal active area of the microelectrode surface exposed to the electrolyte, thus enabling the growth of the next hydrogen bubble.
The total volume of the produced hydrogen can be calculated using Faraday’s law, which states the quantitative relationship between the substance deposited at electrodes and the quantity of electric charge or electricity passed. The mass of a substance deposited at any electrode is directly proportional to the amount of charge passed. The equation for the theoretically produced volume of hydrogen during electrolysis ( V c a l c ) is calculated using the following equation:
V c a l c = E   I   Δ t F   M H 2 · r   T p ,
where E is the equivalent weight (chemical equivalent of the substance), I the measured electrical current, Δ t the time period of interest, F the Faraday constant (96,485 C mol−1), M H 2 the molar mass of hydrogen, R the ideal gas constant, p the pressure, and T the temperature. Using Equation (7), the volume of hydrogen produced during the measurements is shown versus time in Figure 7 for potentials between 2.9 and 3.5 V. The total volume of produced hydrogen increases linearly as the electrical current density remains almost constant after the initial drop at the beginning of the measurement.
The power used for hydrogen generation P e l can be simply calculated from the electrical current I and the applied potential Δ U as
P e l = U   I .
The chemical energy content of the produced hydrogen is determined through the calculated volume of hydrogen and its higher heating value:
P H 2 = V H 2 ρ H 2 H H V H 2 Δ t   ,
where V H 2 is the calculated volume of hydrogen, ρ H 2 represents the density of hydrogen at NTP (0.08376 kg m−3), H H V H 2 denotes the higher heating value of hydrogen (141,860 kJ kg−1) and Δ t is the elapsed time.
In Figure 8, the efficiency of electrolysis is assessed by comparing the volume of hydrogen produced to the theoretical volume based on Equation (7), representing the equivalent of electrolysis efficiency. The volume of generated hydrogen, as determined from high-speed video recordings, is compared to the theoretical volume, which is estimated based on the applied electrical current. Individual frames from the high-speed video recordings were analyzed to measure the radii of several hydrogen bubbles at the moment of detachment from the electrode surface. Assuming a spherical bubble shape, their volumes were calculated accordingly. To determine the hydrogen production rate, the growth duration of each evaluated bubble was measured.

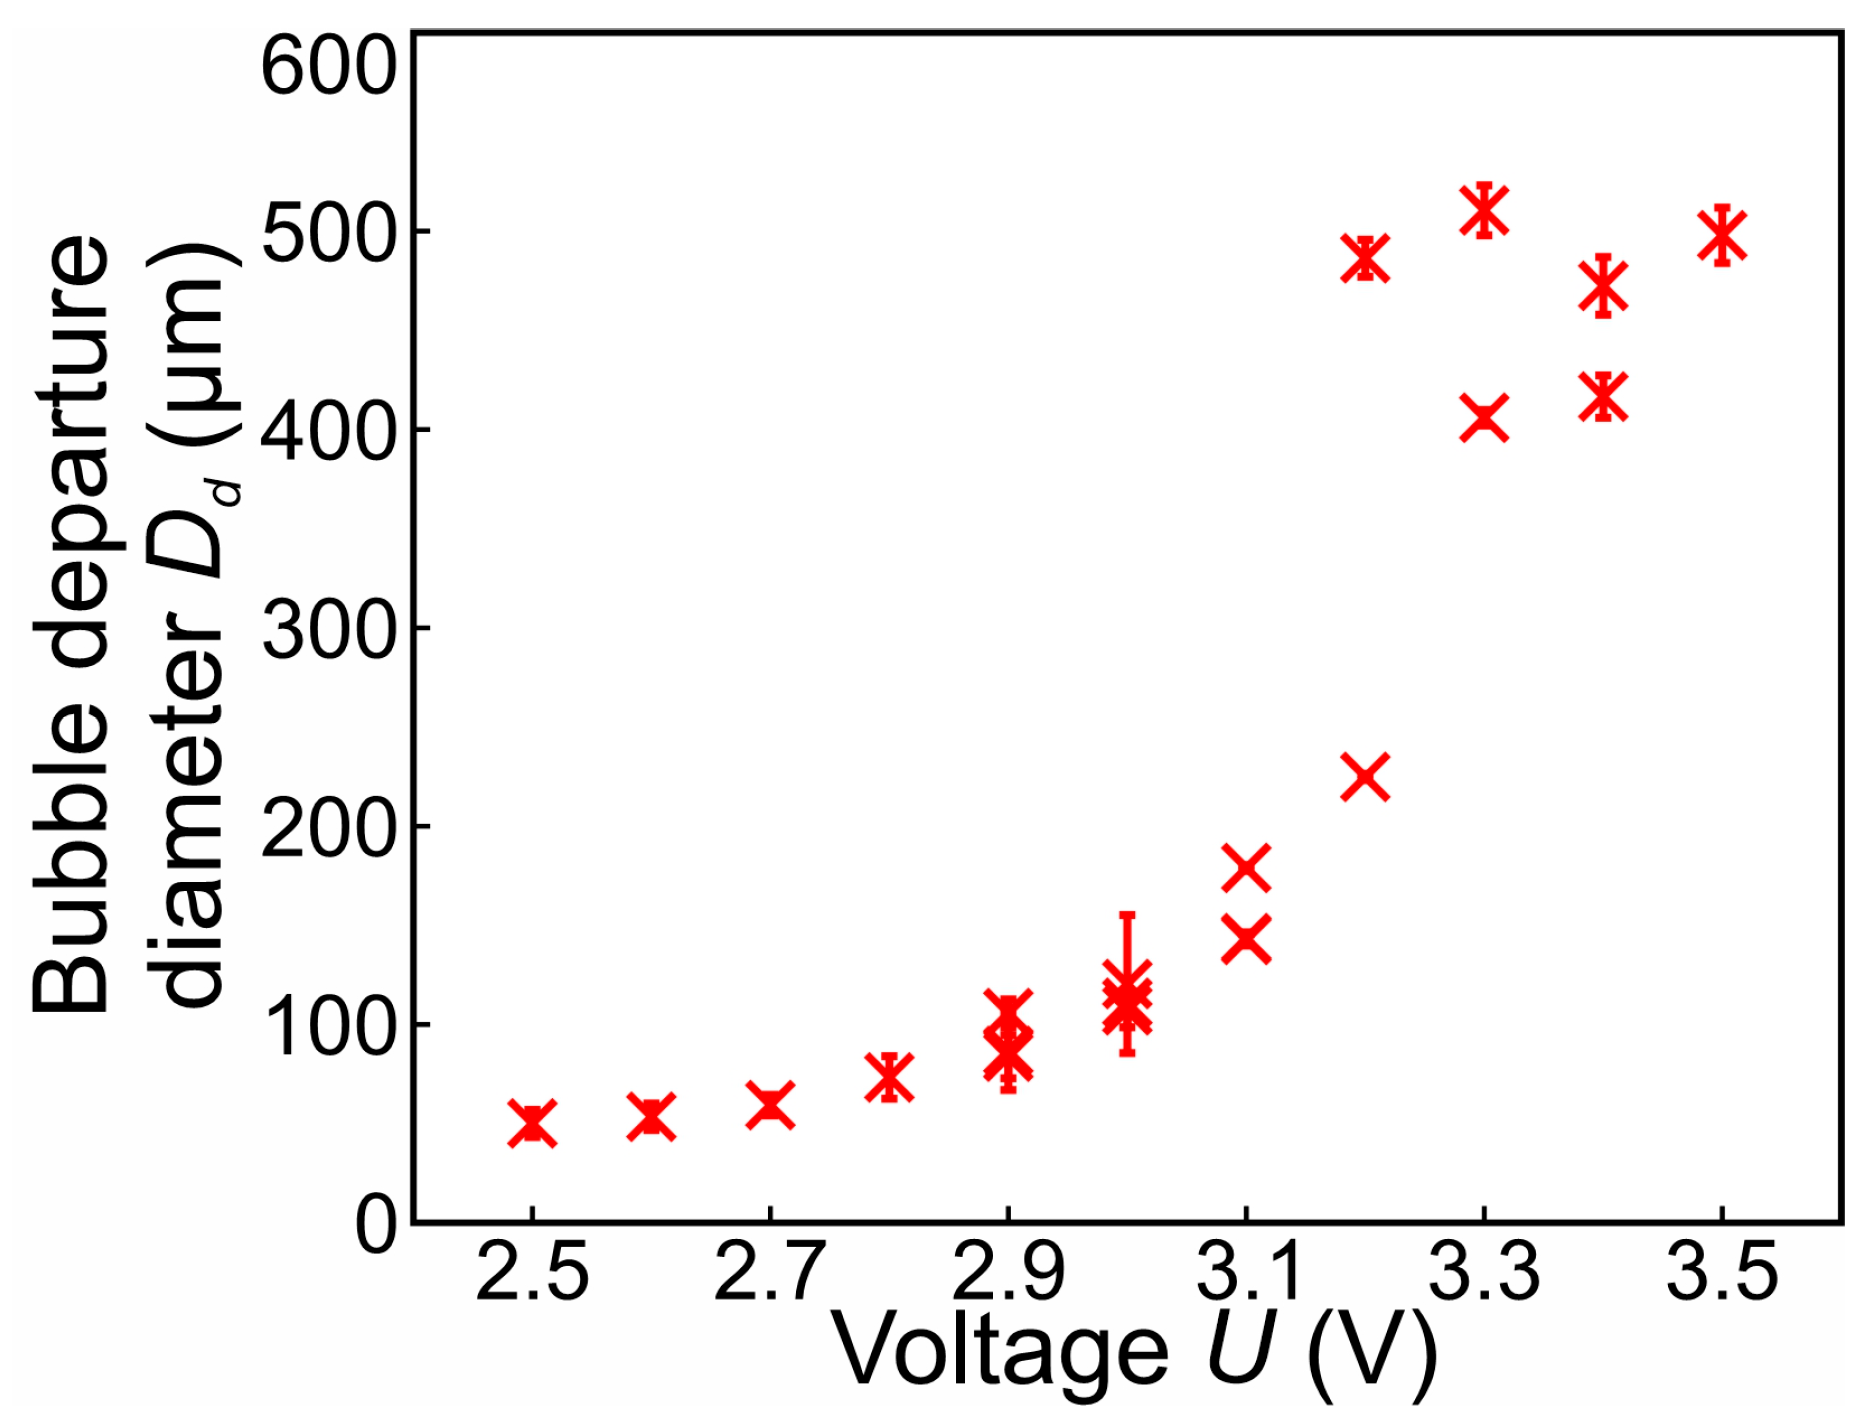
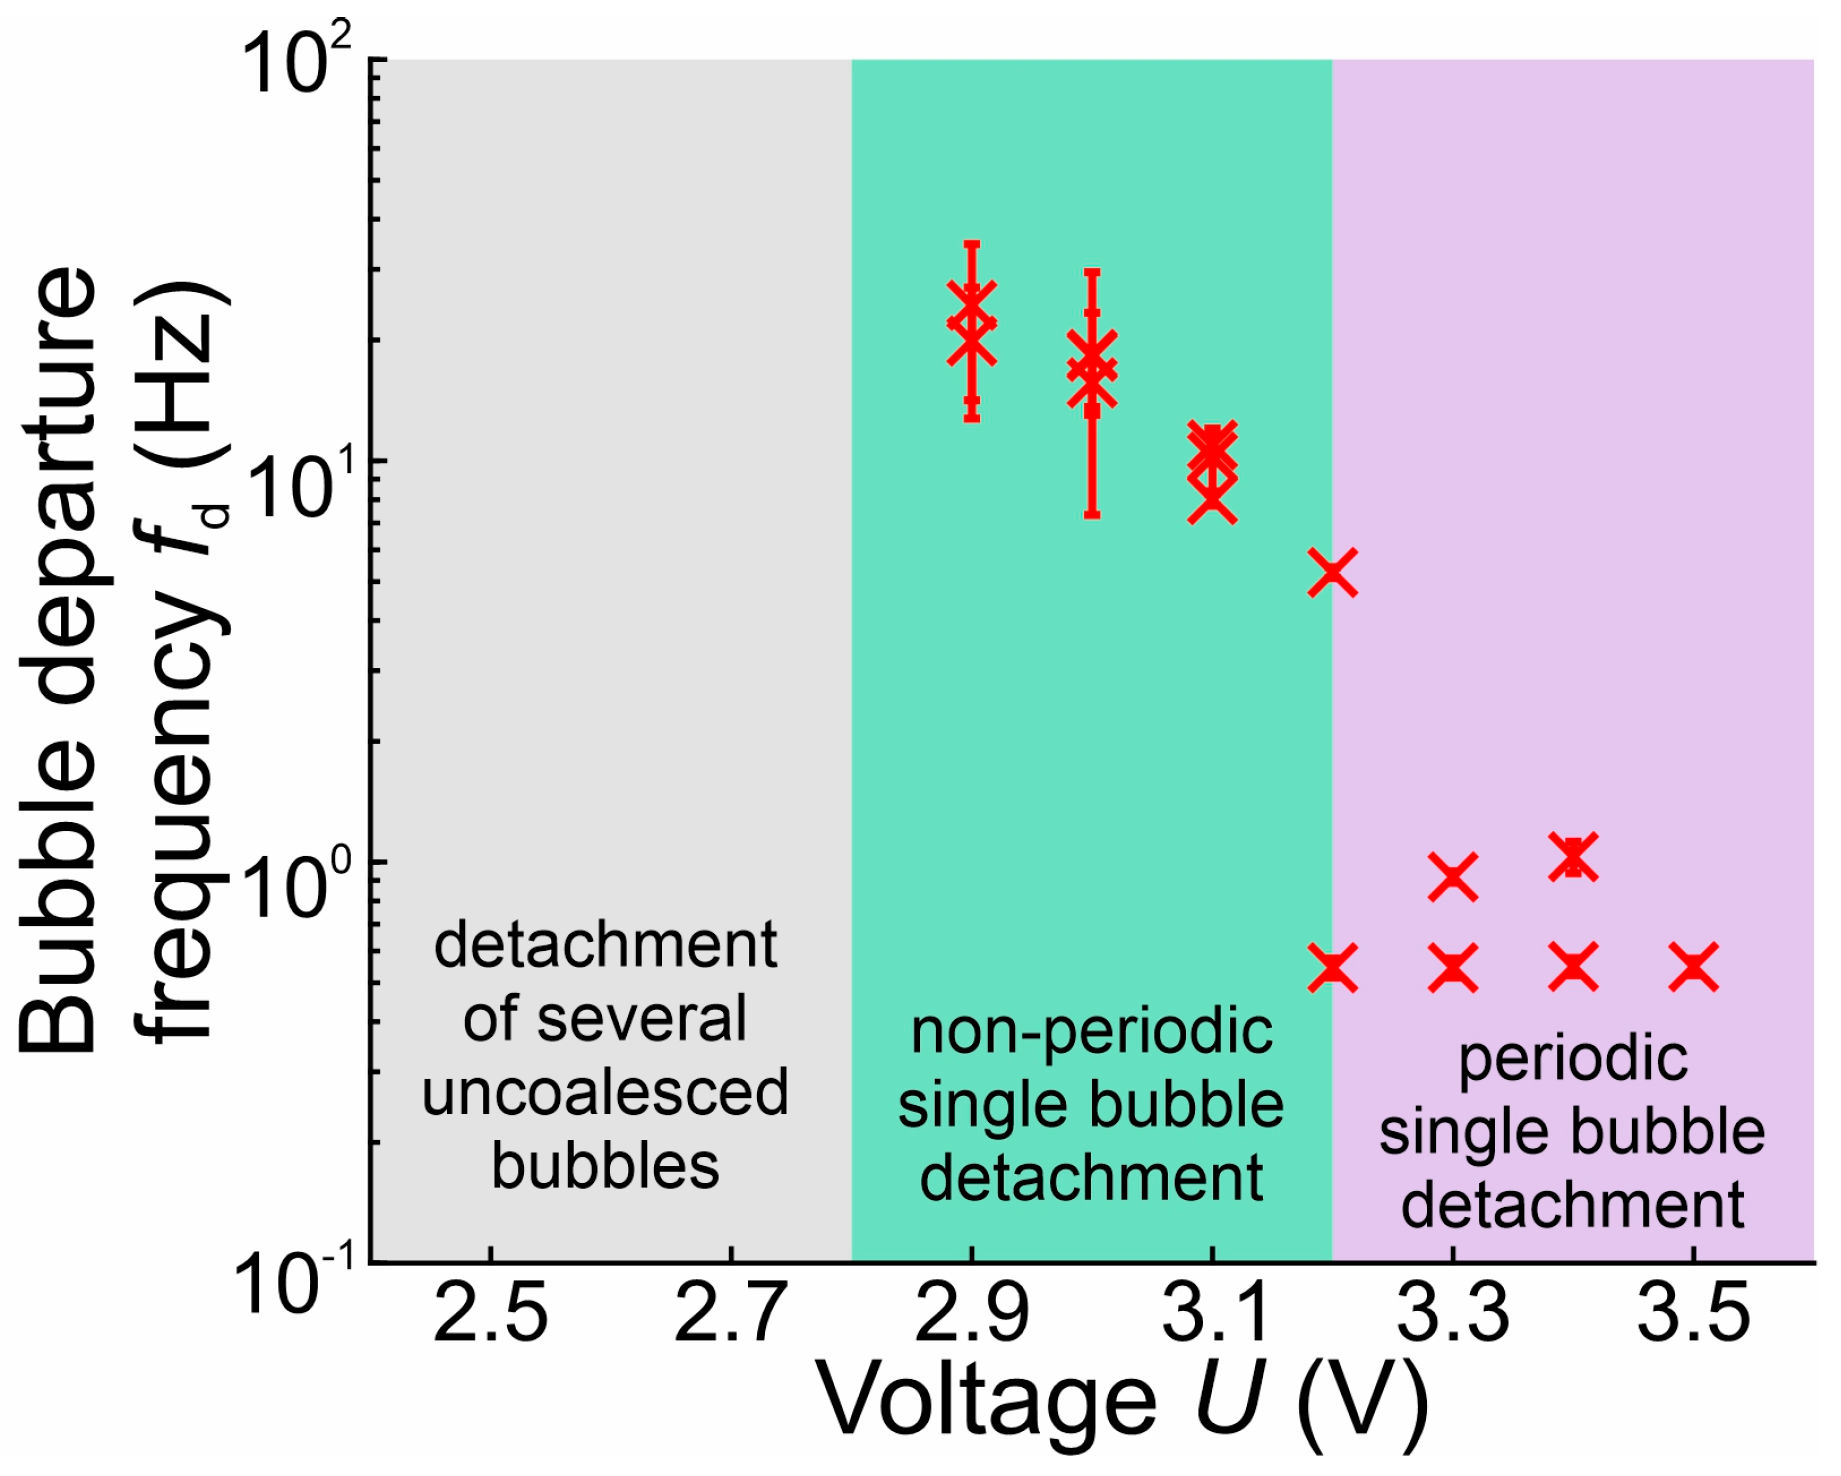
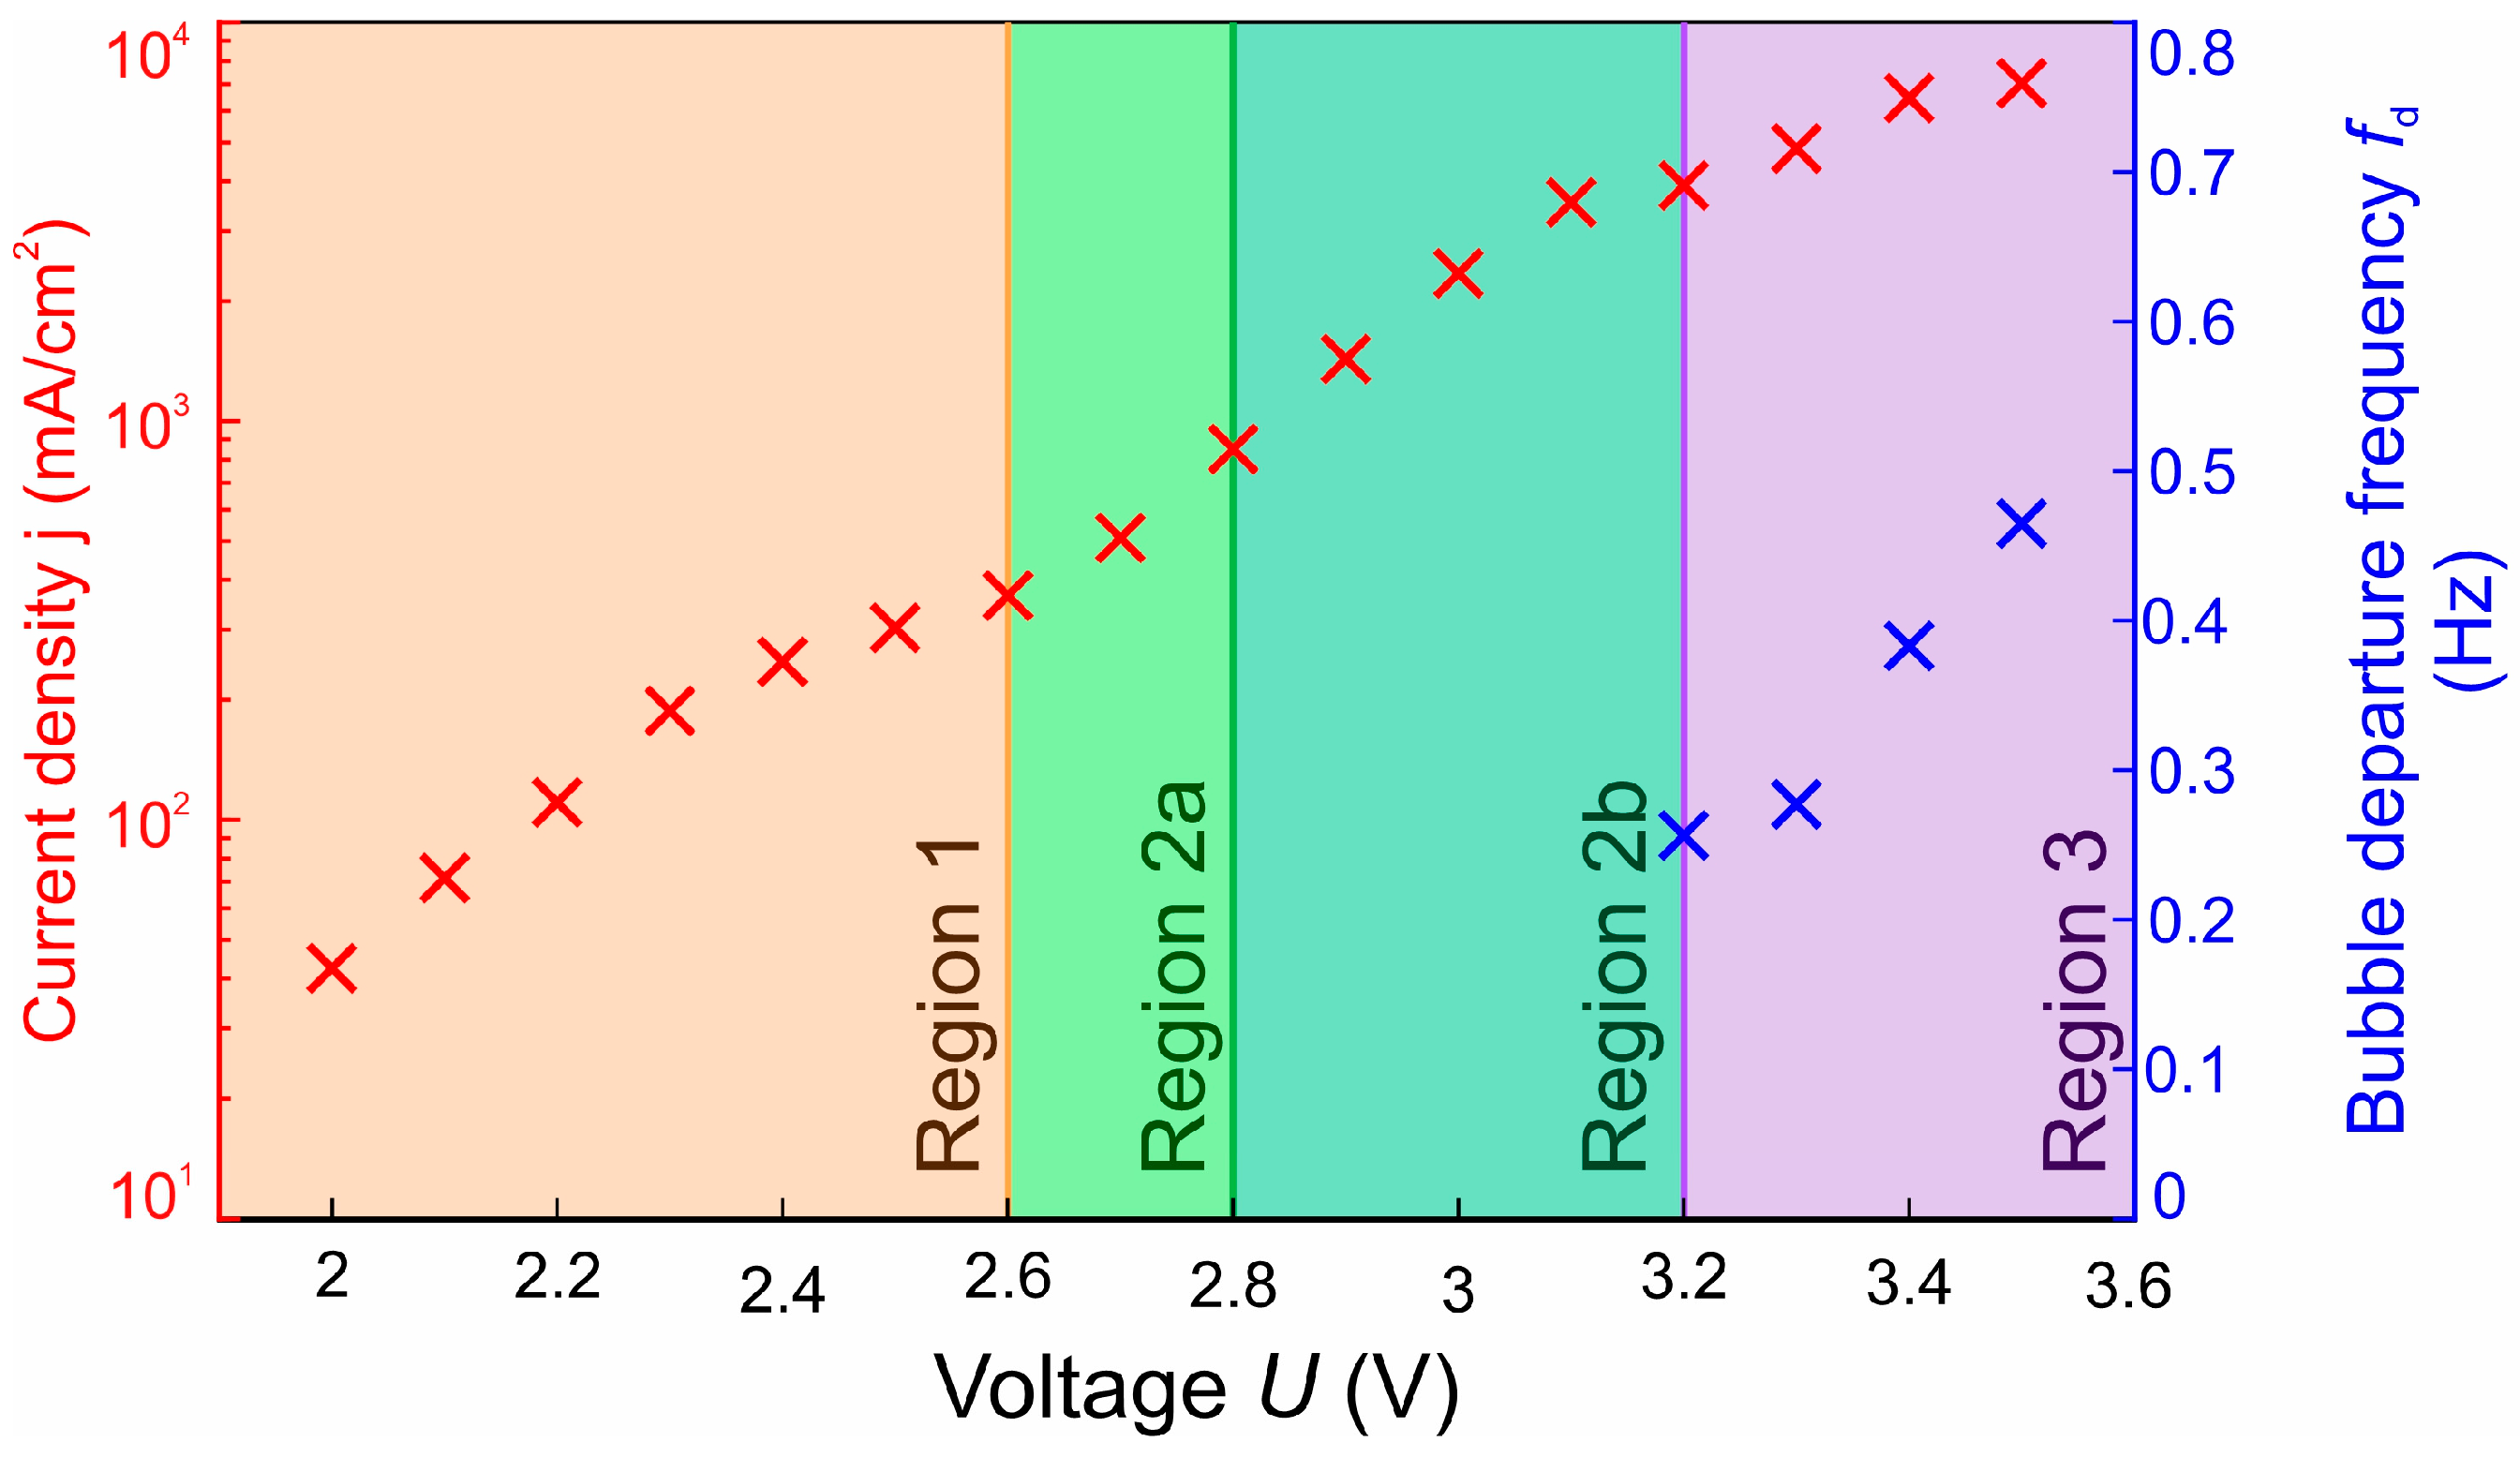
3.2. Bubble Departure Diameters and Frequencies

The applied potential impacts the bubble departure frequency and the bubble departure diameter. Using high-speed video recordings, we compared the bubble departure frequency measured using a potentiostat and the departure frequency obtained from the high-speed camera footage. Average values together with the corresponding standard deviation are presented in Figure 9. Higher potential results in a greater detachment diameter with a notable jump at 3.3 V, which was previously determined to be a regime-transition region. The scatter of the bubble departure diameter values is up to 3% for coalesced bubbles formed at higher potentials and up to 15% for measurements at lower potentials with limited coalescence and microbubble emission. At 3.0 V, a higher scatter of 29% was measured since the detachment of bubbles was nonperiodic at this specific potential, resulting in a greater scatter of measured bubble diameters.
In Figure 10, the bubble departure frequency is presented for a set of applied potentials using a logarithmic scale. Several bubbles were evaluated using high-speed video recording, and the scatter of the measured diameters from each recording is presented with vertical error bars. The scatter of bubble departure frequencies is approximately constant for the detachment of coalesced bubbles, representing up to 5% of the total calculated frequency. Again, a much higher scatter was observed at 3.0 V, pointing to irregular bubble detachment with a value of 60% compared to the average calculated frequency. For potentials ranging from 2.8 V downwards, frequency was not evaluated as bubbles did not coalesce into a single bubble before detaching from the surface.

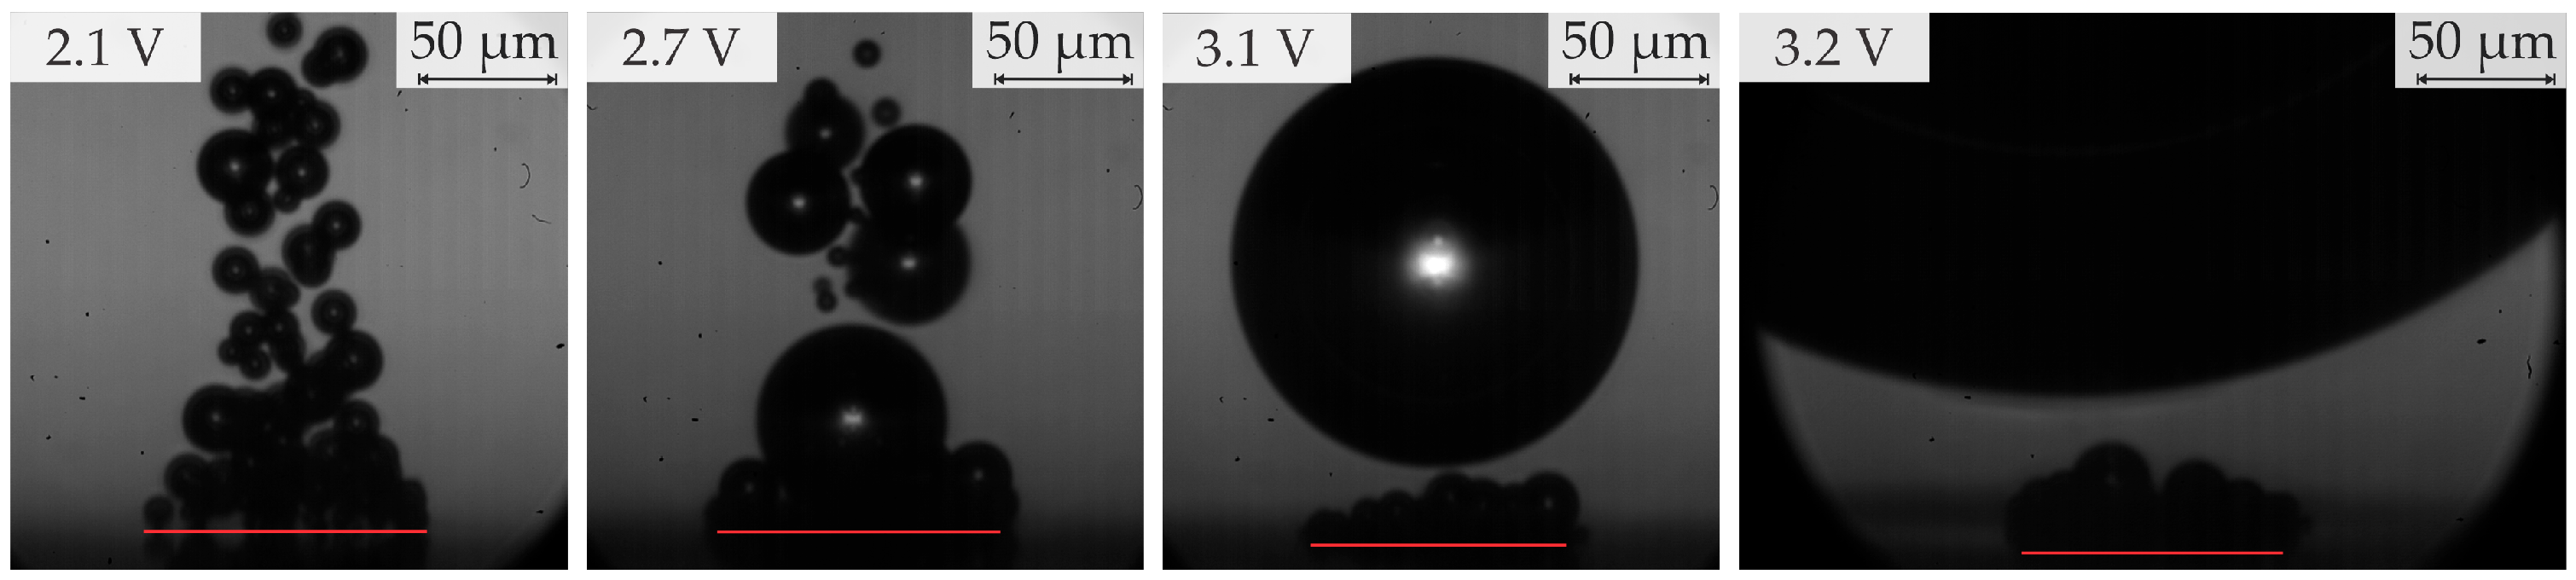
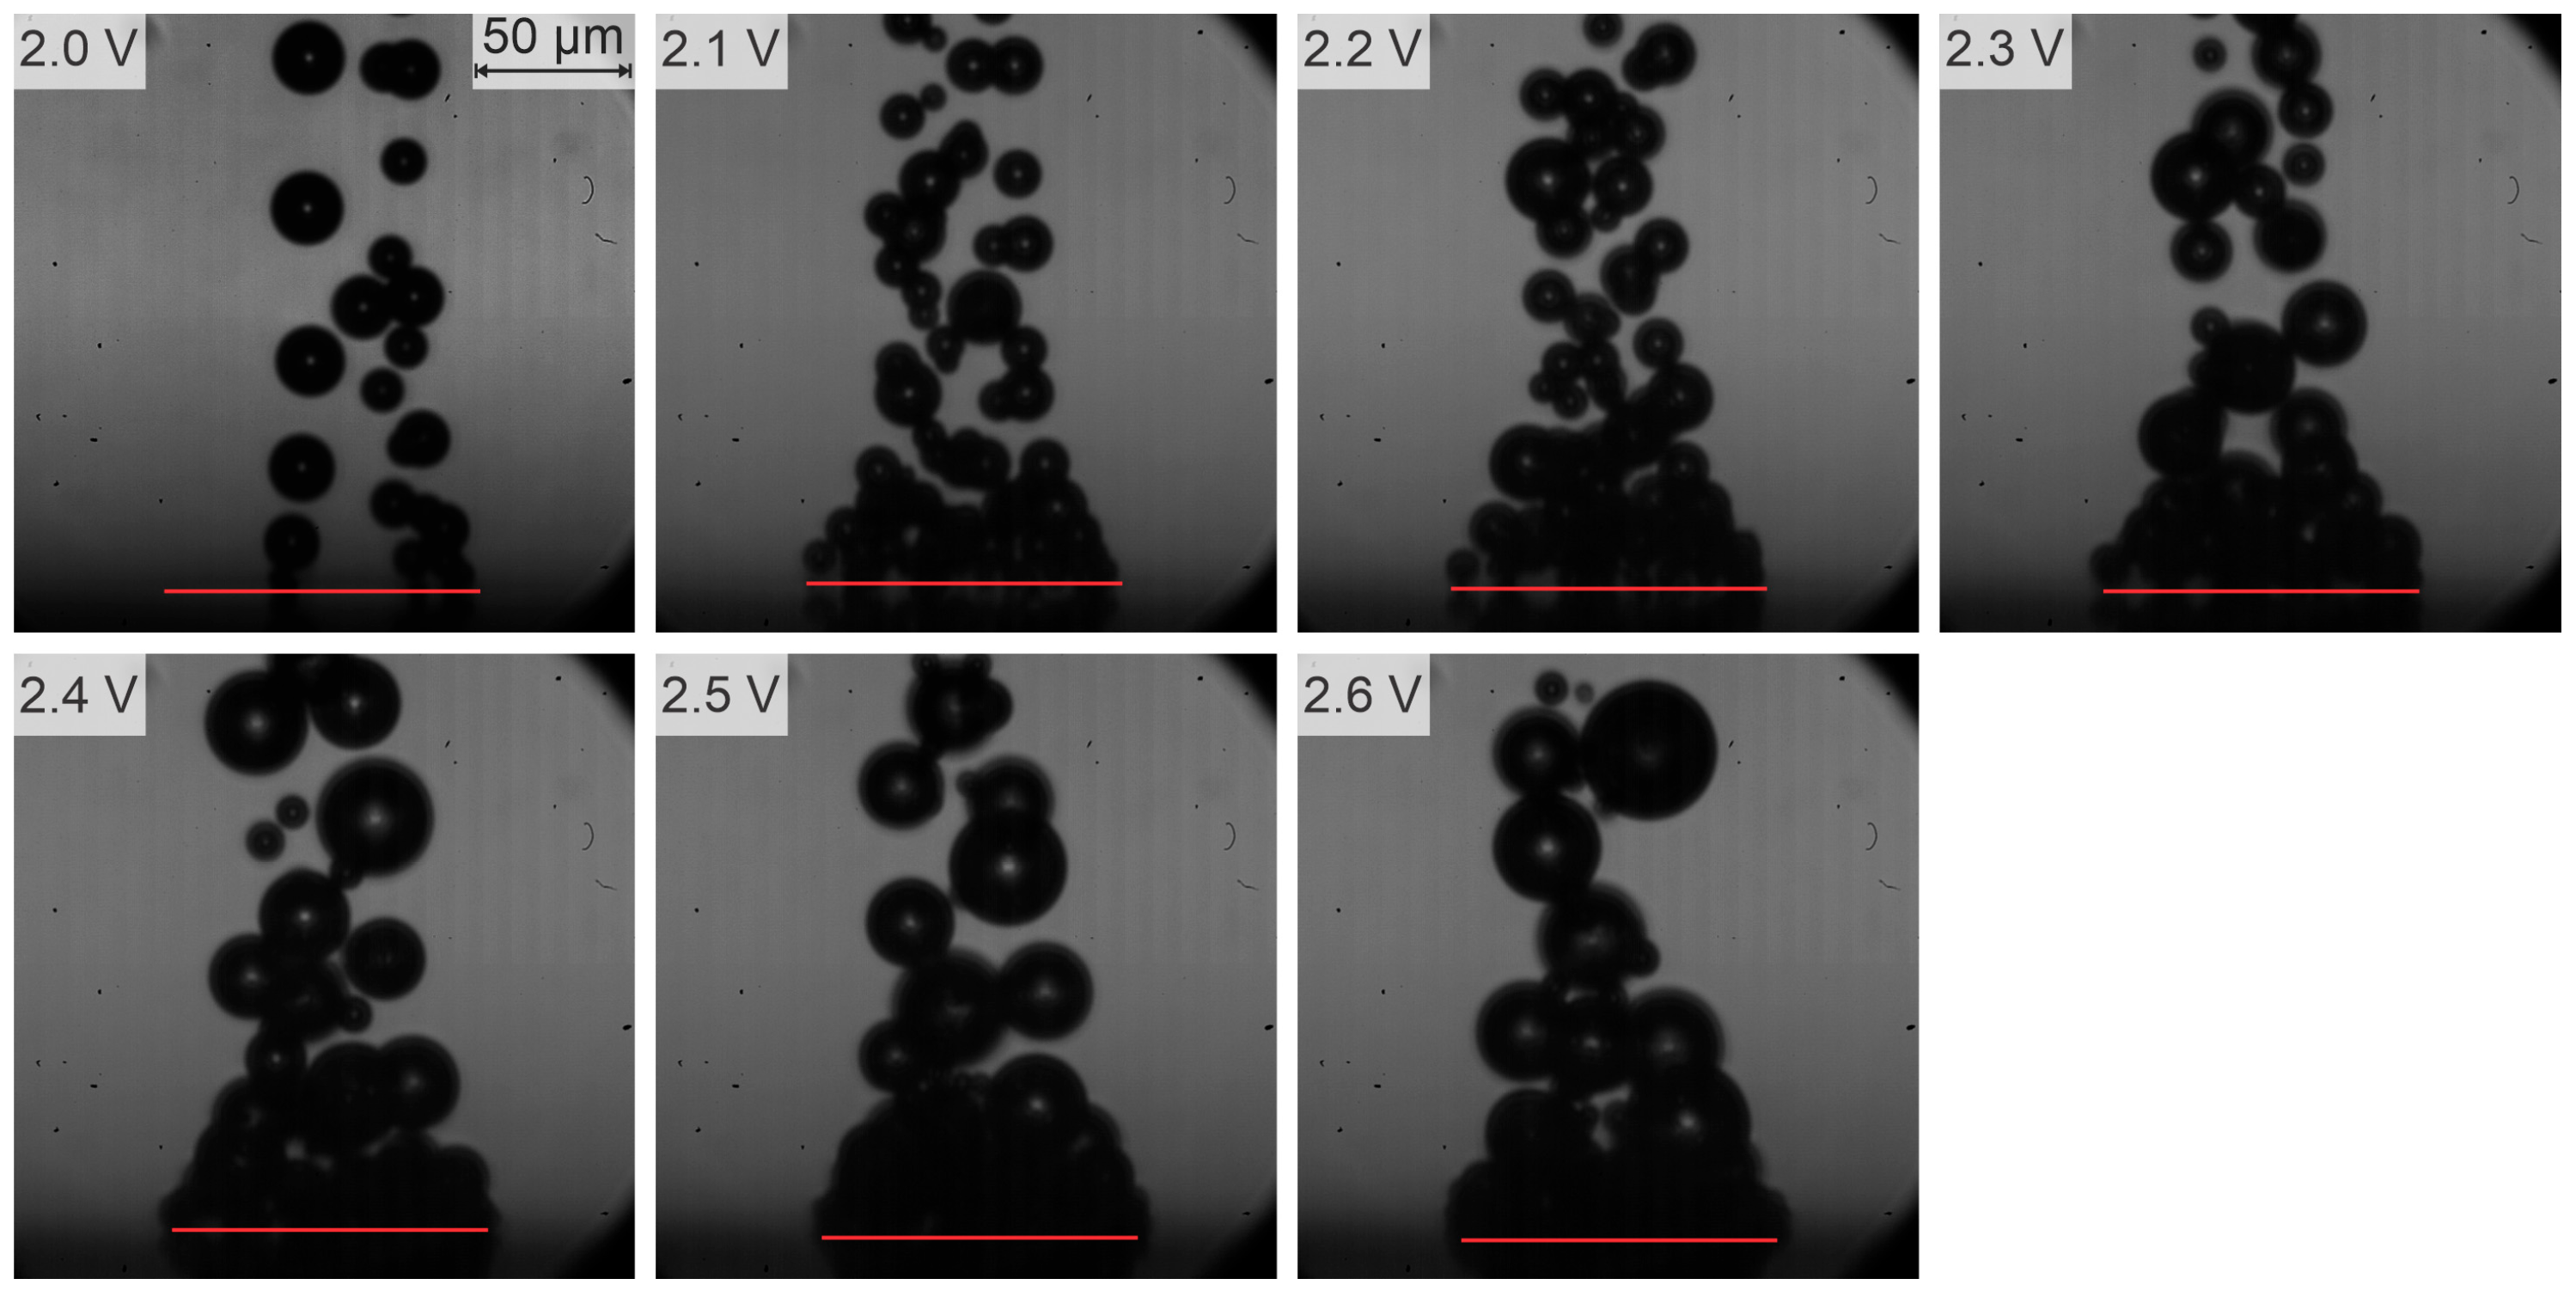
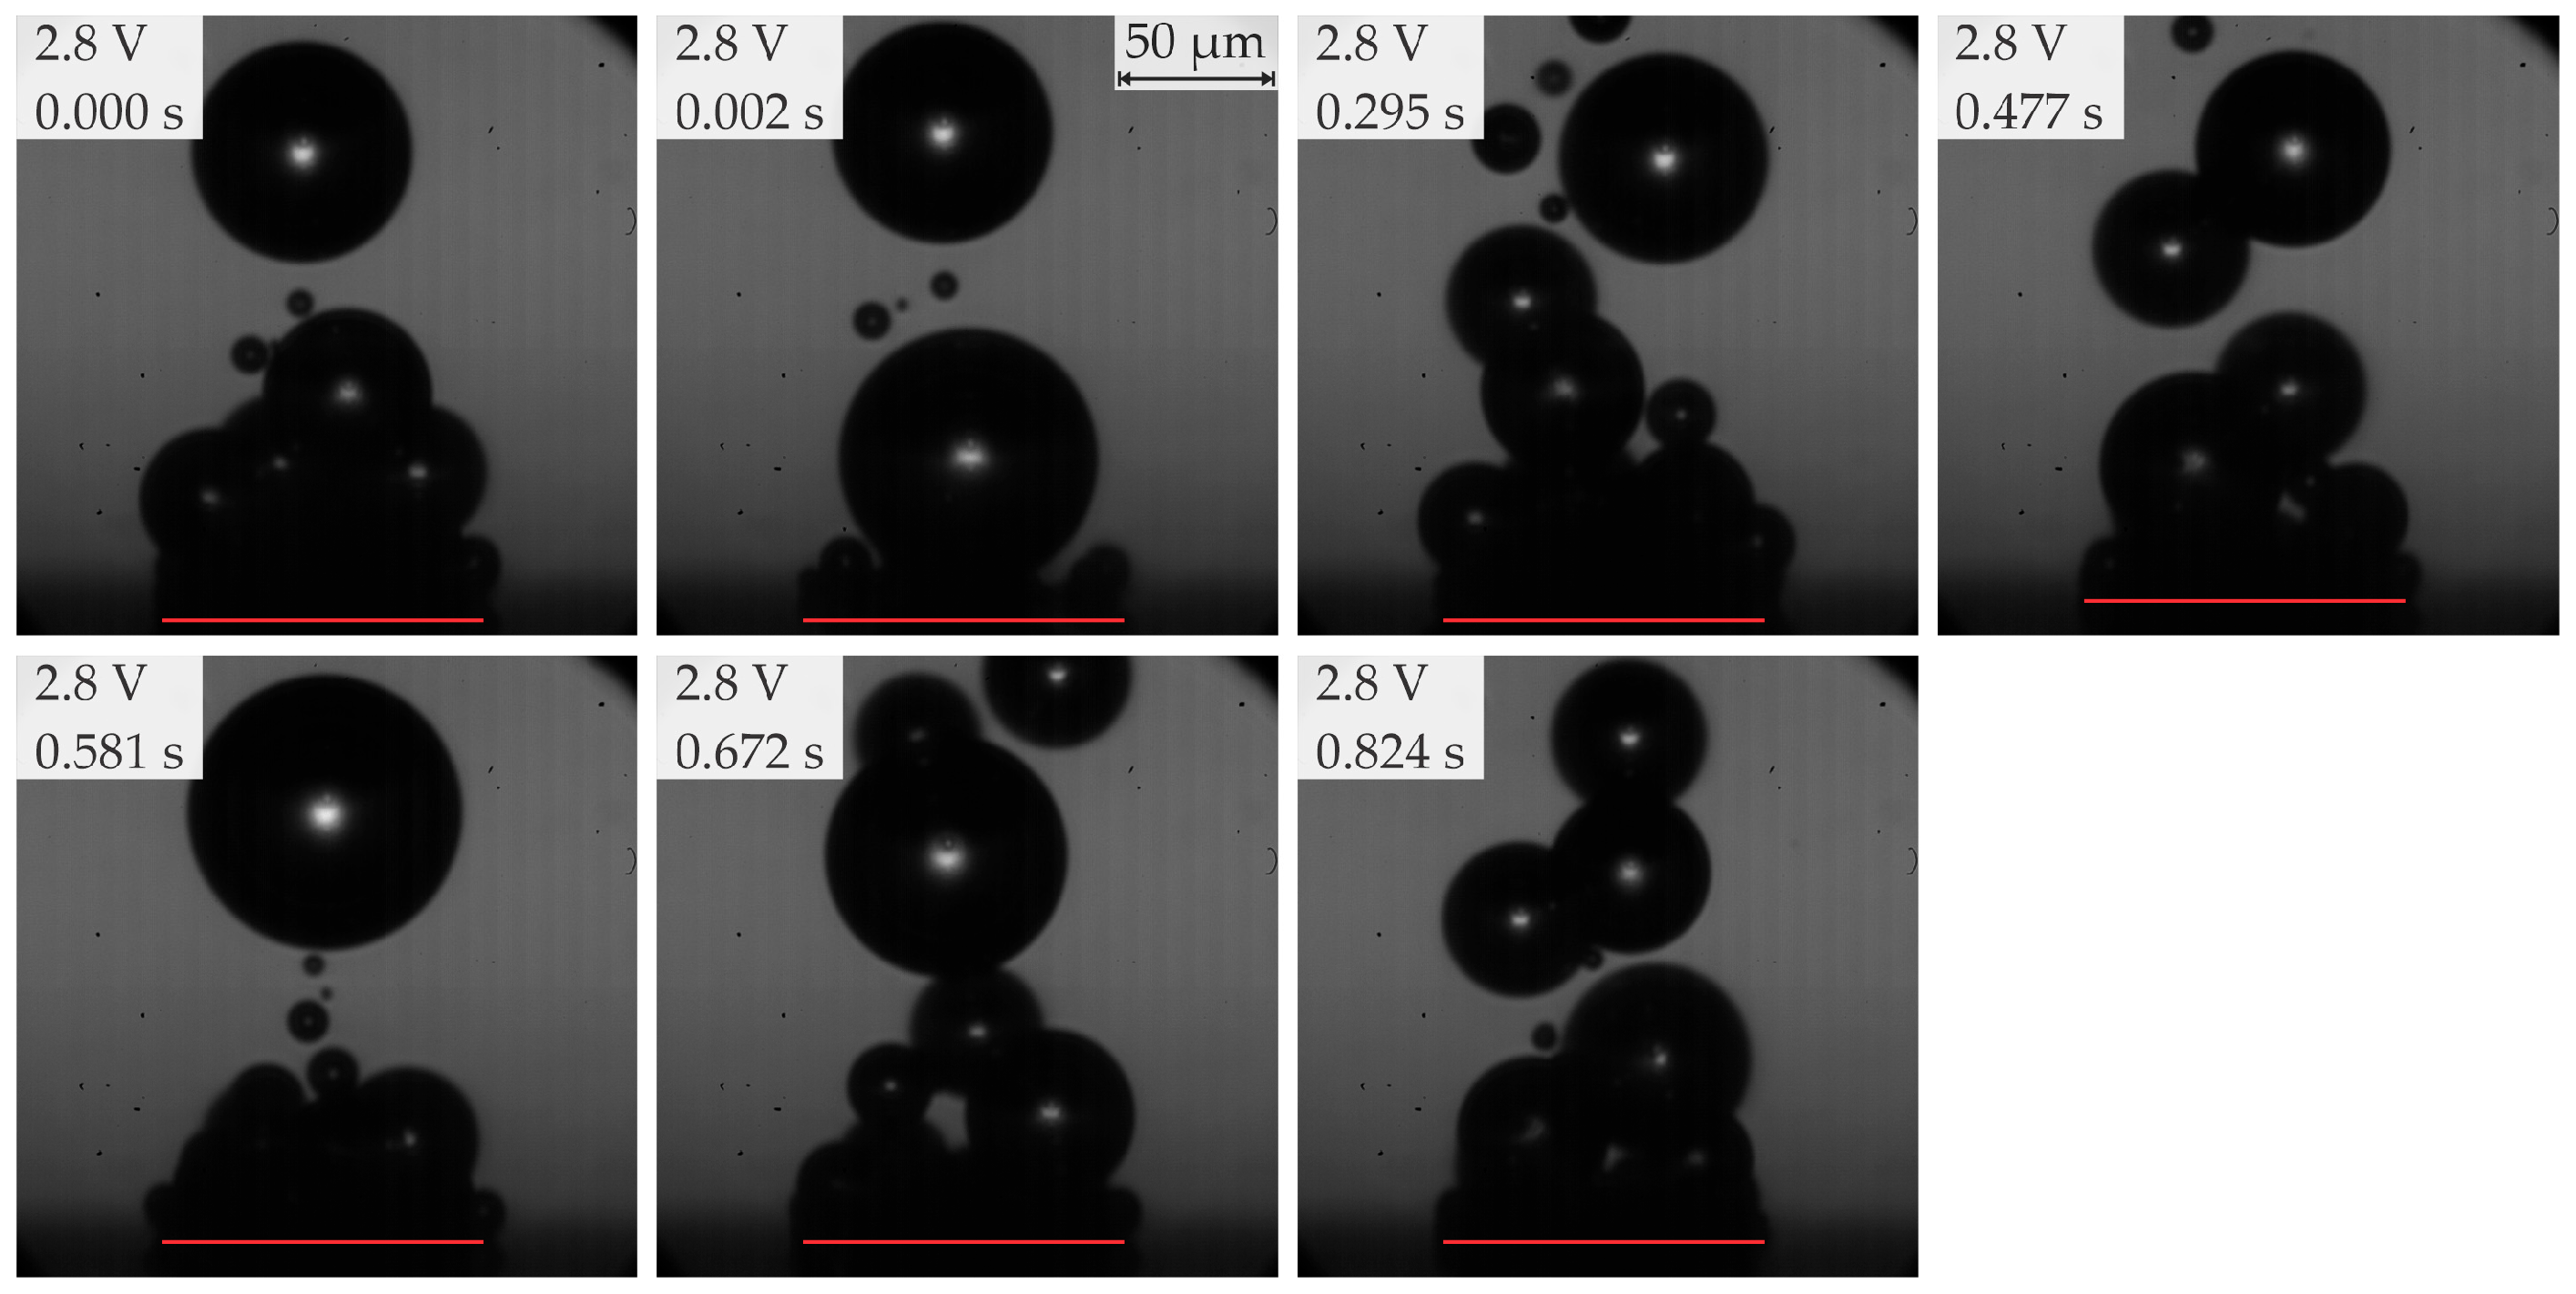
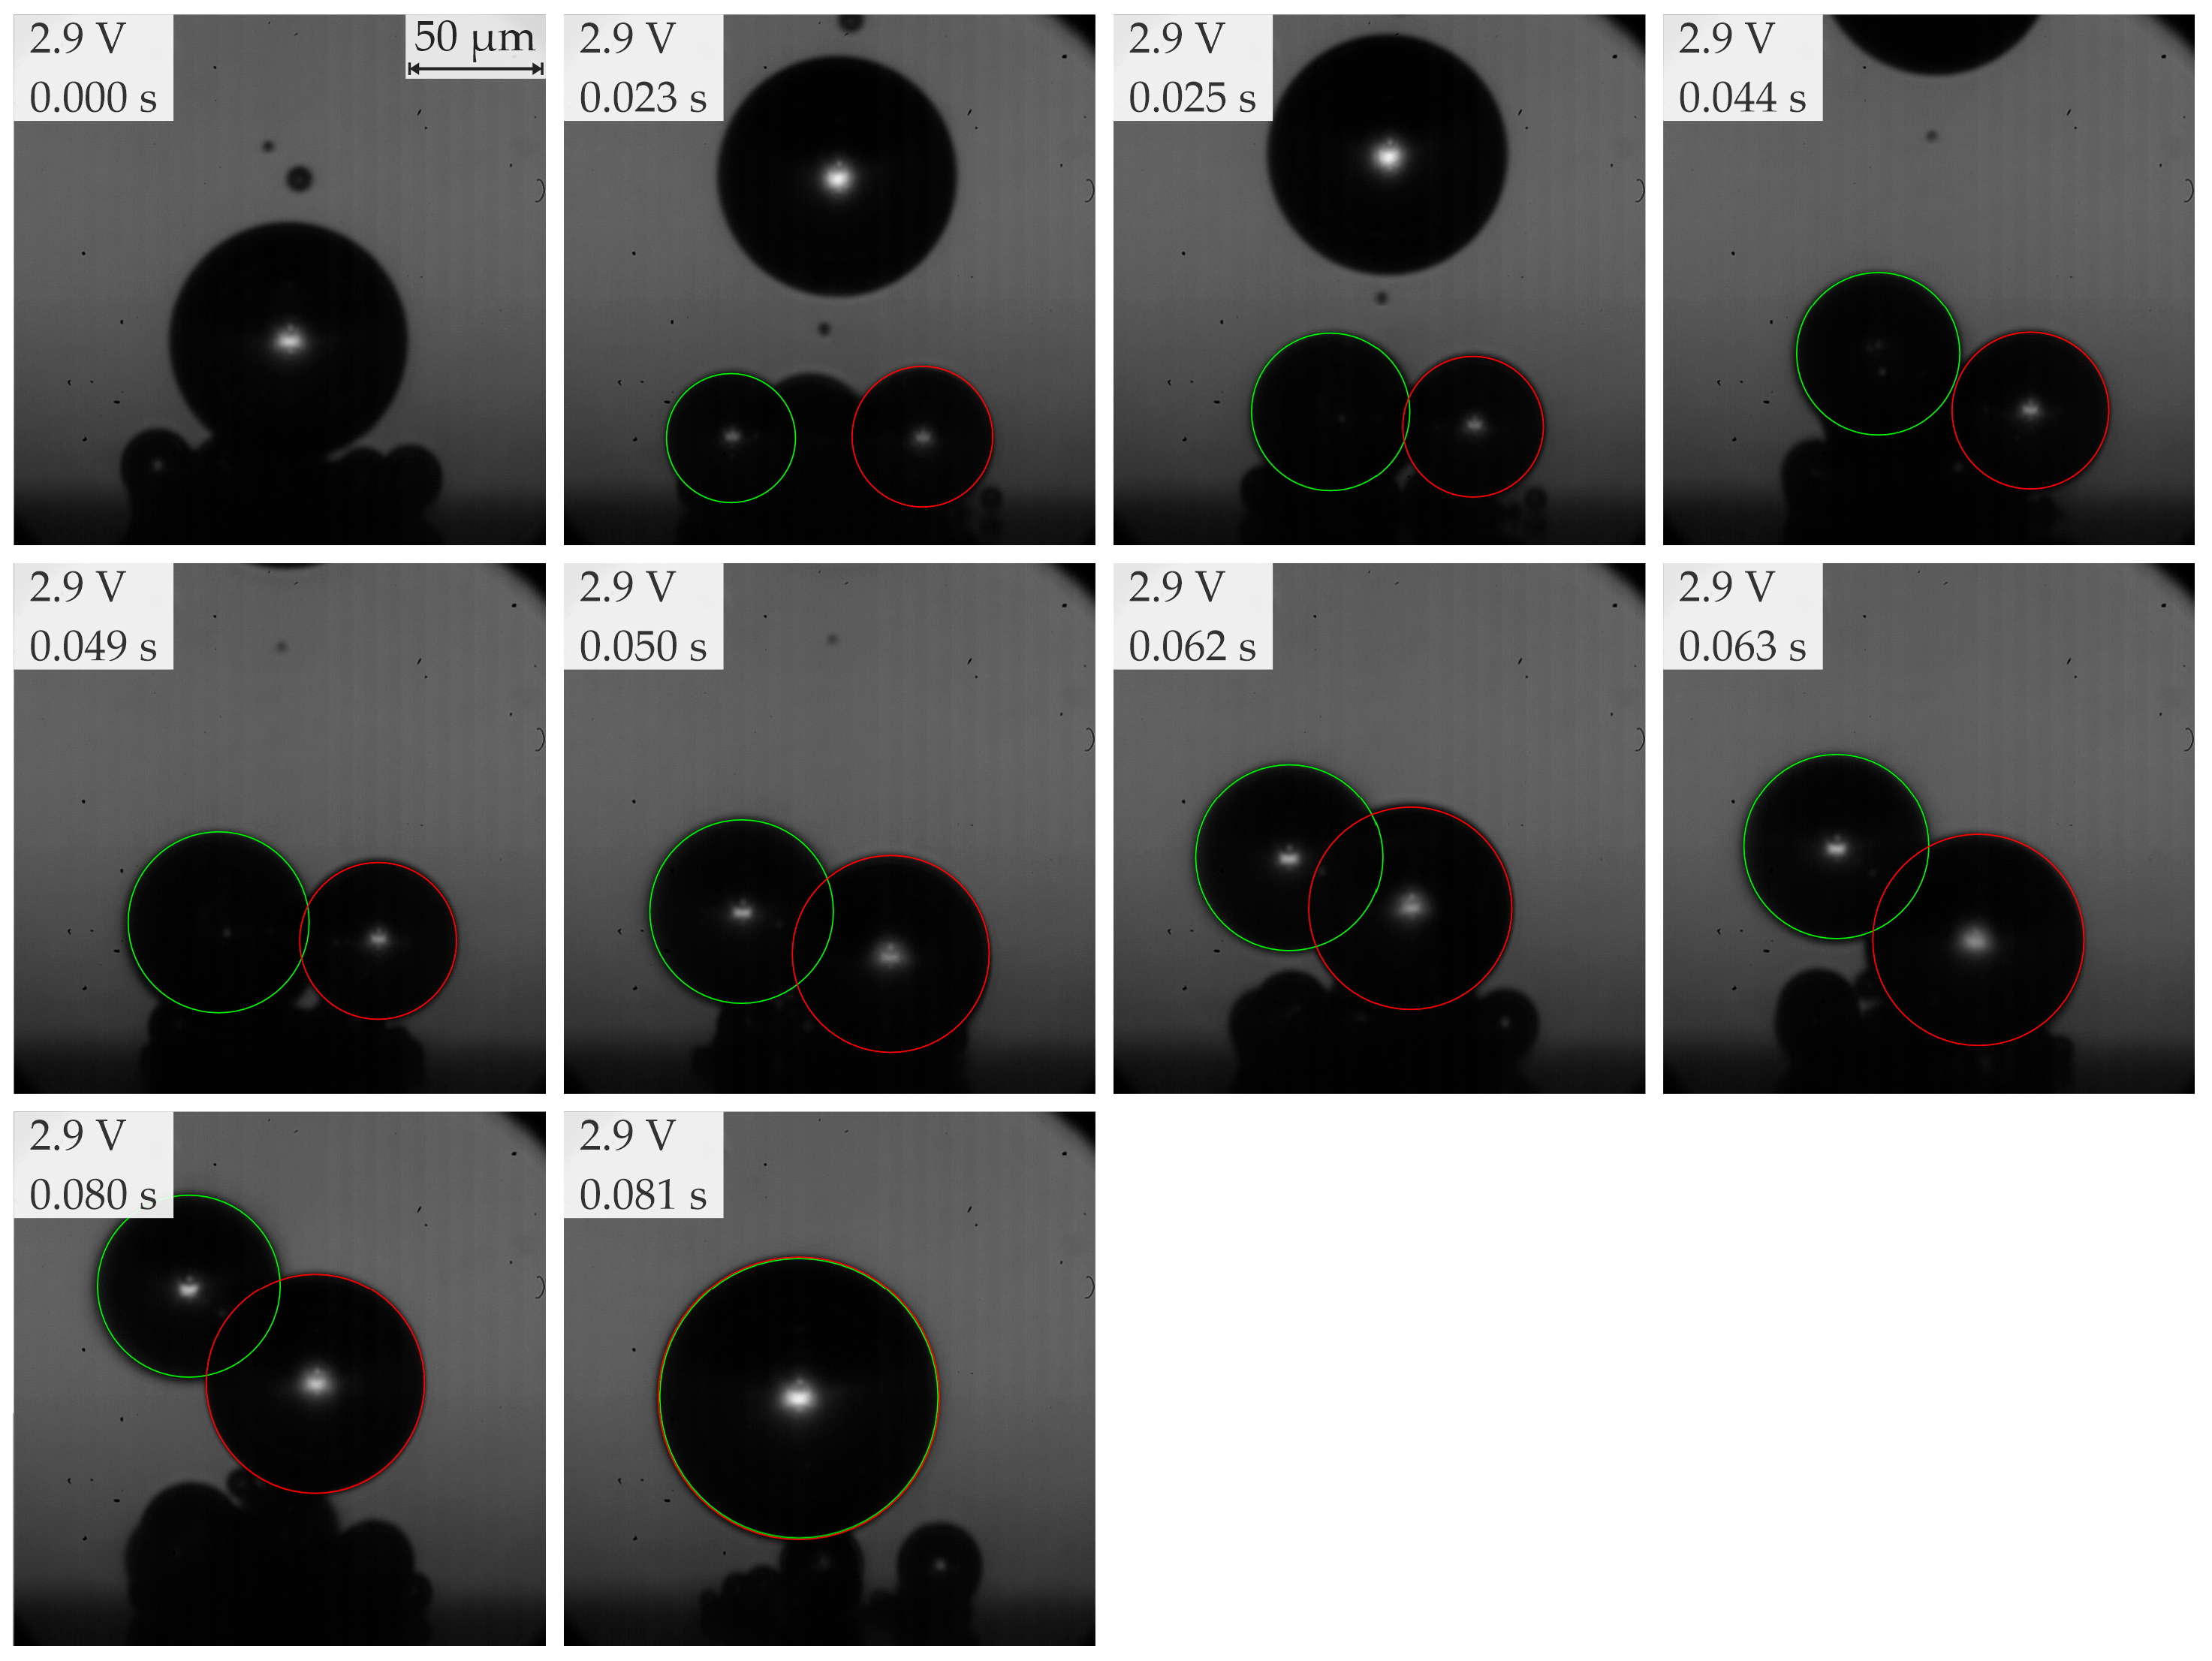
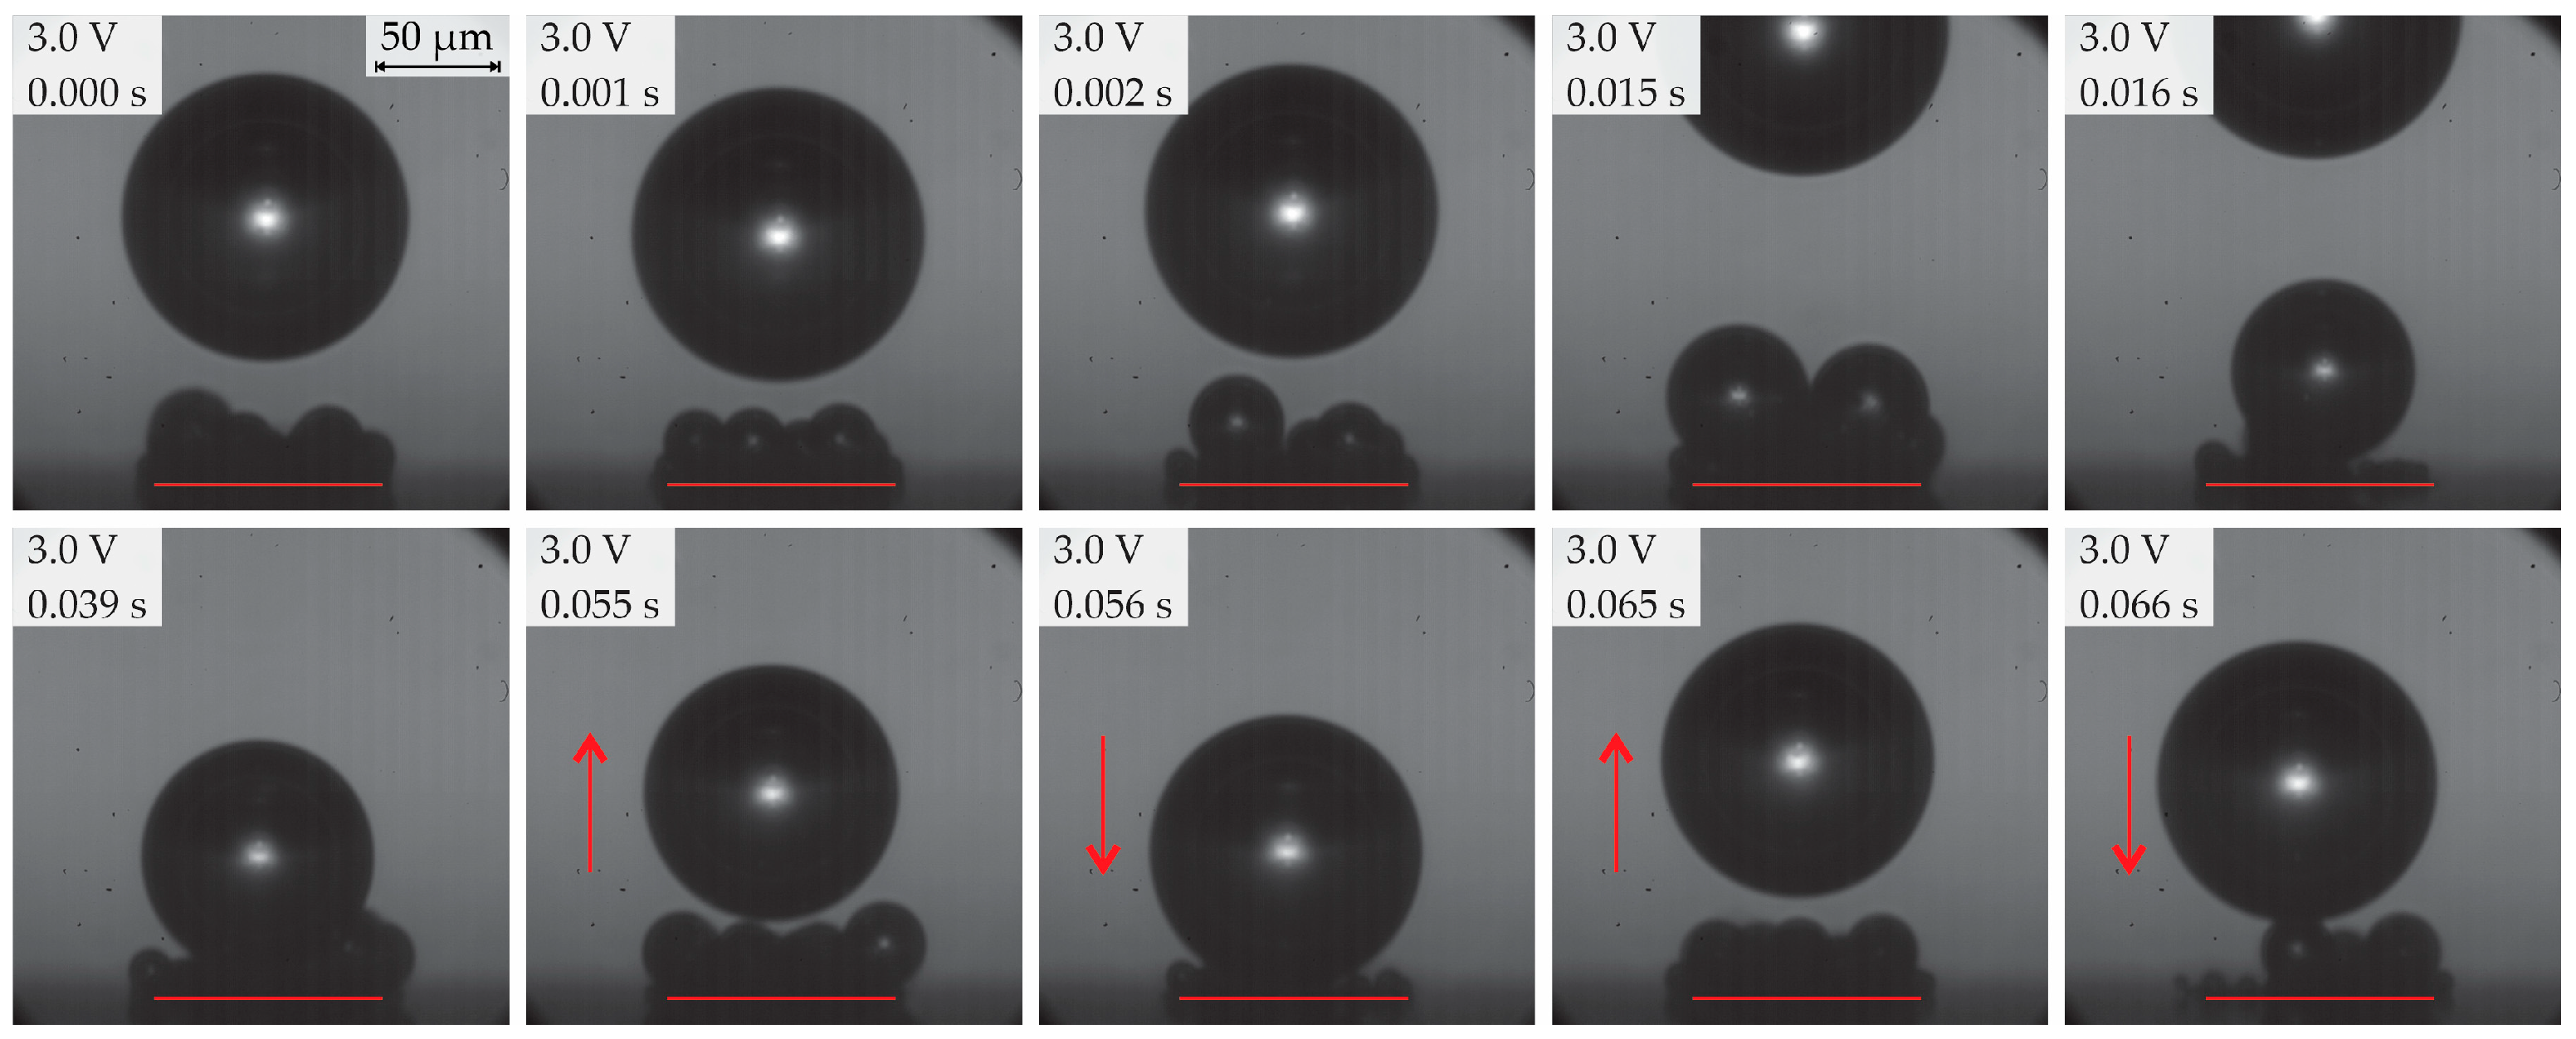
3.3. Bubble Growth and Departure Regimes

Bubble growth and departure regimes were investigated further through high-speed camera footage. At a potential of 1.9 V, bubble nucleation failed to occur. Starting from 2.0 V and up to 2.3 V, nucleation sites are visible in the reflection of the surface. At higher potentials, the nucleation site density increases together with the size of the bubbles, obscuring the identification of individual microbubbles.
For low potentials ranging from 2.0 to 2.6 V at increments of 0.1 V, a single snapshot is presented at each potential. At 2.0 V, only three nucleation sites are active, while the bubble departure diameter varies between individual nucleation sites. Bubbles detaching from the nucleation site on the left are considerably larger compared to the bubbles from the remaining nucleation sites, as evident in Figure 11. The repeatability of the bubble departure period and departure diameter is more consistent on that particular side, indicating more favorable conditions for nucleation, which can be attributed to local surface chemical and/or topographical properties.
By increasing the voltage above 2.0 V, more nucleation sites become active, making it increasingly difficult to track individual microbubble growth. The bubble departure diameters increase with applied potential. Some bubble coalescence might be present above 2.4 V, but it is not as clear as with voltages above 2.7 V.
At a potential of 2.7 V, bubbles start to coalesce, as presented in Figure 12. At this potential, despite prevailing coalescence, several non-coalesced bubbles still depart from the surface. Occasionally, large bubbles with a diameter of up to ~60% of the electrode diameter form, with an example presented at 0.131 s, denoted by a red arrow.
At 2.8 V, the diameter of coalesced bubbles increases significantly compared to those observed at 2.7 V, as shown in Figure 13. Microbubbles are rarely visible, with most bubbles having a departure diameter of approximately 50 μm. The occurrence of larger single bubbles with a departure diameter of 100 μm or more is rare (an example is shown in Figure 13 at 0.581 s). The coalesced bubble with a diameter equal to or larger than the electrode prevents other bubbles from departing simultaneously and represents the total hydrogen generated during the bubble growth period.
At 2.9 V, a single large coalesced bubble predominantly departs from the electrode surface. In Figure 14, the growth of such a bubble is captured at different time frames. Immediately after the previous bubble detachment at the 0.000 s mark, several micro bubbles start to individually form on the surface and eventually coalesce into larger bubbles. At 0.023 s, three coalesced bubbles are observed.
Interestingly, the bubble on the left-hand side (marked with green borderline) starts to depart from the surface at the 0.044 s mark but is pulled down towards the surface due to coalescence with another bubble seen at the back of the imaging plane (i.e., see the snapshot at 0.023 s). After the 0.050 s mark, this bubble starts departing again. Bubble interaction in the vertical direction has previously been studied by Bashkatov et al. [30], where the first detached bubble was attached towards the electrode surface while the second bubble just departed from the electrode, exhibiting a sudden reversal in motion, followed by coalescence with the first bubble. As the left bubble departs, all of the nucleating microbubbles start feeding the bubble on the right-hand side (marked with red borderline), which grows in size and starts departing after the 0.063 s mark. Within 0.001 s (between 0.080 s and 0.081 s marks), the two bubbles merge into a single one that finally completely departs from the surface. While Figure 14 only shows one case, similar behavior is frequently observed at 2.9 V operation, where the actual time and size of departure depend on the spatiotemporal distribution of intermediate (~50 μm) bubbles.
The growth of a single coalesced bubble at 3.0 V is presented in Figure 15. Two intermediate coalesced bubbles appear, and they merge between the 0.015 and 0.016 s mark. This bubble nearly departs at 0.055 s but is pulled back this time due to multiple simultaneous coalescences with smaller bubbles that grow atop the electrode; bubble motion compared with location at previous time stamp is denoted with red arrows.
Bubble motion reversals and contactless interaction between two hydrogen bubbles during water electrolysis were previously studied in-depth by Bashkatov et al. [30]. They reported that the most prominent scenario of bubble interaction consists of a sudden reversal of the first detached bubble’s motion, causing the bubble to return to the electrode’s surface and coalesce with the second bubble, attributing this effect primarily to thermocapillary (Marangoni) forces. When the thermal boundary layer on top of the second bubble (i.e., bubble at the bottom) can touch the bottom of the first bubble (i.e., bubble at the top), bubble reversal motion at specified conditions sets in. Their conclusion was that thermocapillary migration is at the origin of H2 bubble motion reversal, and the interaction of electrogenerated bubbles needs to be taken into account during water electrolysis.
Our observations, while not refuting the role of Marangoni forces, emphasize that an extended contact line, formed by a dense layer of microbubbles bridging the electrode and the larger bubble, also plays a significant role. This extended contact line increases the pinning force, which in turn may counteract buoyancy and contribute to the reversal of bubble motion. Due to the limitations of our current visualization techniques, we are unable to separate the influence of Marangoni forces from that of the extended contact line. Nevertheless, our findings suggest that under certain conditions, both mechanisms may act in concert to influence bubble reversal dynamics. Our observations suggest that bubbles emerging from the electrode increase in size and merge with a larger bubble above. After coalescence, the larger bubble experiences a downward force due to the extended contact line between the electrode and the multitude of microbubbles bridging the gap between the surface and the larger bubble. Since the pinning force is directly proportional to the total contact line length, it becomes significantly stronger than buoyancy in this case, resulting in the observed downward movement. As the bubble continues to grow, buoyancy increases, while the microbubble cloud on the electrode partially merges due to ongoing electrolysis. Once the contact line shortens sufficiently, buoyancy overcomes the pinning force, allowing the bubble to detach. To fully validate this hypothesis, experiments should be conducted on a transparent platinum layer (~5 nm thickness) to enable visualization of the triple contact line position, for example, using the total internal reflection technique. Such an analysis, planned for our future studies, is, however, complex and requires exceptional spatiotemporal resolution.
The process of single bubble evolution at 3.1 V is presented in Figure 16, and the process is largely similar to the bubble evolution at 3.0 V.
At potentials of ≥3.2 V, very large bubbles start to form on the surface, with diameters significantly exceeding the diameter of the microelectrode, as shown in Figure 17. The growth time of these bubbles is notably longer, reaching several seconds. Thus, their behavior was analyzed using a lower recording frequency.
In Figure 18, electrical current density at the end of the measurement interval (at t = 200 s) is presented for all the measured potentials together with the departure frequency of large, coalesced bubbles (where applicable). Within the evaluated range of potentials, data can be divided into three regions, with the transition regions being divided into two sub-regions. These findings can be associated with bubble departure diameters and departure frequencies.
Bashkatov et al. [29] previously defined three regions based on applied potential and the concentration of the electrolyte, namely sulfuric acid. They evaluated the same electrolyte at different concentrations between 0.1 and 1 mol L−1 at potentials between 2 and 10 V. For the sulfuric acid concentration of 0.5 mol L−1, they identified “regime 1” up to 4.7 V, “regime 2” between 4.7 and 10 V, and “regime 3” beyond 10 V. Based on their findings, all of our measurements were conducted in “regime 1”, where bubble evolution is characterized by the growth of nearly spherical bubbles atop a carpet of micro-bubbles. Within this regime, both the position of the bubble apex and electrical current variations are monotonic, with no significant oscillations in current during the bubble growth cycle.
We further explored the degree of bubbles coalescence within the evaluated electrical potential range using a 0.5 mol L−1 sulfuric acid electrolyte. Based on qualitative observations from high-speed video recording and quantitative analysis of potentiostat measurements, we defined three distinct regions characterized by specific bubble behavior and current responses.
In “Region 1”, observed at applied potentials between 2.0 and 2.6 V, bubble formation is characterized by the emergence of isolated, nearly spherical bubbles with negligible coalescence. The electrical current density remains relatively stable, indicating minimal disruption due to bubble detachment. Hydrogen bubble departure frequency in this region could only be estimated by counting bubbles within a specified period, as no significant current oscillations were observed.
“Region 2”, identified as a transitional range of applied potentials from 2.6 to 3.2 V, exhibits increased bubble coalescence. Within this region, two subregions are identified. In subregion 2a, occurring at potentials in the lower part of this range, multiple bubbles coalesce and detach simultaneously, though not as a single entity. Specifically, several coalesced bubbles grow and detach from the surface simultaneously instead of coalescing into a single large bubble. Subregion 2b, observed at a potential approaching 3.2 V, is characterized by a single coalesced bubble detaching from the surface, encompassing most detachable bubbles present before coalescence. In this subregion, most bubbles reach a diameter equal to the electrode diameter at the time of detachment. Within this subregion, bubbles can be identified and tracked, as presented in Figure 18. Departure frequency is presented for applied potentials from 3 V upwards.
“Region 3”, defined at applied potentials of 3.2 V and above, involves bubble coalescence leading to the formation of larger bubbles that detach more predictably. The departure frequency can be reliably extracted from the potentiostat measurement data, as the electrical current density exhibits pronounced drops corresponding to bubble detachment events. For Region 3, the departure frequency is presented for all applied potentials, as it can be readily extracted via high-speed video recordings as well as from the electrical current measurements. The limitation of bubble tracking using high-speed video is that applied magnification does not enable observation of the entire bubble at detachment due to its large diameter.
In Table 1, an overview of the discussed regions is presented along with departure diameters and frequency ranges, presented in previous sections.

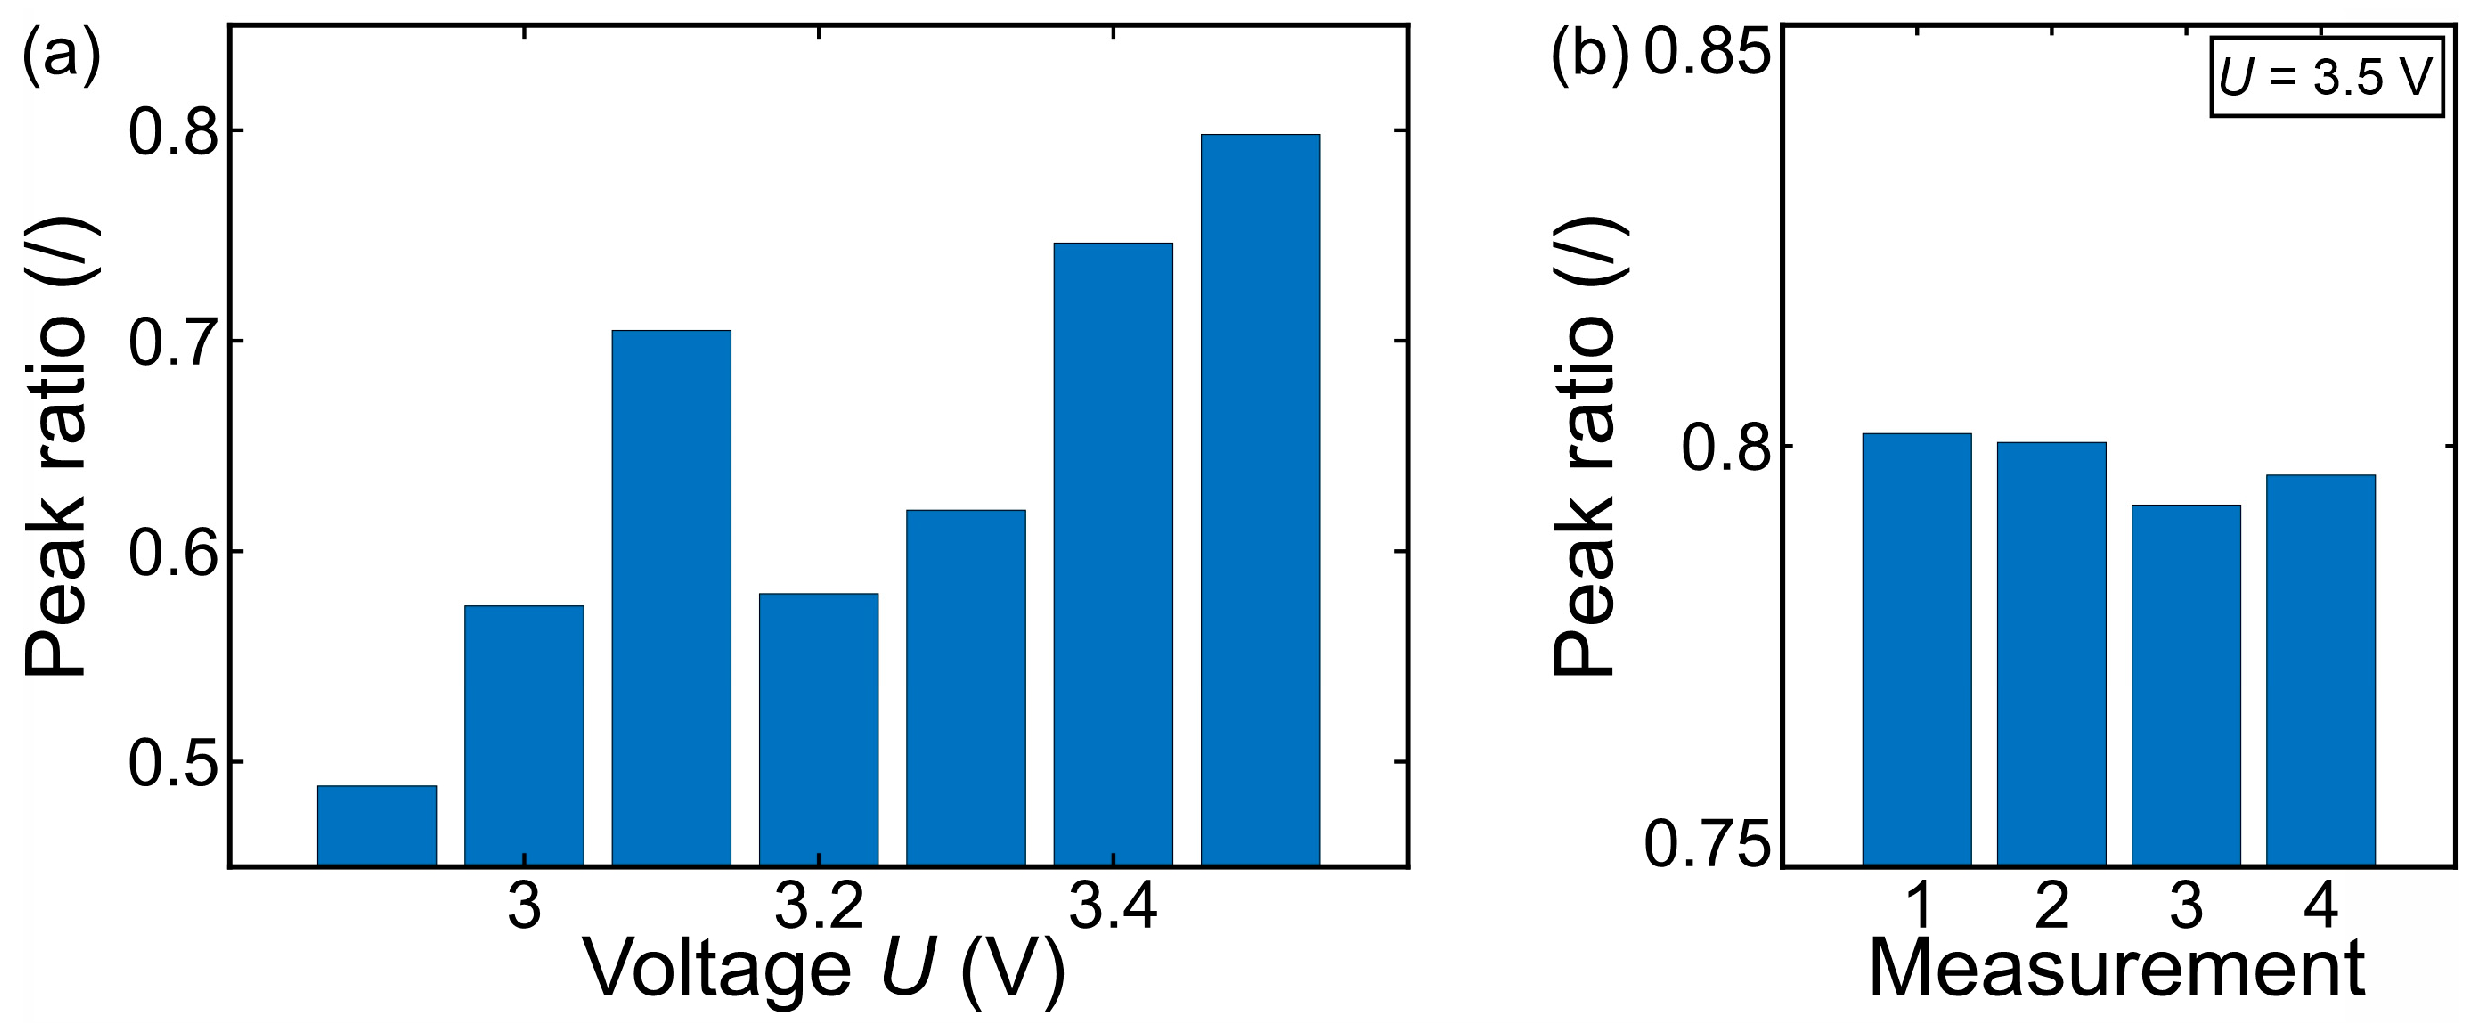
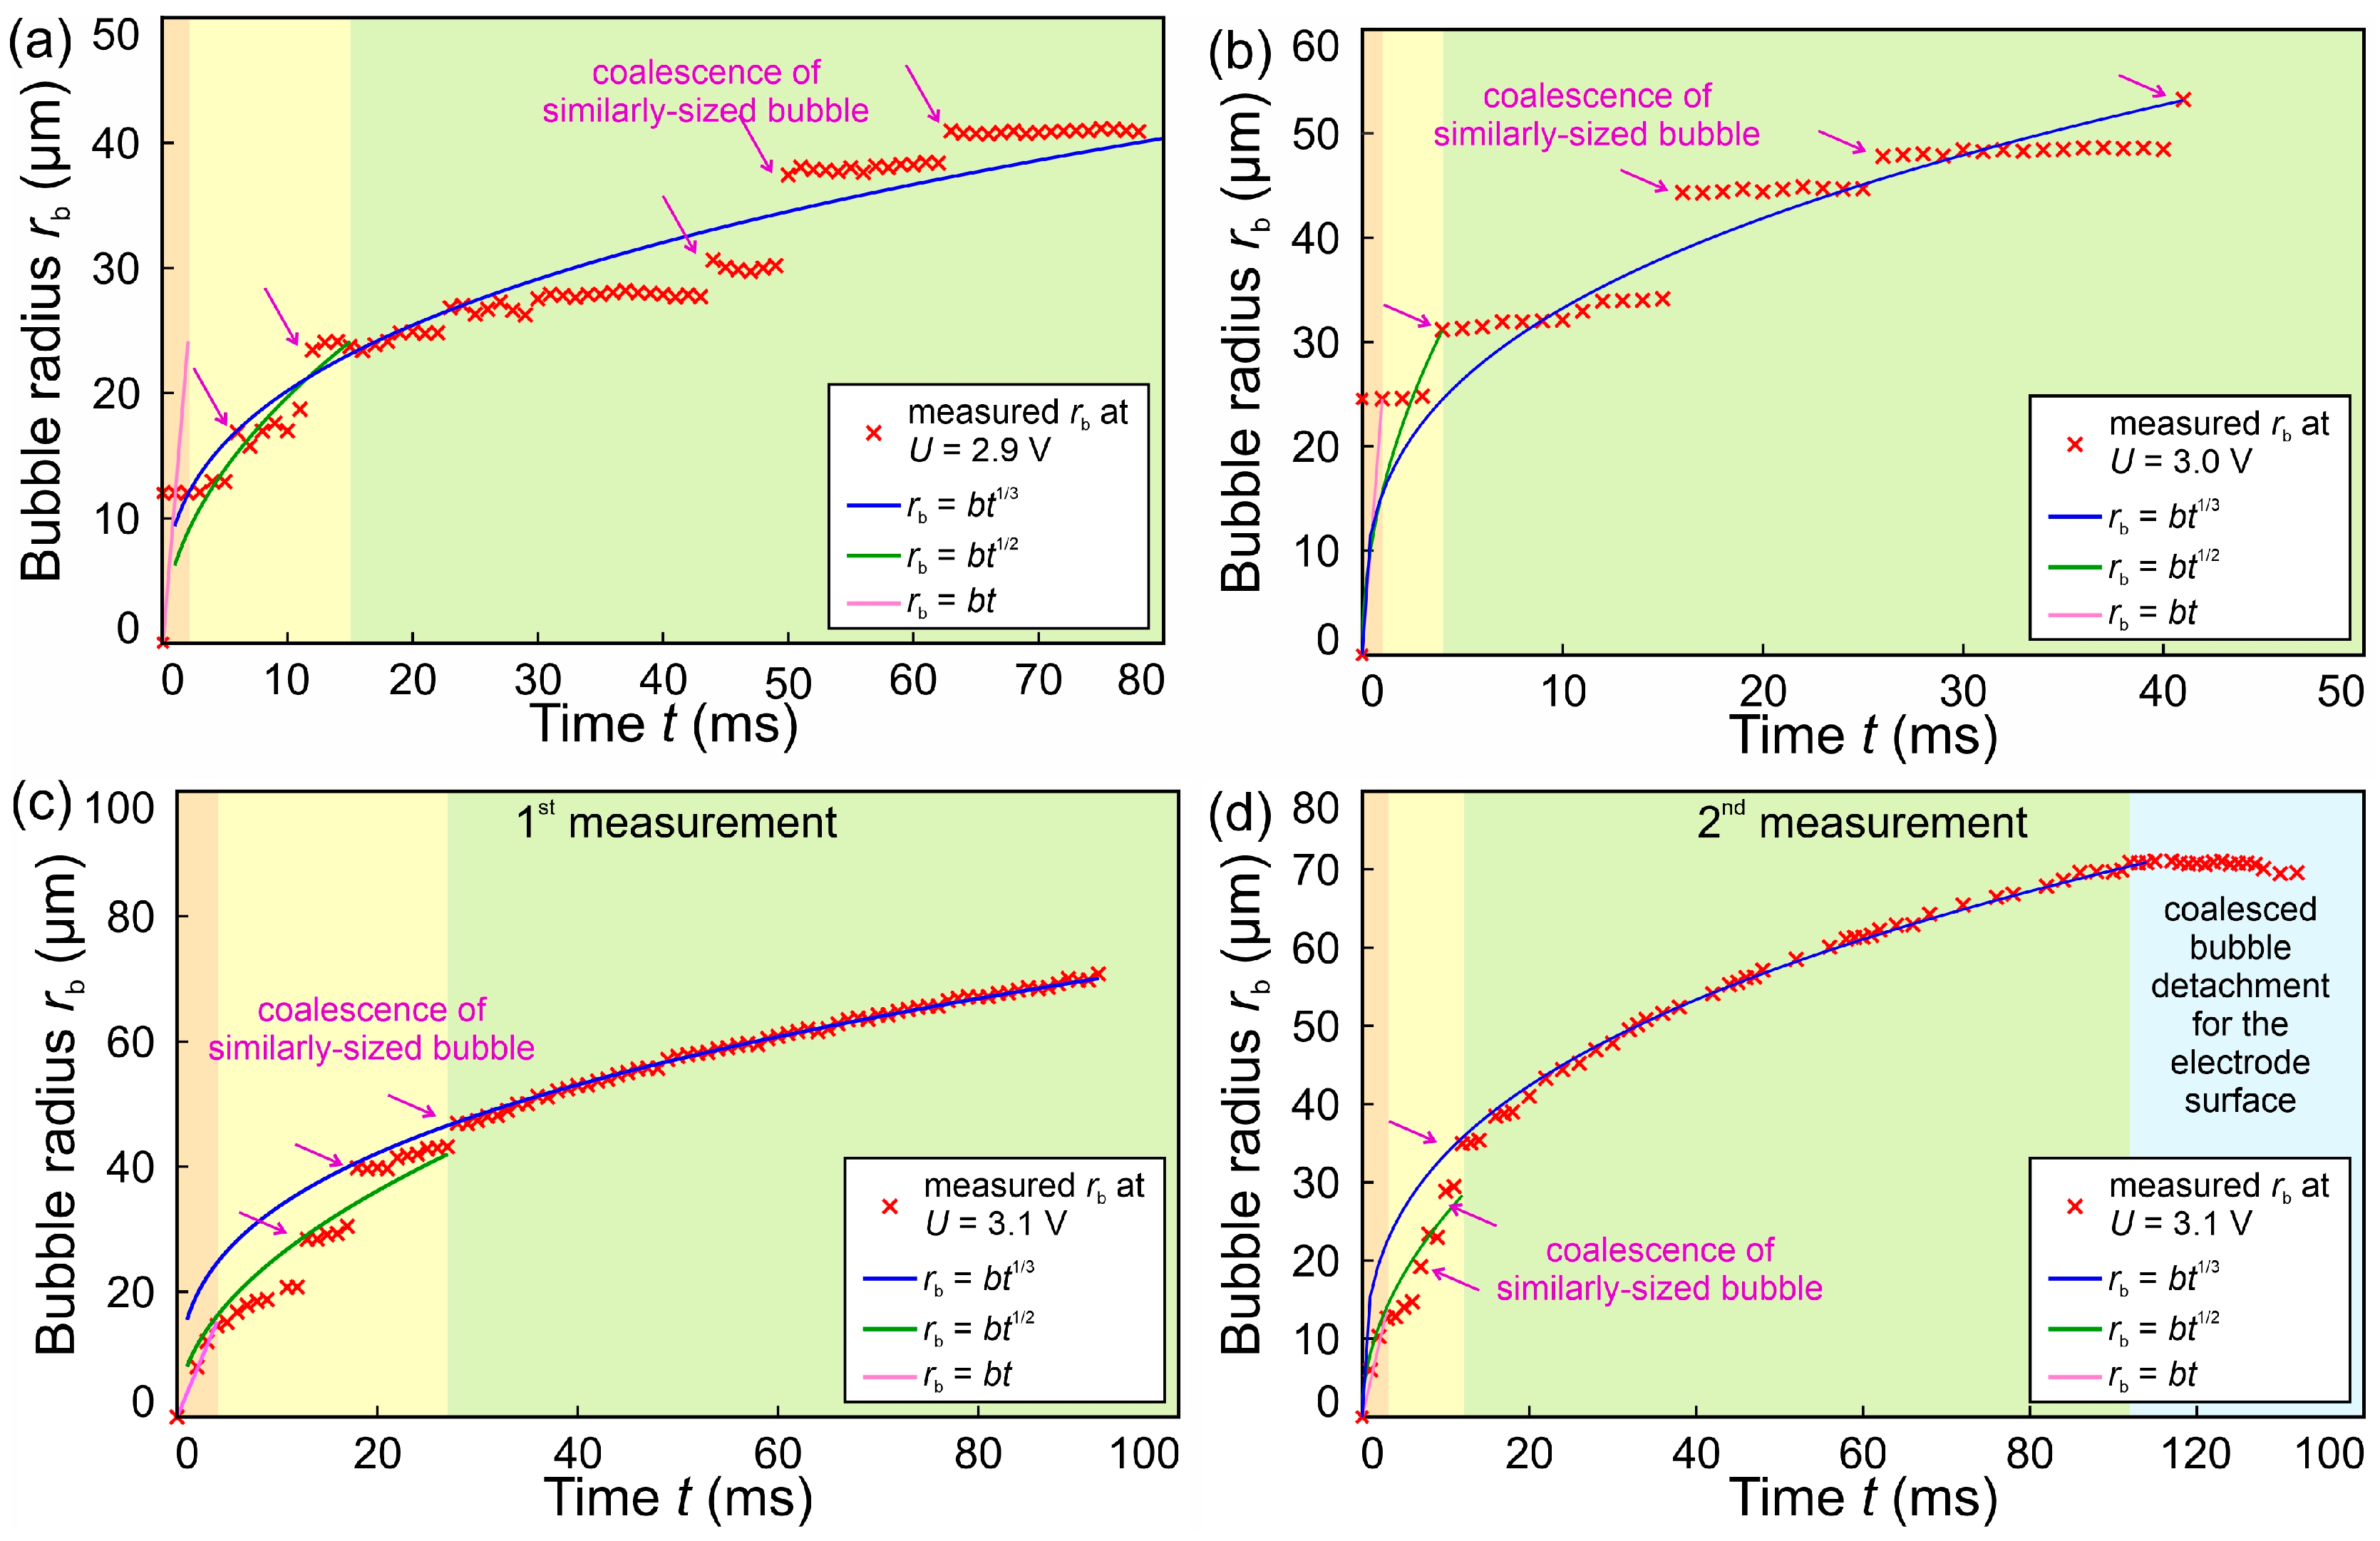
3.4. Bubble Growth Rates

To advance the understanding of bubble evolution, significant research has focused on nucleation, growth, and departure mechanisms. In previous work, Professor White’s group [54,55,56] examined critical aspects of hydrogen nanobubble nucleation, including activation energy, critical nucleus size, and the stability of nanobubbles [29]. These findings are pivotal in describing the initial stages of bubble formation on electrode surfaces.
In Figure 19, the measured bubble radius versus time is presented alongside the theoretically predicted growth rates using different exponents according to Equations (2)–(4) for applied potentials of 2.9, 3.0, and 3.1 V. The growth coefficients were determined to achieve the best fit with the first part of the measured data for Equation (2), the middle part of the data for Equation (3), and the last part of the data for Equation (4). For a detailed frame-by-frame bubble radius analysis, high-speed video recordings using a 50× magnification lens were used. As previously shown in Figure 17, when a potential of 3.2 V is applied, the bubble diameter starts to exceed the size of the observable region of interest, resulting in higher uncertainty related to bubble radius detection.
Figure 19a presents the bubble growth versus time for the 2.9 V case. Bubble radius increases in steps due to the coalescence of pre-coalesced (i.e., intermediate) bubbles of similar diameters, causing a rapid increase in the observed diameter of the main (i.e., the largest) bubble. For the 3.0 V case, (Figure 19b), this non-monotonic increase in bubble radius is even more pronounced. The curve according to Equation (4) provides the best fit to the experimental data in both cases, when the entire bubble growth cycle is taken into account. In Figure 19c,d, the bubble growth rate is shown for the potential of 3.1 V and exhibits favorable fits with predictions according to Equations (2)–(4). The initial region of linear growth is clearly distinguishable in the first 3 recorded frames, soon switching to a diffusion-controlled regime due to bubble coalescence. Considering greater deviations due to the stepwise coalescence of multiple bubbles, the linear model could be used instead of the square root relation for the measured data within the diffusion-controlled regime. In the reaction-limited growth stage (represented by the blue curve), the measured bubble growth clearly follows the theoretical prediction. In Figure 19d, additional measured points are presented, showing the measured bubble size after the detachment from the electrode surface, designated with the light blue diagram background. Our findings regarding the growth rate in the diffusion-controlled regime (Equation (3), i.e., r b t 1 2 ), confirm conclusions of previous studies proposing that dissolved hydrogen is not the rate-limiting factor.

4. Conclusions

Potentiostatic measurements and high-speed imaging were conducted to analyze bubble growth on a 100 μm platinum microelectrode in a 0.5 M H2SO4 electrolyte. Experiments were performed at various applied electrical potentials at room temperature and pressure. Our study highlights the complex interplay between applied potential and bubble behavior, demonstrating how increasing potential promotes bubble growth and coalescence, ultimately influencing mass transfer and current density stability. The critical transition from microbubble detachment to the dominance of coalesced bubbles suggests that optimizing applied potential is crucial for balancing efficiency and bubble management in electrolytic systems. Furthermore, the role of surface hydrodynamics and electrode geometry in bubble detachment dynamics underscores the importance of considering microstructural properties in electrode design. The following findings were made:
(1)
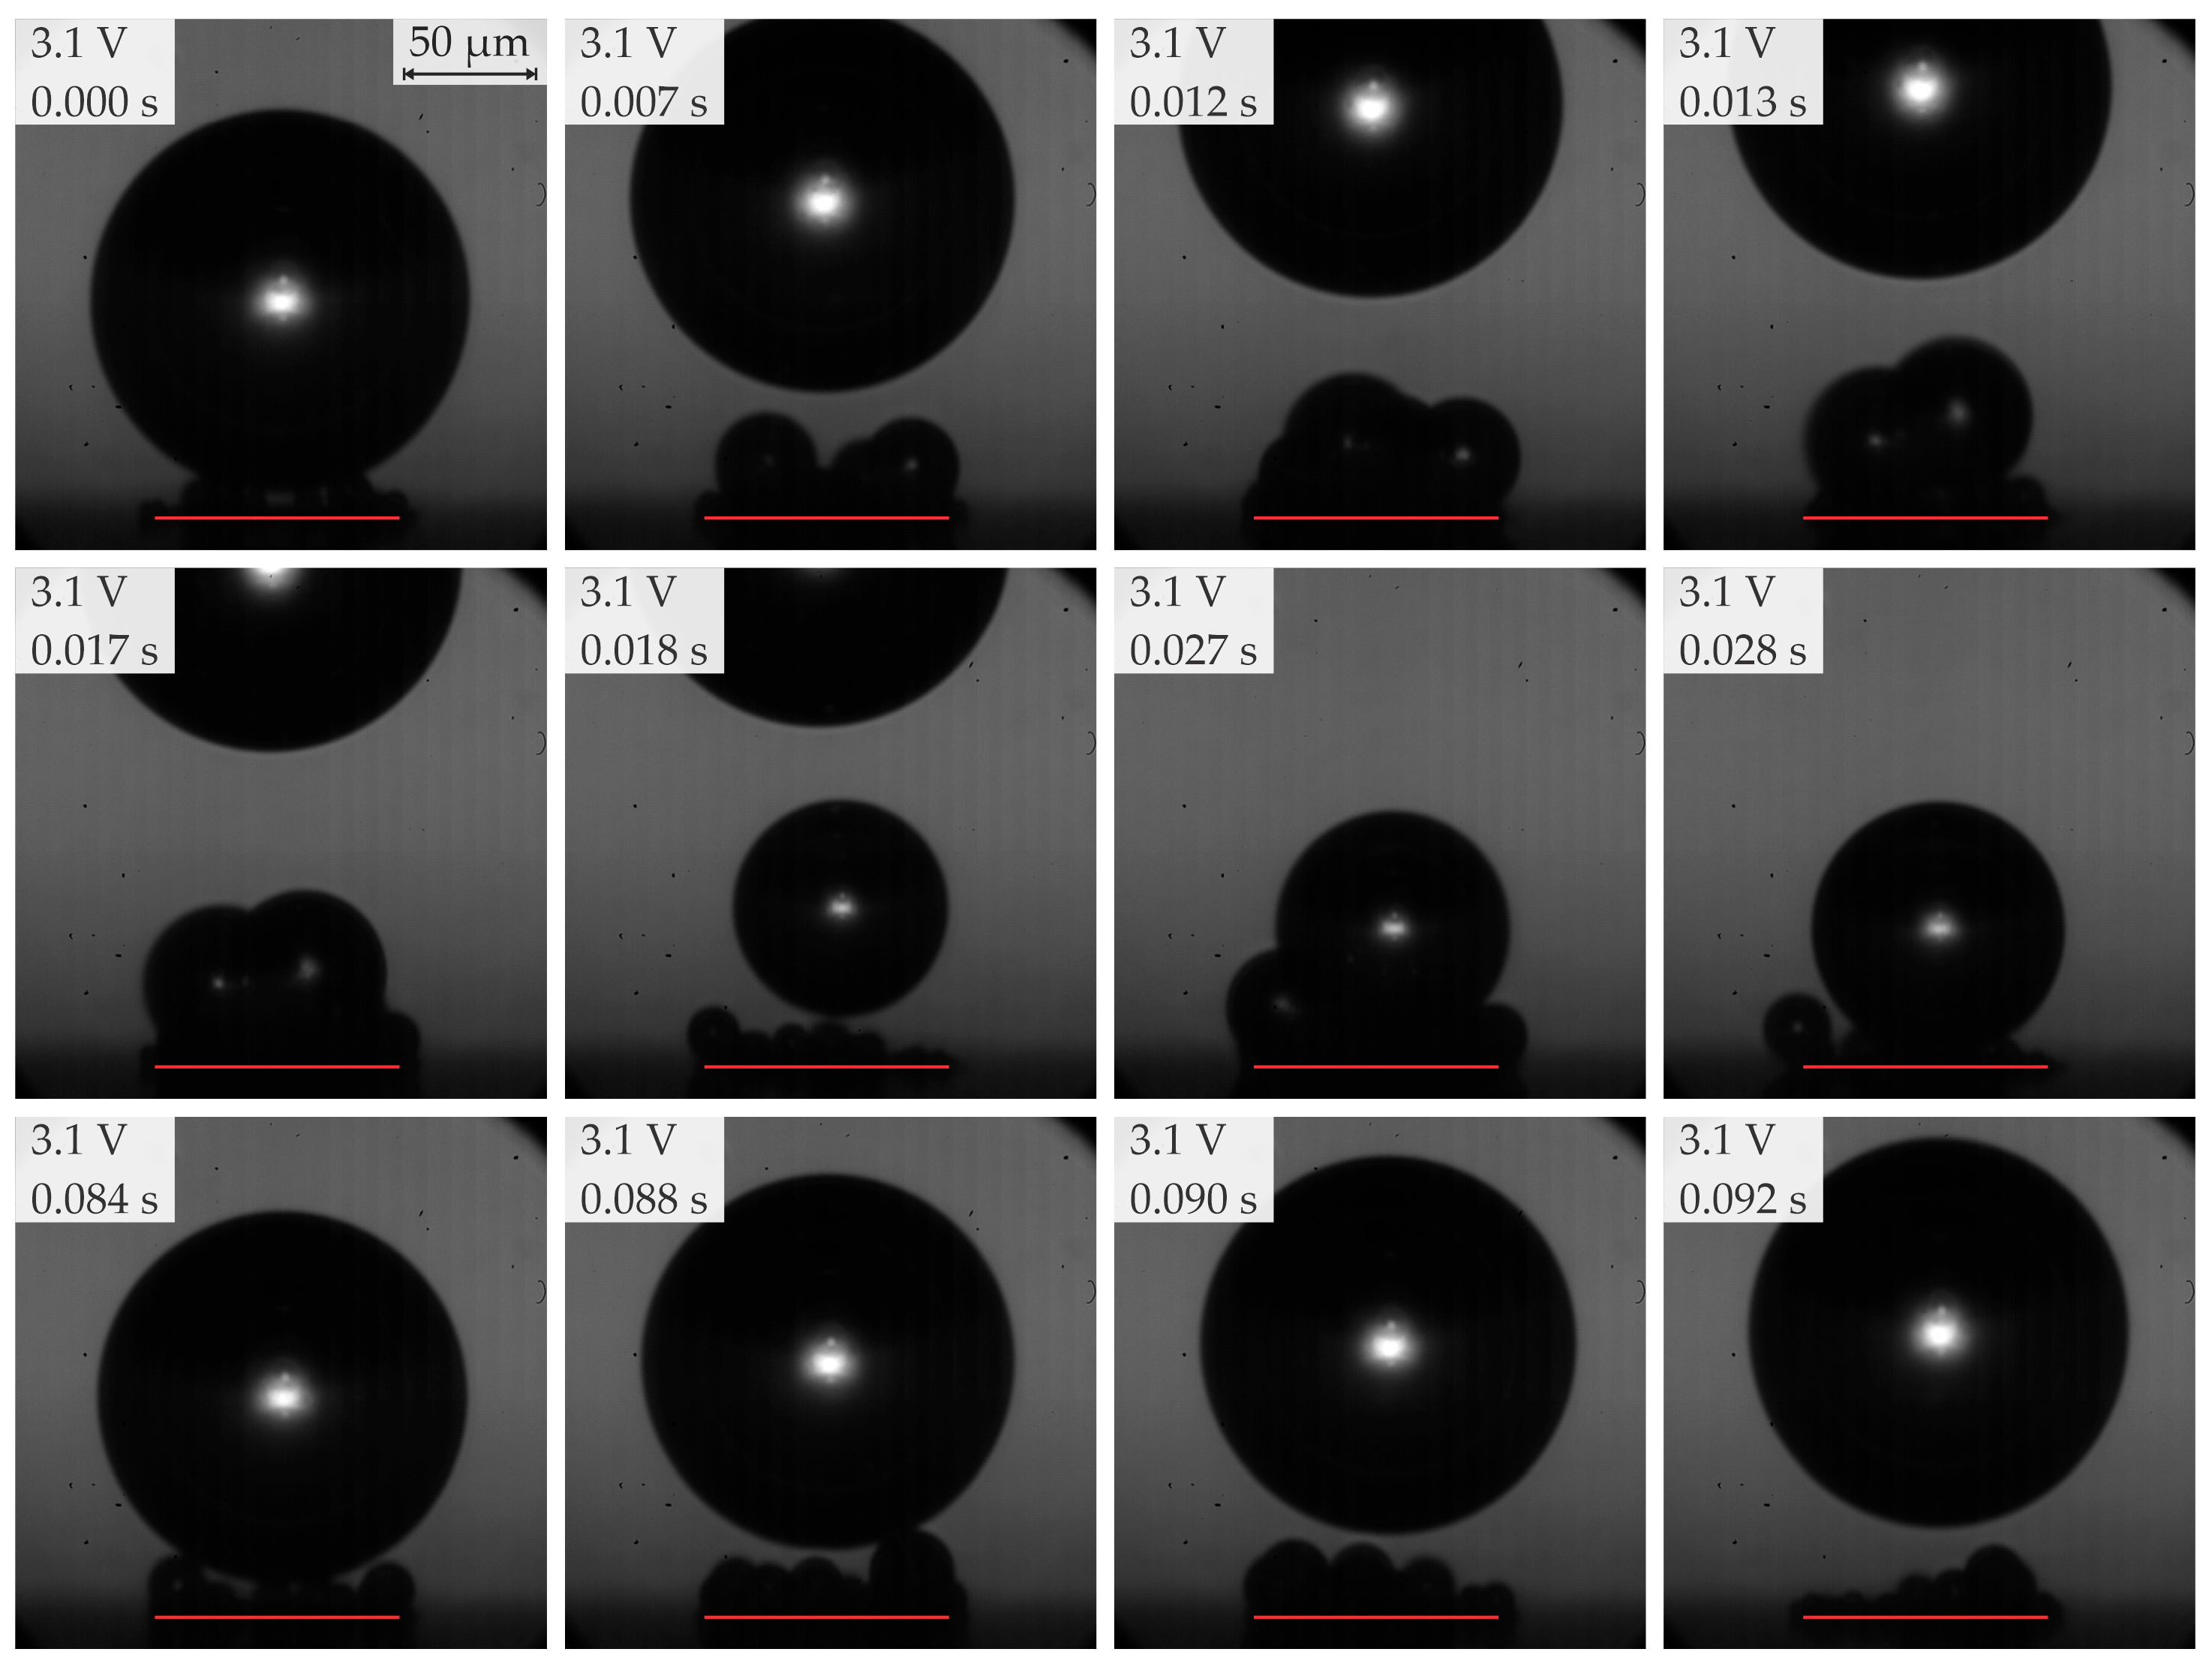
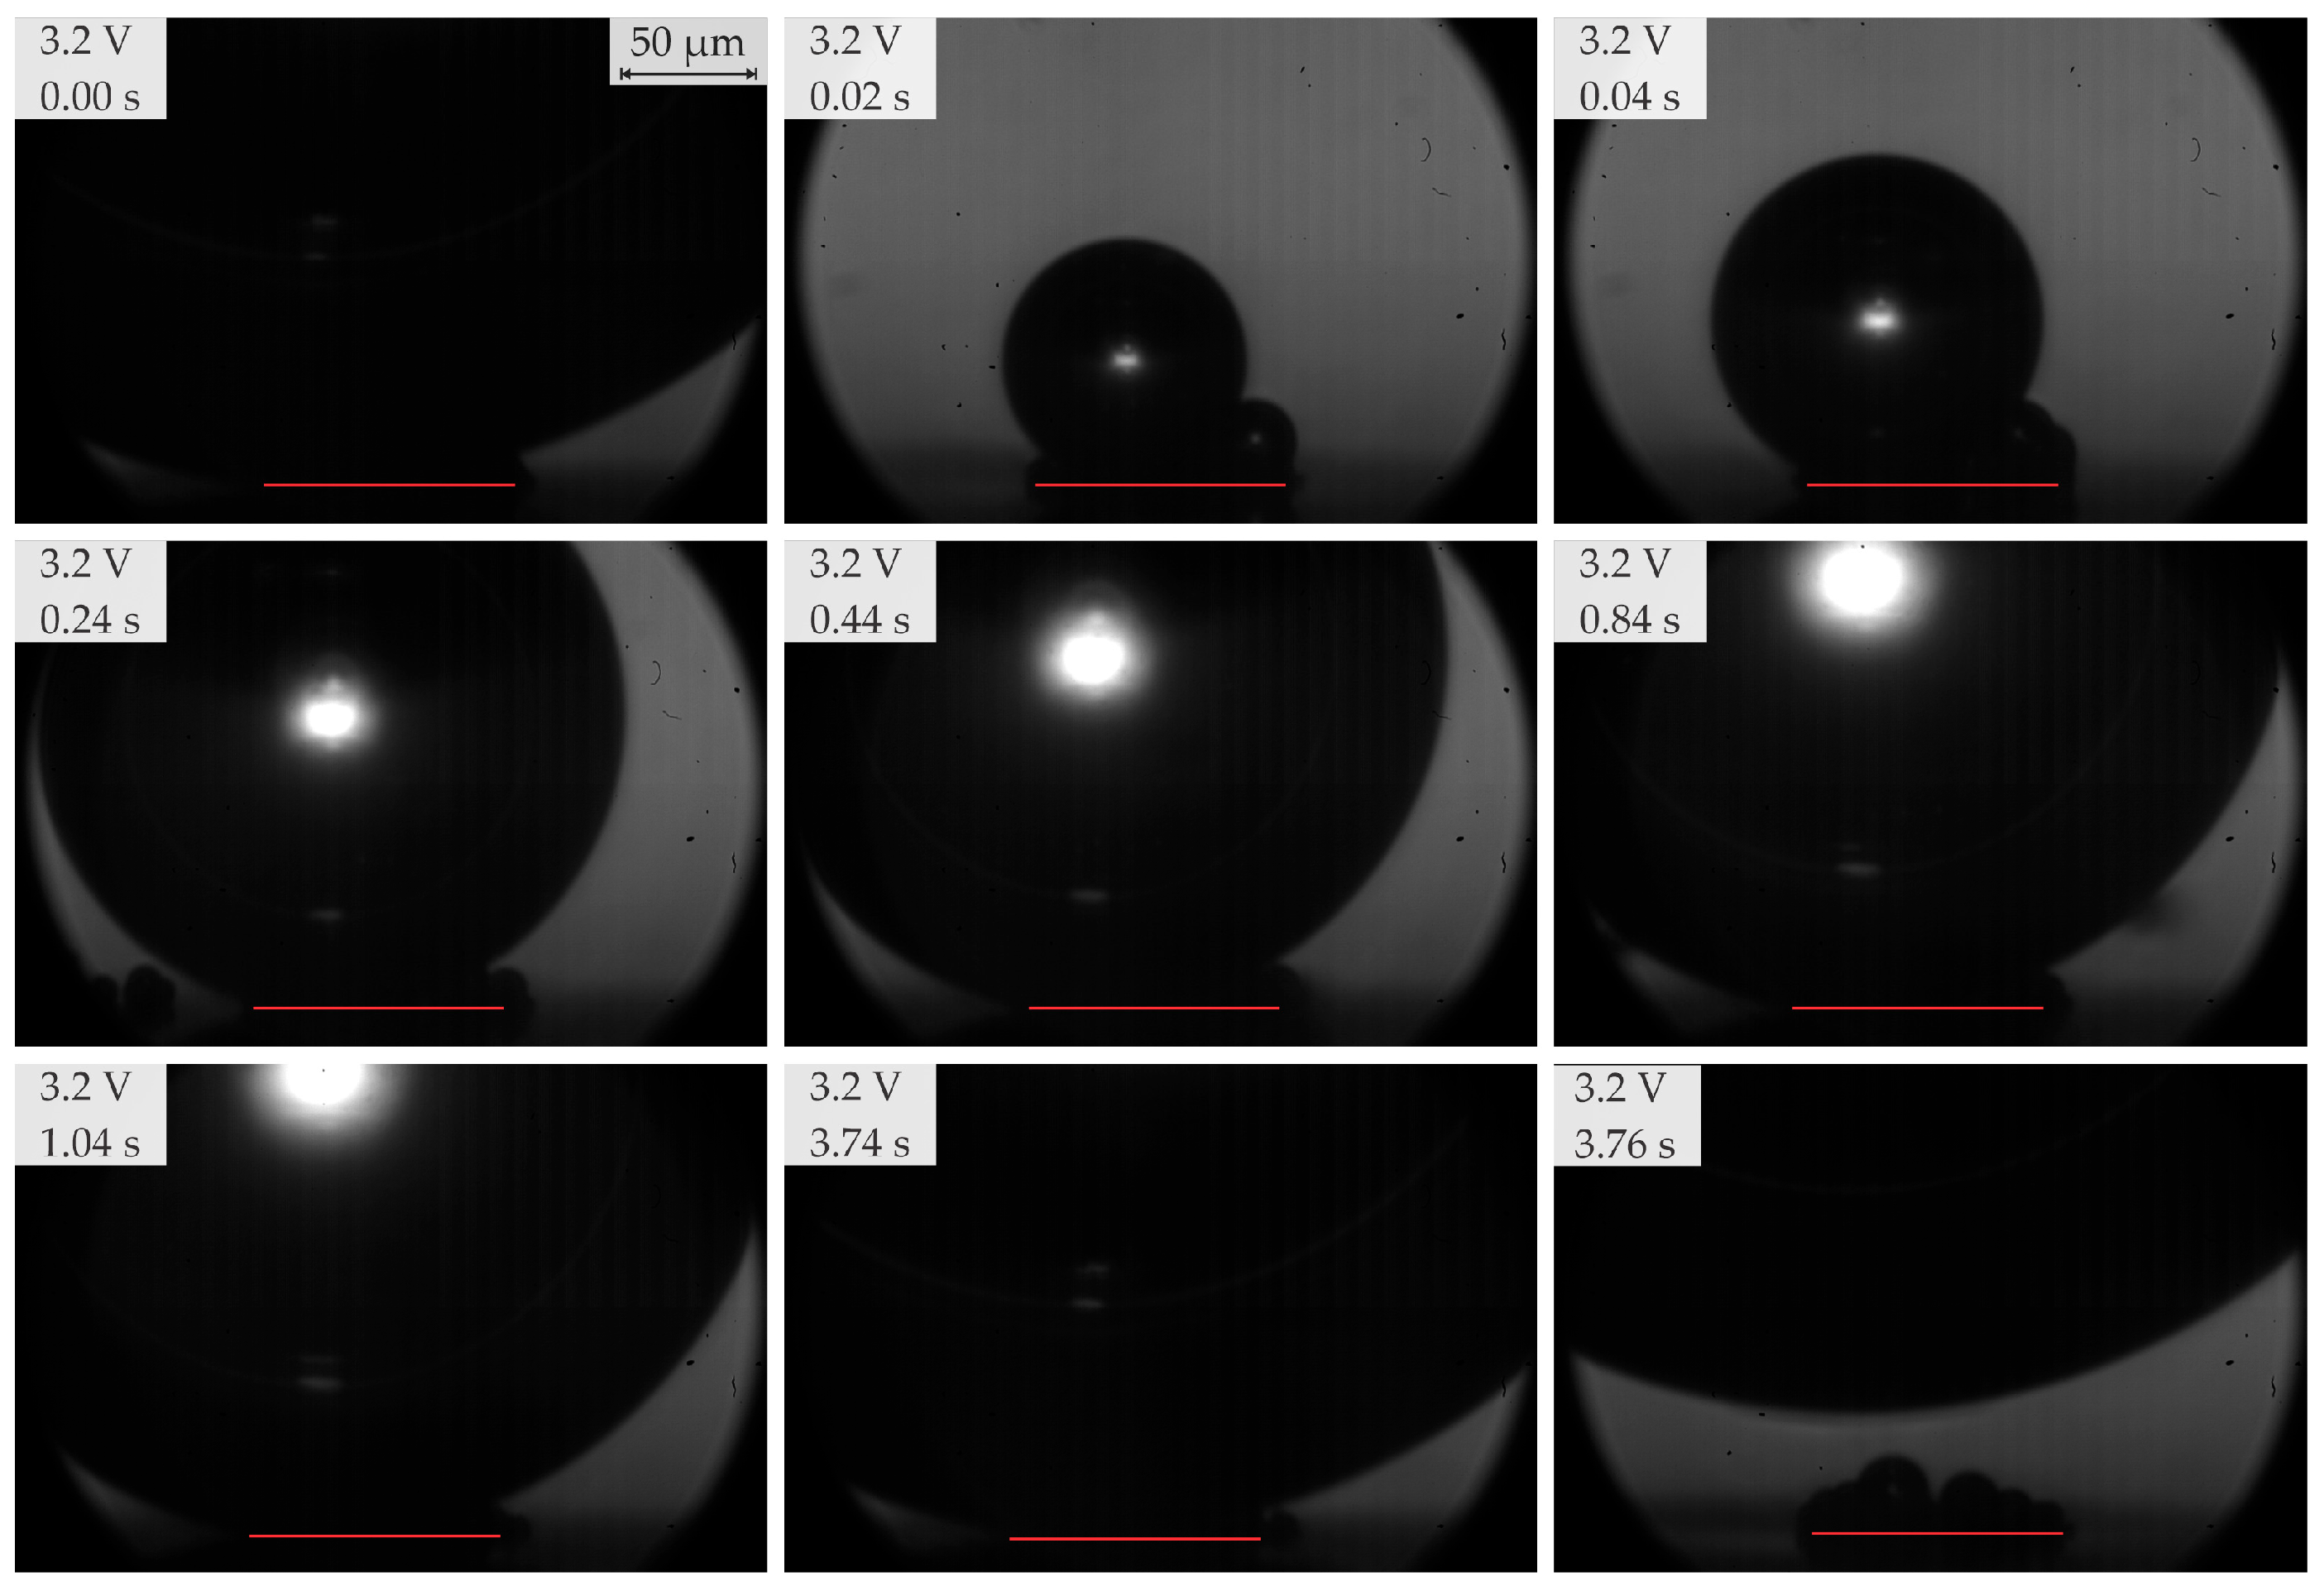
In the range of 2.5–2.8 V, bubble coalescence was minimal, with microbubbles individually detaching from the electrode surface. As the potential was increased, electrical current density fluctuations became more pronounced. Initially, the departure frequency rose, but at very high potentials, the departure frequency decreased due to the formation of very large bubbles. In general, higher potentials lead to the detachment of a single coalesced bubble.
(2)
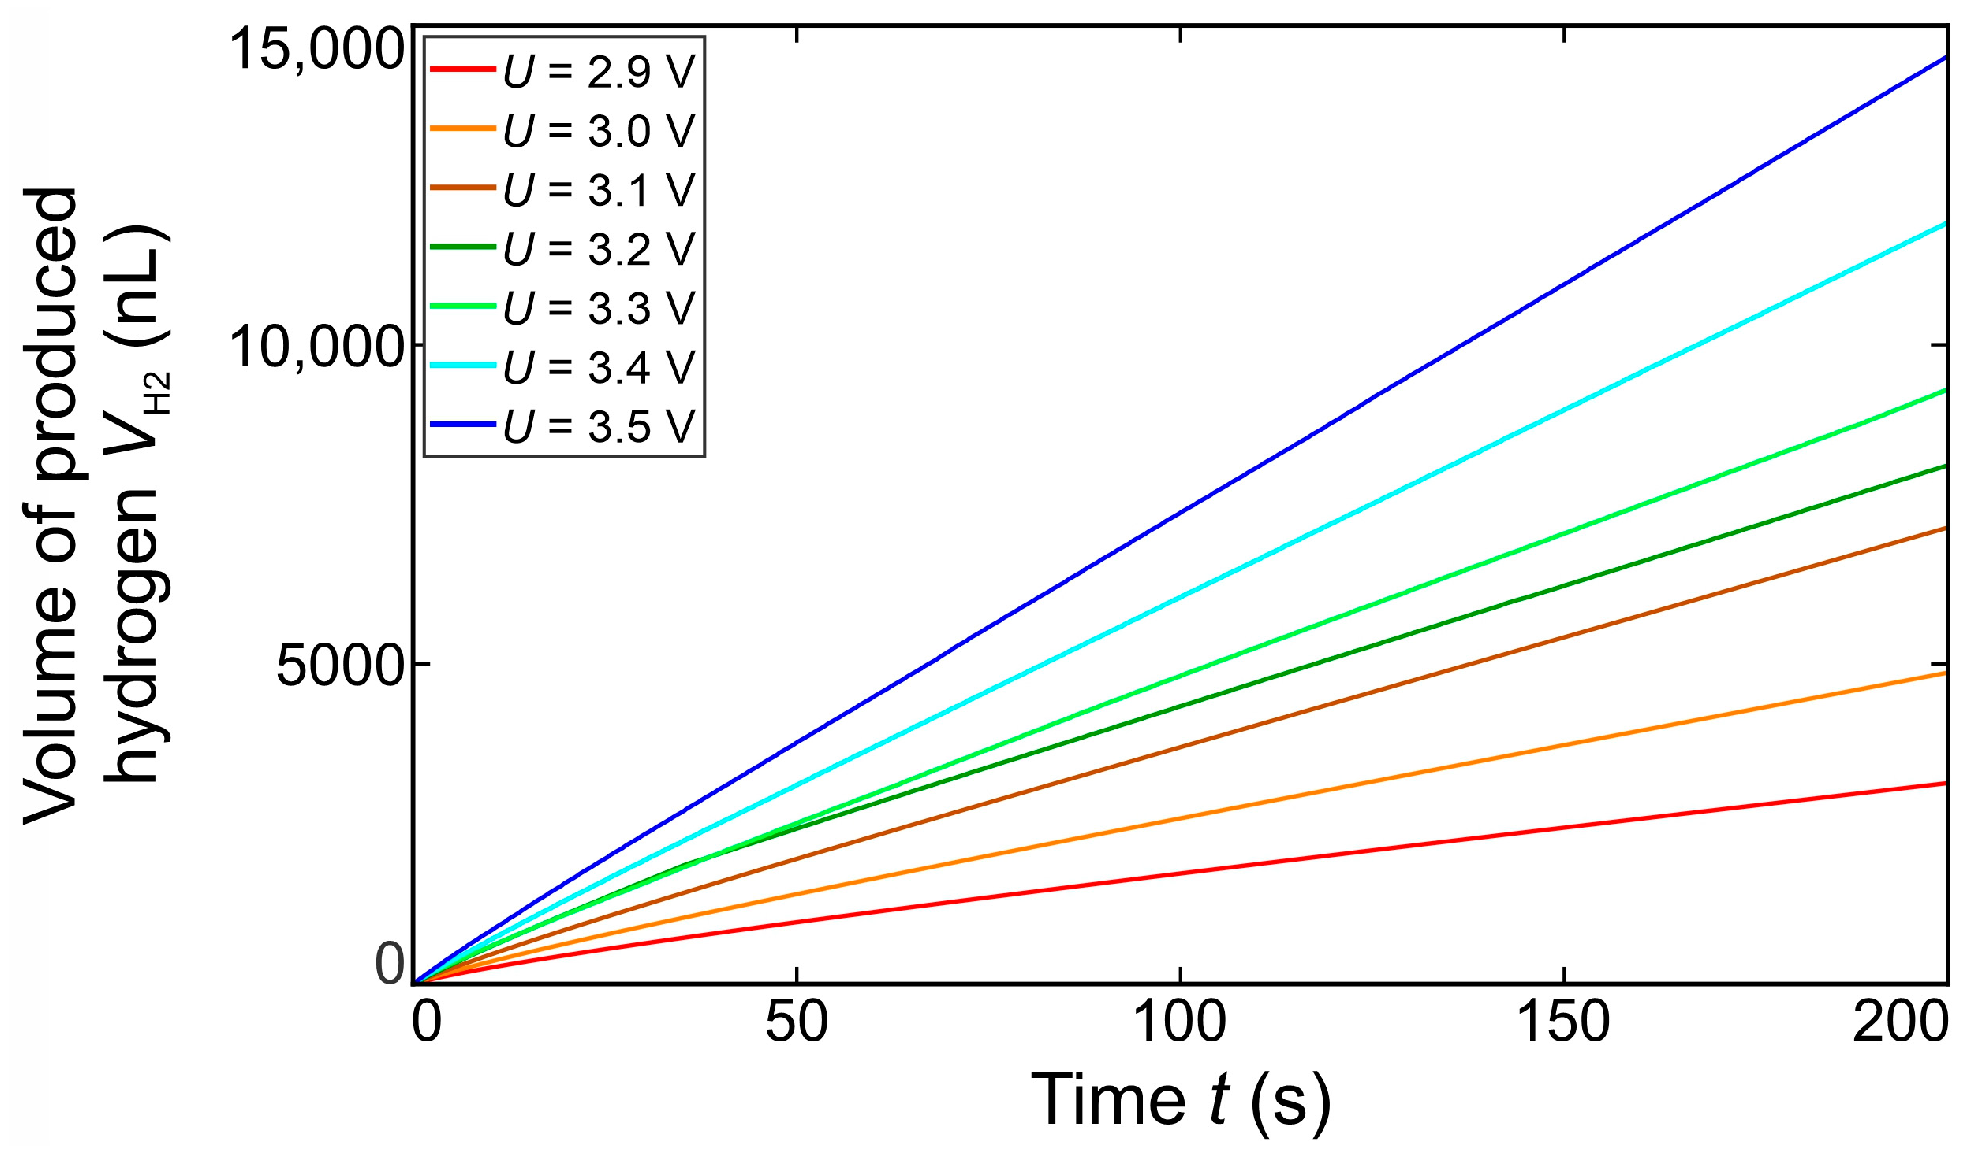
Below 3.2 V, the departure frequency was difficult to quantify due to moderate coalescence and the departure of individual bubbles. Potentiostatic measurements at these applied potentials showed that fluctuations in electrical current density were less pronounced compared to the measurements at 3.2 V and above due to limited bubble coalescence. The observed trends in bubble diameter increase over time aligned well with theoretical predictions.
(3)
As observed by [53,57], bubble coalescence becomes significant at higher potentials. Increased potential enhances gas production rates, leading to the formation of larger bubbles. This observation aligns well with our findings that, at very high potentials, departure frequency decreases due to larger bubble formation. Notably, our study provides a novel insight by identifying a distinct potential range (2.5–2.8 V) where microbubbles detach individually with minimal coalescence—a behavior less emphasized in previous works.
The observed trends provide valuable insights for scaling these phenomena from microscale systems to industrial-scale electrolyzers, where bubble behavior significantly impacts operational efficiency. In future studies, the impact of surface texture could be incorporated to further investigate bubble growth and coalescence behavior. Such research would provide an in-depth understanding of bubble management strategies for improving the overall electrolysis process. More research efforts are also needed to visualize the triple contact line and nucleation site density of microbubbles in relation to the detaching bubble. This could explain the force balance as well as provide deeper insight into the dominating mechanisms of bubble growth.
While our study provides valuable insights into the initial stages of bubble formation and coalescence on a platinum microelectrode, it is important to acknowledge the limitations inherent in the short duration of our experiments. The long-term degradation mechanisms are not captured within the timeframe of our current study. Future research should focus on extended-duration experiments to assess the impact of prolonged operation on catalytic activity and bubble dynamics. Such studies would bridge the gap between our current findings and their applicability to industrial electrolyzers, ensuring that insights gained at the microscale translate effectively to long-term, real-world applications.

Author Contributions

Conceptualization, K.A. and M.M.; methodology, K.A.; software, K.A.; validation, M.M., M.Z. and I.G.; formal analysis, K.A. and M.M.; investigation, K.A.; resources, M.Z. and I.G.; data curation, K.A.; writing—original draft preparation, K.A. and M.M.; writing—review and editing, M.Z. and I.G.; visualization, K.A.; supervision, M.Z.; project administration, M.M. and I.G.; funding acquisition, I.G. All authors have read and agreed to the published version of the manuscript.

Funding

The authors acknowledge the financial support from the state budget by the Slovenian Research and Innovation Agency (Program No. P2-0223 and Project No. J2-50085).

Institutional Review Board Statement

Not applicable.

Informed Consent Statement

Not applicable.

Data Availability Statement

The original contributions presented in this study are included in the article. Further inquiries can be directed to the corresponding author.

Conflicts of Interest

The authors declare no conflicts of interest.

References

  1. Vidas, L.; Castro, R. Recent Developments on Hydrogen Production Technologies: State-of-the-Art Review with a Focus on Green-Electrolysis. Appl. Sci. 2021, 11, 11363. [Google Scholar] [CrossRef]
  2. Nnabuife, S.G.; Quainoo, K.A.; Hamzat, A.K.; Darko, C.K.; Agyemang, C.K. Innovative Strategies for Combining Solar and Wind Energy with Green Hydrogen Systems. Appl. Sci. 2024, 14, 9771. [Google Scholar] [CrossRef]
  3. Brauns, J.; Turek, T. Alkaline Water Electrolysis Powered by Renewable Energy: A Review. Processes 2020, 8, 248. [Google Scholar] [CrossRef]
  4. AlZohbi, G. An Analysis of the Conceptual and Functional Factors Affecting the Effectiveness of Proton-Exchange Membrane Water Electrolysis. ChemEngineering 2024, 8, 116. [Google Scholar] [CrossRef]
  5. Dragan, M. Closing the Loop: Solid Oxide Fuel and Electrolysis Cells Materials for a Net-Zero Economy. Materials 2024, 17, 6113. [Google Scholar] [CrossRef]
  6. Yang, X.; Karnbach, F.; Uhlemann, M.; Odenbach, S.; Eckert, K. Dynamics of Single Hydrogen Bubbles at a Platinum Microelectrode. Langmuir 2015, 31, 8184–8193. [Google Scholar] [CrossRef]
  7. Zhan, S.; Yuan, R.; Wang, X.; Zhang, W.; Yu, K.; Wang, Z.; Wang, J. Dynamics of Growth and Detachment of Single Hydrogen Bubble on Horizontal and Vertical Microelectrode Surfaces. Phys. Fluids 2023, 3, 032111. [Google Scholar] [CrossRef]
  8. Sepahi, F.; Verzicco, R.; Lohse, D.; Krug, D. Mass Transport at Gas-Evolving Electrodes. J. Fluid Mech. 2024, 983, A19. [Google Scholar] [CrossRef]
  9. Zhang, Z.; Gu, C.; Wang, K.; Yu, H.; Qiu, J.; Wang, S.; Wang, L.; Yan, D. Bubbles Management for Enhanced Catalytic Water Splitting Performance. Catalysts 2024, 14, 254. [Google Scholar] [CrossRef]
  10. Zhao, P.; Gong, S.; Zhang, C.; Chen, S.; Cheng, P. Roles of Wettability and Wickability on Enhanced Hydrogen Evolution Reactions. ACS Appl. Mater. Interfaces 2024, 16, 27898–27907. [Google Scholar] [CrossRef]
  11. Gutić, S.J.; Dobrota, A.S.; Fako, E.; Skorodumova, N.V.; López, N.; Pašti, I.A. Hydrogen Evolution Reaction-from Single Crystal to Single Atom Catalysts. Catalysts 2020, 10, 290. [Google Scholar] [CrossRef]
  12. Kuczyński, M.; Mikołajczyk, T.; Pierożyński, B.; Karczewski, J. Optimizing NiFe-Modified Graphite for Enhanced Catalytic Performance in Alkaline Water Electrolysis: Influence of Substrate Geometry and Catalyst Loading. Molecules 2024, 29, 4755. [Google Scholar] [CrossRef] [PubMed]
  13. Raeymaekers, J.; Arhar, K.; Može, M.; Colinet, P.; Golobič, I.; Steelant, J.; Vetrano, M.R. Impact of Electrode Surface Texturing on Hydrogen Bubble Dynamics during Proton Exchange Membrane Water Electrolysis. SSRN 2024. [Google Scholar] [CrossRef]
  14. Sota, K.; Mondal, S.; Ando, K.; Uchimoto, Y.; Nakajima, T. Nanosecond Laser Texturing of Ni Electrodes as a High-Speed and Cost-Effective Technique for Efficient Hydrogen Evolution Reaction. Int. J. Hydrogen Energy 2024, 93, 1218–1226. [Google Scholar] [CrossRef]
  15. Alushi, A.; Al-Musawi, A.; Kim, K.; Lee, C.Y.; Wagner, K.; Swiegers, G.F. Hydrogen Generation by Nickel Electrodes Coated with Linear Patterns of PTFE. J. Compos. Sci. 2024, 8, 368. [Google Scholar] [CrossRef]
  16. Cai, Z.; Li, Z.; Zhang, Y.; Wei, C.; Tian, H.; Hao, M.; Wei, X.; Yang, Z. High Repetition Rate Ultrafast Laser-Structured Nickel Electrocatalyst for Efficient Hydrogen Evolution Reaction. Adv. Photonics Nexus 2023, 2, 056009. [Google Scholar] [CrossRef]
  17. Ränke, F.; Baumann, R.; Voisiat, B.; Soldera, M.; Lasagni, A.F. Nano/Microstructuring of Nickel Electrodes by Combining Direct Laser Interference Patterning and Polygon Scanner Processing for Efficient Hydrogen Production. Adv. Eng. Mater. 2024, 26, 2301583. [Google Scholar] [CrossRef]
  18. Sangtam, B.T.; Park, H. Review on Bubble Dynamics in Proton Exchange Membrane Water Electrolysis: Towards Optimal Green Hydrogen Yield. Micromachines 2023, 14, 2234. [Google Scholar] [CrossRef]
  19. An, L.; Tian, Y.; Zhao, H. Research on Water Flow Control Strategy for PEM Electrolyzer Considering the Anode Bubble Effect. Energies 2025, 18, 273. [Google Scholar] [CrossRef]
  20. Panchenko, O.; Giesenberg, L.; Borgardt, E.; Zwaygardt, W.; Kardjilov, N.; Markötter, H.; Arlt, T.; Manke, I.; Müller, M.; Stolten, D.; et al. Influence of Stoichiometry on the Two-Phase Flow Behavior of Proton Exchange Membrane Electrolyzers. Energies 2019, 12, 350. [Google Scholar] [CrossRef]
  21. Zerrougui, I.; Li, Z.; Hissel, D. Investigating Bubble Impacts on PEM Electrolysis Performance through Enhanced Multiphysics Modeling. Int. J. Hydrogen Energy 2025, 98, 626–638. [Google Scholar] [CrossRef]
  22. Yuan, S.; Zhao, C.; Cai, X.; An, L.; Shen, S.; Yan, X.; Zhang, J. Bubble Evolution and Transport in PEM Water Electrolysis: Mechanism, Impact, and Management. Prog. Energy Combust. Sci. 2023, 96, 101075. [Google Scholar] [CrossRef]
  23. Park, H. Resemblance and Difference in Hydrodynamic Aspects Between Critical Current Density in Water Electrolysis and Critical Heat Flux in Boiling System. Korean J. Chem. Eng. 2025. [Google Scholar] [CrossRef]
  24. Park, S.; Lohse, D.; Krug, D.; Koper, M.T.M. Electrolyte Design for the Manipulation of Gas Bubble Detachment during Hydrogen Evolution Reaction. Electrochim. Acta 2024, 485, 144084. [Google Scholar] [CrossRef]
  25. Guo, C.; Lu, X.; Zhu, Y.; Ma, L.; Jing, D. Insight into the Electrolyte Concentration Impact on Single Hydrogen Bubble Evolution Dynamics at a Microelectrode during Electrochemical Water Splitting. Phys. Fluids 2024, 36, 073339. [Google Scholar] [CrossRef]
  26. Lu, X.; Yadav, D.; Wang, J.; Jing, L.; Zhu, Y.; Ma, L.; Jing, D. Hydrogen Bubble Evolution and Gas Transport Mechanism on a Microelectrode Determined by Cathodic Potential and Temperature. Phys. Fluids 2024, 36, 073302. [Google Scholar] [CrossRef]
  27. Duan, Z.; Xu, Q.; She, Y.; Nie, T.; Luo, X.; Wang, M. In Situ Observation and Electrical Signal Analysis of Different Bubble Detachment Modes on Microelectrode Surface. J. Electrochem. 2024, 171, 076501. [Google Scholar] [CrossRef]
  28. Hossain, S.S.; Bashkatov, A.; Yang, X.; Mutschke, G.; Eckert, K. Force Balance of Hydrogen Bubbles Growing and Oscillating on a Microelectrode. Phys. Rev. E 2022, 106, 035105. [Google Scholar] [CrossRef]
  29. Bashkatov, A.; Hossain, S.S.; Mutschke, G.; Yang, X.; Rox, H.; Weidinger, I.M.; Eckert, K. On the Growth Regimes of Hydrogen Bubbles at Microelectrodes. Phys. Chem. Chem. Phys. 2022, 24, 26738–26752. [Google Scholar] [CrossRef]
  30. Bashkatov, A.; Babich, A.; Hossain, S.S.; Yang, X.; Mutschke, G.; Eckert, K. H 2 Bubble Motion Reversals during Water Electrolysis. J. Fluid Mech. 2023, 958, A43. [Google Scholar] [CrossRef]
  31. Angulo, A.; van der Linde, P.; Gardeniers, H.; Modestino, M.; Fernández Rivas, D. Influence of Bubbles on the Energy Conversion Efficiency of Electrochemical Reactors. Joule 2020, 4, 555–579. [Google Scholar] [CrossRef]
  32. Zhao, X.; Ren, H.; Luo, L. Gas Bubbles in Electrochemical Gas Evolution Reactions. Langmuir 2019, 35, 5392–5408. [Google Scholar] [CrossRef] [PubMed]
  33. Brandon, N.P.; Kelsall, G.H. Growth Kinetics of Bubbles Electrogenerated at Microelectrodes. J. Appl. Electrochem. 1985, 15, 475–484. [Google Scholar] [CrossRef]
  34. Lord, R., VIII. On the Pressure Developed in a Liquid during the Collapse of a Spherical Cavity. Lond. Edinb. Dublin Philos. Mag. J. Sci. 1917, 34, 94–98. [Google Scholar] [CrossRef]
  35. Sakuma, G.; Fukunaka, Y.; Matsushima, H. Nucleation and Growth of Electrolytic Gas Bubbles under Microgravity. Int. J. Hydrogen Energy 2014, 39, 7638–7645. [Google Scholar] [CrossRef]
  36. Fernández, D.; Maurer, P.; Martine, M.; Coey, J.M.D.; Möbius, M.E. Bubble Formation at a Gas-Evolving Microelectrode. Langmuir 2014, 30, 13065–13074. [Google Scholar] [CrossRef]
  37. Scriven, L.E. On the Dynamics of Phase Growth. Chem. Eng. Sci. 1959, 10, 1–13. [Google Scholar] [CrossRef]
  38. Westerheide, D.E.; Westwater, J.W. Isothermal Growth of Hydrogen Bubbles during Electrolysis. AIChE J. 1961, 7, 357–362. [Google Scholar] [CrossRef]
  39. Glas, J.P.; Westwater, J.W. Measurements of the Growth of Electrolytic Bubbles. Int. J. Heat Mass Transf. 1964, 7, 1427–1443. [Google Scholar] [CrossRef]
  40. Higuera, F.J. A Model of the Growth of Hydrogen Bubbles in the Electrolysis of Water. J. Fluid Mech. 2021, 927, A33. [Google Scholar] [CrossRef]
  41. Darby, R.; Haquet, M.S. The Dynamics of Electrolytic Hydrogen Bubble Evolution. Chem. Eng. Sci. 1973, 28, 1129–1138. [Google Scholar] [CrossRef]
  42. Verhaart, H.F.A.; de Jonge, R.M.; van Stralen, S.J.D. Growth Rate of a Gas Bubble during Electrolysis in Supersaturated Liquid. Int. J. Heat Mass Transf. 1980, 23, 293–299. [Google Scholar] [CrossRef]
  43. Bashkatov, A.; Hossain, S.S.; Yang, X.; Mutschke, G.; Eckert, K. Oscillating Hydrogen Bubbles at Pt Microelectrodes. Phys. Rev. Lett. 2019, 123, 214503. [Google Scholar] [CrossRef] [PubMed]
  44. Darband, G.B.; Aliofkhazraei, M.; Shanmugam, S. Recent Advances in Methods and Technologies for Enhancing Bubble Detachment during Electrochemical Water Splitting. Renew. Sustain. Energy Rev. 2019, 114, 109300. [Google Scholar] [CrossRef]
  45. Fritz, W. Maximum Volume of Vapor Bubbles. Phys. Zeitschr. 1935, 36, 379–384. [Google Scholar]
  46. Duhar, G.; Colin, C. Dynamics of Bubble Growth and Detachment in a Viscous Shear Flow. Phys. Fluids 2006, 18, 077101. [Google Scholar] [CrossRef]
  47. Vogt, H.; Balzer, R.J. The Bubble Coverage of Gas-Evolving Electrodes in Stagnant Electrolytes. Electrochim. Acta 2005, 50, 2073–2079. [Google Scholar] [CrossRef]
  48. Lu, Z.; Zhang, L.; Iwata, R.; Wang, E.N.; Grossman, J.C. Transport-Based Modeling of Bubble Nucleation on Gas Evolving Electrodes. Langmuir 2020, 36, 15112–15118. [Google Scholar] [CrossRef]
  49. Zhao, P.; Zhang, C.; Gong, S. Size Ranges of Effective Nucleation Cavities on Gas-Evolving Surfaces. Langmuir 2023, 39, 16101–16110. [Google Scholar] [CrossRef]
  50. Nouri-Khorasani, A.; Tabu Ojong, E.; Smolinka, T.; Wilkinson, D.P. Model of Oxygen Bubbles and Performance Impact in the Porous Transport Layer of PEM Water Electrolysis Cells. Int. J. Hydrogen Energy 2017, 42, 28665–28680. [Google Scholar] [CrossRef]
  51. Iwata, R.; Zhang, L.; Wilke, K.L.; Gong, S.; He, M.; Gallant, B.M.; Wang, E.N. Bubble Growth and Departure Modes on Wettable/Non-Wettable Porous Foams in Alkaline Water Splitting. Joule 2021, 5, 887–900. [Google Scholar] [CrossRef]
  52. Iwata, R.; Zhang, L.; Lu, Z.; Gong, S.; Du, J.; Wang, E.N. How Coalescing Bubbles Depart from a Wall. Langmuir 2022, 38, 4371–4377. [Google Scholar] [CrossRef] [PubMed]
  53. Bashkatov, A.; Park, S.; Demirkır, Ç.; Wood, J.A.; Koper, M.T.M.; Lohse, D.; Krug, D. Performance Enhancement of Electrocatalytic Hydrogen Evolution through Coalescence-Induced Bubble Dynamics. J. Am. Chem. Soc. 2024, 146, 10177–10186. [Google Scholar] [CrossRef]
  54. German, S.R.; Edwards, M.A.; Ren, H.; White, H.S. Critical Nuclei Size, Rate, and Activation Energy of H2 Gas Nucleation. J. Am. Chem. Soc. 2018, 140, 4047–4053. [Google Scholar] [CrossRef]
  55. Luo, L.; White, H.S. Electrogeneration of Single Nanobubbles at Sub-50-Nm-Radius Platinum Nanodisk Electrodes. Langmuir 2013, 29, 11169–11175. [Google Scholar] [CrossRef] [PubMed]
  56. Chen, Q.; Luo, L.; Faraji, H.; Feldberg, S.W.; White, H.S. Electrochemical Measurements of Single H2 Nanobubble Nucleation and Stability at Pt Nanoelectrodes. J. Phys. Chem. Lett. 2014, 5, 3539–3544. [Google Scholar] [CrossRef]
  57. Rox, H.; Bashkatov, A.; Yang, X.; Loos, S.; Mutschke, G.; Gerbeth, G.; Eckert, K. Bubble Size Distribution and Electrode Coverage at Porous Nickel Electrodes in a Novel 3-Electrode Flow-through Cell. Int. J. Hydrogen Energy 2023, 48, 2892–2905. [Google Scholar] [CrossRef]
Figure 1. Schematic of the experimental setup for observation of bubble growth on a microelectrode. Blue circle denote hydrogen bubble, whereas red circles denote oxygen bubbles.
Applsci 15 04107 g001
Figure 2. Electrical current density at low electrical potentials, where bubbles do not merge into a single coalesced bubble.
Applsci 15 04107 g002
Figure 3. Temporal evolution of the electric current during measurements at electric potentials between 3.0 and 3.5 V. The left image shows the full recording (200 s), while the middle image is the zoomed-in region showing the last 10 s of the measurement, and the right image shows the size of the bubbles at detachment at specified potentials.
Applsci 15 04107 g003
Figure 4. Side-by-side comparison of bubble diameter at different regimes/characteristics of electrical current density curves. The microelectrode surface is denoted with a red line.
Applsci 15 04107 g004
Figure 5. Comparison of the first and last peak value of measurements at different set values of applied electrical potential (a) and comparison between several measurements at the same applied potential of 3.5 V (b).
Applsci 15 04107 g005
Figure 6. (a) Example of hydrogen bubble growth at an electric potential of 3.4 V. Each bubble departure is marked by a temporary jump in the electrical current density. (b) The difference between the bubble center from the electrode surface and the bubble radius.
Applsci 15 04107 g006
Figure 7. Theoretically calculated total produced volume of hydrogen according to Faraday’s law.
Applsci 15 04107 g007
Figure 8. Efficiency of hydrogen volume production at different applied potentials.
Applsci 15 04107 g008
Figure 9. High-speed video recording evaluated for average bubble departure diameter at the applied potentials ranging from 2.5 to 3.5 V.
Applsci 15 04107 g009
Figure 10. High-speed video recording evaluated for average bubble departure frequency at the applied potentials ranging from 2.5 to 3.5 V. No data are shown for U ≤ 2.8 V, as the bubble departure frequency could not be reliably determined due to the microbubble emission regime.
Applsci 15 04107 g010
Figure 11. Comparison of bubble sizes during electrolysis at a platinum microelectrode at set potentials ranging from 2.0 to 2.6 V. The diameter and location of the electrode are denoted by a red line.
Applsci 15 04107 g011
Figure 12. Snapshots of the electrolysis process on the microelectrode at a potential of 2.7 V at different time frames. The diameter and location of the electrode are denoted by a red line.
Applsci 15 04107 g012
Figure 13. Snapshots of the electrolysis process on the microelectrode at a potential of 2.8 V at different time frames. The diameter and location of the electrode are denoted by a red line.
Applsci 15 04107 g013
Figure 14. Growth of a single coalesced hydrogen bubble at a potential of 2.9 V.
Applsci 15 04107 g014
Figure 15. Growth of a single coalesced hydrogen bubble at 3.0 V. Coalesced bubble center position relative to the previous time stamp is denoted by red arrows.
Applsci 15 04107 g015
Figure 16. Growth of a single coalesced hydrogen bubble at 3.1 V.
Applsci 15 04107 g016
Figure 17. Growth of a single coalesced hydrogen bubble at 3.2 V.
Applsci 15 04107 g017
Figure 18. Comparison of current density at the end of the experimental run for each measured potential. Values are divided into 3 regions, and region 2 is divided further into two subregions.
Applsci 15 04107 g018
Figure 19. Measured and calculated bubble growth at electrical potentials of 2.9 V (a), 3.0 V (b), and 3.1 V (c,d).
Applsci 15 04107 g019
Table 1. Overview of bubble behavior, diameter at detachment, and departure frequency for the identified voltage regions.
RegionApplied Potential (V)Bubble BehaviorDiameter at Detachment (μm)Departure Frequency (Hz)
1≥2.0
<2.6
No coalescence; departure of individual bubbles≤50N/A
2a≥2.6
<2.8
(subregion a)
Partial coalescence: multiple coalesced bubbles depart simultaneously50–60N/A
2b≥2.8
<3.2
(subregion b)
Predominantly single coalesced bubbles70–2008–25
3≥3.2
<3.5
Departure of single coalesced bubbles≥4500.5–5.5
Disclaimer/Publisher’s Note: The statements, opinions and data contained in all publications are solely those of the individual author(s) and contributor(s) and not of MDPI and/or the editor(s). MDPI and/or the editor(s) disclaim responsibility for any injury to people or property resulting from any ideas, methods, instructions or products referred to in the content.

