Article

Risk Assessment of Drilling and Blasting Method Based on Nonlinear FAHP and Combination Weighting

1
School of Human Settlements and Civil Engineering, Xi’an Jiao Tong University, Xi’an 710049, China
2
China Construction First Group Corporation Limited Northwest Branch, Xi’an 710000, China
3
School of Civil Engineering, Xi’an University of Architecture and Technology, Xi’an 710055, China
4
Shaanxi Key Laboratory of Geotechnical and Underground Space Engineering, Xi’an 710055, China
5
China Railway Beijing Group Co., Ltd., Beijing 102308, China
*
Author to whom correspondence should be addressed.
Appl. Sci. 2025, 15(8), 4239; https://doi.org/10.3390/app15084239
Submission received: 14 March 2025 / Revised: 3 April 2025 / Accepted: 9 April 2025 / Published: 11 April 2025

Abstract

:
Risk assessment in tunnel construction using the drilling and blasting method presents a complex multi-criteria decision-making challenge due to numerous interacting factors. This study develops an advanced risk assessment model integrating game theory-based combination weighting with nonlinear fuzzy analytic hierarchy process (FAHP). The methodology establishes a comprehensive risk evaluation system through the systematic coupling of a work breakdown structure (WBS) and a risk breakdown structure (RBS), effectively combining subjective weights from an analytic hierarchy process (AHP) with objective weights derived through principal component analysis (PCA). A specialized nonlinear operator addresses the inherent fuzziness in the risk evaluation processes. The model is applied to the Daliangshan No. 1 Tunnel flat guide entrance drilling and blasting construction section, with the risk level determined to be high. Detailed analysis further revealed that the detonation network reliability and ventilation system performance constituted the most significant secondary risk elements. Comparative validation demonstrates the model’s superior accuracy over conventional methods in both weight determination and risk classification. The results demonstrate the effectiveness of the proposed model in improving risk assessment accuracy and supporting decision-making in complex tunnel construction environments.

1. Introduction

Tunnel engineering, as a critical component of modern infrastructure construction, faces numerous challenges due to complex geological conditions and construction environments [1]. Particularly in drill-and-blast tunneling, the risks of collapse are prominent due to the dynamic effects of blasting, uncertainties in the surrounding rock conditions, and the complexity of the construction techniques [2,3,4]. These risks significantly impact the safety, progress, and cost of engineering projects. Therefore, effectively assessing and controlling the risks in drill-and-blast tunneling is of great importance to engineering construction.
To address the risks associated with drill-and-blast tunneling, scholars have proposed various risk assessment methods. Guang-Zhao Ou [5] constructed a tunnel collapse risk assessment model through case analysis, advanced geological prediction, and D-S evidence theory, effectively identifying collapse risks in drill-and-blast tunneling. Bo Wu [6] proposed an improved Dempster–Shafer evidence theory, enhancing the accuracy of collapse risk assessment in drill-and-blast tunneling through multi-source data fusion. Tian Xu [7] proposed a cloud model-based risk assessment method for tunnel construction environments, which provides a foundation for transforming qualitative concepts into quantitative expressions under uncertainty. Additionally, Guowang Meng [8] and Xiaoduo Ou [9] utilized Bayesian networks and dynamic Bayesian networks (DBN) to dynamically assess collapse risks in drill-and-blast tunneling, revealing the causal relationships between the risk factors. Jie Jiang [10] introduced a coupled risk analysis model for deep foundation pit construction based on the N-K model and dynamic Bayesian networks, providing a reference for studying the risk coupling mechanism in deep foundation pit construction near existing underpass tunnels. Chengtao Yang [11] introduced a game theory-based G2-EW-TOPSIS model for evaluating the efficiency of drill-and-blast tunneling, constructing an evaluation index system from three dimensions: drilling efficiency, construction duration, and collaborative influencing factors. Desai Guo [1] investigated the composition of tunnel construction risks under complex geological and construction conditions, analyzing the coupling mechanisms of single and dual risk factors using the N-K model and coupling degree model. These studies have provided significant theoretical and methodological support for the analysis and control of risks in drill-and-blast tunneling.
However, risk assessment in drill-and-blast tunneling still faces several challenges [12,13]. First, the complex coupling relationships between the risk factors make it difficult for single risk assessment methods to comprehensively reflect the dynamic evolution of risks. Second, the uncertainties and fuzziness in the construction environment of drill-and-blast tunneling render traditional quantitative analysis methods inadequate for accurate risk assessment. Therefore, there is an urgent need for a risk assessment method that can comprehensively consider subjective and objective factors and address fuzziness and nonlinearity.
In the 1970s, operations researcher T.L. Saaty proposed the analytic hierarchy process (AHP) [14]. As a multi-criteria decision-making tool, AHP has been widely applied in engineering risk assessment due to its clear structure and ease of operation. Jianxiu Wang [15] used AHP to determine the weights of dynamic risk evaluation indicators for ultra-shallow buried large-span multi-arch tunnel construction and combined it with fuzzy comprehensive evaluation for risk assessment. Xiaobin Ding [16] utilized the analytic hierarchy process (AHP) to quantify risk factors related to clogging in clay-rich strata, providing a basis for controlling construction risks in such environments. Jeongheum Kim [17] employed AHP and the Delphi method to quantify risk factors for tunnel collapse, establishing a risk classification system.
Some scholars have further enhanced the applicability of AHP by combining it with other methods [18,19,20,21]. Ki-Chang Hyun [22] discussed the risks of adverse events in tunnel boring machine (TBM) construction, using fault tree analysis (FTA) and AHP with Nitidetch Koohathongsumrit [23] for risk assessment. The study demonstrated that AHP performs well in quantifying risk probability and impact. Qiankun Wang [24] proposed a dynamic safety evaluation method based on fuzzy set theory (FST) and Bayesian networks (BN), incorporating AHP to determine the weights of risk indicators. The study showed that AHP is effective in risk assessment under complex construction environments. Weiqiang Zheng [25] introduced a fuzzy comprehensive evaluation method based on CRITIC and D-AHP-combined weighting, improving risk assessment accuracy by compensating for the shortcomings of single weighting methods. Jianfei Ma [26] employed AHP and the fuzzy comprehensive evaluation method (FCEM) to assess risks in the construction of a super-large quasi-rectangular pipe-jacking tunnel under a high-speed railway. He-Qi Kong [27] introduced the FAHP-I-TOPSIS method for water inrush risk assessment in tunnels, demonstrating the advantages of fuzzy AHP in handling uncertainties and ambiguities. Xianghui Deng [28] applied fuzzy AHP to assess construction risks at tunnel portals, further validating the applicability of AHP in complex construction environments. Shihao Liu [29] constructed a deep foundation pit construction risk evaluation model based on combined weighting and nonlinear fuzzy AHP (FAHP), effectively addressing fuzziness and nonlinearity in risk assessment by introducing nonlinear operators. Additionally, Kang Liu [30] proposed an improved FAHP method for the structural safety assessment of water diversion tunnels, enhancing the consistency of expert judgments and the reliability of risk assessment by incorporating Dempster–Shafer evidence theory. Yuwei Zhang [31] introduced a tunnel blasting scheme evaluation model and blasting parameter optimization method, using FAHP to evaluate the rationality of blasting schemes and optimize key parameters.
Despite the significant achievements of AHP in construction risk assessment, its application in drill-and-blast tunneling still has limitations. While risk assessment methods such as AHP have been applied to engineering risk evaluation, drill-and-blast tunneling involves uncertainties and fuzziness. Relying solely on personnel experience for risk identification may lead to oversight, and the weighting methods in existing evaluation approaches are often singular and heavily dependent on subjective expert judgment, resulting in certain limitations.
This study addresses these limitations by introducing a “Work Breakdown Structure-Risk Breakdown Structure” to construct a risk evaluation index system for drill-and-blast tunneling, avoiding risk omissions and overlaps. A game theory-based combined weighting method is employed to coordinate the weights obtained from subjective and objective weighting methods, reducing the influence of subjective factors and avoiding biases caused by single weighting methods, thereby improving the reliability of weight calculations. By introducing nonlinear operators into the fuzzy analytic hierarchy process (FAHP) for drill-and-blast tunneling risk evaluation, a new risk evaluation model based on combined weighting and nonlinear FAHP is established. This model is applied to the drill-and-blast tunneling section of the No. 1 Tunnel at the Pingdao entrance of the Daliangshan Tunnel, a control project on the Leshan–Xichang Expressway, to verify the rationality and feasibility of the new model.

2. Construction of Risk Assessment Indicators for Drilling and Blasting Method Based on the WBS—RBS Method

The work breakdown structure (WBS) decomposes a project into the smallest operational tasks, while the risk breakdown structure (RBS) [32,33] decomposes risk factors in the construction process into the smallest risk units. By cross-coupling the basic units of WBS and RBS, a WBS–RBS coupling matrix is constructed, which can analyze and judge project risks and transformation conditions from an overall perspective, avoiding omissions and obtaining a reasonable and effective risk index system.

2.1. Developing a Work Breakdown Structure

The drilling and blasting construction process is decomposed hierarchically into primary and secondary indicators. Primary indicators include: drilling and blasting construction preparation, drilling and blasting excavation, and auxiliary construction [3,34]. The primary indicators are further divided into the smallest operational units, forming secondary indicators. The work breakdown structure for drilling and blasting construction is shown in Figure 1.

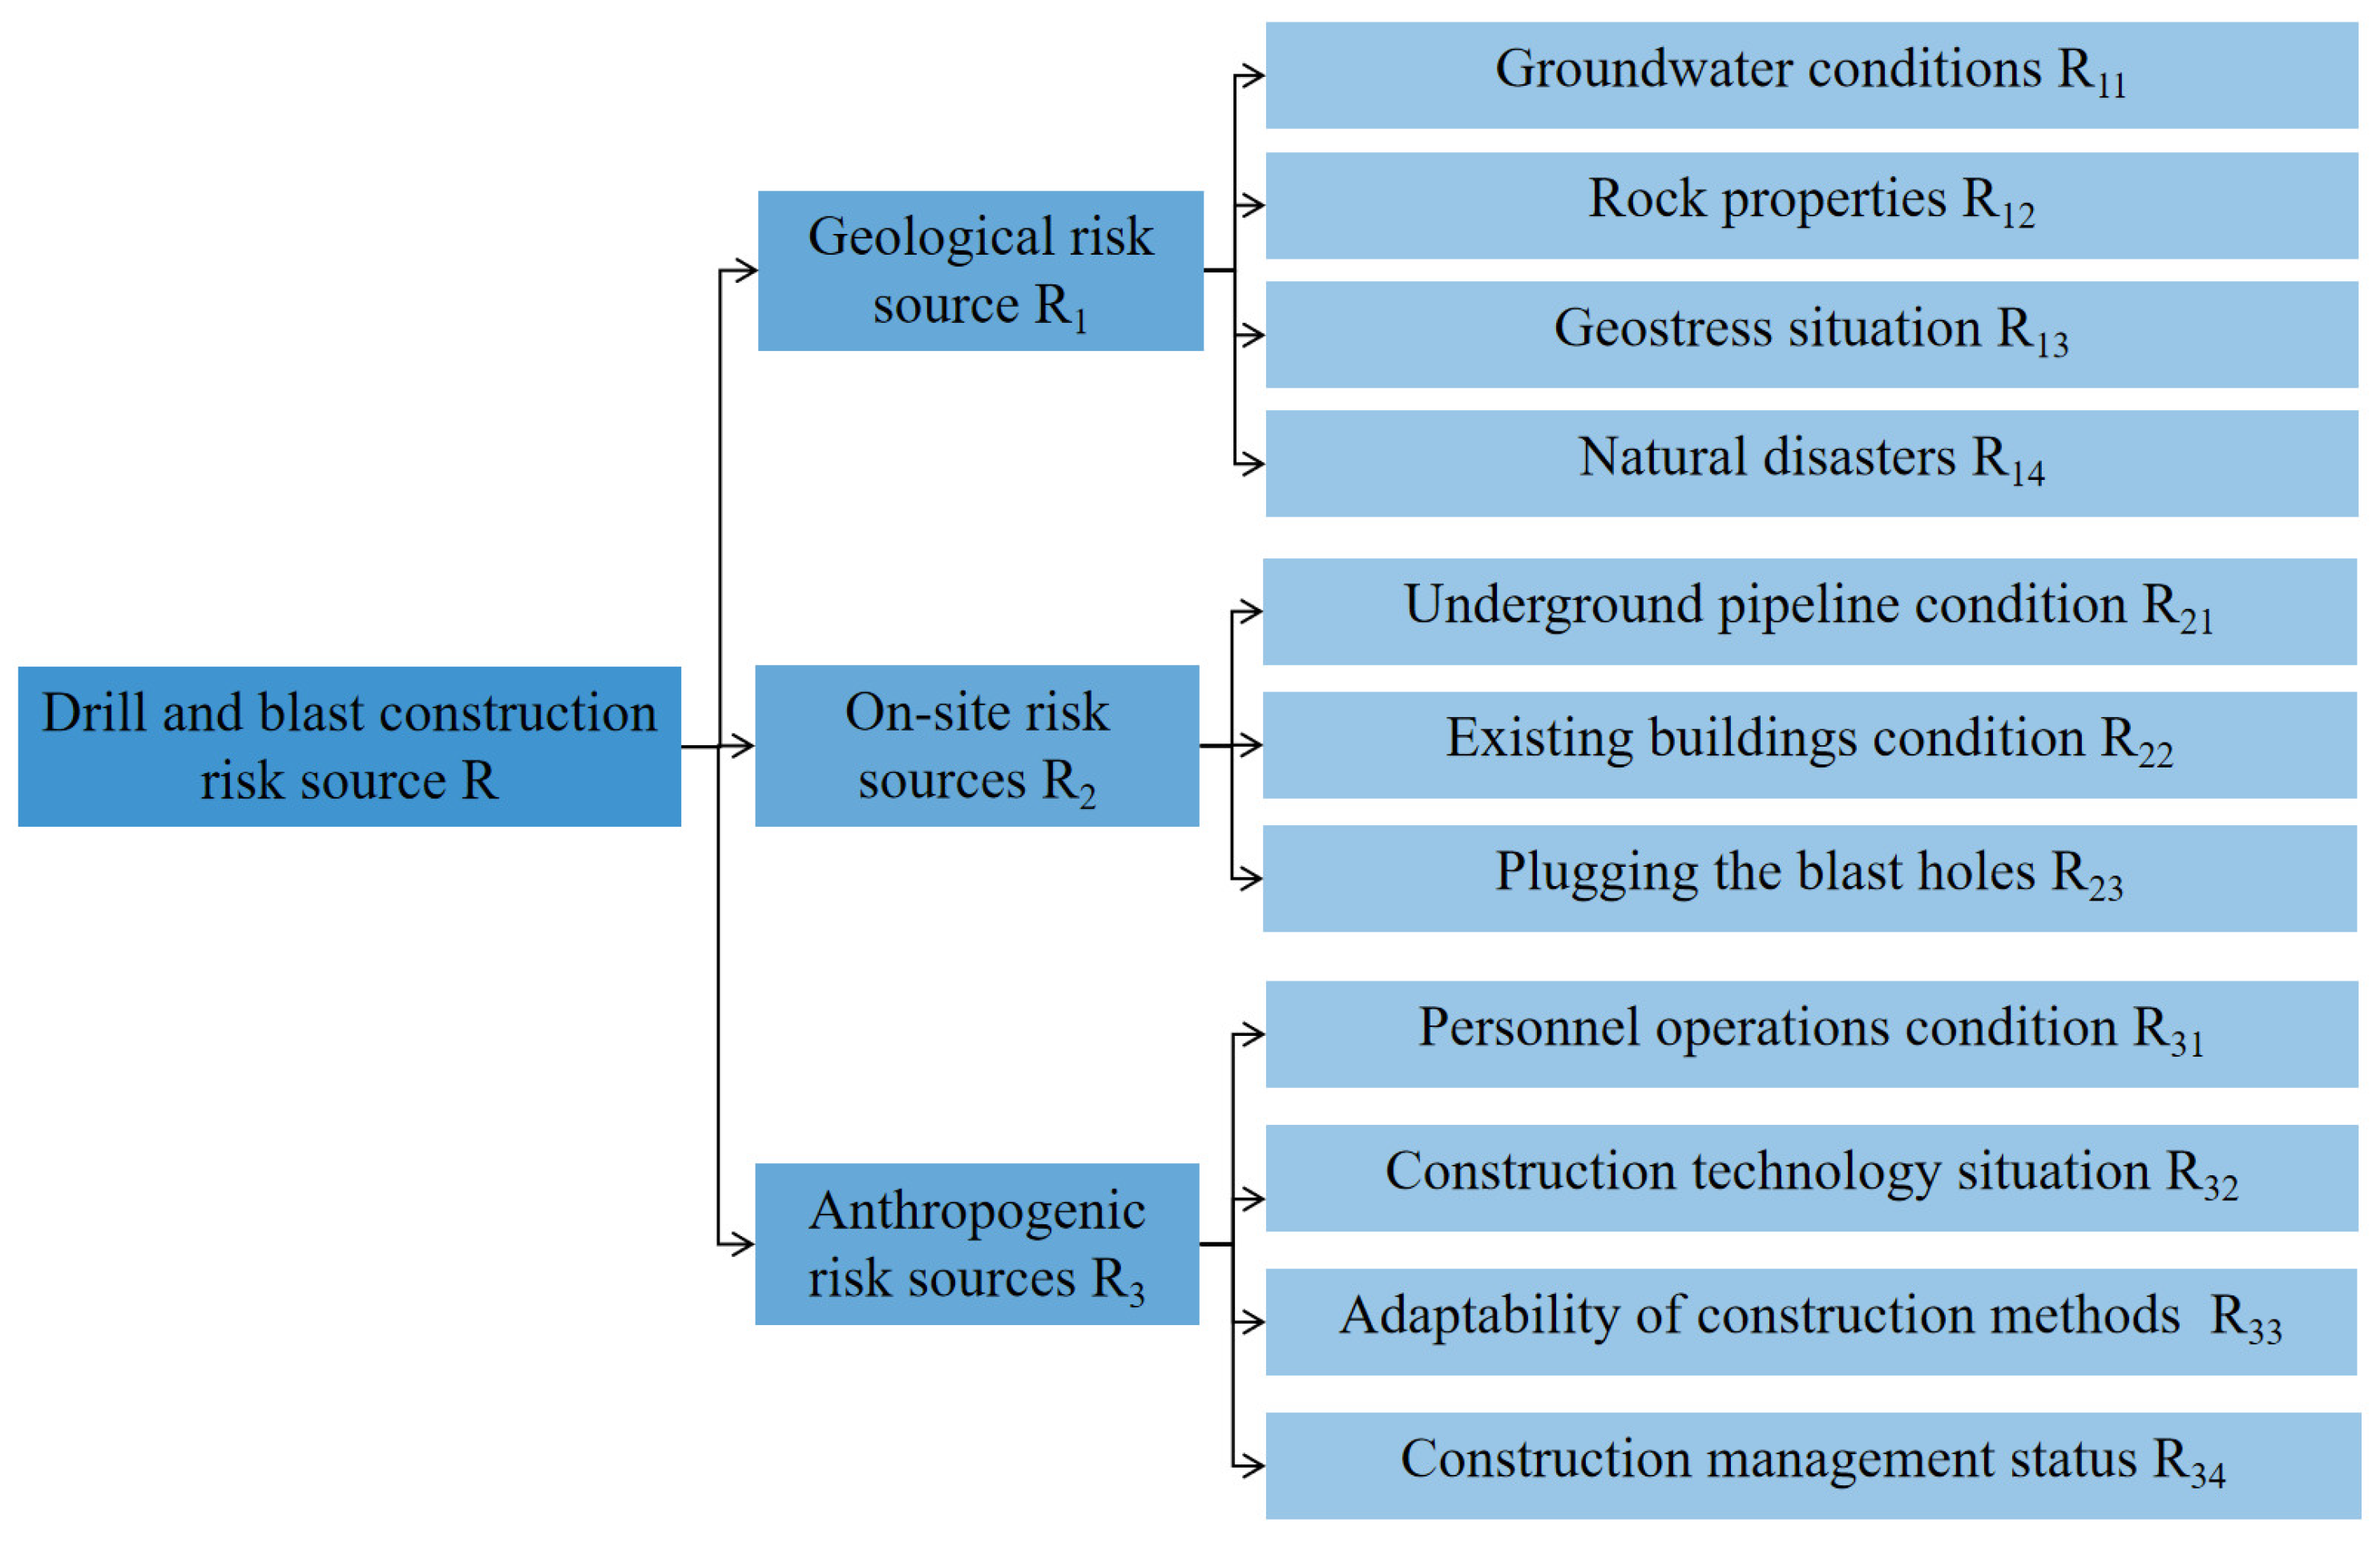
2.2. Risk Source Breakdown Structure

Risk factors that may cause drilling and blasting construction risks are decomposed based on risk categories. Based on the characteristics of the drilling and blasting construction process and the construction environment, risk sources are divided into primary and secondary risk indicators. Secondary risk indicators further decompose the primary risk indicators into different risk units, forming secondary risk indicators. The risk breakdown structure for drilling and blasting construction is shown in Figure 2.

2.3. Risk Identification Coupling Matrix

Using RBS risk units as the vertical axis and WBS operational tasks as the horizontal axis, a WBS–RBS coupling matrix is constructed for risk identification in drilling and blasting construction, as shown in Table 1. In the coupling matrix, if a risk is possible at the intersection of WBS and RBS, it is marked as “1”; otherwise, it is marked as “0”. The risk sources identified in the coupling matrix include: (1) the risk of W13R11, W13R31, W24R11, W24R31, W24R34, W34R11 is water and sand inrush, (2) the risk of W24R12, W24R31, W24R34, W34R12 is tunnel collapse, (3) the risk of W13R13, W24R13, W23R13 is rock burst, (4) the risk of W24R13 is surface subsidence, (5) the risk of W13R12 is borehole collapse, (6) the risk of W11R23, W11R31, W11R34, W13R23 is borehole spacing, (7) the risk of W13R31, W21R31, W21R34 is borehole depth, (8) the risk of W13R33, W11R34 is number or type of borehole, (9) the risk of W22R31, W22R32, W22R33, W22R34 is blast charging structure, (10) the risk of W12R33, W12R34 is drilling equipment, (11) the risk of W24R21 is underground pipeline failure, (12) the risk of W24R22 is existing buildings deformation, (13) the risk of W35R32, W35R33, W35R34 is discontinuous slag discharge, (14) the risk of W24R33, W34R14 is supporting structure deformation, (15) the risk of W24R33, W34R31, W34R34 is lining leakage, (16) the risk of W23R14, W23R31, W23R34 is blasting network failure, (17) the risk of W24R31, W24R33, W24R34 is blast jet lag, (18) the risk of W31R31, W31R34 is misfire or residual blasting, (19) the risk of W33R31, W33R34 is poor blasting effect, (20) the risk of W35R11, W35R14, W35R32, W35R33, W35R34 is water accumulation, and (21) the risk of W32R14, W32R23, W32R31, W32R33, W32R34 is poor ventilation.

2.4. Construction of the Risk Assessment Index System

Based on field construction management experience and the risk identification coupling matrix, a risk assessment index system for drilling and blasting construction is constructed, considering the possible risk factors in drilling and blasting construction [11,31]. The risk assessment index system for drilling and blasting construction is shown in Figure 3.

3. Risk Assessment Methodology

3.1. Construction of the Fuzzy Relation Matrix

3.1.1. Determination of Comment Set

The risk assessment set is a collection of various evaluation combinations for drilling and blasting construction risks, based on experience analysis and expert opinions. The risk assessment set for drilling and blasting construction is divided into five levels: U = {u1, u2, u3, u4, u5} = {low risk, relatively low risk, medium risk, relatively high risk, high risk}.

3.1.2. Construction of the Membership Degree Vector

The expert scoring method is an evaluation method that combines subjective logical judgment analysis with objective computational reasoning. In the risk assessment of drilling and blasting construction, multiple experts score each risk factor, and the membership degree vector is determined. The membership degree vector of evaluation indicator tij to the assessment set U is:
D i = d i 1 , d i 2 , d i 3 , d i 4 , d i 5

3.1.3. Construction of the Fuzzy Evaluation Matrix

In the risk assessment of drilling and blasting construction, the membership degree of each indicator to each risk level is determined, and the fuzzy relation matrix Q is constructed.
Q = d 11 d 1 j d 1 m d i 1 d i j d i m d n 1 d n j d n m
where 0 d i j 1 , dij represents the membership degree of indicator i to risk level j.

3.2. Determination of Weight Vectors

In risk assessment, weights have a significant impact on the evaluation results. Subjective weighting reflects the subjective experience of experts, while objective weighting is calculated based on mathematical formulas. Using a single weighting method has certain limitations, so combined weighting methods are increasingly used in risk assessment to determine the final weights. This study uses AHP [35] and PCA [36] to calculate the subjective and objective weights of risk factors in drilling and blasting construction. The game theory [37] combined weighting method combines the advantages of both subjective and objective methods, aiming for Nash equilibrium to find a balance between the two methods, minimizing the deviation between the combined weights and the weights from each method, resulting in more reasonable combined weight vectors.

3.2.1. Calculation of Subjective Weight Using AHP

Step 1. Constructing the judgment matrix (G):
The scale’s interpretation from 1 to 9 is shown in Table 2. Based on the established risk assessment index system for drilling and blasting construction, the 1–9 scale method is used to compare the importance of each indicator factor within the system’s subordinate levels, obtaining the initial judgment matrix as follows:
G = g i j n × n
where gij represents the element in the i-th row and j-th column of the judgment matrix G, and n is the matrix order.
Step 2. Solve the judgment matrix to obtain its maximum eigenvalue and corresponding eigenvector.
G n × n · M = λ max · M
where Gn×n represents the n-th order judgment matrix; M represents the eigenvector corresponding to the maximum eigenvalue of the judgment matrix; λ max represents the maximum eigenvalue of the judgment matrix.
Step 3. Consistency check.
When constructing the judgment matrix for drilling and blasting construction risk assessment, consistency testing is required to eliminate the influence of subjective factors on the judgment matrix. The specific testing steps include the following:
Consistency index
C I = λ max n n 1
where CI is the consistency index.
Consistency ratio
C R = C I R I
where CR is the consistency ratio, and RI is the average random consistency index, with specific values shown in Table 3. Generally, if CR < 0.1, the judgment matrix passes the consistency test.
Step 4. Repeat steps 1 to 3 for each level, and combine the calculated weights to form the global weight vector W.

3.2.2. Calculation of Objective Weights Using PCA

In multi-attribute evaluation, multiple indicators are typically considered, but as their number grows, complexity and information overlap increase. Principal component analysis (PCA) addresses this by reducing dimensionality to a few uncorrelated principal components, which enhances efficiency by focusing on the most critical factors.
The sample data obtained from the expert scoring method is dimensionally reduced to improve the concentration of sample information and obtain the weights of each principal component. The specific steps are as follows:
For n samples of m dimensions xi = (xi1, xi2, …, xip), form the sample matrix X = (xij)n×p.
Step 1. Standardize the sample data to eliminate the influence of dimensions as follows:
x ˜ ij = x i j x ¯ j s j
where x ˜ ij is the standardized indicator (i = 1, 2, …, n; j = 1, 2, …, m).
x ¯ j = 1 n i = 1 n x i j
s j = 1 n 1 i = 1 n ( x i j x ¯ j ) 2
where x ¯ j and s j are the sample mean and sample standard deviation of the j-th indicator.
x ˜ i = x i x ˜ i s i
where x ˜ i is the standardized indicator variable (i = 1, 2, …, m).
Step 2. Obtain the covariance matrix Z from the standardized data as follows:
Z = ( z i j ) m × m = z 11 z 12 z 1 m z 21 z 22 z 2 m z m 1 z m 2 z m m
where zij is the element of the covariance matrix Z (i = 1, 2, …, m; j = 1, 2, …, m).
Step 3. Solve the characteristic equation of the covariance matrix Z to obtain its eigenvalues λ = [ λ 1 , λ 2 , λ m ] and eigenvectors v = v 1 , v 2 , , v m T , where v j = ( v 1 j , v 2 j , , v n j ) T . Select principal components with eigenvalues greater than 1 for analysis.
Step 4. Determine each principal component Y = y 1 , y 2 , , y p and calculate the variance contribution rate b j and cumulative variance contribution rate a p of each eigenvalue:
y 1 = v 11 x ˜ 1 + v 21 x ˜ 2 + + v m 1 x ˜ m y 2 = v 12 x ˜ 1 + v 22 x ˜ 2 + + v m 2 x ˜ m y p = v 1 m x ˜ 1 + v 2 m x ˜ 2 + + v m p x ˜ m
where p is the number of principal components.
The variance contribution rate of each principal component y j is as follows:
b j = λ j k = 1 m λ k
The cumulative variance contribution rate a p of principal component Y is as follows:
a p = k = 1 p λ k k = 1 m λ k
where j, k = 1, 2, …, m.
Step 5. Calculate the principal component loadings as follows:
q = λ r v r j
where r = 1, 2, …, p; j = 1, 2, …, m; λ r is the eigenvalue corresponding to the r-th principal component, and ν rj is the j-th coefficient of the eigenvector corresponding to the r-th principal component.
Step 6. Calculate the scores of each principal component as follows:
F r = v r 1 X 1 + v r 2 X 2 + + v r p X p
where r = 1, 2, …, p.
Step 7. Calculate the comprehensive scores of each indicator as follows:
F = r = 1 p λ r k = 1 m λ k · F r
where r = 1, 2, …, m.
Step 8. Normalize the weights of each indicator to obtain the objective weights of the risk assessment indicators for drilling and blasting construction.

3.2.3. Calculation of Combined Weights Using Game Theory

Game theory can combine weight sets from multiple evaluation methods, aiming for Nash equilibrium to find a balance between different evaluation methods, minimizing the deviation between combined weights and the weights from each method. This approach combines the advantages of both subjective and objective weighting methods, reducing subjectivity and compensating for the loss of some information due to dimensionality reduction in PCA. The specific steps of the combined weighting method are as follows:
Step 1. Calculate the basic weights of each indicator
Subjective and objective weighting methods are used to calculate the subjective and objective weights of risk indicators in drilling and blasting construction, and construct the basic weight vector set: M k = m k 1 , m k 2 , , m k n , k = 1, 2, …, L, where n is the number of evaluation indicators, and L is the number of weighting methods. The linear combination of L weight vectors Mk is as follows:
M = k L α k · M k T
where M is the combined weight vector, α k is the linear combination weight coefficient, and m is the set of basic weight vectors.
Step 2. Calculate the optimized linear coefficient β
To find consistency between different weights and maximize the benefits of both, optimize the linear combination coefficient α k to minimize the deviation between M and Mk, obtaining the optimal weight. The objective function is as follows:
Min k = 1 L α k · m k T m k 2
where k = 1, 2, …, L.
Based on matrix differential properties, the first-order derivative condition of the above optimization is the linear equation system.
m 1 m 1 T m 1 m 2 T m 1 m L T m 2 m 1 T m 2 m 2 T m 2 m L T m L m 1 T m L m 1 T m L m L T α 1 α 2 α L = m 1 m 1 T m 2 m 2 T m L m L T
Step 3. Normalize the optimized weight coefficients to obtain the optimized linear coefficient β as follows:
β = α k k = 1 L α k
Step 4. Calculate the combined weight M*.
The final combined weight M* of the risk assessment indicators for drilling and blasting construction is calculated as follows:
M * = k = 1 L β M k

3.3. Nonlinear Fuzzy Comprehensive Evaluation

The uncertainty in the risk assessment of drilling and blasting construction leads to nonlinearity in the evaluation. Linear weighted methods may not fully reflect the significant impact of certain evaluation indicators, and the evaluation results may deviate from the actual situation. Therefore, a nonlinear fuzzy comprehensive evaluation method [29,31] is introduced to compensate for the shortcomings of linear weighted methods. The specific form is as follows:
f m 1 , m 2 , , m n ; q 1 , q 2 , , q n ; Λ = m 1 q 1 γ 1 + m 2 q 2 γ 2 + + m n q n γ n 1 γ , γ i 1 , i = 1 , 2 , , n
where m 1 , m 2 , , m n are the weights of risk indicators, m i 0 , and i = 1 n m i = 1 , q 1 , q 2 , , q n are the values of a column in the fuzzy evaluation matrix, q i 1 ; Λ is the vector of prominent influence coefficients, denoted as Λ = γ 1 , γ 2 , γ n , γ = max γ 1 , γ 2 , γ n The prominent influence coefficient γ i is determined based on the 9-scale method and the principle of γ i values, depending on the degree of influence of risk factors on the evaluation results. The specific values are shown in Table 4. When a risk factor has a significant impact on the evaluation results, its prominent influence coefficient γ i increases accordingly; otherwise, if the impact is negligible, γ i is set to 1, resulting in linear fuzzy matrix calculation.
According to the principle of prominent influence coefficient γ i , the influence degree of each risk factor on drilling and blasting construction is evaluated, and the following formula is used for fuzzy transformation to meet the requirements of nonlinear operator for fuzzy matrix synthesis.
d i j = 10 × d i j
where d i j is the value of the original fuzzy evaluation matrix; d i j is the corresponding value in the nonlinear fuzzy evaluation matrix.
During the fuzzy transformation of the original matrix function, it is necessary to ensure that the proportional relationship between each value in the nonlinear fuzzy evaluation matrix and the original matrix remains consistent. Therefore, when d i j 0.05 , d i j = 0 ; when 0.05 d i j 1 , d i j = 1 .

3.4. New Risk Assessment Model

Based on field management experience and the risk identification coupling matrix, a risk assessment index system for drilling and blasting construction is established. As shown in Figure 4, the weights and membership degrees are analyzed, and a nonlinear operator is introduced to develop a combined weighting–nonlinear FAHP risk assessment model for drilling and blasting construction. The specific evaluation process is as follows:
(1)
For the weight part, compare the importance of each risk indicator in the risk factor set using the 1–9 scale method, obtain the corresponding judgment matrix, and perform consistency testing using the consistency ratio (CR). If the consistency test is not satisfied, reconstruct the judgment matrix for adjustment. Solve the judgment matrix that satisfies the consistency test to obtain the maximum eigenvalue and corresponding eigenvector, normalize the eigenvector to obtain the subjective weights and indicator layer weights. Use PCA to extract principal components from the expert scoring data and further calculate the objective weights of each indicator. Use the game theory combined weighting method to coordinate and allocate subjective and objective weights, then combine the subjective and objective weights to obtain the combined weights of the factor layer.
(2)
For the membership degree part, construct the corresponding risk assessment set and risk factor set, use the expert evaluation method to evaluate the indicators of the risk factor set to obtain the membership degree vector, and then convert it into a fuzzy relation matrix.
(3)
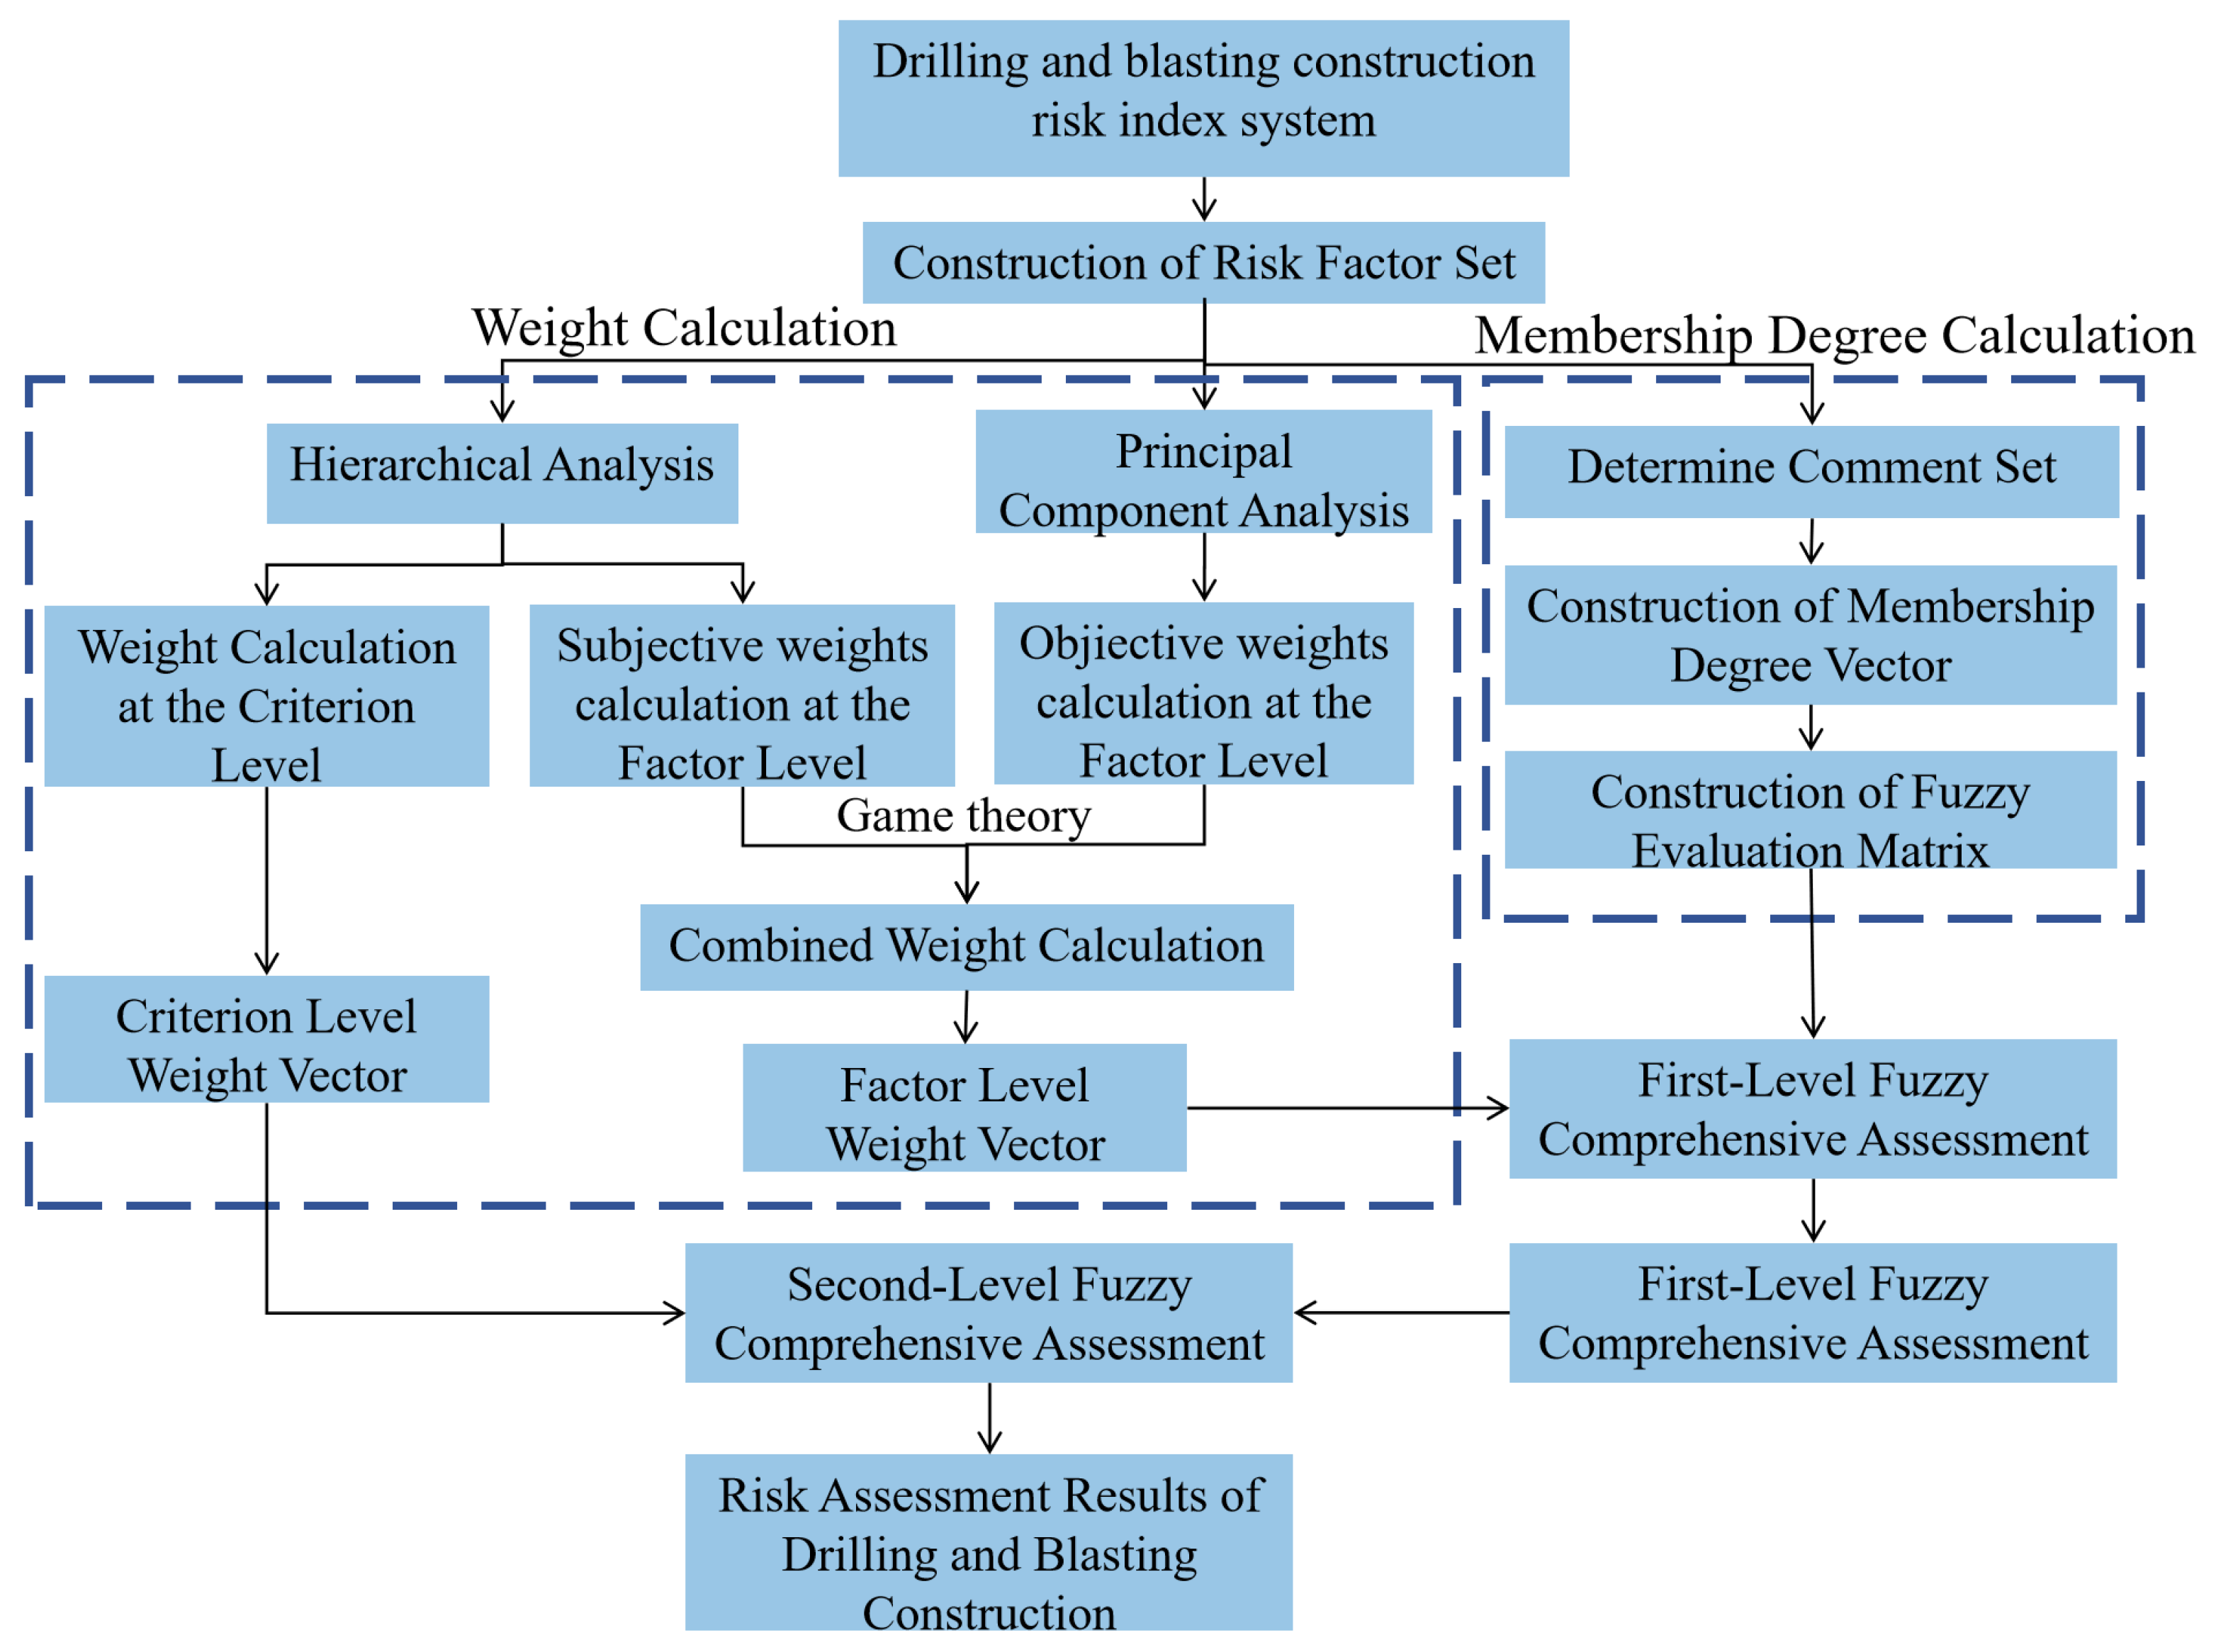
Substitute the combined weights of the secondary indicators and the fuzzy relation matrix into the nonlinear fuzzy comprehensive evaluation to obtain the evaluation result vector and convert it into a fuzzy evaluation matrix. Combine the indicator layer weights for secondary nonlinear fuzzy comprehensive evaluation to obtain the secondary nonlinear fuzzy comprehensive evaluation result vector, and determine the risk level based on the membership degree. The evaluation process is shown in Figure 4.
(4)
Compared with existing evaluation systems, the new model improves the risk identification method and the weight part that significantly affects the evaluation results. The weights are divided into subjective and objective parts, and the game theory combined weighting method is used to integrate the subjective and objective weights, combining the advantages of both weighting methods, reducing subjectivity, and obtaining a combined weight that is more consistent with the actual situation. At the same time, a nonlinear operator is introduced for comprehensive calculation, making the evaluation results more reasonable.

4. Case Study

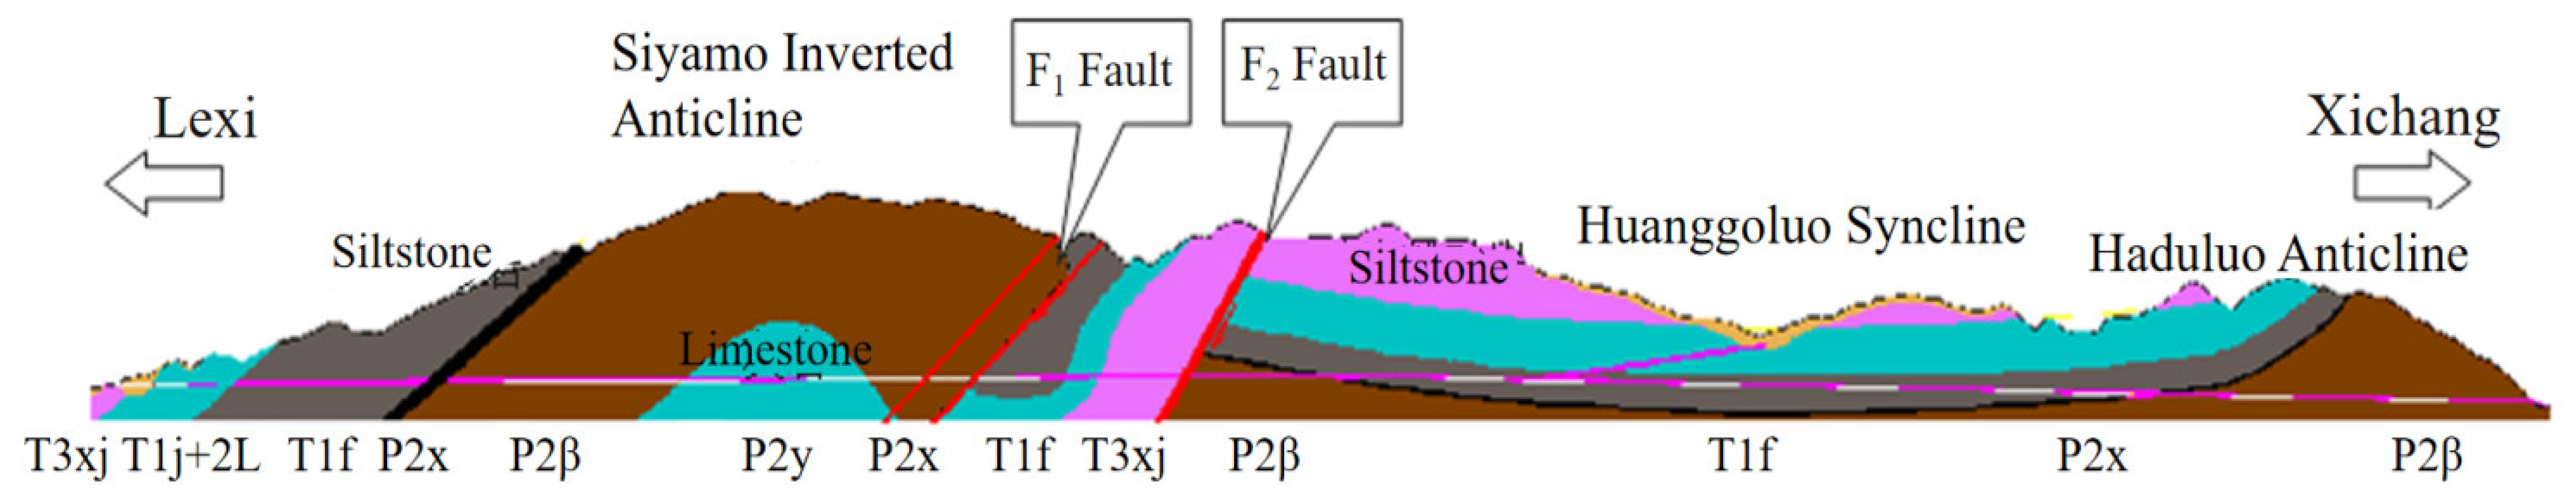
4.1. Project Overview

The case study involves the construction section of the Daliangshan No. 1 Tunnel on the Leshan–Xichang Expressway. The Daliangshan No. 1 Tunnel is a key control project, and the construction of the flat guide is a critical point for progress control. As shown in Figure 5, the tunnel passes through multiple strata with complex lithology and structures, posing significant safety risks, making it a key and challenging project.
The tunnel area is characterized by erosional structural high mountain landforms, mainly controlled by geological structures and closely related to lithology. The typical anticline forms a mountain landform with well-developed “V” shaped transverse valleys. The slope at the tunnel entrance generally ranges from 15° to 25°, with well-developed vegetation, mainly pine trees and mixed woods. The bedrock is sporadically exposed, and the overburden is thick. The tunnel exit is a steep cliff with exposed bedrock and good stability. The tunnel portal is affected by shallow weathering and joint fissures, and the surrounding rock is classified as Grade V, mainly consisting of strongly weathered limestone, dolomite, and thin-layered marl. The groundwater mainly seeps in the form of infiltration, dripping, and rain-like leakage, with possible linear seepage during the rainy season.

4.2. Calculation of Risk Indicator Weights

4.2.1. Calculation of Subjective Weight

Based on the risk assessment index system for drilling and blasting construction, the subjective weights are calculated. The importance of each indicator factor within the subordinate levels of the system is compared pairwise, and the judgment matrix for the risk assessment of the Daliangshan No. 1 Tunnel is determined to obtain the subjective weights. Taking the calculation of the weight coefficient of the indicator layer as an example, the results are shown in Table 5.
Similarly, the subjective weight corresponding to each indicator of the drilling and blasting method is obtained. The specific subjective weights are shown in Table 7.

4.2.2. Calculation of Objective Weight

The expert scoring method is used to score the secondary factors of the risk assessment index system, and the data are standardized. SPSS 27 software is used to analyze the sample data. The KMO value is 0.620, and the Sig value of Bartlett’s sphericity test is 0.000, indicating that the indicators are correlated and meet the criteria for PCA. As shown in Table 6, when the number of principal components is set to nine, the cumulative variance contribution rate reaches 86.124%, indicating that the nine extracted principal components can explain 86.124% of the original data information. Therefore, nine principal components are extracted, denoted as y1, y2, y3, y4, y5, y6, y7, y8, y9.
Based on the principal component coefficients, the objective weights of the secondary factors in the risk assessment of the Daliangshan No. 1 Tunnel are calculated. The specific objective weights are shown in Table 7.

4.2.3. Calculation of Combined Weights

Based on the previously calculated subjective and objective weights, the basic weight set M 2 = m 21 , m 22 is obtained as follows:
1.6039 0.7450 0.7450 1.0410 · α 1 α 2 = 1.6039 1.0410
where m 21 · m 21 T = 1.6039 , m 22 · m 22 T = 1.0410 . Solving Equation (25) yields α 1 = 0.8022 , α 2 = 0.4259 .
From Equation (21), β 1 = 0.6532 , β 2 = 0.3468 .
Finally, based on Equation (22), the combined weights of the secondary factors in the risk assessment of the Daliangshan No. 1 Tunnel are calculated. The specific combined weights are shown in Table 7.
Analyzing the weights of the primary and secondary factors, it is concluded that among the primary risk factors, equipment risk and blasting risk have the greatest impact on risk in drilling and blasting construction scenarios. Among the secondary risk factors, poor blasting effect and borehole spacing have a significant impact on blasting risk, while blasting network failure and poor ventilation have a significant impact on equipment risk.

4.3. Membership Calculation

Based on the construction site conditions at the Daliangshan No. 1 Tunnel construction section on the Leshan–Xichang Expressway, the expert evaluation method is used to assess the secondary indicators for the risk assessment of the drilling and blasting construction of the Daliangshan No. 1 Tunnel. The membership degrees of each risk assessment indicator are obtained, as shown in Table 8.
Based on the secondary indicators, single-factor evaluation matrices are constructed and further transformed into nonlinear fuzzy comprehensive evaluation matrices. The nonlinear fuzzy comprehensive evaluation matrices are as follows:
The nonlinear fuzzy evaluation matrix for geological risk is
Q 1 = 0 0 3 6 1 0 0 8 2 1 0 0 2 7 1 6 3 1 0 0
The nonlinear fuzzy evaluation matrix for site risk is
Q 2 = 0 0 7 2 1 0 0 3 6 1 0 3 6 1 0
The nonlinear fuzzy evaluation matrix for equipment risk is
Q 3 = 0 2 6 1 0 1 6 3 0 0 1 6 3 0 0 0 2 6 2 0 0 3 5 2 0
The nonlinear fuzzy evaluation matrix for blasting risk is
Q 4 = 2 6 2 0 0 0 2 4 4 0 2 5 3 0 0 4 3 1 0 0 0 0 1 6 3 0 0 2 5 3 0 0 3 6 2 0 0 3 4 3 1 7 2 0 0

4.4. Determination of Prominent Influence Coefficients for Risk Factors

Based on Table 4 and the construction site conditions of the Daliangshan No. 1 Tunnel, the prominent influence coefficients for the primary and secondary risk factors in the risk assessment of drilling and blasting construction are determined, as shown in Table 9.
Based on the prominent influence coefficients in Table 7, the prominent influence coefficient vectors for the nonlinear fuzzy comprehensive evaluation matrices Q1 to Q4 are constructed as follows:
Λ 1 = 4.5 3 4.5 1.5 Λ 2 = 3 4 3.5 Λ 3 = 3.5 2 2.5 2.5 2.5 Λ 4 = 2 1.5 2 2 4.5 4.5 2.5 4.5 1.5
and the prominent impact coefficient vectors of the indicator layer Λ = 3.5 3 2 3.5 .

4.5. First-Level Nonlinear Fuzzy Comprehensive Evaluation

Combining Equation (23) and the prominent influence coefficient vector Λ 1 = 4.5 3 4.5 1.5 , the combined weight vectors of the secondary risk factors, and the fuzzy evaluation matrices Q1 to Q4, the evaluation result vectors for the secondary risk factors in the risk assessment of the Daliangshan No. 1 Tunnel are obtained as follows:
A 1 = 0.1358 0.1078 0.2530 0.4301 0.0733 A 2 = 0.0000 0.1734 0.3860 0.3589 0.0817 A 3 = 0.0862 0.3067 0.4407 0.1664 0.0000 A 4 = 0.1181 0.1704 0.1758 0.3397 0.1960

4.6. Second-Level Nonlinear Fuzzy Comprehensive Evaluation

Based on the primary nonlinear FAHP result vectors, a new single-factor evaluation matrix Q A = A 1 A 2 A 3 A 4 T is constructed and further transformed into the fuzzy evaluation matrix Q A as follows:
Q A = 1.3576 1.0776 2.5305 4.3009 0.7334 0.0000 1.7339 3.8598 3.5894 0.8168 0.8618 3.0672 4.4071 1.6640 0.0000 1.1805 1.7045 1.7580 3.3968 1.9602
From Table 8, the prominent influence coefficient vector Λ = 3.5 3 2 3.5 for the primary risk factors in the risk assessment of the Daliangshan No. 1 Tunnel is obtained, and the primary risk factor weights M = 0.0569 0.1852 0.5016 0.2563 .
Using Equation (23), the weights, fuzzy evaluation matrix, and prominent influence coefficient vector are comprehensively calculated and normalized to obtain the secondary nonlinear fuzzy comprehensive evaluation result vector A, which is the comprehensive evaluation vector of the overall risk.
A = f M , Q A , Λ = [ 0.1061 0.1883 0.2625 0.3001 0.1429 ]
According to the principle of maximum membership degree, the overall risk level of the Daliangshan No. 1 Tunnel construction section is determined to be Level 4, indicating a high-risk level. This result is consistent with the actual construction conditions of the Daliangshan No. 1 Tunnel.

4.7. Countermeasures

The risk assessment results indicate that equipment and blasting risks are the most critical factors affecting the construction safety of the Daliangshan No. 1 Tunnel. To mitigate these risks, targeted measures are proposed. For detonation network reliability, a series–parallel hybrid network with precise millisecond delay control should be adopted, with parameters regularly adjusted based on monitoring feedback. Ventilation efficiency can be enhanced by integrating transport and exhaust passages, implementing wet drilling combined with high-pressure sprayers and strategically placed mist purification water curtains (20–30 m from the face), while real-time monitoring of environmental parameters ensures dynamic system optimization. Blasting operations require strict control of perimeter hole charges using interval charging techniques, with hole spacing and explosive consumption continuously corrected according to geological conditions and vibration data. Post-blast evaluations of rock fragmentation, contour accuracy, and overbreak/underbreak should guide iterative parameter refinement. Additionally, employing highly trained personnel for blasting operations and improving surveyor expertise through enhanced training programs will ensure precise hole layout and contour control. These integrated measures, emphasizing adaptive management and continuous process improvement, are designed to effectively control construction risks while maintaining operational efficiency.

5. Discussion

5.1. Rationality Analysis of Index Weight

To validate the correctness of the proposed method, this study considered three additional weighting calculation methods while accounting for expert weight determination, as described below:
(1)
Conventional FAHP [38] employs fuzzy numbers for pairwise comparisons by experts to construct judgment matrices and calculate weights, followed by consistency verification.
(2)
LFPP-FAHP [31] utilizes logarithmic fuzzy preference programming (LFPP) to determine the weights of evaluation indicators, incorporating field conditions to establish reliability functions for dynamic indicators and grading criteria for indicator rationality.
(3)
FAHP-SPA [39] applies triangular fuzzy analytic hierarchy process (FAHP) to determine the fuzzy weights of evaluation indicators. At the objective level, the set pair analysis (SPA) method compares the affiliation between indicator sets and standard sets to define the ranking scope of evaluation criteria. Finally, a combined subjective–objective approach determines the overall risk level of tunnel operational safety.
Taking the expert weights at the second level of the indicator system as an example, Figure 6 illustrates the expert weights calculated by different methods.
The comprehensive weight method adopted in this study demonstrates superior robustness and discriminative power in weight calculation results compared to the three alternative methods (FAHP, LFPP-FAHP, and FAHP-SPA). Its advantages primarily lie in the integrated consideration of consistency and compatibility in expert judgments. For key indicators such as t35, both FAHP and LFPP-FAHP exhibit extreme values due to excessive reliance on fuzzification or single-matrix optimization, while FAHP-SPA tends to smooth out differences through set pair analysis. In contrast, the proposed method dynamically adjusts expert weights to avoid extreme deviations while maintaining reasonable weight differentiation. For highly conflicting indicators like t23, significant discrepancies exist between FAHP and FAHP-SPA results, whereas our method achieves more precise aggregation through compatibility iteration, effectively balancing group disagreements.
Furthermore, the proposed method demonstrates enhanced stability in calculating low-weight indicators, indicating superior noise resistance compared to other approaches. FAHP-SPA’s over-reliance on uncertainty analysis may drive some weights toward zero, while LFPP-FAHP’s neglect of compatibility can lead to deviations from group consensus. In comparison, our method comprehensively optimizes weight allocation by integrating judgment matrix quality and inter-expert compatibility. This approach not only mitigates the subjective fuzziness bias inherent in FAHP but also overcomes the extreme optimization tendency of LFPP-FAHP and the over-smoothing issue of FAHP-SPA, thereby exhibiting significant advantages in both accuracy and discriminative capability.

5.2. Rationality of Evaluation Results

Through comparative analysis of four weighting calculation methods (FAHP, LFPP-FAHP, FAHP-SPA, and the proposed comprehensive weighting method), this study reveals the characteristic differences between various approaches in risk assessment. As shown in Table 10, the conventional FAHP method demonstrates weight amplification effects in both medium–high and medium risk indicators due to its reliance on subjective expert judgments, confirming the bias accumulation issue in fuzzy mathematics when handling uncertainties. The LFPP-FAHP approach, while optimizing consistency through linear programming, results in more extreme weight distributions, indicating that sole dependence on mathematical optimization may disrupt the equilibrium of group decision-making. In contrast, the FAHP-SPA method yields the most conservative risk assessment outcomes through set pair analysis theory, though its abnormally elevated high-risk indicators expose limitations in handling extreme scenarios.
The comprehensive weighting method proposed in this study achieves more rational weight allocation while maintaining risk level discrimination. Specifically, the medium-risk value (0.2625) shows a 7.8% reduction compared to FAHP, the medium–high-risk value (0.3001) demonstrates a 14.2% decrease relative to LFPP-FAHP, and the high-risk indicator (0.1429) exhibits a 23.0% reduction versus FAHP-SPA. This balanced performance stems from the method’s dual optimization mechanism: compatibility testing to correct subjective expert biases and dynamic weight adjustment algorithms to prevent extreme values. Empirical data confirm that the proposed approach not only overcomes FAHP’s subjectivity limitations and LFPP-FAHP’s over-optimization issues, but also better preserves risk assessment sensitivity compared to FAHP-SPA, thereby establishing a novel technical pathway for weight determination in complex decision-making scenarios.

5.3. Limitations and Future Work

The proposed combined weighting-nonlinear FAHP method for risk assessment of drilling and blasting tunnel construction demonstrates advantages in weight calculation and risk level determination, yet several limitations require improvement. Firstly, although the risk indicator system was established through the WBS–RBS coupling matrix, the coverage of risk factors for special geological conditions (e.g., karst development zones) may be incomplete. Moreover, the classification criteria for some secondary indicators primarily rely on expert experience, whose scientific validity and generalizability need further verification with more field measurement data. The model shows limited adaptability to dynamic risks, particularly in real-time response to sudden geological hazards, mainly due to the current assessment framework’s reliance on static weight calculation. Additionally, while nonlinear operators were introduced to address fuzziness, the determination of prominent influence coefficients (Λ) remains based on empirical scaling, which may compromise assessment accuracy under extreme working conditions.
Although case studies have validated the model’s applicability in the Daliangshan No.1 Tunnel, its effectiveness for super-large cross-section tunnels or complex urban environments requires further verification. Future research will integrate construction process numerical simulation with real-time monitoring data to develop dynamic weight updating algorithms and expand the case database to enhance the model’s engineering applicability.

6. Conclusions

Based on the WBS–RBS coupling matrix, an improved method for calculating indicator weights was introduced, and a nonlinear operator was incorporated to establish a combined weighting–nonlinear FAHP risk assessment method for a drilling and blasting method of construction. The following conclusions were drawn:
(1)
A comprehensive risk evaluation system was established by coupling work breakdown structure (WBS) and risk breakdown structure (RBS), effectively linking construction tasks with potential risks. This approach minimized omissions and overlaps in risk identification, providing a structured framework for assessing drilling and blasting construction risks.
(2)
The game theory combined weighting method was used to integrate the subjective weights calculated by the analytic hierarchy process and the objective weights calculated by principal component analysis. By applying group decision-making principles, a more reliable combined weight for the evaluation results was established, improving the rationality of the risk assessment results for drilling and blasting methods of construction and addressing the limitations inherent in single weighting methods.
(3)
Based on the combined weights, a nonlinear operator was introduced to perform a nonlinear fuzzy comprehensive evaluation of the drilling and blasting method construction section at the flat guide entrance of the Daliangshan No. 1 Tunnel. The prominent influence coefficients were determined subjectively, balancing the potential weakening of significant risk factors in traditional linear weighted averages. The results of the linear FAHP and nonlinear FAHP were compared, validating the rationality of the nonlinear FAHP evaluation results.
(4)
The model was applied to the Daliangshan No. 1 Tunnel, identifying the overall risk level as high. Key secondary risk factors, such as detonation network reliability and ventilation system performance, were highlighted. Comparative analysis demonstrated the model’s superior accuracy in weight determination and risk classification over conventional methods.

Author Contributions

Conceptualization and methodology, C.J. and D.L.; software, X.S.; validation, L.X.; writing—original draft, H.P.; writing—review and editing, Y.L. All authors have read and agreed to the published version of the manuscript.

Funding

This research was funded by the Science and Technology Innovation Team of Shaanxi Innovation Capability Support Plan (No. 2020TD005). The financial supports are gratefully acknowledged and the data are available for the journal.

Institutional Review Board Statement

Not applicable.

Informed Consent Statement

Not applicable.

Data Availability Statement

The measured data used to support the findings of this study are included within the article.

Acknowledgments

The authors express thanks to the people who helped with this work, and acknowledge the valuable suggestions from the peer reviewers.

Conflicts of Interest

Author Cheng Ji was employed by the company China Construction First Group Corporation Limited Northwest Branch. Authors Leilei Xu and Hongwei Pan were employed by the company China Railway Beijing Group Co., Ltd. The remaining authors declare that the research was conducted in the absence of any commercial or financial relationships that could be construed as a potential conflict of interest.

References

  1. Guo, D.; Song, Z.; Xu, T.; Zhang, Y.; Ding, L. Coupling Analysis of Tunnel Construction Risk in Complex Geology and Construction Factors. J. Constr. Eng. Manag. 2022, 148, 13. [Google Scholar] [CrossRef]
  2. Huo, R.; Li, S.; Song, Z.; Fujii, Y.; Lei, S.; Mao, J.; Tian, S.; Miao, Z. Analysis of Vibration Response Law of Multistory Building under Tunnel Blasting Loads. Adv. Civ. Eng. 2019, 2019, 6452657. [Google Scholar] [CrossRef]
  3. Tian, X.; Song, Z.; Wang, J. Study on the propagation law of tunnel blasting vibration in stratum and blasting vibration reduction technology—ScienceDirect. Soil Dyn. Earthq. Eng. 2019, 126, 105813. [Google Scholar] [CrossRef]
  4. Song, Z.P.; Li, S.H.; Wang, J.B.; Sun, Z.Y.; Liu, J.; Chang, Y.Z. Determination of equivalent blasting load considering millisecond delay effect. Geomech. Eng. 2018, 15, 745–754. [Google Scholar]
  5. Ou, G.Z.; Jiao, Y.Y.; Zhang, G.H.; Zou, J.P.; Tan, F.; Zhang, W.S. Collapse risk assessment of deep-buried tunnel during construction and its application. Tunn. Undergr. Space Technol. 2021, 115, 17. [Google Scholar] [CrossRef]
  6. Wu, B.; Zeng, J.; Zhu, R.; Zheng, W.; Liu, C. A Multi-Source Data Fusion Method for Assessing the Tunnel Collapse Risk Based on the Improved Dempster–Shafer Theory. Appl. Sci. 2023, 13, 5606. [Google Scholar] [CrossRef]
  7. Xu, T.; Song, Z.P.; Guo, D.S.; Song, Y.C. A Cloud Model-Based Risk Assessment Methodology for Tunneling-Induced Damage to Existing Tunnel. Adv. Civ. Eng. 2020, 2020, 11. [Google Scholar] [CrossRef]
  8. Meng, G.W.; Liu, J.L.; Qiu, W.X.; Wu, B.; Xu, S.X. A Failure Probability Evaluation Method for the Collapse of Drill-Blast Tunnels Based on a Multistate Cloud Bayesian Network. Front. Earth Sci. 2022, 10, 9. [Google Scholar] [CrossRef]
  9. Ou, X.D.; Wu, Y.F.; Wu, B.; Jiang, J.; Qiu, W.X. Dynamic Bayesian Network for Predicting Tunnel-Collapse Risk in the Case of Incomplete Data. J. Perform. Constr. Facil. 2022, 36, 12. [Google Scholar] [CrossRef]
  10. Jiang, J.; Liu, G.Y.; Ou, X.D. Risk Coupling Analysis of Deep Foundation Pits Adjacent to Existing Underpass Tunnels Based on Dynamic Bayesian Network and N-K Model. Appl. Sci. 2022, 12, 10467. [Google Scholar] [CrossRef]
  11. Yang, C.T.; Zhang, R.P.; Liu, D.W.; Tang, Y.; Huang, R.D.; Qiu, W.C. Evaluation of Excavation Ergonomics of Drill and Blast Method Based on Game Theory G2-EW-TOPSIS Model. Appl. Sci. 2023, 13, 7205. [Google Scholar] [CrossRef]
  12. Zhang, G.H.; Chen, W.; Jiao, Y.Y.; Wang, H.; Wang, C.T. A failure probability evaluation method for collapse of drill-and-blast tunnels based on multistate fuzzy Bayesian network. Eng. Geol. 2020, 276, 105752. [Google Scholar] [CrossRef]
  13. Liu, G.F.; Feng, X.T.; Feng, G.L.; Chen, B.R.; Chen, D.F.; Duan, S.Q. A Method for Dynamic Risk Assessment and Management of Rockbursts in Drill and Blast Tunnels. Rock Mech. Rock Eng. 2016, 49, 3257–3279. [Google Scholar] [CrossRef]
  14. Saaty, T.L. Analytic hierarchy process. In Encyclopedia of Operations Research and Management Science; Gass, S.I., Harris, C.M., Eds.; Springer: New York, NY, USA, 2001. [Google Scholar] [CrossRef]
  15. Wang, J.X.; Cao, A.S.; Wu, Z.; Sun, Z.P.; Lin, X.; Sun, L.; Liu, W.J.; Liu, X.T.; Li, H.B.Q.; Sun, Y.W.; et al. Dynamic Risk Assessment of Ultra-Shallow-Buried and Large-Span Double-Arch Tunnel Construction. Appl. Sci. 2021, 11, 11721. [Google Scholar] [CrossRef]
  16. Ding, X.B.; Xie, A.Y.; Yang, H.T.; Li, S.J. Quantifying Multifactor Effects on Mud Cake Formation Risk for a Tunnel Boring Machine with the Analytical Hierarchy Process. Buildings 2023, 13, 355. [Google Scholar] [CrossRef]
  17. Kim, J.; Kim, C.; Kim, G.; Kim, I.; Abbas, Q.; Lee, J. Probabilistic tunnel collapse risk evaluation model using analytical hierarchy process (AHP) and Delphi survey technique. Tunn. Undergr. Space Technol. 2022, 120, 12. [Google Scholar] [CrossRef]
  18. Meng, G.W.; Ye, Y.C.; Wu, B.; Luo, G.J.; Zhang, X.; Zhou, Z.Q.; Sun, W.T. Risk Assessment of Shield Tunnel Construction in Karst Strata Based on Fuzzy Analytic Hierarchy Process and Cloud Model. Shock Vib. 2021, 2021, 16. [Google Scholar] [CrossRef]
  19. Nezarat, H.; Sereshki, F.; Ataei, M. Ranking of geological risks in mechanized tunneling by using Fuzzy Analytical Hierarchy Process (FAHP). Tunn. Undergr. Space Technol. 2015, 50, 358–364. [Google Scholar] [CrossRef]
  20. Ren, X.; He, T.H.; He, P.F.; Yue, F.; Yang, B. A Case Study on Fuzzy Analytic Hierarchy Process Analysis of Factors Influencing the Stability of Surrounding Rock in Water-Rich Loess Tunnels and Corresponding Disposal Strategies. Appl. Sci. 2025, 15, 1835. [Google Scholar] [CrossRef]
  21. Habashneh, M.; Cucuzza, R.; Aela, P.; Rad, M.M. Reliability-based topology optimization of imperfect structures considering uncertainty of load position. Structures 2024, 69, 14. [Google Scholar] [CrossRef]
  22. Hyun, K.C.; Min, S.; Choi, H.; Park, J.; Lee, I.M. Risk analysis using fault-tree analysis (FTA) and analytic hierarchy process (AHP) applicable to shield TBM tunnels. Tunn. Undergr. Space Technol. 2015, 49, 121–129. [Google Scholar] [CrossRef]
  23. Chankham, W. Risk Analysis of Underground Tunnel Construction with Tunnel Boring Machine by Using Fault Tree Analysis and Fuzzy Analytic Hierarchy Process. Safety 2024, 10, 68. [Google Scholar] [CrossRef]
  24. Wang, Q.; Zhang, J.; Zhu, K.; Guo, P.; Shen, C.; Xiong, Z. The Safety Risk Assessment of Mine Metro Tunnel Construction Based on Fuzzy Bayesian Network. Buildings 2023, 13, 1605. [Google Scholar] [CrossRef]
  25. Zheng, W.Q.; Xu, S.X.; Wang, Z.C. Fuzzy Comprehensive Evaluation of Collapse Risk in Mountain Tunnels Based on Game Theory. Appl. Sci. 2024, 14, 5163. [Google Scholar] [CrossRef]
  26. Ma, J.F.; Cui, G.Y.; He, S.H.; Ling, X.K. Assessment and Control of Construction Risk for a Super-Sized Quasi-Rectangular Pipe-Jacking Tunnel Adjacently to High-Speed Railways: A Case Study. Ksce J. Civ. Eng. 2023, 27, 4520–4533. [Google Scholar] [CrossRef]
  27. Kong, H.Q.; Zhang, N. Risk assessment of water inrush accident during tunnel construction based on FAHP-I-TOPSIS. J. Clean Prod. 2024, 449, 15. [Google Scholar] [CrossRef]
  28. Deng, X.; Wang, R.; Xu, T. Risk Assessment of Tunnel Portals in the Construction Stage Based on Fuzzy Analytic Hierarchy Process. Arch. Civ. Eng. 2018, 64, 69–87. [Google Scholar] [CrossRef]
  29. Liu, S.H.; Song, Z.P.; Zhang, Y.; Guo, D.S.; Sun, Y.H.; Zeng, T.; Xie, J.S. Risk assessment of deep excavation construction based on combined weighting and nonlinear FAHP. Front. Earth Sci. 2023, 11, 13. [Google Scholar] [CrossRef]
  30. Liu, K.; Chen, Y.C.; Wang, H.R.; Xie, H.; Liu, Z.W. Reducing inconsistencies of FAHP in structural safety assessment of diversion tunnels. Appl. Soft. Comput. 2023, 146, 14. [Google Scholar] [CrossRef]
  31. Zhang, Y.W.; Zhang, Y.D.; Song, Z.P.; Pan, H.W. A LFPP-FAHP based evaluation model of blasting scheme for tunnel undercrossing existing buildings. Tunn. Undergr. Space Technol. 2024, 153, 15. [Google Scholar] [CrossRef]
  32. Yanmin, H. Risk Pre-diagnosis in Urban Rail Transit Engineering Using the WBS-RBS Method. Urban Rapin Rail Transit 2004, 4, 9–12. [Google Scholar]
  33. Fu, T.; Shi, K.B.; Shi, R.Y.; Lu, Z.P.; Zhang, J.M. Risk Assessment of TBM Construction Based on a Matter-Element Extension Model with Optimized Weight Distribution. Appl. Sci. 2024, 14, 5911. [Google Scholar] [CrossRef]
  34. Song, Z.P.; Mao, J.C.; Tian, X.X.; Zhang, Y.W.; Wang, J.B. Optimization Analysis of Controlled Blasting for Passing through Houses at Close Range in Super-Large Section Tunnels. Shock Vib. 2019, 2019, 16. [Google Scholar] [CrossRef]
  35. Satty, T.L. The Fundamentals of Decision Making and Priority Theory with the Analytic Hierarchy Process; RWS Publications: New York, NY, USA, 2000. [Google Scholar]
  36. Wold, S.; Esbensen, K.; Geladi, P. Principal Component Analysis. Chemom. Intell. Lab. Syst. 1986, 14, 231–246. [Google Scholar] [CrossRef]
  37. Kuhn, H.W. Classics in Game Theory; Princeton University Press: Princeton, NJ, USA, 1997. [Google Scholar]
  38. Naghadehi, M.Z.; Mikaeil, R.; Ataei, M. The application of fuzzy analytic hierarchy process (FAHP) approach to selection of optimum underground mining method for Jajarm Bauxite Mine, Iran. Expert Syst. Appl. 2009, 36, 8218–8226. [Google Scholar] [CrossRef]
  39. Zhao, Y.F.; Qiu, R.; Chen, M.; Xiao, S. Research on Operational Safety Risk Assessment Method for Long and Large Highway Tunnels Based on FAHP and SPA. Appl. Sci. 2023, 13, 9151. [Google Scholar] [CrossRef]
Figure 1. Work breakdown structure of drilling and blasting method.
Applsci 15 04239 g001
Figure 2. Risk breakdown structure of drilling and blasting method.
Applsci 15 04239 g002
Figure 3. Risk evaluation index system of drilling and blasting construction.
Applsci 15 04239 g003
Figure 4. Geological section of Daliangshan No. 1 tunnel.
Applsci 15 04239 g004
Figure 5. Risk assessment flow chart of drilling and blasting method.
Applsci 15 04239 g005
Figure 6. Second-level index weight composition.
Applsci 15 04239 g006
Table 1. Coupling matrix of drilling and blasting method risk identification.
Primary
Indicator
Secondary
Indicator
W1W2W3
W11W12W13W21W22W23W24W31W32W33W34W35
R1R11001000100011
R12001000100010
R13001000100010
R14000001001011
R2R21000000100000
R22000000100000
R23101000001000
R3R31101111111110
R32100010000001
R33011010101001
R34110111111111
Table 2. Relative comparison scale.
ScaleExplanation
1Both elements have the same level of contribution to the goal.
3One element has a slightly higher contribution compared to the other.
5One element has a significantly stronger contribution than the other.
7One element overwhelmingly dominates the other in terms of contribution.
9One element’s contribution is so dominant that the other’s role is almost insignificant.
2, 4, 6, 8Take the median value between the two adjacent degrees of the above comparison.
Table 3. The values of the random consistency index.
n123456789
RI0.000.000.580.901.121.241.321.411.46
Table 4. Criteria for prominent influence coefficient.
ScaleDefinition
1.5The influence of the indicator factor is minimal and hardly significant.
2.5The indicator factor has a modest but discernible influence.
3.5The impact of the indicator factor is clearly noticeable and somewhat significant.
4.5The indicator factor has a substantial and highly noticeable influence.
5.5The impact of the indicator factor is overwhelmingly significant and dominant.
2.0, 3.0, 4.0, 5.0The median between adjacent scales, indicating the scale at times when it falls somewhere in between two adjacent scales
Table 5. Weight calculation of first-level risk evaluation indexes.
Geological RiskOn-Site RiskEquipment RiskBlasting RiskWeight
Geological risk11/31/91/50.0569
On-site risk311/31/20.1852
Equipment risk93120.5016
Blasting risk521/210.2562
Table 6. Principal component variance contribution rates.
PCEigenvalueVariance Contribution RateCumulative Variance Contribution RatePCEigenvalueVariance Contribution RateCumulative Variance Contribution Rate
1434.49332.95332.9531222.0231.6792.266
2156.0711.83744.7891320.8331.5893.847
3118.9689.02353.8121418.6061.41195.258
4102.3477.76261.5741514.4731.09896.355
592.16886.9968.5651612.4480.94497.299
664.3854.88373.4481710.5450.88898.099
761.5414.66778.115189.4740.71998.818
860.0424.55482.669197.9610.60499.422
945.5493.45586.124205.0320.38299.803
1031.6282.39988.522212.5950.197100
1127.3472.07490.596
Table 7. Index weights for risk assessment of deep excavation construction.
Indicator LayerIndicator
Weight
Factor LayerSubjective
Weight
Objective
Weight
Combined
Weight
Geological risk T10.0569Tunnel collapse t110.04740.23220.1115
Water and sand inrush t120.22010.18430.2077
Rock burst t130.06660.33590.1600
Borehole collapse t140.66580.24760.5208
On-site risk T20.1852Underground pipeline failure t210.70850.10710.5000
Existing buildings deformation t220.06030.45520.1973
Surface subsidence t230.23110.43760.3027
Equipment risk T30.5016Supporting structure deformation t310.02820.27300.1131
Poor ventilation t320.26100.04760.1870
Water accumulation t330.08290.24940.1407
Lining leakage t340.10460.17100.1276
Blasting network failure t350.52330.25900.4317
Blasting risk T40.2562Borehole spacing t410.22400.17120.2057
Borehole depth t420.15490.13840.1491
Number or type of borehole t430.09350.04460.0766
Drilling equipment t440.09530.08170.0906
Blasting charge structure t450.02800.14220.0676
Discontinuous slag discharge t460.02480.08240.0448
Blast jet lag t470.06590.06780.0666
Misfire or residual blasting t480.01750.19840.0802
Poor blasting effect t490.29600.07330.2188
Table 8. Membership degree of risk factors.
Risk Levelt11t12t13t14t21t22t23t31t32t33t34t35t41t42t43t44t45t46t47t48t49
Level 10000.600000.10.1000.200.20.400000.1
Level 20000.3000.30.30.60.60.20.30.60.20.50.300000.7
Level 30.30.80.20.10.70.30.60.60.30.30.60.50.20.40.30.30.10.20.30.30.2
Level 40.60.20.700.20.60.10.1000.20.200.4000.60.50.60.40
Level 50.100.100.10.100000000000.30.30.10.30
Table 9. Prominent influence coefficients of risk factors.
Primary IndicatorT1T2T3T4
γ 3.5323.5
Secondary Indicatort11t12t13t14t21t22t23t31t32t33t34t35t41t42t43t44t45t46t47t48t49
γ 4.534.51.5343.53.522.52.52.521.5224.54.52.54.51.5
Table 10. Comparison of evaluation results of different calculation models.
Calculation ModelEvaluation ResultRisk Level
Conventional FAHP[0.0924, 0.2052, 0.2847, 0.3196, 0.0981]Level 4
This study[0.1061, 0.1883, 0.2625, 0.3001, 0.1429]Level 4
LFPP-FAHP[0.0753, 0.1698, 0.3095, 0.3497, 0.0957]Level 4
FAHP-SPA[0.1152, 0.1749, 0.2448, 0.2796, 0.1855]Level 4
Disclaimer/Publisher’s Note: The statements, opinions and data contained in all publications are solely those of the individual author(s) and contributor(s) and not of MDPI and/or the editor(s). MDPI and/or the editor(s) disclaim responsibility for any injury to people or property resulting from any ideas, methods, instructions or products referred to in the content.

