Abstract
Traffic congestion represents an urban challenge that authorities are trying to solve through various means. Current traffic management systems do not solve these challenges, which is why the research presents a new proposal for a traffic optimization system. The proposed solution integrates small-sized equipment (ESP32 equipped with accelerometers, gyroscopes, and cameras), cloud-based AI services (Azure Content Safety), and a multi-parametric analytical framework for real-time navigation. The system uses the Traffic Optimization Algorithm (TOA) proposed by the authors to calculate the Global Route Quality Indicator (GRQIk). It associates each route with a value based on which the degree of optimality is estimated. GRQIk is calculated based on the distance traveled, traffic delays, estimated travel time, road safety, and the individual’s sensitivity. Real-time data are collected using ESP32, with a pothole detection threshold set at 0.8 rad/s. Through the TomTom API, four alternative routes are identified. The performance evaluation showed that GRQIk differentiates route quality, with scores ranging from 26.40% for optimal routes to 100% for the least favorable ones. In addition, Azure’s Content Safety API achieved 100% accuracy in identifying violent incidents and accidents. The limitations of the research concern the small number of images available to test the Content Safety service. The research establishes new approaches for future developments in the field of smart transportation.
1. Introduction
Advanced traffic navigation systems are increasingly important in urban environments, where congestion presents significant mobility, safety, and environmental sustainability challenges. These systems use various technologies to solve traffic issues, including mobile crowd sensing (MCS), Internet of Things (IoT), and advanced data analytics [1].
One of the primary approaches to managing urban traffic congestion is using MCS. This technology allows for collecting real-time vehicular data using smartphones and Global Positioning System (GPS)-enabled vehicles, eliminating the need for direct vehicle-to-vehicle communication. Such a model facilitates the monitoring of traffic conditions and aids in developing dynamic traffic management strategies that adapt to changing conditions, thereby reducing congestion and improving traffic flow. The integration of MCS into traffic management systems has been shown to provide cost-effective solutions for urban traffic challenges, enabling more responsive and optimized traffic control mechanisms [2].
Real-time data analytics enable the estimation of traffic conditions on surrounding roads. By employing predictive models, traffic management systems proactively address congestion issues, thereby increasing the performance of urban transportation networks [3]. The use of big data and machine learning (ML) techniques, such as deep learning (DL), further enhances the accuracy of traffic predictions, allowing for timely interventions and improved route guidance for drivers [4,5].
The incorporation of IoT technologies into traffic management systems has also been transformative. IoT-based architectures facilitate real-time traffic updates and context-aware traffic monitoring with direct implications for urban traffic [6]. These systems integrate various data sources, including traffic signals, public transportation systems, and user-generated data, to comprehensively view traffic conditions [7,8]. Such integration improves traffic flow and supports the development of smart mobility solutions that increase the overall quality of life in urban areas [9]. An important issue is ensuring the compatibility of the input-output devices [10].
Furthermore, optimizing traffic signal systems using advanced algorithms, such as genetic algorithms, has been identified as a factor in reducing congestion during peak hours [11]. By dynamically adjusting traffic signals based on real-time traffic data, these systems decrease wait-times and improve traffic throughput [12]. Additionally, the implementation of intelligent traffic management systems (ITMS) has been shown to enhance road safety and reduce environmental impacts by minimizing fuel consumption and emissions associated with idling vehicles [13,14,15].
1.1. Optimization of Traffic Algorithms
A range of strategies have been introduced in the traffic field, utilizing sophisticated technologies like ML, dynamic programming, and the IoT to advance traffic management systems. A prominent optimization method involves implementing ML algorithms to forecast traffic trends and refine routing. For example, Ridwan et al. [16] examine the difficulties associated with deploying ML in dynamic network environments, highlighting the need for algorithms that adjust to fluctuating traffic conditions and quality of service (QoS) demands. This flexibility affects traffic scenarios, which can evolve swiftly and require immediate modifications to routing approaches. Furthermore, Yang et al. [17] emphasize the role of data science technologies in anticipating traffic congestion to create proactive traffic management systems. By harnessing real-time data, these systems deliver precise traffic information to drivers, enabling improved route selection and lessening congestion.
Dynamic programming methods also contribute to traffic optimization. Mainali et al. [18] highlight the significance of computational efficiency in route search algorithms, pointing out that algorithms such as Dijkstra and A* are frequently used to find optimal routes. These algorithms are improved through dynamic programming techniques that permit rapid route adjustments in response to evolving traffic conditions. Incorporating these algorithms within a Software-Defined Networking (SDN) framework can increase traffic management by allowing more adaptable routing decisions.
ML algorithms, especially those utilizing deep reinforcement learning (DRL), have become integrated into the traffic signal control (TSC) tools, showing notable advancements compared to conventional heuristic approaches. DRL techniques, including Q-learning and its advanced variations, enable adaptive traffic signal regulation that responds in real time to fluctuating traffic conditions, thereby alleviating congestion and overall traffic movement [19,20,21,22,23].
A significant benefit of DRL in TSC is its capacity to learn from experiences and adjust to intricate environments. For example, controllers based on learning can surpass non-learning heuristic methods by employing more sophisticated function approximators and reinforcement learning strategies. This flexibility is used in urban areas where traffic patterns are erratic due to accidents, weather changes, and special events [24,25]. Incorporating high-resolution event-based data improves the effectiveness of DRL models by supplying more precise and timely information for decision-making processes [26,27].
DRL model architectures for traffic optimization typically incorporate deep neural networks capable of automatically extracting features from raw traffic data. This functionality facilitates more accurate state representation, making informed decisions about signal timing and coordinating multiple intersections [28,29]. Recent research has delved into multi-agent reinforcement learning (MARL) frameworks, allowing multiple intersections to collaborate and share information, thereby further improving the performance of traffic signal control systems [30].
Beyond signal control, ML methods are also being utilized in numerous domains [31], including traffic flow prediction and monitoring. For instance, Filipovska and Mahmassani [32] highlight how ML addresses complex nonlinear issues in traffic flow data. Using vehicle trajectory data from connected vehicles has proven effective in forecasting short-term traffic congestion, enabling proactive traffic management strategies.
The formulation of DRL reward functions contributes to the success of traffic signal optimization. Studies show that well-crafted reward functions affect DRL agents’ learning process and results, ensuring they focus on goals such as minimizing travel time and reducing emissions [33,34]. Ongoing research into hybrid models that integrate DRL with other ML techniques continues to demonstrate potential for further improving traffic management systems [35,36,37].
A notable instance of DRL application in route planning is illustrated in the study by Liu et al. [38], where a deep Q-network (DQN) is employed for packet routing in aeronautical ad-hoc networks. This methodology facilitates offline training using historical flight data, thereby minimizing the necessity for continuous information exchange that traditional Q-routing techniques require. In the context of energy transition [39], Zheng et al. [40] introduce an energy-efficient routing technology that uses DL to enhance network performance by selecting near-optimal routing paths based on link congestion. These investigations demonstrate DRL’s ability to handle complex data inputs and make adaptive routing decisions in response to evolving conditions.
Expanding on the potential of neural networks (NNs) in route planning, Zhuang et al. [41] investigate the application of the long short-term memory (LSTM) algorithms for autonomous route generation using large datasets from ship trajectories. Their research reveals that DL decreases the complexity of route design while avoiding local optima, thereby improving the overall route planning process. Complementing this, Liao et al. [42] model routing as a Markov Decision Process and apply DQN to tackle global routing issues, highlighting DRL’s versatility across different routing scenarios.
Automated planning methods have been integrated with NN to alleviate congestion in urban settings. Chrpa et al. [43] argue that the benefits of centralized planning, which provides a comprehensive overview of vehicle locations and intentions, lead to more informed routing decisions. Supporting this, Švadlenka et al. [44] discuss the scalability of automated planning techniques in larger networks, suggesting that neural network approaches handle more intricate routing situations.
Other studies use hybrid strategies that merge NN with traditional algorithms that have shown potential in optimizing path planning. For instance, Yu et al. [45] propose a hybrid approach that combines artificial NN (ANN) with reinforcement learning for unmanned cruise ships, achieving optimal paths in dynamic environments.
The employment of DL extends beyond transportation to encompass logistics and network routing. Gao et al. [46] present a DRL-based framework for routing in cloud radio access networks, demonstrating DL’s capacity to manage complex decision-making processes in telecommunications. Eyobu et al. [47] introduce a DL-driven routing method for wireless mesh networks, presenting the adaptability of these algorithms across various network configurations. Another approach was integrating artificial intelligence (AI) tools in an algorithm for allocating a public urban transport fleet, considering the number of passengers waiting for buses and the operational efficiency of public urban transport companies [48].
The IoT has become a groundbreaking technology in traffic management, facilitating extensive data accumulation from vehicles and infrastructure. Ali et al. introduce an MCS model that leverages smartphone data and GPS-equipped vehicles to track traffic conditions and alleviate congestion [49]. This model illustrates how IoT supports real-time traffic management by offering precise and timely data for informed decision-making.
1.2. Sensor Integration in Traffic Systems
Integrating sensors into traffic systems has improved traffic management and surveillance. Multiple sensor technologies, such as wireless sensor networks (WSNs), Light Detection and Ranging (LiDAR), and weigh-in-motion (WIM) sensors, are instrumental in gathering real-time data to streamline traffic flow, enhance safety, and support emergency responses.
WSNs are particularly important in traffic management systems (TMS), which track traffic metrics like flow, density, and wait-times. These networks comprise sensor nodes that collect data from their environment and a gateway node that transmits this information to a central base station for processing and decision-making [50]. The adaptability and scalability of WSNs enable broad coverage in both urban and rural areas, making them suitable for a range of traffic scenarios [51]. The paper by Qi et al. [52] introduces issues such as optimal sensor placement, data fusion from multiple sources, and privacy concerns that must be addressed to ensure maximum effectiveness [53].
LiDAR technology has become increasingly popular in traffic systems, especially for adaptive traffic signal control. LiDAR sensors enable traffic management to adjust signal timing dynamically based on current traffic conditions, thereby improving intersection efficiency. This technology presented by Soom et al. [54] delivers precise data on vehicle counts and speeds, making informed traffic signal management decisions to be taken. Tatum et al. [55] present the incorporation of advanced algorithms and ML techniques that can further boost the predictive capabilities of traffic systems, facilitating proactive traffic management.
WIM sensors are another part of traffic monitoring technology. These sensors classify vehicles and measure their weights as they traverse a specific location, supplying valuable data for traffic analysis and road design [56]. However, Ma et al. [57] mention that the deployment of WIM sensors can be expensive and disruptive, requiring meticulous planning and implementation to reduce traffic disruptions. Furthermore, data gathered from WIM sensors can be combined with data from other sensors to provide a holistic view of traffic patterns and behaviors [58].
Chen et al. [59] analyze lane-changing behavior on highways. The research used 6506 vehicle trajectories. In the study, a method was developed that extracts the starting and ending points with a relative error of less than 4%. The average lane change time ranges from 2.88 s to 7.32 s. The research results showed that the speed varies between 18.83 m/s and 43.30 m/s. The results are influenced by factors such as the number of lanes, direction, type of vehicle, and speed limits. The study [60] proposes an innovative framework for extracting multiple ship trajectories from maritime video data. The research aims to improve naval traffic safety. The framework utilizes three stages: initial detection of ship positions, contour exploration, and trajectory tracking. Experimental results demonstrate a performance of 96.5% for F1-Score, providing crews with precise information for optimal maneuvers in maritime traffic. The technique for extracting ship trajectories can be applied to monitor the movements of pedestrians, cyclists, or other traffic participants in urban areas, providing a comprehensive perspective on traffic flow.
1.3. Simulation Tools for Traffic Studies
Numerous simulation tools have been created to examine traffic behaviors, optimize signal timings, and assess infrastructure designs. Among these, VISSIM, Simulation of Urban MObility (SUMO), and RegTraffic are particularly notable for their distinct features and applications in traffic research.
VISSIM is a highly regarded microscopic traffic simulation software that facilitates a detailed representation of traffic flow and interactions at intersections. It has been utilized in various studies to assess infrastructure design solutions aimed at reducing congestion. For example, Fabianova et al. [61] underline the effectiveness of a novel intersection model using VISSIM, demonstrating its capability to convert field data into practical insights for urban planners. The software’s stochastic microscopic simulation features allow it to replicate complex traffic operations, making it an invaluable tool for analyzing and enhancing urban traffic dynamics [62]. Additionally, VISSIM’s compatibility with other technologies, such as vehicle-to-everything (V2X) communication, boosts its functionality in developing intelligent urban traffic systems [63].
SUMO has been employed in numerous studies to develop microscopic simulation models that mirror real-world traffic conditions. For instance, Grigoropoulos et al. [64] used SUMO to evaluate bicycle highways in urban environments, illustrating its ability to model multiple transportation modes within a single platform. Integrating automated planning techniques into SUMO has proven effective in centralizing traffic routing, thereby enhancing traffic management in city areas [65]. SUMO’s capacity to incorporate real-time data further improves its performance in simulating dynamic traffic scenarios.
RegTraffic is a regression-based traffic simulator that addresses certain limitations of traditional simulation tools by incorporating spatiotemporal traffic modeling. Mostafi et al. emphasized its practical uses in traffic analysis, including measuring traffic flow and simulating congestion [66]. This simulator’s ability to model traffic congestion based on interactions between neighboring road links represents a significant progression in traffic simulation methods. Regression techniques allow RegTraffic to deliver more precise predictions of traffic behavior, especially in heterogeneous road networks where real-time data might be limited.
1.4. Paper Contributions
The literature review analysis shows gaps concerning integrating all parameters, such as travel distance, traffic delays, estimated travel time, road safety, and road sensitivity, in selecting the best path to maximize traffic in urban areas.
The main contributions of the paper are mentioned below:
- Introduces Traffic Optimization Algorithm (TOA) that computes the Global Route Quality Indicator (GRQIk), integrating multiple parameters such as travel distance, traffic delays, estimated travel time, road safety, and road sensitivity for optimal route evaluation;
- The system employs ESP32-based sensors, including the MPU 6050 gyroscopes and accelerometers, for real-time detection of road anomalies such as potholes;
- Azure’s Safety Content is employed for real-time hazard detection, enabling classification and reporting of traffic-related incidents, such as accidents and violent events, to improve route selection dynamically;
- Demonstrates the effectiveness of IoT devices for collecting accurate, real-time traffic and road condition data with validated thresholds (e.g., 0.8 rad/s for pothole detection);
- The system allows a holistic assessment of route quality, balancing efficiency, safety, and road conditions by combining diverse metrics into the GRQIk;
- The study thoroughly evaluates the system, including GRQIk performance across extreme scenarios, precision and recall of Azure’s Content Safety Application Programming Interface (API), and practical examples of TOA application in real-world routing.
These contributions collectively advance the field of intelligent traffic management by offering an adaptive solution for improving urban mobility.
The paper is organized into five sections. Section 2 presents the methodology, outlining the system architecture, including IoT integration, the TOA, and GRQIk calculation. The results are presented in Section 3 and focus on the evaluation of GRQIk, pothole detection accuracy, and Azure’s Content Safety API. The discussion from Section 4 explores the implications, limitations, and recommendations for future research. Finally, Section 5 describes the conclusions, summarizes the findings, and emphasizes the study’s contributions to intelligent traffic management.
2. Materials and Methods
In this study, we developed an innovative route optimization system that integrates multiple technologies to select the optimal path from a set of alternatives based on distance, average travel time adjusted for congestion, road safety concerning potholes, and road sensitivity incidents. The foundation of our system leverages TomTom’s routing API [67] to gather comprehensive route data, including distance, estimated travel time, and traffic conditions. To enhance real-time road safety assessment, we employed an ESP32 microcontroller equipped with an MPU-6050 accelerometer and gyroscope sensor, alongside a GPS module, to detect and log potholes by identifying sudden variations in vehicle movement.
To further enhance the system’s responsiveness to traffic incidents, such as accidents or violent events, we integrated an ESP32-CAM module. This module continuously captures images of the traffic environment, which are then processed using Azure’s Cognitive Services. Specifically, Azure’s Content Safety feature was employed to automatically identify and classify incidents involving violence or accidents. The dataset used to test the efficacy of Azure’s Content Safety consists of 300 images gathered from the internet that cannot be made available to the public through a reference due to the impossibility of obtaining the copyright from all its authors and the lack of a database with these type of images that can be cited. Upon detection, these incidents are reported in real time, ensuring that users receive up-to-date information on potential hazards along their routes.
The software development was conducted using Microsoft Visual Studio with C#, providing an environment for building the application’s backend and user interface. Visual Studio facilitated seamless integration with Structured Query Language (SQL) Server, which was used to store and manage data collected from the ESP32 devices. SQL Server ensured the handling of large datasets, including real-time pothole reports and traffic incidents. The Arduino IDE programmed the ESP32 microcontroller, enabling precise control over sensor data acquisition and real-time GPS tracking. This setup allowed the system to capture accurate location data and detect potholes effectively.
The integration of these components results in a comprehensive route optimization tool that considers traditional metrics like distance and travel time and dynamically responds to real-time road conditions and safety concerns. By combining SQL Server for data management, Visual Studio with C# for application development, Arduino IDE for microcontroller programming, and Azure’s AI capabilities for incident detection, our system provides a solution for optimal route selection.
2.1. Data Collection, Integration and Processing
The process begins with users reporting their desired destinations by specifying waypoints using precise latitude and longitude coordinates. By allowing users to input geographical coordinates, the system ensures high accuracy in route planning and accommodates diverse starting points and destinations across various regions.
To obtain alternative routes between the specified waypoints, we utilized TomTom’s routing API, which provides comprehensive data for route optimization. The API was configured to handle the latitude and longitude coordinates provided by users, ensuring that the generated routes accurately reflect the intended travel paths.
The API requests were meticulously formatted to include the latitude and longitude coordinates of the user-specified waypoints. This precise formatting allows the API to accurately interpret the desired start and end points and intermediate waypoints. Additionally, traffic data were enabled by setting the appropriate parameters within the API call, allowing the system to factor in real-time traffic conditions when generating route alternatives.
Each API request was constructed to include up to three alternative routes for each set of waypoints. This multiplicity of options allows users to choose the most suitable route based on their preferences and current road conditions. Including traffic information ensures that the estimated travel times are adjusted dynamically to reflect congestion levels, thereby enhancing the route suggestions.
Figure 1 presents the overall diagram of GRQIk. The user provides the geographical points. For each alternative route generated by the TomTom API concerning the geographical points provided by the user, a wealth of data was retrieved to facilitate comprehensive route analysis. The primary data points include:
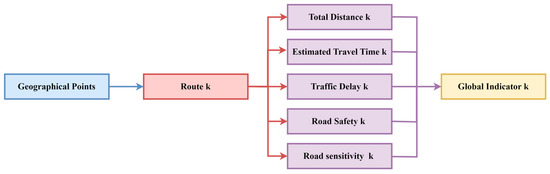
Figure 1.
GRQIk diagram.
- Geographical Points (GP) comprise a detailed list of latitude and longitude coordinates defining the route’s path provided. These points are for mapping the road and performing further spatial analysis, such as assessing proximity to potholes or other hazards;
- Total Distance (TDik) for route k provides users with an understanding of the length of each proposed route, allowing for comparisons based on distance alone;
- Estimated Travel (ETk) Time for route k estimates the distance and current traffic conditions, offering a realistic projection of how long the journey is expected to take;
- Traffic Delay (TDek) for route k quantifies the additional time incurred due to traffic congestion, providing insight into the impact of traffic on overall travel time;
- Road Safety (RSak) for route k evaluates the safety by analyzing factors such as accident reports and traffic incidents. It assesses the likelihood of encountering hazardous conditions, ensuring that the chosen route minimizes risks and enhances traveler safety;
- Road Sensitivity (RSek) for route k refers to the condition and quality of the road surface along the route, specifically focusing on the presence of potholes. This component maps pothole locations using precise latitude and longitude coordinates collected from the ESP32-MPU6050 sensor. By analyzing the density and distribution of these potholes, Road Sensitivity evaluates how the road’s physical state may impact driving comfort and vehicle safety. Routes with lower pothole densities are preferred to ensure a smoother and safer driving experience.
The GRQIk is calculated for route k using Equation (1). It incorporates TDik, ETk, TDek, RSak, and RSek to compare the value between routes, helping users assess the best one.
TomTom is a leading global provider of navigation and mapping products, offering a wide range of services that cater to both consumer and enterprise markets. The TomTom Routing API supports calculating multiple alternative routes. By incorporating real-time traffic information, the API dynamically adjusts estimated travel times and delays, enhancing route suggestions’ accuracy.
In this study, the TomTom Routing API was instrumental in obtaining alternative routes between user-specified waypoints. The system could assess and compare multiple route options by leveraging the API’s ability to deliver detailed route metrics and real-time traffic data. The API request was constructed to retrieve the three alternative routes [68]. The TomTom request provided the TDik, ETk, and TDek parameters.
2.2. Global Route Quality Indicator Calculation
The GRQIk for a specific route k is calculated using an advanced and multifaceted mathematical formula. The Equation (1) integrates five parameters: TDik, ETk, TDek, RSak, and RSek. The objective is to synthesize these parameters into a unique metric that ranges from 1 to 100, where 1 signifies the least favorable route, and 100 represents the most optimal one. The complexity of the formula ensures that each parameter is weighted and transformed appropriately to reflect its impact on overall route quality accurately.
The GRQIk is proposed as a unified metric that integrates multiple parameters into a single value ranging from 1 to 100. This integration is grounded in multi-criteria decision analysis (MCDA), where each parameter is weighted based on its relative importance to balance competing objectives such as efficiency, safety, and road conditions.
The GRQIk formula employs advanced mathematical transformations to capture the relationships between parameters. Normalization ensures that parameters with different scales contribute in proportion to their values. Nonlinear functions (e.g., logarithmic, exponential) emphasize critical factors such as delays or hazards. A sigmoid function is applied to bind the aggregated score within a user-friendly range (0–1). The value is then scaled to 1–100 for ease of interpretation.
A systematic and iterative approach was employed to derive the final formula of GRQIk. An equal-weight evaluation was initially used for each parameter, and this variant was tested on a controlled dataset. This dataset included a known correlation between inputs and outputs. The dataset included diverse scenarios, such as routes with heavy traffic, roads with significant bumps, and areas with a high frequency of traffic incidents. This initial exercise aimed to validate the basic concept of integrating multiple parameters into a single indicator.
During the tests, it was observed that equal weights did not adequately reflect the relative importance of each parameter in evaluating route quality. For example, traffic delays (TDek) and road safety (RSak) had a greater impact on user experience than total distance (TDik). As a result, the weights were adjusted through a series of iterative experiments. Thus, different combinations were tested, and the results were evaluated in comparison with human feedback and the system’s performance in real-world scenarios.
Subsequent adjustments included the application of mathematical transformations (such as logarithmic, exponential, and sigmoidal) to capture nonlinear relationships between parameters and route quality. These transformations were validated using the same controlled dataset. The calculated values of GRQIk were compared with the qualitative scores manually assigned by experts for the same routes. The sigmoid function, for example, was introduced to normalize the scores that reflect human perception of route quality.
Completing the GRQIk formula also involved consulting the specialized literature and adapting standard techniques in multi-criteria optimization and machine learning. It borrowed principles from MCDA to establish the final weights and statistical modeling to apply appropriate transformations to the raw data. The result of this iterative process is presented by Equation (1).
where:
RSak—is the number of incidents normalized to 10. If the value exceeds 10, then the parameter contribution is set to 1 as the most dangerous measure;
RSek—the number of potholes normalized to 100. If the value exceeds 100, the parameter contribution is set to 1, as the worst road could not exist;
Nk—a normalized value based on ETk and TDek calculated using Sk from Equation (2). It employs a logistic function (sigmoid curve) to transform the Sk score into a normalized value between 0 and 1. The sigmoid function is often used when converting a potentially broad range of input values into a bounded output that smoothly transitions between two extremes;
—suggests that higher values of Sk (where expected times are much less than the delay times) will result in a higher Nk, indicating a worse performance or higher impact. Conversely, when Sk is negative (expected times exceed delay), Nk decreases, suggesting better performance or lower impact.
Equation (1) combines all five parameters with nonlinear transformations and weighted aggregations. By applying logarithmic, square root, inverse tangent, quadratic, and exponential functions, the formula captures the impacts of each parameter on the overall route quality. The sigmoid function ensures the aggregation scales appropriately, while the normalization factor balances the positive and negative influences. The final multiplication by 100 scales the indicator to a user-friendly range, facilitating comparison across different routes.
The GRQIk formula incorporates several advanced mathematical concepts prevalent in various fields, including ML, statistical modeling, and multi-criteria decision-making. These foundational elements include:
- The sigmoid function is inspired by logistic regression models commonly used in ML for binary classification tasks. The sigmoid function normalizes the aggregated score to a range between 0 and 1, ensuring that the final indicator remains bounded;
- The weighted aggregation principle of assigning weights to various parameters reflects MCDA techniques. In MCDA, each criterion is weighted according to its relative importance, allowing for a balanced integration of multiple factors into a single evaluative metric;
- Nonlinear transformations incorporating logarithmic, square root, inverse tangent, quadratic, and exponential transformations allow the formula to capture complex relationships between the parameters and the overall route quality. These transformations are reminiscent of feature engineering processes in statistical modeling, where raw data are transformed to enhance model performance;
- The normalization factor ensures that the positive aspects are appropriately balanced against the negative influences. This approach is similar to normalization techniques used in data preprocessing to ensure that different features contribute proportionately to the outcome.
While inspired by existing mathematical frameworks and techniques, the GRQIk formula is uniquely composed to address the specific route optimization requirements. Its design accommodates the integration of diverse parameters, each contributing differently to the overall quality assessment. The formula’s complexity allows it to capture the multifaceted nature of route quality, balancing efficiency, safety, and road conditions in a single, comprehensive metric.
2.3. Azure’s Content Safety and Pothole Integration
Azure’s Content Safety is used as an Azure Detection Safety Component (ADSC) service in our route optimization system, and it provides RSak by automatically identifying and reporting traffic incidents. The ADSC analyzes images to identify and classify content that may be deemed sensitive or require moderation. This includes detecting violent scenes, accidents, and other distressing events. By leveraging advanced ML algorithms, the service accurately discerns various types of sensitive content, providing actionable insights for real-time incident reporting.
The flowchart presented in Figure 2 contains the operational workflow for ADSC and the Pothole Procedure Component (PP). It outlines the process for detecting road hazards, such as potholes, accidents, and violence, using an ESP32-CAM module (manufactured by Espressif Systems Co., Ltd., Shanghai, China) and an MPU-6050 gyroscope (produced by TDK InvenSense, Shenzhen, China). Potholes are identified through the MPU-6050 gyroscope, which measures angular velocity along the Z-axis. When the difference between consecutive readings exceeds a predefined threshold (e.g., 0.8 rad/s), it indicates a road irregularity, and the system logs the event as a pothole in the “UserTrafficReport” table, including GPS coordinates and timestamps. The pothole identification system is based on variations between the positions of the device at two consecutive points. A pothole is identified at the corresponding geographical coordinates if the variation exceeds an empirically imposed threshold.

Figure 2.
Workflow of the real-time incident detection.
Simultaneously, the ESP32_CAM captures images of the detected hazard, which are also considered traffic anomalies. These events are analyzed using the ADSC algorithm to identify additional incidents, such as accidents or traffic violence. ADSC utilizes Azure Cognitive Services to classify sensitive content, including accidents and violent scenes, providing actionable insights for real-time incident reporting and response.
Figure 2 presents the PP and ADSC procedures involved in real-time incident reporting to the database. These procedures do not modify the users’ trajectory. The values stored in the database with these procedures influence the future computed trajectories.
The captured images are transmitted in real time from the ESP32-CAM to the cloud infrastructure using Wi-Fi connectivity. Upon receipt, each image is processed by the ADSC service. The service evaluates the image for indicators of sensitive content, violent incidents, and accidents. The service returns a set of labels and confidence scores indicating the presence and likelihood of various sensitive content types within the image.
Simultaneously, the MPU-6050 sensor monitors vehicle motion and detects significant variations that indicate the presence of potholes. These abrupt changes in the gyroscope enable accurate identification and logging of pothole locations, enhancing the system’s real-time ability to assess road conditions.
Figure 3 illustrates the custom-designed assembly for recording traffic events. It comprises an ESP32-CAM module manufactured by Espressif Systems in Shanghai, China, and an MPU-6050 sensor produced by InvenSense, a subsidiary of TDK, in Tokyo, Japan. These components work in tandem to capture and process real-time traffic incidents. The assembly is algorithmically managed using the Arduino IDE, enabling data acquisition.
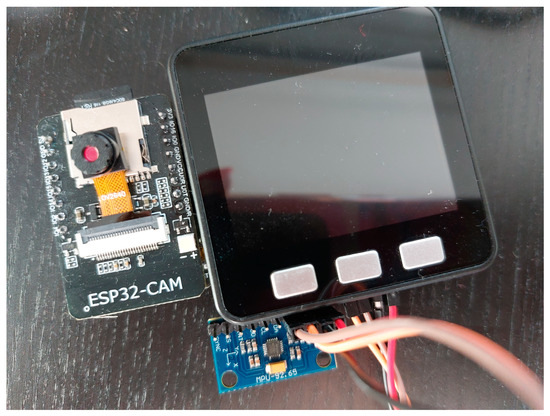
Figure 3.
Custom-designed assembly for event recording using ESP32-CAM and MPU-6050.
The incident reporting block identifies an incident with a confidence score exceeding a predefined threshold and is classified as a confirmed event. An entry is automatically created in the Azure SQL Server database within the UserTrafficReport table for each confirmed incident. This entry includes:
- Latitude and longitude. Precise geographical coordinates where the incident was detected;
- Event type. Classification of the incident, such as “Pothole” or “Incident,” based on the detected content;
- Timestamp. The exact time when the incident was recorded.
By integrating ADSC service with ESP32-CAM image acquisition, the system achieves a mechanism for real-time traffic incident detection and reporting. This integration enhances route safety by providing timely information on road hazards and accidents and ensures that users make informed decisions based on the accurate data available. The seamless interaction between image capture, cloud processing, and database logging exemplifies the effectiveness of combining edge computing with cloud-based AI services to address complex real-world challenges.
After calculating the alternative routes, the system identifies coordinates within the database within 50 m of each route. This proximity check ensures that only exceptional road conditions, such as potholes or accidents, are considered in the quality assessment. If a coordinate falls within the 50-m range of a route, its data are incorporated into the calculation of the GRQIk.
This methodology ensures that routes with fewer nearby incidents receive higher quality scores.
2.4. The Traffic Optimization Algorithm
TOA is designed to calculate the GRQIk by integrating multiple data sources. This procedure ensures users receive the most optimal and safe routes based on the analyzed parameters.
The TOA uses the following procedure depicted in Figure 4:
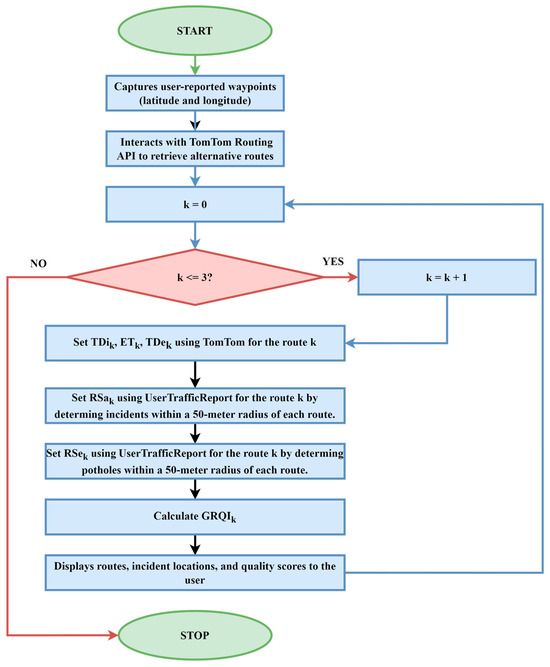
Figure 4.
Logical schema of the TOA for calculating the GRQIk.
- Users initiate the route optimization process by specifying their desired destinations through latitude and longitude coordinates. These waypoints define the journey’s start, end, and intermediate stops. The reported waypoints are stored in the system for subsequent processing and route calculation;
- The TOA constructs API requests using the user-specified waypoints, ensuring that the requests include parameters for real-time traffic data and a maximum of three alternative routes. TomTom’s Routing API responds with detailed information for each alternative route, including TDik, ETk, TDek, and a sequence of geographical points defining the route path;
- For each alternative route, the TOA calculates the proximity of recorded incidents by determining if any reported coordinates fall within a 50-m radius of the route’s geographical points. Incidents within this proximity are factored into the RSak and RSek parameters. The higher the number of proximate incidents, the lower the contribution of RSak and RSek to the overall GRQIk score;
- The SOA integrates the five key parameters (TDik, ETk, TDek, RSak, and RSek) using the GRQIk formula. Equation (1) normalizes the combined parameters to produce a GRQIk score ranging from 1 (poorest quality) to 100 (optimal quality), enabling users to compare and select the best route;
- The system presents the alternative routes on an interactive map within the application’s graphical user interface (GUI), highlighting areas with high incident densities. Each route is accompanied by its respective GRQIk score and detailed metrics. Users compare the routes based on these metrics and select the most suitable option for their journey.
In Figure 4, the parameter k represents the index of alternative routes generated by the TomTom Routing API. These routes are ranked in ascending order of estimated travel time, with lower values of k corresponding to shorter time routes, while higher values indicate progressively longer paths. The TOA evaluated four route alternatives. Practical and computational considerations drive the decision to limit the analysis to four. Users typically prefer routes with shorter travel times, as these are more practical and align with their preferences. Including routes beyond four would introduce alternatives with significantly longer durations, which are unlikely to be chosen and may unnecessarily increase computational effort.
The TOA employs a multifaceted approach to compute the GRQIk, integrating user inputs, real-time sensor data, advanced image analysis, and route metrics.
3. Results
This section explores the analysis of extremes for GRQIk, outlining examples of ADSC’s sensitive content detection, presents the PP prototype with usage examples, and concludes with a detailed study case of the TOA algorithm, highlighting its performance in identifying optimal routes using cutting-edge technologies and unique device capabilities.
3.1. Analyzing Extremes in GRQIk
In the pursuit of increasing transportation efficiency and safety, the analysis of GRQIk focuses on understanding the extreme values and assessing how different factors influence the perceived quality and viability of routes under varying conditions. By examining scenarios that represent the upper and lower bounds of the GRQI scale, we gain valuable insights into the thresholds that define optimal and suboptimal route conditions.
The GRQIk calculation integrates multiple dimensions of route analysis into a single, unified metric. This metric quantifies a route’s quality and highlights each contributing factor’s impact. By exploring the extremes of GRQIk, we identify critical thresholds beyond which the route quality is significantly compromised or, conversely, where it meets the criteria for excellence.
Table 1 presents the computed values of the GRQIk under two distinct extreme scenarios. Each scenario demonstrates the impact of travel times, delays, and road conditions on the overall assessment of route quality.

Table 1.
Calculated GRQIk for the extreme scenarios.
The first scenario represents a highly undesirable route. Poor safety, extremely hazardous road conditions, and a significant delay over a relatively long distance lead to a high GRQIk of 100. This result aligns with the interpretation that a higher GRQIk indicates a route that should be avoided due to its combination of dangers and inefficiencies.
In contrast, the second scenario reflects an ideal route. Excellent safety, road conditions, and no delays result in a low GRQIk of 0. This score indicates a highly recommended route that offers efficient travel with minimal risks or hazards.
These scenarios illustrate the GRQIk formula’s ability to quantify a route’s desirability. A higher GRQIk highlights routes with significant issues, whereas a lower GRQIk emphasizes safe, efficient, and well-maintained options. This system supports route planning and optimization decision-making by ranking routes based on quality and risk.
Figure 5a–d illustrate the evolution of the GRQIk as a function of four key parameters: ETk, RSak, RSek, and TDek, with all other parameters held constant.
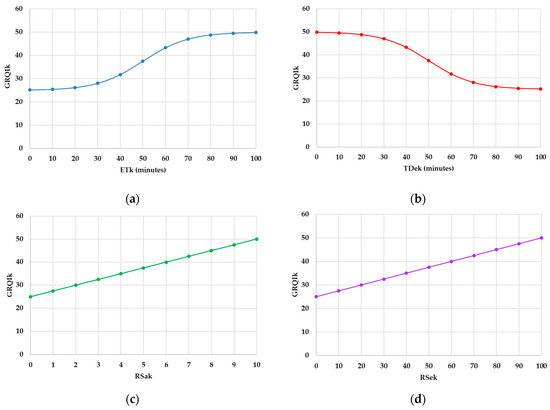
Figure 5.
GRQIk variation with increasing: (a) travel time; (b) road safety; (c) road quality; (d) traffic delays.
Each graph demonstrates a distinct relationship between GRQIk and the respective parameters, highlighting the impact of individual factors on route quality. TDik is not analyzed as it is used for parameter normalization and does not directly influence road quality.
For Figure 5a, the parameters were set as RSak = 5, RSek = 50, TDik = 10, and TDek = 50. This figure shows a declining trend in GRQIk as ETk increases. As travel time increases, the route quality deteriorates, reflecting the adverse impact of inefficiency and prolonged journeys on overall quality assessment.
In the case of Figure 5b, the parameters were kept constant: RSek = 50, TDik = 10, ETk = 50, and TDek = 50. This graph displays a linear rise in GRQIk as RSak improves. This suggests that enhancing road safety (e.g., reducing accidents or implementing better safety protocols) influences route quality positively, emphasizing safety’s importance in determining route desirability.
For Figure 5c, the parameters were set as RSak = 5, TDik = 10, ETk = 50, and TDek = 50. This figure underscores a linear increase in GRQIk with RSek. Improved road conditions (e.g., fewer potholes or smoother surfaces) significantly enhance route quality, underscoring the critical role of road infrastructure in GRQIk calculations.
Finally, for Figure 5d, the parameters were set as RSak = 5, RSek = 50, TDik = 10, and ETk = 50. This figure demonstrates a decreasing trend in GRQIk as TDek increases. Longer delays substantially reduce route quality, highlighting the inefficiency caused by congestion or other disruptions and their negative impact on route desirability.
These graphs collectively illustrate the dynamic nature of GRQIk. When improved, parameters like road safety and condition increase route quality, while factors like increased travel time and delays diminish it.
3.2. Azure Content Safety Evaluation in Advanced Traffic Navigation System
This subsection details the evaluation of image content safety using Azure’s Content Safety service, focusing on three critical categories such as self-harm, sexual assault, and violence. The assessment includes a confusion matrix for each category and calculates performance metrics to determine the effectiveness of the implemented solution.
A dataset comprising 300 real-life images was employed to test the efficacy of Azure’s Content Safety API within traffic navigation. The dataset was evenly distributed across three categories:
- Self-harm: 100 images;
- Sexual assault: 100 images;
- Violence: 100 images.
Each image was analyzed to determine its classification into the above categories. The API provides a binary classification (TRUE or FALSE) indicating the presence or absence of content for each category. Confusion matrices and performance metrics (Accuracy, Precision, Recall, and F1-Score), presented in Table 2, were constructed for each category to evaluate the classification performance based on the API’s predictions versus the expected outcomes.
Table 2.
Performance metrics.
The self-harm model demonstrates high precision (100%), indicating that it is always correct when predicting an image containing self-harm content. However, the recall is moderate (71.4%), suggesting that 28.6% of actual self-harm images were not detected. This imbalance implies that while false positives are non-existent, false negatives are a concern, potentially allowing some inappropriate content to bypass the safety filters.
The sexual assault model performs well in identifying sexual assault content, with a precision of 75% and a recall of 50%. The relatively high precision minimizes the occurrence of false positives, while the recall indicates a reasonable detection rate, though there is room for improvement to reduce missed detections.
The lowest performance metrics are observed in the violence category, with a precision of 100% and a recall of 37.5%. This indicates a significant number of false negatives where violent content is not detected, posing a risk in scenarios where safety is critical. Additionally, the 100% precision suggests that a violent prediction may be incorrect, leading to potential disruptions in system performance due to false alarms.
While Azure’s Content Safety API demonstrates strong precision in detecting self-harm and violence, the varying recall rates across categories indicate a need for further optimization.
3.3. PP Prototype
The Road Sensitivity (RSek) prototype aims to identify potholes using real-time data from the gyroscope sensor integrated into the MPU-6050 module. The gyroscope captures angular velocity changes, providing insights into abrupt vertical displacements indicative of a pothole. This analysis ensures timely detection and reporting of road irregularities to enhance route safety and comfort.
Potholes are identified by analyzing gyroscopic values, particularly abrupt variations in angular velocity across the Z-axe. These values are monitored and processed using threshold-based algorithms. The thresholds are set to capture sudden spikes typical of vertical oscillations caused by potholes. Based on experimental and field tests, a threshold of 0.8 rad/s is flagged as a potential pothole encounter. After exceeding the threshold, a record with the latitude and longitudinal coordination of the identified event is added to the database.
Figure 6 illustrates the temporal variations in the gyroscopic Z-axis angular velocity as a vehicle encounters a pothole over 100 s. Initially, the gyroscopic readings are relatively constant, reflecting the vehicle’s steady movement on a smooth road surface.
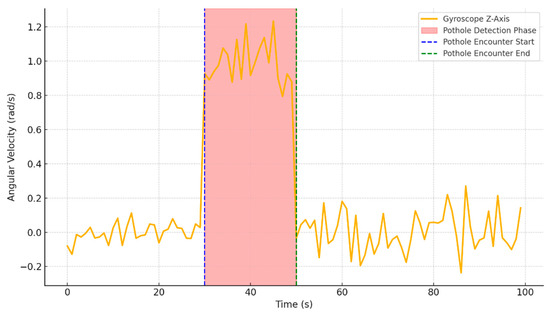
Figure 6.
Gyroscope Z-axis behavior during pothole detection.
After 30 s, a sharp spike in angular velocity is observed, marking the moment the vehicle interacts with the pothole. This abrupt variation exceeds the defined threshold (approximately 1 rad/s), confirming the presence of a road anomaly. The gyroscopic readings gradually stabilize as the vehicle resumes normal motion on a smoother road.
3.4. Case Study for TOA
The analysis focuses on four alternative routes generated using the TomTom service, based on the specified coordinates: (44.92599019228926 North Latitude and 26.02940758681691 East Longitude), (44.92498748173771 North Latitude and 25.994731989529296 East Longitude), (44.94394486315496 North Latitude and 26.019451227199674 East Longitude), and (44.92599019228926 North Latitude and 26.02940758681691 East Longitude).
Figure 7 presents the alternative route 1. This route is relatively short (11.129 km) with no traffic delays. Moderate road safety and road sensitivity contribute to the 31.46%. The black squares in Figure 7, Figure 8, Figure 9 and Figure 10 indicate events such as potholes or unpleasant incidents.
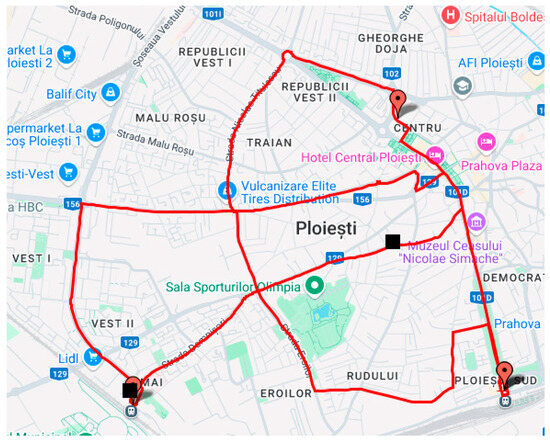
Figure 7.
TOA for route 1.
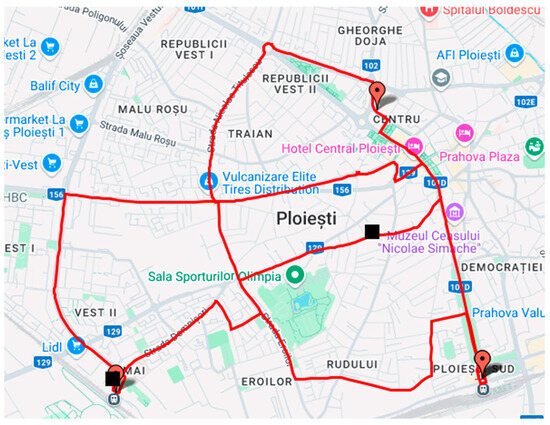
Figure 8.
TOA for route 2.
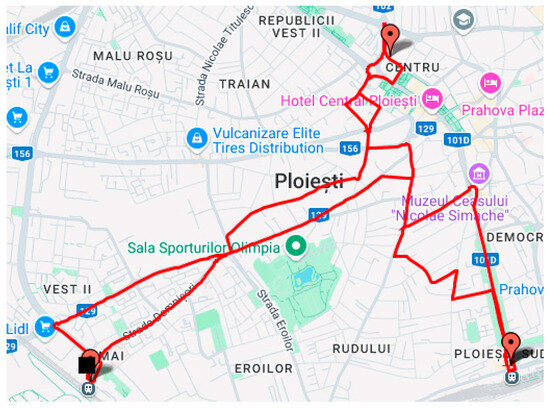
Figure 9.
TOA for route 3.
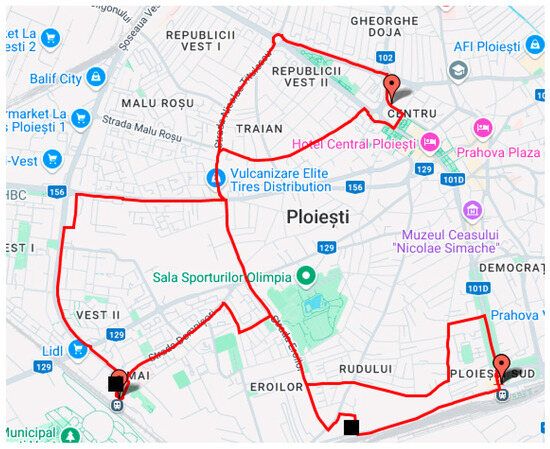
Figure 10.
TOA for route 4.
Route 2 (Figure 8) achieves the highest GRQIk as the worst-ranked route due to its poor road safety conditions and moderate travel time (34.33 min). Despite slightly poorer road sensitivity, its minimal traffic delay and efficient travel distance (11.324 km) conduct 34.04% for the GRQIk.
Route 3 (Figure 9) features a longer distance (13.083 km) and higher traffic delay, as depicted in Figure 10. The combination of moderate safety and road conditions lowers its overall ranking. This route is acceptable but less optimal compared to Route 4, having a GRQIk of 29.44%.
Figure 10 presents the best result, with 26.40% for the GRQIk. Route 4 has the longest distance (16.473 km) and the highest traffic delay. Its high safety and average road conditions make it the best alternative.
The TOA algorithm effectively provides the optimal route by leveraging advanced technologies and unique device capabilities. Its precision and ability to balance travel efficiency, safety, and road conditions underscore its uniqueness, setting a benchmark for intelligent routing solutions in modern navigation systems.
4. Discussion
The results of our study underscore the integration of advanced sensor technologies and AI for optimizing traffic navigation. By employing the TOA with a multi-parameter approach, we demonstrated its ability to dynamically assess route quality through the GRQIk. This approach incorporates travel distance, traffic delays, road safety, and road sensitivity to deliver adaptive navigation solutions. The combination of real-time data collection using ESP32-based sensors and Azure’s Content Safety for incident detection further enhanced the responsiveness of our system.
Anomaly detection refers to identifying unexpected traffic levels, detecting previously unreported potholes in areas, and the obstacles encountered by drivers in traffic. For identification purposes, the ESP32 system is used in conjunction with sensors, including an accelerometer, gyroscope, and camera. The TOA algorithm processes data in real time, meaning that it is added to the database, and future routes will refer to these updates. The Azure Content Safety API identifies scenes of violence, blood, and other content that should not be part of regular traffic. One of the contributions of this research is the TOA’s ability to generate routes by detecting anomalies, hazards, and violent events in urban traffic. The results show that pothole detection was achieved using the ESP32 microcontroller with a high accuracy rate in identifying obstacles. Azure Content Safety detects accidents and other potential hazards on the road, enabling route optimization. The detection of violent events is experimentally validated with 100% accuracy. This value indicates the potential of the technology to ensure urban safety. The authors emphasize that only the data acquisition component is in real time and that the TOA algorithm does not adjust the routes of drivers already in traffic in real time. Future research will also enable real-time updates for drivers already in traffic, for whom a possible route was previously generated, with the aim that they have already begun their journey.
In TOA, the algorithm utilized for image-based incident detection is Azure Content Safety. It operates as part of the broader Azure Cognitive Services suite. This choice was driven by several key factors that distinguish Azure Content Safety from the multitude of algorithms proposed in the literature. Azure Content Safety was selected due to its advanced ML capabilities, which are specifically designed to identify and classify sensitive content within images. This includes detecting violent scenes, accidents, and other distressing events that could pose risks to road safety. The algorithm leverages DL models trained on extensive datasets. Azure Content Safety automatically flags hazardous content, making it an ideal choice for real-time incident reporting in urban traffic management systems. The decision to use Azure Content Safety over other algorithms, such as traditional object detection models like You Only Look Once (YOLO), Faster Region-Based Convolutional Neural Network (R-CNN), or Single Shot Detector (SSD), was motivated by its superior adaptability and ease of integration. Azure Content Safety offers a streamlined solution that minimizes complexities compared to traditional solutions.
Our findings indicate that the GRQIk is a metric for quantifying route quality, enabling clear distinctions between optimal and suboptimal routes. The analysis of extremes revealed how factors such as traffic congestion, road conditions, and safety incidents influence navigation decisions. The system prioritizes user safety and time efficiency by integrating deep reinforcement learning with data-driven insights from IoT sensors. The evaluation of Azure’s Content Safety API demonstrated its capability to identify and classify sensitive traffic-related incidents.
Making a relevant comparison between the TOA algorithm and other algorithms in the literature is difficult because no other research integrates the same parameters. By calculating the global indicator GRQIk, this innovative approach offers a holistic perspective on urban traffic optimization. This makes this paper stand out due to its high degree of innovation. To support this claim, a Web of Science search was conducted using the query TS = ((“Traffic Optimization” OR “Route Optimization” OR “Urban Traffic”) AND (“IoT Sensors” OR “Internet of Things” OR “Sensors”) AND (“Road Quality” AND “Accident Detection” AND “Road Safety”)), which yielded no results.
The implications of this work extend to urban mobility and intelligent transportation systems. Our approach provides a scalable solution to mitigate congestion, improve travel safety, and reduce environmental impact through optimized traffic flow. The system also demonstrates the feasibility of combining edge computing and cloud-based AI to address complex real-world navigation challenges. Furthermore, the TOA’s modular design allows for integrating additional parameters, such as weather conditions or user preferences, thus broadening its applicability.
Despite its promising results, the system has some limitations. First, relying on the TomTom Routing API and Azure services introduces potential dependency issues, particularly regarding data availability and service disruptions [69]. Second, while the GRQIk captures multiple dimensions of route quality, some aspects, such as pedestrian traffic or real-time construction updates, are not accounted for. Finally, deploying IoT sensors on a large scale may pose logistical and financial challenges, particularly in resource-constrained regions.
Future research should focus on extending the system’s capabilities by incorporating additional data sources, such as real-time weather updates and user-generated feedback. Further GRQIk development could include adaptive parameter weighting based on user preferences or contextual factors. Expanding the dataset for training and testing Azure’s Content Safety API will improve its accuracy across various scenarios.
By addressing these limitations and recommendations, the proposed system has the potential to set a new benchmark in intelligent traffic navigation and urban mobility solutions.
5. Conclusions
This study addresses the need for intelligent traffic management systems by proposing a novel approach integrating IoT sensors, cloud-based AI, and advanced algorithms for route optimization and hazard detection. The primary objectives were to develop a TOA capable of evaluating global route quality using a unified indicator. The application must implement real-time hazard detection using Azure Content Safety and ESP32 sensors.
The main contributions of this research include:
- GRQIk was introduced as a multi-parameter metric for assessing route quality based on distance, delays, road safety, and sensitivity. This holistic approach provides a unified evaluation of urban routes, surpassing traditional single-parameter methods;
- Integration of IoT sensors and AI-driven tools for identifying hazards such as potholes, accidents, and violence in real time. The system achieved 100% precision in detecting specific incidents;
- The TOA is designed to adapt to varying traffic conditions specific to smart city infrastructure.
The TOA demonstrated its efficacy through the GRQIk, a metric that consolidates travel distance, traffic delays, road safety, and road sensitivity into a single value ranging from 1 to 100. Test results revealed variations across extreme cases, with GRQIk values ranging from 0% for the most optimal route to 100% for the least favorable one. These findings confirmed the system’s ability to accurately quantify route quality and prioritize safe travel paths.
The pothole detection threshold for the MPU-6050 gyroscope sensor was validated experimentally, with the threshold set at 0.8 rad/s. This value ensured the reliable identification of abrupt angular velocity variations indicative of road anomalies. Similarly, the evaluation of Azure’s Content Safety API yielded high precision (100%) across categories such as self-harm and violence detection. Still, it highlighted moderate recall rates, suggesting room for improvement in identifying certain sensitive content.
The research process successfully combined cutting-edge technologies, such as IoT devices and cloud-based AI, to address the complex challenges of real-time traffic management. From data collection and sensor integration to developing the GRQIk formula, this step-by-step methodology ensured a holistic approach to system design and validation. Challenges encountered during the study, such as dependency on external APIs and data sparsity in some testing scenarios, provided insights for system refinement and future scalability.
This study contributes to intelligent traffic management by introducing a comprehensive framework that integrates real-time data analytics, sensor technologies, and AI-driven decision-making. With its ability to account for multiple parameters in route optimization, the novel GRQIk formula sets a foundation for further exploration and enhancement in traffic navigation systems. Additionally, incorporating Azure’s Content Safety API for hazard detection represents a significant step toward integrating safety considerations into navigation tools.
In this paper, the application of MCDA holistically evaluates the quality of routes by integrating several key parameters. By assigning specific weights to each criterion based on its importance, MCDA offers solutions that optimize urban traffic.
Although this study achieves advancements in traffic optimization, the following limitations remain to be addressed. The variability in recall across hazard categories, which ranges from 37.5% to 71.4%, is identified as a limitation in the system’s ability to consistently detect all types of hazards. This inconsistency is particularly problematic in scenarios where certain hazards, such as potholes or accidents, are less frequently represented in the dataset. The lower recall rates for specific hazard categories suggest that the model may struggle to identify all relevant instances, potentially resulting in false negatives. More classification models should be explored to address this issue, such as deep learning architectures that can better handle imbalanced datasets. Incorporating advanced data augmentation techniques during model training could help mitigate these challenges. Building a dataset that includes elements of violence, blood, or other sensitive scenarios poses a challenge from multiple perspectives, both technical and ethical. First of all, collecting such images requires access to sources that accurately reflect these situations without promoting or exposing explicit content that could be considered inappropriate or even illegal in some jurisdictions. For example, obtaining images that realistically illustrate violence involves using materials from films or reports. Still, these must be processed carefully to avoid including graphic details that might be considered too intense or unsafe. Additionally, explicit consent must be obtained from the participants or sources providing these images. From a technical standpoint, building such a dataset also involves challenges related to the diversity of scenarios. For the model to accurately detect violence in diverse contexts (e.g., low lighting, hidden angles, various environments), a large dataset is required to encompass a wide range of conditions. This includes capturing images that reflect violence at various times of day, in different weather conditions, and in both urban and rural environments. Therefore, collecting such data is costly and time-consuming, as it requires specialized equipment and qualified personnel.
Future research directions will focus on:
- Expanding the dataset to include more diverse traffic scenarios (e.g., adverse weather conditions, highways, rural areas);
- Incorporating additional contextual data, such as traffic flow patterns and vehicle types;
- Integrating machine learning algorithms for future trend analysis;
- Collaborating with city authorities to deploy and validate the system in real-world urban environments.
This study highlights the potential of integrating IoT and advanced routing algorithms to revolutionize traffic navigation. The findings underscore the importance of combining efficiency and safety considerations in intelligent transportation systems. Addressing current limitations and embracing the recommended advancements, this research sets a solid foundation for developing next-generation traffic management solutions, ultimately contributing to safer and more efficient urban mobility.
Author Contributions
Conceptualization, C.-M.R.; methodology, C.-M.R. and A.S.; software C.-M.R.; validation, C.-M.R. and A.S.; formal analysis, C.-M.R. and A.S.; investigation, A.S. and I.-A.G.; resources, A.S. and I.-A.G.; data curation, C.-M.R.; writing—original draft preparation, A.S. and I.-A.G.; writing—review and editing, A.S. and I.-A.G.; visualization, C.-M.R., A.S. and I.-A.G.; supervision, C.-M.R.; project administration, A.S.; funding acquisition, A.S. All authors have read and agreed to the published version of the manuscript.
Funding
This research was funded by the Petroleum-Gas University of Ploiesti, Romania.
Institutional Review Board Statement
Not applicable.
Informed Consent Statement
Not applicable.
Data Availability Statement
The raw data supporting the conclusions of this article will be made available by the authors upon request.
Conflicts of Interest
The authors declare no conflicts of interest.
Abbreviations
The following abbreviations are used in this manuscript:
| ADSC | Azure Detection Safety Component |
| AI | Artificial intelligence |
| ANN | Artificial neural network |
| API | Application Programming Interface |
| DL | Deep learning |
| DQN | Deep Q-network |
| DRL | Deep reinforcement learning |
| ETk | Estimated Travel |
| FN | False negative |
| FP | False positive |
| GP | Geographical Points |
| GPS | Global Positioning System |
| GRQIk | Global Route Quality Indicator |
| GUI | Graphical user interface |
| IoT | Internet of Things |
| ITMS | intelligent traffic management systems |
| LiDAR | Light Detection and Ranging |
| LSTM | Long short-term memory |
| MARL | Multi-agent reinforcement learning |
| MCDA | Multi-criteria decision analysis |
| MCS | Mobile crowd sensing |
| ML | Machine learning |
| NN | Neural network |
| PP | Pothole Procedure Component |
| QoS | Quality of service |
| R-CNN | Region-Based Convolutional Neural Network |
| RSak | Road Safety |
| RSek | Road Sensitivity |
| SDN | Software-Defined Networking |
| SQL | Structured Query Language |
| SSD | Single Shot Detector |
| SUMO | Simulation of Urban MObility |
| TDek | Traffic Delay |
| TDik | Total Distance |
| TMS | Traffic management systems |
| TN | True negative |
| TOA | Traffic Optimization Algorithm |
| TP | True positive |
| TSC | Traffic signal control |
| V2X | Vehicle-to-everything |
| WIM | Weigh-in-motion |
| WSN | Wireless sensor network |
| YOLO | You Only Look Once |
References
- Rosca, C.-M.; Rădulescu, G.; Stancu, A. Artificial Intelligence of Things Infrastructure for Quality Control in Cast Manufacturing Environments Shedding Light on Industry Changes. Appl. Sci. 2025, 15, 2068. [Google Scholar] [CrossRef]
- Ravish, R.; Swamy, S.R. Intelligent Traffic Management: A Review of Challenges, Solutions, and Future Perspectives. Transp. Telecommun. 2021, 22, 163–182. [Google Scholar] [CrossRef]
- Fouladgar, M.; Parchami, M.; Elmasri, R.; Ghaderi, A. Scalable deep traffic flow neural networks for urban traffic congestion prediction. In Proceedings of the International Joint Conference on Neural Networks, Anchorage, AK, USA, 14–19 May 2017; pp. 2251–2258. [Google Scholar] [CrossRef]
- Anjaneyulu, M.; Kubendiran, M. Short-Term Traffic Congestion Prediction Using Hybrid Deep Learning Technique. Sustainability 2022, 15, 74. [Google Scholar] [CrossRef]
- Aqib, M.; Mehmood, R.; Alzahrani, A.; Katib, I.; Albeshri, A.; Altowaijri, S.M. Smarter Traffic Prediction Using Big Data, In-Memory Computing, Deep Learning and GPUs. Sensors 2019, 19, 2206. [Google Scholar] [CrossRef]
- Humayun, M.; Afsar, S.; Almufareh, M.F.; Jhanjhi, N.Z.; Alsuwailem, M. Smart Traffic Management System for Metropolitan Cities of Kingdom Using Cutting Edge Technologies. J. Adv. Transp. 2022, 2022, 4687319. [Google Scholar] [CrossRef]
- Afrin, T.; Yodo, N. A Survey of Road Traffic Congestion Measures towards a Sustainable and Resilient Transportation System. Sustainability 2020, 12, 4660. [Google Scholar] [CrossRef]
- Oktorini, R.; Barus, L.S. Integration of Public Transportation in Smart Transportation System (Smart Transportation System) in Jakarta | Konfrontasi: Jurnal Kultural, Ekonomi dan Perubahan Sosial. Konfrontasi J. Kult. Ekon. Dan Perubahan Sos. 2022, 9, 341–347. [Google Scholar] [CrossRef]
- Hasan, M.; Fadli, F. Multimodal Transport For Smart Mobility in Emerging Cities: Case of Doha. Proc. Int. Conf. Civ. Infrastruct. Constr. 2023, 2023, 933–940. [Google Scholar] [CrossRef]
- Rosca, C.M. Convergence Catalysts: Exploring the Fusion of Embedded Systems, IoT, and Artificial Intelligence. In Engineering Applications of AI and Swarm Intelligence; Yang, X.-S., Ed.; Springer Nature: Singapore, 2025; pp. 69–87. [Google Scholar] [CrossRef]
- Al-Madi, N.A.; Hnaif, A.A. Optimizing Traffic Signals in Smart Cities Based on Genetic Algorithm. Comput. Syst. Sci. Eng. 2021, 40, 65–74. [Google Scholar] [CrossRef]
- Misnan, M.F.; Thamrin, N.M.; Amin, M.S.M.; Abu Bakar, Z. Conceptual Design of Smart Network Adaptive Traffic Light in Creating Low-Carbon City. Int. J. Integr. Eng. 2023, 15, 98–106. [Google Scholar] [CrossRef]
- Liu, L.; Lian, M.; Lu, C.; Zhang, S.; Liu, R.; Xiong, N.N. TCSA: A Traffic Congestion Situation Assessment Scheme Based on Multi-Index Fuzzy Comprehensive Evaluation in 5G-IoV. Electronics 2022, 11, 1032. [Google Scholar] [CrossRef]
- Shaheed, S.H. Intelligent Traffic Congestion Control Using Black Widow Optimization with Hybrid Deep Learning on Smart City Environment. J. Smart Internet Things 2023, 2023, 44–61. [Google Scholar] [CrossRef]
- Panait, M.; Janjua, L.R.; Apostu, S.A.; Mihăescu, C. Impact factors to reduce carbon emissions. Evidences from Latin America. Kybernetes 2023, 52, 5669–5686. [Google Scholar] [CrossRef]
- Ridwan, M.A.; Radzi, N.A.M.; Azmi, K.H.M.; Abdullah, F.; Ahmad, W.S.H.M.W. A New Machine Learning-based Hybrid Intrusion Detection System and Intelligent Routing Algorithm for MPLS Network. Int. J. Adv. Comput. Sci. Appl. 2023, 14, 94–107. [Google Scholar] [CrossRef]
- Yang, X.; Luo, S.; Gao, K.; Qiao, T.; Chen, X. Application of Data Science Technologies in Intelligent Prediction of Traffic Congestion. J. Adv. Transp. 2019, 2019, 2915369. [Google Scholar] [CrossRef]
- Mainali, M.K.; Mabu, S.; Yu, S.; Eto, S.; Hirasawa, K. Dynamic optimal route search algorithm for car navigation systems with preferences by dynamic programming. IEEJ Trans. Electr. Electron. Eng. 2011, 6, 14–22. [Google Scholar] [CrossRef]
- Chu, T.; Wang, J.; Codeca, L.; Li, Z. Multi-agent deep reinforcement learning for large-scale traffic signal control. IEEE Trans. Intell. Transp. Syst. 2020, 21, 1086–1095. [Google Scholar] [CrossRef]
- Gregurić, M.; Vujić, M.; Alexopoulos, C.; Miletić, M. Application of Deep Reinforcement Learning in Traffic Signal Control: An Overview and Impact of Open Traffic Data. Appl. Sci. 2020, 10, 4011. [Google Scholar] [CrossRef]
- Li, D.; Wu, J.; Xu, M.; Wang, Z.; Hu, K. Adaptive Traffic Signal Control Model on Intersections Based on Deep Reinforcement Learning. J. Adv. Transp. 2020, 2020, 6505893. [Google Scholar] [CrossRef]
- Wang, S.; Xie, X.; Huang, K.; Zeng, J.; Cai, Z. Deep Reinforcement Learning-Based Traffic Signal Control Using High-Resolution Event-Based Data. Entropy 2019, 21, 744. [Google Scholar] [CrossRef]
- Rosca, C.-M.; Stancu, A. Fusing Machine Learning and AI to Create a Framework for Employee Well-Being in the Era of Industry 5.0. Appl. Sci. 2024, 14, 10835. [Google Scholar] [CrossRef]
- Elfar, A.; Talebpour, A.; Mahmassani, H.S. Machine Learning Approach to Short-Term Traffic Congestion Prediction in a Connected Environment. Transp. Res. Rec. 2018, 2672, 185–195. [Google Scholar] [CrossRef]
- Luo, S.; Li, Q. Application of Autoformer to Short-Term Traffic Flow Prediction. Int. J. Sci. Adv. 2024, 5, 85–87. [Google Scholar] [CrossRef]
- Ge, H.; Song, Y.; Wu, C.; Ren, J.; Tan, G. Cooperative deep Q-learning with Q-value transfer for multi-intersection signal control. IEEE Access 2019, 7, 40797–40809. [Google Scholar] [CrossRef]
- Hassan, M.A.; Elhadef, M.; Khan, M.U.G. Collaborative Traffic Signal Automation Using Deep Q-Learning. IEEE Access 2023, 11, 136015–136032. [Google Scholar] [CrossRef]
- Genders, W.; Razavi, S. Evaluating Reinforcement Learning State Representations for Adaptive Traffic Signal Control. Int. J. Traffic Transp. Manag. 2019, 1, 19–26. [Google Scholar] [CrossRef]
- Kodama, N.; Harada, T.; Miyazaki, K. Traffic Signal Control System Using Deep Reinforcement Learning With Emphasis on Reinforcing Successful Experiences. IEEE Access 2022, 10, 128943–128950. [Google Scholar] [CrossRef]
- Prajapati, M.; Upadhyay, A.K.; Patil, H.; Dongradive, J. A Review of Deep Reinforcement Learning for Traffic Signal Control. Int. J. Multidiscip. Res. 2024, 6, 1–10. [Google Scholar] [CrossRef]
- Rosca, C.-M.; Stancu, A. Earthquake Prediction and Alert System Using IoT Infrastructure and Cloud-Based Environmental Data Analysis. Appl. Sci. 2024, 14, 10169. [Google Scholar] [CrossRef]
- Filipovska, M.; Mahmassani, H.S. Traffic Flow Breakdown Prediction using Machine Learning Approaches. Transp. Res. Rec. 2020, 2674, 560–570. [Google Scholar] [CrossRef]
- Jamil, A.R.M.; Nower, N. A Comprehensive Analysis of Reward Function for Adaptive Traffic Signal Control. Knowl. Eng. Data Sci. 2021, 4, 85–96. [Google Scholar] [CrossRef]
- Schumacher, M.; Adriano, C.M.; Giese, H. Challenges in Reward Design for Reinforcement Learning-based Traffic Signal Control: An Investigation using a CO2 Emission Objective. In Proceedings of the SUMO Conference, Berlin, Germany, 2–4 May 2023; pp. 131–151. [Google Scholar] [CrossRef]
- Bouktif, S.; Cheniki, A.; Ouni, A. Traffic Signal Control Using Hybrid Action Space Deep Reinforcement Learning. Sensors 2021, 21, 2302. [Google Scholar] [CrossRef] [PubMed]
- Cao, K.; Wang, L.; Zhang, S.; Duan, L.; Jiang, G.; Sfarra, S.; Zhang, H.; Jung, H. Optimization Control of Adaptive Traffic Signal with Deep Reinforcement Learning. Electronics 2024, 13, 198. [Google Scholar] [CrossRef]
- Rosca, C.-M. New Algorithm to Prevent Online Test Fraud Based on Cognitive Services and Input Devices Events. In Proceedings of Third Emerging Trends and Technologies on Intelligent Systems. ETTIS 2023. Lecture Notes in Networks and Systems; Noor, A., Saroha, K., Pricop, E., Sen, A., Trivedi, G., Eds.; Springer Nature: Singapore, 2023; Volume 730, pp. 207–219. [Google Scholar] [CrossRef]
- Liu, D.; Cui, J.; Zhang, J.; Yang, C.Y.; Hanzo, L. Deep Reinforcement Learning Aided Packet-Routing for Aeronautical Ad-Hoc Networks Formed by Passenger Planes. IEEE Trans. Veh. Technol. 2021, 70, 5166–5171. [Google Scholar] [CrossRef]
- Apostu, S.A.; Panait, M.; Vasile, V. The energy transition in Europe—A solution for net zero carbon? Environ. Sci. Pollut. Res. 2022, 29, 71358–71379. [Google Scholar] [CrossRef]
- Zheng, X.; Huang, W.; Wang, S.; Zhang, J.; Zhang, H. Research on Energy-Saving Routing Technology Based on Deep Reinforcement Learning. Electronics 2022, 11, 2035. [Google Scholar] [CrossRef]
- Zhuang, C.X.; Chen, C. Research on autonomous route generation method based on AIS ship trajectory big data and improved LSTM algorithm. Front. Neurorobotics 2022, 16, 1049343. [Google Scholar] [CrossRef]
- Liao, H.; Zhang, W.; Dong, X.; Poczos, B.; Shimada, K.; Burak Kara, L. A Deep Reinforcement Learning Approach for Global Routing. J. Mech. Des. 2020, 142, 061701. [Google Scholar] [CrossRef]
- Chrpa, L.; Vallati, M.; Parkinson, S. Exploiting automated planning for efficient centralized vehicle routing and mitigating congestion in urban road networks. In Proceedings of the 34th ACM/SIGAPP Symposium on Applied Computing, Limassol, Cyprus, 8–9 April 2019; pp. 191–194. [Google Scholar] [CrossRef]
- Švadlenka, M.; Chrpa, L.; Vallati, M. Improving the Scalability of Automated Planning-based Vehicle Routing via Smart Routes Identification. In Proceedings of the 8th International Conference on Models and Technologies for Intelligent Transportation Systems, Nice, France, 14–16 June 2023; pp. 1–6. [Google Scholar] [CrossRef]
- Yu, J.; Deng, W.; Zhao, Z.; Wang, X.; Xu, J.; Wang, L.; Sun, Q.; Shen, Z. A hybrid path planning method for an unmanned cruise ship in water quality sampling. IEEE Access 2019, 7, 87127–87140. [Google Scholar] [CrossRef]
- Gao, Z.; Zhang, J.; Yan, S.; Xiao, Y.; Simeonidou, D.; Ji, Y. Deep Reinforcement Learning for BBU Placement and Routing in C-RAN. In Proceedings of the Optical Fiber Communication Conference, San Diego, CA, USA, 3–7 March 2019; pp. W2A.22–W22A.22. [Google Scholar] [CrossRef]
- Eyobu, O.S.; Edwinah, K. A Deep Learning-Based Routing Approach for Wireless Mesh Backbone Networks. IEEE Access 2023, 11, 49509–49518. [Google Scholar] [CrossRef]
- Rosca, C.-M.; Stancu, A.; Neculaiu, C.-F.; Gortoescu, I.-A. Designing and Implementing a Public Urban Transport Scheduling System Based on Artificial Intelligence for Smart Cities. Appl. Sci. 2024, 14, 8861. [Google Scholar] [CrossRef]
- Ali, A.; Ayub, N.; Shiraz, M.; Ullah, N.; Gani, A.; Qureshi, M.A. Traffic Efficiency Models for Urban Traffic Management Using Mobile Crowd Sensing: A Survey. Sustainability 2021, 13, 13068. [Google Scholar] [CrossRef]
- Silas, A.I.; Jonathan, F.M.; Ekong, O.E. Traffic Management System for Prioritizing Emergency Over Time and Density. In Proceedings of the Accra Bespoke Multidisciplinary Innovations Conference, Accra, Ghana, 12–14 December 2021; pp. 23–36. [Google Scholar] [CrossRef]
- Kadim, Z.; Johari, K.M.; Fairol, D.; Li, Y.S.; Hon, H.W. Real-time vehicle counting in complex scene for traffic flow estimation using multi-level convolutional neural network. Int. J. Adv. Technol. Eng. Explor. 2021, 8, 338–351. [Google Scholar] [CrossRef]
- Qi, L.; Wang, F.; Xu, X.; Dou, W.; Zhang, X.; Khosravi, M.R.; Zhou, X. Time-Aware Missing Traffic Flow Prediction for Sensors with Privacy-Preservation. In Proceedings of the 11th International Conference on Computer Engineering and Networks, Lecture Notes in Electrical Engineering, Hechi, China; Springer: Singapore, 2022; pp. 721–730. [Google Scholar] [CrossRef]
- Rosca, C.-M.; Stancu, A.; Iovanovici, E.M. The New Paradigm of Deepfake Detection at the Text Level. Appl. Sci. 2025, 15, 2560. [Google Scholar] [CrossRef]
- Soom, J.; Leier, M.; Janson, K.; Tuhtan, J.A. Open Urban mmWave Radar and Camera Vehicle Classification Dataset for Traffic Monitoring. IEEE Access 2024, 12, 65128–65140. [Google Scholar] [CrossRef]
- Tatum, R.; Bays, M.; Hyland, J.; Hartman, B. Traffic monitoring using an adaptive sensor power scheduling algorithm. SN Appl. Sci. 2019, 1, 1552. [Google Scholar] [CrossRef]
- Mihaila, M.; Blanari, I.; Goanta, V.; Barsanescu, P.D. Finite element analysis of a modified weigh-in-motion sensor. In Proceedings of the 10th International Conference on Advanced Concepts in Mechanical Engineering, Iasi, Romania, 9–10 June 2022; p. 012052. [Google Scholar] [CrossRef]
- Ma, R.; Zhang, Z.; Dong, Y.; Pan, Y. Deep Learning Based Vehicle Detection and Classification Methodology Using Strain Sensors under Bridge Deck. Sensors 2020, 20, 5051. [Google Scholar] [CrossRef]
- Roșca, C.-M.; Cărbureanu, M. A Comparative Analysis of Sorting Algorithms for Large-Scale Data: Performance Metrics and Language Efficiency. In Proceedings of the Emerging Trends and Technologies on Intelligent Systems. ETTIS 2024. Lecture Notes in Networks and Systems, Noida, India; Springer: Singapore, 2025; pp. 99–113. [Google Scholar] [CrossRef]
- Chen, S.; Piao, L.; Zang, X.; Luo, Q.; Li, J.; Yang, J.; Rong, J. Analyzing differences of highway lane-changing behavior using vehicle trajectory data. Phys. A: Stat. Mech. Its Appl. 2023, 624, 128980. [Google Scholar] [CrossRef]
- Chen, X.; Chen, W.; Wu, B.; Wu, H.; Xian, J. Ship visual trajectory exploitation via an ensemble instance segmentation framework. Ocean Eng. 2024, 313, 119368. [Google Scholar] [CrossRef]
- Fabianova, J.; Michalik, P.; Janekova, J.; Fabian, M. Design and evaluation of a new intersection model to minimize congestions using VISSIM software. Open Eng. 2020, 10, 48–56. [Google Scholar] [CrossRef]
- Asman, N.; Md Rohani, M.; Aman, M.Y.; Gungat, L.; Hassan, S.A. A Study of Roundabout Sustainability using Traffic Simulation -A Case Study at Ayer Hitam Signalised Intersection. Int. J. Sustain. Constr. Eng. Technol. 2023, 14, 466–483. [Google Scholar] [CrossRef]
- Carlos-Mancilla, M.; Neri, E.L.; Hermenegildo-Dominguez, L.A. A Cyber-Physical System Modelling Framework for an Intelligent Urban Traffic System. Comput. Y Sist. 2019, 23, 299–312. [Google Scholar] [CrossRef]
- Grigoropoulos, G.; Hosseini, S.A.; Keler, A.; Kaths, H.; Spangler, M.; Busch, F.; Bogenberger, K. Traffic Simulation Analysis of Bicycle Highways in Urban Areas. Sustainability 2021, 13, 1016. [Google Scholar] [CrossRef]
- Švadlenka, M.; Chrpa, L. Towards a Framework for Intelligent Urban Traffic Routing. In Proceedings of the 36th International FLAIRS Conference, Clearwater Beach, FL, USA, 14–17 May 2023. [Google Scholar] [CrossRef]
- Mostafi, S.; Alghamdi, T.; Elgazzar, K. RegTraffic: A Regression based Traffic Simulator for Spatiotemporal Traffic Modeling, Simulation and Visualization. In Proceedings of the International Joint Conference on Neural Networks, Padua, Italy, 18–23 July 2022; pp. 1–6. [Google Scholar] [CrossRef]
- TomTom. Calculate Route, Routing API, TomTom Developer Portal. Available online: https://developer.tomtom.com/routing-api/documentation/tomtom-maps/calculate-route (accessed on 20 February 2025).
- TomTom. API Request for Routing. Available online: https://api.tomtom.com/routing/1/calculateRoute/{waypointsParam}/json?key={apiKey}&traffic=true&maxAlternatives=3 (accessed on 20 February 2025).
- Rosca, C.-M.; Stancu, A.; Tănase, M.R. A Comparative Study of Azure Custom Vision Versus Google Vision API Integrated into AI Custom Models Using Object Classification for Residential Waste. Appl. Sci. 2025, 15, 3869. [Google Scholar] [CrossRef]
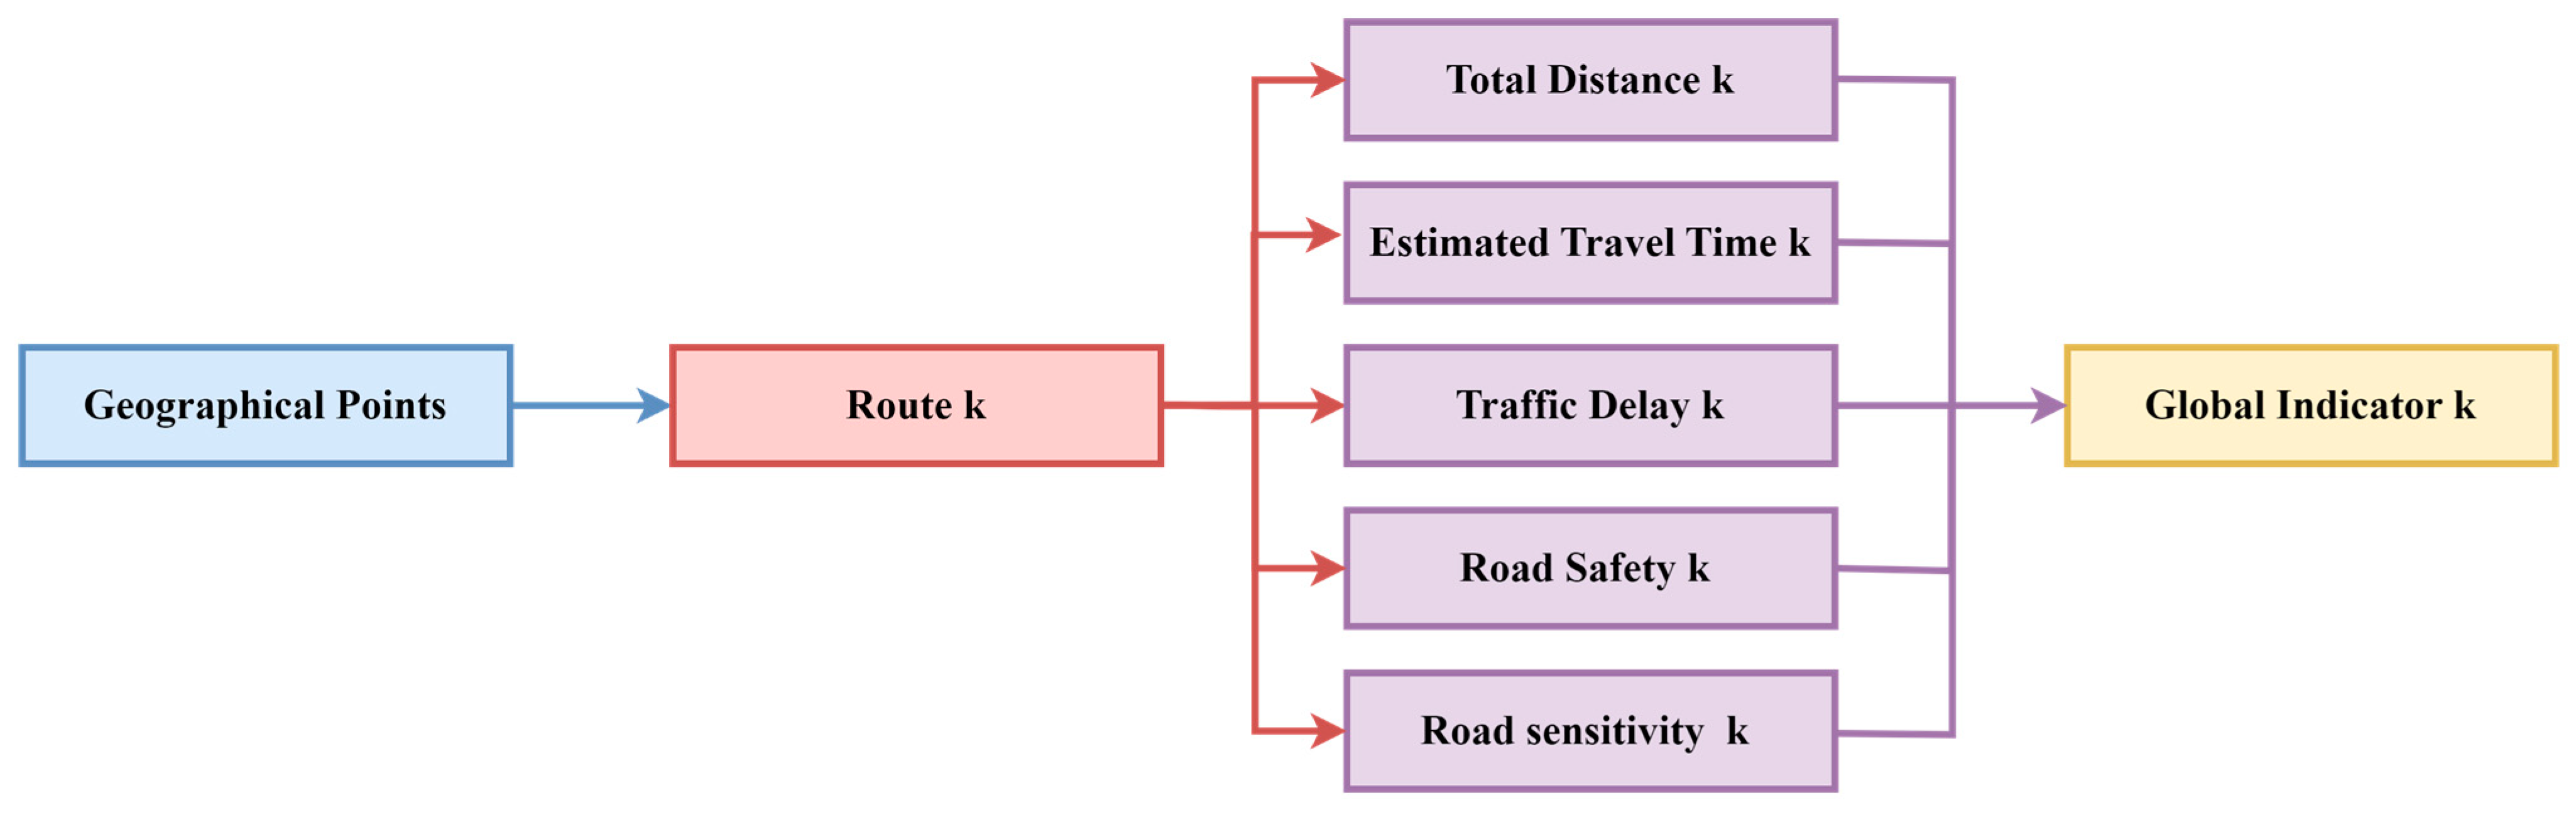
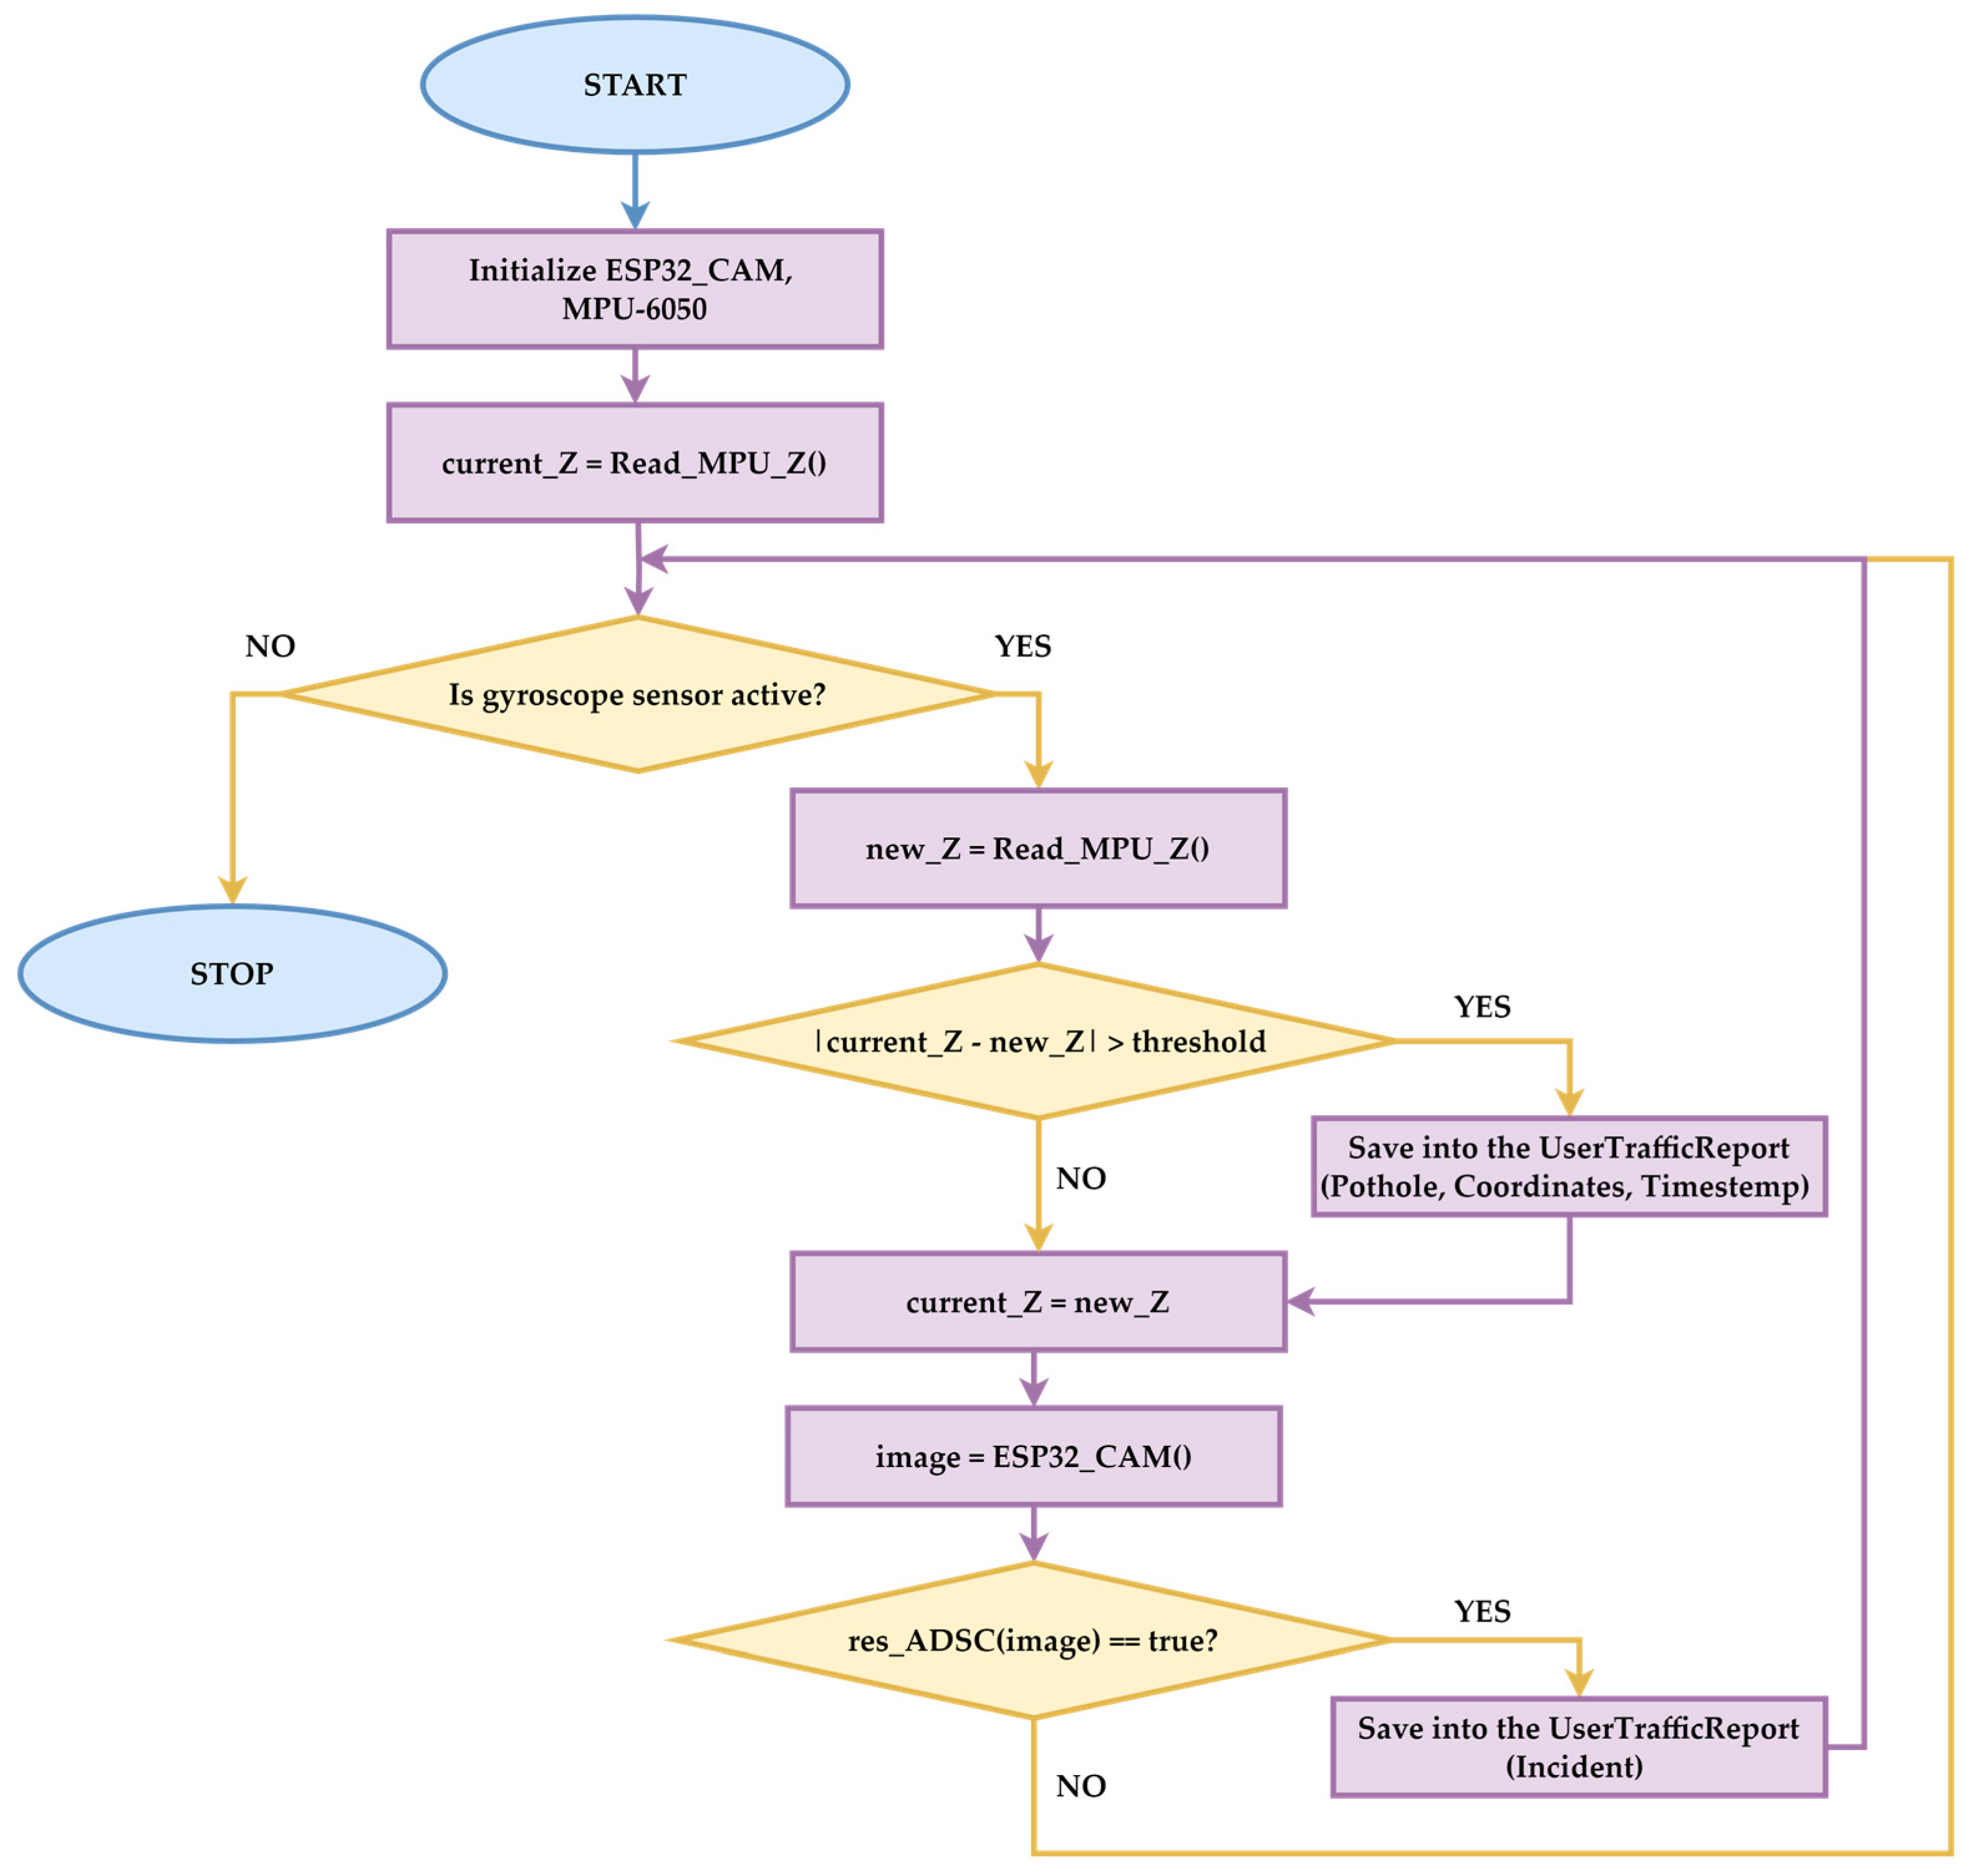


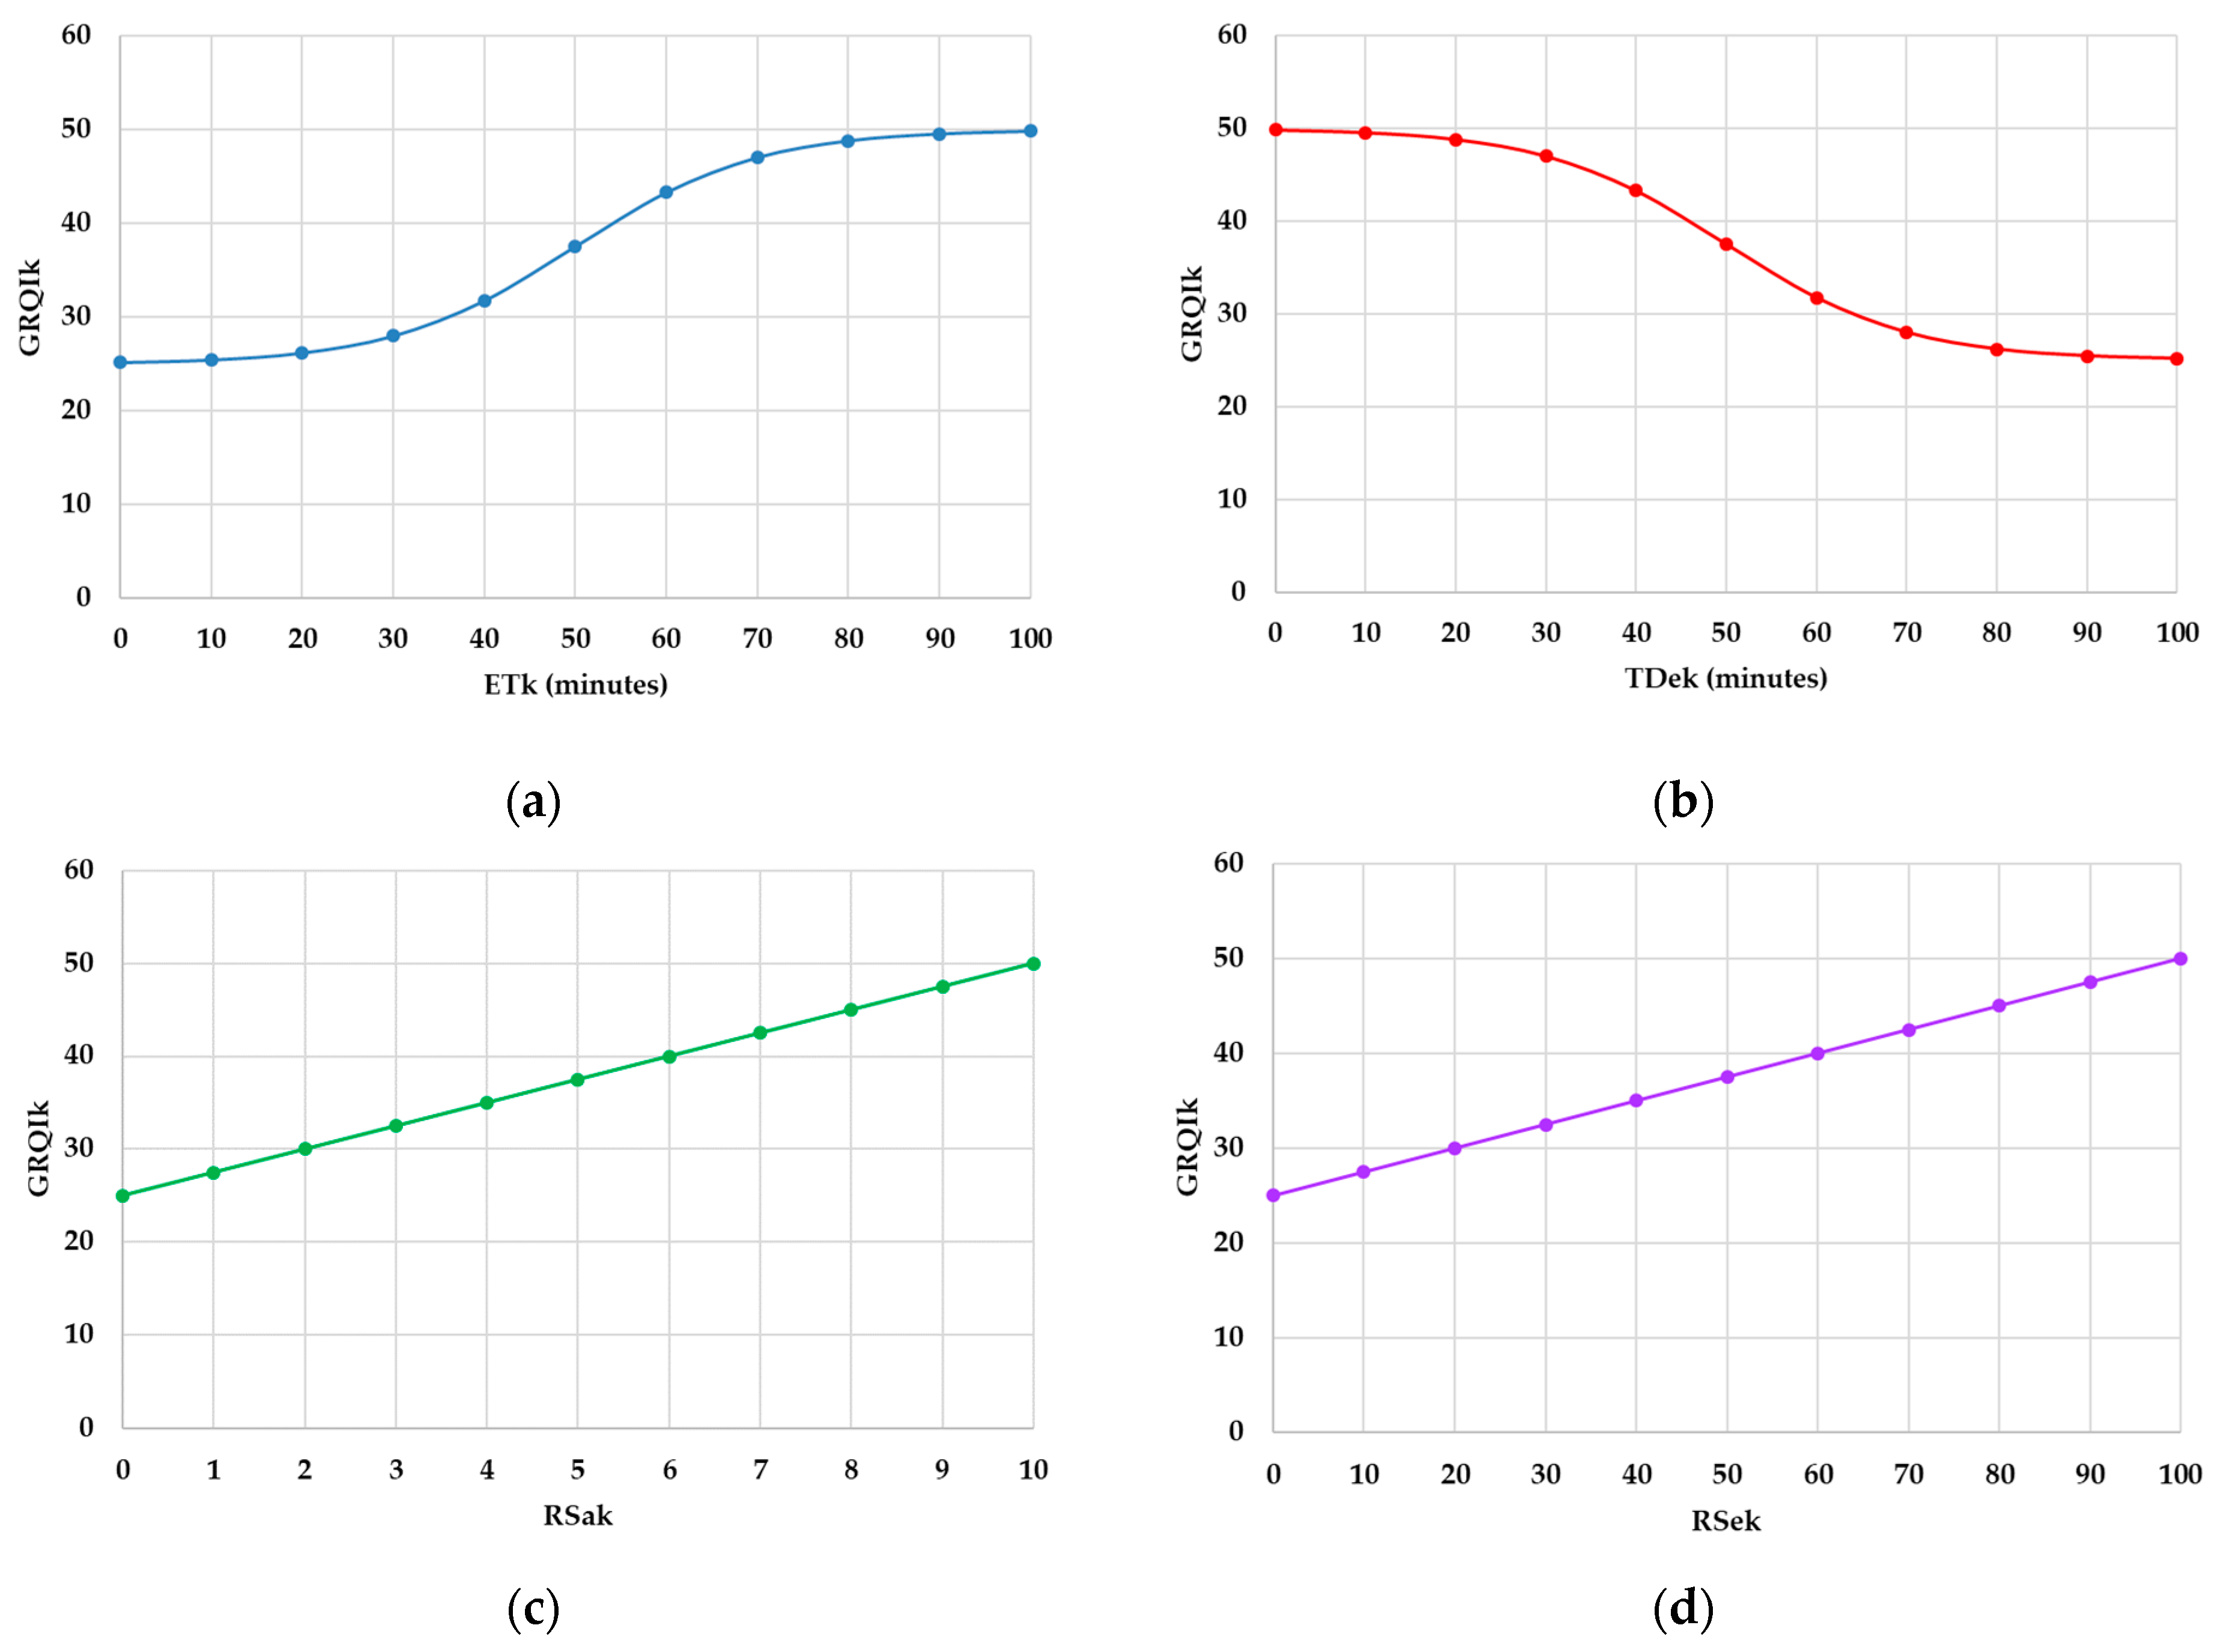
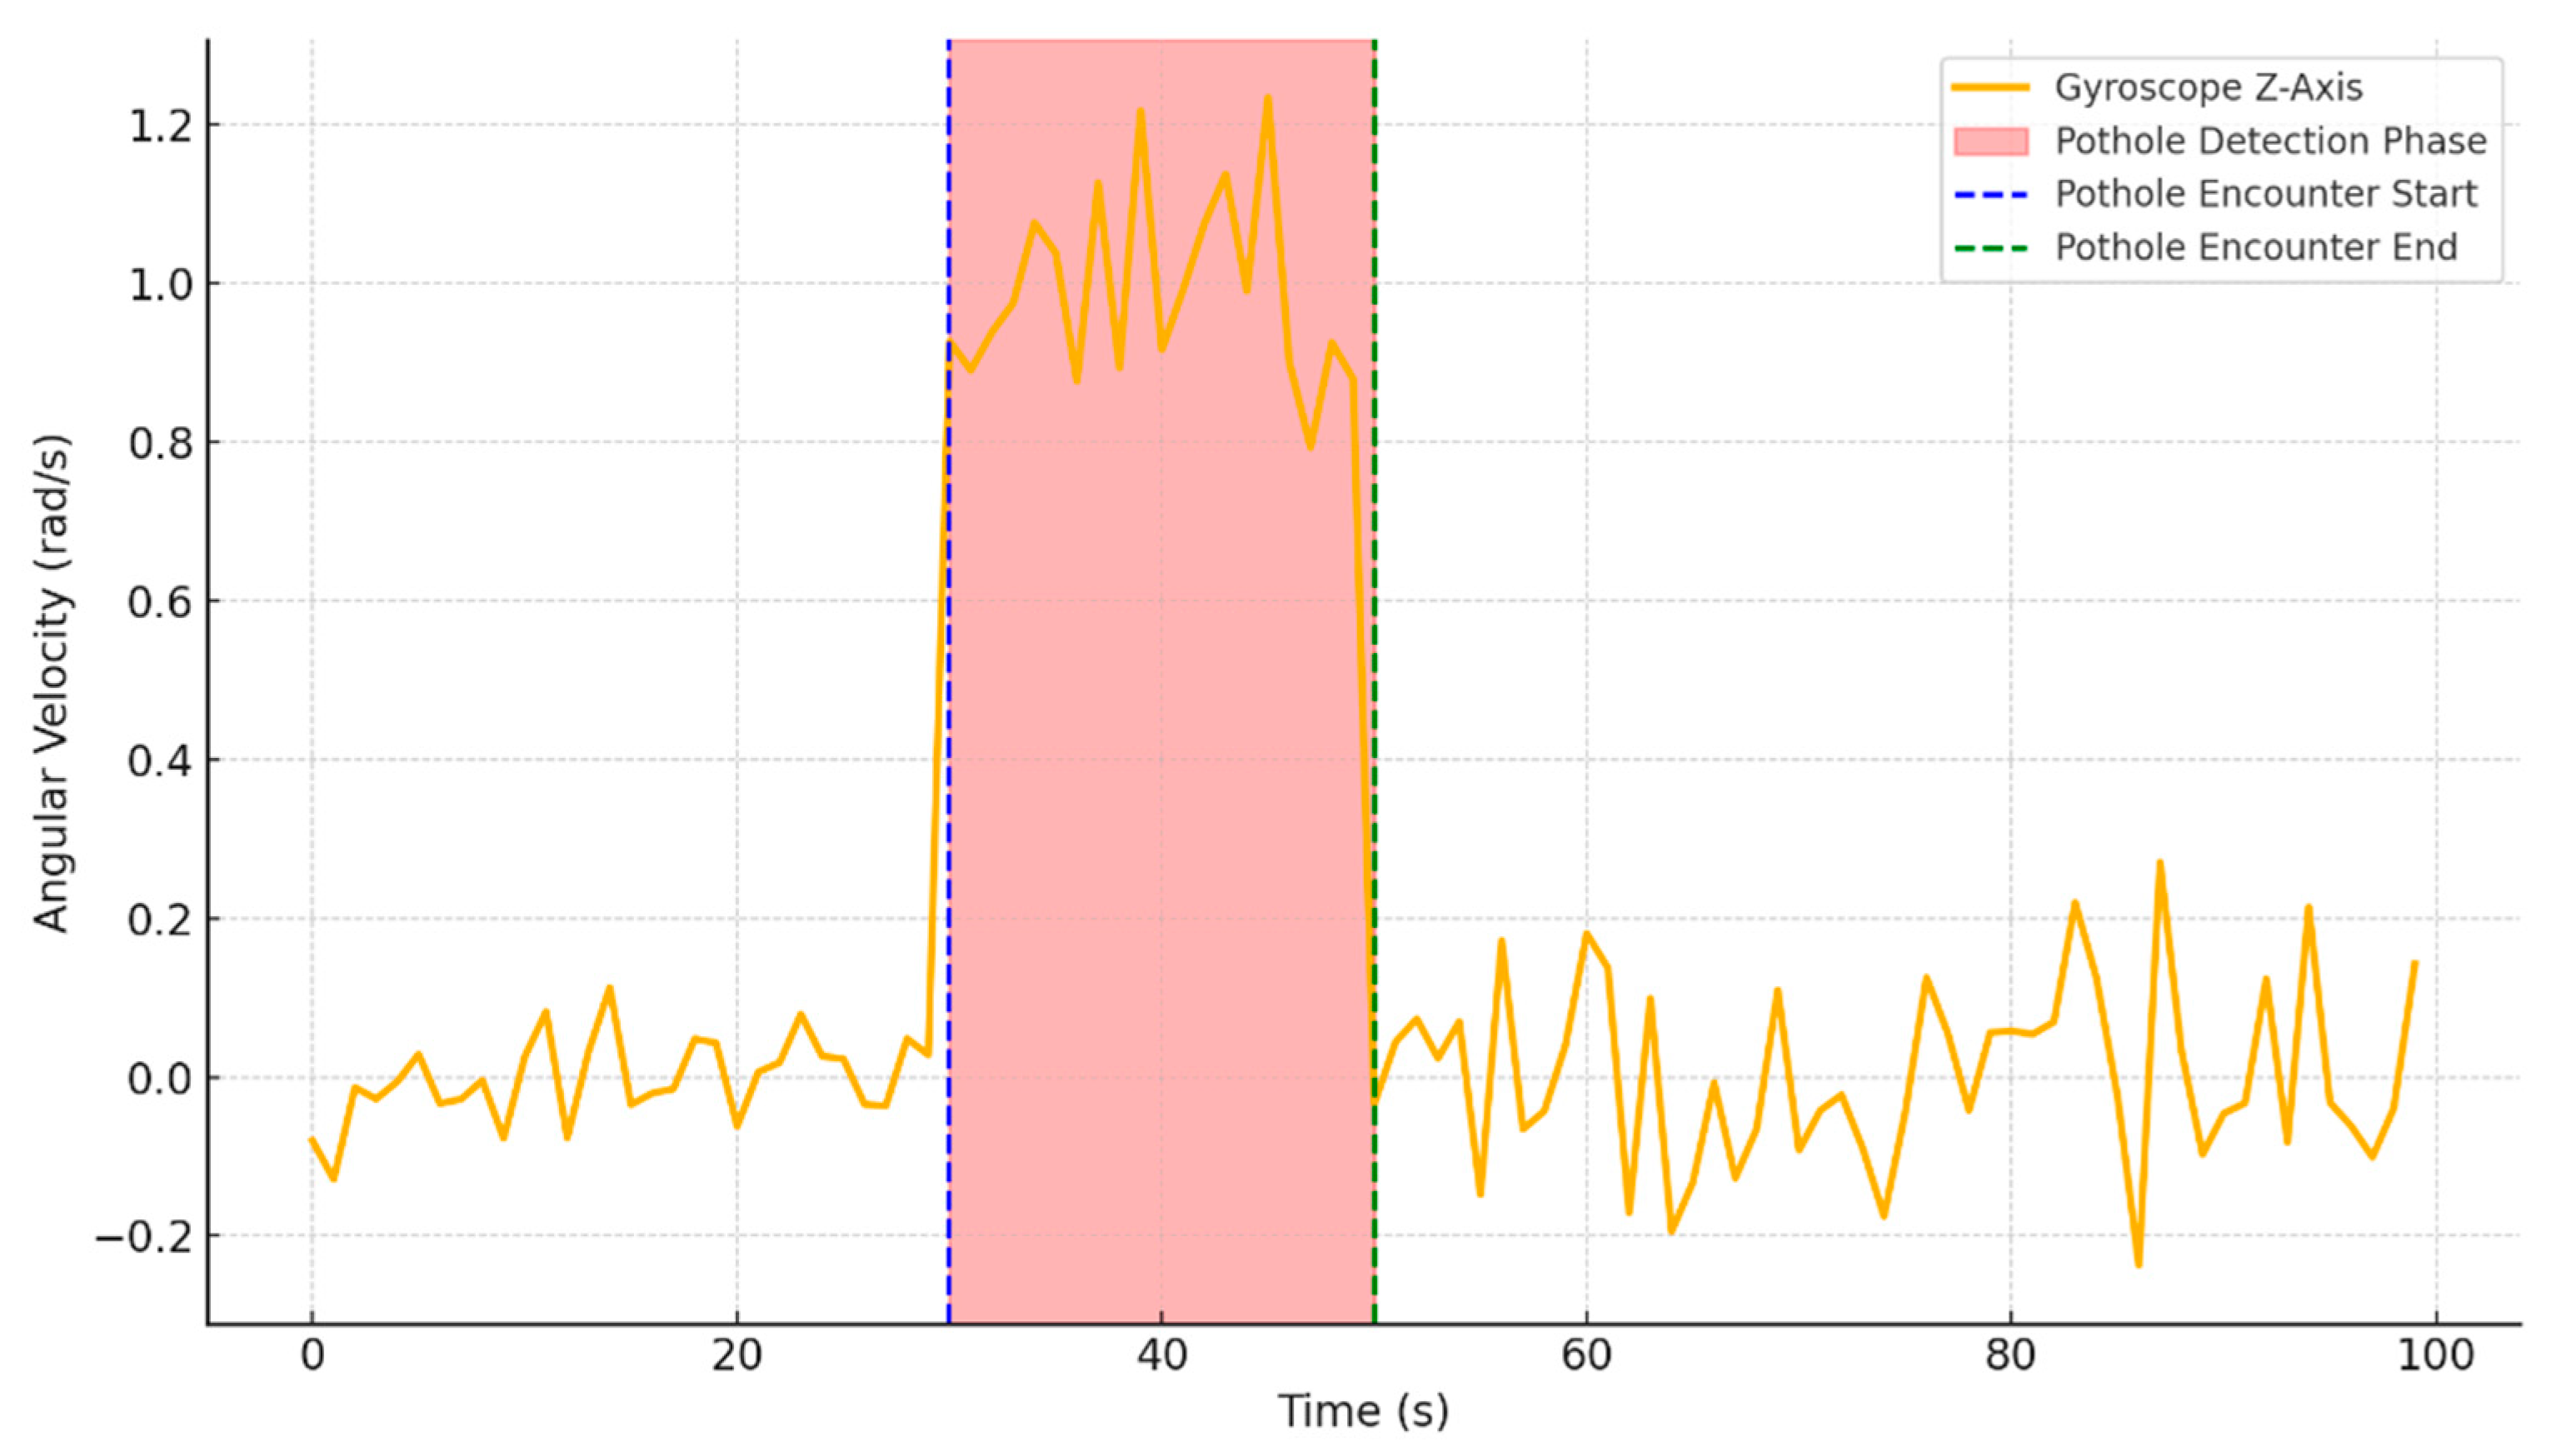

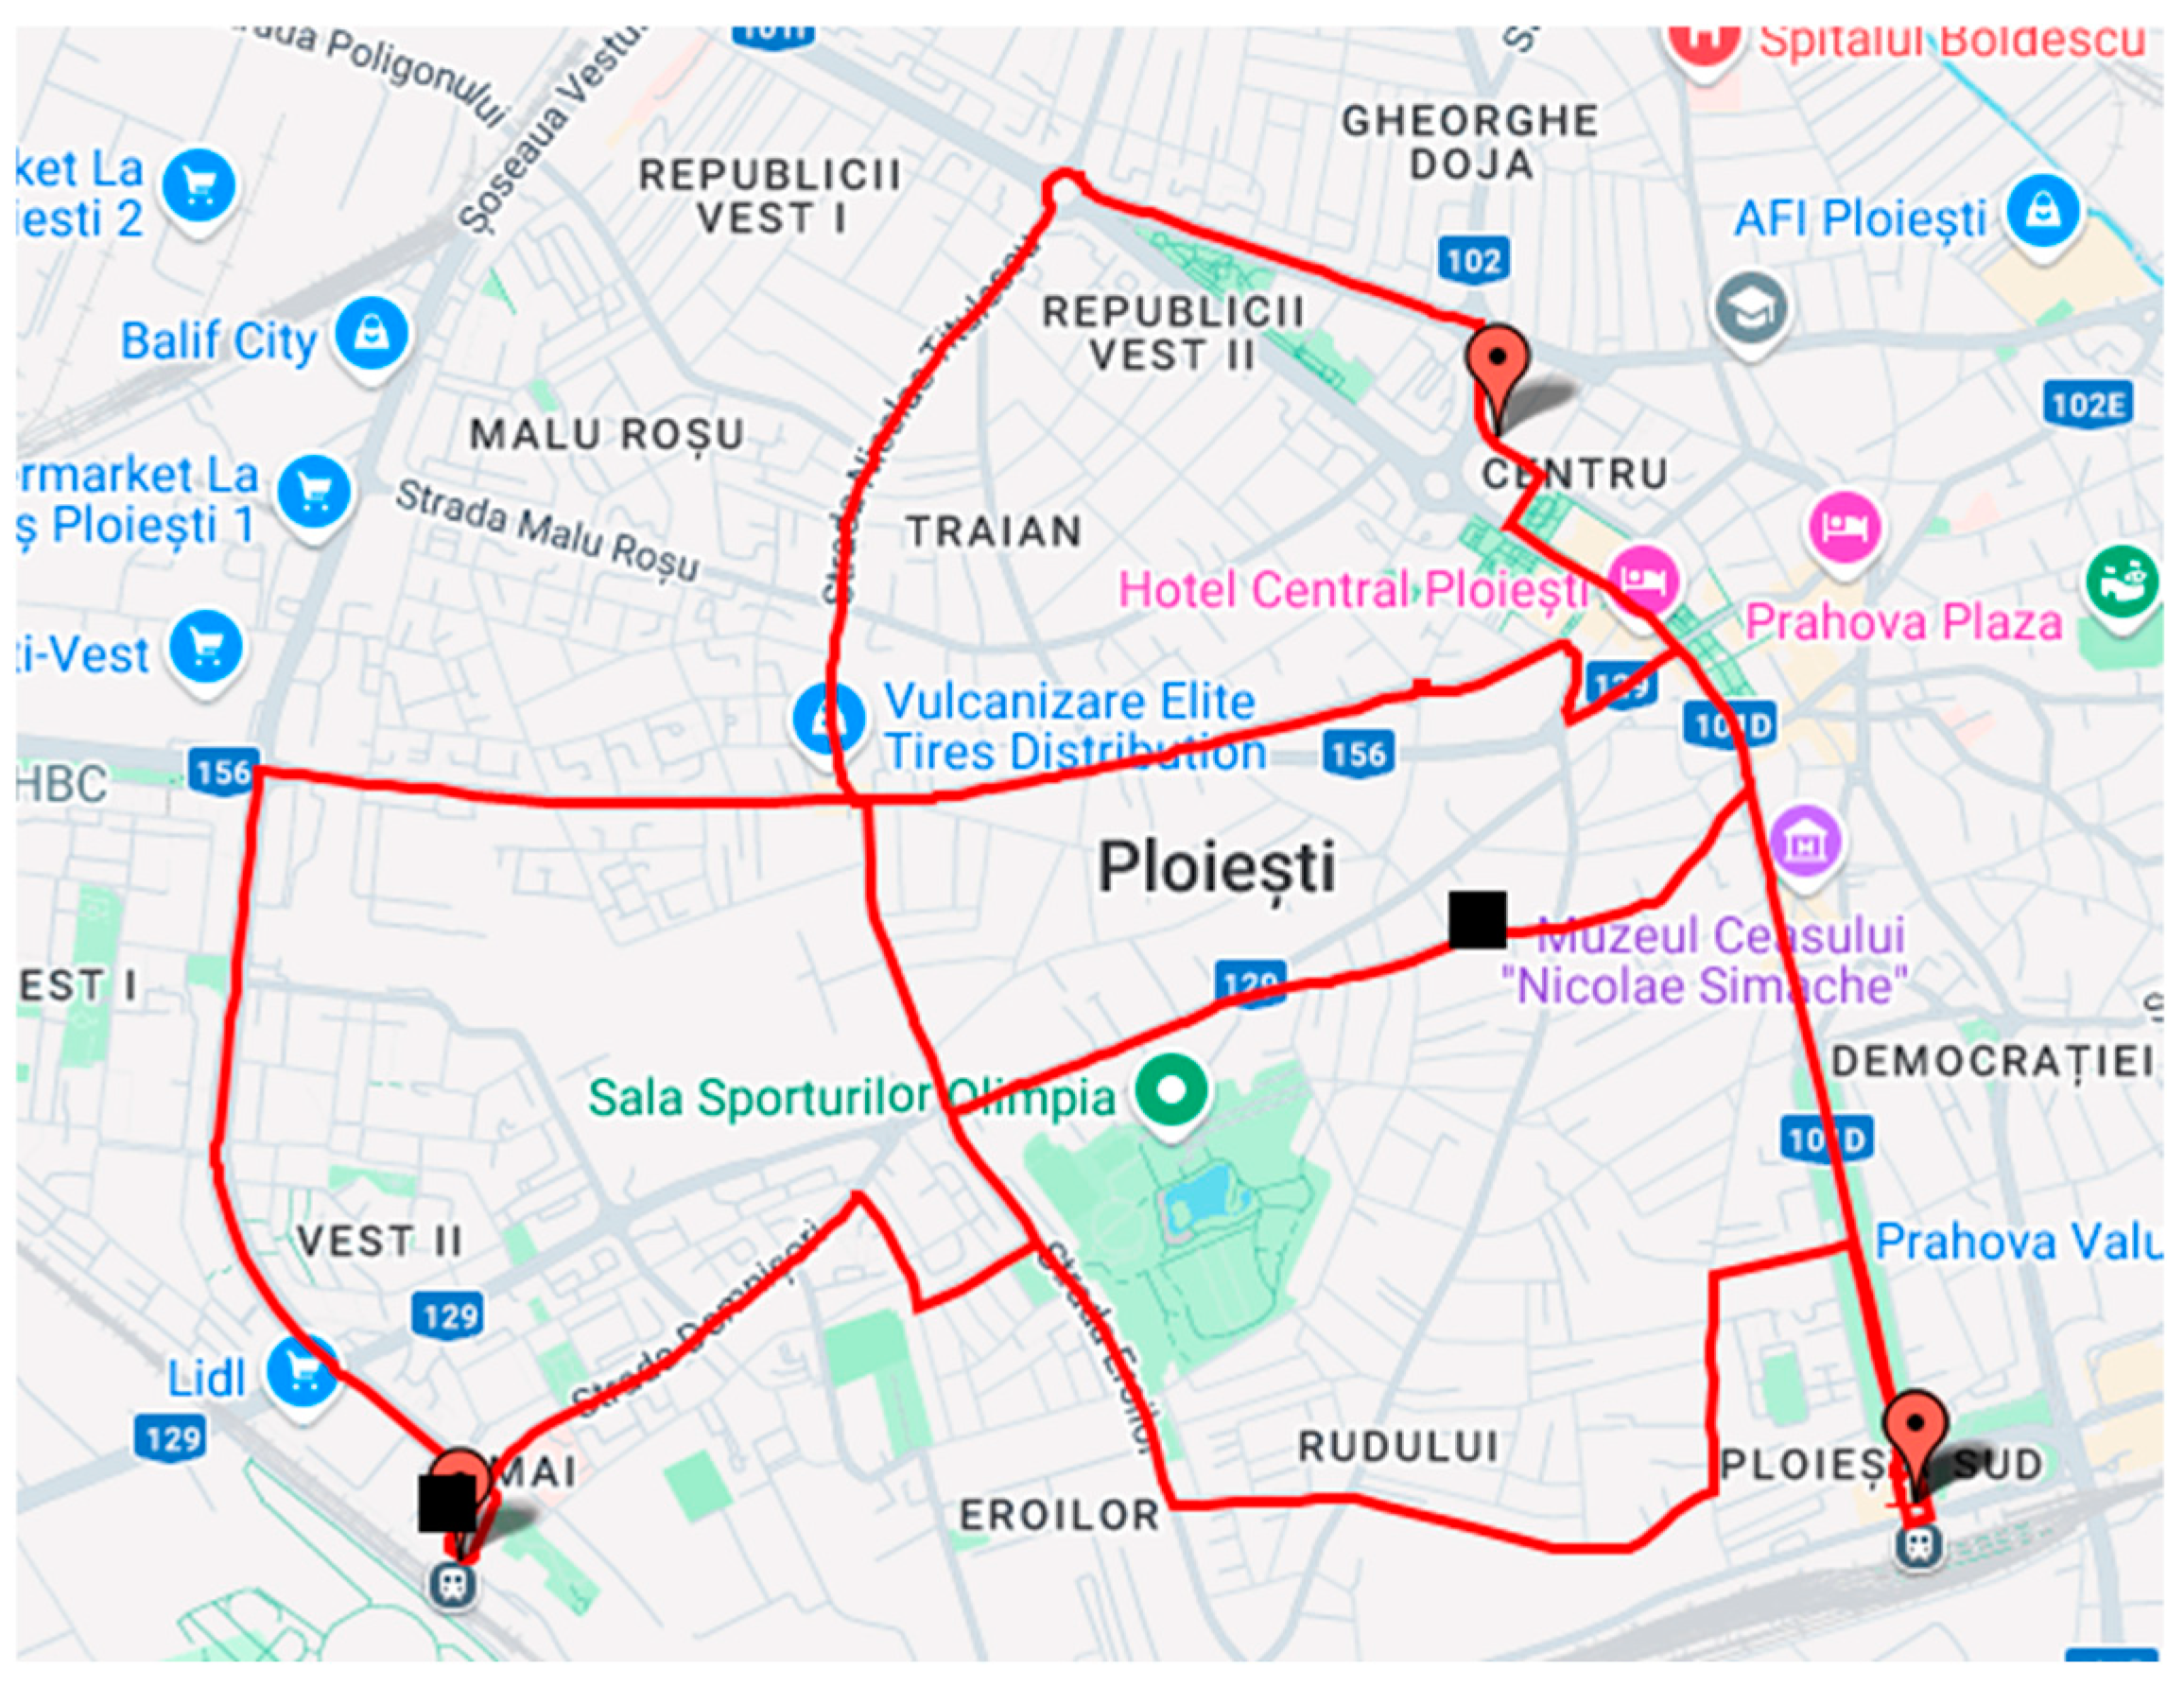

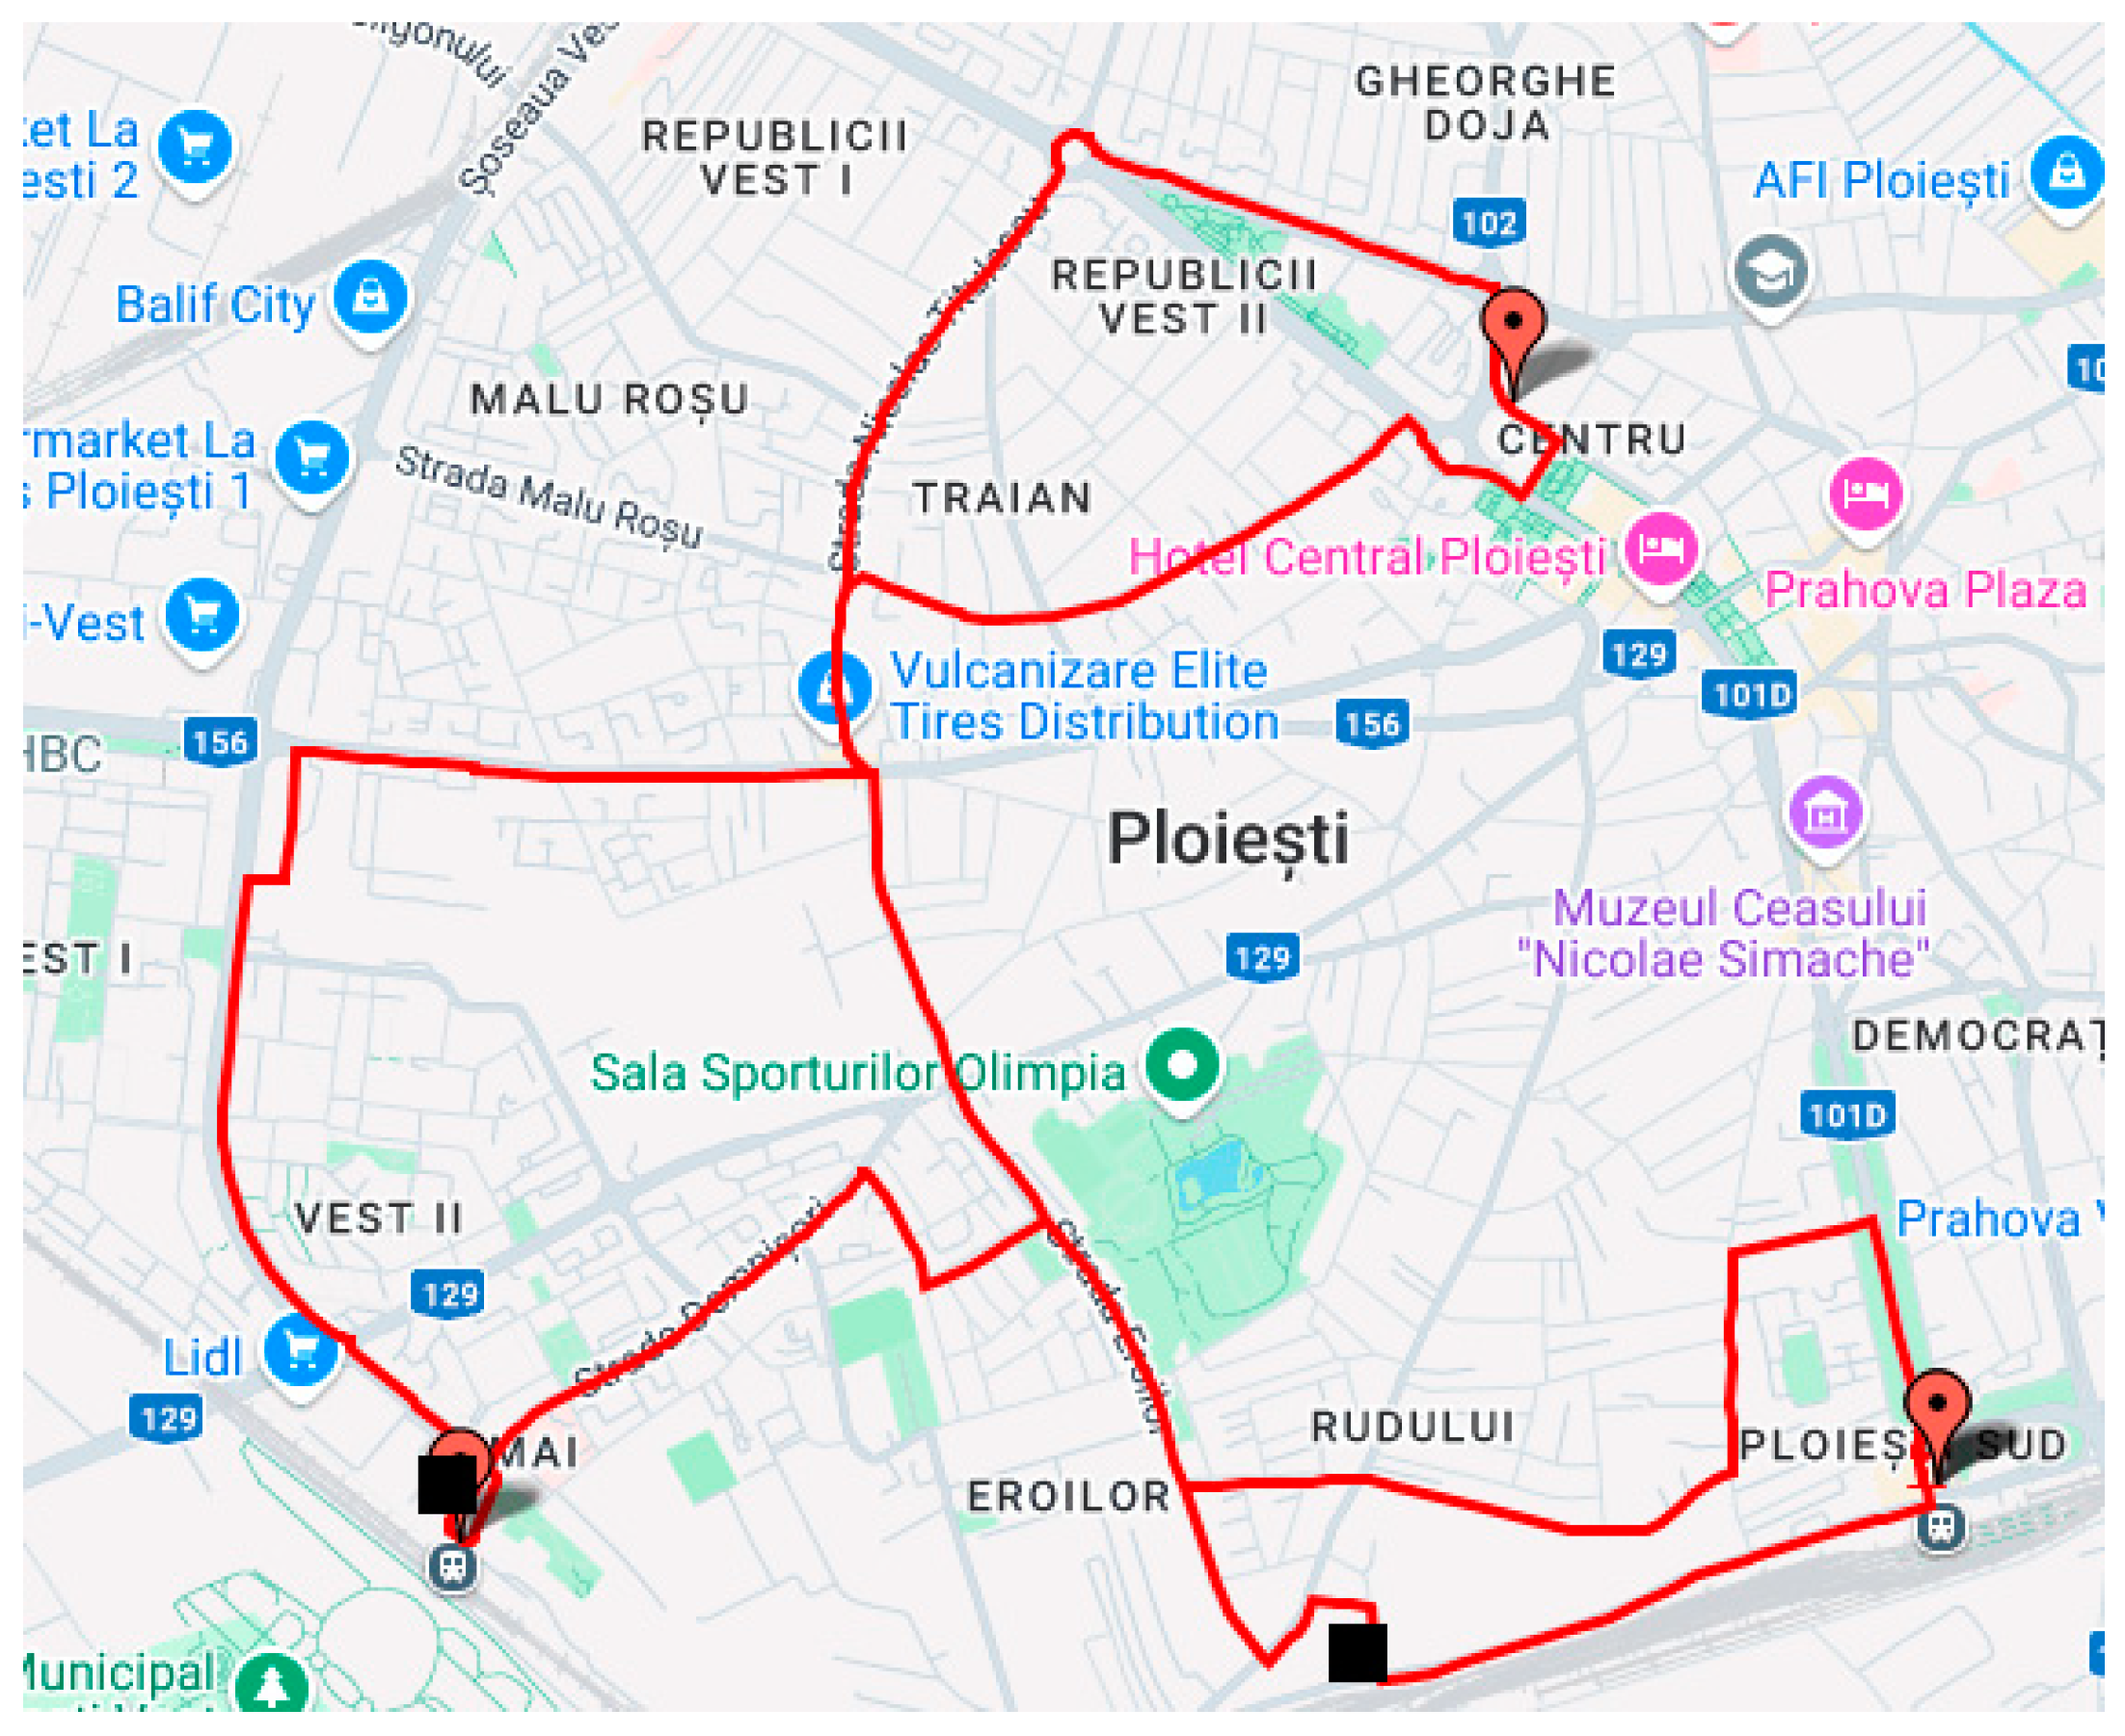
Disclaimer/Publisher’s Note: The statements, opinions and data contained in all publications are solely those of the individual author(s) and contributor(s) and not of MDPI and/or the editor(s). MDPI and/or the editor(s) disclaim responsibility for any injury to people or property resulting from any ideas, methods, instructions or products referred to in the content. |
© 2025 by the authors. Licensee MDPI, Basel, Switzerland. This article is an open access article distributed under the terms and conditions of the Creative Commons Attribution (CC BY) license (https://creativecommons.org/licenses/by/4.0/).