Article

Experimental Investigation on the Effects of Cutting Direction and Joint Spacing on the Cuttability Behaviour of a Conical Pick in Jointed Rock Mass

1
Department of Geotechnical Engineering Research, Korea Institute of Civil Engineering and Building Technology, 283 Goyangdae-ro, Ilsanseo-gu, Goyang-si 10223, Republic of Korea
2
Department of Energy and Resources Engineering, Chonnam National University, 77 Yongbong-ro, Buk-gu, Gwangju 61186, Republic of Korea
*
Author to whom correspondence should be addressed.
Appl. Sci. 2025, 15(8), 4347; https://doi.org/10.3390/app15084347
Submission received: 27 February 2025 / Revised: 8 April 2025 / Accepted: 14 April 2025 / Published: 15 April 2025
(This article belongs to the Special Issue Progress and Challenges of Rock Engineering)

Abstract

:
In this study, a series of rock cutting tests was conducted using a conical pick to investigate the effect of joints on roadheader performance. Tests were performed on intact rock and jointed rock mass specimens with three different joint spacings. The results indicate that cuttability is enhanced in jointed rock mass compared to intact rock due to the influence of joints on fracture mechanics. When cutting perpendicular to the joint plane, joints shorten the fracture path for rock chip formation, reducing the cutting force (FC). In parallel cutting, the joint plane acts as a barrier to side-crack propagation, leading to a further reduction in FC. The FC and specific energy (SE) were generally lower in parallel cutting than in perpendicular cutting. However, when the cutting depth exceeded 0.2 times the joint spacing and the line spacing surpassed 0.4 times the joint spacing, this trend reversed. This occurred because joints hindered the interaction between adjacent cuts, causing a transition to an unrelieved cutting mode. Additionally, FC and SE increased with joint spacing. When joint spacing reached ten times the cutting depth, their values approached those of intact rock. This suggests that the joint effect becomes negligible. These findings provide a better understanding of the effect of joints on roadheader performance.

1. Introduction

In South Korea, the main expressways in the Seoul metropolitan area have lost their intended functionality as they operate beyond their designed capacity. In most sections, severe traffic congestion makes it take nearly an hour to travel a short distance of about 30 km. However, conventional methods of expanding road capacity have become practically unfeasible because of extensive urbanization surrounding these expressways. Consequently, plans for the undergrounding of existing expressways have been under consideration. Currently, the South Korean government is promoting a total of four underground expressway projects, as illustrated in Figure 1. Among these, the project to underground the Gyeongbu Expressway (Hwaseong–Seoul) passed its preliminary feasibility study in the latter half of 2024 and is expected to commence construction in 2027.
The Hwaseong–Seoul Underground Expressway Project involves constructing a four- to six-lane road tunnel at a deep level across a 26.1 km stretch from Giheung IC to Yangjae IC, which will be an unprecedentedly large cross-section and ultra-long tunnel project. To successfully carry out this project, it will be essential to employ both conventional drill-and-blast methods and mechanical excavation in an appropriate manner, as well as to effectively respond to geological and geotechnical variations.
Joints are geological and geotechnical variables that influence the performance of mechanical excavators such as tunnel boring machines (TBMs) and roadheaders. In this context, various empirical prediction models for TBMs have considered parameters that represent joint density or frequency, such as rock quality designation (RQD), joint spacing, and volumetric joint count [1,2,3,4,5,6]. Among the empirical models for predicting roadheader performance, some have also included RQD as a parameter to reflect the influence of joints [7,8,9]. However, Dibavar et al. [10] emphasized that only RQD is not sufficient to describe the properties of jointed rock masses, which could lead to inaccurate results from these models. To overcome this, they proposed a model that considers additional factors such as the strike and dip of joints and joint aperture.
Numerous researchers have investigated the effects of joint orientation, which is defined as the angle between the tunnel axis and the joint plane, and spacing on TBM performance using numerical simulations. Gong et al. [11] and Gong et al. [12] numerically investigated crack propagation and chip formation in jointed rock masses with varying joint orientations and spacings. They found that crack propagation and rock fragmentation in jointed rock occur in two modes. Bejari and Khademi Hamidi [13] conducted numerical simulations considering both joint spacing and orientation. The results showed that cutting efficiency improves as joint spacing decreases and is maximized when the joint orientation is 60°. To better understand the interaction between disc cutters and jointed rock masses, Choi and Lee [14] and Xue et al. [15] conducted numerical simulations of the rock cutting process. Furthermore, Afrasiabi et al. [16] simulated TBM cutterhead excavation in jointed rock masses and analyzed the influence of joint spacing and orientation.
Laboratory test methods have also been used to investigate the impact of joints on the cuttability of TBM. Yin et al. [17] studied the impact of joint spacing on rock fragmentation using full-size LCM tests, considering only cases where the joint plane was perpendicular to the direction of penetration. The results showed that smaller joint spacing significantly reduces the required normal force compared to intact rock. When the spacing between the cutting surface and the joint plane is smaller than a critical value, the rock fragmentation is dominated by the joint. Rolling indentation abrasion tests (RIATs) have also been employed to analyze the effects of joints on TBM performance. Yang et al. [18] investigate the impact of joint orientation and spacing on rock fragmentation mechanisms using RIATs. They found that a joint orientation of about 30° is optimal for boring, and thrust increases and torque decreases as joint spacing increases. Similarly, Yang et al. [19] used the RIAT to investigate the effects of joint orientation and spacing on TBM rock cutting efficiency and cracking behaviour. The experimental results showed that the optimal rock cutting conditions are achieved with smaller joint spacings and joint orientations between 45° and 60°. In a similar vein, indentation tests provide another effective approach for understanding the impact of joints on TBM performance. Liu et al. [20] analyzed the impact of joint orientation on breakage behaviour using indentation tests, reporting that joint orientation could change the relative magnitudes of tensile and shear stresses along the trajectories of median cracks. Song et al. [21] conducted disc cutter indentation tests with joint spacing, joint orientation, and cutter spacing as variables, and found that rock breaking efficiency is highest when the joint orientation is 60°. Liu et al. [22] investigated the rock breaking mechanisms of disc cutters with different joint shear strengths.
Rock cutting with disc cutters predominantly involves compressive fracturing induced by normal force, while drag picks primarily tear off rock through cutting force. Due to this difference, the effect of joints on the cuttability of conical picks equipped with roadheaders may differ from that on disc cutters. However, while some researchers have investigated the effect of joint orientation on the cuttability of drag picks using numerical simulations [23,24], studies on how joint properties affect roadheader performance remain limited.
In this study, an experimental approach was employed to investigate the effect of joints on roadheader performance. A series of laboratory-scale LCM tests was conducted on both jointed rock mass specimens and intact rock specimens using a conical pick. The joint rock mass specimens were prepared with joint spacings of 30 mm, 60 mm, and 90 mm, with the joint orientation fixed at 90°. Cutting tests were performed at various cutting depths and line spacings, considering both parallel and perpendicular cutting directions relative to the joint plane. The cuttability of the conical pick was then analyzed based on these conditions.

2. Experimental Methodology

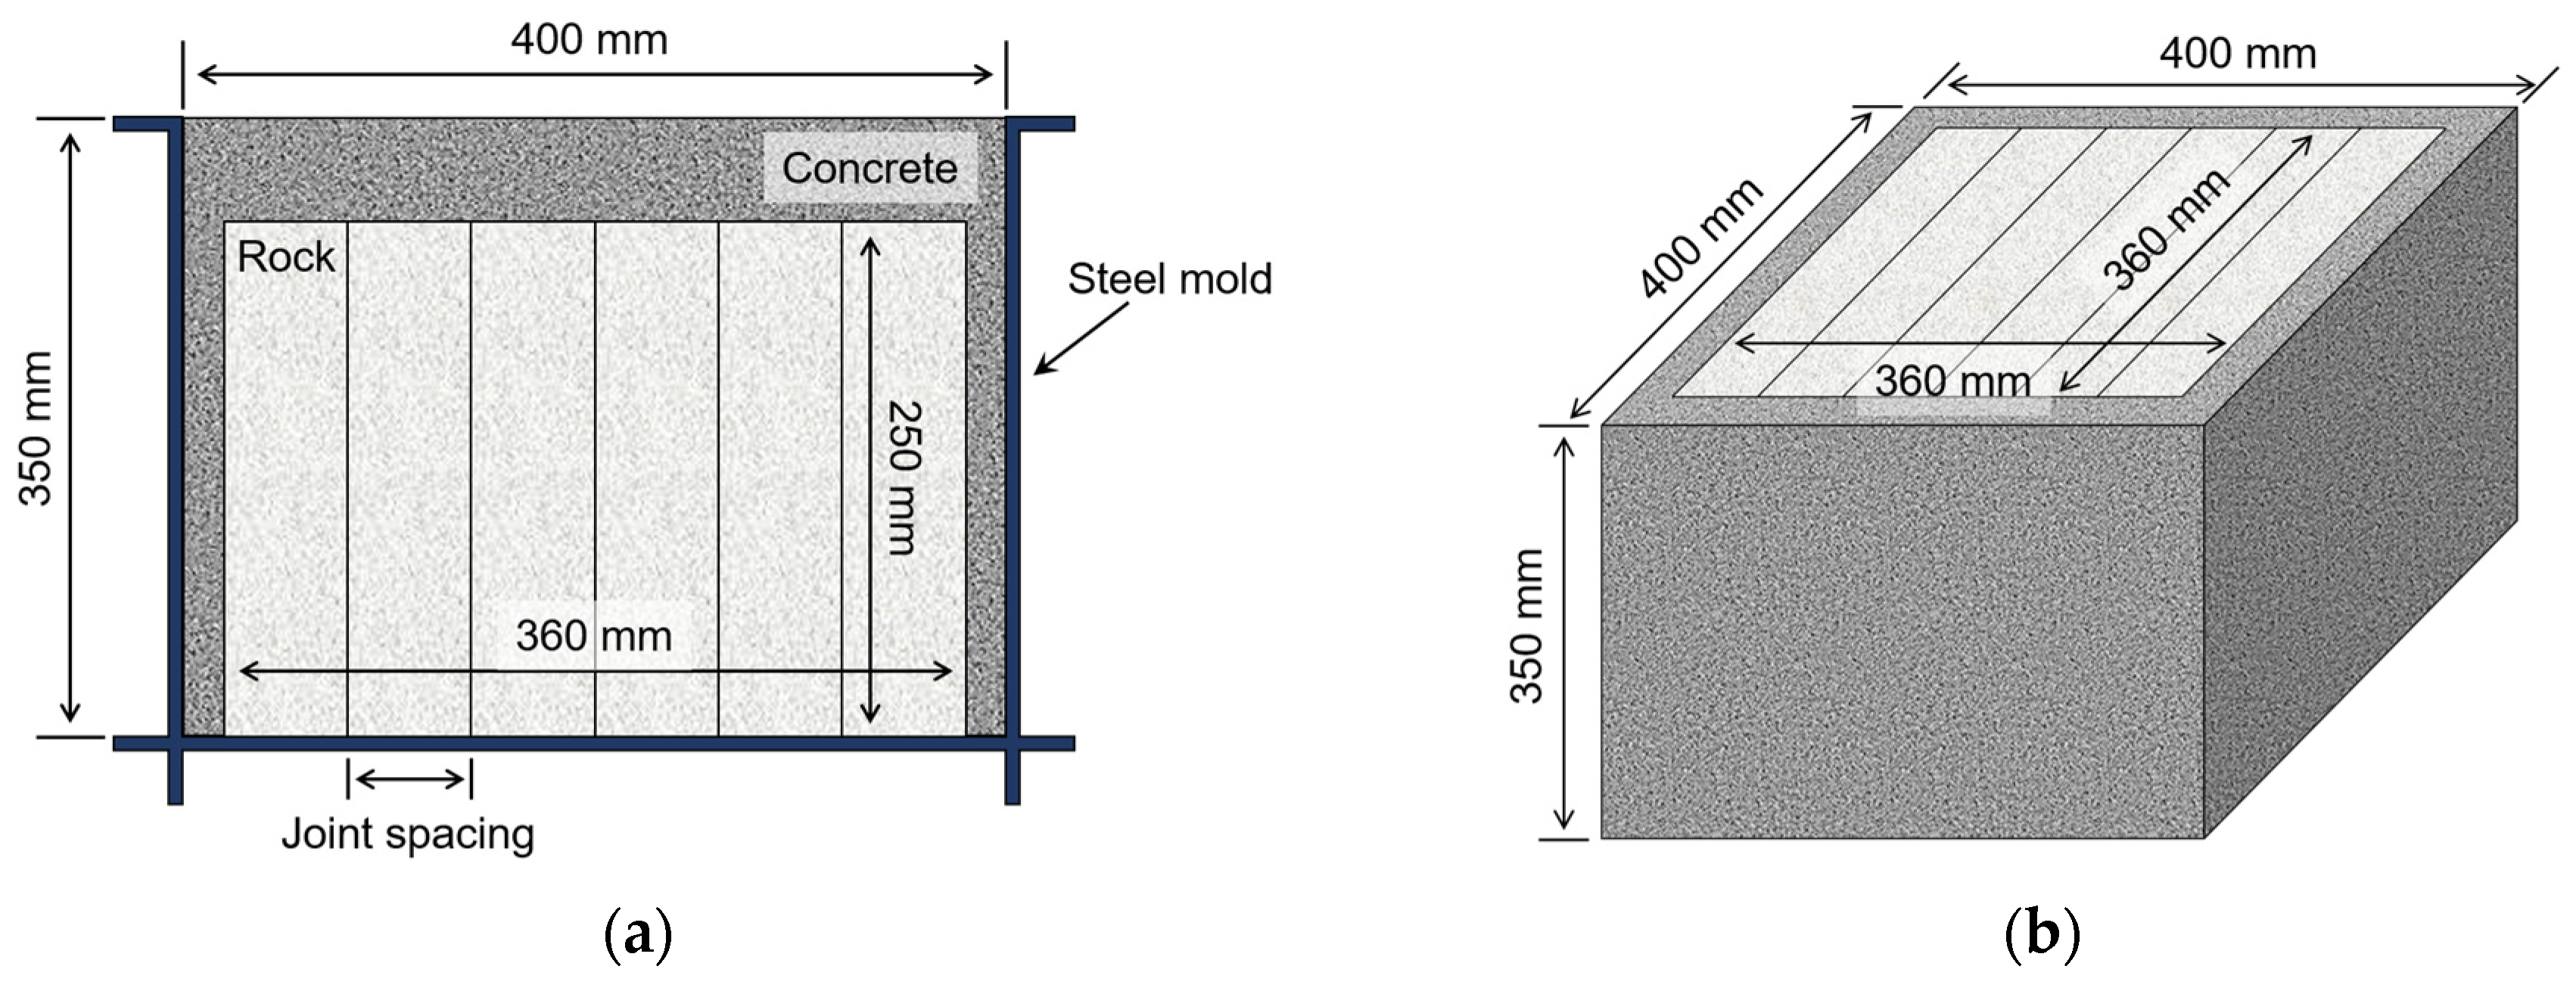
2.1. Preparation of Jointed Rock Mass Specimens

The rock employed in this experiment is Finike limestone, a medium-strength calcareous sedimentary rock from Finike, southern Turkey. The rock samples were prepared by cutting Finike limestone, which is free from bedding planes and joints, into dimensions of 360 mm × 360 mm × 250 mm. To simulate a jointed rock mass, some samples were further subdivided into blocks of uniform thickness. For instance, to represent a joint spacing of 30 mm, one sample was cut into 12 blocks, each measuring 360 mm × 250 mm × 30 mm. Similarly, for joint spacings of 60 mm and 90 mm, samples were cut into 6 blocks (360 mm × 250 mm × 60 mm) and 4 blocks (360 mm × 250 mm × 90 mm), respectively. Each set of blocks was bound together by cement mortar with a thickness of 2 mm, as in previous studies [21,22], to form an artificial jointed rock mass. The jointed rock mass specimens were fabricated by placing the artificial jointed rock mass in a steel mould and filling the surrounding space with concrete (Figure 2). Similarly, the intact rock specimen was fabricated using the same method.
The mechanical properties of the Finike limestone, concrete, and cement mortar are detailed in Table 1. The uniaxial compressive strength (σc), the elastic modulus (E), and Poisson’s ratio (ν) were determined according to ASTM D7012-14 [25]. Additionally, tensile strength (σt) and density (ρ) were determined using the methods recommended by ASTM D3967-08 [26] and ASTM C97/C97M-15 [27], respectively.
It should be noted that the strength of the cement mortar used to form the artificial joint plane is significantly lower than that of the Finike limestone. This indicates that the jointed rock mass specimens in this experiment adequately represent joint rock mass in nature. Moreover, the properties of joint planes are consistent across all specimens. Therefore, the effects of joint roughness and joint strength on cuttability can be disregarded.

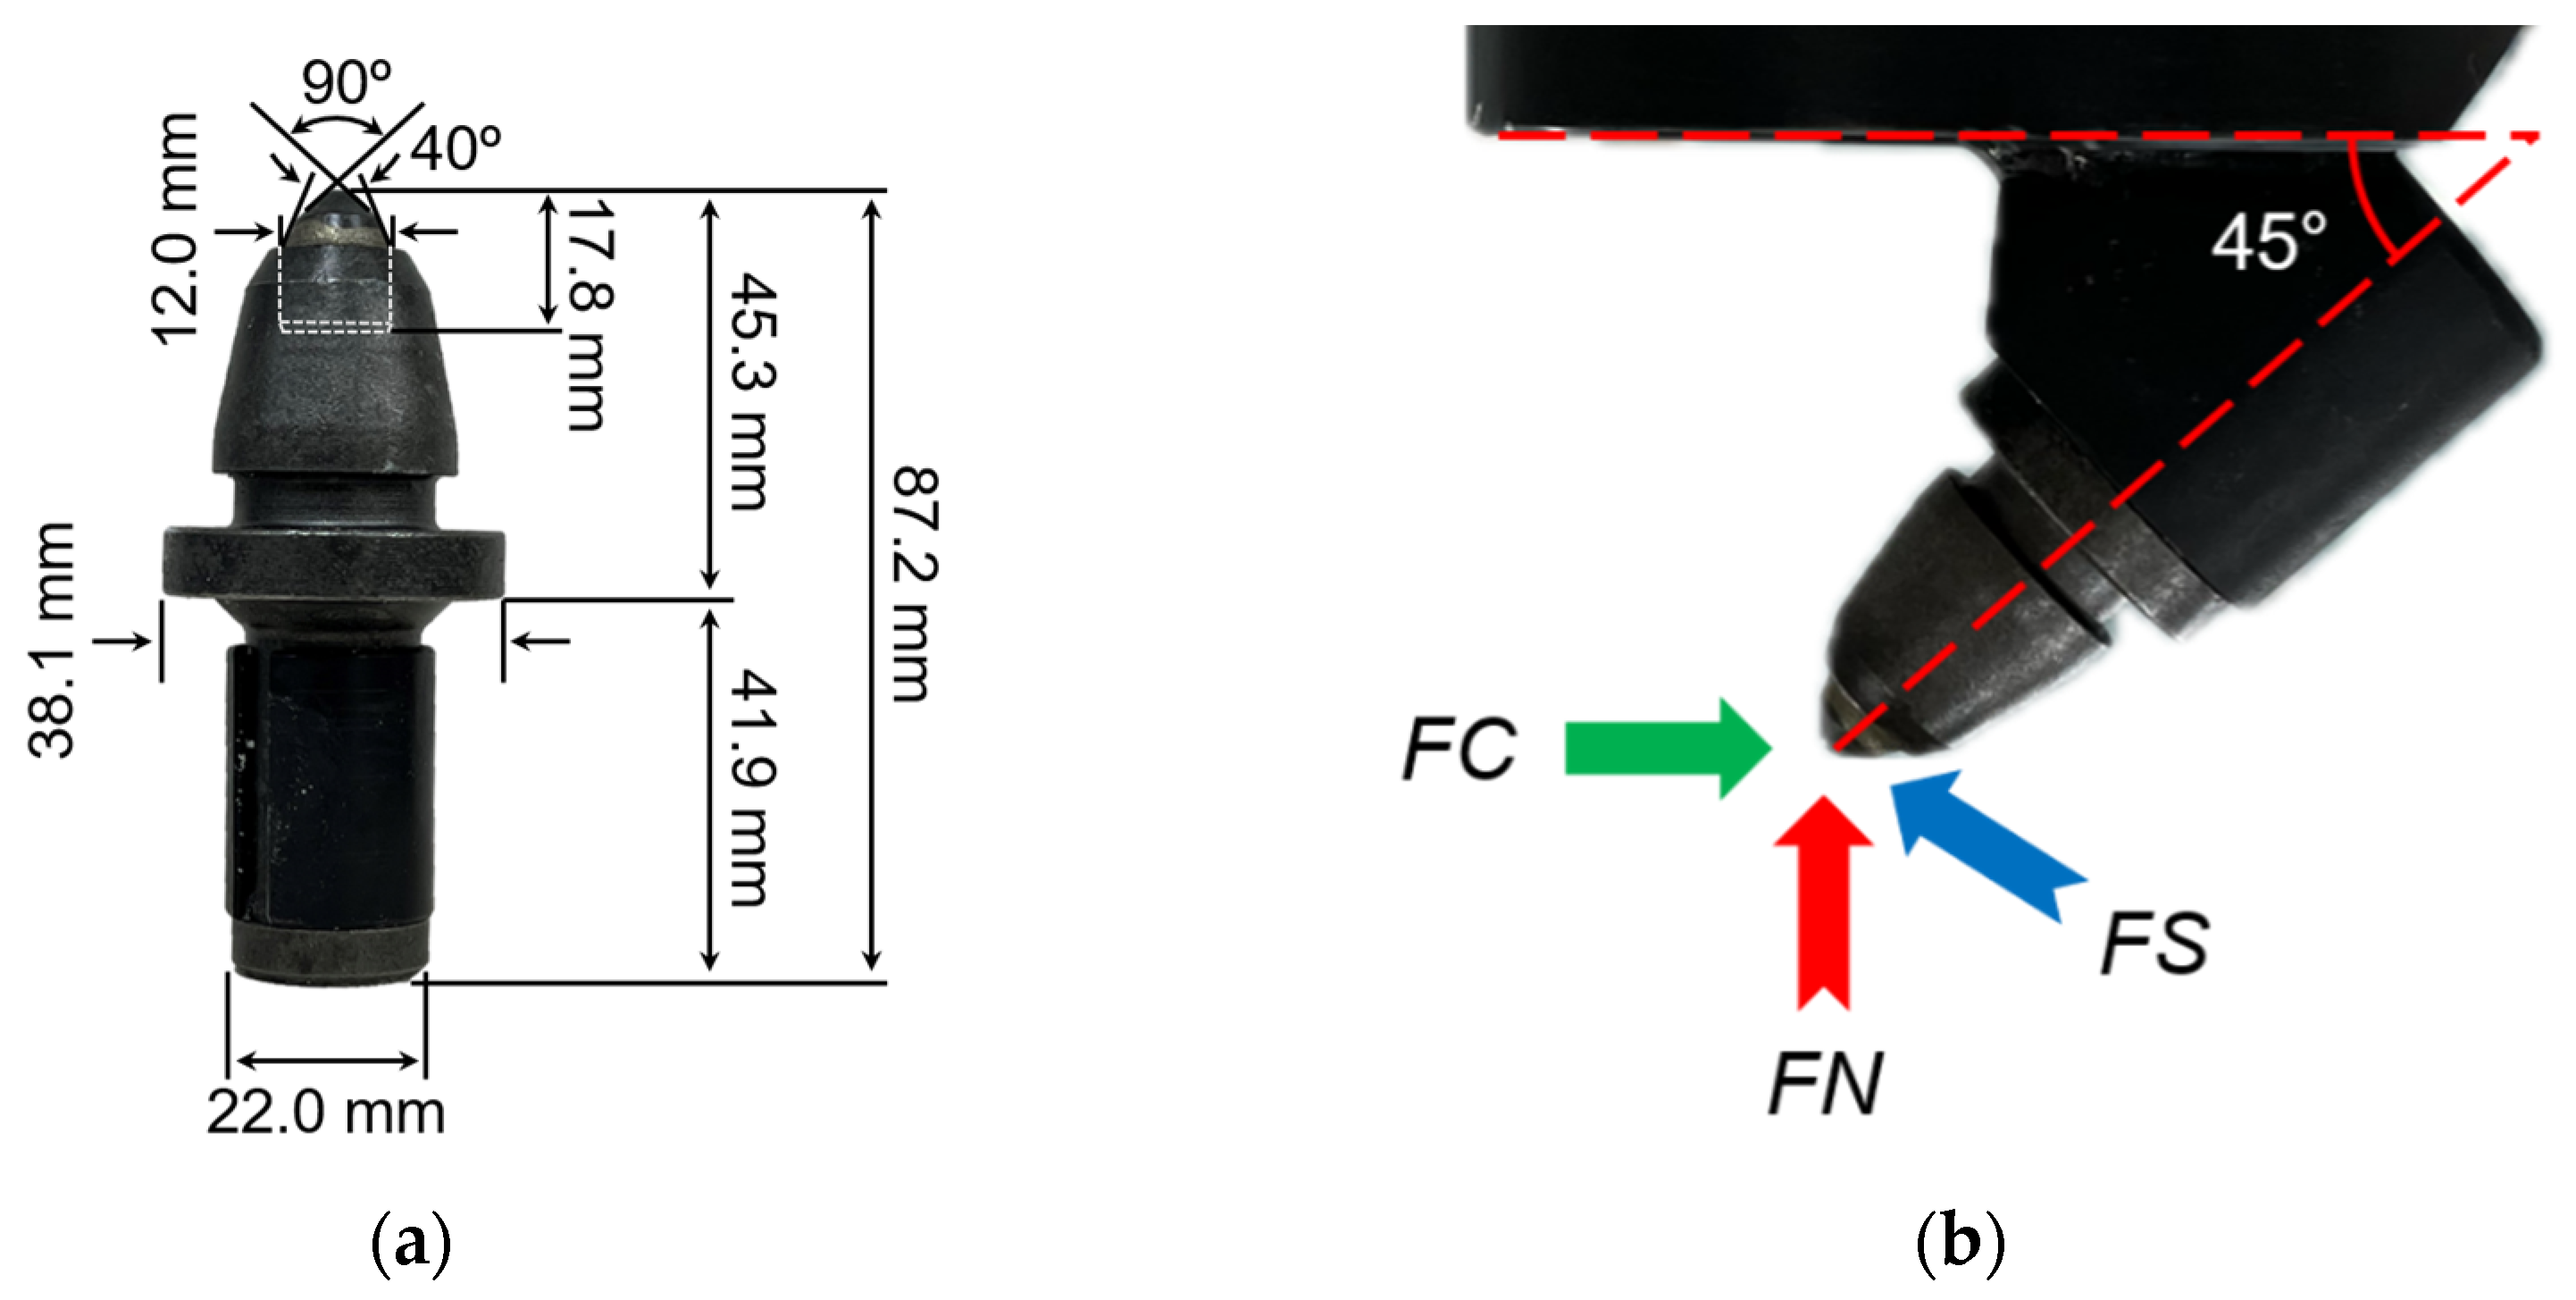
2.2. Laboratory-Scale Linear Cutting Machine and Cutting Tool

Figure 3 shows the laboratory-scale LCM employed in this experiment. This LCM operates electronically and includes a rock box that can hold the rock specimens. The rock box is positioned using two servo motors. The x-axis servo motor moves the rock box to adjust the line spacing with a stroke of 500 mm, while the y-axis servo motor shifts the rock box to execute the cutting operation with a stroke of 700 mm. In addition, the z-axis servo motor moves the saddle vertically to adjust the cutting depth. Tool forces acting on the conical pick during cutting are measured by three load cells installed along three orthogonal axes. The x-axis load cell measures the side force (FS), while the y-axis and z-axis load cells measure the cutting force (FC) and normal force (FN), respectively, with data collected at a rate of 10 Hz. Cutting parameters, including cutting depth and line spacing, are set using the control box. Tool forces are displayed in real time on a monitor and concurrently recorded in CSV format.
In the experiment, the cutting tool employed was the conical pick manufactured by Kennametal Inc. (Pittsburgh, PA, USA), model SM06. This pick has a tip angle of 90°, and the pick gauge and shank lengths are 45.3 mm and 41.9 mm, respectively. The detailed specifications of the conical pick are shown in Figure 4a. The attack angle was consistently set at 45° for all tests, as shown in Figure 4b, with both the skew and tilt angles set at 0°.

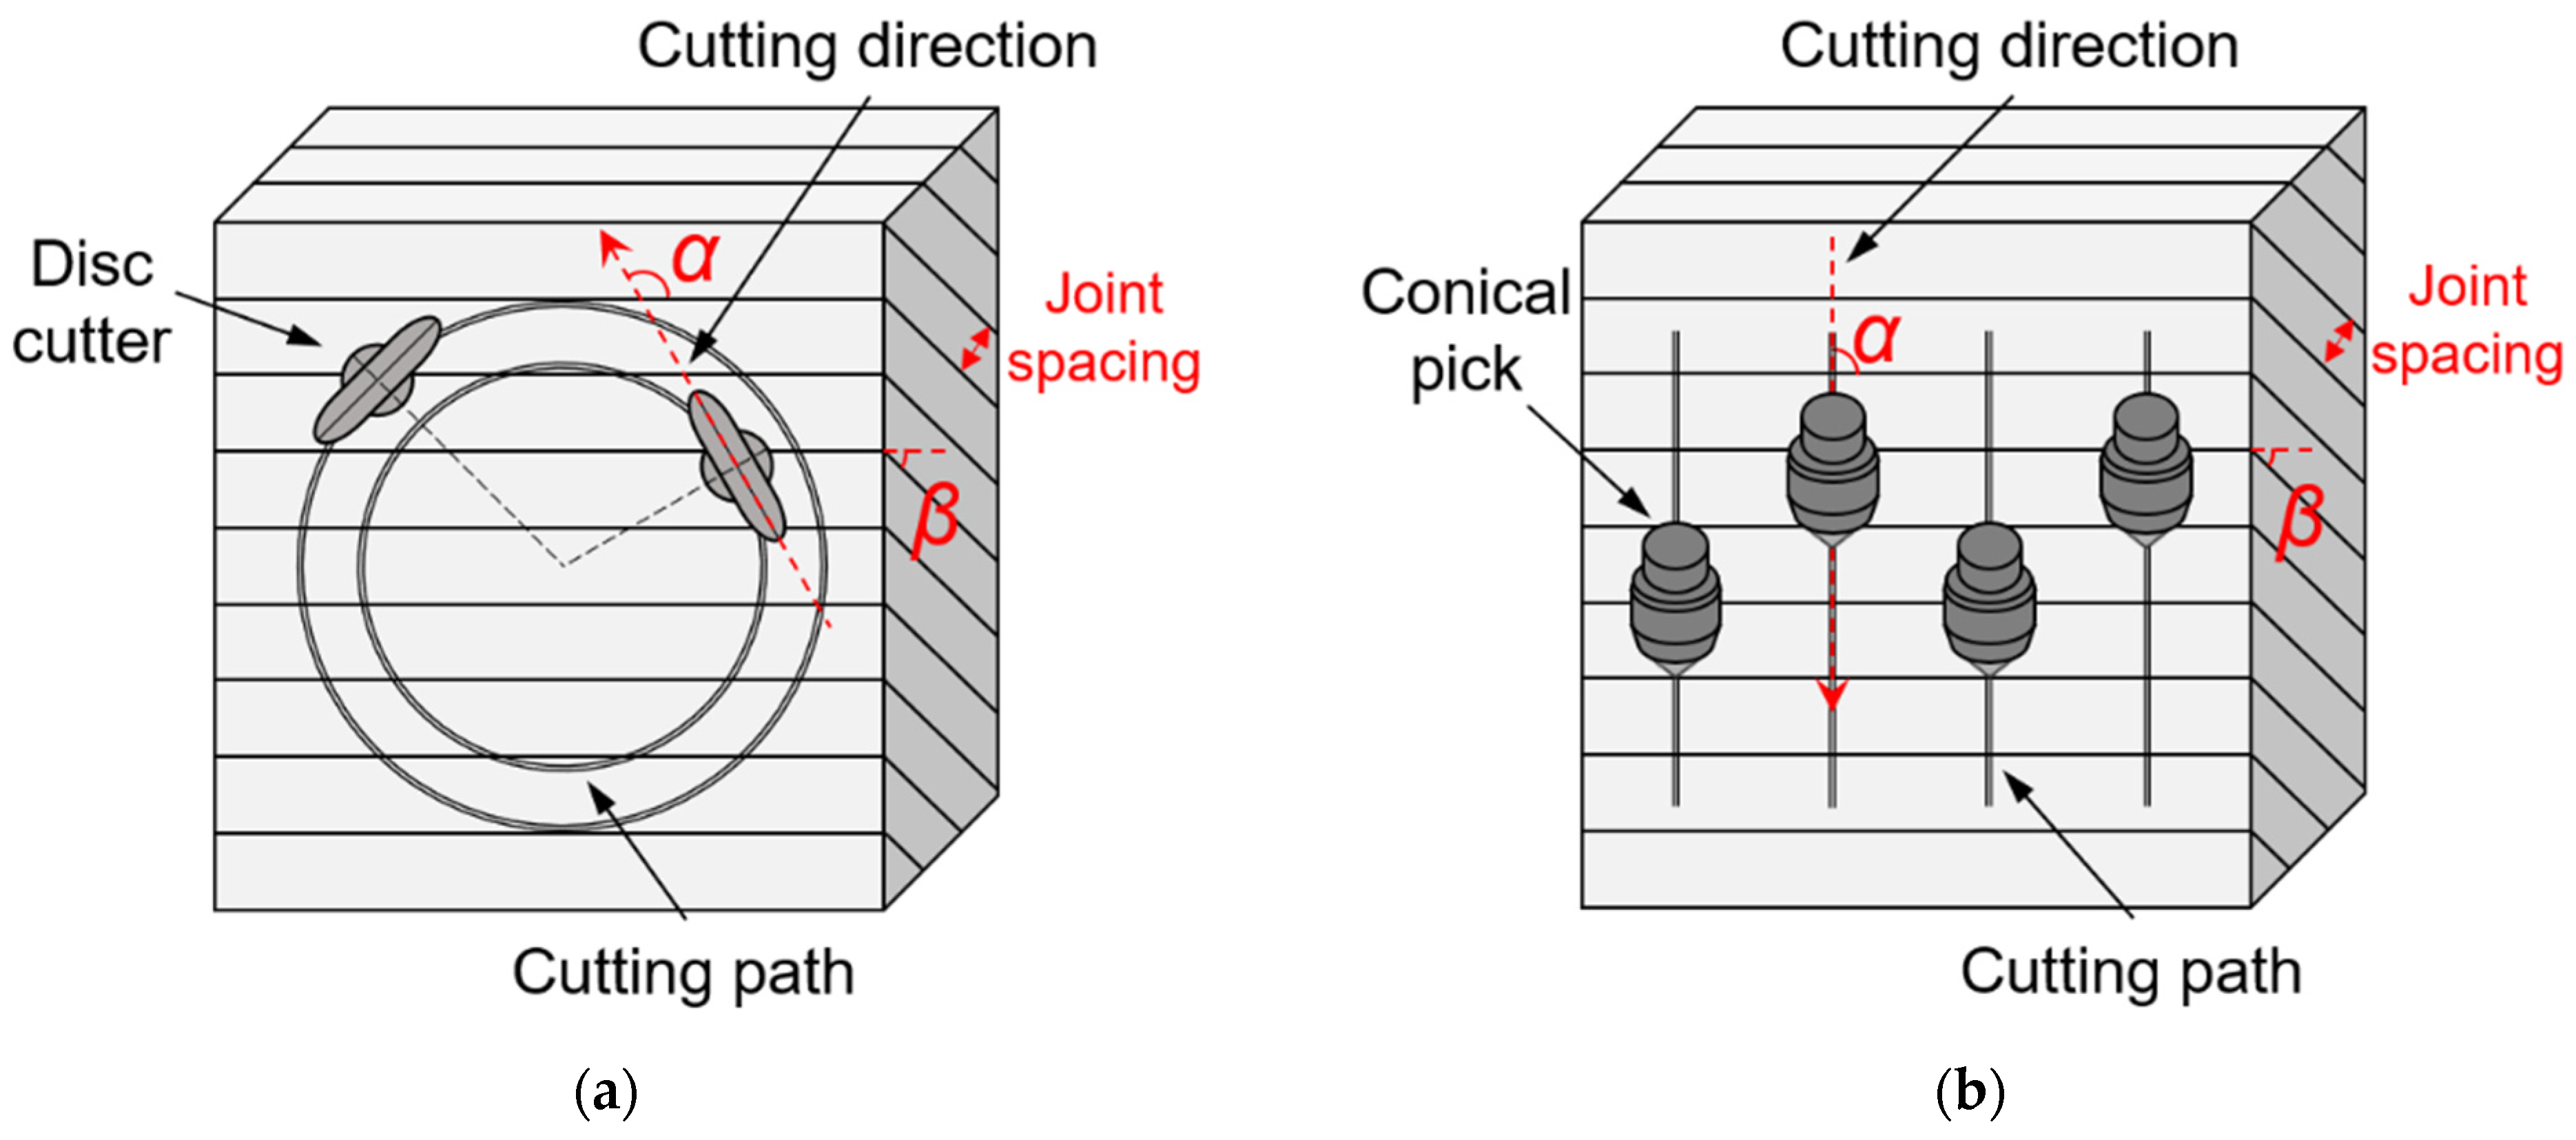
2.3. Experimental Procedure

In the excavation of jointed rock mass by mechanical excavators, the performance of excavator is influenced by the angle between the cutting direction and the joint plane (α in Figure 5), the angle between the tunnel axis and the joint plane (β in Figure 5), and the joint spacing [11,28]. For TBMs, as the disc cutter moves along the cutting path, the α instantaneously varies between 0° and 90° (Figure 5a). Moreover, Howarth [29] and Sanio [30] indicate that the effect of α on TBM performance is not obvious from experimental investigations. Therefore, in the TBM excavation of jointed rock mass, only β and joint spacing are considered. In contrast, α remains constant during excavation for roadheaders (Figure 5b). Therefore, α is expected to be a factor that influences roadheader performance.
Therefore, a series of rock cutting tests were conducted on joint rock mass specimens considering 2 different α angles, and tests were also performed on an intact rock specimen. The cutting depth was set to 3 to 12 mm, depending on the specimen. Line spacing was adjusted between 3 and 60 mm, depending on cutting depth, so that the ratio of line spacing to cutting depth (s/p) ranged from 1 to 6. The details of experimental cutting parameters are listed in Table 2. For any given cutting depth and line spacing, the cutting test was composed of at least five cuts to minimize errors. When conducting cutting tests in a direction parallel to the joint planes (α = 0), the cutting test was initiated at the midpoint between adjacent joint planes. The number of cuts was then adjusted so that the cutting tool would cross at least one joint plane and extend to the midpoint between the next pair of joint planes. In all cutting tests, the cutting speed was fixed at 30 mm/s, ensuring that the influence of cutting speed was not a variable in this study.

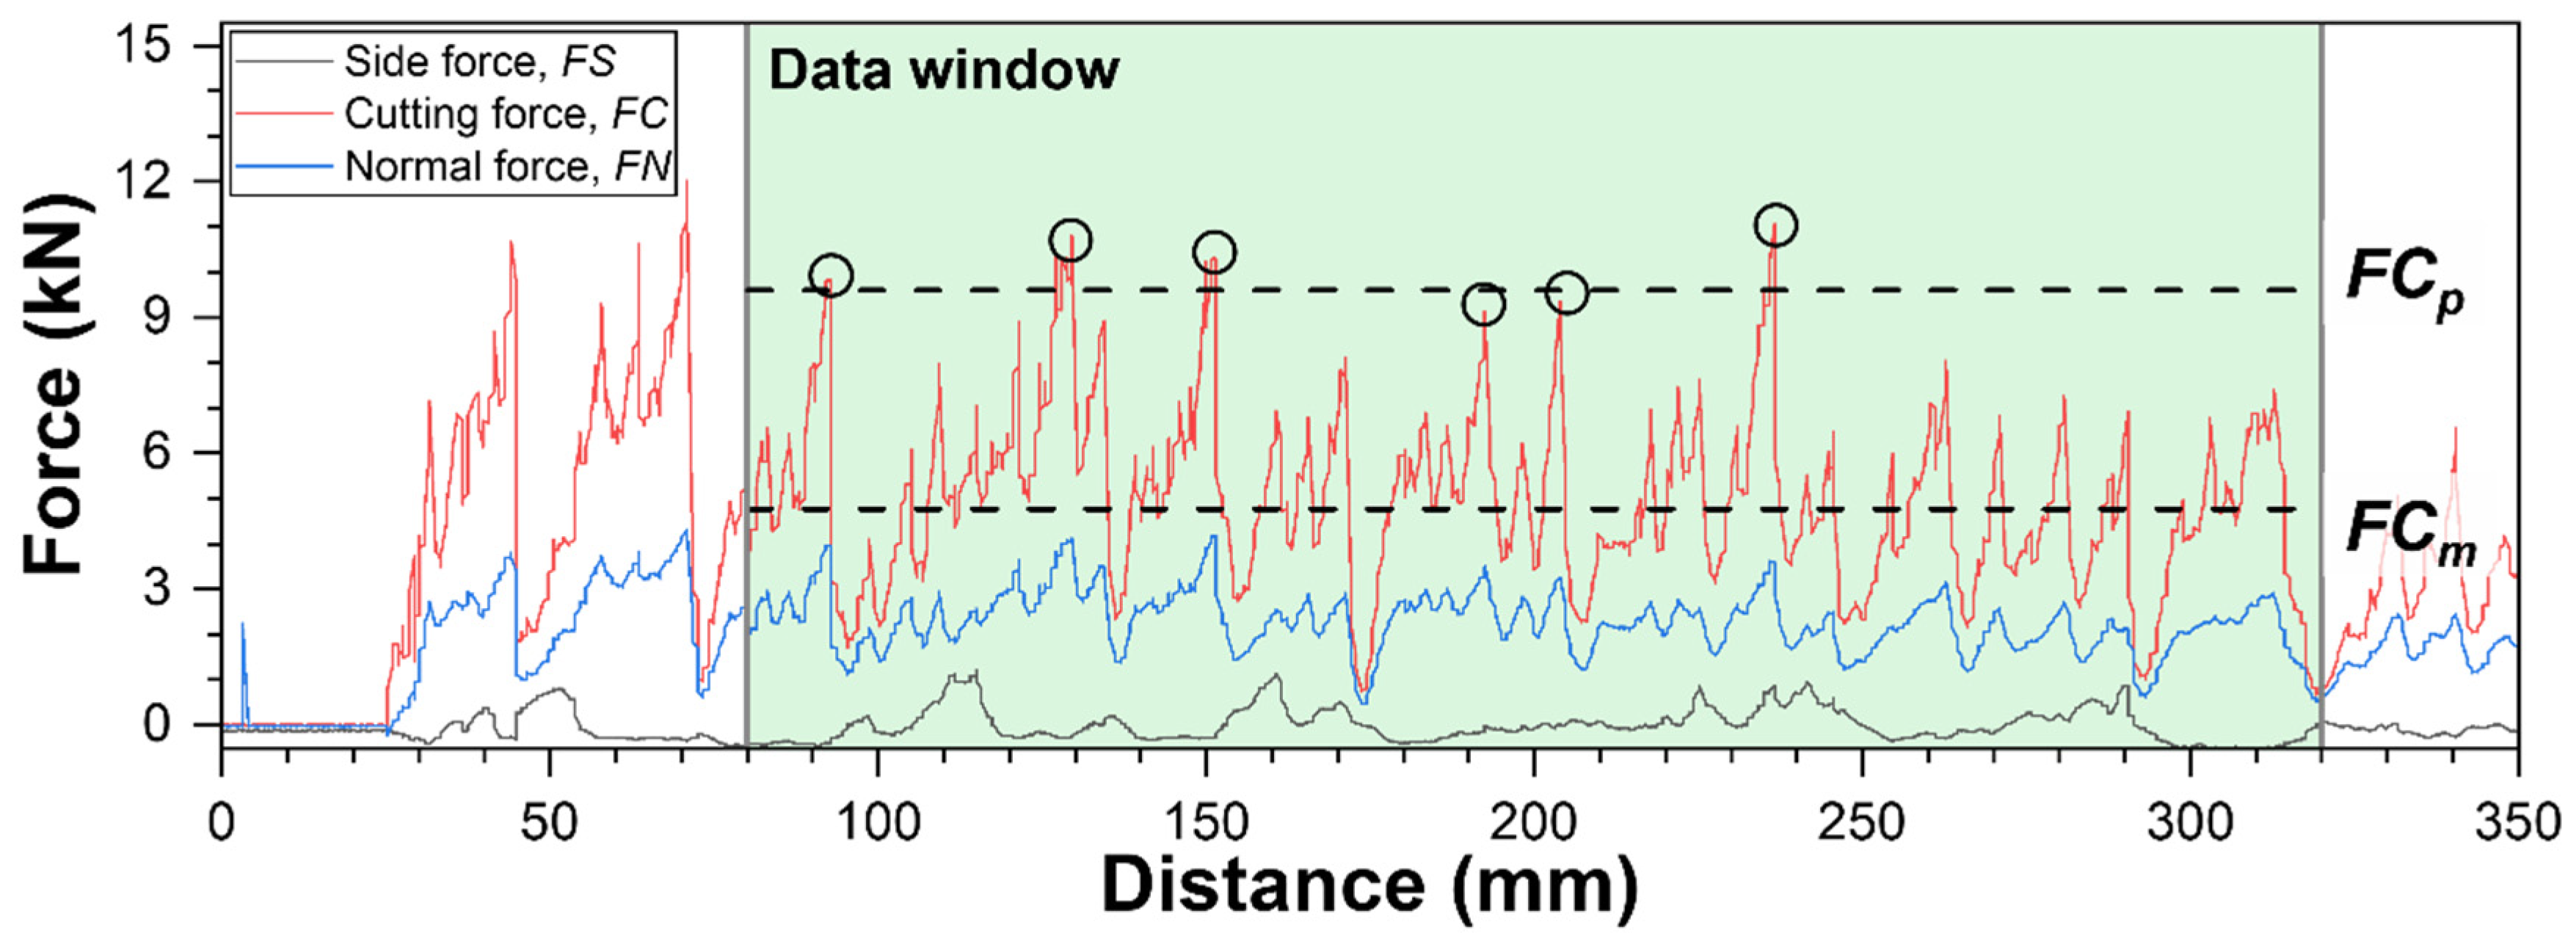
2.4. Data Processing

To investigate the effects of cutting direction and joint spacing on cuttability by a conical pick, the experiment focused on the variations in FC and SE. The tool forces measured during a single cut in the test are recorded, as shown in Figure 6. The red line represents FC, while the blue and black lines indicate FN and FS, respectively. To eliminate results from concrete cutting and excessive crushing at the beginning and end of the cutting process, only the data recorded within the data window (green box in Figure 6) were utilized. The mean cutting force (FCm) was calculated by averaging the FC values, and the peak cutting force (FCp) was determined by averaging the peak FC values recorded within the data window.
The cutting efficiency is evaluated using SE, which refers to the energy consumed to excavate a unit volume. A high SE indicates that more energy is required to remove a given volume of rock. SE in MJ/m3 is calculated as follows:
S E = W V = 100   ×   F C m   ×   L   ×   ρ M
where W denotes the work or energy to cut the rock (MJ), V is the cutting volume (mm3), FCm is the mean cutting force (kN), L is the cutting length (mm), ρ is the density of the rock (g/cm3), and M is the mass of the rock debris (g).
It is noted that L is defined as the distance from the start to the end of the data window. Furthermore, the rock debris used to calculate V was collected only from the portion of the specimen corresponding to the data window.

3. Experimental Results and Discussion

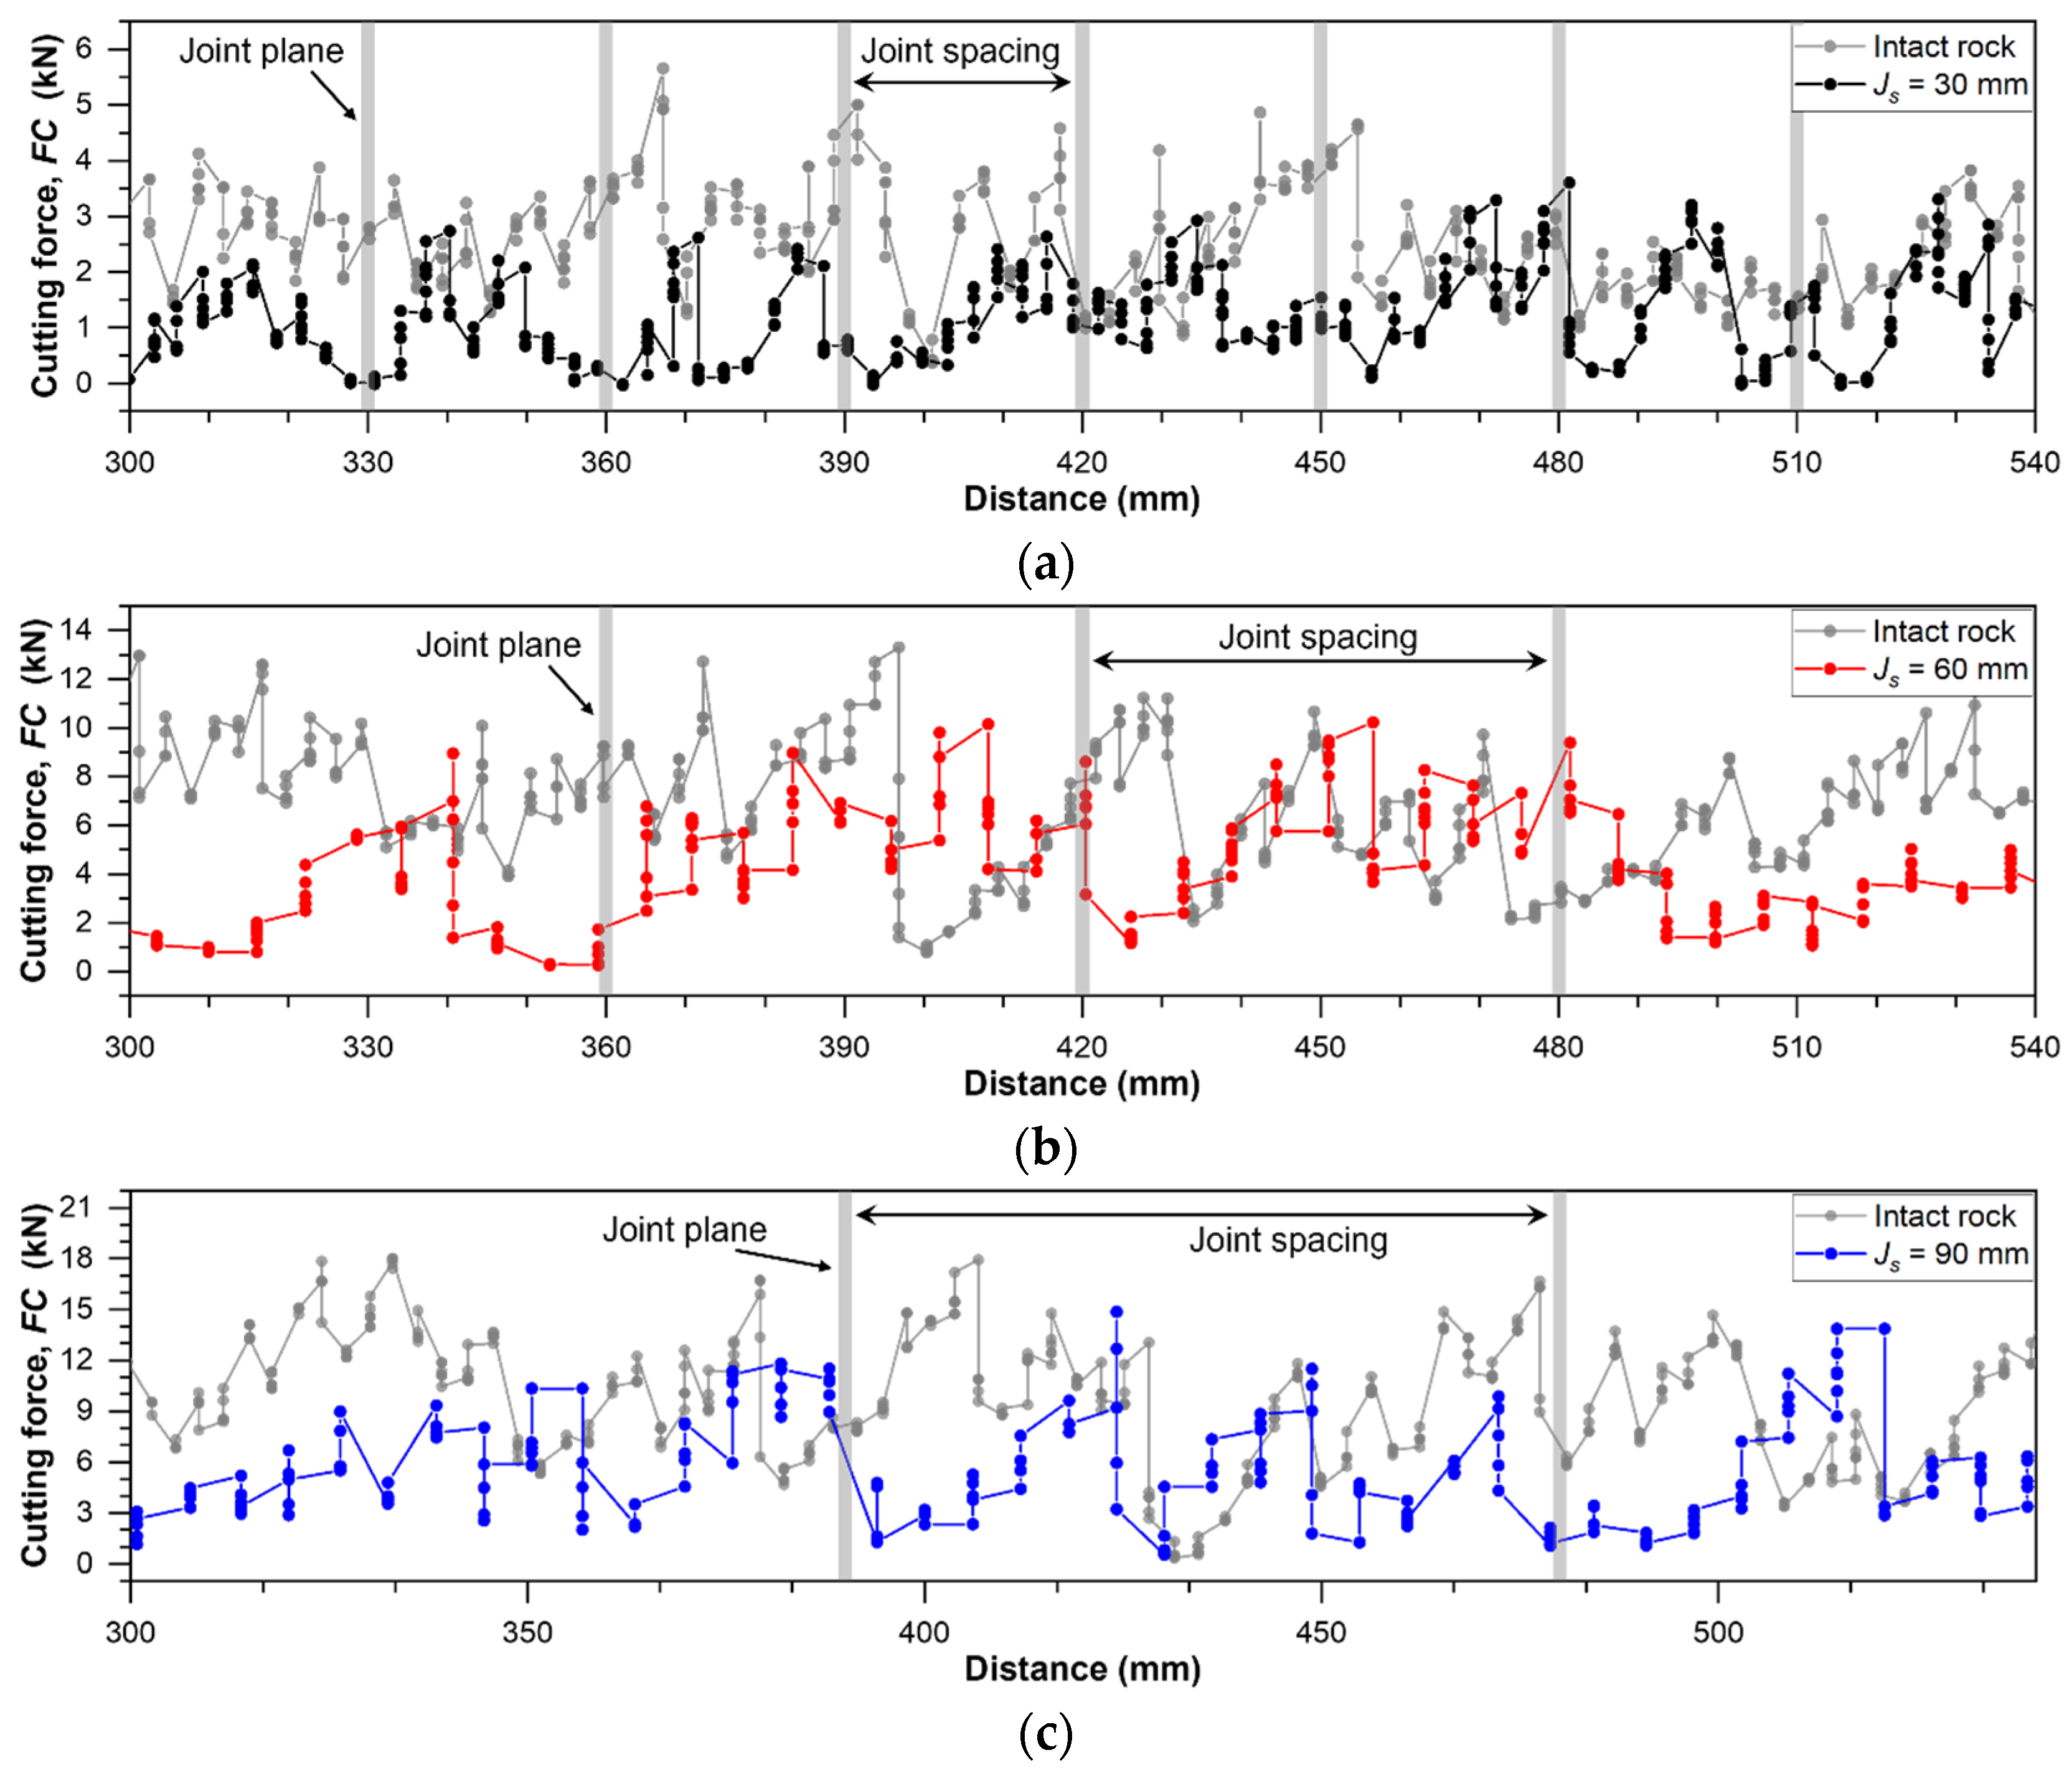
3.1. Characteristics of Cutting Force in Jointed Rock Mass

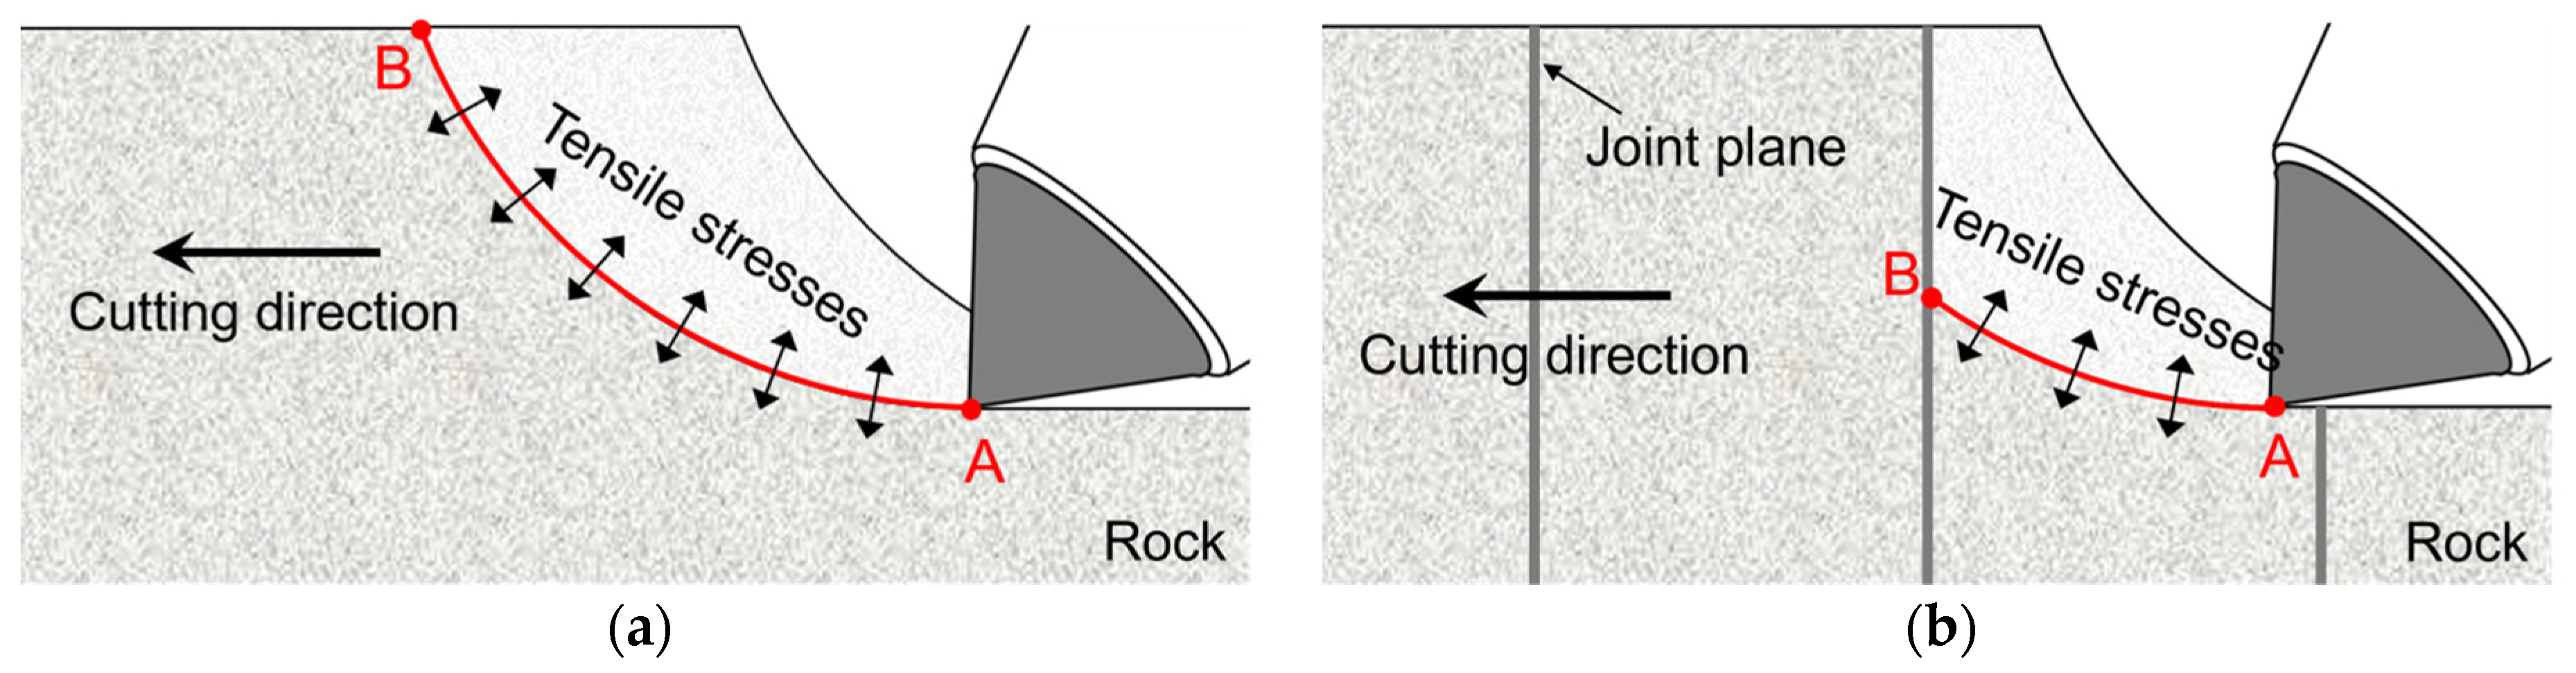
3.1.1. Cutting Force in the Direction Perpendicular to the Joint Plane

The variation in the cutting force with cutting distance for intact rock and jointed rock mass specimens, when the cutting direction is perpendicular to the joint plane (α = 90°), is shown in Figure 7. Figure 7a illustrates FC in a single cut within a series of cuts performed with a cutting depth of 3 mm and a line spacing of 9 mm on an intact rock and a jointed rock mass specimen with a joint spacing of 30 mm. For the jointed rock mass specimens, FC increased to a maximum of approximately 3 kN during the cutting process and then decreased to nearly zero, exhibiting a consistent cycle. Additionally, FC approached zero near the joint planes, and this cycle had a length of approximately 30 mm, corresponding closely to the joint spacing. In contrast, for the intact rock specimen, FC peaked at about 5 kN, but no distinct periodic pattern was observed. Figure 7b shows the cutting force with a cutting depth of 6 mm and a line spacing of 18 mm. In the jointed rock mass (Js = 60 mm), it also exhibited a periodic variation with a cycle of approximately 60 mm, fluctuating between a maximum of about 9 kN and nearly 0. It can be observed from Figure 7c that similar behaviour occurs in cutting on jointed rock mass with a joint spacing of 90 mm (p = 9 mm and s = 24 mm).
This behaviour of FC can be explained through the rock chip formation process. In rock cutting, the cutting force exhibits some repetitive patterns as it builds up to a peak, then drops, and builds up again [31]. Rock chips tear off as soon as these sudden drops occur [32]. Figure 8 depicts rock chip formation in both intact rock and jointed rock mass based on the theory by Evans [33]. As seen in Figure 8a, in intact rock, the fracture path required for rock chip formation extends from the tip of the pick to the free surface of the rock. Here, the peak value of FC required for rock chip formation can be calculated as follows:
F C = L AB × σ t
where LAB is the length of the path from point A to point B.
On the other hand, in jointed rock mass (Figure 8b), rock chips are generated once the fracture path reaches the joint plane. This suggests that in jointed rock mass, the fracture path is restricted by the joint spacing. As a result, LAB is reduced, ultimately leading to a decrease in FC. This phenomenon can be observed in Figure 9. Consequently, FC peaks are lower in jointed rock mass than in intact rock and exhibit periodic variations corresponding to the joint spacing.

3.1.2. Cutting Force in the Direction Parallel to the Joint Plane

Figure 10 shows the FCm of each cut with respect to the distance from the initial midpoint between the joint planes in a series of cuts, extending to the midpoint of the next joint plane, under cutting conditions of a 6 mm cutting depth and a 6 mm line spacing. Regardless of the joint spacing, FCm near the midpoint between joint planes remained similar, ranging from approximately 2 to 2.5 kN. As the distance from the midpoint increased, FCm gradually decreased. For a joint spacing of 30 mm, FCm reached a minimum value of 0.87 kN at a distance of around 18 mm, then increased to 2.95 kN at 30 mm. Similarly, for a joint spacing of 60 mm, FCm reached a minimum of 1.14 kN at 30 mm and increased to 3.03 kN at 60 mm. In the case of a joint spacing of 90 mm, FCm reached a minimum of 1.01 kN at 42 mm. It is noted that FCm reached its minimum of approximately 1 kN near the joint planes, while at the next midpoint, FCm increased to about 3 kN, which is comparable to the FCm in intact rock.
The variation in FCm with respect to the distance between joint planes can be explained by the influence of joint planes on crack propagation. Many studies have found that joint planes act as physical barriers to crack propagation, causing the crack growth to either stop at the joint plane or change direction [11,20,21,34]. Assuming all cracks induced by the conical pick result from tensile fracture, the results are represented as shown in Figure 11. When the joint spacing is sufficiently large and the conical pick cuts at the midpoint between joint planes, cracks develop similarly to those in intact rock, as shown in Figure 11a. The FC required to initiate crack formation can be simply expressed as follows:
F C = ( C m + C s 1 + C s 2 )   ×   σ t
where Cm is the length of the median crack and Cs1 and Cs2 are the lengths of the side cracks.
On the other hand, when cutting near a joint plane (Figure 11b), cracks propagating from the conical pick toward the joint plane are blocked by the joint plane. This indicates that Cs2 becomes shorter, which can be observed in Figure 12. Consequently, total crack length becomes shorter compared to the case in Figure 11a, ultimately leading to a reduction in FC.

3.2. Effect of Cutting Direction and Joint Spacing on Cutting Performance

In jointed rock mass excavation, joint spacing is one of the key factors influencing the performance of mechanical excavators. Additionally, in the case of roadheaders, where the cutting direction remains constant during excavation, the angle between the joint plane and the cutting direction also acts as a factor affecting performance. In this study, the influence of cutting direction and joint spacing on the cuttability of a conical pick was investigated, focusing on FCm, FCp, and SE. Additionally, the variation in the optimal ratio of line spacing to cutting depth (s/popt), where cutting efficiency is maximized, was observed in relation to cutting direction and joint spacing. The results of the rock cutting tests are listed in Table 3, Table 4, Table 5 and Table 6.

3.2.1. Effect of Cutting Direction

Figure 13 and Figure 14 show the plots of the mean values and standard deviations of FCm and FCp, respectively, for intact rock specimens and for different cutting directions in jointed rock mass specimens. Both FCm and FCp were lower in jointed rock mass compared to intact rock. Additionally, when the cutting direction was parallel to the joint plane (α = 0), the values were lower than when the cutting direction was perpendicular to the joint plane (α = 90°). This suggests that the influence of the joint plane is greater when the cutting direction is parallel to the joint plane compared to when it is perpendicular.
However, it should be noted that when the cutting depth exceeds 0.2 times the joint spacing (p ≥ 0.2Js), the FCm for cutting parallel to the joint plane is greater than the FCm for cutting perpendicular to the joint plane. As seen in Figure 13a, in the jointed rock mass specimen with a joint spacing of 30 mm, when the cutting depth exceeded 6 mm, the FCm for cutting parallel was greater than the FCm for cutting perpendicular to the joint plane. A similar trend was observed in the jointed rock mass specimen with a joint spacing of 60 mm at a cutting depth of 12 mm.
Figure 15 shows the plot of the mean values and standard deviations of SE for intact rock specimens and for different cutting directions in jointed rock mass specimens. SE was higher in intact rock specimens compared to jointed rock mass specimens, and it was lower in cutting parallel to the joint plane (α = 0) compared to cutting perpendicular to the joint plane (α = 90°). However, similar to FCm, when the cutting depth exceeds 0.2 times the joint spacing, SE was greater for cutting parallel to the joint plane compared to cutting perpendicular to the joint plane.
To analyze this in detail, the ratios of FCm and SE in the perpendicular cutting direction (FCm90 and SE90) to those in the parallel cutting direction (FCm0 and SE0) were plotted against the ratio of line spacing to joint spacing (s/Js), as shown in Figure 16. When the cutting depth is smaller than 0.2 times the joint spacing, the relative ratio of FCm was mostly greater than 1. On the other hand, when the cutting depth exceeds 0.2 times the joint spacing, the relative ratio of FCm was mostly less than 1. Notably, for s/Js greater than 0.4, the relative ratio of FCm consistently fell below 1 (Figure 16a). A similar trend was observed for the relative ratio of SE, which also became less than 1 when the cutting depth exceeded 0.2 times the joint spacing and s/Js was greater than 0.4 (Figure 16b).
As shown in Figure 17, when the cutting depth exceeded 0.2 times the joint spacing and s/Js was greater than 0.4, only a single cut was performed between the joint planes. This suggests that when the cutting depth exceeds 0.2 times the joint spacing, and as the line spacing increases beyond 0.4 times the joint spacing, the interaction between cuts is progressively hindered by the joint planes. Eventually, this causes a transition to the unrelieved mode, leading to a decrease in cutting efficiency.
Figure 18 presents the mean values and standard deviations of the s/popt for intact rock specimens and different cutting directions in jointed rock mass specimens. The s/popt in jointed rock mass was smaller than that in intact rock, with the smallest value observed in the parallel cutting direction to the joint plane. This can be attributed to the differences in crack formation characteristics between jointed rock mass and intact rock. With the penetration of the cutting tool, in intact rock, cracks are generated only under the tool tip. On the other hand, in jointed rock mass, the majority of cracks are generated on the joint plane, contributing to the rock breaking [21,35]. As a result, efficient rock breakage can still be achieved even at smaller spacings due to the interaction of cracks with joint planes. Furthermore, in the cutting direction parallel to the joint plane, the joint plane acts as a barrier, restricting the propagation of cracks generated by the pick and interfering with the interaction between successive cuts. Consequently, the optimal spacing is further reduced.

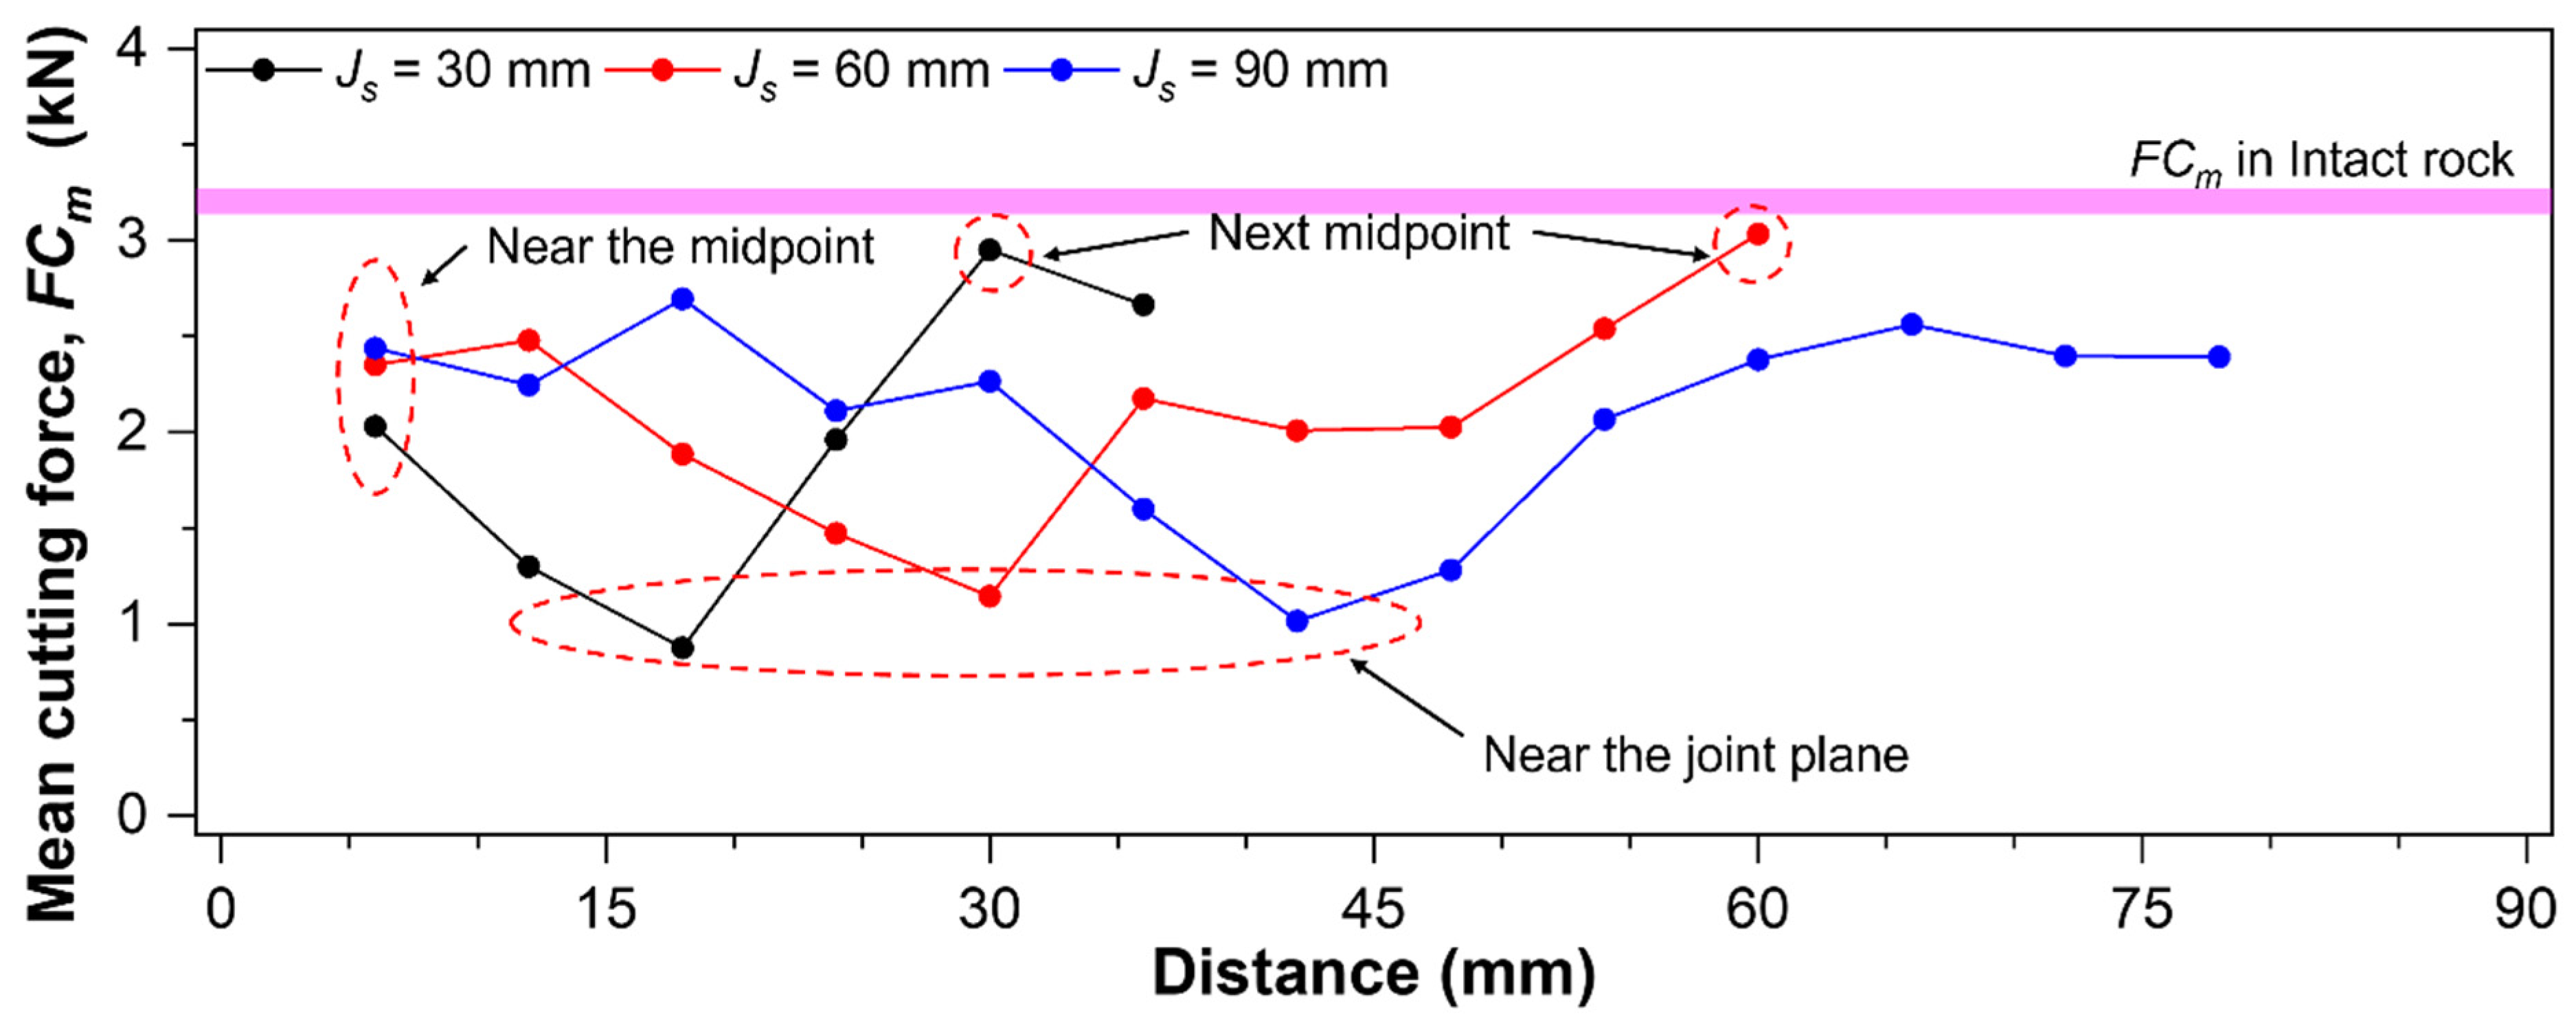
3.2.2. Effect of Joint Spacing

The effect of joint spacing on FC and SE was investigated through cutting tests conducted at depths of 6 mm and 9 mm, which were consistently performed across all the specimens. Numerous studies on TBMs have reported that an increase in joint spacing leads to an increase in thrust force [15,16,18,19]. The results obtained in this study show a similar trend. Figure 19 presents the mean values and standard deviations of FCm and FCp for intact rock specimens and for different cutting directions in jointed rock mass specimens. Both FCm and FCp showed an increasing trend as the joint spacing increased. The mean value of FCm for a cutting depth of 6 mm increased from approximately 3 kN at a joint spacing of 30 mm to about 4 kN as the joint spacing increased to 90 mm. Similarly, for a cutting depth of 9 mm, the mean value of FCm increased from 4 kN to approximately 6 kN as the joint spacing increased from 30 mm to 90 mm.
The mean values and standard deviations of SE for intact rock specimens and different cutting directions in jointed rock mass specimens are illustrated in Figure 20. Consistent with the findings of Song et al. [21], SE also increased as the joint spacing increased. the joint spacing increased from 30 mm to 90 mm, the mean value of SE for a cutting depth of 6 mm increased from 42 MJ/m3 to approximately 55 MJ/m3, while for a cutting depth of 9 mm, it increased from 30 MJ/m3 to about 40 MJ/m3.
It is noteworthy that for a cutting depth of 6 mm, both FCm and SE reach the level of intact rock at a joint spacing of 60 mm, while for a cutting depth of 9 mm, they reach the intact rock level at a joint spacing of 90 mm. This suggests that when the joint spacing becomes more than 10 times the cutting depth, the influence of joint spacing can be considered negligible.
Several researchers have found that the optimal spacing of disc cutters in TBMs decreases as joint spacing increases [35,36]. Song et al. [21] reported that in jointed rock mass excavation using disc cutters, cracks generated in closely spaced joint planes cause greater damage to rock blocks, leading to a higher degree of fragmentation, increased crack density, and improved fragmentation efficiency. However, as joint spacing increases, the efficiency of rock breakage decreases, ultimately leading to a reduction in the optimal spacing of the cutting tool. A similar trend was observed in this study. Figure 21 shows the mean values and standard deviations of s/popt with respect to joint spacing. As the joint spacing increased from 30 mm to 90 mm, s/popt decreased from 3.89 to 3.33. Therefore, the influence of joints in excavation using a conical pick can be considered highly similar to their effect in excavation with disc cutters.

4. Conclusions

A series of rock cutting tests was conducted using a conical pick to investigate the effect of joints on the performance of roadheaders. Rock cutting tests were performed on intact rock specimens and jointed rock mass specimens with three different joint spacings. Through these tests, the influence of the angle between the joint plane and the cutting direction, as well as joint spacing, on the cuttability of the conical pick was investigated.
The cuttability of the conical pick was shown to be improved in jointed rock mass compared to intact rock. The behaviour of FC in each individual cut within a series of cuts provided insight into the mechanisms through which joints contribute to enhanced cuttability. When cutting perpendicular to the joint plane, the presence of joints shortens the required fracture length for rock chip formation, reducing FC. In the parallel cutting direction, the joint plane acts as a barrier to side-crack propagation, lowering the FC required for crack development.
FC and SE were generally lower when cutting parallel to the joint plane compared to cutting perpendicular to it. However, when the cutting depth exceeded 0.2 times the joint spacing and the line spacing surpassed 0.4 times the joint spacing, the opposite trend was observed. This is because, as the cutting depth increases and the line spacing becomes larger while the joint spacing remains constant, the joints hinder the interaction between adjacent cuts, leading to a gradual transition to an unrelieved cutting mode. Additionally, FC and SE increased with joint spacing, and at a joint spacing 10 times the cutting depth, they exhibited values similar to those in intact rock. This indicates that when the joint spacing exceeds 10 times the cutting depth, the influence of joints becomes negligible.
The findings of this study provide a better understanding of the influence of joints on the performance of roadheaders. However, this study is limited in its consideration of diverse joint conditions, particularly joint orientation. Therefore, to expand these findings, future work will include experimental investigations that consider joint orientation, as well as numerical simulations, to explore a broader range of joint characteristics and complex conditions involving joint sets.

Author Contributions

Conceptualization, H.-E.K.; methodology, H.-E.K.; investigation, H.-E.K.; data curation, H.-E.K.; writing—original draft preparation, H.-E.K.; writing—review and editing, M.-S.K., W.-K.Y. and C.-Y.K. All authors have read and agreed to the published version of the manuscript.

Funding

This work was supported by the Korea Agency for Infrastructure Technology Advancement (KAIA) grant funded by the Ministry of Land, Infrastructure, and Transport (grant RS-2024-00416524, development of technology to enhance safety and efficiency of ultra-long K-underground expressway infrastructure).

Institutional Review Board Statement

Not applicable.

Informed Consent Statement

Not applicable.

Data Availability Statement

The original contributions presented in this study are included in the article. Further inquiries can be directed to the corresponding author.

Conflicts of Interest

The authors declare no conflicts of interest.

References

  1. Sapigni, M.; Berti, M.; Bethaz, E.; Busillo, A.; Cardone, G. TBM performance estimation using rock mass classifications. Int. J. Rock Mech. Min. Sci. 2002, 39, 771–788. [Google Scholar] [CrossRef]
  2. Hassanpour, J.; Rostami, J.; Zhao, J. A new hard rock TBM performance prediction model for project planning. Tunn. Undergr. Space Technol. 2011, 26, 595–603. [Google Scholar] [CrossRef]
  3. Rasouli Maleki, M. Rock Joint Rate (RJR); a new method for performance prediction of tunnel boring machines (TBMs) in hard rocks. Tunn. Undergr. Space Technol. 2018, 73, 261–286. [Google Scholar] [CrossRef]
  4. Salimi, A.; Rostami, J.; Moormann, C. Application of rock mass classification systems for performance estimation of rock TBMs using regression tree and artificial intelligence algorithms. Tunn. Undergr. Space Technol. 2019, 92, 103046. [Google Scholar] [CrossRef]
  5. Farrokh, E. A study of various models used in the estimation of advance rates for hard rock TBMs. Tunn. Undergr. Space Technol. 2020, 97, 103219. [Google Scholar] [CrossRef]
  6. Xu, H.; Gong, Q.; Lu, J.; Yin, L.; Yang, F. Setting up simple estimating equations of TBM penetration rate using rock mass classification parameters. Tunn. Undergr. Space Technol. 2021, 115, 104065. [Google Scholar] [CrossRef]
  7. Bilgin, N.; Seyrek, T.; Erding, E.; Shahriar, K. Roadheaders glean valuable tips for Istanbul Metro. Tunn. Tunn. Int. 1990, 22, 29–32. [Google Scholar]
  8. Ebrahimabadi, A.; Goshtasbi, K.; Shahriar, K.; Cheraghi Seifabad, M. A model to predict the performance of roadheaders based on the Rock Mass Brittleness Index. J. S. Afr. Inst. Min. Metall. 2011, 111, 355–364. [Google Scholar]
  9. Abdolreza, Y.C.; Siamak, H.Y. A new model to predict roadheader performance using rock mass properties. J. Coal Sci. Eng. 2013, 19, 51–56. [Google Scholar] [CrossRef]
  10. Dibavar, B.; Kahraman, S.; Rostami, M.; Fener, M. A New Rock Mass Cuttability Classification for Roadheaders Used in Coal Mining. Min. Metall. Explor. 2023, 40, 1141–1152. [Google Scholar] [CrossRef]
  11. Gong, Q.M.; Zhao, J.; Jiao, Y.Y. Numerical modeling of the effects of joint orientation on rock fragmentation by TBM cutters. Tunn. Undergr. Space Technol. 2005, 20, 183–191. [Google Scholar] [CrossRef]
  12. Gong, Q.M.; Jiao, Y.Y.; Zhao, J. Numerical modelling of the effects of joint spacing on rock fragmentation by TBM cutters. Tunn. Undergr. Space Technol. 2006, 21, 46–55. [Google Scholar] [CrossRef]
  13. Bejari, H.; Khademi Hamidi, J. Simultaneous effects of joint spacing and orientation on TBM cutting efficiency in jointed rock masses. Rock Mech. Rock Eng. 2013, 46, 897–907. [Google Scholar] [CrossRef]
  14. Choi, S.O.; Lee, S.J. Numerical study to estimate the cutting power on a disc cutter in jointed rock mass. KSCE J. Civ. Eng. 2016, 20, 440–451. [Google Scholar] [CrossRef]
  15. Xue, Y.; Zhou, J.; Liu, C.; Shadabfar, M.; Zhang, J. Rock fragmentation induced by a TBM disc-cutter considering the effects of joints: A numerical simulation by DEM. Comput. Geotech. 2021, 136, 104230. [Google Scholar] [CrossRef]
  16. Afrasiabi, N.; Rafiee, R.; Noroozi, M. Investigating the effect of discontinuity geometrical parameters on the TBM performance in hard rock. Tunn. Undergr. Space Technol. 2019, 84, 326–333. [Google Scholar] [CrossRef]
  17. Yin, L.; Miao, C.; He, G.; Dai, F.; Gong, Q. Study on the influence of joint spacing on rock fragmentation under TBM cutter by linear cutting test. Tunn. Undergr. Space Technol. 2016, 57, 137–144. [Google Scholar] [CrossRef]
  18. Yang, H.Q.; Li, Z.; Jie, T.Q.; Zhang, Z.Q. Effects of joints on the cutting behavior of disc cutter running on the jointed rock mass. Tunn. Undergr. Space Technol. 2018, 81, 112–120. [Google Scholar] [CrossRef]
  19. Yang, H.; Liu, J.; Liu, B. Investigation on the Cracking Character of Jointed Rock Mass Beneath TBM Disc Cutter. Rock Mech. Rock Eng. 2018, 51, 1263–1277. [Google Scholar] [CrossRef]
  20. Liu, B.; Yang, H.; Haque, E.; Wang, G. Effect of Joint Orientation on the Breakage Behavior of Jointed Rock Mass Loaded by Disc Cutters. Rock Mech. Rock Eng. 2021, 54, 2087–2108. [Google Scholar] [CrossRef]
  21. Song, K.; Yang, H.; Xie, J.; Karekal, S. An Optimization Methodology of Cutter-Spacing for Efficient Mechanical Breaking of Jointed Rock Mass. Rock Mech. Rock Eng. 2022, 55, 3301–3316. [Google Scholar] [CrossRef]
  22. Liu, B.; Li, B.; Zhang, L.; Huang, R.; Gao, H.; Luo, S.; Wang, T. Disc-cutter induced rock breakage mechanism for TBM excavation in rock masses with different joint shear strengths. Undergr. Space 2024, 19, 119–137. [Google Scholar] [CrossRef]
  23. Zhu, X.; Liu, W.; Lv, Y. The investigation of rock cutting simulation based on discrete element method. Geomech. Eng. 2017, 13, 977–995. [Google Scholar]
  24. Wang, M. Study conical pick cutting performance and fatigue life in breaking rock plate process with numerical simulation. Sci. Rep. 2024, 14, 857. [Google Scholar] [CrossRef]
  25. ASTM D7012-14; Standard Test Methods for Compressive Strength and Elastic Moduli of Intact Rock Core Specimens Under Varying States of Stress and Temperatures. ASTM International: West Conshohocken, PA, USA, 2014.
  26. ASTM D3967-08; Standard Test Method for Splitting Tensile Strength of Intact Rock Core Specimens with Flat Loading Platens. ASTM International: West Conshohocken, PA, USA, 2008.
  27. ASTM C97/C97M-15; Standard Test Methods for Absorption and Bulk Specific Gravity of Dimension Stone. ASTM International: West Conshohocken, PA, USA, 2015.
  28. Khosravi, M.; Ramezanzadeh, A.; Zare, S. Effect of Rock Joint on Boreability of TBM at Northern Section of Kerman Water Conveyance Tunnel. Int. J. Min. Geo-Eng. 2021, 55, 145–150. [Google Scholar]
  29. Howarth, D.F. The effect of jointed and fissured rock on the performance of tunnel boring machines. In Proceedings of the ISRM International Symposium, Tokyo, Japan, 21–24 September 1981. [Google Scholar]
  30. Sanio, H.P. Prediction of the performance of disc cutters in anisotropic rock. Int. J. Rock Mech. Min. Sci. 1985, 22, 153–161. [Google Scholar] [CrossRef]
  31. Wang, X.; Su, O.; Wang, Q.F.; Liang, Y.P. Effect of cutting depth and line spacing on the cuttability behavior of sandstones by conical picks. Arab. J. Geosci. 2017, 10, 525. [Google Scholar] [CrossRef]
  32. Yasar, S.; Yilmaz, A.O. Drag pick cutting tests: A comparison between experimental and theoretical results. J. Rock Mech. Geotech. Eng. 2018, 10, 893–906. [Google Scholar] [CrossRef]
  33. Evans, I. Theoretical aspects of coal ploughing. In Mechanical Properties of Non-Metallic Brittle Materials; Watton, W.H., Ed.; Butterworths: London, UK, 1958; pp. 451–468. [Google Scholar]
  34. Lin, Q.B.; Cao, P.; Li, K.H.; Cao, R.H.; Zhou, K.P.; Deng, H.W. Experimental study on acoustic emission characteristics of jointed rock mass by double disc cutter. J. Cent. South Univ. 2018, 25, 357–367. [Google Scholar] [CrossRef]
  35. Jiang, M.; Liao, Y.; Wang, H.; Sun, Y. Distinct element method analysis of jointed rock fragmentation induced by TBM cutting. Eur. J. Environ. Civ. Eng. 2018, 22, s79–s98. [Google Scholar] [CrossRef]
  36. Naghadehi, M.Z.; Mikaeil, R. Optimization of tunnel boring machine (TBM) disc cutter spacing in jointed hard rock using a distinct element numerical simulation. Period. Polytech. Civ. Eng. 2017, 61, 56–65. [Google Scholar] [CrossRef]
Figure 1. Planned underground expressway projects in South Korea.
Applsci 15 04347 g001
Figure 2. Schematic diagram of jointed rock mass specimen: (a) cross-sectional view; (b) full view.
Applsci 15 04347 g002
Figure 3. Components of laboratory-scale LCM employed in this experiment.
Applsci 15 04347 g003
Figure 4. Conical pick employed in this experiment: (a) geometry and specifications of SM06; (b) attack angle of conical pick.
Applsci 15 04347 g004
Figure 5. Effect of joint orientation on mechanical excavation: (a) TBM; (b) roadheader.
Applsci 15 04347 g005
Figure 6. The tool forces recorded during a single cut in the LCM test.
Applsci 15 04347 g006
Figure 7. Variation in FC with cutting distance for intact rock and jointed rock mass specimens at an α of 90°: (a) p = 3, s = 9; (b) p = 6, s = 18; and (c) p = 9, s = 24.
Applsci 15 04347 g007
Figure 8. Rock chip formation based on the theory by Evans [31]: (a) intact rock; (b) jointed rock mass.
Applsci 15 04347 g008
Figure 9. Jointed rock mass specimen after cutting at an α of 0.
Applsci 15 04347 g009
Figure 10. FCm for each individual cut when α is 0 (p = 6 and s = 6).
Applsci 15 04347 g010
Figure 11. Idealized tensile fracture under the conical pick: (a) midpoint between joint planes; (b) near the joint plane.
Applsci 15 04347 g011
Figure 12. Jointed rock mass specimen after cutting at an α of 90°.
Applsci 15 04347 g012
Figure 13. Variation in FCm with α: (a) Js = 30 mm; (b) Js = 60 mm; and (c) Js = 90 mm.
Applsci 15 04347 g013
Figure 14. Variation in FCp with α: (a) Js = 30 mm; (b) Js = 60 mm; and (c) Js = 90 mm.
Applsci 15 04347 g014
Figure 15. Variation in SE with α: (a) Js = 30 mm; (b) Js = 60 mm; and (c) Js = 90 mm.
Applsci 15 04347 g015
Figure 16. Plot of the relative ratio of (a) FCm and (b) SE to s/Js.
Applsci 15 04347 g016
Figure 17. Jointed rock mass specimen with a joint spacing of 60 mm after cutting (p = 12 mm and s = 48 mm).
Applsci 15 04347 g017
Figure 18. Variation in s/popt with α.
Applsci 15 04347 g018
Figure 19. Variation in (a) FCm and (b) FCp with Js.
Applsci 15 04347 g019
Figure 20. Variation in SE with Js.
Applsci 15 04347 g020
Figure 21. Variation in s/popt with Js.
Applsci 15 04347 g021
Table 1. Physical and mechanical properties of rock specimen materials.
Materialρ (g/cm3)E (GPa)νσc (MPa)σt (MPa)
Finike limestone2.2221.10.1349.05.00
Concrete2.3838.90.3042.02.51
Cement mortar2.118.70.206.00.90
Table 2. Experimental cutting parameters.
SpecimenCutting Depth, p (mm)Line Spacing, s (mm)
IJ30 3369121518
IJ30J60J9066912182436
IJ30J60J90991218243648
J60J90 12121824364860
Here, I is the intact rock specimen, and J30, J60, and J90 are the jointed rock mass specimens with 30 mm, 60 mm, and 90 mm of joint spacing, respectively.
Table 3. Rock cutting results of the intact rock.
p (mm)s (mm)s/pFCm (kN)FCp (kN)SE (MJ/m3)s/popt
3311.573.18178.04.13
621.654.1496.9
931.995.2078.2
1242.195.2972.9
1552.536.1480.8
1862.736.7595.8
6613.326.93108.34.05
91.53.517.7263.0
1223.828.8354.6
1834.5911.0547.4
2444.9413.6246.0
3665.6613.3557.7
9914.8711.3466.63.52
121.335.1212.1454.3
1826.0714.1239.2
242.676.5716.4832.9
3647.1618.1433.5
485.338.1319.6545.9
Table 4. Rock cutting results of the jointed rock mass with a joint spacing of 30 mm.
α (Deg.)p (mm)s (mm)s/ps/JsFCm (kN)FCp (kN)SE (MJ/m3)s/popt
03310.10.761.8693.14.33
620.21.022.6654.3
930.31.333.6155.7
1240.41.624.1659.1
1550.52.005.2457.9
1860.61.914.6661.4
6610.22.095.1660.14.23
91.50.32.155.8544.6
1220.42.786.8441.3
1830.63.218.2135.9
2440.83.449.0838.8
3661.23.839.9239.6
9910.32.567.5139.13.45
121.330.43.069.3428.9
1820.64.0710.2329.2
242.670.84.3611.3026.8
3641.25.9015.2827.6
485.331.65.6715.4338.4
903310.11.033.01145.24.07
620.21.493.8382.3
930.31.383.9673.6
1240.41.394.9140.8
1550.52.286.1463.4
1860.62.106.1967.4
6610.22.367.8275.54.18
91.50.32.207.4638.4
1220.42.687.4338.7
1830.62.787.5430.4
2440.83.378.6835.3
3661.23.3610.5734.0
9910.33.229.2344.53.07
121.330.43.008.9731.9
1820.63.5010.8821.6
242.670.84.4112.1823.5
3641.24.0015.0217.3
485.331.65.2115.7631.1
Table 5. Rock cutting results of the jointed rock mass with a joint spacing of 60 mm.
α (Deg.)p (mm)s (mm)s/ps/JsFCm (kN)FCp (kN)SE (MJ/m3)s/popt
06610.12.396.3373.54.54
91.50.153.017.7564.4
1220.23.127.8246.8
1830.34.2610.7045.6
2440.44.8412.6346.2
3660.66.0314.4756.2
9910.152.719.0638.23.66
121.330.24.1411.3843.3
1820.34.0812.2031.1
242.670.44.8115.7428.4
3640.65.9416.5628.0
485.330.86.2715.2331.7
121210.24.4913.9633.43.31
181.50.34.8414.9330.7
2420.46.3217.2327.4
3630.610.0420.4737.8
4840.88.0819.6525.7
605113.7724.3946.3
906610.12.777.2784.03.90
91.50.153.368.5177.0
1220.23.729.4556.2
1830.34.2510.9941.0
2440.45.0112.3945.4
3660.65.4213.0743.9
9910.153.9410.4154.23.75
121.330.24.1511.1840.3
1820.34.7114.3829.8
242.670.46.1817.0131.0
3640.67.4517.5035.3
485.330.88.2721.5533.5
121210.25.1114.6636.52.44
181.50.36.1318.5527.0
2420.46.7619.8526.6
3630.67.0121.7922.3
4840.87.4320.5920.1
60518.9823.6029.1
Table 6. Rock cutting results of the jointed rock mass with a joint spacing of 90 mm.
α (Deg.)p (mm)s (mm)s/ps/JsFCm (kN)FCp (kN)SE (MJ/m3)s/popt
06610.072.075.8763.43.88
91.50.12.646.8158.7
1220.132.837.3843.8
1830.23.979.5347.6
2440.274.1010.5544.8
3660.45.9012.6952.0
9910.13.7310.1252.23.38
121.330.134.5312.0342.8
1820.24.9112.7937.9
242.670.275.9015.8536.3
3640.48.3816.2242.3
485.330.536.8516.1047.3
121210.135.6014.4943.72.99
181.50.25.6916.0531.9
2420.277.7518.3934.0
3630.49.1520.7232.2
4840.5310.6128.9842.4
6050.6712.5225.4643.5
906610.072.316.5275.93.92
91.50.12.926.4760.7
1220.133.437.9147.8
1830.24.5011.6149.0
2440.275.6212.6251.9
3660.46.3212.4757.4
9910.14.4210.4960.63.16
121.330.135.5511.6355.2
1820.25.0813.7934.3
242.670.275.3414.6229.7
3640.48.8917.9845.3
485.330.537.9016.1346.0
121210.135.7817.7248.12.62
181.50.26.8321.0140.9
2420.278.3722.4633.6
3630.410.4322.9138.9
4840.5311.1625.8038.1
6050.6713.2524.7545.6
Disclaimer/Publisher’s Note: The statements, opinions and data contained in all publications are solely those of the individual author(s) and contributor(s) and not of MDPI and/or the editor(s). MDPI and/or the editor(s) disclaim responsibility for any injury to people or property resulting from any ideas, methods, instructions or products referred to in the content.

