Article

Shape-Stabilized Phase Change Materials with Expanded Graphite for Thermal Management of Photovoltaic Cells: Selection of Materials and Preparation of Panels

1
Department of Industrial Engineering and INSTM Research Unit, University of Trento, Via Sommarive 9, 38123 Trento, Italy
2
New Energies, Renewable Energies and Materials Science Research Center, Eni S.p.A., 30175 Marghera, Italy
3
New Energies, Renewable Energies and Materials Science Research Center, “Istituto Guido Donegani”, Eni S.p.A., 28100 Novara, Italy
*
Authors to whom correspondence should be addressed.
Appl. Sci. 2025, 15(8), 4352; https://doi.org/10.3390/app15084352
Submission received: 28 February 2025 / Revised: 4 April 2025 / Accepted: 11 April 2025 / Published: 15 April 2025

Abstract

:
Organic phase change materials (PCMs) have been widely studied for thermal management applications, such as the passive cooling of silicon photovoltaic (PV) cells, whose efficiency is negatively affected by rising temperature. The aim of the present study is to investigate the shape stabilization of PCMs by using expanded graphite (EG) as a highly conductive supporting matrix, leading to the development of novel PCM/EG composites with melting temperatures in the range 30–50 °C. Different organic PCMs were selected and compared, i.e., two paraffins and a eutectic mixture of fatty acids (myristic and palmitic acid). The EG was vacuum-impregnated with organic PCMs, and, subsequently, powdery composites were cold-compacted to obtain dense heat-absorbing panels. The thermal conductivity was enhanced up to 6 W/m·K, guaranteeing composites with a melting enthalpy of 160 to 220 J/g. This study found that the EG vacuum impregnation method is suitable for PCM shape stabilization, and cold compaction allows for the formation of solid panels with improved thermal response. The obtained PCM/EG composites were utilized to produce panels of about 6 × 6 × 2 cm3, suitable for the thermal management of silicon PV.

1. Introduction

In recent years, excessive fossil fuel consumption has given rise to a deep energy crisis and environmental concerns, making clean energy technologies of increasing interest in order to replenish conventional fuels. Solar energy is a sustainable and accessible renewable energy source of unlimited potential. Nowadays, photovoltaics (PVs) represent the most effective technology for taking advantage of solar energy for electricity production.
The most consolidated PV technology involves the use of mono- and polycrystalline silicon cells, which cover around 97% of the PV market [1]. Cumulative PV installation is exponentially growing in order to fulfill the renewable electricity generation capacity, which has to reach 6 TW worldwide in order to limit the average global temperature increase to 1.5 °C above pre-industrial levels [2]. However, in 2024, the cumulative total PV capacity barely reached 2 TW, and thereby, the total replenishment of silicon cells with emerging PV technologies, such as perovskites [3,4], is becoming even more difficult thanks to the advantages offered by silicon technology such as their low-cost, environmental friendliness, and economies of scale [5].
PV cells absorb part of the incoming energy from the sun, dissipating the rest into heat. The excessive heat can raise module temperatures, shortening their lifespan and reducing their efficiency. In particular, the conversion efficiency of crystalline silicon solar cells decreases by 0.3–0.5% for every degree of temperature increase. Silicon solar cell efficiencies are approaching the maximum theoretical value [6]; hence, thermal management becomes fundamental to minimize efficiency losses. It is therefore essential to maintain the lowest possible working temperatures, developing active or passive cooling systems to be coupled with PV cells [7,8]. Because active cooling requires specifically dedicated energy consumption, passive systems are energetically preferred [9,10].
An emerging strategy in the field of passive cooling is the use of phase change materials (PCMs), storage materials able to absorb incoming heat flux during melting and store it in the latent form at constant temperature. The stored latent heat is released in crystallization during the opposite thermal cycle, as reviewed in the literature [11,12]. PCMs have been exploited in many applications related to energetic transition. They may replace insulating materials to mitigate building environmental impacts [13], and also, they can prevent overheating in electronic devices [14] and batteries [15,16]. In addition, they have been proposed for low-temperature thermal energy storage (TES) [17,18]. PCMs can also be employed in PV modules as passive cooling systems to mitigate the already mentioned efficiency losses [19,20,21,22].
PCMs are subdivided into classes based on their chemical structure: organic, inorganic, and eutectic mixtures [23]. Organic PCMs include paraffins, fatty acids, and poly(ethylene glycol) derivatives. They offer advantages such as high melting enthalpy, non-corrosiveness, chemical stability, and no supercooling phenomenon. However, they present high volumetric expansion upon melting, flammability, and low thermal conductivity. These drawbacks do not exist in inorganic PCMs, a class composed of salts, hydrated salts, metals, and alloys. Nevertheless, inorganic PCMs are often avoided because they are corrosive, scarcely stable, and they may incur the supercooling phenomenon. Likewise, eutectic mixtures are combinations of two or more PCMs of the previous classes, which enable the fine-tuning of PCM melting temperatures. Because of their disadvantages, inorganic PCMs are discarded, and in the following, we consider only organic PCMs and their eutectic mixtures.
Organic PCMs are poor thermal conductors, so thermal conductivity improvement is fundamental for fast charging and discharging rates, which are critical issues when PCMs are applied for the thermal management of electronic devices and batteries [24]. Thermal conductivity in organic PCMs can be enhanced by adding carbon substances such as graphene [25], graphene oxide [26], and expanded graphite [27,28,29]. They can rely on their excellent porous structure, which allows for the efficient absorption of PCMs, making possible the creation of a highly stable PCM-based composite. Graphene and graphene oxides, notwithstanding their excellent properties, have been often discarded due to the high cost, in favor of expanded graphite (EG). EG has become of huge interest in the realization of PCM-based composites due to its low density and high specific surface area, which creates a thermal conductive network, which additionally provides shape stabilization and limited leakage [30,31,32].
This stabilizing effect of EG is crucial to restrict the main technological limitation in the use of PCMs, which is the need to confine them once molten. Many solutions have been proposed, like macro- [33] or micro-encapsulation [34]. These are valid strategies but they do not increase the thermal conductivity and macro-encapsulation has to deal with the large volumetric expansion of PCMs upon melting, while micro-encapsulation is a fairly expensive process. Moreover, the micro-encapsulated PCM must be dispersed into a polymeric matrix, such as one made up of thermoplastics [35,36], acrylic resins [37], or elastomers [38], but this process can be performed also with neat PCMs, obtaining higher melting enthalpy composites. For these reasons, carbon-based structures are preferred when a high PCM content is needed.
In a previous study [39], for the first time, we impregnated EG with a fatty acid mixture under vacuum conditions and the obtained powder was cold-compacted to realize shape-stabilized panels. We found that a 14 EG parts per hundred ratio (phr) of PCM is the optimum amount for leaking prevention and thermal conductivity enhancement, obtaining isotropic thermal conductivity values not reached before in the literature. However, the considered PCM melted at 50–55 °C and we verified that, to maximize the thermal management efficacy in PV systems at a north-Italian latitude, a lower melting point (around 40–45 °C) is preferable. For this reason, in the present study, we focus on lower-melting-point PCMs, in order to maximize the thermal management action, intending to obtain EG-based passive cooling systems to be coupled with crystalline silicon PV cells, which can be applied to either new plants or existent ones.

2. Materials and Methods

2.1. Materials

The investigated organic PCMs were selected due to their melting interval from 30 to 50 °C. They are reported in increasing order of melting temperatures:
  • Rubitherm® RT35HC (RT35), whose melting peak temperature is 35 °C, characterized by a melting enthalpy of 240 J/g (±7.5%) and density in the solid state of 0.88 g/cm3, was provided by Rubitherm GmbH (Berlin, Germany);
  • Rubitherm® RT44HC (RT44), whose melting peak temperature is 44 °C, characterized by a melting enthalpy of 250 J/g (±7.5%) and density in the solid state of 0.8 g/cm3, was provided by Rubitherm GmbH (Berlin, Germany);
  • A fatty acid mixture of myristic and palmitic acids (MPAs), mixed at a 61:39 weight ratio to finetune the melting temperature to around 50 °C, yielded a eutectic composition, whose precursors (purity ≥ 95%) were provided by Merck KGaA (Darmstadt, Germany).
The expanded graphite (EG) chosen as the supporting matrix was SIGRAFLEX® EXPANDAT, provided by SGL Carbon GmbH (Meitingen, Germany). It is characterized by tapped density of 25 g/L at 20 °C and particle size of 4–40 µm.

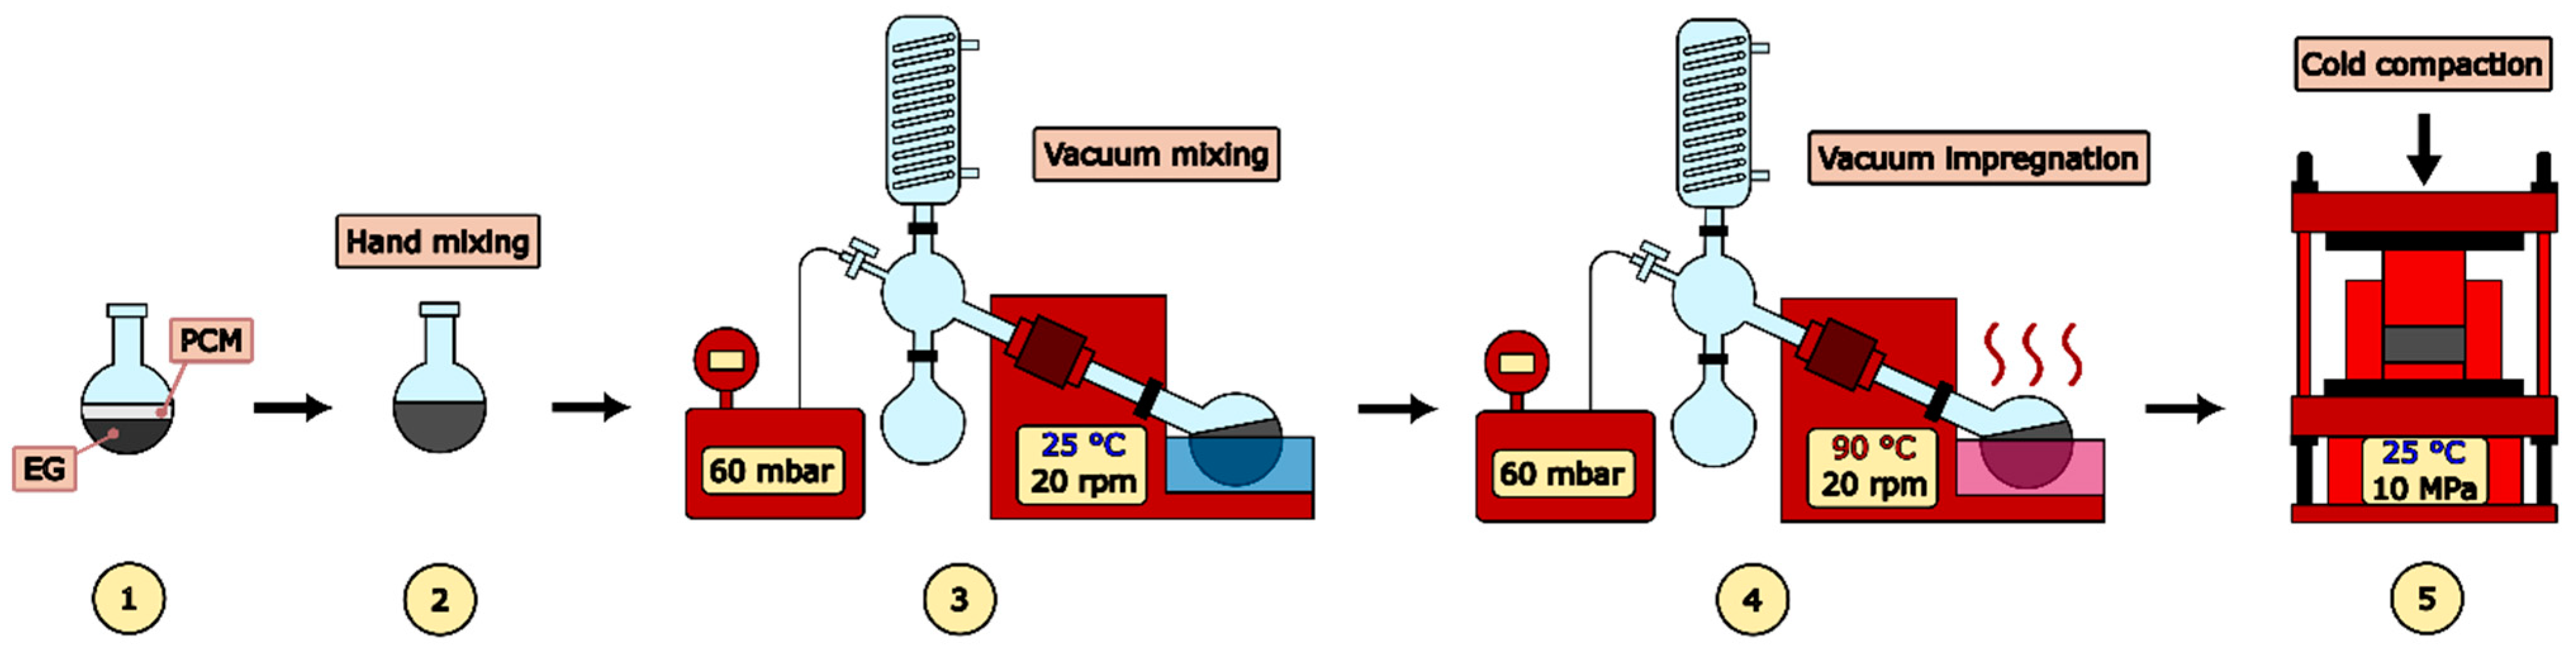
2.2. Sample Preparation

RT35 and RT44 were used without any preliminary treatments. In order to obtain MPA, instead, myristic and palmitic acid (61:39 ponderal ratio) were heated at 70 °C and, once molten, were magnetically stirred for 5 min to obtain a PCM with a lower melting point with respect to the two neat fatty acids, accordingly to the requirements for the application of photovoltaic thermal management.
Masses of 100 g of PCM and 14 g of EG were inserted into a 1 l flask and hand-mixed. This choice was made due to an earlier study focused on the optimization of the considered graphite-to-PCM ratio in the vacuum impregnation process, in order to allow thermal conductivity enhancement and leaking reduction, maintaining significant enthalpic content [39].
The flask was then attached to a rotary vapor apparatus at room temperature, 20 rotations per minute (rpm) were applied, and a 60 mbar vacuum was created using a rotary pump. Once the vacuum level was in equilibrium, fundamental to remove the entrapped air from the EG’s pores, the water bath was heated up to 90 °C. After melting the PCM, evidenced by the disappearance of whitish flakes inside the flask, the rotation was maintained for 30 min in the presence of the heated bath to guarantee homogeneous EG impregnation with the PCM. Then, the flask was removed from the bath, and the PCM, stabilized into EG, was cooled down until solidification. The vacuum was removed and the rotation stopped. The obtained material was a powder with a similar appearance to the EG before impregnation. As a result, the disappearance of all the free PCM can be noticed, evidencing its full impregnation into the EG pores. The PCM remained entrapped in the molten state due to capillary forces, with the EG porosity allowing volume expansion when the melting transition occurs.
Subsequently, the powders were cold-compacted using a Carver® press (Carver, Wabash, IN, USA) into a steel mold 62 × 62 mm2 [35] starting from a column of 60 mm3. Then, 10 MPa was applied for 30 s and bricks with a size of 62 × 62 × 20 mm3 were obtained. For some characterizations (e.g., thermal diffusivity measurements), disks of 12.7 mm diameter were obtained with the use of cylindrical molds. Powder compaction with a press was performed at 20 °C (below the melting point of PCM) to avoid the PCM squeezing out of the graphite matrix. Figure 1 shows a schematic representation of the sequence to obtain the composites and Table 1 lists the sample composition.

2.3. Experimental Methodologies

The chemical structure of neat PCMs was investigated through Fourier-transform infrared (FTIR) spectroscopy, using a Spectrum One Perkin-Elmer spectrometer (Perkin-Elmer, Shelton, CT, USA) operating in attenuated total reflectance (ATR) mode. The spectra were obtained by averaging 4 scans in the wavenumber range of 4000–640 cm−1.
The ability of the samples to retain the PCM was investigated through leaking tests, which quantifies the PCM loss above its melting temperature. Disks of diameter 20 mm, thickness 1 mm, and masses 1 g were placed into an oven at 60 °C on filter paper for 3 h, and the masses were monitored hour by hour.
Fracture surfaces of compacted panels were observed by scanning electron microscopy (SEM) by using the secondary electron signal of a Zeiss Supra 40 field emission scanning electron microscope (Carl Zeiss, Oberkochen, Germany), which operates at 10−6 Torr vacuum and an acceleration voltage of 2.5 kV. The surfaces were covered by a thin layer of Pt-Pd before the observations.
Thermogravimetric analysis (TGA) was performed using a Mettler TG50 thermobalance (Mettler-Toledo, Greifensee, Switzerland), heating at 10 °C/min, from 30 °C to 700 °C and fluxing 100 mL/min of nitrogen gas. Samples of mass 10 g were analyzed in an alumina crucible. The parameters determined to compare the curves of the different samples were the temperature associated with a mass loss of 5 wt.% (T5%), the temperature of the maximum degradation rate (Tpeak), and the residual mass at 700 °C (m700).
Differential scanning calorimetry (DSC) of neat PCMs and composite samples was performed using a Mettler DSC5+ calorimeter (Mettler-Toledo, Greifensee, Switzerland). The thermal cycles were composed of heating/cooling/heating in the range 25 °C to 55 °C in 40 μL aluminum crucibles. The scans were conducted under a nitrogen flow of 100 cm3/min at a rate of 1 °C/min to increase the precision in the determination of the phase transition temperatures [35,39]. From the thermograms, the characteristic temperatures of the samples were obtained, in particular, the melting temperatures during the first and the second heating scan (Tm1 and Tm2) and the crystallization temperature (Tc) in cooling. The specific melting and crystallization enthalpy values (ΔHm1, ΔHc, and ΔHm2) were additionally determined. The effective PCM content ( P C M m 2 e f f ) of the impregnated EG samples was determined in the second heating scan according to Equation (1), and Equation (2) gave the calculation for the efficiency of melting during the second melting scan (ηm2).
P C M m 2 e f f = H m 2 H m 2 , P C M   · 100
η m 2 = H m 2 H m 2 , P C M   ·   W P C M   · 100  
where ΔHm2,PCM is the specific enthalpy of the neat PCM in the second heating scan and WPCM is the weight fraction of the PCM.
The specific heat capacity at constant pressure (cp) was determined in the solid state for comparison with a sapphire reference according to the ASTM E1269-11 standard [40]. Three specimens of 10 mg for each sample were analyzed using a Mettler DSC5+ machine (Mettler-Toledo, Greifensee, Switzerland) performing a heating scan at a rate of 1 °C/min, and the specific heat capacity was determined at 20, 25, 30, and 35 °C.
Thermal diffusivity (α) was determined in the solid state at 20, 25, 30, and 35 °C using a Neztsch Laser Flash Analyzer (LFA) 446 (Netzsch GmbH, Selb, Germany). The specimens were disks of thickness 2.5 mm and diameter of 12.7 mm. A laser signal of 250 V was imposed using a pulse width of 0.6 ms. The composite specimens were obtained by cold compaction of the impregnated EG, while the neat PCMs were cast into a polytetrafluoroethylene mold.
Thermal conductivity (λ) was indirectly determined according to Equation (3).
λ = α ·   ρ   · c p
where ρ is the bulk density of the analyzed specimens, determined at 20 °C as the ratio between mass and geometrical volume, and it is approximated as being constant for the investigated temperature range. The values of specific heat capacity, thermal diffusivity, and thermal conductivity are reported as the mean value and standard deviation.

3. Results and Discussion

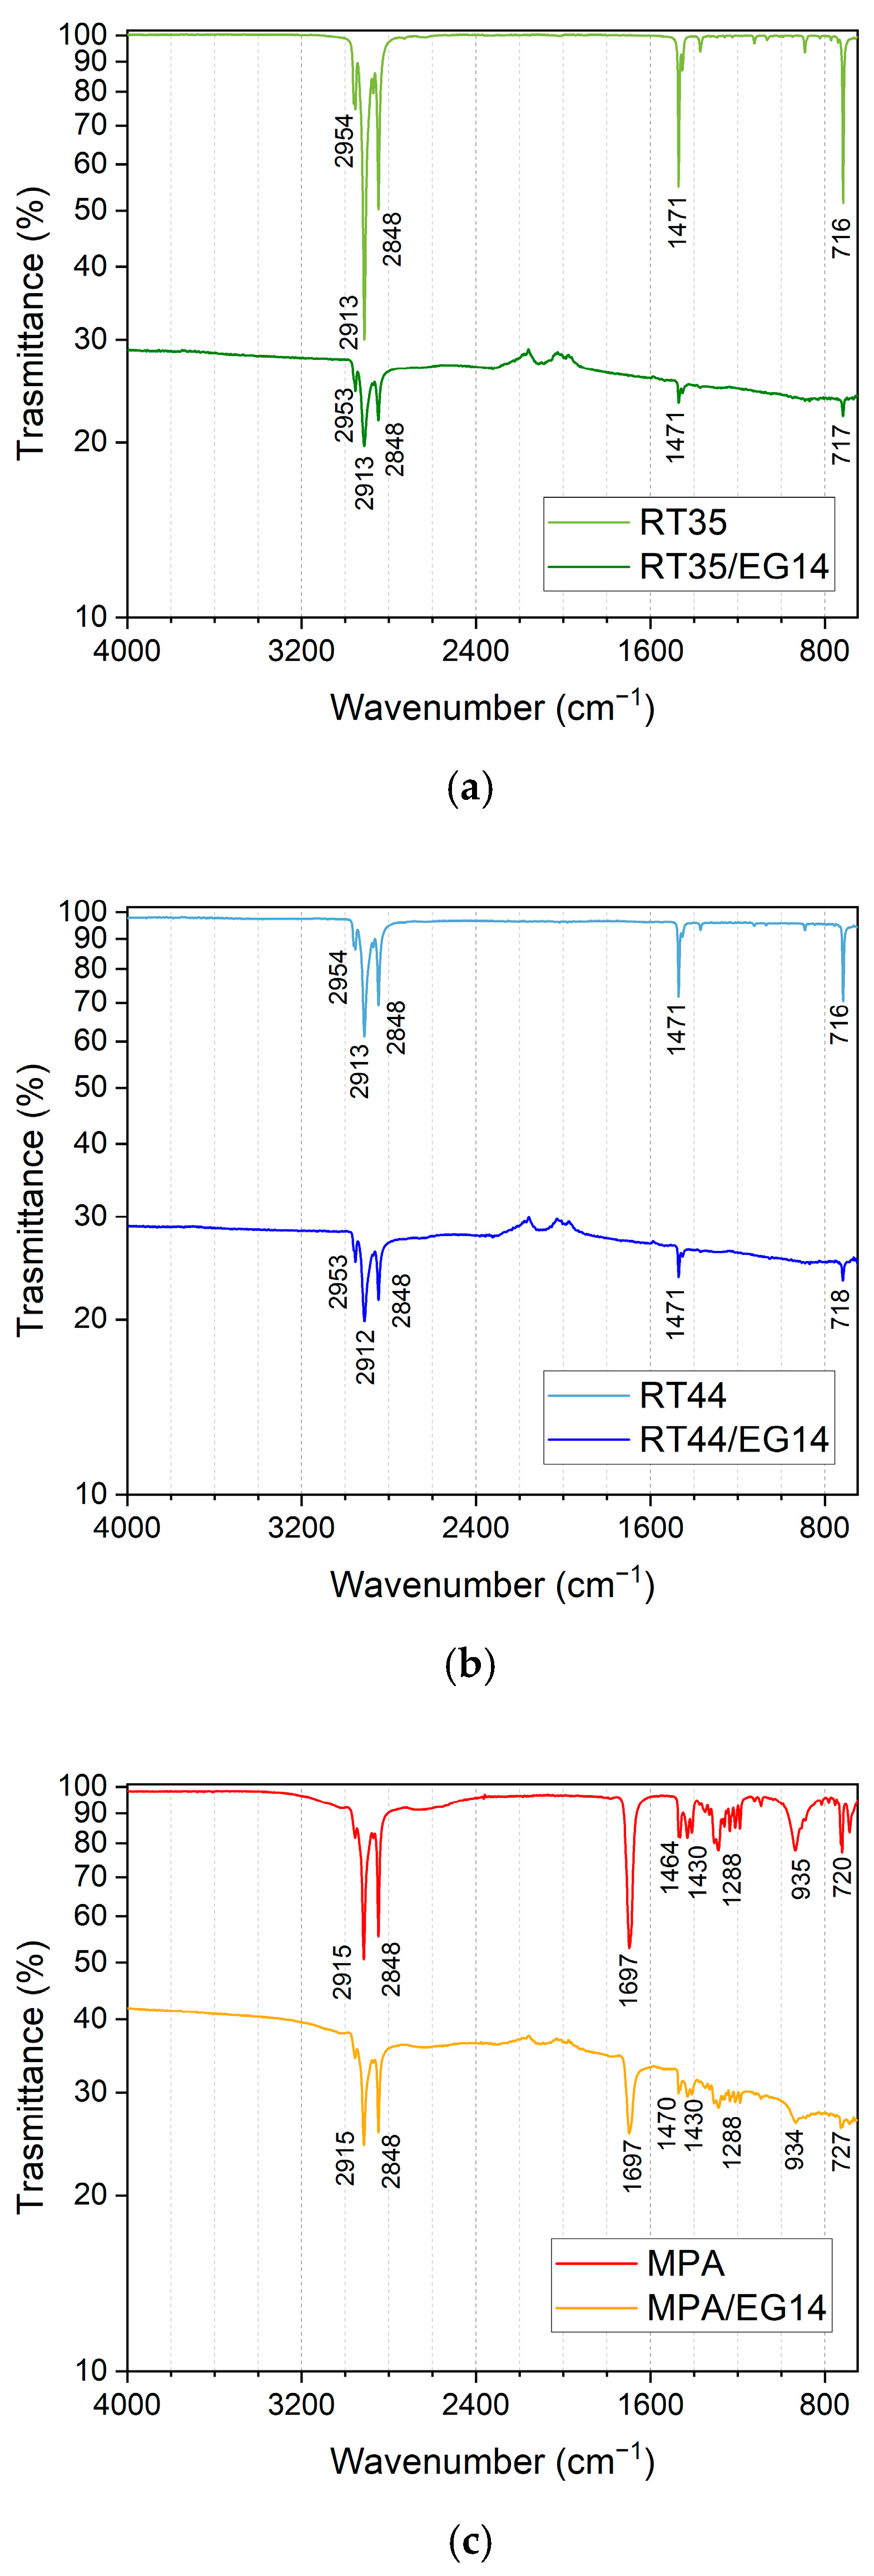
3.1. Fourier-Transform Infrared (FTIR) Spectroscopy

The three selected PCMs are compared by FTIR analysis before and after EG impregnation, as shown in Figure 2, in order to identify the functional groups of the PCMs, which can be correlated with the leakage behavior. As expected, the presence of EG reduces the transmittance of the composite materials. The position of the peaks remains at the same position before and after impregnation.
The peaks at 2915 and 2850 cm−1 correspond to the stretching of the aliphatic C-H, while those at about 1470 and 715 cm−1 indicate C-H bending and wagging; thus, RT35 and RT44 are organic aliphatic compounds. No other peaks are present in the RT35 and RT44 spectra, indicating that these two PCMs are paraffins.
MPA, a mixture of myristic and palmitic acids, presents a stretching peak at about 2915 and 2850 cm−1, as in the already described olefins. In addition, it presents an intense peak at about 1700 cm−1, attributed to C=O stretching and a large band at 2600–2550 cm−1 typical of the carboxylic group. Moreover, the fingerprint zone confirms that MPA is an aliphatic fatty acid [35].

3.2. Leaking Test

The ability of EG to retain the different PCMs is investigated considering the leaking test curves shown in Figure 3, in which the PCM loss of the pressed disks is reported as a function of time.
The fatty acid mixture, MPA, interacts much better with EG with respect to the two commercial paraffins, deducible by the much less pronounced leakage after every mass measurement, experiencing only 0.55 wt.% of mass loss after three hours, around 10 times lower than those of RT35 (−5.36 wt.%) and RT44 (−5.11 wt.%). The slightly lower leakage of RT44 in comparison with RT35 can be probably attributed to the higher melting point of the first one, hence the higher viscosity at the test temperature of 60 °C, considering the same aliphatic nature of the oligomers. Similarly, the slightly higher melting point of MPA (see the following) could influence the leakage behavior. However, for the test, a constant temperature was preferred to a fixed range above the PCM melting point to better simulate the real conditions in which when all the PCM is molten, the system temperature tends to stabilize with that of the PV panel, proportionally to the striking irradiance.
The most pronounced leakage is evidenced for RT35/EG14 and RT44/EG14 during the first hour, a behavior already encountered in previous works by the authors [35,39]. The pictures of the specimens after one hour of testing perfectly match the trend of the plot, showing a particularly contained leaked MPA halo.
For these reasons, the fatty acid mixture can be considered the best candidate to be shape-stabilized in EG, probably due to the higher chain polarity and higher capillary forces conferred by the carboxylic groups [35]. Another explanation could be the planar shape of the fatty acid flakes, which makes them suitable to be intercalated among the already distanced graphitic lamellae [39,41].

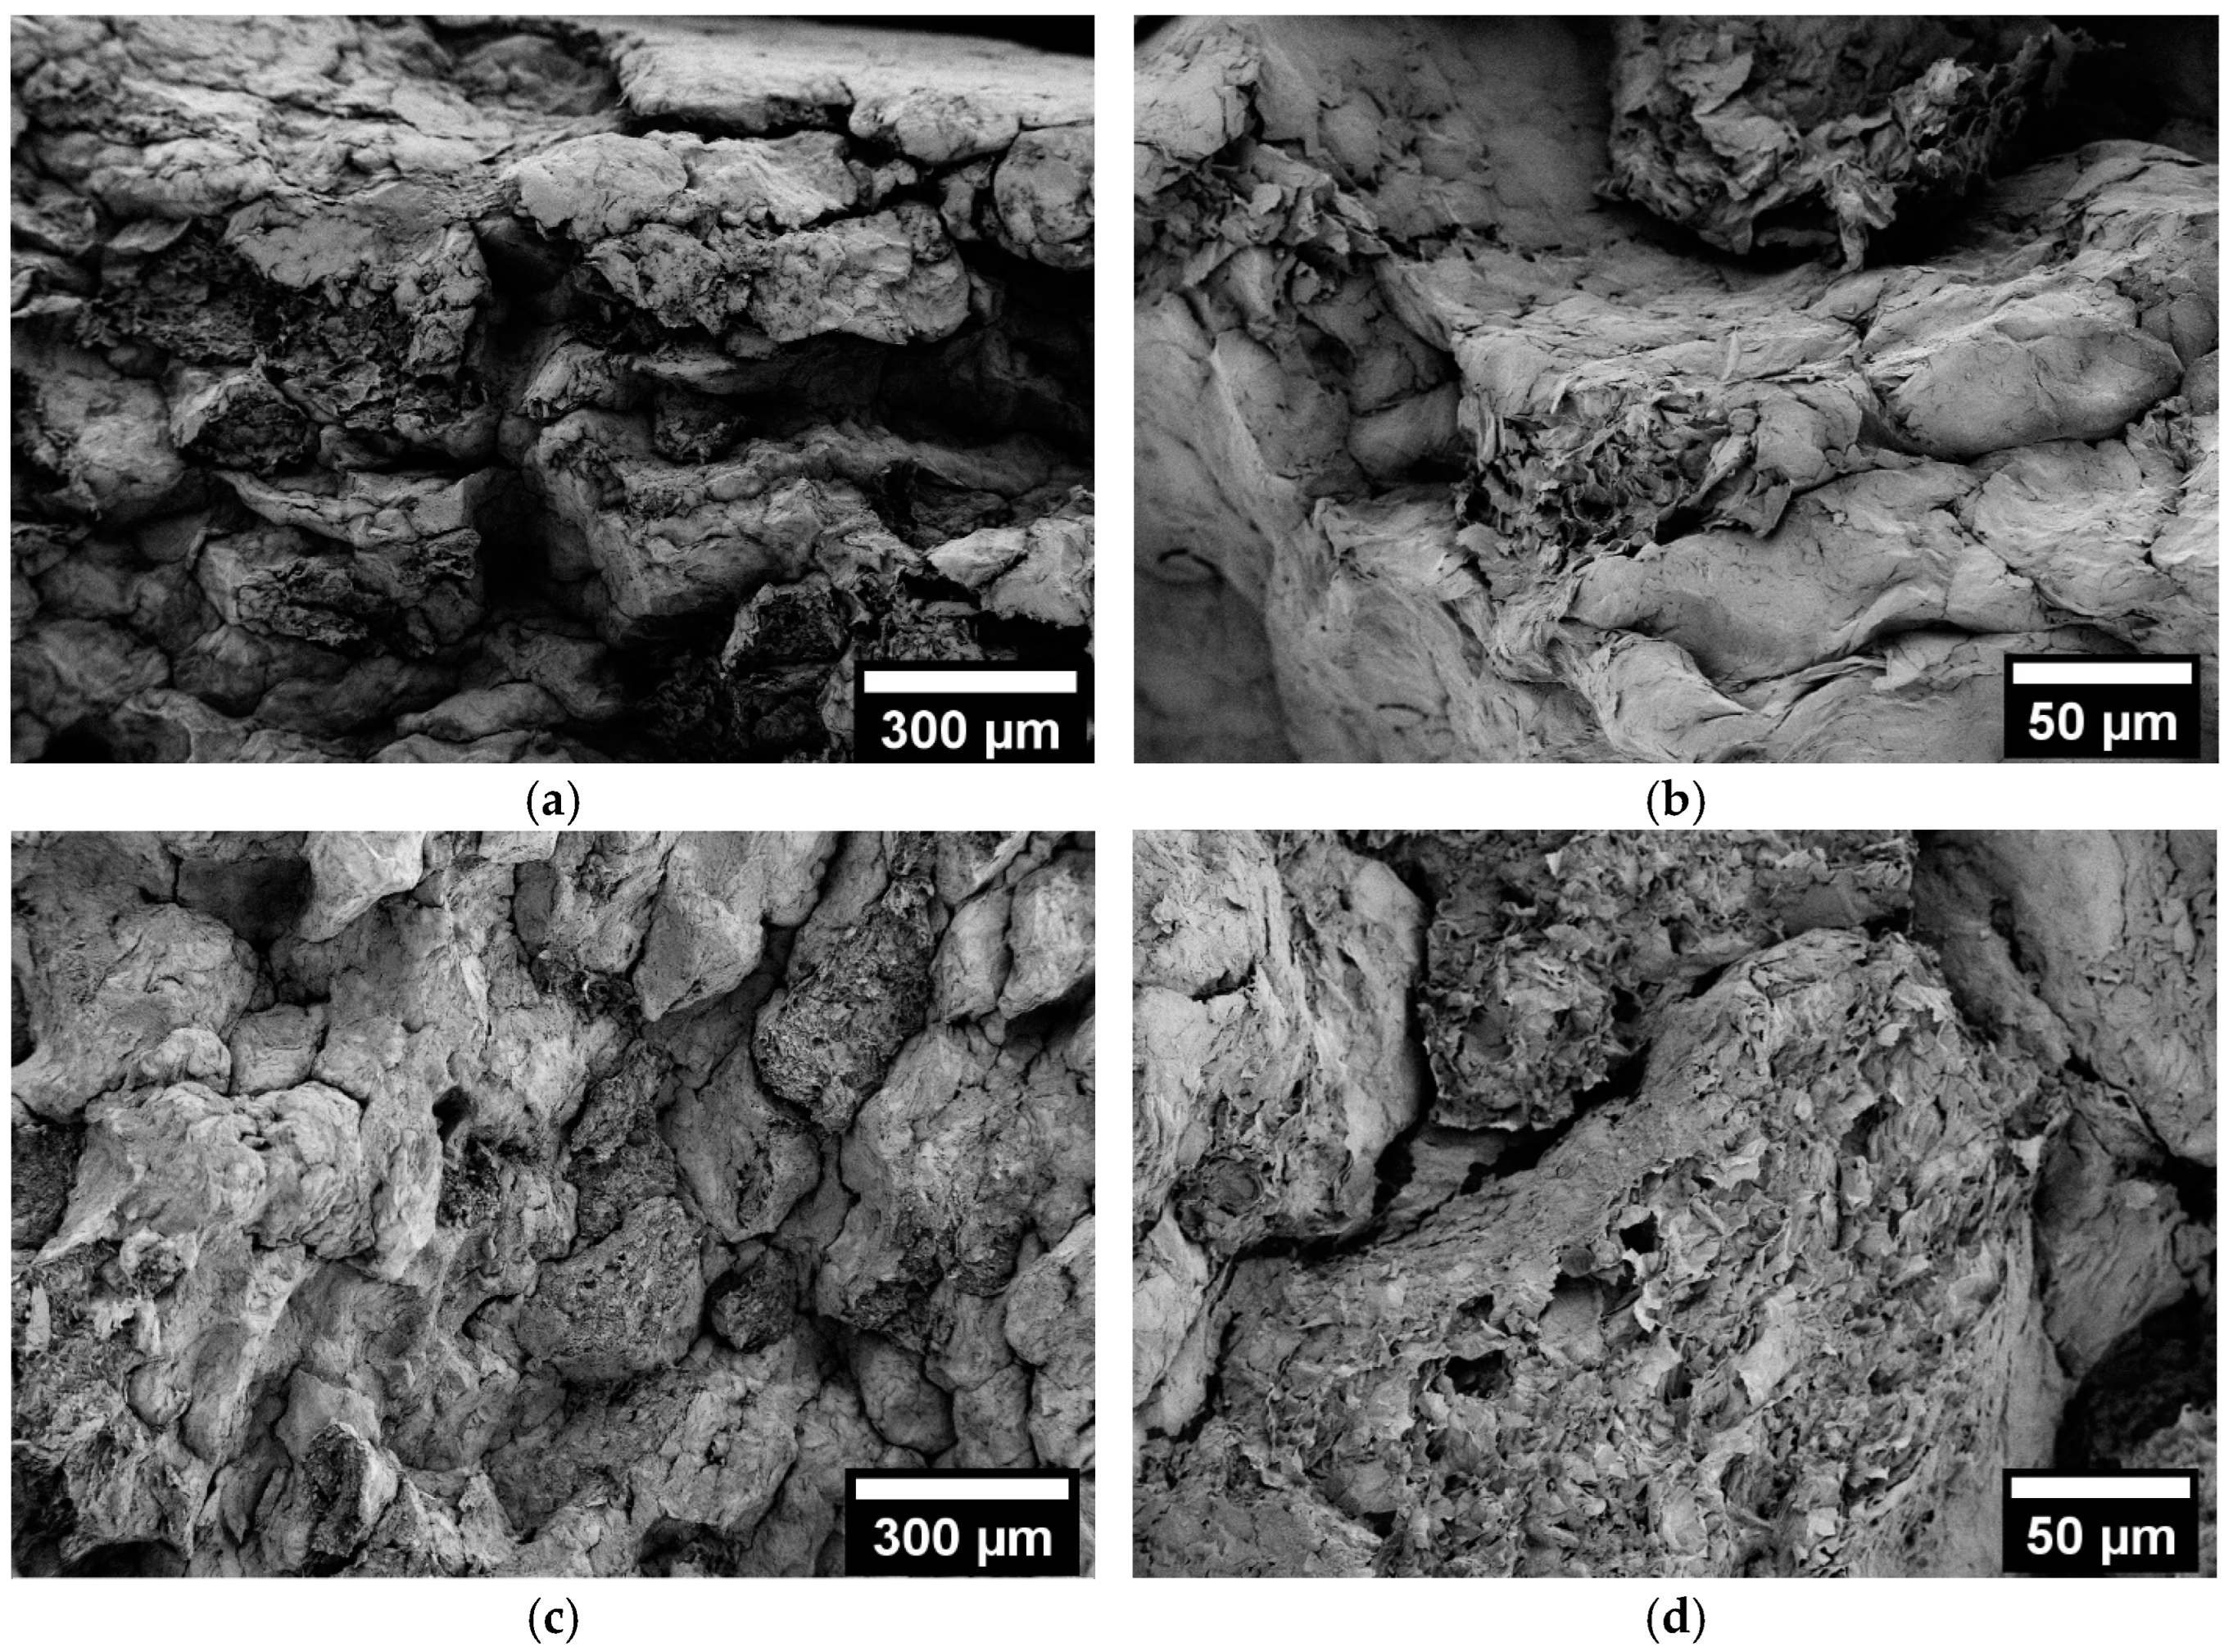
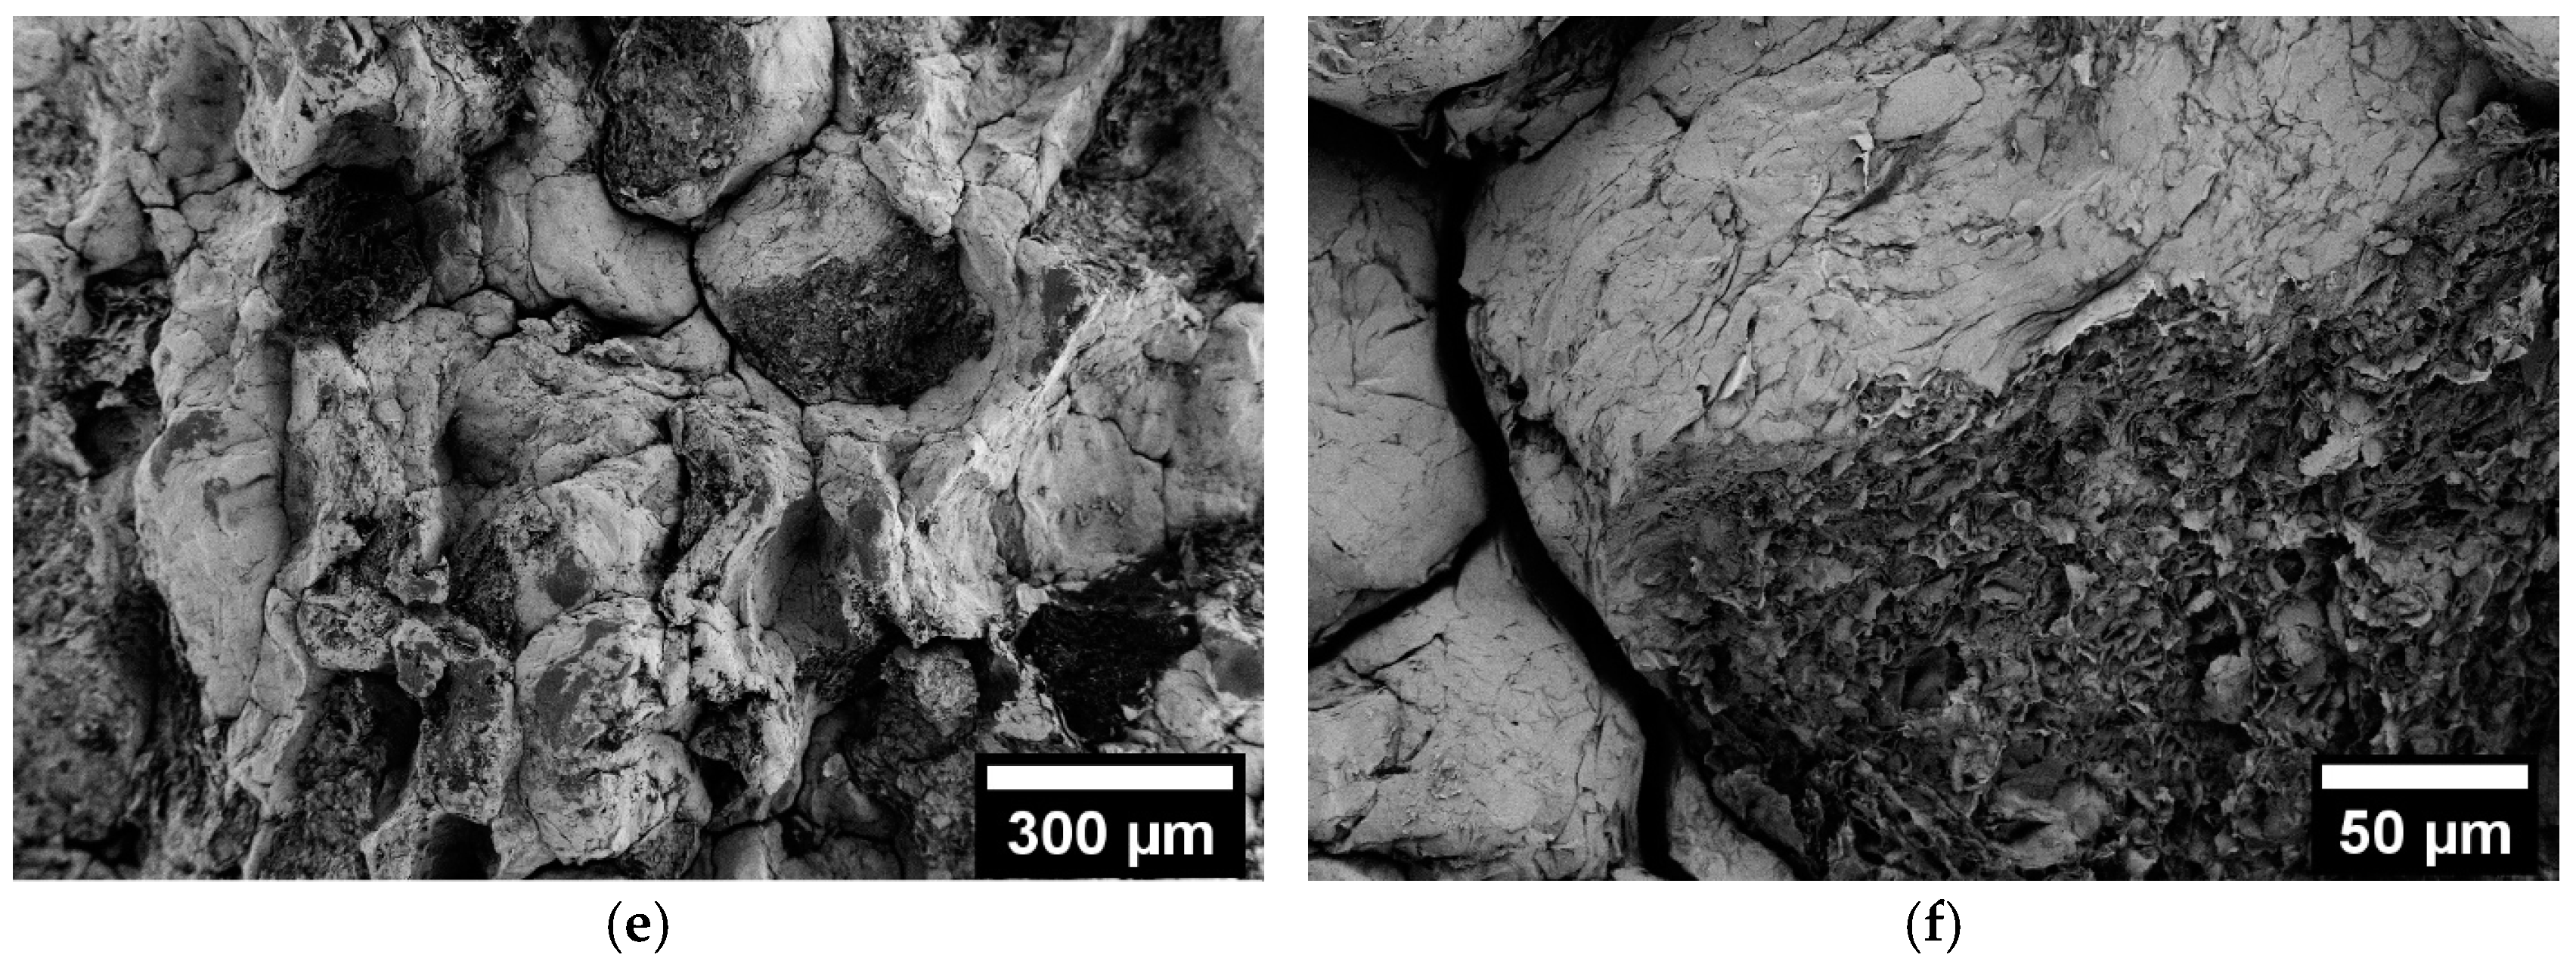
3.3. Scanning Electron Microscopy (SEM)

The EG before impregnation was observed to identify the effect of the expansion in the lamellar plane spacing, as shown in Figure 4.
Figure 4a shows an image of carbon monolayers in a granule, whose inter-layer distance is typically 3.35 Å [42]. Figure 4b is focused on a micrometric space between the packets of carbon planes in which the PCM domains can be allocated, evidencing the low exfoliation degree of EG. The shape and dimensions of the introduced porosity allows high capillary forces once the PCM is molten, a characteristic which further confirms that this graphite expansion is suitable for PCM shape stabilization.
Figure 5a–f show SEM micrographs of the fracture surfaces of the compacted samples at two different magnitudes.
From Figure 5, the distinct powdery granules are recognizable. They are only weakly connected thanks to the cold compaction process, which, using granule interlocking, infers acceptable mechanical properties when the PCM is solid and permits shape maintenance above the melting point. At these magnifications, no substantial differences can be noted comparing the three samples. However, higher magnifications were critical also when using a low voltage due to PCM melting in the observed zone, favored by the high vacuum level. The morphologies are coherent with those encountered in a former study [39]. Fractures occur for both intergranular detachment and granule breaking, even if it is quite difficult to distinguish the open porosity of granules, which permits the impregnation of mechanically cracked granules.

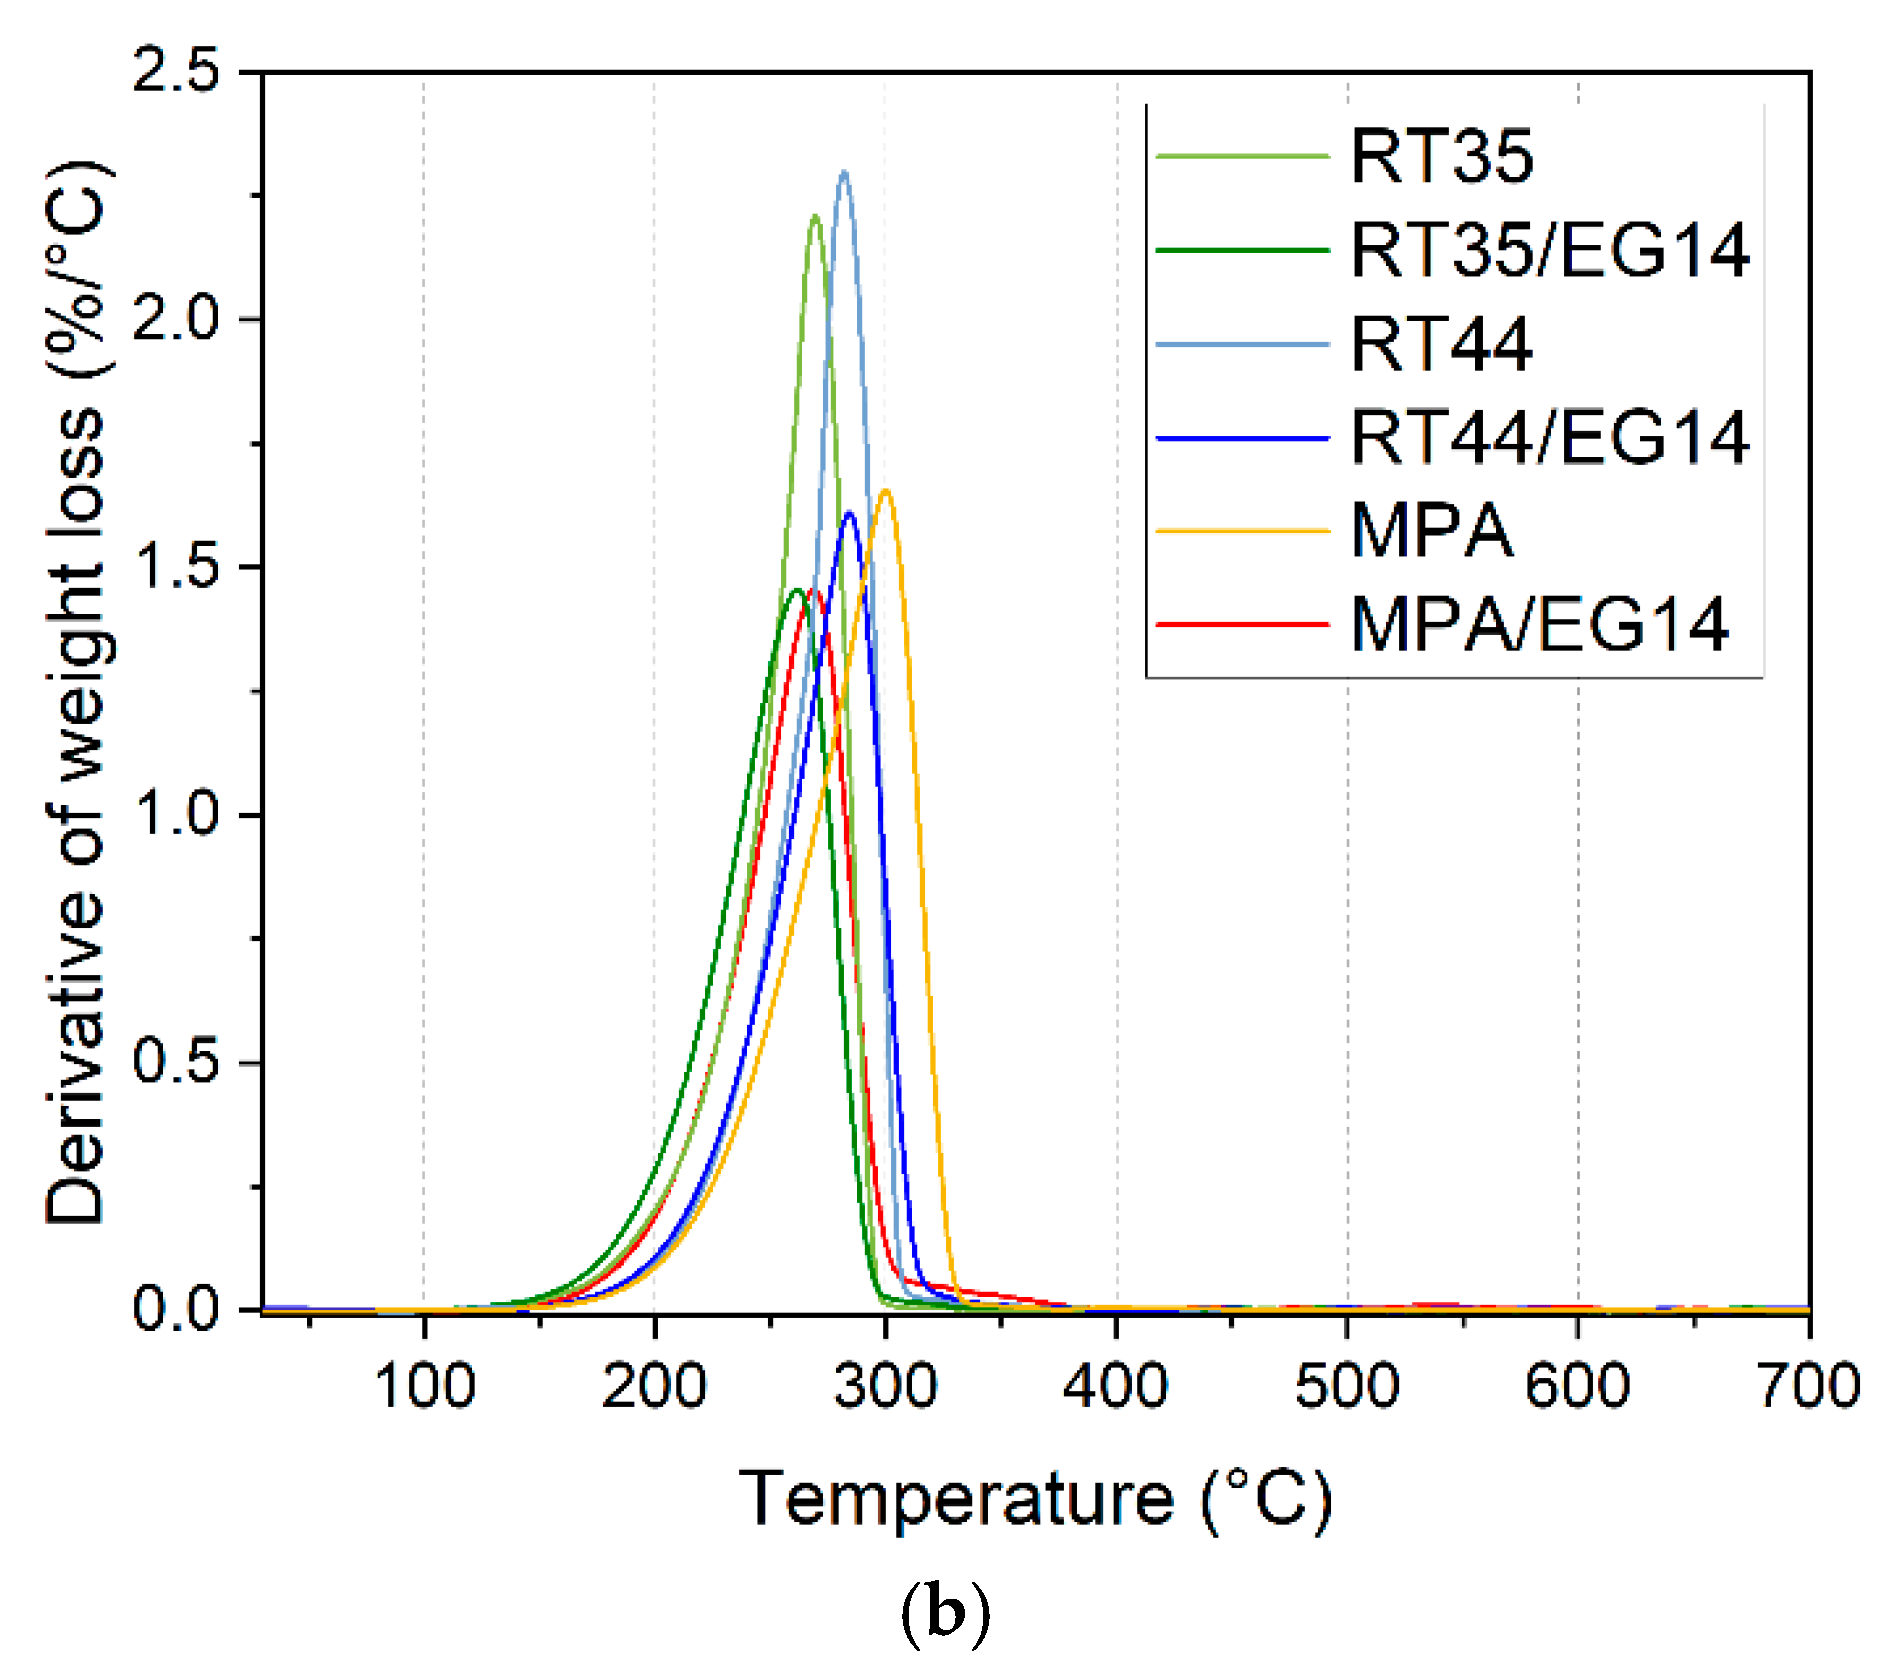
3.4. Thermogravimetric Analysis (TGA)

Figure 6 shows the TGA curves of the neat PCMs and composite samples as the residual mass and derivative of weight loss. The main results are summarized in Table 2.
It is evident that the full thermal degradation of the PCMs occurs in the temperature range of 200–300 °C, with faster mass loss for paraffins with respect to the fatty acid mixture. The residues at 700 °C are consistent with the EG content (12.3 wt.%), in fact, EG is stable in the considered temperature interval [39]. Discrepancies from the nominal value can be attributed to local inhomogeneities in the PCM-to-EG ratio.

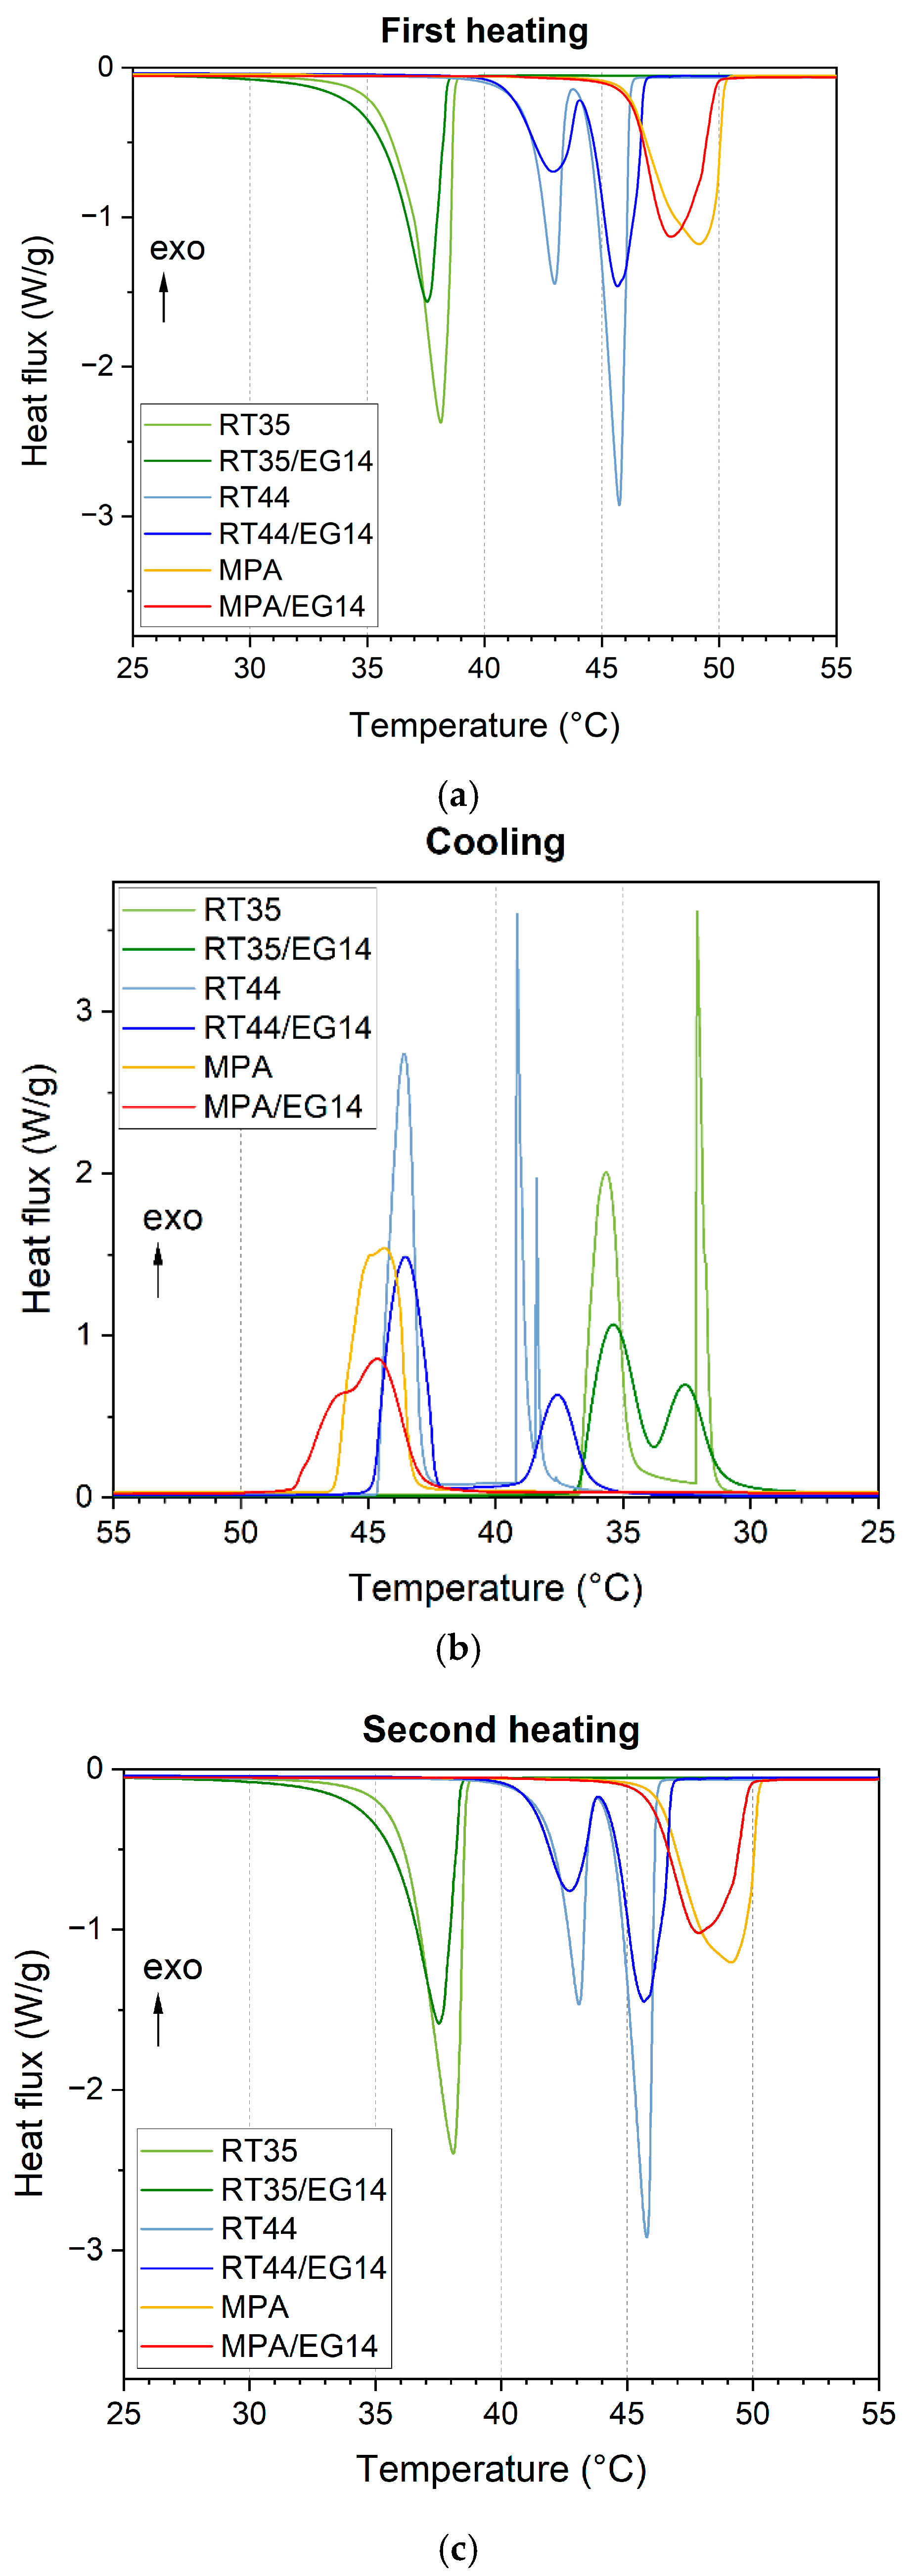
3.5. Differential Scanning Calorimetry (DSC)

The phase transition temperatures and enthalpies of the neat PCMs and composite samples can be determined from the DSC thermograms shown in Figure 7, the main results of which are summarized in Table 3.
The temperature range of melting is between 30 °C and 50 °C for all of the compositions. As expected, RT35 presents a lower melting point, even completing the phase transition before the start of RT44 melting. The MPA is the last to melt, with the entire transition occurring in the 45–50 °C range, slightly above that expected for this composition (61 wt.% myristic acid, 39 wt.% palmitic acid) [43].
RT44 shows an extraordinary high melting enthalpy (270 J/g), RT35 has an intermediate value (236 J/g), and the lowest value belongs to MPA (196 J/g). This last material, obtained by mixing two fatty acids, benefits from a tuned melting enthalpy, reduced with respect to its neat precursors. However, it suffers from melting enthalpy reduction as a consequence of the mixing of its precursors.
RT44 presents a double peak in melting, probably corresponding to two distinct stable molecular weight fractions, with C22 predominating [44]. When cooling, this separation appears even more evident, with the second peak at 39 °C being very sharp. Likewise, RT35 presents a double crystallization peak with a very similar shape to that of RT44, shifted to lower temperatures and with closer peaks. This peak separation can be attributed to the crystallization of the more mobile fraction of PCM (first peak), which acts as a nucleating site for crystallizing the remaining molecules [35]. MPA does not present any peak separation, even if a shoulder can be noticed in crystallization.
EG enhances the PCM thermal response anticipating the phase transition, even if the scanning rate was selected to minimize this effect. RT35/EG14 exploits the melting enthalpy coherent to the expected value, while RT44/EG14 and MPA/EG14 shows around 93% of the theoretical enthalpy. A possible explanation could be a local inhomogeneity of the impregnation, with a higher graphite content in the scanned specimens in comparison with the nominal composition.

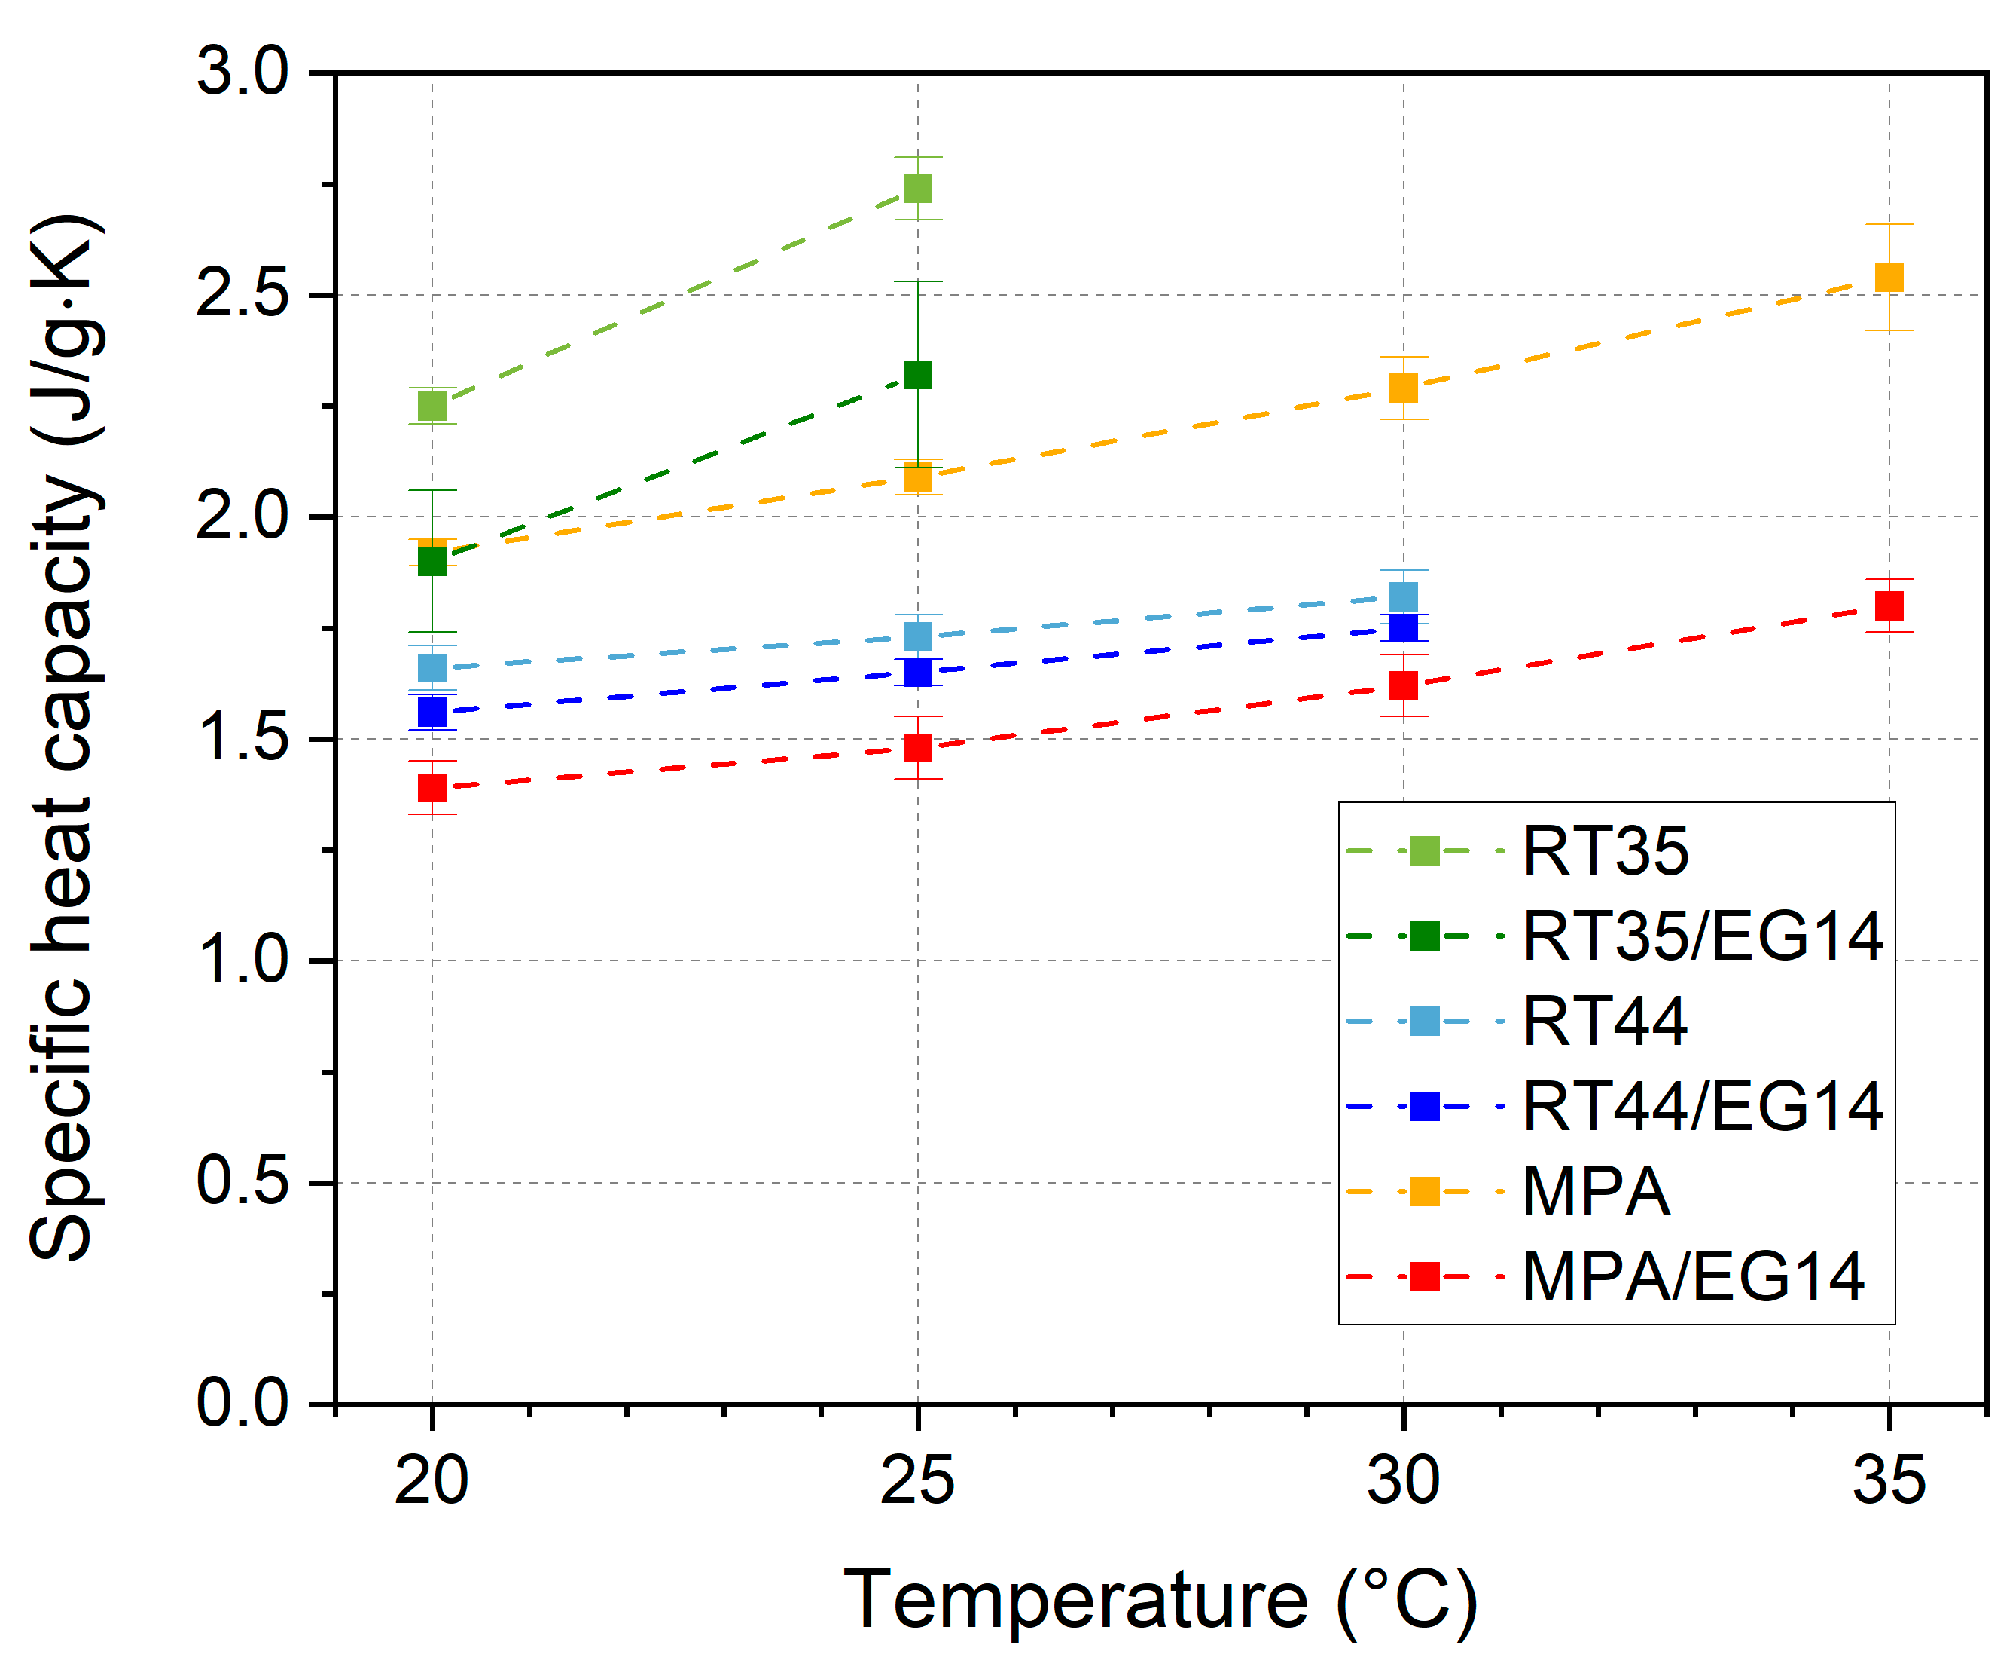
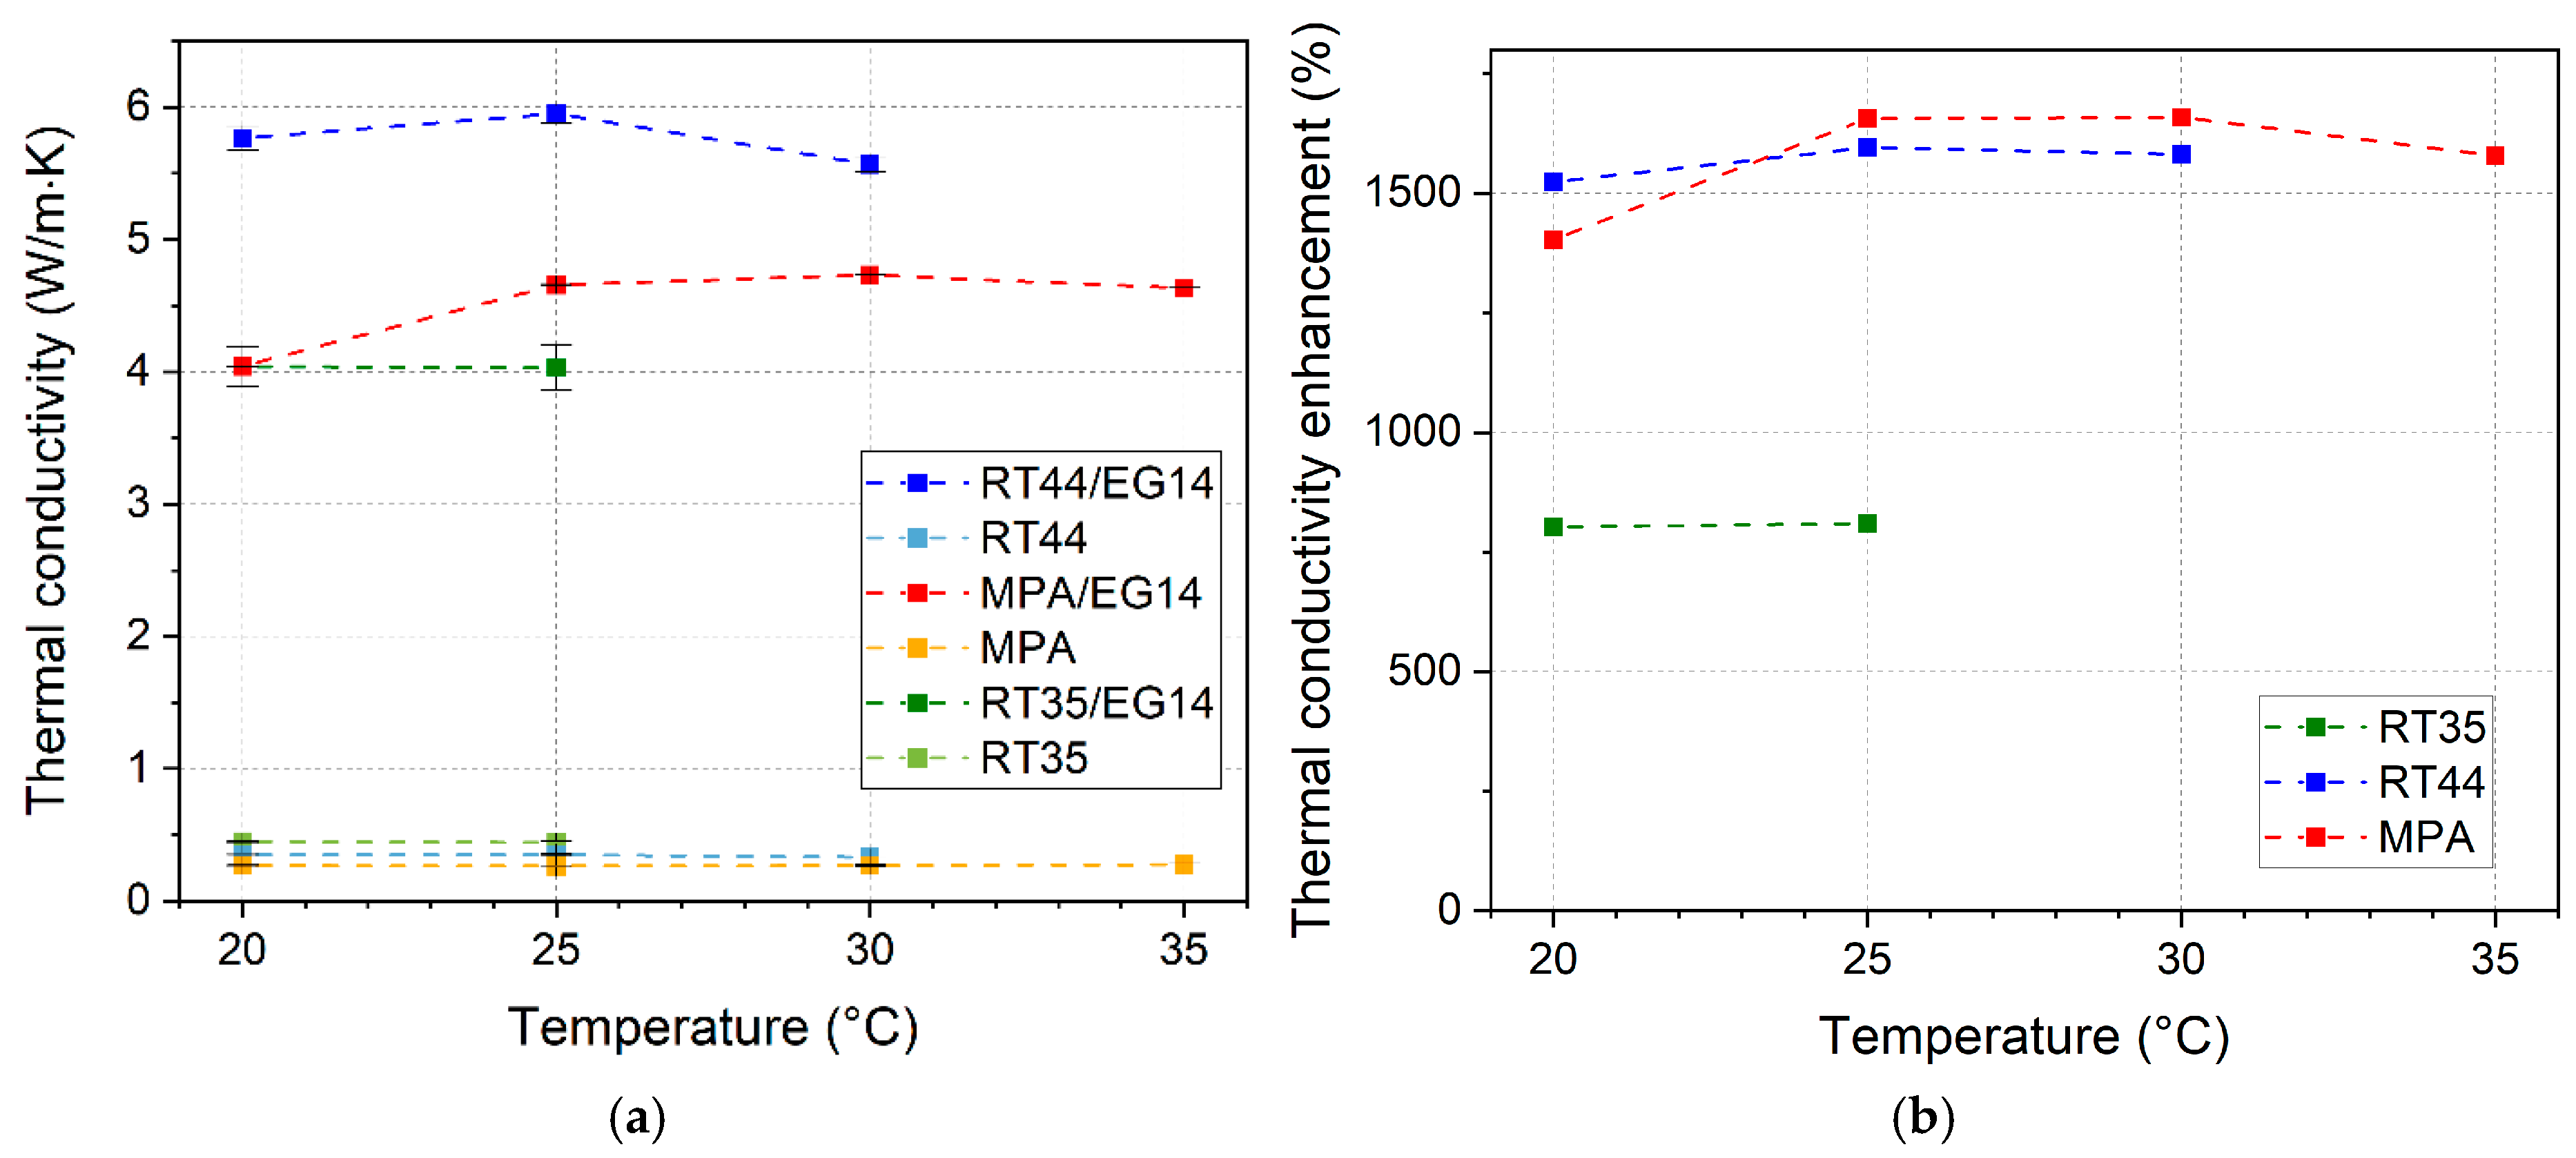
3.6. Specific Heat Capacity, Thermal Diffusivity, and Thermal Conductivity

The specific heat capacity values in the solid state of the neat PCMs and impregnated EG are reported in Figure 8.
The specific heat capacity strongly increases with temperature, confirming well-known trends already encountered for other organic PCMs [45], and an incipient variation before the main melting point was observed, with a direct consequence on the cp evaluation, as observable in other studies on PCM’s thermophysical properties [46,47,48].
Note that for RT35 and RT35/EG14, the specific heat capacity evaluation is not possible above 25 °C because the phase transition has already started; hence, the specific heat capacity cannot be defined. The same consideration is valid for RT44 and RT44/EG14 above 30 °C. The trend for each PCM is confirmed also in the presence of EG, which decreases the specific heat capacity in all of the compositions due to the lower specific heat capacity of EG [39,49], particularly for MPA. On the contrary, RT44 is not drastically affected by the EG addition.
Moreover, an uncertainty of ±4% in the heat flux, due to DSC calibration, must be taken into consideration [50]. The mean values and standard deviation of the three tested specimens for each sample are reported in the results to simplify the visualization. However, the trends are not affected by this issue, because the same calibration was adopted for all the specimens.
The EG’s beneficial effect on enhancing the thermal diffusivity can be seen in Figure 9a, and in Figure 9b, the thermal diffusivity values are normalized with respect to those of the neat PCMs to appreciate the improvement inferred by EG.
From Figure 9a, an opposite trend with respect to the specific heat capacity can be noticed, with a decrease in thermal diffusivity when the temperature increases. Also, in this case, the most pronounced decreasing trend with temperature is presented by RT35/EG14, which, in this case, possesses the lowest values among the three compositions. From Figure 9b, it is possible to appreciate how the highest thermal diffusivity increase, thanks to the EG matrix, is exploited by MPA (more than 20 times), followed by RT44 (around 13 times), and finally RT35 (8 times).
The thermal conductivity values, calculated using Equation (3), are reported in Figure 10.
Although the specific heat capacity and thermal diffusivity are directly measured independently, the indirectly evaluated thermal conductivity trends are quite constant with temperature; hence, a sort of compensation between thermal diffusivity decrease and specific heat capacity increase occurs. This constancy of the thermal conductivity with temperature is in agreement with many other studies, but, rarely, it is correlated to two opposite trends of specific heat capacity and thermal diffusivity.
The highest value is 5.95 ± 0.07 W/m·K, reached at 25 °C by RT44/EG14, which corresponds to an enhancement of 16 times with respect to the neat PCM. Lower values are obtained for MPA/EG14 (4.73 ± 0.01 W/m·K at 30 °C) and RT35/EG14 (4.03 ± 0.15 W/m·K at 25 °C). The high uncertainty in the determination of the specific heat capacity of RT35/EG14 propagates to the thermal conductivity, leading to standard deviation values much higher with respect to RT44/EG14 and MPA/EG14.
The EG’s effect in increasing thermal conductivity is predominant in the cases of MPA and RT44 (more than 15 times), while, for RT35, is slightly higher than 8 times, as clear in Figure 10b. In any case, the thermal conductivities are in the range 0.25–0.45 W/m·K for all of the neat PCMs, and they are increased above 4 W/m·K in the composites.
Errors in these measurements can arise from different applied pressures during specimen preparation or from improper EG impregnation, which strongly affects not only the bulk density but also the thermal diffusivity; a higher void fraction will reflect a lower thermal diffusivity because voids are excellent thermal insulators [39].
These obtained thermal conductivity values are compared in Table 4 with those obtained in representative studies in which EG was used to increase the PCM thermal conductivity. Both fatty acids and paraffins were considered with melting temperatures in the ranges 18–69 °C and 36–64 °C, respectively.
Table 4 evidences the large amount of data related to the thermal conductivity of various PCM/EG composites with melting temperatures in the range 18 °C and 69 °C. The higher the EG content, the higher the thermal conductivity. The highest values of thermal conductivity, 8–24 W/mK, were obtained with the composition with 25% EG in stearic acid for applications at a high temperature (Tm 69 °C).
Moreover, as is clear from Table 4, our vacuum impregnation and compaction process permits a thermal conductivity enhancement in the range 4–6 W/m·K, higher than the majority of works in which the main production strategies consist of melt PCM mixing with EG.

3.7. Comparative Thermal Management System Properties

Table 5 compares the main properties of the thermal management systems, considering panels 2 cm thick. A qualitative and quantitative comparison of the material performances can be represented by the thermal management ability (TMA) for a panel of thickness 2 cm, expressed as the normalized energy for surface unit [35].
T M A = H m 2 · ρ · V A
where V is the volume of a panel 100 × 100 × 2 cm3, and A is the unitary area of 1 m2. Preliminary panels of the three PCM compounds were prepared with a constant weight of 70 g and a constant surface dimension of 62 × 62 mm2. The resulting thickness (t) and thermal energy capacity (TEC) values, calculated according to Equation (5), can be considered peculiar parameters of the realized thermal management panels.
T E C = H m · m
where m is the mass of the panels, equal to 70 g for all the systems.
RT44/EG14 clearly appears to be the best candidate in terms of the ability to subtract heat and have a high thermal conductivity. However, the melting temperature range plays a fundamental role in material selection; hence, RT35/EG14, even though it presents a lower thermal management ability, could be preferable for setting a lower temperature control. Outdoor tests to verify the PV cell performance will be necessary. MPA/EG14 had the worst ability to store heat, even when, considering the higher melting temperature range, the daily temperature peak was completely smooth.

4. Conclusions

In this work, PCM panels for PV applications were successfully prepared and compared. EG vacuum impregnation is confirmed as a suitable process for the shape stabilization of organic PCMs, either paraffin (RT35 and RT44) or a fatty acid mixture (MPA). EG is particularly effective in avoiding MPA leakage, probably due to the stronger polar interaction and the planar shape of the crystals. Panels with a fixed geometry can be obtained via a cold compaction process, additionally conferring a low void fraction to the composites. Consequently, the graphitic network enhances the thermal conductivity from 7 to 16 times with respect to the neat PCMs, with and the maximum reached value of 6 W/m·K was approached by RT44/EG14 at 25 °C. The high melting enthalpy of the thermal management systems was maintained thanks to the low EG fraction (14 phr), guaranteeing 3.3–4.4 MJ/m2 of thermal management ability. The intervals in which the cooling action can be exploited are 30–39 °C for RT35/EG14, 40–47 °C for RT44/EG14, and 45–51 °C for MPA/EG14. Outdoor tests with the thermal management panels coupled to silicon PV cells will be necessary to make conclusions regarding the effectiveness of improving the PV conversion efficiency, which will depend not only on the material properties but also on the environmental conditions at a specific latitude and season. Thereby, a rank of the investigated systems cannot be drafted a priori and all of the passive cooling systems developed in this study can be considered good candidates in PV applications. The obtained PCM-based panels were attached to the rear of the polycrystalline silicon cells, whose efficiency improvement was quantified under exposure to sunlight conditions during the summer of 2024 at a latitude of 46° N. The results of the PV tests by using the selected PCM/EG panels will be presented in a forthcoming paper.

Author Contributions

Conceptualization, S.S., F.V., L.F. and R.P.; methodology, S.S., F.V., L.F., M.G. and R.P.; validation, S.S., R.P. and L.F.; formal analysis, S.S.; investigation, S.S.; resources, L.F.; data curation, S.S.; writing—original draft preparation, S.S; writing—review and editing, F.V. and L.F.; supervision, F.V., R.P. and L.F.; project administration, R.P. and L.F. All authors have read and agreed to the published version of the manuscript.

Funding

This research received no external funding.

Institutional Review Board Statement

Not applicable.

Informed Consent Statement

Not applicable.

Data Availability Statement

The raw data supporting the conclusions of this article will be made available by the authors on request.

Acknowledgments

We kindly acknowledge Alice Benin for her help in material preparation.

Conflicts of Interest

The authors Marco Guidolin and Riccardo Po were employed by the company Eni S.p.A. The remaining authors declare that the research was conducted in the absence of any commercial or financial relationships that could be construed as a potential conflict of interest.

References

  1. Photovoltaics Report. Available online: https://www.ise.fraunhofer.de/en/publications/studies/photovoltaics-report.html (accessed on 1 August 2024).
  2. Alliance, G.R.; Presidency, C. Tripling Renewable Power and Doubling Energy Efficiency by 2030: Crucial Steps Towards 1.5 °C. 2023. Available online: https://www.irena.org/Publications/2023/Oct/Tripling-renewable-power-and-doubling-energy-efficiency-by-2030 (accessed on 25 March 2025).
  3. Green, M.A.; Ho-Baillie, A.; Snaith, H.J. The emergence of perovskite solar cells. Nat. Photonics 2014, 8, 506–514. [Google Scholar] [CrossRef]
  4. Bisconti, F.; Giuri, A.; Suhonen, R.; Kraft, T.M.; Ylikunnari, M.; Holappa, V.; Po’, R.; Biagini, P.; Savoini, A.; Marra, G.; et al. One-step polymer assisted roll-to-roll gravure-printed perovskite solar cells without using anti-solvent bathing. Cell Rep. Phys. Sci. 2021, 2, 100639. [Google Scholar] [CrossRef]
  5. Di Sabatino, M.; Hendawi, R.; Garcia, A.S. Silicon Solar Cells: Trends, Manufacturing Challenges, and AI Perspectives. Crystals 2024, 14, 167. [Google Scholar] [CrossRef]
  6. Best Efficiency Cells Chart. Available online: https://www.nrel.gov/pv/cell-efficiency.html (accessed on 13 January 2025).
  7. Hamzat, A.K.; Sahin, A.Z.; Omisanya, M.I.; Alhems, L.M. Advances in PV and PVT cooling technologies: A review. Sustain. Energy Technol. Assess. 2021, 47, 101360. [Google Scholar] [CrossRef]
  8. Utomo, B.; Darkwa, J.; Du, D.; Worall, M. Solar photovoltaic cooling and power enhancement systems: A review. Renew. Sustain. Energy Rev. 2025, 216, 115644. [Google Scholar] [CrossRef]
  9. Harmailil, I.O.; Sultan, S.M.; Tso, C.P.; Fudholi, A.; Mohammad, M.; Ibrahim, A. A review on recent photovoltaic module cooling techniques: Types and assessment methods. Results Eng. 2024, 22, 102225. [Google Scholar] [CrossRef]
  10. Ahmed, Y.E.; Maghami, M.R.; Pasupuleti, J.; Danook, S.H.; Basim Ismail, F. Overview of Recent Solar Photovoltaic Cooling System Approach. Technologies 2024, 12, 171. [Google Scholar] [CrossRef]
  11. Lawag, R.A.; Ali, H.M. Phase change materials for thermal management and energy storage: A review. J. Energy Storage 2022, 55, 105602. [Google Scholar] [CrossRef]
  12. Cao, Y.; Su, J.; Xiao, Y.; Ren, J.; Algadi, H.; Yeszhanova, E.; Sartayeva, A.; Huang, J.; Guo, Z.; Tynybekov, B.; et al. Functional biomass/biological macromolecular phase change composites and their applications in different scenarios: A review. Int. J. Biol. Macromol. 2025, 306, 141377. [Google Scholar] [CrossRef]
  13. Valentini, F.; Grigiante, M.; Prada, A.; Fambri, L.; Dorigato, A.; Pegoretti, A. Experimental dynamic thermal properties determination of EPDM/NBR panels with a shape stabilized Phase Change Material based on summer daily temperatures of four cities in Italy. Energy Build. 2024, 318, 114503. [Google Scholar] [CrossRef]
  14. Maqbool, Z.; Hanief, M.; Parveez, M. Review on performance enhancement of phase change material based heat sinks in conjugation with thermal conductivity enhancers for electronic cooling. J. Energy Storage 2023, 60, 106591. [Google Scholar] [CrossRef]
  15. Khan, M.M.; Alkhedher, M.; Ramadan, M.; Ghazal, M. Hybrid PCM-based thermal management for lithium-ion batteries: Trends and challenges. J. Energy Storage 2023, 73, 108775. [Google Scholar] [CrossRef]
  16. Ji, W.; Dang, Y.; Yu, Y.; Zhou, X.; Li, L. Combination of Phase Change Composite Material and Liquid-Cooled Plate Prevents Thermal Runaway Propagation of High-Specific-Energy Battery. Appl. Sci. 2025, 15, 1274. [Google Scholar] [CrossRef]
  17. Du, K.; Calautit, J.; Eames, P.; Wu, Y. A state-of-the-art review of the application of phase change materials (PCM) in Mobilized-Thermal Energy Storage (M-TES) for recovering low-temperature industrial waste heat (IWH) for distributed heat supply. Renew. Energy 2021, 168, 1040–1057. [Google Scholar] [CrossRef]
  18. Qu, X.; Qi, X.; Fang, D. A Novel Liquid–Solid Fluidized Bed of Large-Scale Phase-Changing Sphere for Thermal Energy Storage. Appl. Sci. 2024, 14, 9828. [Google Scholar] [CrossRef]
  19. Wongwuttanasatian, T.; Sarikarin, T.; Suksri, A. Performance enhancement of a photovoltaic module by passive cooling using phase change material in a finned container heat sink. Sol. Energy 2020, 195, 47–53. [Google Scholar] [CrossRef]
  20. Gao, L.; Zhang, X.; Hua, W. Recent progress in photovoltaic thermal phase change material technology: A review. J. Energy Storage 2023, 65, 107317. [Google Scholar] [CrossRef]
  21. Ortiz Lizcano, J.C.; Ziar, H.; De Mooij, C.; Verheijen, M.P.F.; Van Nierop Sanchez, C.; Ferlito, D.; Connelli, C.; Canino, A.; Zeman, M.; Isabella, O. Long-term experimental testing of phase change materials as cooling devices for photovoltaic modules. Sol. Energy Mater. Sol. Cells 2024, 277, 113133. [Google Scholar] [CrossRef]
  22. Wieprzkowicz, A.; Heim, D.; Knera, D. Coupled Model of Heat and Power Flow in Unventilated PV/PCM Wall-Validation in a Component Scale. Appl. Sci. 2022, 12, 7764. [Google Scholar] [CrossRef]
  23. Mousavi Ajarostaghi, S.S.; Amiri, L.; Poncet, S. Application of Thermal Batteries in Greenhouses. Appl. Sci. 2024, 14, 8640. [Google Scholar] [CrossRef]
  24. Luo, J.; Zou, D.; Wang, Y.; Wang, S.; Huang, L. Battery thermal management systems (BTMs) based on phase change material (PCM): A comprehensive review. Chem. Eng. J. 2022, 430, 132741. [Google Scholar] [CrossRef]
  25. Kumar, K.; Sharma, K.; Verma, S.; Upadhyay, N. Experimental Investigation of Graphene-Paraffin Wax Nanocomposites for Thermal Energy Storage. Mater. Today Proc. 2019, 18, 5158–5163. [Google Scholar] [CrossRef]
  26. Kumar, A.; Gupta, A.; Sharma, K.; Singh, M. Effect of graphene oxide on thermal charging and discharging behaviour of paraffin wax as nano-enhanced phase change materials. MRS Adv. 2024, 9, 1213–1218. [Google Scholar] [CrossRef]
  27. Gao, L.; Sun, X.; Sun, B.; Che, D.; Li, S.; Liu, Z. Preparation and thermal properties of palmitic acid/expanded graphite/carbon fiber composite phase change materials for thermal energy storage. J. Therm. Anal. Calorim. 2020, 141, 25–35. [Google Scholar] [CrossRef]
  28. Ao, C.; Yan, S.; Zhao, S.; Hu, W.; Zhao, L.; Wu, Y. Stearic acid/expanded graphite composite phase change material with high thermal conductivity for thermal energy storage. Energy Rep. 2022, 8, 4834–4843. [Google Scholar] [CrossRef]
  29. Zhou, D.; Xiao, S.; Xiao, X. Preparation and Thermal Performance of Fatty Acid Binary Eutectic Mixture/Expanded Graphite Composites as Form-Stable Phase Change Materials for Thermal Energy Storage. ACS Omega 2023, 8, 8596–8604. [Google Scholar] [CrossRef] [PubMed]
  30. Feng, L.; Wu, J.; Sun, W.; Cai, W. Effects of Pore Structure and Pore Size of Expanded Graphite on the Properties of Paraffin Wax/Expanded Graphite Composite Phase Change Materials. Energies 2022, 15, 4201. [Google Scholar] [CrossRef]
  31. Yang, K.; Zhang, X.; Venkataraman, M.; Wiener, J.; Palanisamy, S.; Sozcu, S.; Tan, X.; Kremenakova, D.; Zhu, G.; Yao, J.; et al. Structural Analysis of Phase Change Materials (PCMs)/Expanded Graphite (EG) Composites and Their Thermal Behavior under Hot and Humid Conditions. ChemPlusChem 2023, 88, e202300081. [Google Scholar] [CrossRef]
  32. Islam, A.; Pandey, A.K.; Saidur, R.; Tyagi, V.V. Shape stable composite phase change material with improved thermal conductivity for electrical-to-thermal energy conversion and storage. Mater. Today Sustain. 2024, 25, 100678. [Google Scholar] [CrossRef]
  33. Palacios, A.; Navarro-Rivero, M.E.; Zou, B.; Jiang, Z.; Harrison, M.T.; Ding, Y. A perspective on Phase Change Material encapsulation: Guidance for encapsulation design methodology from low to high-temperature thermal energy storage applications. J. Energy Storage 2023, 72, 108597. [Google Scholar] [CrossRef]
  34. Patil, J.R.; Mahanwar, P.A.; Sundaramoorthy, E.; Mundhe, G.S. A review of the thermal storage of phase change material, morphology, synthesis methods, characterization, and applications of microencapsulated phase change material. J. Polym. Eng. 2023, 43, 354–375. [Google Scholar] [CrossRef]
  35. Sacchet, S.; Valentini, F.; Rizzo, C.; Po, R.; Fambri, L. High density polyethylene with phase change materials for thermal energy management. Energy Mater. 2025, 5, 500042. [Google Scholar] [CrossRef]
  36. Rigotti, D.; Dorigato, A.; Pegoretti, A. Multifunctional 3D-Printed Thermoplastic Polyurethane (TPU)/Multiwalled Carbon Nanotube (MWCNT) Nanocomposites for Thermal Management Applications. Appl. Sci. 2024, 14, 9614. [Google Scholar] [CrossRef]
  37. Kaygusuz, K.; Alkan, C.; Sari, A.; Uzun, O. Encapsulated Fatty Acids in an Acrylic Resin as Shape-stabilized Phase Change Materials for Latent Heat Thermal Energy Storage. Energy Sources Part A Recovery Util. Environ. Eff. 2008, 30, 1050–1059. [Google Scholar] [CrossRef]
  38. Valentini, F.; Dorigato, A.; Fambri, L.; Bersani, M.; Grigiante, M.; Pegoretti, A. Production and characterization of novel EPDM/NBR panels with paraffin for potential thermal energy storage applications. Therm. Sci. Eng. Prog. 2022, 32, 101309. [Google Scholar] [CrossRef]
  39. Sacchet, S.; Valentini, F.; Benin, A.; Guidolin, M.; Po, R.; Fambri, L. Expanded Graphite (EG) Stabilization of Stearic and Palmitic Acid Mixture for Thermal Management of Photovoltaic Cells. C 2024, 10, 46. [Google Scholar] [CrossRef]
  40. ASTM E1269-11; Standard Test Method for Determining Specific Heat Capacity by Differential Scanning Calorimetry. ASTM International: West Conshohocken, PA, USA, 2018. Available online: https://www.astm.org/e1269-11.html (accessed on 13 May 2024).
  41. Pan, S.J.; Zhou, J.B.; Li, H.T.; Quan, C. Particle Formation by Supercritical Fluid Extraction and Expansion Process. Sci. World J. 2013, 2013, 538584. [Google Scholar] [CrossRef]
  42. Shulyak, V.A.; Morozov, N.S.; Makhina, V.S.; Klyukova, K.E.; Gracheva, A.V.; Chebotarev, S.N.; Avdeev, V.V. Intercalation of Large Flake Graphite with Fuming Nitric Acid. C 2024, 10, 108. [Google Scholar] [CrossRef]
  43. Shi, Y.; Zhao, Y.; Zhang, Y.; Fan, Z.; Jiang, D. Study on the Reliability and Stability of Fatty Acid-Paraffin Ternary Phase Change Materials as Energy-saving Materials. ChemistrySelect 2024, 9, e202303114. [Google Scholar] [CrossRef]
  44. Matuszek, K.; Kar, M.; Pringle, J.M.; Macfarlane, D.R. Phase Change Materials for Renewable Energy Storage at Intermediate Temperatures. Chem. Rev. 2023, 123, 491–514. [Google Scholar] [CrossRef]
  45. Divi, S.; Chellappa, R.; Chandra, D. Heat capacity measurement of organic thermal energy storage materials. J. Chem. Thermodyn. 2006, 38, 1312–1326. [Google Scholar] [CrossRef]
  46. Ghasemi, K.; Tasnim, S.H.; Mahmud, S. Fabrication and evaluating thermophysical properties of microencapsulated organic and eutectic phase change material. Colloids Surf. A Physicochem. Eng. Asp. 2024, 686, 133395. [Google Scholar] [CrossRef]
  47. Duquesne, M.; Mailhé, C.; Doppiu, S.; Dauvergne, J.-L.; Santos-Moreno, S.; Godin, A.; Fleury, G.; Rouault, F.; Palomo Del Barrio, E. Characterization of Fatty Acids as Biobased Organic Materials for Latent Heat Storage. Materials 2021, 14, 4707. [Google Scholar] [CrossRef]
  48. Nazir, H.; Batool, M.; Ali, M.; Kannan, A.M. Fatty acids based eutectic phase change system for thermal energy storage applications. Appl. Therm. Eng. 2018, 142, 466–475. [Google Scholar] [CrossRef]
  49. Lachheb, M.; Karkri, M.; Albouchi, F.; Mzali, F.; Ben Nasrallah, S. Thermophysical properties estimation of paraffin/graphite composite phase change material using an inverse method. Energy Convers. Manag. 2014, 82, 229–237. [Google Scholar] [CrossRef]
  50. Noël, J.A.; White, M.A. Heat capacities of potential organic phase change materials. J. Chem. Thermodyn. 2019, 128, 127–133. [Google Scholar] [CrossRef]
  51. Sarı, A.; Karaipekli, A. Preparation, thermal properties and thermal reliability of palmitic acid/expanded graphite composite as form-stable PCM for thermal energy storage. Sol. Energy Mater. Sol. Cells 2009, 93, 571–576. [Google Scholar] [CrossRef]
  52. Meng, X.; Zhang, H.; Zhao, Z.; Sun, L.; Xu, F.; Zhang, J.; Jiao, Q.; Bao, Y.; Ma, J. Preparation, Encapsulation and Thermal Properties of Fatty Acid/Expanded Graphite Composites as Shape-stabilized Phase Change Materials. Chem. J. Chin. Univ.-Chin. Ed. 2012, 33, 526–530. [Google Scholar] [CrossRef]
  53. Zhang, N.; Yuan, Y.; Wang, X.; Cao, X.; Yang, X.; Hu, S. Preparation and characterization of lauric–myristic–palmitic acid ternary eutectic mixtures/expanded graphite composite phase change material for thermal energy storage. Chem. Eng. J. 2013, 231, 214–219. [Google Scholar] [CrossRef]
  54. Zhang, N.; Yuan, Y.; Du, Y.; Cao, X.; Yuan, Y. Preparation and properties of palmitic-stearic acid eutectic mixture/expanded graphite composite as phase change material for energy storage. Energy 2014, 78, 950–956. [Google Scholar] [CrossRef]
  55. Wu, S.; Li, T.X.; Yan, T.; Dai, Y.J.; Wang, R.Z. High performance form-stable expanded graphite/stearic acid composite phase change material for modular thermal energy storage. Int. J. Heat Mass Transf. 2016, 102, 733–744. [Google Scholar] [CrossRef]
  56. Zhang, J.-L.; Wu, N.; Wu, X.-W.; Chen, Y.; Zhao, Y.; Liang, J.-F.; Bai, X.-B. High latent heat stearic acid impregnated in expanded graphite. Thermochim. Acta 2018, 663, 118–124. [Google Scholar] [CrossRef]
  57. Li, C.; Zhang, B.; Xie, B.; Zhao, X.; Chen, J.; Chen, Z.; Long, Y. Stearic acid/expanded graphite as a composite phase change thermal energy storage material for tankless solar water heater. Sustain. Cities Soc. 2019, 44, 458–464. [Google Scholar] [CrossRef]
  58. Zhou, D.; Yuan, J.; Zhou, Y.; Liu, Y. Preparation and characterization of myristic acid/expanded graphite composite phase change materials for thermal energy storage. Sci. Rep. 2020, 10, 10889. [Google Scholar] [CrossRef]
  59. Liu, S.; Zhang, X.; Zhu, X.; Xin, S. A Low-Temperature Phase Change Material Based on Capric-Stearic Acid/Expanded Graphite for Thermal Energy Storage. ACS Omega 2021, 6, 17988–17998. [Google Scholar] [CrossRef]
  60. Wang, Z.; Huang, G.; Jia, Z.; Gao, Q.; Li, Y.; Gu, Z. Eutectic Fatty Acids Phase Change Materials Improved with Expanded Graphite. Materials 2022, 15, 6856. [Google Scholar] [CrossRef]
  61. Gao, H.; Bing, N.; Xie, H.; Yu, W. Energy harvesting and storage blocks based on 3D oriented expanded graphite and stearic acid with high thermal conductivity for solar thermal application. Energy 2022, 254, 124198. [Google Scholar] [CrossRef]
  62. Li, J.; Wang, W.; Deng, Y.; Gao, L.; Bai, J.; Xu, L.; Chen, J.; Yuan, Z. Thermal Performance Analysis of Composite Phase Change Material of Myristic Acid-Expanded Graphite in Spherical Thermal Energy Storage Unit. Energies 2023, 16, 4527. [Google Scholar] [CrossRef]
  63. Zhou, D.; Xiao, S.; Liu, Y. The Effect of Expanded Graphite Content on the Thermal Properties of Fatty Acid Composite Materials for Thermal Energy Storage. Molecules 2024, 29, 3146. [Google Scholar] [CrossRef]
  64. Chen, B.; Ruilong, W.; Xueyou, Y.; Ma, A. Thermal and electrical properties of palmitic acid/expanded graphite composite phase change materials for thermal energy storage. Fuller. Nanotub. Carbon Nanostruct. 2024, 32, 1093–1101. [Google Scholar] [CrossRef]
  65. Jesus D’oliveira, E.; Azimov, U.; Costa Pereira, S.-C.; Lafdi, K. Effect of particle size on the thermal conductivity of organic phase change materials with expanded graphite. J. Energy Storage 2024, 92, 112090. [Google Scholar] [CrossRef]
  66. Kenisarin, M.; Mahkamov, K.; Kahwash, F.; Makhkamova, I. Enhancing thermal conductivity of paraffin wax 53–57 °C using expanded graphite. Sol. Energy Mater. Sol. Cells 2019, 200, 110026. [Google Scholar] [CrossRef]
  67. Li, Y.; Yan, H.; Yang, F.; Li, S.; Jiang, C.; Xie, L. Paraffin Wax–Expanded Graphite Composite Phase Change Materials With Enhancing Thermal Conductivity and Thermal Stability for Thermal Energy Storage. ChemistrySelect 2024, 9, e202404879. [Google Scholar] [CrossRef]
Figure 1. Schematic representation of material production through vacuum impregnation and cold compaction.
Applsci 15 04352 g001
Figure 2. FTIR spectra of neat PCMs and composite materials: (a) RT35 and RT35/EG, (b) RT44 and RT44/EG, (c) MPA and MPA/EG.
Applsci 15 04352 g002
Figure 3. Leaking test results at 60 °C. The pictures on the right show the leakage comparison of MPA/EG14 (red frame), RT44/EG14 (blue frame), and RT35/EG14 (green frame) disks after one hour of testing.
Applsci 15 04352 g003
Figure 4. Fracture surface of an EG granule to evidence: (a) the carbon planes of graphite; (b) the additional spacing introduced by the expansion between the lamellae.
Applsci 15 04352 g004
Figure 5. SEM micrographs of compacted samples at low (left) and high magnification (right): RT35/EG14 (a,b), RT44/EG14 (c,d), MPA/EG14 (e,f). Observations performed at 25 °C.
Applsci 15 04352 g005aApplsci 15 04352 g005b
Figure 6. TGA curves: (a) residual mass and (b) derivative of mass loss of neat PCMs and samples.
Applsci 15 04352 g006aApplsci 15 04352 g006b
Figure 7. DSC thermograms of the neat PCM and PCM/EG systems at 1 °C/min: first heating (a), cooling (b), and second heating (c).
Applsci 15 04352 g007
Figure 8. Specific heat capacity in the solid state from 20 °C to 35 °C.
Applsci 15 04352 g008
Figure 9. Thermal diffusivity in the solid state from 20 °C to 35 °C (a) and thermal diffusivity enhancement after EG addition (b).
Applsci 15 04352 g009
Figure 10. Thermal conductivity assuming constant bulk density in the solid state in the range 20–35 °C (a) and thermal conductivity enhancement after EG addition (b).
Applsci 15 04352 g010
Table 1. Sample coding and compositions.
SampleRT35RT44MPAEG
[phr][wt.%][phr][wt.%][phr][wt.%][phr][wt.%]
RT35/EG1410087.7----1412.3
RT44/EG14--10087.7--1412.3
MPA/EG14----10087.71412.3
Table 2. TGA results.
SampleT5%Tpeakm700
[°C][°C][wt.%]
RT35204.5269.30.0
RT35/EG14195.3261.512.5
RT44219.5281.70.0
RT44/EG14217.8284.010.7
MPA223.2299.80.0
MPA/EG14204.3268.812.9
T5% = temperatures associated with a mass loss of 5 wt.%; Tpeak = temperatures associated with the maximum degradation rate; m700 = residual mass at 700 °C.
Table 3. DSC results.
SampleTm1
[°C]
ΔHm1
[J/g]
Tc
[°C]
ΔHc
[J/g]
Tm2
[°C]
ΔHm2
[J/g]
( P C M m 2 e f f )
[wt.%]
η m 2
[wt.%]
RT3537.523436.2–36.723437.4236100100
RT35/EG1437.320435.6–32.720637.220687.499.7
RT4442.7–45.227244.2–39.927045.2–42.8270100100
RT44/EG1442.8–45.422143.8–37.721945.4–42.622081.592.9
MPA48.619345.219648.5196100100
MPA/EG1447.716644.915547.615981.192.5
Melting temperature and enthalpy in the first (Tm1, ΔHm1) and second heating (Tm2, ΔHm2), crystallization temperature and enthalpy (Tc, ΔHc), effective PCM content during second heating scan ( P C M m 2 e f f ), efficiency of melting during the second heating scan ( η m 2 ).
Table 4. Comparative thermal conductivity (λ) of PCM/EG composite based on fatty acid and paraffins at selected different melting temperatures.
PCM TypeTmEG ContentλYear
[°C][wt.%][W/m·K][Reference]
Fatty acid (PA)688.00.82009 [51]
Fatty acid (CA-LA-PA)18n.a.0.72012 [52]
Fatty acid (LA-MA-PA)315.31.72013 [53]
Fatty acid (PA-SA)547.12.52014 [54]
Fatty acid (SA)6915.0–30.07.5–23.32016 [55]
Fatty acid (SA base)535.0–20.01.5–3.22018 [56]
Fatty acid (SA base)532.0–10.00.8–3.62019 [57]
Fatty acid (MA)536.52.12020 [58]
Fatty acid (CA-SA)2510.0–12.00.5–0.62021 [59]
Fatty acid (LA-SA)3110.0–15.00.62022 [60]
Fatty acid (SA)688.0–12.03.3–6.52022 [28]
Fatty acid (SA)695.0–25.00.7–7.72022 [61]
Fatty acid (MA)544.0–6.02.32023 [62]
Fatty acid (CA-MA)195.0–20.00.3–1.22024 [63]
Fatty acid (PA)6116.04.92024 [64]
Fatty acid (PA-SA)539.0–12.34.0–10.32024 [39]
Fatty acids62–662.0–6.00.3–0.52024 [65]
Fatty acid (MA-PA)4812.34.72025 Present study
Paraffin642.0–6.00.3–0.52024 [65]
Paraffin53–576.01.0–1.32019 [66]
Paraffin508.00.82022 [30]
Paraffin3610.0–30.05.3–6.02024 [67]
Paraffin3712.34.02025 Present study
Paraffin4512.36.02025 Present study
Tm = melting temperatures; λ = thermal conductivity value at room temperature (mainly 20–30 °C). CA capric acid; LA lauric acid; PA palmitic acid; MA myristic acid; SA stearic acid.
Table 5. Specifics of realized thermal management systems.
TMS
Panels
ρ
[g/cm3]
λ25
[W/(m·K)]
ΔT +
[°C]
ΔT
[°C]
ΔHm
[J/g]
ΔHm*
[J/cm3]
SD
[kg/m2]
TMA
[MJ/m2]
t
[mm]
TEC
[kJ/Unit]
RT35/EG140.944.0330–3937–3020619418.83.919.414.4
RT44/EG140.995.9540–4745–3522021819.84.418.415.4
MPA/EG141.054.6645–5148–4215916721.03.317.311.7
ρ = bulk density at 25 °C; λ30 = thermal conductivity determined through LFA technique at 30 °C; ΔT + = melting temperature range (heating); ΔT = crystallization temperature range (cooling); ΔHm = specific melting enthalpy (2nd heating scan); ΔHm* = melting enthalpy normalized by volume; SD = surface density of a panel with thickness 20 mm; TMA = thermal management ability of a panel with thickness 20 mm (Equation (4)); t = thickness of a 70 g panel of area 62 × 62 mm2; TEC = thermal management capacity of a panel.
Disclaimer/Publisher’s Note: The statements, opinions and data contained in all publications are solely those of the individual author(s) and contributor(s) and not of MDPI and/or the editor(s). MDPI and/or the editor(s) disclaim responsibility for any injury to people or property resulting from any ideas, methods, instructions or products referred to in the content.

