Abstract
The development of sustainable strategies in the logistics industry is becoming increasingly important due to environmental, economic, and social pressures. This study aims to identify and rank sustainable strategic options in the logistics industry, thereby providing priorities and a hierarchical structure to support the decision-making process. The system of sustainable strategic options is built on the theory of three core factors. The Fuzzy Analytic Hierarchy Process and Neutral Fuzzy Axiom Design method is applied to evaluate and rank these options, helping to clarify the relationships and priorities between strategies. The results indicate that strategies such as optimizing green processes, training human resources in green technology, investing in technological innovation, and strengthening cooperation with green partners are the most effective options for the logistics industry. Strategies related to government support, cost optimization, and meeting consumers’ green needs play an important role in the hierarchical structure. This study provides practical recommendations for government agencies and businesses, contributing to promoting sustainable development in green logistics.
1. Introduction
In the context of climate change and increasingly stringent requirements for sustainable development, the logistics industry plays an important role in minimizing environmental impacts and creating long-term value [1]. In addition, logistics companies are under pressure to reduce CO2 emissions, better manage resources, and meet the stringent requirements of international and domestic environmental regulations [2]. Furthermore, sustainable strategies not only help logistics businesses improve operational efficiency but also contribute to environmental protection and promote economic development. In addition, sustainable strategies help businesses save costs, optimize transportation, and distribution processes, thereby increasing profits [3]. For example, adopting renewable energy technology, using green vehicles, or optimizing transportation routes helps save fuel, reduce equipment wear and tear, and increase vehicle life. This not only helps businesses reduce operating costs but also improves long-term operational efficiency [4].
Recent studies have shown that implementing sustainable strategies not only helps businesses reduce their negative environmental impact but also enhances brand reputation and competitive advantage. According to a study by Kraus et al. [5], adopting sustainable strategies creates a positive brand image and helps build customer loyalty. Consumers are increasingly concerned about the environment and tend to choose brands that are committed to sustainable development. In addition, research by Javed et al. [6] has shown that businesses that successfully apply sustainability strategies are often able to attract many new customers, especially young and environmentally conscious consumers. This brings a strong competitive advantage, as businesses not only reach a highly conscious customer group but also build long-term trust, thereby strengthening their competitive position in the market. Moreover, applying sustainability strategies in the logistics sector not only helps businesses meet the expectations of stakeholders but also enhances their adaptability and contributes to the sustainable development of the industry [7]. In the context of climate change, natural disasters, and market fluctuations, applying sustainable strategies helps logistics businesses build flexibility and the ability to respond to potential risks. Sustainable strategies such as using modern technology, optimizing supply chain management, and training human resources help businesses adapt quickly to market changes and ensure stability [8].
However, implementing sustainable strategies in the logistics sector faces many challenges, including high investment costs, a lack of uniform standards and regulations, and competitive pressure from rivals. The cost of investing in green technology and infrastructure is a major obstacle, especially for small- and medium-sized enterprises [9]. Research by Hui An et al. [10] has shown that financial barriers are one of the main factors that hinder the adoption of sustainable strategies. In addition, the lack of uniform standards and regulations across countries also makes it difficult to adopt a common sustainability strategy. To transition to sustainable strategies, businesses need to change their entire supply chain management processes and systems, which takes time and resources [11]. Furthermore, the lack of specialized human resources in new technologies, such as artificial intelligence and blockchain, is also a challenge [12]. Finally, competitive pressure from rivals who do not implement sustainable strategies further exacerbates these difficulties, forcing businesses to carefully consider the costs and benefits of implementing sustainable measures in their operations [13].
In the increasingly complex landscape of logistics and supply chain management, the need for Multi-Criteria Decision-Making (MCDM) has become more evident than ever. Organizations are often faced with multiple factors, such as cost, service quality, environmental impact, and sustainability, all of which affect overall performance. In this context, MCDM is a powerful tool that allows managers to evaluate and optimize options based on multiple criteria. According to research by Zavadskas et al. [14], MCDM provides flexible analytical methods for better decision-making in situations with complex and conflicting factors. Moreover, the use of fuzzy logic in MCDM further increases the effectiveness of the decision-making process. Fuzzy logic allows modeling of uncertain and ambiguous information, making the evaluation of criteria and options more realistic. In fact, as highlighted by research by Zadeh [15], fuzzy theory is capable of handling ambiguous information that traditional methods cannot, thereby creating more accurate and reliable assessments. Among MCDM methods, the Fuzzy Analytic Hierarchy Process (FAHP) and Neutral Fuzzy Axiom Design (NFAD) are widely applied to improve the decision-making process. FAHP combines traditional AHP and fuzzy theory, helping to optimize the determination of criteria weights based on ambiguous assessments from experts. As a result, research by Chen et al. [15] shows that FAHP not only improves the accuracy of weighting but also helps to reduce bias due to personal opinions of experts. In addition, the NFAD method provides a powerful framework for analyzing and evaluating alternatives based on complex criteria in uncertain environments. According to research by Wang et al. [16], NFAD helps optimize the decision-making process by taking into account ambiguous factors and helping managers make more effective decisions in real-world situations. In short, the application of MCDM, fuzzy theory, FAHP, and NFAD methods is essential in the logistics field, helping organizations make rational and sustainable decisions and improve competitiveness in an increasingly harsh business environment.
To identify the most effective sustainability strategies, the FAHP method combined with NFAD was applied. FAHP helps to handle uncertainties and evaluate based on multidimensional criteria, while NFAD provides a systematic and comprehensive approach to decision-making. The objective of the study is to develop a framework for evaluating sustainability strategies for the logistics industry, thereby providing an optimal solution to enhance competitiveness and environmental friendliness. This study is the first to integrate FAHP and NFAD methods to select sustainable strategies in the logistics industry in Vietnam. This combination not only expands the theoretical framework in the field of MCDM but also provides a new, more reliable approach to analyzing diverse and contradictory factors in strategic decisions. This study will provide a theoretical and practical basis for further studies and encourage the development of integrated methods in the field of decision-making. Second, by applying FAHP and NFAD, enterprises can improve operational efficiency, minimize risks, and optimize resources. The study also emphasizes the importance of implementing sustainable strategies, not only meeting current needs but also ensuring long-term and sustainable development in the future. Enterprises can apply these results to adjust their operating processes, improve service quality, and enhance competitiveness. Third, the results of the study can be an important reference for policymakers in developing regulations to support the sustainable development of logistics enterprises in the modern context. Fourth, in addition to economic benefits, the study also contributes to promoting social and environmental values. The proposed sustainable strategies will contribute to minimizing negative impacts on the environment, improving working conditions, and creating value for the community. This not only benefits enterprises but also the whole society, contributing to the construction of a greener and more sustainable economy. Finally, this study also creates opportunities for further studies in applying different MCDM methods in the logistics industry, further exploring the factors affecting sustainable development. It opens up new research directions in developing more effective analytical tools and models and encourages research into the impact of policies and regulations on the logistics industry and sustainable development.
The structure of this paper is outlined as follows: The next section of the paper summarizes the prominent studies related to the topic. Then, the third section focuses on in-depth analysis of data coverage methods. In the fourth section, the findings from the study are presented, and the results are interpreted in detail. Finally, the fifth section provides discussions, an overall assessment, limitations of the study, and future research.
2. Literature Review
This study aims to develop an objective assessment framework for selecting and prioritizing the most effective sustainability strategies in the logistics sector, using the integration of two MCDM methods, FAHP and NFAD. To achieve this goal, a comprehensive understanding of two main research streams is required: sustainability strategy assessment studies and the application of MCDM methods in the sector. A detailed analysis of each literature stream and the research gaps is provided below.
2.1. Scientific Research on Sustainable Strategy Assessment
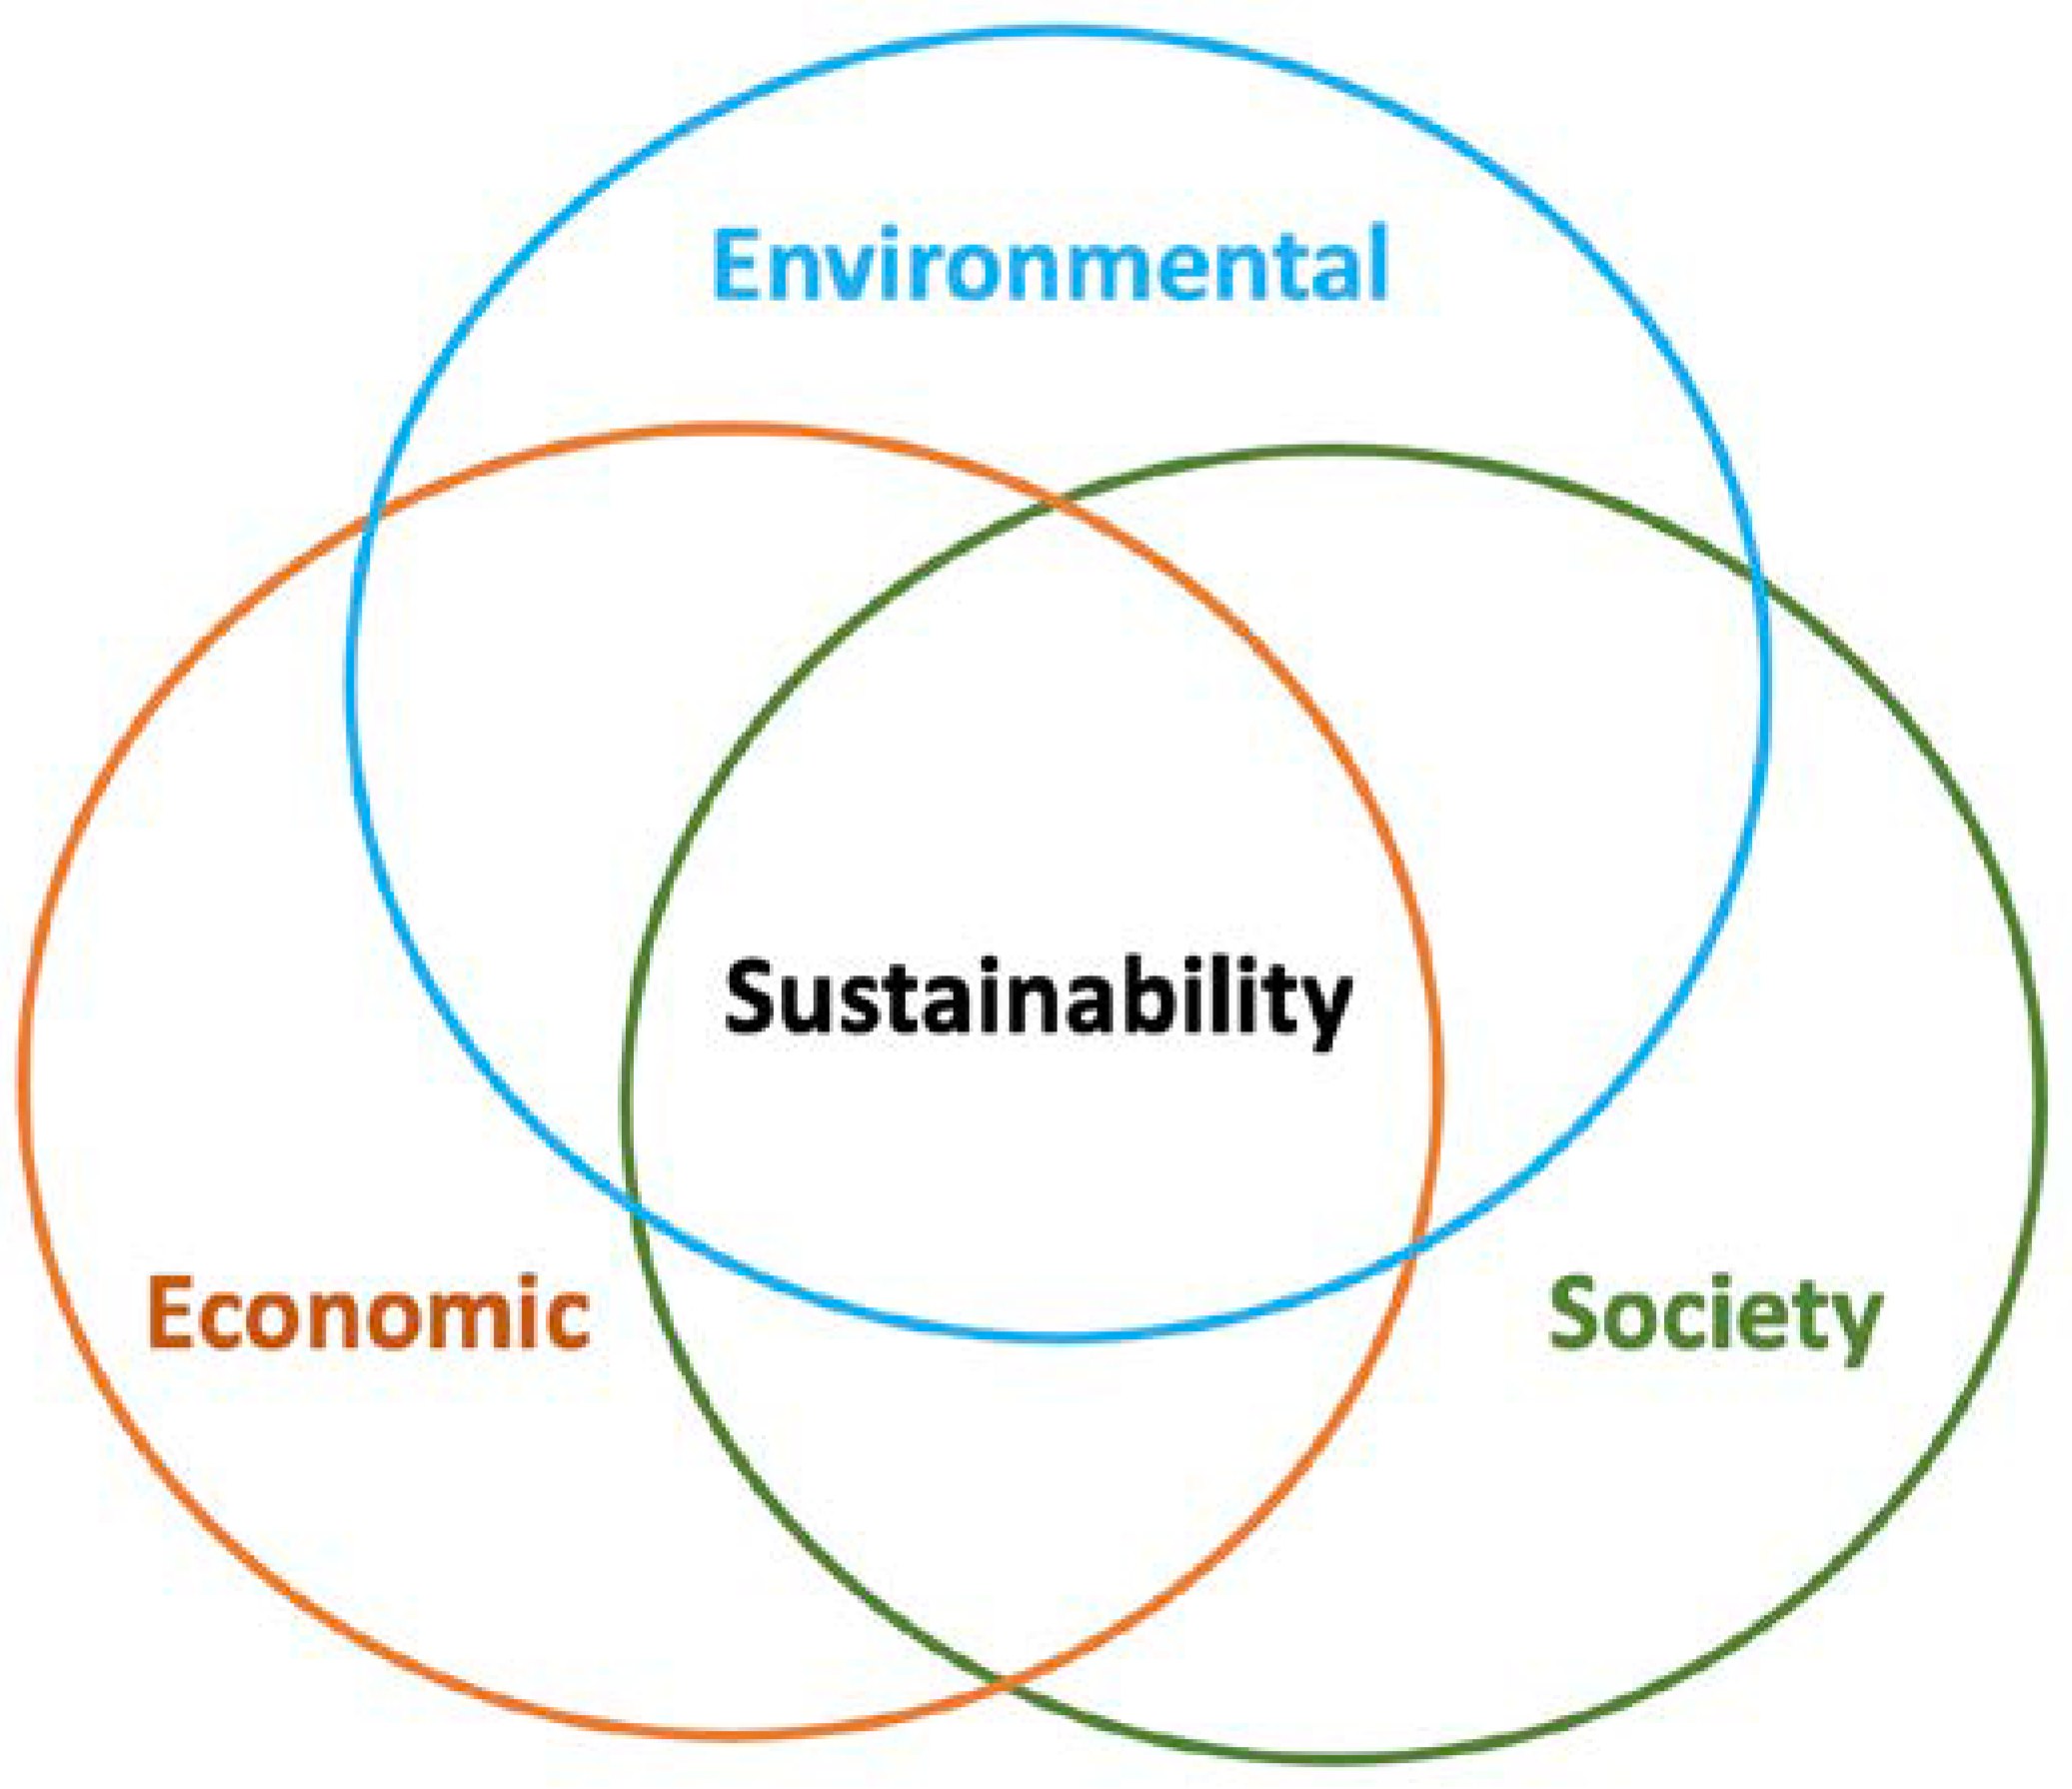
Evaluating sustainability strategies in logistics is an area that is receiving increasing attention, especially as businesses face pressure to balance economic benefits, social responsibility, and environmental protection—also known as the “Triple Bottom Line”, as shown in Figure 1. The triple bottom line theory encourages organizations to not only seek economic profits but also to actively contribute to environmental protection and improve social welfare. This model helps businesses achieve sustainable development, balancing financial benefits and environmental protection and improving the quality of life of the community [17,18].

Figure 1.
The Triple Bottom Line of Sustainability.
Research in this area has focused on identifying key factors influencing sustainability, including government regulation, consumer demand, green technology adoption, green logistics education, and sustainable human resource development. In the study by Chatterjee [19], they analyzed the determinants of supply chain sustainability in turbulent environments, focusing on firm capabilities and government regulations. Using dynamic capability theory and contingency theory, a theoretical model was built and verified through PLS-SEM. The results showed that firm capabilities, support from the leadership team, and contingency planning play essential roles, while government regulations have a significant moderating effect in turbulent environments. Furthermore, in the research by Jay et al. [20], they also analyzed government subsidies in research joint ventures (RJVs) of sustainable supply chains. The results showed that the two types of subsidies should not be used simultaneously and that the subsidy for innovation efforts is not affected by the way RJVs are formed. Producers may suffer if production costs are high and only subsidized per unit of production. On the other hand, research by Hunka et al. [21] surveyed 800 UK consumers about the demand for circular (reusable or remanufactured) products in the premium segment, such as phones and robot vacuum cleaners. The results showed that consumers preferred partially circular products and were willing to accept prices equivalent to new products. Circular products mainly compete with new products, opening up opportunities for companies to apply circular business models. Research by Mara Madaleno et al. [22] explored the causal relationship between green finance, clean energy, environmental responsibility, and green technology using a time-varying causality testing approach. The study highlighted the importance of green finance investments, especially in the context of clean energy demand, and called for comprehensive policies to promote sustainable development. According to Karaman et al. [23], a positive relationship has been shown between green logistics performance and sustainability reporting, especially in weak governance environments. Developing countries can improve logistics performance and enhance sustainability through appropriate policies and improved LPI indicators. Katarzyna Piwowar-Sulej [24] explored the development of human potential in the context of sustainable HRM (SHRM) and its principles, with a focus on industrial engineers in Poland. The study found that Polish companies have a short-sighted view of human resource development, focusing only on current needs and lacking long-term development and employee engagement. In addition, training on environmental sustainability is lacking, and cooperation with external educational institutions is low. The paper proposes directions for further research on SHRM and sustainability training. Research by Khan, Muhammad, et al. [25] assessed the role of IoT, BCT, and AI in improving transparency and sustainability in humanitarian logistics (HL). Based on data from 434 aid workers, the results showed that emerging technologies help improve governance, reduce corruption, and increase the effectiveness of disaster relief.
Although there are numerous instances in the literature that have explored the approach to sustainability in logistics, most studies have focused on individual aspects such as economic or environmental factors, ignoring the complex interactions between economic, social, and environmental factors. Furthermore, some studies have lacked effective quantitative methods to evaluate and compare sustainability strategies, which makes it difficult to apply in practice. Therefore, the development of an integrated framework, capable of considering multiple complex and multidimensional factors simultaneously, is a notable gap that needs to be filled.
2.2. Identifying Research Gaps and Advancing MCDM Approaches for Sustainable Logistics Strategy Evaluation
MCDM methods have proven to be important in solving complex problems that require analysis of multiple criteria with different weights and priorities. Methods such as AHP, TOPSIS, DEA, FAHP, and, recently, NFAD are widely applied in logistics to evaluate operational efficiency, select suppliers, optimize supply chains, and evaluate sustainable strategies.
Research by Korucuk et al. [26] proposed a model for selecting smart network strategies and determining the green transport index for logistics companies in the Black Sea region of Türkiye. The goal is to support companies in optimizing resources and protecting the environment while creating competitive advantages. The PF-LBWA and PF-CoCoSo methods were used to evaluate and propose suitable strategies for sustainable logistics. To manage domestic logistics operations with a focus on environmental sustainability, as shown by Charłampowicz et al. [27], fuzzy DEMATEL analysis was used. The study identified key management concepts and the relationships between them, emphasizing the important roles of strategic and operations management. The model not only provides a strong theoretical framework for sustainable logistics management, but also provides practical implications for integrating the model into domestic logistics operators to improve efficiency and meet environmental standards. Research by Mladen Krstić et al. [28] selected the best scenario for developing a smart reverse logistics system to support the circular economy and closed-loop supply chain. Using an MCDM model integrating Delphi, ANP, and COBRA in a fuzzy environment, the study evaluated four scenarios based on six key criteria. The results suggested the integration of Industry 4.0 technologies, such as IoT, AI, blockchain, and big data, emphasizing the importance of consensus among stakeholders. In a study by Le Anh Luyen and Nguyen Van Thanh [29], the authors combined the fuzzy theory and MCDM model to evaluate and select potential third-party logistics (3PL) service providers. This was in order to propose a framework for selecting suitable urban logistics (CL) concepts, supporting sustainable urban development. With conflicting objectives among stakeholders, S. Tadic et al. [30] applied a hybrid MCDM model combining DEMATEL, ANP, and VIKOR to handle conflicting and uncertain factors. This framework supports planners, authorities, and service providers in choosing the optimal solution. The method is illustrated through an application in the City of Belgrade. Research by Jacek Żak [31] presented the first stage of the MCDM process, using the Electre III method to select logistics hub locations. The regions were analyzed on the macrolevel, evaluating them according to technological, economic, social, infrastructure, and environmental criteria. The ranking results reflected the suitability of each region and the preferences of the decision-maker. Research by S. Wadhwa et al. [32] proposed a fuzzy set theory-based MCDM model to optimize reverse logistics (RLS) strategies and select the most efficient recycling option. The model evaluates both qualitative and quantitative criteria such as cost, environmental impact, quality, and market, supporting flexible and effective policy design. The analysis helps companies develop new recycling facilities or leverage existing ones, with an example illustrating the model implementation process. Stević et al. [33] developed an integrated model to measure reverse logistics (RL) service quality for the company Komunalac Teslić, using the Delphi, FUCOM, and modified SERVQUAL methods. The analysis showed that customer expectations were higher than the perceived quality, with statistical differences in 12 SQ statements. The company needed to improve its service to achieve satisfactory quality levels based on the findings from the questionnaire and statistical analysis. Also, in terms of logistics performance evaluation and MCDM application, Kalyana et al. [34] reviewed over 120 studies (2010–2019), identifying common approaches and 13 potential research topics. The study suggests future opportunities within these trends, providing a comprehensive view of developments in the field. Research by Huseyin et al. [35] proposed a two-stage approach to design a reverse logistics network for battery waste management, aiming to achieve economic and environmental goals. The first stage used SF-AHP to determine the weights of the objectives, with carbon emission reduction and employment maximization having the highest weights. The second stage applied MO-MILP to optimize the network in Turkey, with 100% satisfaction for employment and development goals, 96% for carbon emission reduction, and 75% for cost reduction. Nila B. and Jagannath Roy [36] proposed a hybrid MCDM model using triangular fuzzy numbers (TFN) to select a third-party logistics (3PL) provider for a food company in India. The model combines LOPCOW, FUCOM, and DOBI methods to evaluate and rank suppliers, helping to determine the optimal choice. The method was successfully tested, providing stable and reliable solutions for decision-making in the supply chain.
Although many studies have applied MCDM methods to evaluate performance or select strategies, there are still significant limitations. First, the combination of MCDM methods is still limited, especially between fuzzy processing methods such as FAHP and NFAD. Second, the application of these methods in the context of sustainable logistics has not been fully studied, especially in developing countries such as Vietnam, where economic, social, and environmental factors have complex interactions and are heavily influenced by local policies and conditions.
Based on the overview of the two literature streams above, it is possible to identify some important gaps that need to be researched. First, there is no integrated framework that uses FAHP and NFAD to evaluate and prioritize sustainable strategies in logistics, especially in the context of developing economies. Second, existing studies lack a multidimensional approach to comprehensively consider and analyze economic, social, and environmental factors in strategy assessment. Finally, existing assessment methods often have difficulty in providing objective and reliable weightings for sustainability factors, leading to limitations in the ability to make accurate and feasible decisions. This study aims to fill the above gaps by developing an integrated framework of FAHP and NFAD and by applying this framework to evaluate and select sustainable strategies in logistics in Vietnam. This is not only a theoretical contribution but also a practical one, helping businesses and policymakers build and implement sustainable strategies in a more effective and scientific way. Moreover, compared with the traditional AHP method and other sustainability decision models in the logistics industry. The FAHP-NFAD method excels in its ability to handle uncertainty and ambiguity in the evaluation process, where factors influencing strategic decisions are often not precisely determined. While AHP only uses definite values to compare criteria, FAHP applies fuzzy theory to reflect uncertainty, providing more accurate results in complex situations. In addition, NFAD adds the ability to calculate aggregate values (SF), which helps to rank sustainability strategies in more detail, while other methods often only provide a simple assessment of the feasibility of strategies. Therefore, the FAHP-NFAD method not only optimizes the decision-making process but also provides a deeper and more comprehensive insight into the factors influencing sustainability strategies in logistics, especially in the context of today’s uncertain environment.
3. Methodology
3.1. Methodology Description
This study evaluated and selected 15 sustainable strategies in the logistics sector in Vietnam, as shown in Table 1. Figure 2 illustrates the two-layer decision-making approach proposed by the study to evaluate these sustainable strategies. In the first layer, to identify the evaluation criteria for selecting sustainable strategies in the logistics industry, a group of experts in the field of logistics and sustainable development was assembled to discuss and develop evaluation criteria, ensuring the comprehensiveness and depth of the criteria. Then, the criteria were refined based on the literature review and expert opinions. The study then used FAHP to calculate the weight of each criterion based on expert assessment, thereby reflecting the relative importance of sustainability criteria in the logistics context. Next, NFAD was applied to determine the suitability of sustainable strategies based on their relationship with ideal and non-ideal values, thereby selecting the most potential strategies. Furthermore, to ensure the stability and reliability of the FAHP-NFAD model in selecting sustainable logistics strategies, a sensitivity analysis was performed to assess the change in results when there was a change in the weight of the criteria. Specifically, each weight of the main criteria was systematically adjusted to determine the influence of each criterion on the final ranking order of the options. Sensitivity analysis helped to verify the ability of the model to maintain consistency when faced with small fluctuations or significant changes in input factors. The combination of FAHP and NFAD ensured that the decision-making process could handle uncertainty and subjectivity in strategic assessment, creating a clear and adaptable analytical framework.

Table 1.
List of 15 Sustainable Logistics Strategies.
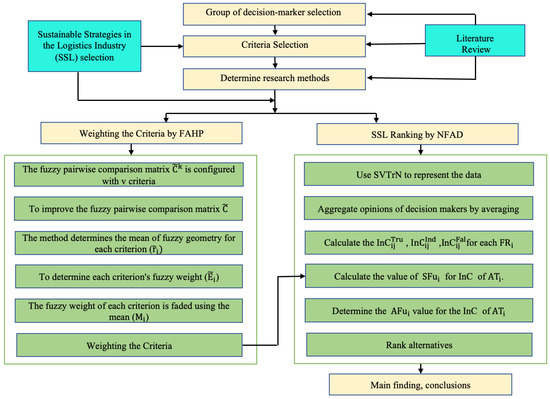
Figure 2.
Conceptual Framework of the Study.
Through calculations in these two layers, the study determined the overall score of each sustainable logistics strategy. These scores include both quantitative assessments and subjective language opinions of experts, reflecting the economic, social, and environmental aspects of the strategies in many dimensions. Choosing a sustainable strategy in logistics requires simultaneously considering many criteria of different importance. The combination of FAHP and NFAD helps to optimize the evaluation process, providing an analytical tool that is not only accurate and comprehensive but also flexible, responding well to the challenges in the current logistics context.
FAHP facilitates the ranking of criteria by calculating weights based on expert opinions, thereby helping to clearly determine the priority of each factor in the assessment. NFAD then supports the evaluation of options based on these key criteria to create optimal, fair, and balanced results between conflicting factors. The FAHP-NFAD approach not only helps to evaluate sustainability strategies scientifically but also plays an important role in guiding strategic decisions on sustainable logistics development in Vietnam.
In this study, the Triple Bottom Line approach served as the foundation for analyzing and evaluating 15 sustainable logistics strategies in Vietnam. The combination of the FAHP and NFAD methods helped establish a systematic and quantitative evaluation process, supporting the consideration of three economic, social, and environmental factors. Previous studies have mainly focused on each individual aspect of sustainability without a comprehensive synthesis method that fully reflects the complex relationships between these factors. This study overcomes this limitation by applying a multi-criteria decision-making model, consistent with the Triple Bottom Line theory, thereby providing a comprehensive and highly practical evaluation method for sustainable logistics strategies. By combining expert perspectives with the application of advanced decision-making methods, this study not only highlights the importance of balancing the three sustainability factors but also provides an approach that can be applied to evaluate sustainability strategies in many other sectors and industries.
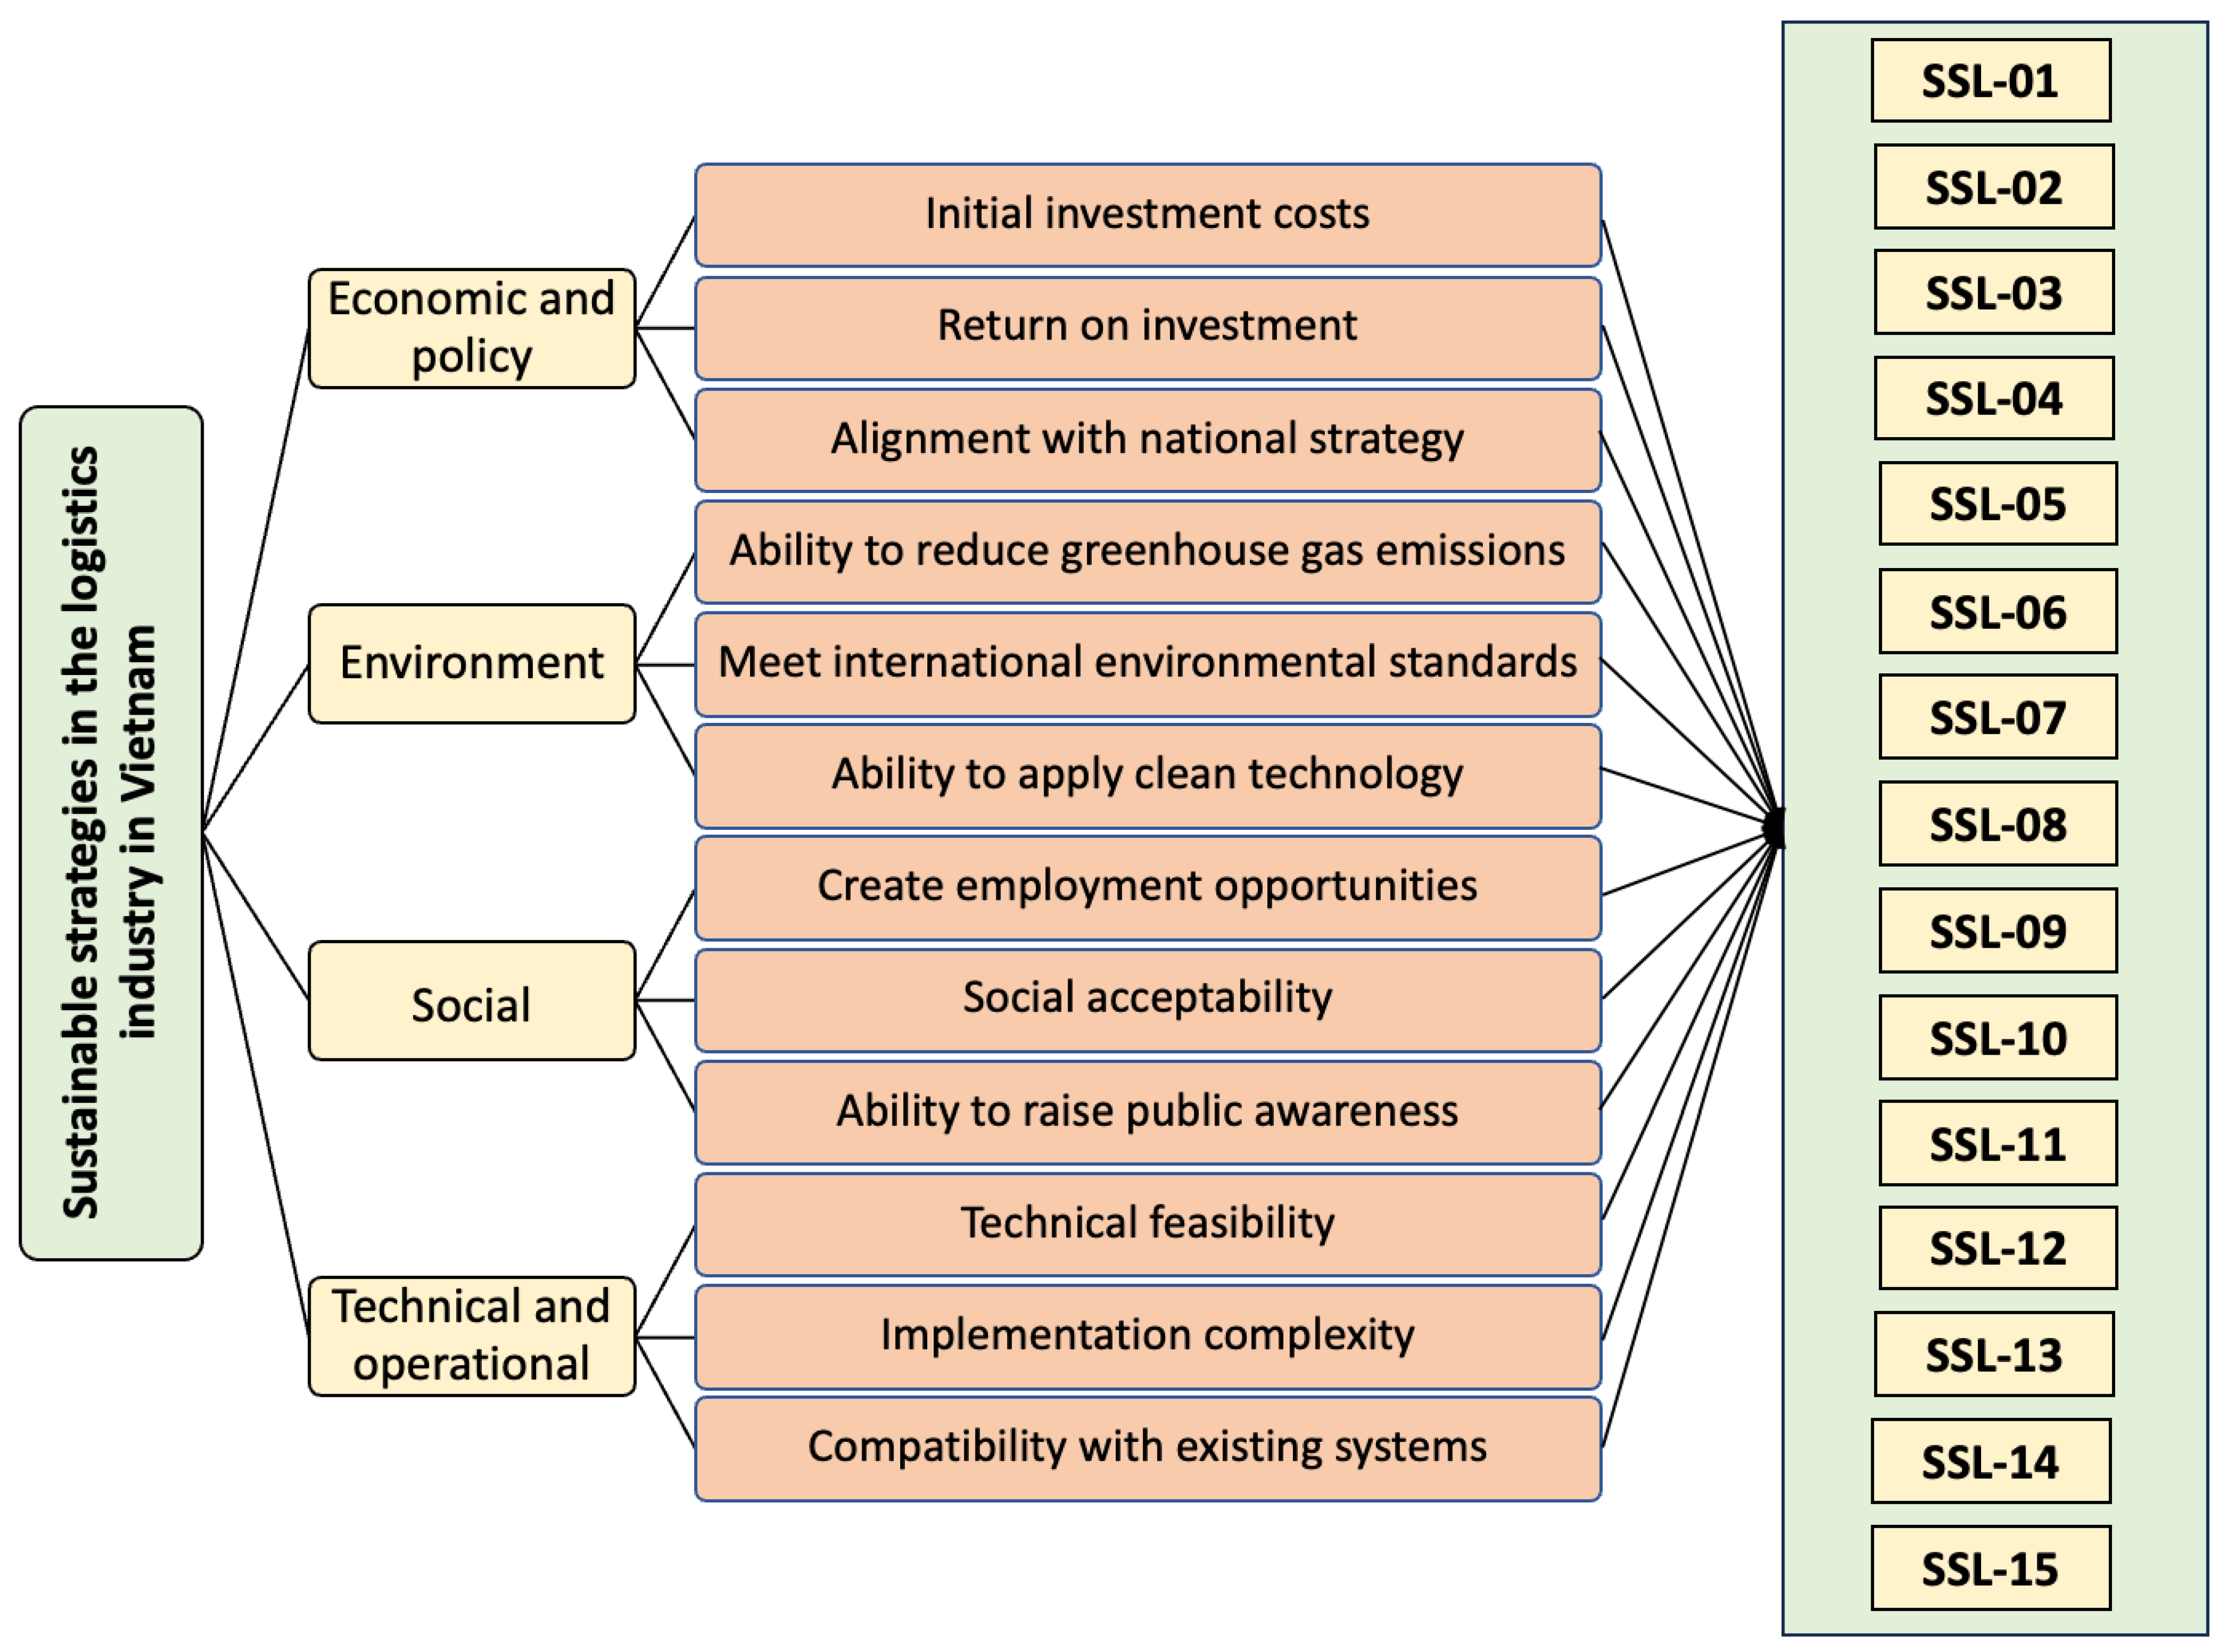
Figure 3 clearly illustrates the relationship between the criteria and strategies, providing an overview of how the strategies interact and impact each other. This classification not only helps to clearly reflect the necessary requirements in sustainable logistics development but also ensures that the strategies are evaluated from multiple perspectives, providing a comprehensive and practical view. To ensure the objectivity and reliability of the results, the study consulted 10 leading experts in the field of logistics in Vietnam. These experts not only have rich practical experience but also have a good grasp of global sustainable logistics development trends. Through an in-depth assessment process, experts analyzed and provided detailed assessments of the impact of each criterion on the proposed strategies. The expert-based approach not only helps to improve the accuracy of the results but also provides multi-dimensional and practical perspectives, contributing to the orientation of feasible and sustainable strategic proposals. This also reflects the need to combine theory and practice in the research process in order to achieve the goal of comprehensive sustainable logistics development in Vietnam.

Figure 3.
Diagram of criteria for evaluating sustainable logistics development strategy in Vietnam.
3.2. Fuzzy Analytical Hierarchy Process (FAHP)
FAHP is an extension of the Analytical Hierarchy Process (AHP) to deal with uncertain and ambiguous situations. FAHP overcomes the limitations of AHP and effectively solves many MCDM problems. Table 2 provides linguistic expressions for the fuzzy scales, and the triangular fuzzy number (TFN) is defined. To determine the relative importance between two criteria, a scale from 1 to 9 is used based on specific linguistic features. The tilde (~) is added to the parameter symbols to indicate the imprecise nature of the data. FAHP implements six procedural steps, allowing for the analysis of complex relationships between related factors.
Table 2.
Classification of TFNs Based on Position and Importance.
Step 1: The fuzzy pairwise comparison matrix is configured with v criteria, as shown in Equation (1). In the kth determinator’s distinction, represents the significance level of the ith criterion in relation to the jth criterion.
Step 2: To improve the fuzzy pairwise comparison matrix , apply Equation (2). Where K is the total number of experts or decision-makers.
Step 3: The method determines the mean of fuzzy geometry for each criterion (, as shown in Equation (3).
Step 4. To determine each criterion’s fuzzy weight (), utilize Equation (4).
Step 5: The fuzzy weight of each criterion is faded using the mean () shown in Equation (5).
Step 6: Equation (6) used to calculate the normalized weight of each criterion ().
3.3. Neutrosophic Set Theory
Suppose ξ represents the universe, and the real normal coefficients of the interval [0, 1] are defined by the functions , , and . Here, the centrality is denoted by Q in ξ and is described by the functions given. This leads to a description of Q in ξ as follows:
To compare SVNs, we use suitable functions such as the accuracy function (AFu) and the score function (SFu). Suppose that = (, , ) is an SVN, then the SFu() and AFu() of an SVNN can be described as follows:
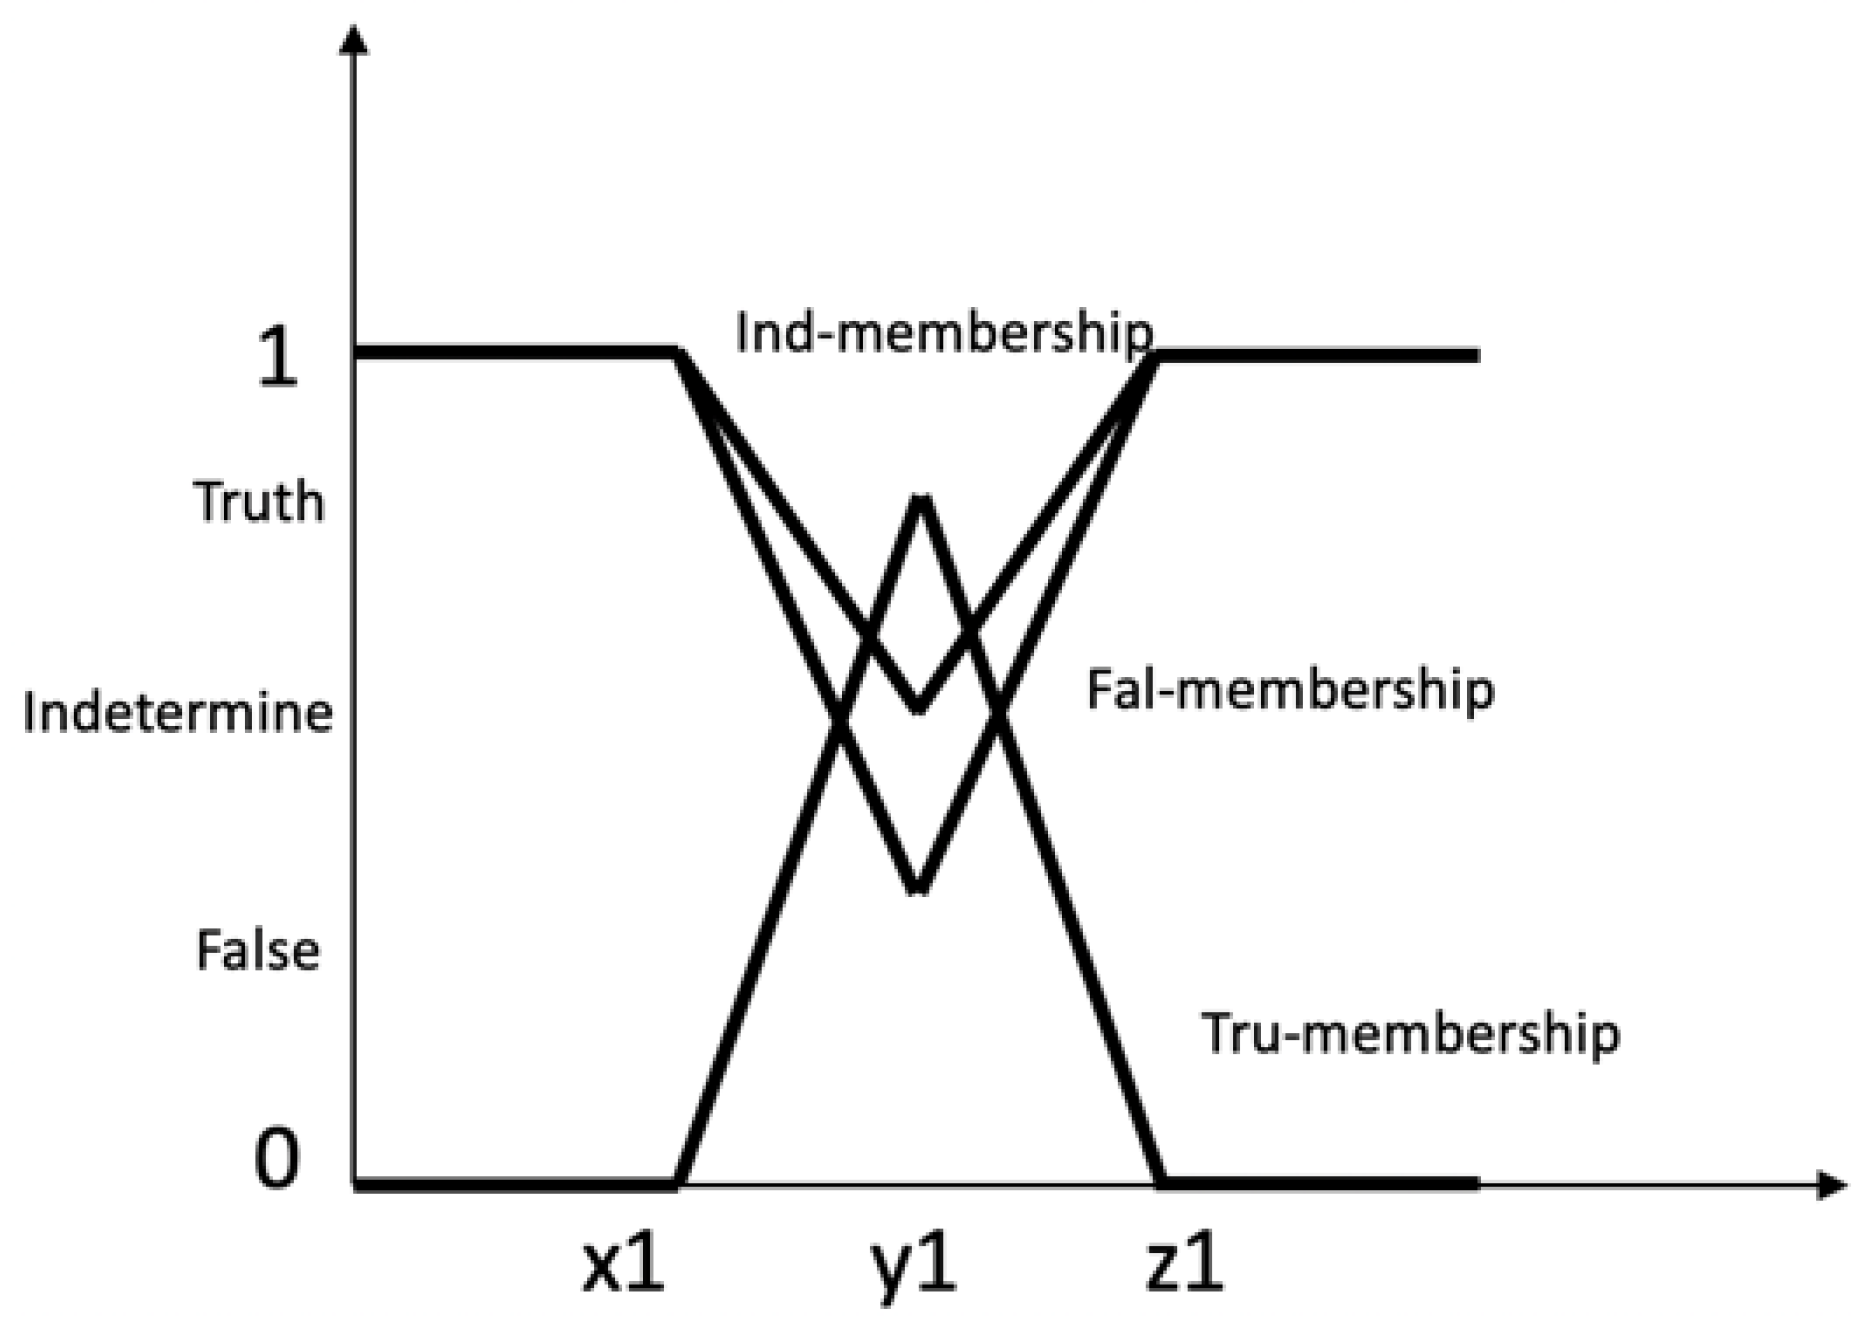
The notation ( =< (x1, y1, z1); , , >) rangle represents a special central set on the set of real numbers, in which the components Tru, Ind, and Fal are illustrated in Figure 4 as follows:

Figure 4.
Triangular neutrosophic membership functions for a single standard value.
Suppose =< (); > and =< (); , , > is two SVTrN-number, then:
The SC and AFu values of an SVTrN are defined as follows. The following definitions apply to SFu s() and AFu a():
Ranking of SVTrN-number.
3.4. Neutrosophic Axiomatic Design (NAD)
Neutrosophic Axiomatic Design (NAD) is an extension of Axiomatic Design (AD) that uses neutrosophic sets to handle uncertainty, imprecision, and incomplete information in complex decision-making processes. While traditional Axiomatic Design focuses on two main principles, independence and information minimization, NAD integrates neutrosophic logic to increase flexibility and reliability in ambiguous environments.
The information axiom, which concerns the ability to maintain established goals, is determined based on information content (InC). The origin of is described as follows:
The distribution function of uniform probability, denoted (), is represented as follows:
The symbols of the components of information content, including truth members (InCTru), false members (InCInd), and indeterminacy members (InCFal), are described as follows:
The proposed method for MCDM problems, using the NFAD approach for evaluation, is as follows: ATru represents the set of alternatives, with . The set is the criteria, with ; We is the weight of each C, satisfying ≥ 0, j = 1, 2, …, n, ; DU is a group of decision-makers.
Step 1: Apply SVTrN, with the structure <Low value (L), Medium value (M), High value (U)>, and confirmation level (CD), to represent the data. The method of representing the data is shown in Table 3.
Table 3.
Representation of SVTrN Language Variables for Selection and Criteria.
Step 2: To calculate the average of decision-makers’ opinions, we add up the SVTrN numbers, as in Equation (13), then divide the sum by the number of decision-makers for each criterion.
Step 3: To calculate the InCTru for each functional requirement (, we use Equation (26):
where and are the low value (L) and high value (U) of and and are the low value (L) and high value (U) of according to .
Step 4: Calculate the value for each functional requirement using the formula in Equation (27):
where and are the low value (L) and high value (U) of and and are the low value (L) and high value (U) of according to .
Step 5: Calculate the value for each functional requirement according to the formula in Equation (28):
where and are the low value (L) and high value (U) of and and are the low value (L) and high value (U) of according to .
Step 6: Calculate the value SFu for the InC of each based on the relevant parameters and criteria:
Step 7: For the InC of each , determine the value by applying Equation (30)
Step 8: Rank the alternatives.
Use Equations (18) and (19) to select the optimal alternatives. Then, rank the alternatives based on comparing their values, checking whether any alternative has the same value.
4. The Results
In this study, 12 criteria were developed to comprehensively evaluate 15 sustainable logistics development strategies in Vietnam. These criteria are classified into four main groups, including economic and policy aspects and environmental, technical, and operational aspects, as well as social factors.
The ranking of experts, as shown in Table 4, is based on a number of factors, including education, research output, expertise, and professional experience. The experts in the table are mainly doctoral, with a few having master’s degrees. Higher education is often accompanied by a solid theoretical foundation, allowing experts to contribute extensive research knowledge to the evaluation process. The number of research publications indicates the level of contribution to the academic community. Experts with more research output are often rated higher because they have made extensive and diverse research contributions. Furthermore, the experts in the table have expertise in a variety of fields, from supply chain management to sustainable logistics, sustainable transport management, and sustainability performance evaluation. Experts with relevant and extensive expertise in the field of sustainable logistics will be highly valuable in evaluating strategic criteria. Finally, the experience of the experts, as shown by the number of years they have been working in their field, has a great influence on the ranking. Experts with long-term practical experience will have deeper insight and the ability to make more accurate assessments.
Table 4.
Qualification and rank of experts.
The selected panel of experts not only represents the diversity of expertise but also ensures a balance between theory and practice. This contributes to the accuracy and reliability in the assessment of the impact of the SSL selection criteria. Through the ranking system, the study has made the most of the knowledge and experience from the expert group, creating an important premise to determine impact criteria in a comprehensive and scientific manner. This helps to make effective strategic recommendations, supporting the development of sustainable logistics in Vietnam in the context of a strongly transforming global economy.
In this study, FAHP (the Fuzzy Analytical Hierarchy method) was used to determine the weights of key criteria influencing the selection of the Sustainable Logistics Strategy (SSL). Through the calculation process, a pairwise comparison matrix between the criteria and sub-criteria was established and checked to ensure consistency, as shown in Table 5. These matrices help determine the priority and impact of the sub-criteria, thereby supporting the selection of an appropriate sustainable logistics strategy.
Table 5.
Main criteria and sub-criteria fuzzy pairwise comparison matrix.
The non-fuzzy comparison matrices in Table 6 were constructed to determine the priority of the main and sub-criteria in the Economic and Policy, Environmental, Social, and Technical and Operational groups. The above tables help to assess the importance of the main and sub-criteria in choosing a sustainable logistics strategy. Thereby, it is possible to clearly identify which criteria play a key role in each group. These criteria have a strong influence on the choice of strategy, helping businesses focus on the most necessary factors for successful implementation of a sustainable logistics strategy. The non-fuzzy tables have provided the necessary values for constructing a fuzzy comparison matrix in the process of applying the FAHP method, supporting decision-making based on ambiguous and uncertain factors.
Table 6.
Main criterion and sub-criteria of non-fuzzy comparison matrix.
Table 7 shows the normalization of the non-fuzzy comparison matrix and the calculation of priority vectors for the primary and secondary criteria. The priority vectors are determined by averaging the values in each row after normalization. This is the basis for evaluating the importance of each criterion. These results provide a solid basis for further analysis.
Table 7.
Priority vector and normalization comparison matrix as primary criteria and sub-criteria.
The next step of the stability determination process is the largest locator, which is denoted as , , , . This is a step in the stability assessment process using matrices and weight vectors. Each matrix is multiplied by the corresponding weight vector to calculate the value of the output vector. The output vector result is then divided element by element by the original weight vector to calculate the locator value for each factor. The results are analyzed as follows:
The calculation of determines the consistency and stability of the decision-making process. For the main system matrix, 4 × 4, where n = 4, = 4.1324, reflecting the overall system consistency. For the submatrices, 3 × 3, where n = 3, the results are: = 3.1136, = 3.0675, = 3.0880, and = 3.0937. These values, close to their respective n, confirm the reliability of judgments across all criteria, supporting a stable and consistent decision-making framework.
The consistency index (CI) and consistency ratio (CR) are calculated to assess the reliability of pairwise comparisons in the decision-making process. For the main system matrix (n = 4, RI = 0.9), = 0.04 and CR = 4.9%, indicating good consistency. For the submatrices (n = 3, RI = 0.58), the results are as follows: = 0.06 and CR = 9.8%; = 0.03 and CR = 5.8%; = 0.04 and CR = 7.6%; = 0.05 and CR = 8.1%. Since all CR values are below the acceptable threshold of 10%, the pairwise comparisons demonstrate acceptable consistency, validating the reliability of the evaluation process.
Based on the aforementioned findings, the pairwise comparison matrix’s consistency can be considered acceptable and utilized for additional computations, as indicated by the coefficient of consistency being less than 10%. Other pairwise comparison matrices are performed similarly with this consistency determination procedure. The next step, as shown in Table 8, presents the results of calculating the geometric mean of the four main criteria (CT-1 to CT-4) using the fuzzy geometric mean method. The sum of the main criteria is determined with three components of the triangular fuzzy number, represented by a triplet of values (Lower, Middle, Upper). The inverse of the sum is also calculated to assist in determining the fuzzy weight of each criterion. The geometric mean of the sub-criteria, grouped by each main criterion. Each group of sub-criteria has its own geometric sum and inverse to normalize the weight.
Table 8.
Meaning of the main criterion and sub-criteria geometry.
The fuzzy weight determination process evaluates the importance of criteria and sub-criteria using the ratio of the reciprocal of the geometric mean to the geometric mean. This approach generates fuzzy weights for both the main criteria and their respective sub-criteria. As shown in Table 9, the fuzzy weight of each main criterion reflects its relative importance. This analysis provides a structured framework for prioritizing criteria and sub-criteria based on their calculated fuzzy weights, ensuring an informed decision-making process.
Table 9.
Sub-criteria and main criteria fuzzy weight.
The next step is to find the fuzzy weight product of the pertinent sub-criteria and the main criterion, as indicated in Table 10, in order to ascertain the final fuzzy weight of the sub-criteria. This fuzzy weight is represented as three values: low, medium, and high, representing uncertainty and variation in the assessment. Table 10 helps us better understand the importance of each sub-criteria in choosing a sustainable strategy for the logistics industry in Vietnam. The criteria that need to be maximized have high fuzzy weights, while the criteria that need to be minimized have low weights. This analysis will help policymakers and businesses identify optimal strategies that balance economic, environmental, and social benefits.
Table 10.
Final fuzzy weighted sub-criteria.
NAD Calculation Results
After calculating the weights of the criteria, the next step is to apply the NFAD method to calculate and rank the sustainable strategies based on the above 12 criteria. In this section, the average method is used to calculate the aggregate values for each criterion to combine the opinions of the decision-makers according to the previously calculated weights. Specifically, each decision maker has a separate weight, reflecting the level of influence or importance of their opinions in the overall decision-making process. The opinions of each decision maker on each criterion will be multiplied by their respective weights and then summed to calculate the aggregate average value as in Table 11.
Table 11.
The aggregated direct influence matrix.
Table 12 presents the Truth-membership, Indeterminacy-membership, and False-membership values calculated for each functional requirement, based on Formulas (26)–(28). Truth-membership reflects the degree of accuracy or agreement of an element with the functional requirement, indicating the rate at which the element is considered to be consistent. Indeterminacy-membership represents the uncertainty or degree of uncertainty in the evaluation of the element, while False-membership measures the degree of imprecision or disagreement with the functional requirement. These values provide an overall view of the consistency, uncertainty, and nonconformance of each element with the analyzed requirement.
Table 12.
The results of Truth-membership, Indeterminacy-membership, and False-membership.
In Table 13, the SF values have been calculated and presented in detail. The determination of these values is based on Formula (29), with the aim of providing a summary index showing the level of response of each factor to the analytical requirements. Through the SF values, readers can easily compare, evaluate, and make judgments about the effectiveness of each factor in meeting the established criteria. This contributes to clarifying the role of each factor in optimizing decisions and data analysis.
Table 13.
The value of SF.
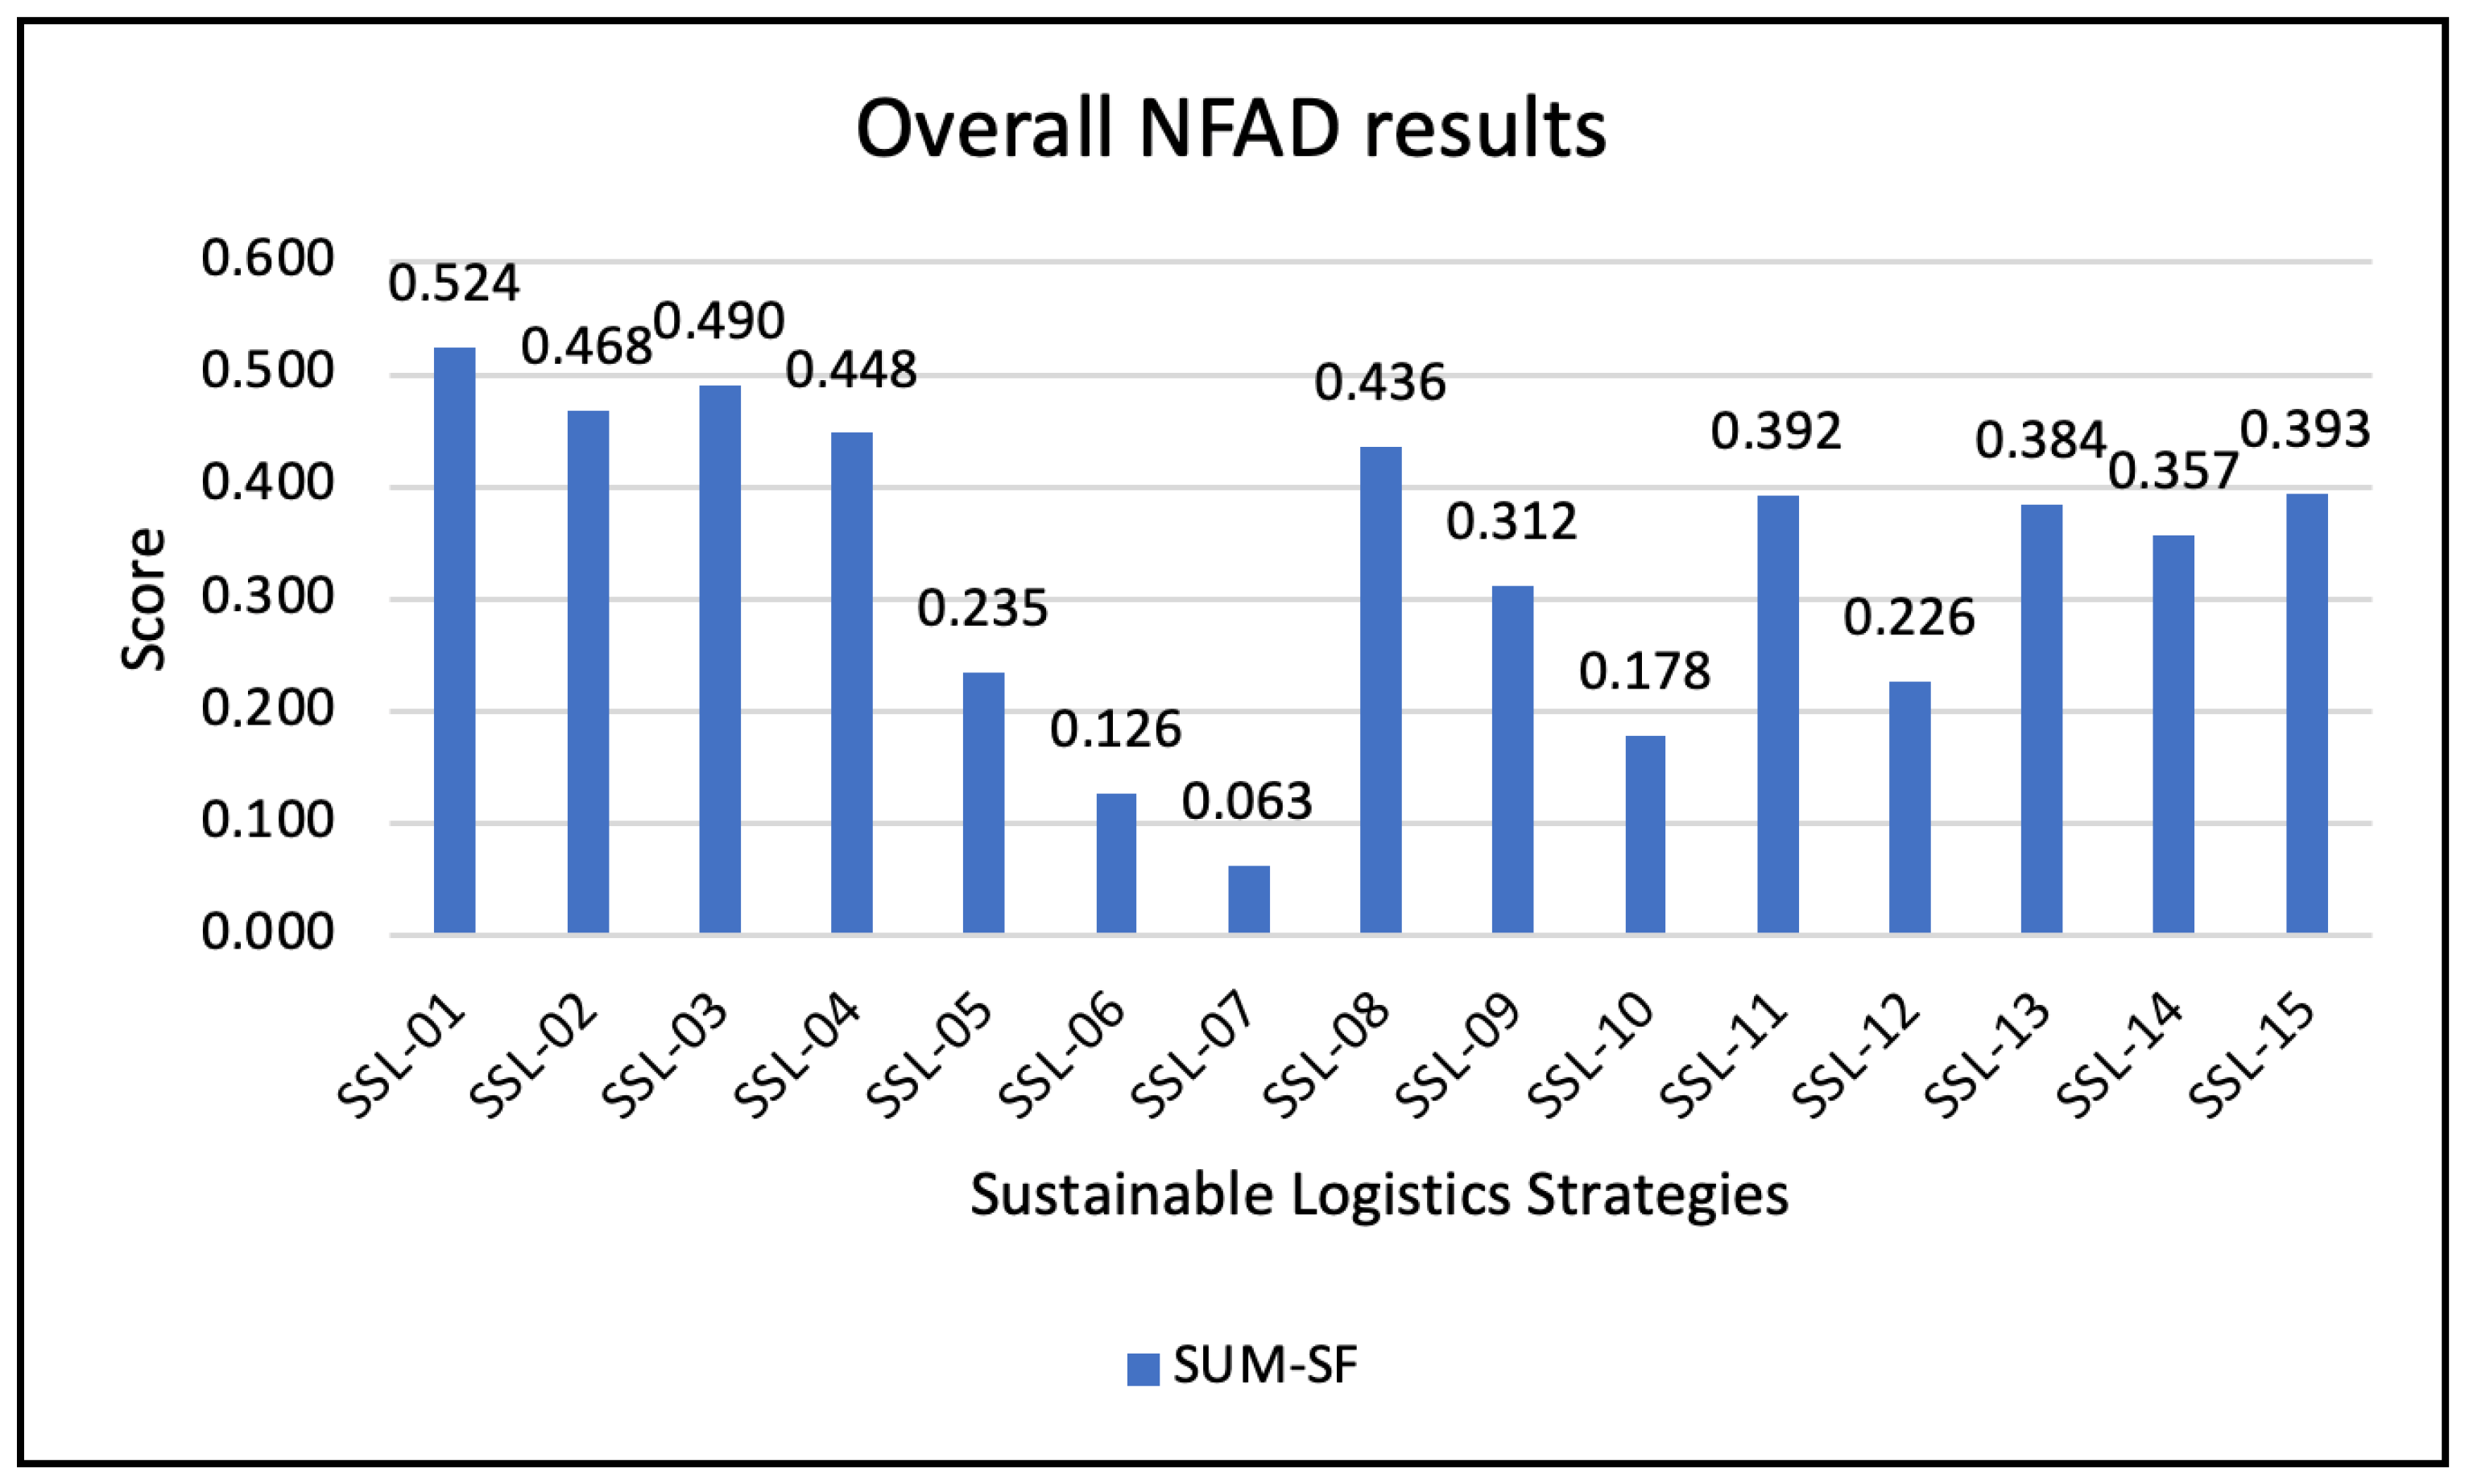
Based on Figure 5, the SF values are calculated using Formula (30), representing the suitability of each alternative with the defined criteria. Finally, the final ranking of each location is determined using Formula (31). The option with the highest SF value will be selected as optimal. In case the SF values of the alternatives are equal, the priority order will be evaluated and ranked based on more detailed factors.

Figure 5.
Overall NFAD results.
The reasonable allocation of resources for these strategies will not only help Vietnam achieve the goal of sustainable logistics but also enhance the competitive position of the industry in the regional and global markets. Figure 5 illustrates the synthesis results of the NFAD method, showing the SF value of 15 sustainable logistics (SSL) strategies. In the context of the current logistics industry in Vietnam, the Applying green technology strategy has the highest SF value (0.524), showing that this is a suitable and potential orientation to promote sustainable development. This strategy is not only in line with the global green transformation trend but also contributes to reducing the negative impact of the logistics industry on the environment, while improving the competitiveness of domestic enterprises. Strategies such as Optimizing supply chain network (0.468), Developing green warehouses (0.490), and Applying environmentally friendly means of transport (0.448) are also highly rated for feasibility. This reflects the urgent need to optimize supply chain operations, build green logistics infrastructure, and use environmentally friendly means of transport. These are all important factors to reduce costs, increase efficiency, and meet international standards on sustainable development. However, some strategies such as Applying circular economy models (0.063) and Managing and reducing greenhouse gas emissions (0.178) have low SF scores, indicating major challenges in implementation in Vietnam. The reasons may be due to high investment costs, lack of resources, and advanced technology, along with limited support policies from the government. These strategies need to be carefully considered and can be piloted or combined with other solutions to improve feasibility. In the context of Vietnam’s logistics industry being under pressure from increasing transportation demand, fierce competition, and sustainability requirements, choosing and prioritizing appropriate strategies is extremely important [52,53]. Leading strategies, such as Applying green technology and Developing green warehouses, should be focused on immediately, as they bring about quick positive impacts and are consistent with national policies on green growth. At the same time, strategies with low SF scores need to be invested in further research, with coordination between businesses, governments, and international organizations to increase implementation efficiency in the future.
This study demonstrated the effectiveness of the FAHP and NFAD methods in assessing sustainable logistics strategies in Vietnam, while highlighting the need to balance the three elements of TBL theory: economic, social, and environmental. Strategies such as “Applying green technology” and “Developing green warehouses” were highly appreciated for their feasibility and effectiveness, in line with the global development trend of greening the logistics industry. However, strategies such as “Applying circular economy model” and “Emission management” need more time to research and test to overcome challenges in cost and technology. These results are not only meaningful to the logistics industry but also provide an assessment method that can be applied to many other industries and fields, helping to promote sustainable development.
The FAHP and NFAD methods have played an important role in ranking and evaluating sustainable strategies in the logistics industry in Vietnam. FAHP helps determine the weights for important factors, such as cost, feasibility, and environmental impact, thereby creating a quantitative basis for comparing strategies. After determining the weights, NFAD calculates the SF (Synthesis Fuzzy) value for each strategy, helping to determine the overall feasibility and impact. Strategies such as Applying green technology and Developing green warehouses have the highest SF, indicating feasibility and effectiveness in promoting sustainable development. In contrast, strategies such as Applying circular economy model and Managing greenhouse gas emissions have low SF, reflecting the challenges in implementation due to high costs and lack of suitable technology.
5. The Practical and Managerial Implications of the Study
This study highlights important recommendations for governments and businesses in promoting sustainable logistics development. For governments, it is necessary to develop appropriate support policies, create a stable legal environment, and encourage public-private partnerships in the field of green logistics in order to reduce barriers and promote sustainable initiatives. At the same time, governments should also play a role in encouraging investment in green technology and developing long-term support programs. For businesses, investing in modern technology and optimizing operating processes are extremely important to achieve sustainability goals. Businesses also need to focus on training human resources with expertise in green technology and developing long-term strategies towards environmental protection and sustainable economic development. In addition, optimizing costs and meeting consumers’ green needs will help businesses not only increase their competitiveness but also contribute to the overall sustainable development of the logistics industry.
6. Conclusions, Limitations, and Future Studies
In the context of globalization and increasing pressure from sustainable development requirements, logistics strategies have moved beyond conventional operational performance optimization to address long-term economic, social, and environmental goals. This transformation requires businesses and government agencies to focus not only on cost reduction and efficiency improvement but also on technological innovation, enhanced supply chain collaboration, and meeting sustainability criteria. However, developing and implementing a sustainable logistics strategy is not simple, with many challenges such as high investment costs, shortage of qualified human resources, and lack of policy synchronization, creating significant barriers. This study used the FAHP-NFAD method to identify, evaluate, and rank sustainable logistics strategies, clarifying the relationship and priorities between economic, social, and environmental factors. Based on the three cores theory, a hierarchical structure of strategic options was constructed, providing a solid scientific basis for strategic decision-making in green logistics. Priority strategies such as green technology application, green warehouse development, and supply chain network optimization were identified as important factors in promoting sustainable logistics development. In particular, strategies related to the application of environmentally friendly means of transport, optimization of transport loads, construction of green distribution centers, and development of reverse logistics strategies were also ranked as important priorities. These factors not only play a fundamental role but also contribute to promoting innovation and enhancing competitiveness for the logistics industry. The objective of the study was to identify sustainable strategies in logistics and provide a scientific basis to support strategic decisions in this industry, which was completely achieved. The study not only clarifies the relationship between influencing factors but also provides practical recommendations for governments and businesses in developing sustainable strategies. However, the study still has some gaps, especially in expanding the scope of the survey and integrating more multidimensional assessment factors, as well as analyzing the long-term impacts of these strategies. One of the notable limitations is the limited scope of the survey subjects, and more criteria are needed for a more comprehensive assessment. Further studies can expand the scope of the study and integrate more multidimensional factors to assess the long-term impacts of sustainable logistics strategies. This will create a solid basis for policy and strategy planning in the logistics industry, contributing to promoting sustainable development and creating long-term value for society, the economy, and the environment. Overall, this study has addressed current issues in the field of sustainable logistics while laying a solid foundation for future sustainable development strategies. The findings from the study will help governments and businesses to orient and implement effective sustainable logistics strategies, meeting the increasing demands for sustainable development in the current context of globalization.
Funding
This research received no external funding.
Institutional Review Board Statement
Not applicable.
Informed Consent Statement
Not applicable.
Data Availability Statement
The original contributions presented in this
study are included in the article. Further inquiries can be directed to
the corresponding author.
Acknowledgments
The author appreciate the support from the Ho Chi Minh City University of Technology and Education, Vietnam.
Conflicts of Interest
The authors declare no conflicts of interest.
References
- Evangelista, P.; Colicchia, C.; Creazza, A. Is environmental sustainability a strategic priority for logistics service providers? J. Environ. Manag. 2017, 198, 353–362. [Google Scholar] [CrossRef] [PubMed]
- Sikder, M.; Wang, C.; Yeboah, F.K.; Wood, J. Driving factors of CO2 emission reduction in the logistics industry: An assessment of the RCEP and SAARC economies. Environ. Dev. Sustain. 2022, 26, 2557–2587. [Google Scholar] [CrossRef]
- Hsu, H.-Y.; Hwang, M.-H.; Chiu, Y.-S.P. Development of a strategic framework for sustainable supply chain management. AIMS Environ. Sci. 2021, 8, 532–552. [Google Scholar] [CrossRef]
- Xie, D.; Qiu, Y.; Huang, J. Multi-Objective optimization for green logistics planning and operations management: From economic to environmental perspective. Comput. Ind. Eng. 2024, 189, 109988. [Google Scholar] [CrossRef]
- Kraus, S.; Rehman, S.U.; García, F.J.S. Corporate social responsibility and environmental performance: The mediating role of environmental strategy and green innovation. Technol. Forecast. Soc. Chang. 2020, 160, 120262. [Google Scholar] [CrossRef]
- Javed, T.; Mahmoud, A.B.; Yang, J.; Zhao, X. Green branding in fast fashion: Examining the impact of social sustainability claims on Chinese consumer behaviour and brand perception. Corp. Commun. Int. J. 2024, 29, 915–934. [Google Scholar] [CrossRef]
- Gruchmann, T. Advanced Green Logistics Strategies and Technologies. In Operations, Logistics and Supply Chain Management; Springer International Publishing: Cham, Switzerland, 2019; pp. 663–686. [Google Scholar] [CrossRef]
- Negri, M.; Cagno, E.; Colicchia, C.; Sarkis, J. Integrating sustainability and resilience in the supply chain: A systematic literature review and a research agenda. Bus. Strategy Environ. 2021, 30, 2858–2886. [Google Scholar] [CrossRef]
- Hadi, S.; Miru, S.; Kaseng, S.; Asngadi; Syamsuddin; Zahra, F. Barriers to Green Logistics Implementation in Indonesia: A Preliminary Study. In Proceedings of the 2nd International Interdisciplinary Conference on Environmental Sciences and Sustainable Developments Education and Green Economy (IICESSD EGE 2022), Palu, Indonesia, 7–8 November 2022; pp. 254–257. [Google Scholar] [CrossRef]
- An, H.; Razzaq, A.; Nawaz, A.; Noman, S.M.; Khan, S.A.R. Nexus between green logistic operations and triple bottom line: Evidence from infrastructure-led Chinese outward foreign direct investment in Belt and Road host countries. Environ. Sci. Pollut. Res. 2021, 28, 51022–51045. [Google Scholar] [CrossRef]
- Jefimovaitė, L.; Vienažindienė, M. Factors influencing the application of green logistics: Findings from the lithuanian logistics center. Pol. J. Manag. Stud. 2022, 25, 193–212. [Google Scholar] [CrossRef]
- Zhang, M.; Sun, M.; Bi, D.; Liu, T. Green Logistics Development Decision-Making: Factor Identification and Hierarchical Framework Construction. IEEE Access 2020, 8, 127897–127912. [Google Scholar] [CrossRef]
- Matić, B.; Jovanović, S.; Das, D.K.; Zavadskas, E.K.; Stević, Ž.; Sremac, S.; Marinković, M. A New Hybrid MCDM Model: Sustainable Supplier Selection in a Construction Company. Symmetry 2019, 11, 353. [Google Scholar] [CrossRef]
- Zadeh, L.A. Fuzzy sets. Inf. Control 1965, 8, 338–353. [Google Scholar] [CrossRef]
- Freeman, J.; Chen, T. Green supplier selection using an AHP-Entropy-TOPSIS framework. Supply Chain Manag. Int. J. 2015, 20, 327–340. [Google Scholar] [CrossRef]
- Wang, C.N.; Pham, T.D.T.; Nhieu, N.L. Applying an Ordinal Priority Approach Based Neutrosophic Fuzzy Axiomatic Design Approach to Develop Sustainable Geothermal Energy Source. Energy Eng. 2024, 121, 2039–2064. [Google Scholar] [CrossRef]
- Gimenez, C.; Sierra, V.; Rodon, J. Sustainable operations: Their impact on the triple bottom line. Int. J. Prod. Econ. 2012, 140, 149–159. [Google Scholar] [CrossRef]
- Ahi, P.; Searcy, C. Assessing sustainability in the supply chain: A triple bottom line approach. Appl. Math. Model. 2015, 39, 2882–2896. [Google Scholar] [CrossRef]
- Chatterjee, S.; Chaudhuri, R. Supply chain sustainability during turbulent environment: Examining the role of firm capabilities and government regulation. Oper. Manag. Res. 2022, 15, 1081–1095. [Google Scholar] [CrossRef]
- Chen, J.Y.; Dimitrov, S.; Pun, H. The impact of government subsidy on supply Chains’ sustainability innovation. Omega 2019, 86, 42–58. [Google Scholar] [CrossRef]
- Hunka, A.D.; Linder, M.; Habibi, S. Determinants of consumer demand for circular economy products. A case for reuse and remanufacturing for sustainable development. Bus. Strategy Environ. 2021, 30, 535–550. [Google Scholar] [CrossRef]
- Madaleno, M.; Dogan, E.; Taskin, D. A step forward on sustainability: The nexus of environmental responsibility, green technology, clean energy and green finance. Energy Econ. 2022, 109, 105945. [Google Scholar] [CrossRef]
- Karaman, A.S.; Kilic, M.; Uyar, A. Green logistics performance and sustainability reporting practices of the logistics sector: The moderating effect of corporate governance. J. Clean. Prod. 2020, 258, 120718. [Google Scholar] [CrossRef]
- Piwowar-Sulej, K. Human resources development as an element of sustainable HRM—With the focus on production engineers. J. Clean. Prod. 2021, 278, 124008. [Google Scholar] [CrossRef] [PubMed]
- Khan, M.; Parvaiz, G.S.; Ali, A.; Jehangir, M.; Hassan, N.; Bae, J. A Model for Understanding the Mediating Association of Transparency between Emerging Technologies and Humanitarian Logistics Sustainability. Sustainability 2022, 14, 6917. [Google Scholar] [CrossRef]
- Korucuk, S.; Aytekin, A.; Ecer, F.; Pamucar, D.S.S.; Karamaşa, Ç. Assessment of ideal smart network strategies for logistics companies using an integrated picture fuzzy LBWA–CoCoSo framework. Manag. Decis. 2023, 61, 1434–1462. [Google Scholar] [CrossRef]
- Charłampowicz, J.; Mańkowski, C.; Saikouk, T. Strategic integration of environmental sustainability in inland logistics: A multi-criteria decision-making approach. Bus. Strategy Environ. 2024, 33, 7544–7561. [Google Scholar] [CrossRef]
- Krstić, M.; Agnusdei, G.P.; Miglietta, P.P.; Tadić, S. Evaluation of the smart reverse logistics development scenarios using a novel MCDM model. Clean. Environ. Syst. 2022, 7, 100099. [Google Scholar] [CrossRef]
- Luyen, L.A.; Van Thanh, N. Logistics Service Provider Evaluation and Selection: Hybrid SERVQUAL–FAHP–TOPSIS Model. Processes 2022, 10, 1024. [Google Scholar] [CrossRef]
- Tadić, S.; Zečević, S.; Krstić, M. A novel hybrid MCDM model based on fuzzy DEMATEL, fuzzy ANP and fuzzy VIKOR for city logistics concept selection. Expert Syst. Appl. 2014, 41, 8112–8128. [Google Scholar] [CrossRef]
- Zak, J.; Węgliński, S. The Selection of the Logistics Center Location Based on MCDM/A Methodology. Transp. Res. Procedia 2014, 3, 555–564. [Google Scholar] [CrossRef]
- Wadhwa, S.; Madaan, J.; Chan, F.T.S. Flexible decision modeling of reverse logistics system: A value adding MCDM approach for alternative selection. Robot. Comput. Integr. Manuf. 2009, 25, 460–469. [Google Scholar] [CrossRef]
- Stević, Ž.; Tanackov, I.; Puška, A.; Jovanov, G.; Vasiljević, J.; Lojaničić, D. Development of Modified SERVQUAL–MCDM Model for Quality Determination in Reverse Logistics. Sustainability 2021, 13, 5734. [Google Scholar] [CrossRef]
- Chejarla, K.C.; Vaidya, O.S.; Kumar, S. MCDM applications in logistics performance evaluation: A literature review. J. Multi-Criteria Decis. Anal. 2022, 29, 274–297. [Google Scholar] [CrossRef]
- Kilic, H.S.; Kalender, Z.T.; Solmaz, B.; Iseri, D. A two-stage MCDM model for reverse logistics network design of waste batteries in Turkey. Appl. Soft Comput. 2023, 143, 110373. [Google Scholar] [CrossRef]
- Nila, B.; Roy, J. A new hybrid MCDM framework for third-party logistics provider selection under sustainability perspectives. Expert Syst. Appl. 2023, 234, 121009. [Google Scholar] [CrossRef]
- Zhang, M.; Yan, T.; Gao, W.; Xie, W.; Yu, Z. How does environmental regulation affect real green technology innovation and strategic green technology innovation? Sci. Total Environ. 2023, 872, 162221. [Google Scholar] [CrossRef]
- Tognetti, A.; Grosse-Ruyken, P.T.; Wagner, S.M. Green supply chain network optimization and the trade-off between environmental and economic objectives. Int. J. Prod. Econ. 2015, 170, 385–392. [Google Scholar] [CrossRef]
- Motla, R.; Kumar, A.; Saxena, N.; Sana, S.S. Inventory optimization in a green environment with two warehouses. Innov. Green Dev. 2023, 2, 100087. [Google Scholar] [CrossRef]
- Iwan, S. Adaptative Approach to Implementing Good Practices to Support Environmentally Friendly Urban Freight Transport Management. Procedia Soc. Behav. Sci. 2014, 151, 70–86. [Google Scholar] [CrossRef]
- Margallo, M.; Ziegler-Rodriguez, K.; Vázquez-Rowe, I.; Aldaco, R.; Irabien, Á.; Kahhat, R. Enhancing waste management strategies in Latin America under a holistic environmental assessment perspective: A review for policy support. Sci. Total Environ. 2019, 689, 1255–1275. [Google Scholar] [CrossRef]
- Law, M.M.S.; Hills, P.; Hau, B.C.H. Engaging Employees in Sustainable Development—A Case Study of Environmental Education and Awareness Training in Hong Kong. Bus. Strategy Environ. 2017, 26, 84–97. [Google Scholar] [CrossRef]
- Rahla, K.; Mateus, R.; Bragança, L. Implementing Circular Economy Strategies in Buildings—From Theory to Practice. Appl. Syst. Innov. 2021, 4, 26. [Google Scholar] [CrossRef]
- Lü, X.; Wang, P.; Meng, L.; Chen, C. Energy optimization of logistics transport vehicle driven by fuel cell hybrid power system. Energy Convers. Manag. 2019, 199, 111887. [Google Scholar] [CrossRef]
- Wang, C.; Liu, J.; Fan, R.; Xiao, L. Promotion strategies for environmentally friendly packaging: A stochastic differential game perspective. Int. J. Environ. Sci. Technol. 2023, 20, 7559–7568. [Google Scholar] [CrossRef] [PubMed]
- Nayak, D.; Saetnan, E.; Cheng, K.; Wang, W.; Koslowski, F.; Cheng, Y.F.; Zhu, W.Y.; Wang, J.K.; Liu, J.X.; Moran, D.; et al. Management opportunities to mitigate greenhouse gas emissions from Chinese agriculture. Agric. Ecosyst. Environ. 2015, 209, 108–124. [Google Scholar] [CrossRef]
- Cai, S.; Gou, Z. A comprehensive analysis of green building rating systems for data centers. Energy Build. 2023, 284, 112874. [Google Scholar] [CrossRef]
- Al-Ghaili, A.M.; Kasim, H.; Al-Hada, N.M.; Jorgensen, B.N.; Othman, M.; Wang, J. Energy Management Systems and Strategies in Buildings Sector: A Scoping Review. IEEE Access 2021, 9, 63790–63813. [Google Scholar] [CrossRef]
- Lai, Y.; Yang, F.; Meng, G.; Lu, W. Data-Driven Flexible Vehicle Scheduling and Route Optimization. IEEE Trans. Intell. Transp. Syst. 2022, 23, 23099–23113. [Google Scholar] [CrossRef]
- Lai, P.-L.; Su, D.-T.; Tai, H.-H.; Yang, C.-C. The impact of collaborative decision-making on logistics service performance for container shipping services. Marit. Bus. Rev. 2020, 5, 175–191. [Google Scholar] [CrossRef]
- Waqas, M.; Dong, Q.; Ahmad, N.; Zhu, Y.; Nadeem, M. Critical Barriers to Implementation of Reverse Logistics in the Manufacturing Industry: A Case Study of a Developing Country. Sustainability 2018, 10, 4202. [Google Scholar] [CrossRef]
- Vornhusen, B.; Kopfer, H. Emission vehicle routing problem with split delivery and a heterogeneous vehicle fleet. In Proceedings of the Computational Logistics: 6th International Conference, ICCL 2015, Delft, The Netherlands, 23–25 September 2015; Springer International Publishing: Cham, Switzerland, 2015; pp. 76–90, Proceedings 6. [Google Scholar]
- Foumani, M. Adaptation of a Collaborative Truck and Robotic Vehicle for Sustainable Supply Chain Operations. In Proceedings of the International Conference on Robot Intelligence Technology and Applications, Taicang, China, 6–8 December 2023; Springer Nature Switzerland: Cham, Switzerland, 2023; pp. 289–301. [Google Scholar]

Disclaimer/Publisher’s Note: The statements, opinions and data contained in all publications are solely those of the individual author(s) and contributor(s) and not of MDPI and/or the editor(s). MDPI and/or the editor(s) disclaim responsibility for any injury to people or property resulting from any ideas, methods, instructions or products referred to in the content. |
© 2025 by the author. Licensee MDPI, Basel, Switzerland. This article is an open access article distributed under the terms and conditions of the Creative Commons Attribution (CC BY) license (https://creativecommons.org/licenses/by/4.0/).