
Mathematical Modeling and Simulation of Logistic Growth


Abstract
1. Introduction
- The implementation of a straightforward simulation of the logistic growth model, characterized by parameters that explicitly match the underlying mathematical variables and parameter ranges; these variables can be easily modified by the user, taking into account repeatability purposes and limited computational resources via the customizable setting of the number of simulations and iterations within a single simulation scenario;
- The definition of a basic simulation framework that can be tailored to investigate real-world empirical systems, making use of the extensive and reproducible testing performed on a non-specific synthetic population across extreme living conditions;
- The assessment of the limits of the proposed system trough a detailed comparison with the state-of-the-art Gillespie algorithm in terms of statistical significance and residual analysis.
2. Background
3. Materials and Methods
3.1. Proposed Simulation of Logistic Growth
- If the drawn probability for R is smaller than the corresponding threshold set for R, then the creature reproduces, introducing a new one in the system.
- If the drawn probability for is smaller than its threshold, then the same creature dies. We note that the threshold probability value for is dynamic, depending on the current value of N at each timestep.
- If both probability samples satisfy or do not satisfy their matching inequalities, then “nothing happens”: either the same creature reproduces, dies, and is replaced by its own copy, or it keeps living without causing any change.
- short-term, which represents the sigmoid phase, including lag, acceleration, and deceleration, also named head, with ;
- steady-state, or tail, when the system hits the carrying capacity limit and becomes stationary, with ;
- long-term, which comprises both head and tail, accounting for the whole evolution of the system, with .
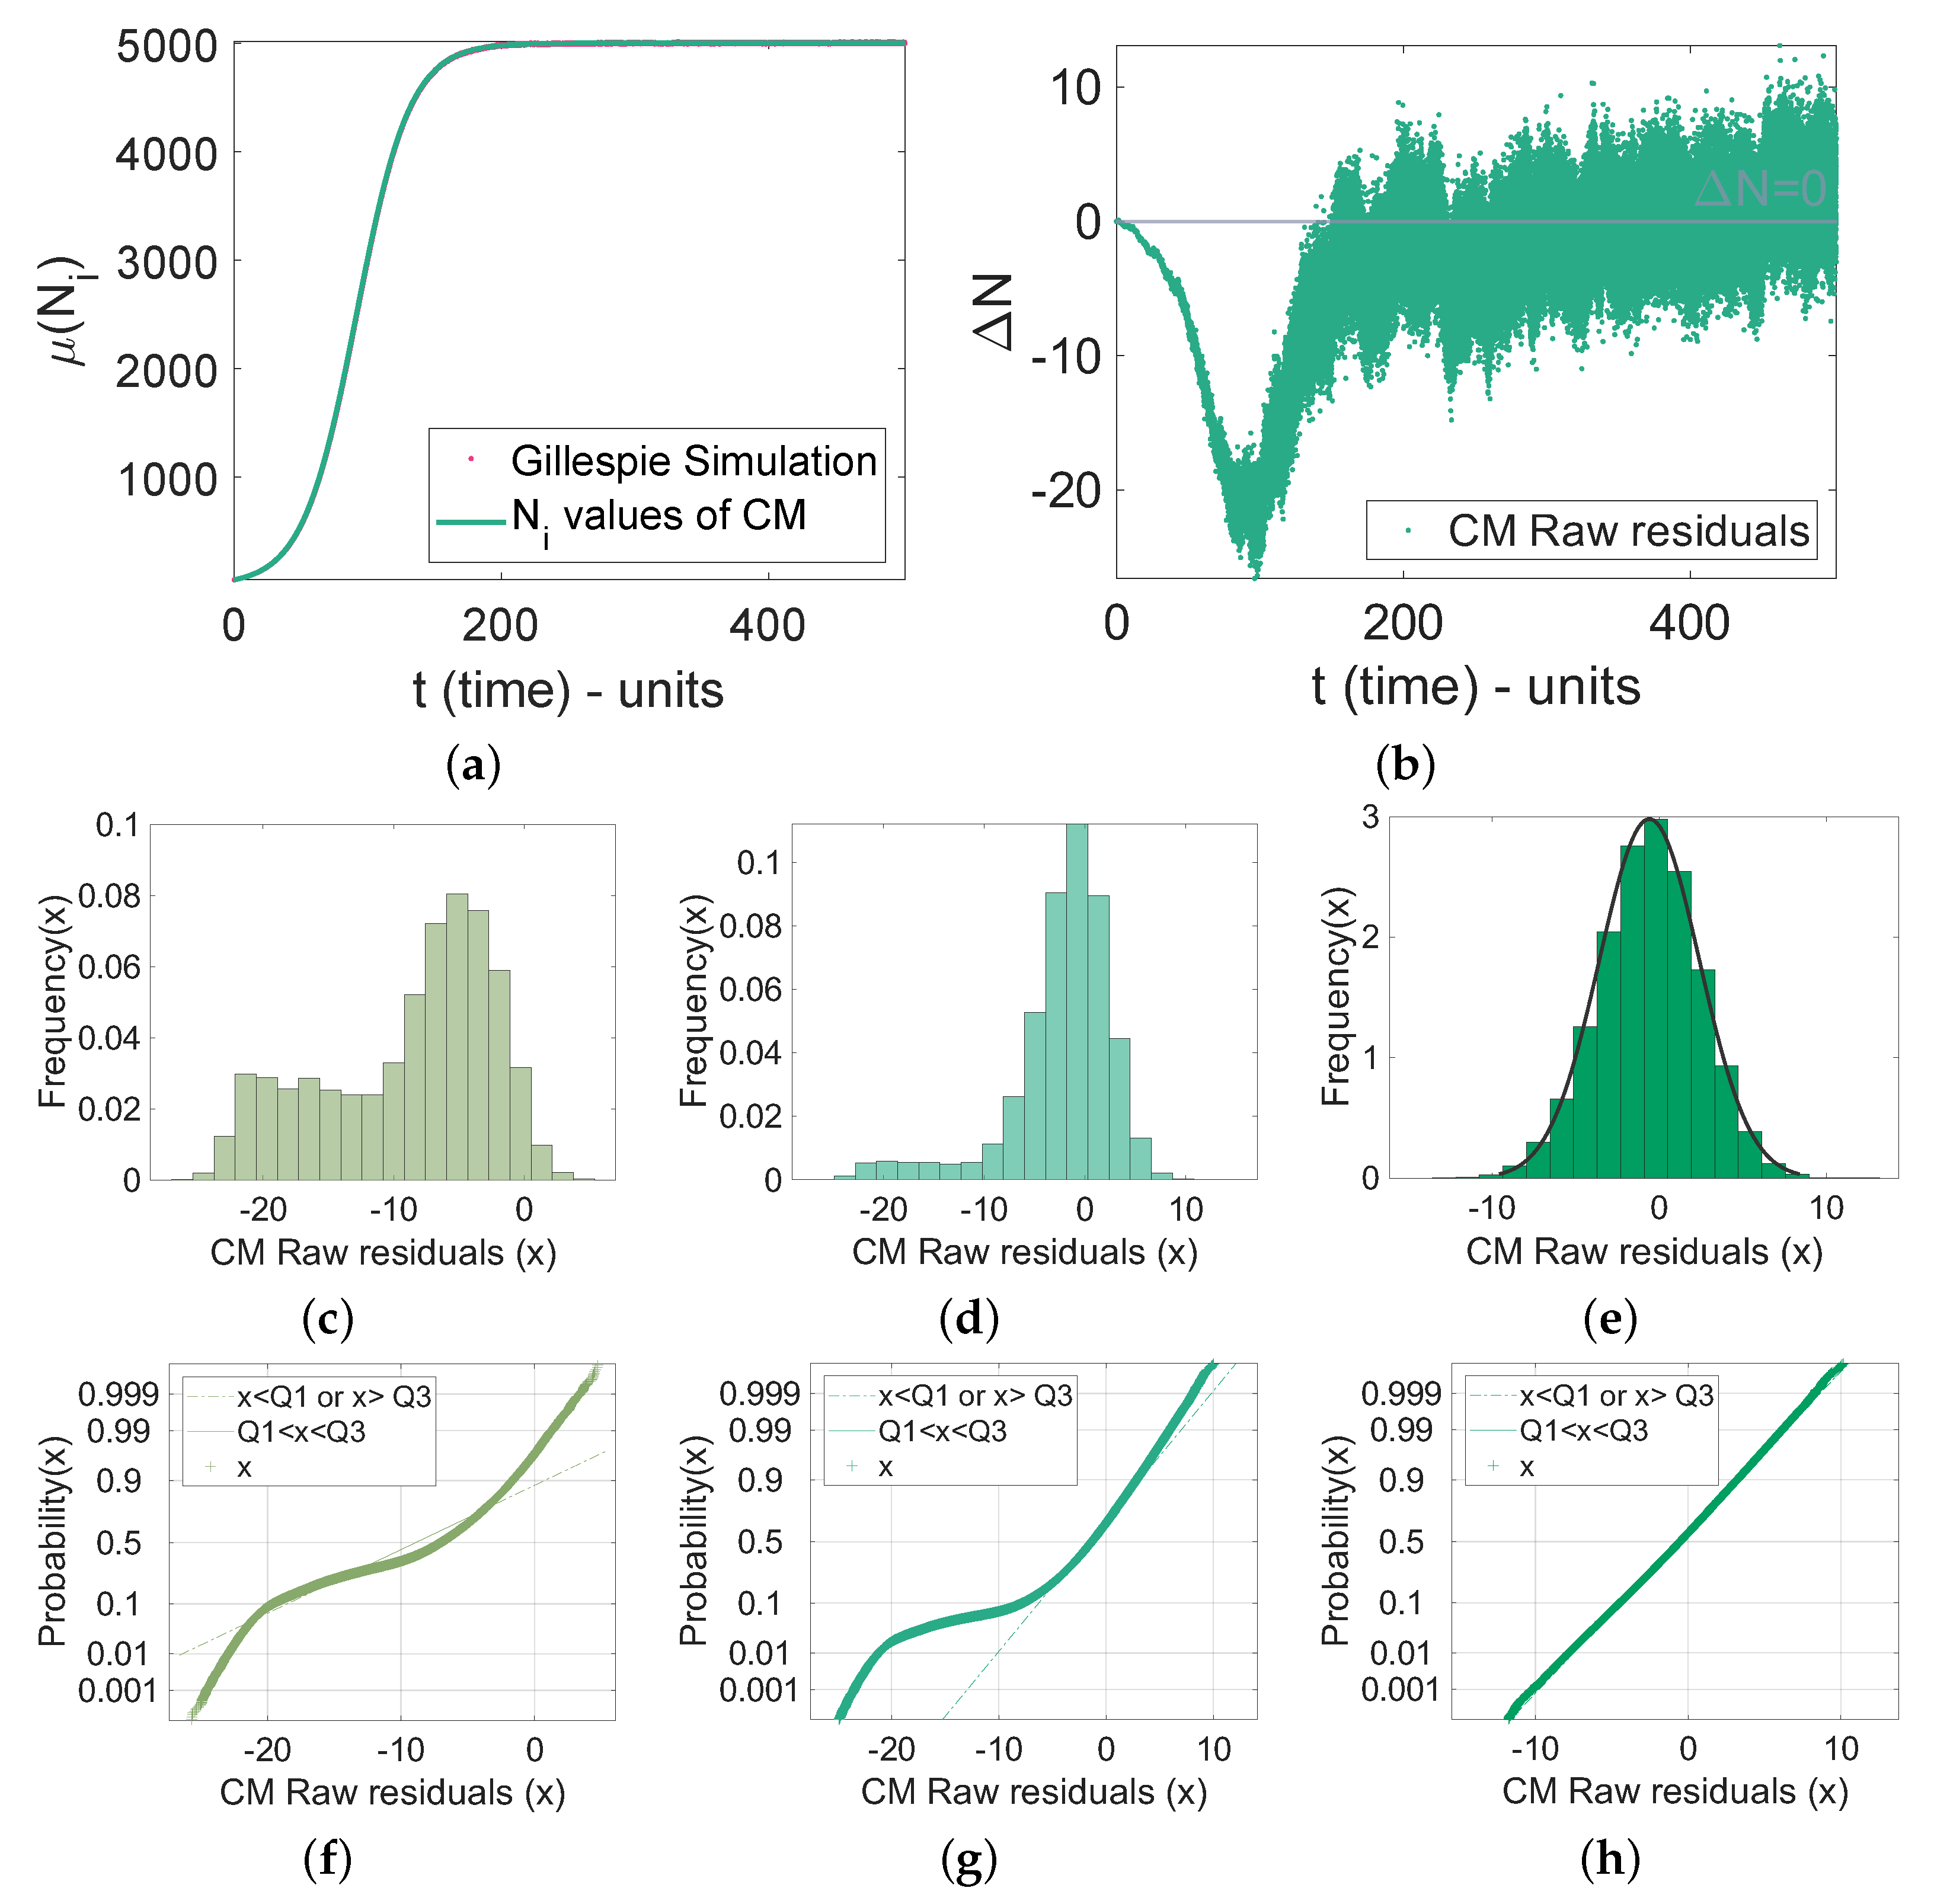
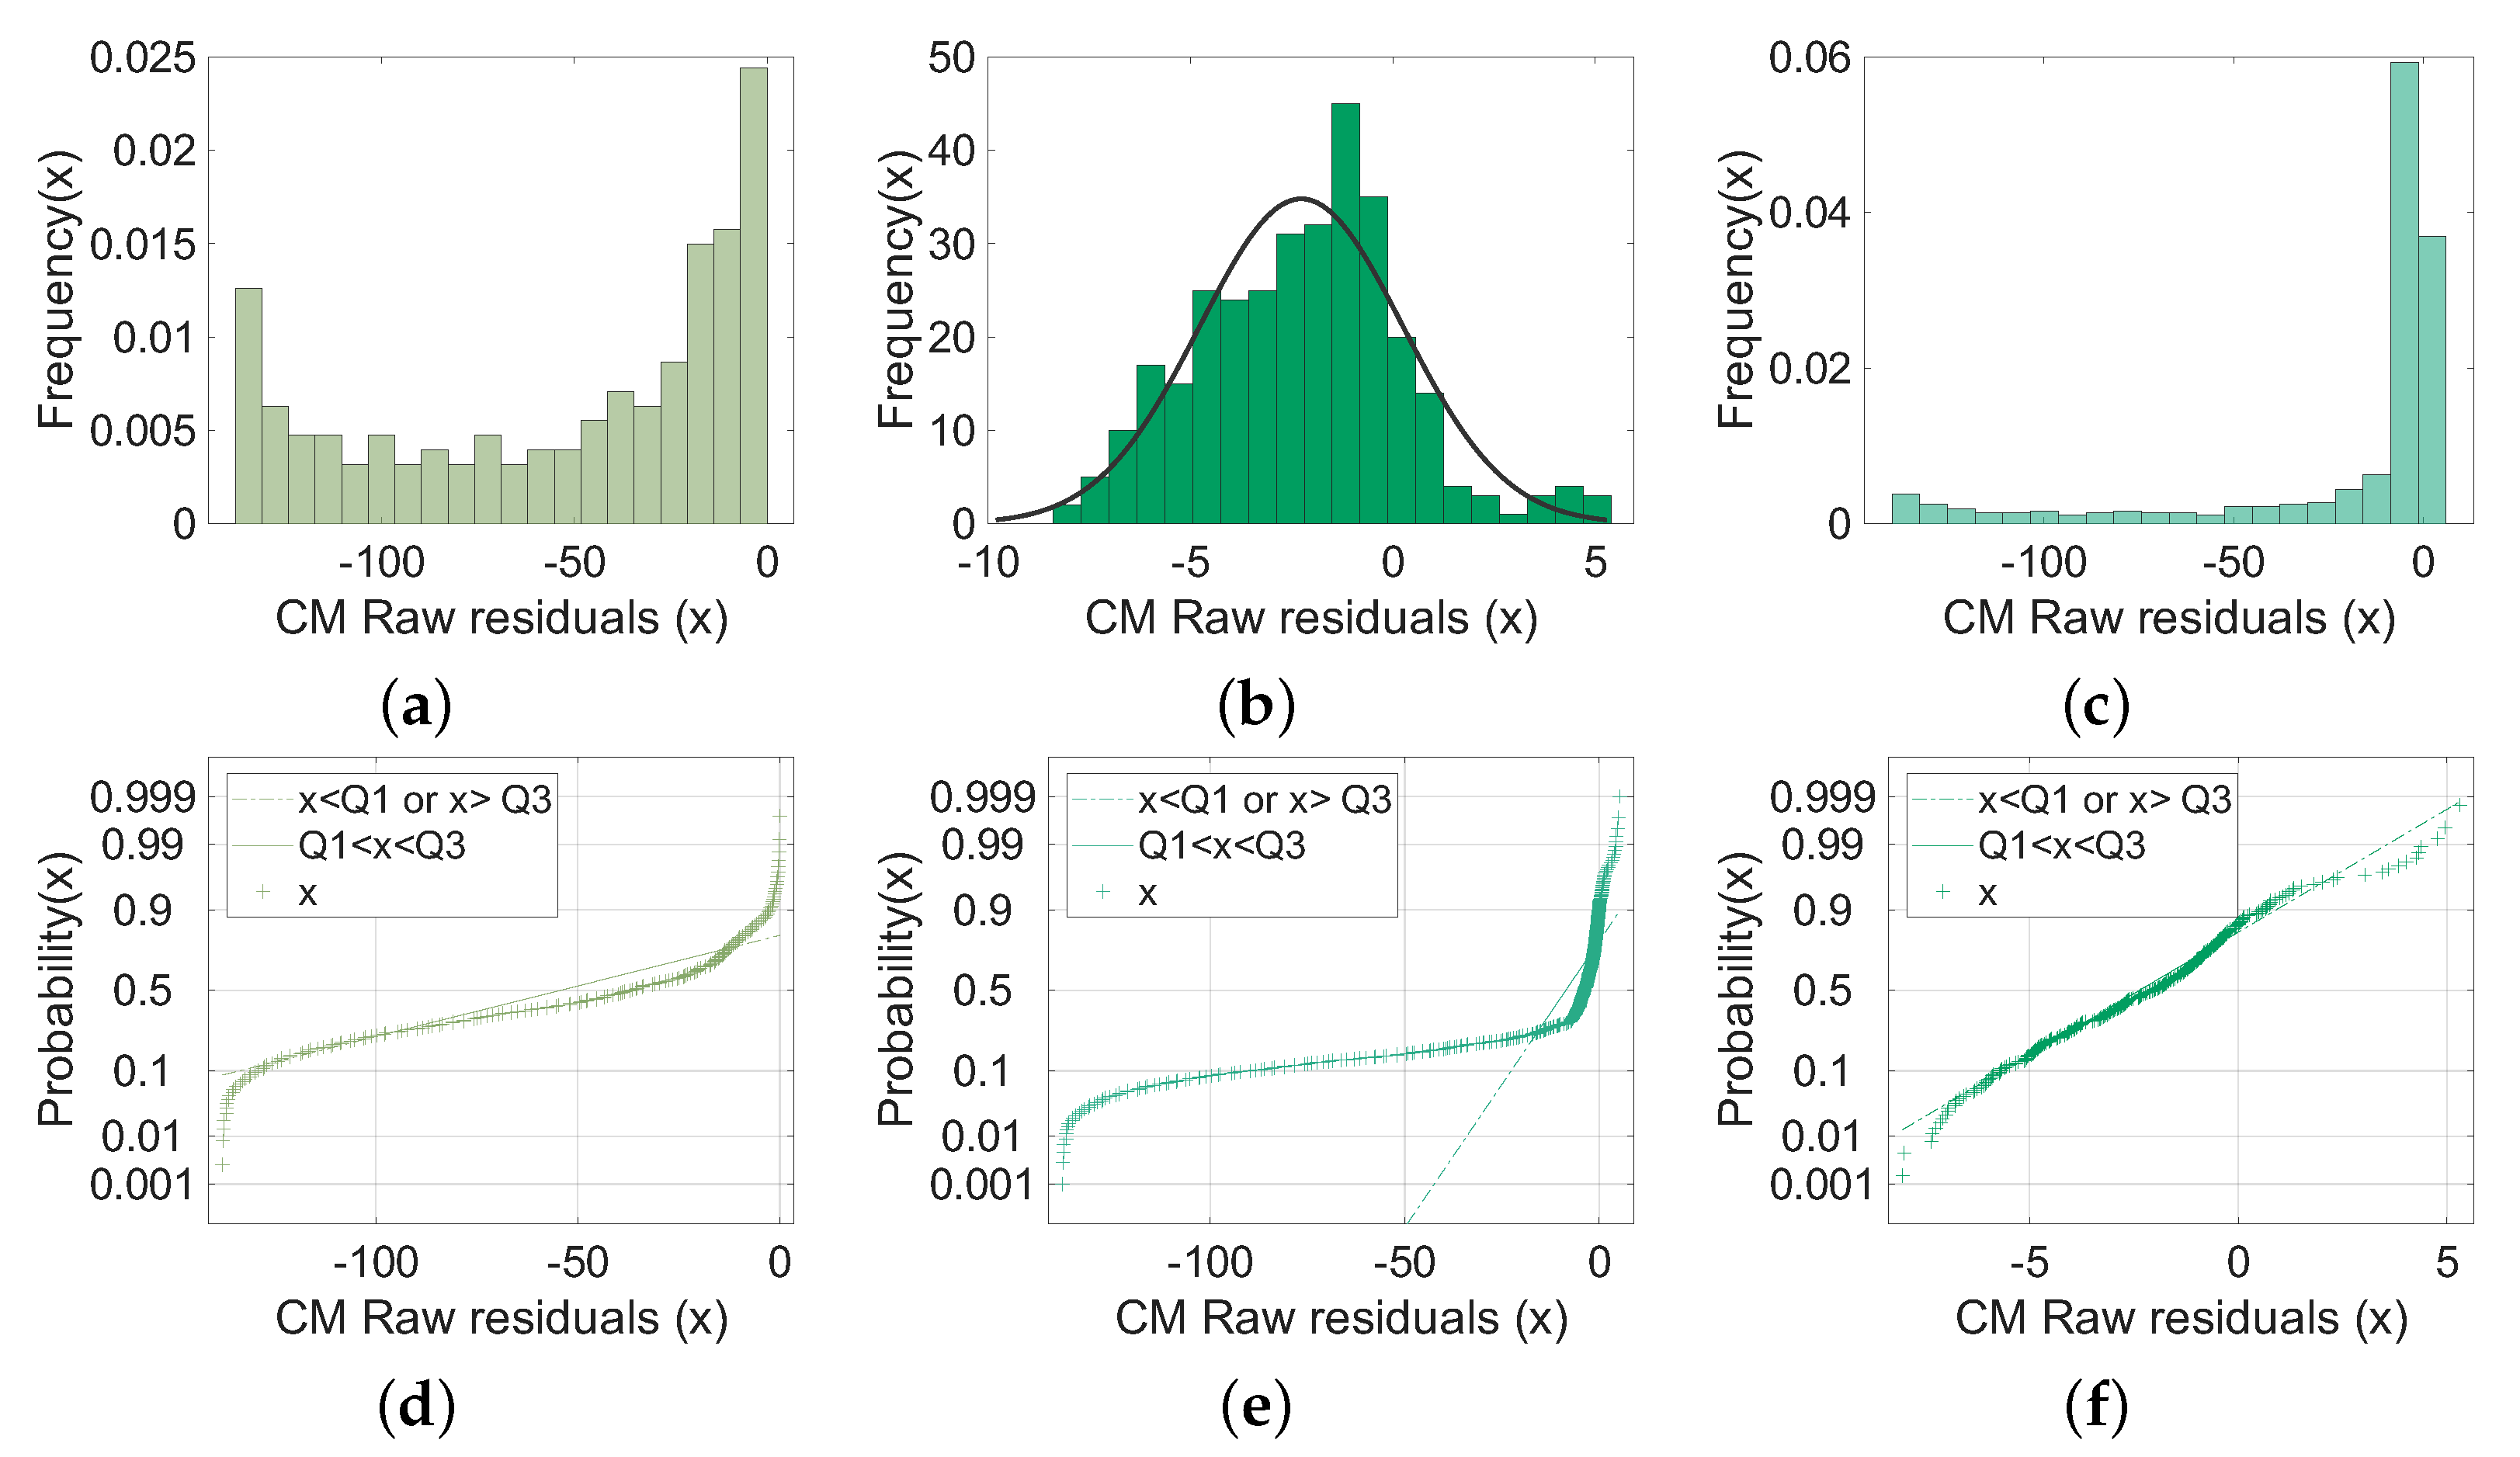
3.2. Comparison with the Gillespie Algorithm
- Birth, , with rate accounting for the left-hand side of the subtraction within the logistic equation .
- Death, , with rate , corresponding to the right-hand side, = . This rate is dynamic, depending on the current value of N.
- The corresponding transition probabilities are given as:
- = .
- = .
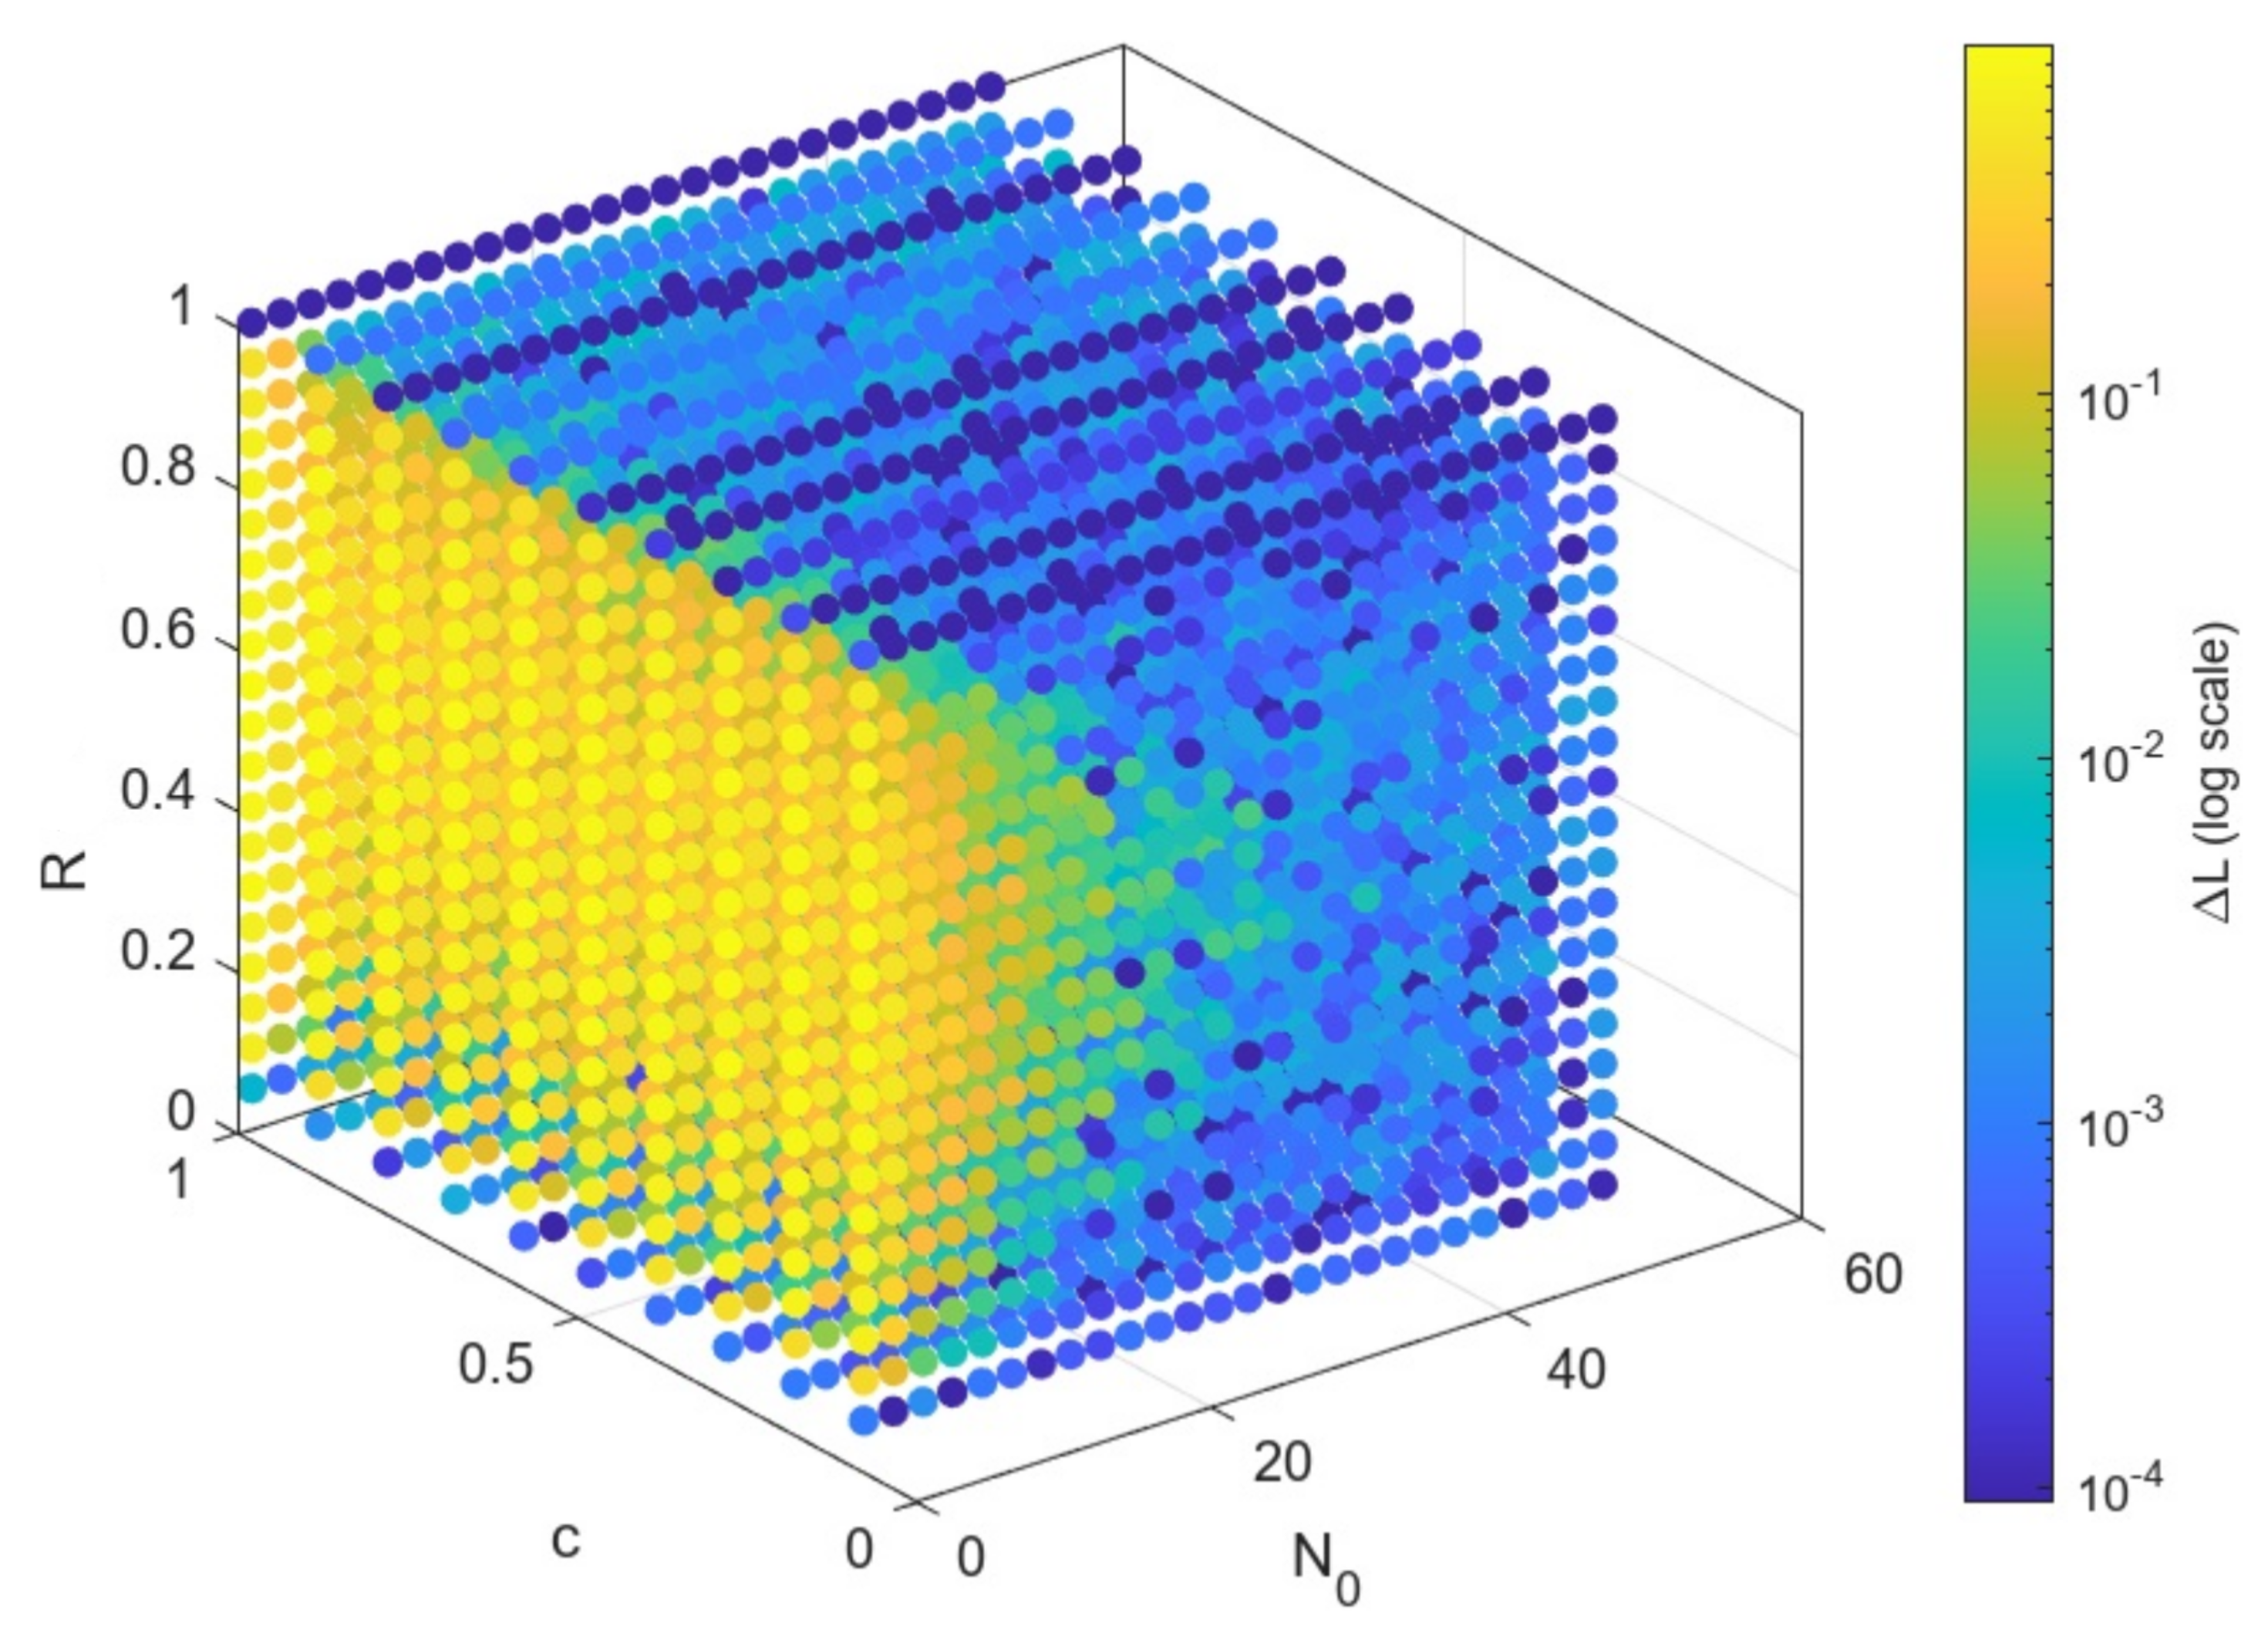
3.3. Parameter Space Exploration and Tuning
4. Results and Discussion
4.1. Proposed Simulation of Logistic Growth
4.2. Comparison with the Gillespie Algorithm
4.3. Parameter Space Exploration and Tuning
5. Conclusions
Supplementary Materials
Author Contributions
Funding
Institutional Review Board Statement
Informed Consent Statement
Data Availability Statement
Conflicts of Interest
Notation
| Notation | Definition | Description |
| N | Population value | Generic reference to the number of creatures in the designed environment |
| Initial population | Number of creatures at the first time-step of the model or simulation | |
| Final population | Number of creatures at the maximum (or last) time-step of the model or simulation | |
| Inflection population | is the x coordinate of the inflection point, obtained by setting the second derivative of the sigmoid function to zero: | |
| Current population | Number of creatures at the current time-step t or iteration i of the model or simulation | |
| Current population per simulation | corresponding to simulation j | |
| Continuous model of growth | is used to map both the exponential and logistic equation (analytical solution), to highlight the transition from theoretical, unlimited to limited growth | |
| Discrete model of growth | is used to map both discrete versions of the exponential and logistic equation (master equation), to highlight the transition from theoretical, unlimited to limited growth | |
| t | Current time-step or time-unit (time) | Current iteration i of the model or simulation |
| First time-step | First iteration i of the model or simulation | |
| Maximum time-step | Last iteration i of the model or simulation | |
| Inflection time | is the y coordinate of the inflection point, obtained by setting the second derivative of the sigmoid function to zero: | |
| Absolute growth rate | Population per unit of time-step t | |
| Delta time | Unit time interval or length of each time-step t: | |
| Delta population | This abbreviation accounts for a difference between two population N values, depending on the paper context:
| |
| k | Continuous relative growth rate | Percent of population per time-step t of the continuous model |
| r | Discrete relative growth rate | Percent of population per time-step t of the discrete model |
| R | Reproduction rate or threshold probability parameter | Per-capita reproduction rate per time-step t as a function of N (simulation model), turned into a threshold probability value for comparison with the corresponding stochastic component of the simulation implementation (rejection sampling) |
| D | Death rate or probability parameter | Per-capita death rate per time-step t as a function of N (simulation model), turned into a probability value that makes up the threshold probability of |
| Death rate adjusted for crowding or threshold probability parameter | Per-capita death rate per time-step t as a function of to account for over-crowding (simulation model), turned into a threshold probability value for comparison with the corresponding stochastic component of the simulation implementation (rejection sampling) | |
| L | Carrying capacity | The largest population that can be supported by the environment. We distinguish between theoretical L and observed L to respectively account for the model and simulation, given that the latter fluctuates above and below |
| c | Crowding coefficient | Constant value accounting for the limiting resources of an over-crowded environment:
|
| Increase rate | Net per-capita increase rate per time-step t under unlimited (exponential) population growth:
| |
| Increase rate adjusted for crowding | Net per-capita increase rate per time-step t under limited (logistic) population growth | |
| Set of simulations | indicates the set of all simulations runs | |
| Number of simulations | represents the cardinality of the simulation set, hence the total number of simulation runs | |
| CM | Continuous Model of Logistic Growth | Abbreviation used to facilitate visualization on plots and readability on text, due to its recurrent use as the theoretical continuous reference of the proposed simulation |
| DM | Discrete Model of Logistic Growth | Abbreviation used to facilitate visualization on plots and readability on text, due to its recurrent use, being the master equation at the base of the proposed simulation |
| Birth transition rate | Along with the event of birth (), the transition rate is a property of the underlying continuous-Markov process. In particular, stands for the left hand-side of the subtraction within the logistic equation. | |
| Death transition rate | Along with the event of death (), the transition rate is a property of the underlying continuous-Markov process. stands for the left hand-side of the subtraction within the logistic equation. | |
| Waiting time | How long it takes for a birth (or death) event to occur, according to an exponential distribution with mean | |
| Iteration mean | The iteration (sample) mean averages N at a given time-step t, across all the independent simulation runs in set : | |
| Iteration variance | The iteration (sample) variance tracks N variability at each time-step t, across all the independent S simulation runs, correcting for bias: | |
| Percentage Error | Difference between the discrete rate r, representing empirical growth, and the continuous growth rate k, standing for theoretical growth, as a percentage of k: | |
| Iteration Absolute Percentage Error | For each iteration i, this metric computes the absolute value of the difference between the DM current population () and the CM current population () divided by . The resulting value is multiplied by 100 to get the corresponding percentage: | |
| Normalized Root Mean Square Error | This metric compares the iteration mean values with the background continuous model (CM) population values. | |
| PRNG | Pseudo Random Number Generator | Employment of the Mersenne Twister 1997 algorithm for the inclusion of the rejection sampling method into the development of the proposed Monte Carlo discrete-time event simulation |
References
- Miller, G.; Spoolman, S. Essentials of Ecology; Brooks/Cole: Pacific Grove, CA, USA, 2009. [Google Scholar]
- Zhao, S.; Hu, I.; Lou, J.; Chong, M.K.; Cao, L.; He, D.; Zee, B.C.; Wang, M.H. The mechanism shaping the logistic growth of mutation proportion in epidemics at population scale. Infect. Dis. Model. 2023, 8, 107–121. [Google Scholar] [CrossRef] [PubMed]
- Shen, C.Y. Logistic growth modelling of COVID-19 proliferation in China and its international implications. Int. J. Infect. Dis. 2020, 96, 582–589. [Google Scholar] [CrossRef] [PubMed]
- Pelinovsky, E.; Kurkin, A.; Kurkina, O.; Kokoulina, M.; Epifanova, A. Logistic equation and COVID-19. Chaos, Solitons ‘I&’ Fractals 2020, 140, 110241. [Google Scholar] [CrossRef]
- Hughes-Hallett, D.; Gleason, A.; McCallum, W. Calculus: Single and Multivariable, 6th ed.; Wiley: New York, NY, USA, 2012. [Google Scholar]
- Gillespie, D.T. Exact stochastic simulation of coupled chemical reactions. J. Phys. Chem. 1977, 81, 2340–2361. [Google Scholar] [CrossRef]
- Pineda-Krch, M. GillespieSSA: Implementing the Gillespie Stochastic Simulation Algorithm in R. J. Stat. Softw. 2008, 25, 1–18. [Google Scholar] [CrossRef]
- Berryman, A.A. On principles, laws and theory in population ecology. Oikos 2003, 103, 695–701. [Google Scholar] [CrossRef]
- Malthus, T.R. An Essay on the Principle of Population; Number Malthus1798 in History of Economic Thought Books; McMaster University Archive for the History of Economic Thought: Hamilton, ON, Canada, 1798. [Google Scholar]
- Académie royale des sciences, d.l.e.d.b.a.d.B. Nouveaux méMoires de l’Académie Royale des Sciences et Belles-Lettres de Bruxelles; L’Académie Royale de Bruxelles et de l’Université Louvain: Louvain, Belgium, 1845. [Google Scholar]
- Verhulst, P.F. A Note on the Law of Population Growth. In Mathematical Demography: Selected Papers; Springer Berlin Heidelberg: Berlin/Heidelberg, Germany, 1977; pp. 333–339. [Google Scholar] [CrossRef]
- Lipkin, L.; Smith, D. Logistic growth model. In Convergence; MAA: Washington, DC, USA, 2004. [Google Scholar]
- Cavallini, F. Fitting a Logistic Curve to Data. Coll. Math. J. 1993, 24, 247–253. [Google Scholar] [CrossRef]
- May, R. Simple Mathematical Models With Very Complicated Dynamics. Nature 1976, 26, 457. [Google Scholar] [CrossRef] [PubMed]
- Gordon, S.P. Comparing the Discrete and Continuous Logistic Models. PRIMUS 2008, 18, 449–455. [Google Scholar] [CrossRef]
- Takasu, F. Lecture 10: Logistic Growth Models. Available online: https://gi.ics.nara-wu.ac.jp/~takasu/lecture/old/archives/L10_logistic-growth.pdf (accessed on 28 June 2006).
- Boudec, J. Performance Evaluation of Computer and Communication Systems; Computer and Communication Sciences; EFPL Press: Lausanne, Switzerland, 2010. [Google Scholar]
- Pineda-Krch, M.; Cannoodt, R. GillespieSSA: Gillespie’s Stochastic Simulation Algorithm (SSA). R Package Version 0.6.2. 2022. Available online: https://cran.r-project.org/web/packages/GillespieSSA/index.html (accessed on 3 April 2025).
- Chure, G. Tutorial 6: Stochastic Simulation of Constitutive Expression. 2018. Available online: https://www.rpgroup.caltech.edu/ncbs_pboc/code/t06_gillespie_algorithm.html (accessed on 2 July 2024).
- Sànchez-Taltavull, D. Stochastic Modelling in Mathematical Biology. 2013. Available online: https://www.ub.edu/simba/slides/simba130304-DSanchez.pdf (accessed on 2 July 2024).
- Policriti, A. Stochastic Simulation (and Gillespie’s Algorithm). Available online: https://users.dimi.uniud.it/~alberto.policriti/home/sites/default/files/bioinformatica-supe/Stochastic-Simulation-advanced.pdf (accessed on 2 July 2024).
- James, G.; Witten, D.; Hastie, T.; Tibshirani, R. An Introduction to Statistical Learning: With Applications in R; Springer: Berlin/Heidelberg, Germany, 2013. [Google Scholar]
- Masuda, N.; Vestergaard, C.L. Gillespie Algorithms for Stochastic Multiagent Dynamics in Populations and Networks; Cambridge University Press: Cambridge, UK, 2022. [Google Scholar] [CrossRef]
- Sloot, P. 1 Introduction to Simulation and Modeling. 1.4 Model Execution: Event Driven vs. Time Driven. 2013. Available online: https://artemis.wszib.edu.pl/~sloot/1_4.html (accessed on 12 July 2012).


| Continuous Growth | Discrete Growth | Percentage Error |
|---|---|---|
| % | ||
| % | ||
| % | ||
| % | ||
| % | ||
| % | ||
| % |
Disclaimer/Publisher’s Note: The statements, opinions and data contained in all publications are solely those of the individual author(s) and contributor(s) and not of MDPI and/or the editor(s). MDPI and/or the editor(s) disclaim responsibility for any injury to people or property resulting from any ideas, methods, instructions or products referred to in the content. |
© 2025 by the authors. Licensee MDPI, Basel, Switzerland. This article is an open access article distributed under the terms and conditions of the Creative Commons Attribution (CC BY) license (https://creativecommons.org/licenses/by/4.0/).
Share and Cite
Pelagalli, C.; Faccio, S.; Casari, P. Mathematical Modeling and Simulation of Logistic Growth. Appl. Sci. 2025, 15, 4409. https://doi.org/10.3390/app15084409
Pelagalli C, Faccio S, Casari P. Mathematical Modeling and Simulation of Logistic Growth. Applied Sciences. 2025; 15(8):4409. https://doi.org/10.3390/app15084409
Chicago/Turabian StylePelagalli, Camilla, Stefano Faccio, and Paolo Casari. 2025. "Mathematical Modeling and Simulation of Logistic Growth" Applied Sciences 15, no. 8: 4409. https://doi.org/10.3390/app15084409
APA StylePelagalli, C., Faccio, S., & Casari, P. (2025). Mathematical Modeling and Simulation of Logistic Growth. Applied Sciences, 15(8), 4409. https://doi.org/10.3390/app15084409