Review

Spectroscopic Techniques Application for Wine and Wine Byproduct Authentication

1
Centre for the Research and Technology of Agro-Environmental and Biological Sciences (CITAB), Institute for Innovation, Capacity Building and Sustainability of Agri-Food Production (Inov4Agro), Biology and Environment Department, School of Life Sciences and Environment, University of Trás-os-Montes and Alto Douro, Quinta de Prados, 5000-801 Vila Real, Portugal
2
Chemistry Research Centre-Vila Real (CQ-VR), Biology and Environment Department, School of Life Sciences and Environment, University of Trás-os-Montes and Alto Douro, Quinta de Prados, 5000-801 Vila Real, Portugal
3
Center for Computational and Stochastic Mathematics (CEMAT), Department of Mathematics, University of Trás-os-Montes and Alto Douro, Quinta de Prados, 5000-801 Vila Real, Portugal
4
Chemistry Research Centre-Vila Real (CQ-VR), Department of Agronomy, School of Agrarian and Veterinary Sciences, University of Trás-os-Montes and Alto Douro, Quinta de Prados, 5000-801 Vila Real, Portugal
*
Author to whom correspondence should be addressed.
Appl. Sci. 2025, 15(8), 4457; https://doi.org/10.3390/app15084457
Submission received: 1 March 2025 / Revised: 14 April 2025 / Accepted: 15 April 2025 / Published: 17 April 2025
(This article belongs to the Special Issue Applications of Spectral Analysis in Alcoholic Beverages)

Abstract

:
The growing concern regarding the authenticity of wine and wine byproducts, particularly in terms of their origin and grape varieties, is of great importance to both consumers and the wine industry. Verifying the accuracy of information presented on labels is crucial for this sector, as regulatory frameworks strictly govern the veracity of claims made to consumers. This concern has driven the development and application of innovative analytical methods, such as spectroscopic techniques, which utilize different wavelengths of the electromagnetic spectrum, including the visible (Vis), ultraviolet (UV), and infrared (IR) regions. This review aims to highlight the importance of understanding a wine’s unique fingerprint. To achieve this, it will explore various analytical methods used to verify the authenticity of consumer information, assess the composition of grapes and wine, and discuss the statistical techniques employed to extract valuable insights from the resulting datasets.

1. Introduction

The geographical origin, composition, grape variety identification, and production methods of wine and its byproducts are essential factors in determining quality, authenticity, and food safety. Awareness of all these characteristics is a growing concern for both consumers and the wine industry [1,2]. Produced through the alcoholic fermentation of fresh white or red grape must, wine holds significant economic value. According to the International Organization of Vine and Wine (OIV) [3], global wine production in 2024 reached 226 million hectoliters, with consumption estimated at 214 million hectoliters in 2024.
Due to rising prices, wine is highly susceptible to adulteration, particularly in the case of wines from prestigious producers. Although most producers issue certificates of authenticity, wine fraud continues to rise, driven by increased trade on digital platforms [4,5]. Fraud can take various forms, most commonly involving the misrepresentation of grape variety and geographical origin, the addition of sugar, flavor enhancers, and colorants, as well as false labeling [6].
Analytical methods for wine authentication typically focus on the analysis of volatile compounds, phenolic compounds, amino acids, elements, or isotopes [4]. These analyses rely on advanced and costly technologies such as high-performance liquid chromatography (HPLC), gas chromatography–mass spectrometry (GC-MS), isotope ratio mass spectrometry (IRMS), and inductively coupled plasma mass spectrometry (ICP-MS). While highly accurate and reliable, these techniques are generally not accessible for routine application—particularly in small to medium-sized wineries or operations with limited resources. They require expensive instrumentation, regular maintenance, specialized facilities, and trained personnel for proper operation and data interpretation. However, it is important to note that in large-scale laboratories and research institutions equipped with the necessary infrastructure, methods like HPLC and GC-MS are widely and effectively used as standard analytical tools. In such contexts, the associated costs and complexity are justified by the high volume of analyses, regulatory demands, and the need for precise, reproducible data.
Recent advancements in analytical techniques for assessing wine’s physicochemical and organoleptic characteristics, aging process [7], geographical origin, and grape varieties [8,9] primarily rely on chromatographic methods, inductively coupled plasma mass spectrometry (ICP-MS), and nuclear magnetic resonance (NMR) spectroscopy [10,11]. While these methods provide critical insights, widespread implementation is challenging due to high costs [12].
As a result, researchers are increasingly focusing on spectroscopic techniques for wine classification and authentication, as they offer highly accurate, reliable, simple, and cost-effective methodologies [13,14,15].
Several studies have demonstrated the effectiveness of combining spectroscopic techniques to identify a wine fingerprint with high precision. Cozzolino et al. [15] and Riovanto et al. [16] successfully classified Sauvignon Blanc and Shiraz wines from different regions of Australia and New Zealand based on geographical origin using ultraviolet–visible (UV–Vis), near-infrared (NIR), and mid-infrared (MIR) spectroscopy combined with multivariate data analysis (chemometrics). Ranaweera et al. [17] authenticated Australian Cabernet Sauvignon wines by integrating spectrofluorometric and multi-element techniques with multivariate statistical modeling. Similarly, Philippidis et al. [12] employed UV–Vis spectroscopy to differentiate between the grape variety, aging period, and type of container for red and white wines from Crete.
Given these findings, understanding the origin of wine and its byproducts is crucial for assessing authenticity and typicality, ultimately enhancing consumer’s perception of quality [18]. Validated analytical techniques, supported by updated databases, are essential for reliably determining and authenticating wine origins.
Moreover, when combined with chemometrics and machine-learning approaches, spectroscopic techniques offer powerful tools for authenticating wine and its byproducts. Techniques such as NMR, UV–Vis, IR, and fluorescence spectroscopy offer detailed insights into the composition, origin, and authenticity of wine. Additionally, non-invasive methods such as Raman and IR spectroscopy play a vital role in verifying packaging authenticity, while data fusion approaches enhance the classification of wine vinegar. These methods are instrumental in ensuring the integrity and quality of wine products in the global market.
Table 1 summarizes some applications and insights of the most commonly used spectroscopic techniques.
Statistical methodologies play an essential role in modeling spectroscopic data. Spectroscopy generates complex datasets, and statistical techniques help to extract meaningful information and build predictive models [4]. For example, González-Domínguez et al. [25] demonstrated how Spanish wine vinegars from different denominations of origin were successfully discriminated using a combination of ultraviolet–visible spectroscopy and multivariate statistical tools.
This review presents a comprehensive overview of the principles underlying spectroscopic techniques employed in the authentication of wines and their derivatives. We explore various aspects, including data analysis methods, advances in machine learning, and the integration of emerging artificial intelligence technologies.
Each spectroscopic methodology is thoroughly described, with specific examples provided to illustrate its practical application in wine authentication.
It begins by examining food spectral fingerprinting approaches, which involve analyzing the unique spectral signatures that characterize different wine varieties. This is followed by a discussion of the algorithms utilized for multivariate data analysis, which play a crucial role in interpreting the complex datasets generated by these spectral analyses. Finally, we explore the application of AI techniques, highlighting how machine-learning models can improve the accuracy and efficiency of wine authentication processes.

2. Food Spectral Print Approaches

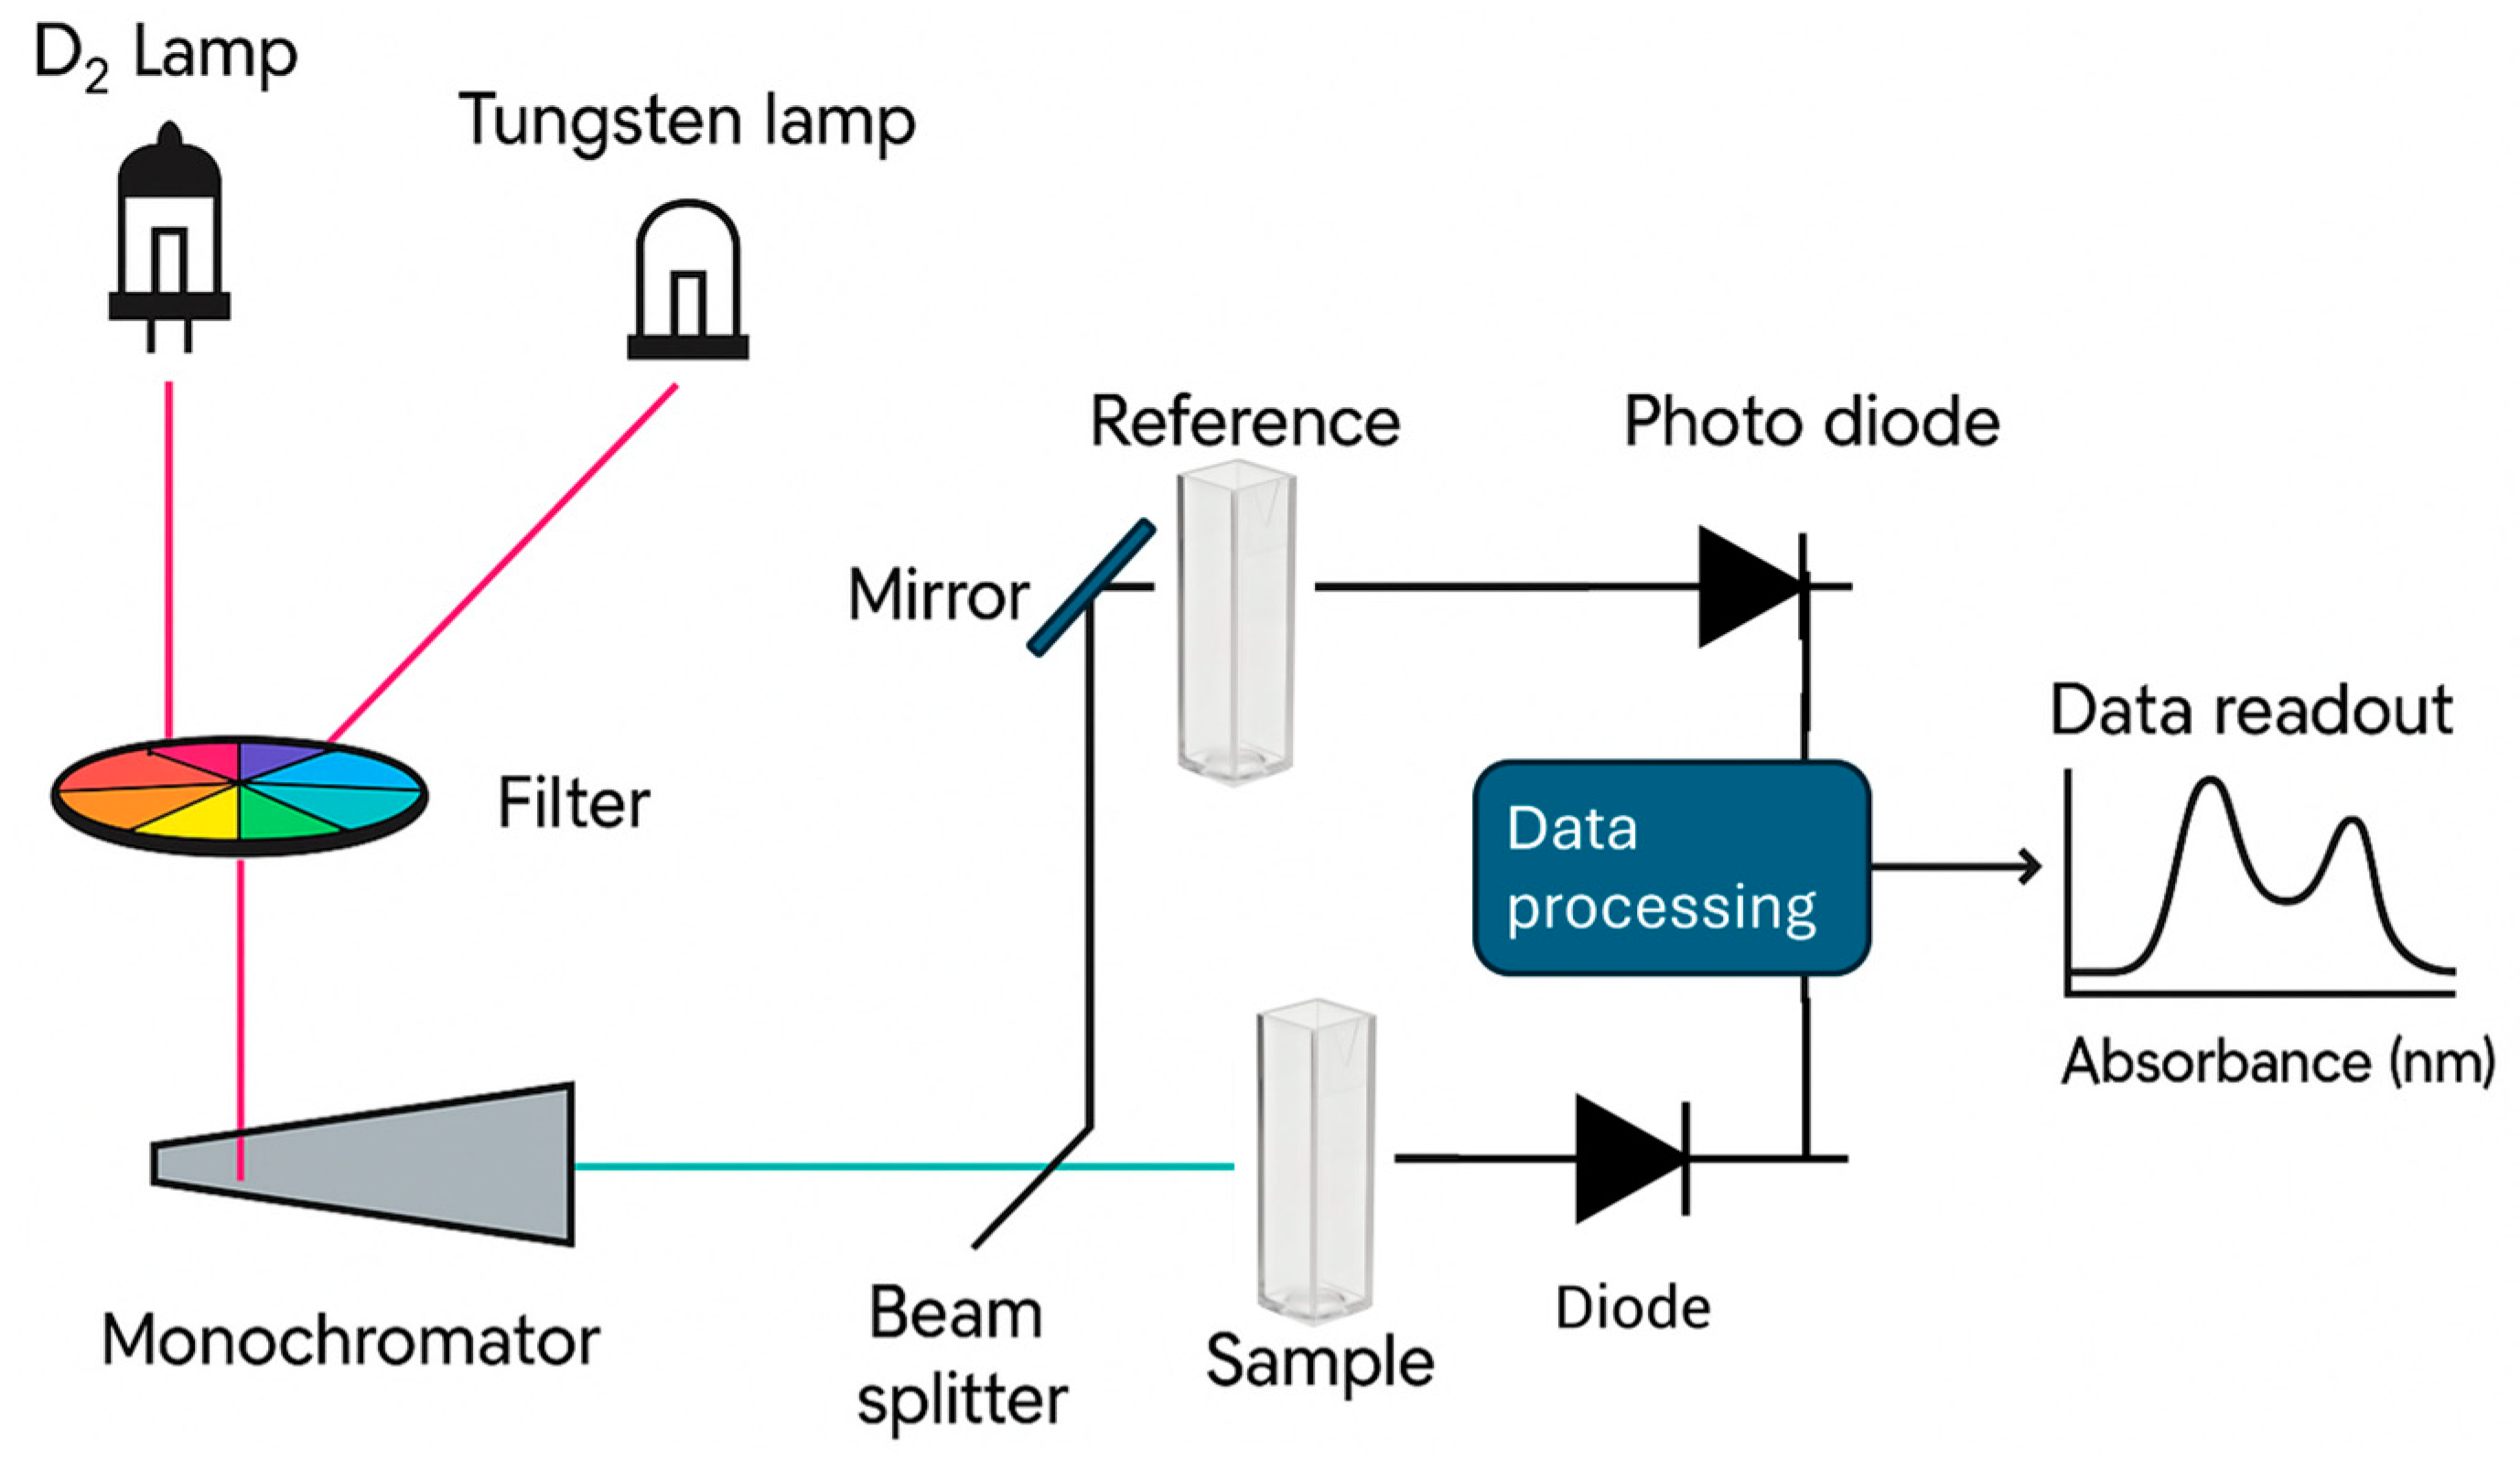
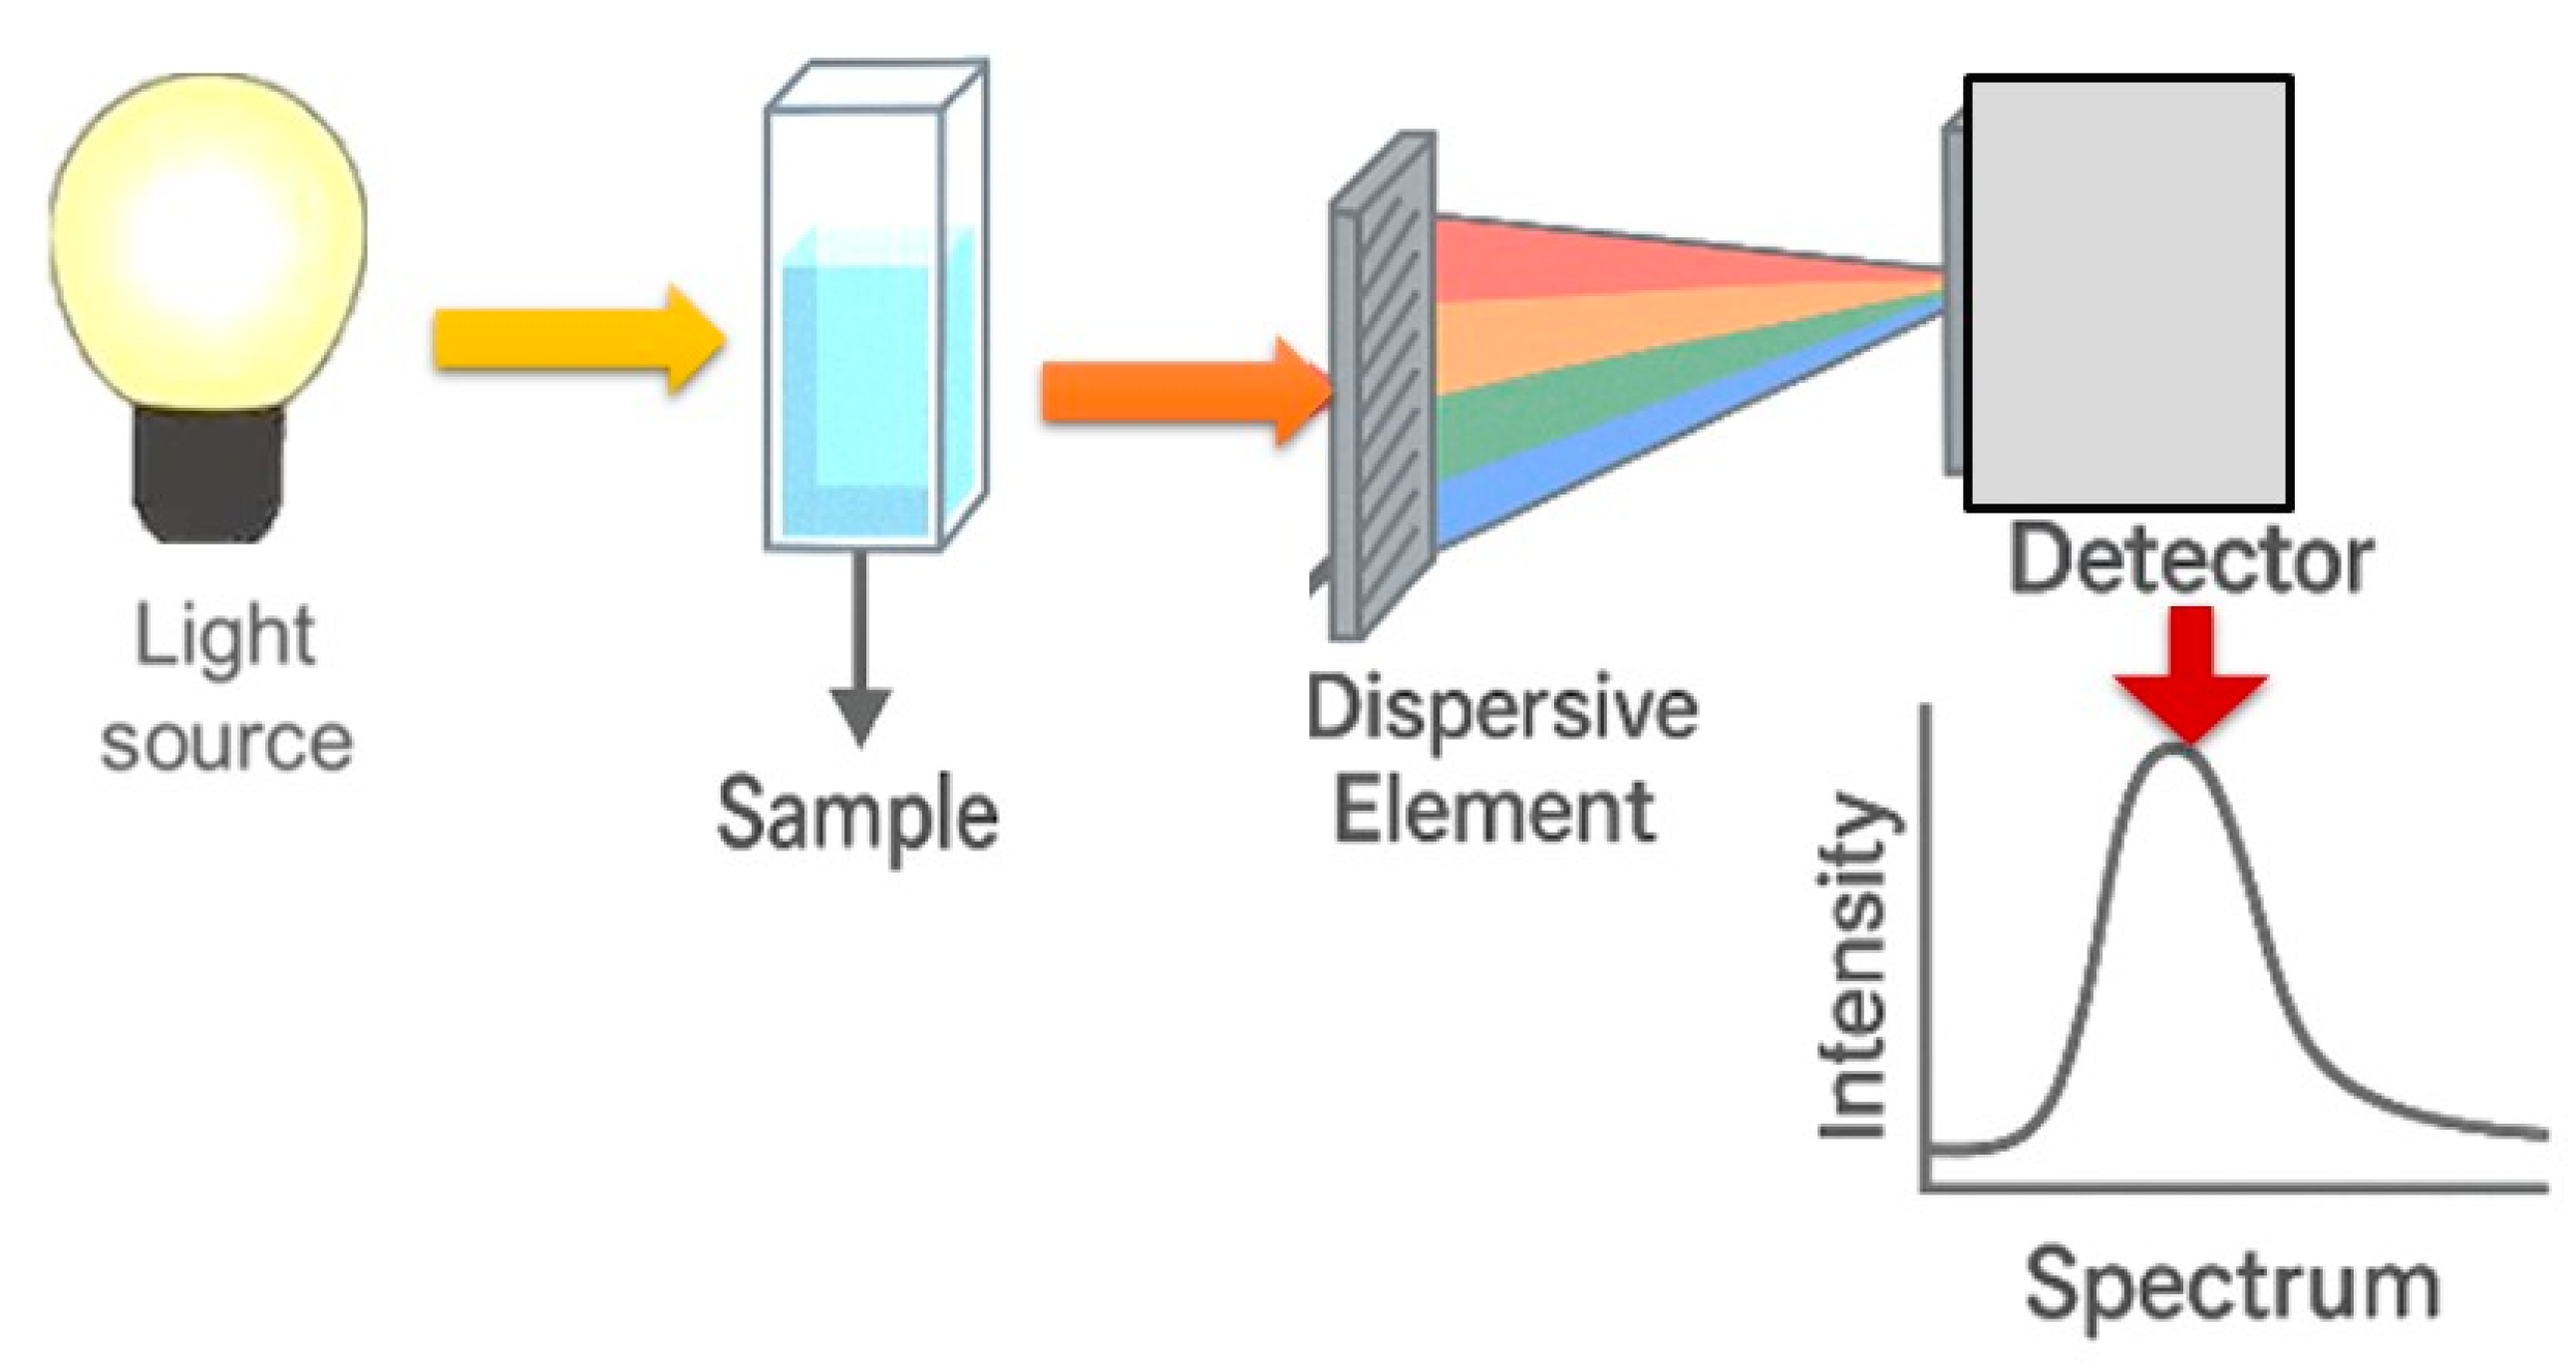
2.1. UV–Vis Spectroscopy

UV–Vis spectroscopy is a widely used analytical technique in the wine industry for authenticating and characterizing wines and wine byproducts. This method is valued for its simplicity, cost-effectiveness, and ability to provide rapid results, making it an attractive option for quality control and fraud prevention in the wine sector.
UV–Vis spectroscopy involves the absorption of electromagnetic radiation by molecules, leading to electronic transitions. The technique measures the amount of light a sample absorbs at different wavelengths, which is related to the concentration and nature of the absorbing species. It operates on the principle that molecules absorb light at specific wavelengths, depending on their electronic structure [26,27]. The apparatus (Figure 1) typically consists of a light source, a monochromator to select specific wavelengths, a sample holder, and a detector to measure the intensity of transmitted light. Indeed, a UV–Vis spectrophotometer is a device that measures the absorption of ultraviolet and visible light. It uses a light source, either a deuterium lamp for UV light (190–400 nm) or a tungsten–halogen lamp for visible light (400–800 nm). The light passes through a diffraction grating or prism, which separates it into different wavelengths. A slit then selects one specific wavelength to go through to the sample. The sample is placed in a cuvette made of quartz for UV light or glass or plastic for visible light. A photodetector, such as a photomultiplier tube or photodiode array, measures the amount of light that passes through or is absorbed by the sample. The device calculates absorbance (A) using the Lambert–Beer Law (explained below). Finally, the spectrophotometer creates an absorption spectrum that shows absorbance versus wavelength. This spectrum helps to identify and measure the substances in the sample. These components are crucial for ensuring accurate measurements. These components are crucial for ensuring accurate measurements [27], as shown in Figure 1.
The technique is based on the Lambert–Beer Law (Equation (1)), which relates absorbance to concentration and path length. However, users must be aware of its limitations and potential sources of errors in routine analysis [28].
A = log I 0 I
where I0 is the intensity of incident light and I is the intensity of the transmitted light.
A critical area of application is wine authentication. UV–Vis spectroscopy, often combined with chemometric techniques, effectively distinguishes between grape varieties and vintage years. Studies have shown that UV–Vis spectroscopy can outperform methods like FT-IR in varietal classification, while FT-IR may be more effective for discriminating vintage years [1,29]. This technique also authenticates wine vinegars, distinguishing between different production methods and protected designations of origin (PDOs) [24,30]. Ríos-Reina et al. [24] investigated the application of hierarchical classification models and reliability estimation by bootstrapping for the authentication and discrimination of wine vinegar samples using UV–Vis spectroscopy. The study demonstrated the effectiveness of UV–Vis spectroscopy in differentiating wine vinegars. A hierarchical classification model utilizing PLS-DA, soft independent modeling of class analogy (SIMCA), and bootstrapping was developed to distinguish between “aged” and “non-aged” wine vinegars, as well as between PDO and non-PDO wines and various aging categories within PDOs. The results indicated that the UV region around 300 nm and the visible range between 500 and 600 nm effectively distinguished the most aged vinegars (“Reserva” category). In comparison, the least-aged samples (“Crianza” and “Solera” categories) were better explained by wavelengths in the range of 290 nm and between 350 and 500 nm.
Phenolic compounds significantly influence the sensory attributes of wine, such as color and flavor. UV–Vis spectroscopy, in conjunction with chemometrics, is employed to monitor the phenolic composition during winemaking. It is particularly effective in determining anthocyanin concentration and evolution, which is crucial for assessing wine quality [31,32]. Miramont et al. [32] analyzed the tannin and anthocyanin content of ninety-two wines from various vintages, varieties, and regions. Tannin concentration was measured using protein and polysaccharide precipitation and the Bate-Smith assay, while free anthocyanin was assessed through bisulfite bleaching. Additional methods included HPLC/UV–Vis for determining the molecular concentration of anthocyanin and dual-spectrum collection using both UV–Vis and FTIR. Statistical analysis using partial least squares (PLS) regression revealed significant correlations, with most parameters exhibiting coefficients of determination exceeding 0.7. FTIR proved more robust for predicting tannin concentration, while UV–Vis was more effective for anthocyanins. Combining both spectral methods improved the results, especially when incorporating visible wavelengths, highlighting the importance of the visible spectrum for estimating anthocyanin parameters. The technique can also quantify polyphenolic compounds in red wines, such as catechin and quercetin [33].
The primary advantages of UV–Vis spectroscopy include its rapid analysis capability, non-destructive nature, and low operational costs. It is suitable for routine analysis in the wine industry, providing a quick method for composition, authentication, and traceability [34]. However, the technique’s effectiveness can be limited by the complexity of wine matrices and the need for sophisticated data analysis methods to interpret the results [34,35,36] accurately.
The development of software tools like VinegarScan (Version 3.0), which utilizes UV–Vis spectra for quality control, highlights the potential for integrating this technique with portable devices for on-site analysis. This could enhance the ability of control bodies to prevent fraud and ensure product authenticity in the wine industry [30]. Future research may focus on improving the robustness and accuracy of UV–Vis spectroscopy models, potentially by combining them with other spectroscopic methods [32].
UV–Vis spectroscopy has been applied to analyze Chinese rice wines from four regions: Zhejiang, Jiangsu, Shanghai, and Fujian. Wu et al. [37] studied 112 samples, collecting UV–Vis absorption spectra from 190 to 800 nm. They employed principal component analysis (PCA) to differentiate the samples and developed classification models, including SIMCA, linear discriminant analysis (LDA), discriminant partial least squares (DPLS), and support vector machines (SVM). Standard normal transformation (SNV) was the most effective among seven mathematical pre-treatments. The SNV-treated LDA models showed a high average classification rate of 98.96% in the training set and 100% in the testing set, demonstrating the effectiveness of UV spectroscopy combined with chemometric analysis for classifying rice wines by region.
Table 2 presents the examples discussed above and others that summarize the use of UV–Vis spectroscopy in analyzing wines and wine byproducts.
UV–visible and infrared (IR) spectroscopy are both valuable analytical techniques, but they differ in their principles, applications, and the types of information they provide. UV–Visible spectroscopy focuses on electronic transitions and is particularly useful for quantitative analysis. In contrast, IR spectroscopy centers on vibrational transitions and is ideal for qualitative analysis of molecular structures. In the following section, we will discuss some applications of IR spectroscopy techniques in wine analysis, specifically mid-infrared (MIR) and near-infrared (NIR) spectroscopy.

2.2. Infrared (IR) Spectroscopy

IR spectroscopy is an analytical technique used to identify and study molecular structures by analyzing their interactions with infrared light. It primarily detects the vibrational modes of chemical bonds within a molecule. When infrared light is passed through a sample, molecules absorb specific wavelengths corresponding to their vibrational frequencies. The absorbed energy causes bond vibrations, such as stretching, bending, and twisting. Each type of chemical bond (C-H, C=O, O-H, etc.) absorbs IR radiation at characteristic frequencies. A detector measures the transmitted or reflected light, producing an IR spectrum that serves as a molecular fingerprint. As a secondary technique, IR spectroscopy often relies on calibration models for quantification and detects bond vibrations caused by dipole changes. In the food industry, NIR and MIR spectroscopy are primarily employed for various applications [41].
In the analytical procedure, a thermal source, such as a Globar or Nernst glower, emits infrared radiation within the range of 4000 to 400 cm−1. This IR beam either passes through or reflects off the sample, which can be in solid, liquid, or gas form. The sample absorbs IR light at specific frequencies, which excites various vibrational modes, including stretching, bending, twisting, and wagging.
A detector, such as a pyroelectric, thermocouple, or photoconductive detector, measures the intensity of the transmitted or reflected IR light. The instrument then generates an IR spectrum, plotting absorbance or transmittance against wavenumber. The resulting peaks in the spectrum correspond to specific bond vibrations, facilitating the identification of the molecules present in the sample [41].

2.2.1. Mid-Infrared (MIR) Spectroscopy

MIR spectroscopy is a subset of infrared (IR) spectroscopy that specifically analyzes molecular vibrations in the mid-infrared region (4000–400 cm−1), as shown in Figure 2. It is widely used for identifying functional groups, chemical bonding, and molecular structures in organic and inorganic compounds.
MIR spectroscopy investigates the interaction of MIR photons with molecules, exciting their vibrational and rotational modes. This interaction offers molecular selectivity and sensitivity, making it suitable for analyzing complex molecules and gases [42,43]. Some MIR spectroscopy techniques involve frequency up conversion, where MIR photons are converted to the near-infrared range. This process preserves quantum correlations and enables high-sensitivity detection using single-pixel detectors [42,43]. MIR dual-comb spectroscopy (DCS) utilizes two frequency combs to achieve high-resolution and high-speed spectral analysis. This method is effective for molecular metrology and can be enhanced with active phase control to improve coherence and the signal-to-noise ratio [44,45,46]. Table 3 presents examples of wines where MIR spectroscopy has been applied, along with referenced works.
MIR spectroscopy enables the rapid analysis of various wine parameters, including alcohol content, acidity, and sugar levels, providing a comprehensive chemical fingerprint of the wine. This capability is crucial for monitoring changes during wine production and ensuring quality control [34,54,55]. Combined with chemometric techniques, this approach is practical in classifying wines based on their geographic origin and grape variety. Studies have shown that MIR can accurately predict the geographic origin of wines and differentiate between monovarietal wines, which is crucial for authenticity and quality assurance [56,57].
The technique is also applied to authenticate fruit wines from chokeberry, blackberry, and raspberry. Researchers can classify fruit wines by plant species by establishing chemometric models from MIR spectra, demonstrating the method’s versatility beyond traditional grape wines [49].
A significant advantage of MIR spectroscopy is that it is non-destructive, requiring minimal sample preparation and no chemical reagents, making it an environmentally friendly option for routine wine analysis [34,56]. Moreover, the technique offers high precision and accuracy in determining wine parameters, outperforming other spectroscopic methods, such as NIR and Raman, in specific applications, including measuring alcohol strength and total acidity [48]. The technique is also efficient; integrating it with other methods, such as NIR, electronic tongues, and GC-MS, can enhance wine authentication processes. These combined approaches provide a comprehensive analysis and mutual corroboration, improving the reliability of authenticity assessments [58].

2.2.2. Near-Infrared (NIR) Spectroscopy

NIR spectroscopy measures a sample’s absorption of near-infrared light. The absorption bands result from overtones and combination vibrations of molecular bonds, primarily involving C-H, N-H, and O-H groups [58,59], as shown in Figure 3. The technique uses spectrometers that can be miniaturized for various applications. Recent advancements in instrumentation and spectral analysis methods, such as spectral image processing and quantum chemical calculations, have enhanced their applicability [60,61]. NIR spectroscopy often requires multivariate calibration algorithms to interpret the spectral data. NIR spectra are composed of broad and overlapping bands, making direct interpretation of the data difficult. Therefore, it is common to use multivariate calibration algorithms, such as PLS regression and PCA, to extract relevant information and build reliable predictive models. These statistical methods enable the correlation of spectral data with sample attributes of interest, thereby increasing the accuracy and robustness of NIR analyses [61]. Chemometrics is commonly used to model the spectral response to the chemical or physical properties of the samples [59,62].
NIR is a powerful analytical technique for authenticating wine and its byproducts. It offers a rapid, non-destructive, and cost-effective method for analyzing various quality parameters and ensuring the authenticity of wine products. This technique is often combined with chemometric methods to enhance its effectiveness.
NIR spectroscopy, often combined with visible spectroscopy (Vis–NIR), has been demonstrated to effectively detect quality parameters, including total acid, total sugar, and alcohol content, in wines. Advanced algorithms, such as ant colony optimization (ACO), enhance the prediction performance of these parameters, rendering them a reliable method for quality assessment [63]. This technique, when combined with chemometrics, has been successfully applied to authenticate high-quality wine vinegars with a PDO. This method demonstrated a high prediction accuracy, making it a valuable tool for preventing adulteration and ensuring brand protection [64]. It can also quantify volatile compounds in wines, such as those found in wines from the Vinho Verde region, which are traditionally determined by gas chromatography. The technique offers a promising, rapid tool for quantifying these compounds, with high coefficients of determination indicating its reliability [65].
NIR spectroscopy is often used in conjunction with other techniques, such as MIR spectroscopy, electronic tongue (E-tongue), and headspace–solid-phase microextraction-GC-MS (HS-SPME-GC-MS), for comprehensive wine authentication. This integrative approach allows for a more robust differentiation of wines, particularly in identifying geographical origins and preventing adulteration [58].
It has been proven to be very reliable when compared to other techniques. NIR spectroscopy, UV–Vis spectroscopy, and artificial noses and tongues have been compared for their effectiveness in characterizing Italian red wines. These techniques, when combined with chemometric pattern recognition, provide a comprehensive fingerprinting method for distinguishing wine samples based on grape variety [29].
Despite its advantages, implementing NIR spectroscopy in routine wine analysis presents several challenges, including a lack of understanding of the technology and a high degree of dependence on mathematical models. Addressing these issues is crucial for the broader adoption of this technology in the wine industry [34]. Thus, the continuous development of NIR spectroscopy and its integration with chemometrics holds promise for wider applications in wine authentication. As technology advances, it is expected to become an even more integral part of ensuring wine quality and authenticity in the global market [4].
Table 4 presents examples of wines where NIR spectroscopy has been applied, along with the following references.
IR spectroscopy efficiently provides detailed information about molecular structures, while fluorescence spectroscopy is highly sensitive and particularly useful for detecting low concentrations of substances. Integrating these two techniques can enhance analytical capabilities and offer comprehensive insights into complex scientific questions. In the next session, we will provide detailed information on fluorescence techniques.

2.3. Fluorescence

Fluorescence spectroscopy is a fast, simple, and highly sensitive analytical technique widely used for characterizing various compounds. The method involves exciting a sample with monochromatic light and analyzing the emitted photons from fluorophores as a function of wavelength. Each fluorophore has a distinct excitation and emission wavelength pair, at which it exhibits maximum fluorescence [70].
One significant advantage of fluorescence spectroscopy is its high sensitivity and selectivity, often surpassing other spectroscopic techniques. It is a non-destructive, non-invasive, cost-effective method with low detection limits. However, despite these benefits, fluorescence spectroscopy is less commonly utilized than vibrational spectroscopic techniques [71,72,73]. It is particularly effective for detecting molecules such as polyaromatic hydrocarbons and heterocycles with rigid molecular structures.
Fluorescence spectroscopy has garnered significant attention in food authentication research, particularly when combined with multivariate statistical analysis [74,75]. This combined approach has shown great potential for verifying the authenticity of various food products and beverages [76]. However, multifluorophoric food samples require more advanced measurement techniques than conventional emission or excitation spectra. Advanced fluorescence methods, such as excitation–emission matrix (EEM) fluorescence spectroscopy, synchronous fluorescence spectroscopy (SFS), and total synchronous fluorescence spectroscopy (TSFS), have been increasingly applied in food analysis [77,78].
Fluorescence spectroscopy has shown particular promise in wine analysis due to its ability to detect polyphenols—a complex family of fluorescent molecules with diverse structures, properties, and sizes [79]. This technique provides valuable insights into molecules containing conjugated double bonds, such as phenolic acids, stilbenes, anthocyanins, flavanols, and tannins, influencing wine composition and quality. The concentrations and types of these compounds vary depending on grape variety, maturity, winemaking processes, and aging conditions. Additionally, wines contain other fluorescent compounds, including proteins, contributing to their spectral fingerprints [80].
Wine also contains fluorescent vitamins and amino acids. Vitamin C is present in fresh must and during fermentation, but it diminishes over time. Vitamin A is found in minimal amounts, whereas B-complex vitamins, particularly riboflavin (B2), are more abundant. In wine, riboflavin primarily exists in its free form, unlike in fruit juice and beer, where it coexists with flavin derivatives [81]. The fluorescent amino acid tryptophan has also been identified in wines [82].
Fluorescence spectra recorded from wine samples following excitation at 261 nm provide information on multiple fluorophores, effectively creating a characteristic fingerprint that enables the identification of samples [80]. The presence and composition of polyphenols vary between grape varieties, with additional complexity introduced by reactions that occur during winemaking and aging.
Front-face fluorescence spectroscopy, combined with chemometric methods, has been investigated for its ability to discriminate wines based on variety, typicality, and vintage. A study analyzing 120 wines from France and Germany utilized fluorescence spectroscopy to record emission spectra (275–450 nm) and excitation spectra (250–350 nm) directly from the wine samples. The emission spectra exhibited a maximum at 376 nm and a shoulder at 315 nm, while the excitation spectra displayed two peaks at approximately 260 and 320 nm. Spectral shape and intensity variations enabled differentiation based on wine origin and characteristics [80].
Rapid fluorescence measurements applied directly to wines have also been used to monitor varietal characteristics, typicality, and vintage classification. These findings confirm that front-face fluorescence spectroscopy, combined with chemometric analysis, is a promising approach for wine authentication. The technique is nondestructive, rapid, easy to use, and cost-effective [80].
In recent years, fluorescence spectroscopic techniques have developed intensively due to the simplicity of the required equipment and the advantages they offer. These methods are fast, noninvasive, highly sensitive, and relatively low-cost. Fluorescence techniques provide crucial information about fluorescent molecules and their environments in biological and food samples. They are reported to be 100–1000 times more sensitive than other spectroscopic techniques [83].
The role of fluorescence spectroscopy in wine analysis continues to expand. Phenolic compounds in grapes and wines form a diverse group of fluorescent molecules. Studies have demonstrated the potential of fluorescence spectroscopy for providing unique spectral fingerprints, allowing the identification of wines based on variety and typicality [17,80]. Furthermore, ref. [18] demonstrated that chlorophyll fluorescence can be utilized to assess anthocyanin content in grapes, underscoring the versatility of fluorescence-based methods in viticulture.
Distilled spirits’ fluorescence spectra contain overlapping bands that reflect chemical, physical, and structural information. As a result, conventional fluorescence techniques that rely on single emission or excitation spectra may be inadequate for analyzing spirit drinks. Advanced methods, such as total luminescence or synchronous scanning fluorescence, combined with multivariate and multiway analytical techniques, enhance sample classification, identification, and property determination [84].
Fluorescence spectroscopy is a valuable tool for authenticating food and wine. It enables rapid, non-destructive analysis, allowing researchers and producers to obtain characteristic fingerprints of products in seconds. When combined with chemometric techniques, fluorescence spectroscopy becomes even more potent for authenticating wines based on grape variety, processing conditions, and aging. This high sensitivity makes it a valuable tool for verifying wines based on variety [22,85,86] or geographical origin [22,80]. Its potential is further enhanced when combined with chemometric techniques [22,26,85,86].
Despite its promise, research on integrating fluorescence spectroscopy with chemometric methods remains limited. Further studies are needed to strengthen wine authentication and enhance its acceptance in international markets [22].

2.4. Nuclear Magnetic Resonance (NMR)

NMR spectroscopy is one of the most powerful analytical techniques for obtaining high-throughput spectroscopic and structural information on various molecular compounds. It enables the precise characterization of complex compositional matrices in foodstuffs with minimal sample preparation, allowing for the accurate quantification of selected metabolites within mixtures. As a result, NMR provides comprehensive metabolic profiles that are essential for food authentication [87,88].
A specialized NMR technique, Site-Specific Natural Isotopic Fractionation (SNIF-NMR), enhances the robustness of molecular fingerprinting. One of its most notable applications is determining the geographical origin of wine, a method officially recognized by the European Union since 1990 (Rossmann, 2001 [89]). SNIF-NMR is widely used to verify the authenticity of various products, including wine and vinegar, by analyzing their metabolic profiles.
At its core, NMR spectroscopy detects atomic nuclei with a non-zero magnetic moment, interacting with an external magnetic field. When subjected to an oscillating radio-frequency field, these nuclei emit signals that reflect their chemical environment and interactions with neighboring nuclei, providing valuable insights into their structure. The intensity of these signals correlates with the number of resonating nuclei, making NMR a highly sensitive and reliable analytical tool [90].
One key advantage of NMR spectroscopy is its ability to simultaneously identify and quantify a wide range of chemical compounds, including sugars, organic acids, amino acids, alcohols, and phenolic compounds [91]. The intensity of NMR signals is directly related to the concentration of each compound, a principle that has been validated through international collaborative trials [92].
NMR has been extensively applied in wine research. It has been used to characterize the metabolome of intact grape berries [93], analyze berry extracts to assess maturity levels before harvest [94], and evaluate the influence of terroir [95] and cultivation practices [96] on grape composition. Additionally, metabolic profiling of wines using NMR has facilitated the classification and comparison of wine samples [10]. Since NMR spectra can reveal inherent genotypic variations among grape cultivars, this technique has proven to be a powerful tool for varietal classification [97].
The NMR spectrum of a wine sample serves as a unique molecular fingerprint, making it invaluable for traceability and authentication [19,98]. Numerous studies have demonstrated its potential for wine authentication, particularly in distinguishing geographical origin [99], vintage [93], and grape variety [100]. In principle, a well-structured dataset of 1H NMR spectra can simultaneously address multiple authenticity concerns [101,102].
Godelmann et al. [103] analyzed approximately 600 German wines and demonstrated that 1H NMR can generate unique “fingerprints” for each wine sample when combined with statistical data analysis. These fingerprints provide valuable insights into various factors, including geographical origin, grape variety, physiological state, vintage, and technological treatments. Additionally, studies have shown that integrating NMR profiling with stable isotope analysis enhances wine authentication, yielding promising results [99].
However, a key challenge in NMR-based wine authentication lies in the multivariate nature of the data. Unlike targeted analysis focusing on individual compounds, NMR evaluates the entire spectral fingerprint using classification models built on reference data. To ensure accurate predictions for unknown samples, these models must be trained on a comprehensive dataset that captures the full spectrum of natural variation. This necessitates the development of extensive reference databases containing spectra from authentic, well-characterized wine samples [104].
NMR spectroscopy is a powerful, non-destructive tool that provides detailed metabolic profiles essential for wine authentication. Its ability to analyze complex mixtures with high precision and robust classification models makes it an indispensable technique for verifying wine authenticity in global markets. Despite its advantages, the use of this approach may be limited by economic and operational factors. The high cost of acquiring, maintaining, and operating NMR equipment, especially those with high magnetic fields, represents a significant barrier, especially in institutions with limited resources [19].

2.5. Raman

Raman spectroscopy is a vibrational spectroscopic technique that provides valuable insights into the chemical composition of a substance. It operates through inelastic scattering, allowing for the detection of vibrations associated with specific chemical functional groups within a sample molecule. This property makes Raman spectroscopy highly effective for molecular fingerprinting. The technique offers high specificity, with distinct, non-overlapping peaks, and is particularly well-suited for analyzing liquid samples. Since Raman signals are inherently weak and do not interfere with analysis, Raman spectroscopy is ideal for examining high-water-content matrices such as wine [105]. As a green, non-destructive method, it enables rapid analysis and requires minimal sample preparation, making it particularly useful for authenticating wine and other aqueous samples [106,107,108,109,110].
A Raman spectrometer generates a spectrum that provides key molecular information, including vibration frequencies, peak position shifts, peak width, spectral intensity, half-width at half-height, and the debiasing ratio. Because Raman spectroscopy is highly sensitive to molecular bonding and structural variations, each molecule or sample exhibits a unique “fingerprint”. Various Raman techniques, such as dispersive Raman spectroscopy (DRS), Fourier transform Raman spectroscopy (FT-RS) [111], micro-confocal Raman spectroscopy (MCRS), spatially offset Raman spectroscopy (SORS) [75,112], resonance Raman spectroscopy (RRS) [112], and surface-enhanced Raman spectroscopy (SERS) [75,113,114], are widely applied in food analysis. Figure 4 represents a schematic of the measurement principle in a Raman spectrometer, illustrating how it works. A laser light source illuminates the sample, causing the light to interact with the molecules. The inelastically scattered light is then separated into different wavelengths by a dispersive element. The detector analyzes the various wavelengths and their intensities, converting the data into the final spectrum.
One significant advantage of Raman spectroscopy is its ability to be performed directly in aqueous environments and through glass containers, as both water and glass produce minimal interference in the Raman spectrum [115]. Their weak signals do not overlap with those of key food components, such as lipids [116], proteins [117], and carbohydrates [118], which exhibit high sensitivity and specificity.
Due to its rich spectral information, Raman spectroscopy offers distinct advantages in verifying food authenticity [119]. The Raman scattering effect has been explored in wine discrimination studies, particularly when combined with chemometric analysis, to distinguish wines from the protected designation of origin of Piemonte (Northwest Italy) based on grape variety, production area, and aging time [120]. Similarly, it has been successfully applied to differentiate between wines from Romania and France, concerning cultivar, geographical origin, and vintage [121].
As mentioned earlier, spectroscopic techniques are particularly useful for analyzing various properties of wine, including its chemical composition, quality, aging potential, and even flavor profile. However, raw spectral data often contain noise, unwanted variations, and redundancies that must be addressed before meaningful analysis. Statistical techniques provide powerful tools for processing, modeling, and integrating spectroscopic data, enhancing their interpretability and predictive capabilities.

3. Statistical Techniques in Spectroscopy

Spectroscopic techniques are increasingly being used as a tool for extracting relevant information in various scientific fields. They enable the identification of substances, analysis of chemical composition, and quality control of raw materials, among other applications [122,123,124]. These techniques also play a crucial role in the wine sector, providing powerful tools for detecting fraudulent practices such as mislabeling of geographical origin, adulteration, or misrepresenting grape varieties. Additionally, they provide insights into wine’s chemical composition, quality, and sensory properties [1,125]. Combining information from spectral data, sensory data, and environmental factors can achieve a more holistic understanding of wine and wine byproducts. However, due to the complex and multidimensional nature of the resulting data, advanced statistical and machine-learning techniques are essential for data processing, modeling, and fusion [24,123,126,127]. These techniques ensure reliable interpretation and help to derive actionable insights leading to improved wine classification, quality control, fraud detection, and predictive modeling for producers and consumers.

3.1. Data Processing

Spectroscopic data are often high-dimensional, with thousands of variables per sample, requiring robust techniques for analysis and interpretation. Data processing is crucial in spectroscopic analysis, ensuring that raw spectral data are cleaned, normalized, and transformed to enhance signal quality and eliminate unwanted variations [123,126]. Standard preprocessing techniques include:
Visualizing spectral data using techniques such as boxplots, heatmaps, histograms, and scatterplots, and computing descriptive statistical measures like mean, median, standard deviation, and correlation constitutes a fundamental step in preprocessing and interpreting spectral datasets.
Baseline correction, smoothing, and normalization techniques such as asymmetric least squares (ALS), Savitzky–Golay filtering, and vector normalization improve signal clarity, reduce noise, and ensure consistency across variables with different ranges.
Reduction techniques, such as PCA, Factor Analysis (FA), Categorical Principal Component Analysis (CATPCA), and the wavelet transform, help to extract relevant information while eliminating redundant data [124,128,129].
Additionally, statistical approaches such as the Mahalanobis distance and Grubbs’ test are employed for outlier detection [130,131,132].
In wine analysis, PCA is frequently used to process Fourier transform infrared (FTIR) spectra to identify the primary sources of variation. In contrast, FA is used to identify latent variables that influence spectral data and wavelet transform. The wavelet transform helps to decompose spectral data into different frequency components.
Radulescu et al. [129] utilized PCA to analyze FTIR and Raman spectra of red grape skin, demonstrating its efficacy in managing spectral data redundancy. In another study, PCA was applied to identify the primary sources of variation in FTIR spectra of 329 wines of various styles, enabling the identification and interpretation of samples and the identification of outlier samples [133].
Therefore, integrating PCA, FA, and WT into the analysis of wine spectral data helps minimize redundancy, enhances the extraction of meaningful information, and improves the accuracy of predictive models used to assess and classify wine quality.
Through effective data processing, researchers can gain a deeper understanding of spectral data, identify key trends, and prepare the data for further analysis, such as classification, clustering, or predictive modeling.

3.2. Data Modeling

Data modeling is a critical process in spectroscopy-based wine analysis. The complexity and multidimensionality of spectral data require the application of machine learning and statistical techniques that enable the pattern recognition, classification, and prediction of key parameters related to wine composition, origin, and quality. The choice of statistical methodology depends on the specific data type and the objectives of the analysis. Some commonly used statistical methods for modeling spectroscopic data include the following:
Regression techniques, such as multiple linear regression (MLR), partial least squares regression (PLSR), and principal component regression (PCR), are used to predict spectral data quantitatively [125,127,134,135]. PLSR is widely applied to handle highly collinear spectral data by extracting latent variables from the spectra, which are then used to predict outcomes. PCR is a procedure that uses the first principal components as predictors in the regression model.
Classification techniques such as linear discriminant analysis (LDA) and quadratic discriminant analysis (QDA) are based on probability distributions. Support vector machines (SVMs) are used to find the optimal decision boundary. At the same time, Random Forest (RF) is an ensemble learning method that builds multiple decision trees and aggregates their predictions for classification [21,125,136]. Techniques such as K-means Clustering, K-nearest neighbors, or Hierarchical Clustering are used to group spectra with similar properties based on spectral features [60,130]. Multivariate analyses, such as FA, Canonical Correlation Analysis (CCA), and PLS, are applied to identify patterns and relationships between datasets. More recently, advanced classification techniques, such as Artificial Neural Networks (ANNs), have gained popularity in analyzing complex spectroscopic data due to their ability to model nonlinear relationships and handle large datasets. In wine analysis, Artificial Neural Networks can be used, after being trained on spectral datasets, to predict changes in the chemical composition of wine over time, assess wine quality, and quantify various chemical components, among other applications [4,137,138,139,140].

4. Emerging Trends in Wine and Byproduct Authentication

Ensuring the authenticity of the wine and its byproducts is crucial to maintaining consumer confidence, protecting brand reputation, and meeting regulatory standards. This is a widely debated topic among experts, especially given the increasing internationalization of wine and its byproducts [141].
The methods described in this manuscript offer significant advantages, such as rapid results acquisition, minimal sample preparation, and the ability to perform non-destructive analysis [4]
In addition, DNA-based methods have gained prominence in wine authentication [25]. Wine DNA authentication involves verifying the authenticity of wines by identifying the genetic material of the grape varieties used. This process includes various techniques for extracting and analyzing DNA from wine samples to confirm the wine’s varietal composition and authenticity.
The first step is DNA extraction and sample preparation. DNA is extracted from wine debris using methods such as precipitation with polyvinylpyrrolidone and dimethyl sulfoxide (DMSO) lysis, which help reduce contamination risk [142]. However, enologists’ filtration treatments can significantly reduce DNA content, affecting traceability, as different filter materials impact DNA recovery rates [143].
After DNA extraction, the method for DNA analysis must be chosen. Microsatellite markers are used to analyze DNA from must and wine, allowing the identification of grape cultivars. This method is effective during fermentation but becomes less reliable in finished wines due to DNA degradation [144]. Single-nucleotide polymorphism (SNP) genotyping assays, such as TaqMan, are used for varietal authentication; however, DNA loss during winemaking can limit their effectiveness [145].
Alternatively, a quartz crystal microbalance (QCM) biosensor, or QCM-DNA biosensor, can detect SNPs without PCR, offering a more straightforward approach to assessing wine authenticity [146]. Both optical and QCM-DNA biosensors have been developed to detect DNA in complex matrices, such as wine, offering a label-free method for varietal identification [146,147].
Wine DNA fingerprinting can also be achieved by using Microsatellite DNA Analysis (SSR) combined with bioinformatics tools to determine the varietal composition of wines, even in blends, by comparing DNA profiles to known grape variety candidates [148].
This method is used to identify grape varieties [149]. However, it has some limitations. According to Zambianchi [150], DNA degradation over time makes it increasingly tricky to obtain reliable samples, particularly in older wines.
Techniques such as real-time PCR and next-generation sequencing (NGS) are used to identify and differentiate grape species and varieties and detect adulteration. These methods offer high specificity and sensitivity and are widely used in the food industry to ensure product authenticity [151].
Wine DNA authentication employs various techniques, including DNA extraction, microsatellite markers, SNP detection, and biosensors, to verify the authenticity of wines. These methods help to ensure the accurate identification of varietal composition and maintain the quality of wine. However, challenges such as DNA degradation during winemaking and the effects of the filtration process remain. Advances in biosensor technology and bioinformatics are increasingly enhancing the accuracy and applicability of these techniques within the wine industry.
Artificial intelligence (AI) has revolutionized wine authentication, providing new methods for analyzing and interpreting complex data. Machine-learning (ML) algorithms are trained to analyze the chemical composition of wines, enabling fraud detection with high accuracy [152]. Hategan et al. [153] study highlights experimental data obtained through 1H-NMR spectroscopy, combined with AI models, to detect unique signatures associated with different regions, grape varieties, and harvest years. Integrating AI with blockchain technology enables the secure tracking of wine origins, providing verifiable data on their provenance [154]. Moreover, AI systems can be trained to correlate sensory data, such as aroma and flavor, with databases of authentic wines, assisting winemakers in identifying inconsistencies. However, the use of several sensory analysis methods in alcoholic beverages continues to expand. To meet new assessment requirements, this method must be regularly updated and improved [155].
Therefore, AI enhances production efficiency and significantly contributes to the successful marketing and sales of wines and their byproducts [152].
In addition, digital olfactory and taste technologies, such as electronic noses (e-noses) and electronic tongues (e-tongues), are intelligent devices designed to establish models that identify complex patterns in the aromatic profiles of wines, essentially acting as fingerprints [156,157]. AI has been used to develop databases supporting wine product authentication and traceability [158]. In this context, AI and ML algorithms are emerging as powerful tools for predictive modeling, enabling the assessment of wine quality, monitoring aging processes, determining the geographical origin of wine, and detecting fraud [152,159].
The integration of spectroscopic techniques and statistical analysis with artificial intelligence has further improved the accuracy of identifying patterns and differentiating wines’ mineral profiles. Creating robust databases and advanced algorithms contributes to developing traceability systems that can provide detailed information on a wine’s origin [160].
The study by Yin et al. [161] demonstrated that the untargeted metabolomics method, based on UHPLC-QTOF-MS, is a highly effective tool for profiling secondary metabolites in four Chinese red wines: Cabernet Sauvignon, Merlot, Cabernet Gernischt, and Pinot Noir. This method identified flavonoids, phenols, indoles, and amino acids as key compounds differentiating these wine varieties. Using KEGG pathway analysis, the authors found a strong correlation between flavonoids and indoles and wine variety.
Another emerging trend in wine authentication is isotopic analysis, which utilizes the stable isotopes of a wine’s components. Isotopes are atoms of the same element that differ in mass due to variations in the number of neutrons while retaining the same number of electrons and protons. Isotopic analysis provides insights into the geographical origin and authenticity of wines by utilizing the unique isotopic signatures of elements such as strontium (Sr), lead (Pb), carbon (C), and oxygen (O), among others, to differentiate wines based on their provenance and production conditions.
According to Mac et al. [162], the most commonly studied stable isotope ratios in wine analysis include 2H/1H, 13C/12C, 15N/14N, and 18O/16O, while 34S/32S is less frequently used. According to the same authors [162], wines exhibit unique isotopic signatures influenced by viticultural practices, production methods, and geographical origin, giving wines distinctive isotopic signatures [163,164]. Similarly, Sr isotopic analysis has been successfully applied to Champagne and other sparkling wines, allowing for precise origin discrimination [165]. The strong correlation between Sr isotopic ratios in soil, grapes, and final wine products further supports their reliability for geographical traceability [164,166].
In the European Union, official methods for detecting wine fraud rely on analyzing the 13C/12C ratio of ethanol and the 18O/16O ratio of water. Carbon isotope ratio analysis can reveal the addition of external sugars, such as cane sugar, which have distinct isotopic signatures compared to the natural sugars found in grapes. Oxygen isotope analysis helps to detect the addition of water to wine by examining variations in oxygen isotopes [167].
Geană et al. [168] determined the δ13C and δ18C in authentic wines and compared them to 29 commercial wines, concluding that only 16 were genuine, while the remaining samples showed signs of alteration. Similarly, Wu et al. [169,170] applied isotopic analysis using the 13C/12C ratio of ethanol and glycerol, as well as the 18O/16O ratio of water, to evaluate 600 samples of Chinese wines and verify the origin of 240 French wine samples. Their findings confirmed that stable isotope analysis offers excellent sensitivity and accuracy. However, they also noted that precision can be compromised during sample processing and storage due to the instability of the isotopic ratios [169,170].
Integrating isotopic analysis with elemental composition measurements provides a comprehensive approach to wine authentication. This method has been successfully applied to Bordeaux wines, where isotopic ratios of hydrogen, oxygen, and carbon, along with trace element profiles, enable the differentiation of subregions and vintages [171]. Using multiple isotopic and elemental markers enhances the accuracy of origin determination and authenticity verification [172,173]. Also, according to Aiello and Tosi [152], combining isotopic analysis with DNA fingerprinting provides a robust approach to assessing a wine’s chemical composition and determining its geographical origin.
Although isotopic analysis is considered a reliable method for determining wines’ geographical origin and authenticity, several limitations can be pointed out.
The geology of the source region influences the 87Sr/86Sr isotopic composition in wine, particularly the bedrock and soil. Therefore, a careful assessment of the geochemical context is required to interpret isotopic data accurately, as variations in bedrock can significantly impact the wine’s isotopic composition [166].
While isotopic analysis can reasonably identify regional wineries, the variability within a region can be minimal, making it challenging to distinguish between wines from closely situated vineyards [163]. Moreover, according to the same authors, natural and anthropogenic factors can introduce variations in isotopic signatures, complicating the discrimination between authentic and counterfeit wines [163].
Enological practices, such as must concentration techniques, may slightly influence isotopic values. For instance, high-vacuum evaporation can alter the oxygen-18 ratio, affecting the wine’s isotopic profile [174]. The precision and accuracy of isotopic measurements depend heavily on optimized sample preparation and analytical conditions, as any deviation can compromise the reliability of the data used for wine authentication [165].
As previously mentioned, analytical techniques used for wine evaluation and authentication, such as chromatographic and spectroscopic methods, have substantial commercial applications [153]. According to Koljančić et al. [5], promising new methods are currently being explored, with digital imaging techniques standing out due to their minimal or no sample preparation requirements. As such, analytical methods that integrate digital imaging with chemometrics represent an innovative and practical approach to wine analysis.

5. Conclusions

UV–Vis spectroscopy has been effectively applied in various contexts, including the authentication of wine vinegar, the determination of polyphenolic compounds in red wines, and the geographical classification of wines. Combined with chemometric tools, this technique provides a rapid and cost-effective wine analysis and quality control method.
MIR spectroscopy has been successfully applied to various wines, including red, white, fruit, and rice. It is used for varietal classification, quality control, and predicting chemical compositions and sensory properties.
NIR spectroscopy has been effectively utilized for various wines, including wines from the Vinho Verde region and red wines, to quantify volatile and phenolic compounds, assess grape quality, classify wines based on aging processes, and measure elemental concentrations.
Spectroscopy techniques offer a powerful and efficient approach for authenticating wine and wine byproducts, particularly when combined with chemometric methods. Their ability to rapidly and accurately assess quality parameters and verify authenticity makes them invaluable tools in the wine industry.
Researchers and industry professionals can enhance data quality, improve predictive accuracy, and derive more reliable insights by employing statistical techniques in spectroscopic data analysis. From preprocessing methods that refine raw spectral data to advanced data modeling, these approaches ensure the robustness and interpretability of spectroscopy-based wine analysis.
Given wine’s socio-economic importance and byproducts, additional techniques and trends have been explored. These include DNA-based methods for identifying grape varieties, real-time PCR techniques, and stable isotope analysis for detecting fraud. However, caution is required, as isotopic analysis is limited by factors such as the need for a thorough understanding of the geochemical context, the influence of winemaking practices, and the precision of analytical methods. These limitations necessitate careful consideration and the use of complementary techniques to ensure accurate wine authentication.
AI integration with analytical and statistical techniques has facilitated the creation of robust databases for detecting fraudulent practices in marketing wines and their byproducts.

Author Contributions

Conceptualization, T.P. and A.V.; writing—original draft preparation, T.P., A.V., F.C. and E.C.; writing—review and editing, T.P., A.V., F.C. and E.C.; supervision, T.P. All authors have read and agreed to the published version of the manuscript.

Funding

This work was supported by the National Funds by FCT—Portuguese Foundation for Science and Technology, under the projects UID/04033: Centro de Investigação e de Tecnologias Agro-Ambienteis e Biológicas and LA/P/0126/2020, https://doi.org/10.54499/LA/P/0126/2020. This research was also funded by the Chemistry Research Centre-Vila Real—CQ-VR: UIDB/00616/2020 and UIDP/00616/2020, https://doi.org/10.54499/UIDP/00616/2020 and https://doi.org/10.54499/UIDB/00616/2020, and by the CEMAT/IST-ID-Center for Computational and Stochastic Mathematics: UIDB/04621/2020 and UIDP/04621/2020, https://doi.org/10.54499/UIDB/04621/2020.

Data Availability Statement

Not applicable.

Acknowledgments

The authors would like to thank the Chemistry Research Centre-Vila Real (CQVR), CITAB/Inov4Agro Center for Research and Technology in Agro-Environmental and Biological Sciences, the Institute for Innovation, Capacity Building, and Sustainability of Agri-Food Production, and CEMAT/IST-ID for their financial support.

Conflicts of Interest

The authors declare no conflicts of interest.

References

  1. Geană, E.; Ciucure, C.; Apetrei, C.; Artem, V. Application of Spectroscopic UV-Vis and FT-IR Screening Techniques Coupled with Multivariate Statistical Analysis for Red Wine Authentication: Varietal and Vintage Year Discrimination. Molecules 2019, 24, 4166. [Google Scholar] [CrossRef] [PubMed]
  2. Kamiloglu, S. Authenticity and traceability in beverages. Food Chem. 2019, 277, 12–24. [Google Scholar] [CrossRef]
  3. International Organization of Vine and Wine (OIV). OIV Statistical Report on World Vitiviniculture. Available online: https://www.oiv.int/sites/default/files/2024-04/OIV_STATE_OF_THE_WORLD_VINE_AND_WINE_SECTOR_IN_2023.pdf (accessed on 2 March 2025).
  4. Ranaweera, R.; Capone, D.; Bastian, S.; Cozzolino, D.; Jeffery, D. A Review of Wine Authentication Using Spectroscopic Approaches in Combination with Chemometrics. Molecules 2021, 26, 4334. [Google Scholar] [CrossRef]
  5. Koljančić, N.; Furdíková, K.; Araújo Gomes, A.; Spánik, I. Wine authentication: Current progress and state of the art. Trends Food Sci. Technol. 2024, 150, 104598. [Google Scholar] [CrossRef]
  6. Liveri, M.; Tsantili-Kakoulidou, A.; Tsopelas, F. Identification of white wine adulteration with apple juice and apple cider using cyclic voltammetry on a screen-printed electrode aided by chemometric analysis. J. Food Compost. Anal. 2024, 136, 106751. [Google Scholar] [CrossRef]
  7. Gallego, L.; Del Alamo, M.; Nevares, I.; Fernandez, J.A.; de Simon, B.F.; Cadahia, E. Phenolic compounds and sensorial characterization of wines aged with alternative to barrel products made of Spanish oak wood (Quercus pyrenaica Willd). Food Sci. Technol. Int. 2012, 18, 151–165. [Google Scholar] [CrossRef]
  8. Proestos, C.; Bakogiannis, A.; Psarianos, C.; Koutinas, A.A.; Kanellaki, M.; Komaitis, M. High-performance liquid chromatography analysis of phenolic substances in Greek wines. Food Control 2005, 16, 319–323. [Google Scholar] [CrossRef]
  9. Kallithraka, S.; Tsoutsouras, E.; Tzourou, E.; Lanaridis, P. Principal phenolic compounds in Greek red wines. Food Chem. 2006, 99, 784–793. [Google Scholar] [CrossRef]
  10. Amargianitaki, M.; Spyros, A. NMR-based metabolomics in wine quality control and authentication. Chem. Biol. Technol. Agric. 2017, 4, 9. [Google Scholar] [CrossRef]
  11. Cassino, C.; Tsolakis, C.; Bonello, F.; Gianotti, V.; Osella, D. Wine evolution during bottle aging, studied by 1H NMR spectroscopy and multivariate statistical analysis. Food Res. Int. 2019, 116, 566–577. [Google Scholar] [CrossRef]
  12. Philippidis, A.; Poulakis, E.; Kontzedaki, R.; Orfanakis, E.; Symianaki, A.; Zoumi, A.; Velegrakis, M. Application of Ultraviolet-Visible Absorption Spectroscopy with Machine Learning Techniques for the Classification of Cretan Wines. Foods 2021, 10, 9. [Google Scholar] [CrossRef] [PubMed]
  13. Cozzolino, D.; Smyth, H.E.; Gishen, M. Feasibility study on the use of visible and near-infrared spectroscopy together with chemometrics to discriminate between commercial white wines of different varietal origins. J. Agric. Food Chem. 2003, 51, 7703–7708. [Google Scholar] [CrossRef] [PubMed]
  14. Popîrdă, A.; Luchian, C.E.; Cotea, V.V.; Colibaba, C.; Scutarașu, E.C.; Toader, M. A review of representative methods used in wine authentication. Agriculture 2021, 11, 225. [Google Scholar] [CrossRef]
  15. Cozzolino, D.; Cynkar, W.; Shah, N.; Smith, P. Quantitative analysis of minerals and electric conductivity of red grape homogenates by near infrared reflectance spectroscopy. Comput. Electron. Agric. 2011, 77, 81–85. [Google Scholar] [CrossRef]
  16. Riovanto, R.; Cynkar, W.U.; Berzaghi, P.; Cozzolino, D. Discrimination between Shiraz wines from different Australian regions: The role of spectroscopy and chemometrics. J. Agric. Food Chem. 2011, 59, 10356–10360. [Google Scholar] [CrossRef]
  17. Ranaweera, K.R.; Gilmore, A.M.; Capone, D.L.; Bastian, S.E.P.; Jeffery, D.W. Authentication of the geographical origin of Australian Cabernet Sauvignon wines using spectrofluorometric and multi-element analyses with multivariate statistical modeling. Food Chem. 2021, 335, 127592. [Google Scholar] [CrossRef] [PubMed]
  18. Su, Y.; Zhao, Y.; Cui, K.; Wang, F.; Zhang, J.; Zhang, A. Wine characterization according to geographical origin using analysis of mineral elements and rainfall correlation of oxygen isotope values. Int. J. Food Sci. Technol. 2021, 57, 552–565. [Google Scholar] [CrossRef]
  19. Solovyev, P.; Fauhl-Hassek, C.; Riedl, J.; Esslinger, S.; Bontempo, L.; Camin, F. NMR spectroscopy in wine authentication: An official control perspective. Compr. Rev. Food Sci. Food Saf. 2021, 20, 2040–2062. [Google Scholar] [CrossRef]
  20. Ehlers, M.; Horn, B.; Raeke, J.; Fauhl-Hassek, C.; Hermann, A.; Brockmeyer, J.; Riedl, J. Towards harmonization of non-targeted 1H NMR spectroscopy-based wine authentication: Instrument comparison. Food Control 2022, 132, 8508. [Google Scholar] [CrossRef]
  21. Gilmore, A.M.; Sui, Q.; Blair, B.; Pan, B.S. Accurate varietal classification and quantification of key quality compounds of grape extracts using the absorbance-transmittance fluorescence excitation emission matrix (A-TEEM) method and machine learning. OENO One 2022, 56, 107–115. [Google Scholar] [CrossRef]
  22. Ranaweera, R.; Gilmore, A.M.; Bastian, S.E.P.; Capone, D.L.; Jeffery, D.W. Spectrofluorometric analysis to trace the molecular fingerprint of wine during the winemaking process and recognize the blending percentage of different varietal wines. OENO One 2022, 56, 189–196. [Google Scholar] [CrossRef]
  23. Grijalba, N.; Maguregui, M.; Unceta, N.; Morillas, H.; Médina, B.; Barrio, R.; Pécheyran, C. Direct non-invasive molecular analysis of packaging label to assist wine-bottle authentication. Microchem. J. 2020, 154, 104564. [Google Scholar] [CrossRef]
  24. Ríos-Reina, R.; Azcarate, S.; Camiña, J.; Callejón, R.; Amigo, J. Application of hierarchical classification models and reliability estimation by bootstrapping, for authentication and discrimination of wine vinegars by UV–vis spectroscopy. Chemom. Intell. Lab. Syst. 2019, 191, 42–53. [Google Scholar] [CrossRef]
  25. González-Domínguez, R. Food Authentication: Techniques, Trends and Emerging Approaches (Second Issue). Foods 2022, 11, 1926. [Google Scholar] [CrossRef]
  26. Chen, Z.; Deutsch, T.; Dinh, H.; Domen, K.; Emery, K.; Forman, A.; Gaillard, N.; Garland, R.; Heske, C.; Jaramillo, T.; et al. UV-Vis Spectroscopy. In Photoelectrochemical Water Splitting. SpringerBriefs in Energy; Springer: New York, NY, USA, 2013; pp. 49–62. [Google Scholar] [CrossRef]
  27. Akash, M.S.H.; Rehman, K. Ultraviolet-Visible (UV-VIS) Spectroscopy. In Essentials of Pharmaceutical Analysis; Springer: Singapore, 2020; pp. 29–56. [Google Scholar] [CrossRef]
  28. Mäntele, W.; Deniz, E. UV-VIS absorption spectroscopy: Lambert-Beer reloaded. Spectrochim. Acta Part A Mol. Biomol. Spectrosc. 2017, 173, 965–968. [Google Scholar] [CrossRef]
  29. Casale, M.; Oliveri, P.; Armanino, C.; Lanteri, S.; Forina, M. NIR and UV-vis spectroscopy, artificial nose and tongue: Comparison of four fingerprinting techniques for the characterisation of Italian red wines. Anal. Chim. Acta 2010, 668, 143–148. [Google Scholar] [CrossRef]
  30. Ríos-Reina, R.; Caballero, D.; Azcarate, S.; García-González, D.; Callejón, R.; Amigo, J. VinegarScan: A Computer Tool Based on Ultraviolet Spectroscopy for A Rapid Authentication of Wine Vinegars. Chemosensors 2021, 9, 296. [Google Scholar] [CrossRef]
  31. Aleixandré-Tudo, J.; Nieuwoudt, H.; Aleixandre, J.; Du Toit, W. Chemometric compositional analysis of phenolic compounds in fermenting samples and wines using different infrared spectroscopy techniques. Talanta 2018, 176, 526–536. [Google Scholar] [CrossRef]
  32. Miramont, C.; Jourdes, M.; Teissèdre, P. Development of UV-vis and FTIR Partial Least Squares models: Comparison and combination of two spectroscopy techniques with chemometrics for polyphenols quantification in red wine. OENO One 2020, 54, 779–792. [Google Scholar] [CrossRef]
  33. Martelo-Vidal, M.; Vázquez, M. Determination of polyphenolic compounds of red wines by UV-VIS-NIR spectroscopy and chemometrics tools. Food Chem. 2014, 158, 28–34. [Google Scholar] [CrossRef]
  34. Chapman, J.; Gangadoo, S.; Truong, V.; Cozzolino, D. Spectroscopic approaches for rapid beer and wine analysis. Curr. Opin. Food Sci. 2019, 28, 67–73. [Google Scholar] [CrossRef]
  35. Yu, J.; Wang, H.; Zhan, J.; Huang, W. Review of recent UV–Vis and infrared spectroscopy researches on wine detection and discrimination. Appl. Spectrosc. Rev. 2018, 53, 65–86. [Google Scholar] [CrossRef]
  36. Scano, P. Characterization of the medium infrared spectra of polyphenols of red and white wines by integrating FT IR and UV–Vis spectral data. LWT 2021, 89, 108–116. [Google Scholar] [CrossRef]
  37. Wu, Z.; Li, H.; Long, J.; Xu, E.; Xu, X.; Jin, Z.; Jiao, A. Discrimination of Chinese rice wines of different geographical origins by UV–vis spectroscopy and chemometrics. J. Inst. Brew. 2015, 121, 167–174. [Google Scholar] [CrossRef]
  38. Edelmann, A.; Diewok, J.; Schuster, C.; Lendl, B. Rapid method for the discrimination of red wine cultivars based on mid-infrared spectroscopy of phenolic wine extracts. J. Agric. Food Chem. 2001, 49, 1139–1145. [Google Scholar] [CrossRef] [PubMed]
  39. Tan, J.; Li, R.; Jiang, Z.; Zhang, Y.; Hou, Y.; Wang, Y.; Wu, X.; Gong, L. Geographical classification of Chinese Cabernet Sauvignon wines by data fusion of ultraviolet-visible and synchronous fluorescence spectroscopies: The combined use of multiple wavelength differences. Aust. J. Grape Wine Res. 2016, 22, 358–365. [Google Scholar] [CrossRef]
  40. Theophile, T. Introduction to infrared spectroscopy. In Infrared Spectroscopy; Theophile, T., Ed.; IntechOpen: Rijeka, Croatia, 2012. [Google Scholar] [CrossRef]
  41. López-Lorente, Á.; Mizaikoff, B. Mid-infrared spectroscopy for protein analysis: Potential and challenges. Anal. Bioanal. Chem. 2016, 408, 2875–2889. [Google Scholar] [CrossRef] [PubMed]
  42. Tidemand-Lichtenberg, P.; Dam, J.; Andersen, H.; Høgstedt, L.; Pedersen, C. Mid-infrared upconversion spectroscopy. J. Opt. Soc. Am. B-Opt. Phys. 2016, 33, D28–D35. [Google Scholar] [CrossRef]
  43. Cai, Y.; Chen, Y.; Dorfman, K.; Xin, X.; Wang, X.; Huang, K.; Wu, E. Mid-infrared single-photon upconversion spectroscopy enabled by nonlocal wavelength-to-time mapping. Sci. Adv. 2024, 10, eadl3503. [Google Scholar] [CrossRef]
  44. Liu, M.; Gray, R.; Costa, L.; Markus, C.; Roy, A.; Marandi, A. Mid-infrared cross-comb spectroscopy. Nat. Commun. 2021, 14, 1044. [Google Scholar] [CrossRef]
  45. Lou, H.; Deng, Z.; Luo, D.; Pan, J.; Zhou, L.; Xie, G.; Gu, C.; Li, W. High-SNR mid-infrared dual-comb spectroscopy using active phase control cooperating with CWs-dependent phase correction. Opt. Express 2024, 32, 5826–5836. [Google Scholar] [CrossRef] [PubMed]
  46. Yuan, Z.; Fan, X.; Xu, B.; Zhu, Y.; He, Z. Digitally generated high-resolution mid-infrared dual-comb spectroscopy system based on electro-optic modulation. Opt. Lett. 2024, 49, 5711–5714. [Google Scholar] [CrossRef]
  47. Bevin, C.; Dambergs, R.; Fergusson, A.; Cozzolino, D. Varietal discrimination of Australian wines by means of mid-infrared spectroscopy and multivariate analysis. Anal. Chim. Acta 2008, 621, 19–23. [Google Scholar] [CrossRef]
  48. Santos, C.; Páscoa, R.; Porto, P.; Cerdeira, A.; González-Sáiz, J.; Pizarro, C.; Lopes, J. Raman spectroscopy for wine analyses: A comparison with near and mid-infrared spectroscopy. Talanta 2018, 186, 306–314. [Google Scholar] [CrossRef]
  49. Petric, I.; Duralija, B.; Leder, R. Analytical Techniques for the Authenticity Evaluation of Chokeberry, Blackberry and Raspberry Fruit Wines: Exploring FT-MIR Analysis and Chemometrics. Horticulturae 2024, 10, 1043. [Google Scholar] [CrossRef]
  50. Sen, I.; Ozturk, B.; Tokatli, F.; Ozen, B. Combination of visible and mid-infrared spectra for the prediction of chemical parameters of wines. Talanta 2016, 161, 130–137. [Google Scholar] [CrossRef] [PubMed]
  51. Niimi, J.; Liland, K.; Tomic, O.; Jeffery, D.; Bastian, S.; Boss, P. Prediction of wine sensory properties using mid-infrared spectra of Cabernet Sauvignon and Chardonnay grape berries and wines. Food Chem. 2021, 344, 128634. [Google Scholar] [CrossRef]
  52. Shen, F.; Ying, Y.; Li, B.; Zheng, Y.; Hu, J. Prediction of sugars and acids in Chinese rice wine by mid-infrared spectroscopy. Food Res. Int. 2011, 44, 1521–1527. [Google Scholar] [CrossRef]
  53. Croce, R.; Malegori, C.; Oliveri, P.; Medici, I.; Cavaglioni, A.; Rossi, C. Prediction of quality parameters in straw wine by means of FT-IR spectroscopy combined with multivariate data processing. Food Chem. 2020, 305, 125512. [Google Scholar] [CrossRef]
  54. Patz, C.; Blieke, A.; Ristow, R.; Dietrich, H. Application of FT-MIR spectrometry in wine analysis. Anal. Chim. Acta 2004, 513, 81–89. [Google Scholar] [CrossRef]
  55. Ozturk, B.; Yucesoy, D.; Ozen, B. Application of Mid-infrared Spectroscopy for the Measurement of Several Quality Parameters of Alcoholic Beverages, Wine and Raki. Food Anal. Methods 2012, 5, 1435–1442. [Google Scholar] [CrossRef]
  56. Santos, C.; Páscoa, R.; Sarraguça, M.; Porto, P.; Cerdeira, A.; González-Sáiz, J.; Pizarro, C.; Lopes, J. Merging vibrational spectroscopic data for wine classification according to the geographic origin. Food Res. Int. 2017, 102, 504–510. [Google Scholar] [CrossRef]
  57. Parpinello, G.; Ricci, A.; Arapitsas, P.; Curioni, A.; Moio, L.; Riosegade, S.; Ugliano, M.; Versari, A. Multivariate characterisation of Italian monovarietal red wines using MIR spectroscopy. OENO One 2019, 53. [Google Scholar] [CrossRef]
  58. Jin, X.; Wu, S.; Yu, W.; Xu, X.; Huang, M.; Tang, Y.; Yang, Z. Wine Authentication Using Integration Assay of MIR, NIR, E-tongue, HS-SPME-GC-MS, and Multivariate Analyses: A Case Study for a Typical Cabernet Sauvignon Wine. J. AOAC Int. 2019, 102, 1174–1180. [Google Scholar] [CrossRef] [PubMed]
  59. Workman, J. Interpretive Spectroscopy for Near Infrared. Appl. Spectrosc. Rev. 1996, 31, 251–320. [Google Scholar] [CrossRef]
  60. Beć, K.; Grabska, J.; Huck, C. Near-Infrared Spectroscopy in Bio-Applications. Molecules 2020, 25, 2948. [Google Scholar] [CrossRef] [PubMed]
  61. Bai, X.; Zhang, L.; Kang, C.; Quan, B. Near-infrared spectroscopy and machine learning-based technique to predict quality-related parameters in instant tea. Sci. Rep. 2022, 12, 3833. [Google Scholar] [CrossRef] [PubMed]
  62. Reich, G. Near-infrared spectroscopy and imaging: Basic principles and pharmaceutical applications. Adv. Drug Deliv. Rev. 2005, 57, 1109–1143. [Google Scholar] [CrossRef]
  63. Hu, L.; Yin, C.; Ma, S.; Liu, Z. Rapid detection of three quality parameters and classification of wine based on Vis-NIR spectroscopy with wavelength selection by ACO and CARS algorithms. Spectrochim. Acta Part A Mol. Biomol. Spectrosc. 2018, 205, 574–581. [Google Scholar] [CrossRef]
  64. Ríos-Reina, R.; García-González, D.; Callejón, R.; Amigo, J. NIR spectroscopy and chemometrics for the typification of Spanish wine vinegars with a protected designation of origin. Food Control 2018, 89, 108–116. [Google Scholar] [CrossRef]
  65. Genisheva, Z.; Quintelas, C.; Mesquita, D.; Ferreira, E.; Oliveira, J.; Amaral, A.; Amaral, A. New PLS analysis approach to wine volatile compounds characterization by near-infrared spectroscopy (NIR). Food Chem. 2018, 246, 172–178. [Google Scholar] [CrossRef] [PubMed]
  66. Cozzolino, D.; Kwiatkowski, M.; Parker, M.; Cynkar, W.; Dambergs, R.; Gishen, M.; Herderich, M. Prediction of phenolic compounds in red wine fermentations by visible and near-infrared spectroscopy. Anal. Chim. Acta 2004, 513, 73–80. [Google Scholar] [CrossRef]
  67. Rouxinol, M.; Martins, M.; Murta, G.; Barroso, J.M.; Rato, A. Quality Assessment of Red Wine Grapes through NIR Spectroscopy. Agronomy 2022, 12, 637. [Google Scholar] [CrossRef]
  68. Nardi, T.; Petrozziello, M.; Girotto, R.; Fugaro, M.; Mazzei, R.; Scuppa, S. Wine aging authentication through Near Infrared Spectroscopy: A feasibility study on chips and barrel-aged wines. OENO One 2020, 54, 165–173. [Google Scholar] [CrossRef]
  69. Cozzolino, D.; Kwiatkowski, M.; Kwiatkowski, M.; Dambergs, R.; Dambergs, R.; Cynkar, W.; Cynkar, W.; Janik, L.; Janik, L.; Skouroumounis, G.; et al. Analysis of elements in wine using near-infrared spectroscopy and partial least squares regression. Talanta 2008, 74, 711–716. [Google Scholar] [CrossRef]
  70. Fan, K.-J.; Su, W.-H. Applications of Fluorescence Spectroscopy, RGB- and MultiSpectral Imaging for Quality Determinations of White Meat: A Review. Biosensors 2022, 12, 76. [Google Scholar] [CrossRef]
  71. Danezis, G.P.; Tsagkaris, A.S.; Brusic, V.; Georgiou, C.A. Food authentication: State of the art and prospects. Curr. Opin. Food Sci. 2016, 10, 22–31. [Google Scholar] [CrossRef]
  72. Danezis, G.P.; Tsagkaris, A.S.; Camin, F.; Brusic, V.; Georgiou, C.A. Food authentication: Techniques, trends & emerging approaches. TrAC Trends Anal. Chem. 2016, 85, 123–132. [Google Scholar] [CrossRef]
  73. Radotić, K.; Melø, T.B.; Lindgren, M. A fluorescence spectroscopic study of light transmission and adaxial-abaxial distribution of emitting compounds in leaves of Christmas star (Euphorbia pulcherrima). Spectrochim. Acta Part A Mol. Biomol. Spectrosc. 2023, 303, 123269. [Google Scholar] [CrossRef]
  74. Callao, M.P.; Ruisánchez, I. An overview of multivariate qualitative methods for food fraud detection. Food Control 2018, 86, 283–293. [Google Scholar] [CrossRef]
  75. Wu, M.; Li, M.; Fan, B.; Sun, Y.; Shen, Q. A Rapid and Low-Cost Method for Detection of Nine Kinds of Vegetable Oil Adulteration Based on 3-D Fluorescence Spectroscopy. LWT 2023, 188, 115419. [Google Scholar] [CrossRef]
  76. Sikorska, E.; Khmelinskii, I.; Sikorski, M. Fluorescence spectroscopy and imaging instruments for food quality evaluation. In Evaluation Technologies for Food Quality; Woodhead Publishing: Sawston, UK, 2019; pp. 491–533. [Google Scholar] [CrossRef]
  77. Kumar, K.; Tarai, M.; Mishra, A.K. Unconventional steady-state fluorescence spectroscopy as an analytical technique for analyses of complex-multifluorophoric mixtures. TrAC Trends Anal. Chem. 2017, 97, 216–243. [Google Scholar] [CrossRef]
  78. Hu, L.; Zhang, Y.; Ju, Y.; Meng, X.; Yin, C. Rapid Identification of Rice Geographical Origin and Adulteration by Excitation-Emission Matrix Fluorescence Spectroscopy Combined with Chemometrics Based on Fluorescence Probe. Food Control 2023, 146, 109547. [Google Scholar] [CrossRef]
  79. Airado-Rodríguez, D.; Durán-Merás, I.; Galeano-Díaz, T.; Wold, J.P. Front-face fluorescence spectroscopy: A new tool for control in the wine industry. J. Food Compos. Anal. 2011, 24, 257–264. [Google Scholar] [CrossRef]
  80. Dufour, É.; Letort, A.; Laguet, A.; Lebecque, A.; Serra, J.N. Investigation of variety, typicality and vintage of French and German wines using front-face fluorescence spectroscopy. Anal. Chim. Acta 2006, 563, 292–299. [Google Scholar] [CrossRef]
  81. Mattivi, F.; Monetti, A.; Vrhovsek, U.; Tonon, D.; Andrés-Lacueva, C. High-performance liquid chromatographic determination of the riboflavin concentration in white wines for predicting their resistance to light. J. Chromatogr. A 2000, 888, 121–127. [Google Scholar] [CrossRef] [PubMed]
  82. Hoenicke, K.; Simat, T.J.; Steinhart, H.; Köhler, H.J.; Schwab, A. Determination of free and conjugated indole-3-acetic acid, tryptophan and tryptophan metabolites in grape must and wine. J. Agric. Food Chem. 2001, 49, 5494–5501. [Google Scholar] [CrossRef]
  83. Le Moigne, M.; Dufour, E.; Bertrand, D.; Maury, C.; Seraphin, D.; Jourjon, F. Front face fluorescence spectroscopy and visible spectroscopy coupled with chemometrics have the potential to characterise ripening of Cabernet Franc grapes. Anal. Chim. Acta 2008, 621, 8–18. [Google Scholar] [CrossRef]
  84. Žiak, Ľ.; Sádecká, J.; Májek, P.; Hroboňová, K. Simultaneous determination of phenolic acids and scopoletin in brandies using synchronous fluorescence spectrometry coupled with partial least squares. Food Anal. Methods 2014, 7, 563–570. [Google Scholar] [CrossRef]
  85. Sádecká, J.; Jakubíková, M. Varietal classification of white wines by fluorescence spectroscopy. J. Food Sci. Technol. 2020, 57, 2545–2553. [Google Scholar] [CrossRef]
  86. Suciu, R.C.; Zarbo, L.; Guyon, F.; Magdas, D.A. Application of fluorescence spectroscopy using classical right angle technique in white wines classification. Sci. Rep. 2019, 9, 18250. [Google Scholar] [CrossRef] [PubMed]
  87. Eltemur, D.; Robatscher, P.; Oberhuber, M.; Scampicchio, M.; Ceccon, A. Applications of Solution NMR Spectroscopy in Quality Assessment and Authentication of Bovine Milk. Foods 2023, 12, 3240. [Google Scholar] [CrossRef] [PubMed]
  88. Pacholczyk-Sienicka, B.; Ciepielowski, G.; Albrecht, Ł. The Application of NMR Spectroscopy and Chemometrics in Authentication of Spices. In Analysis of Food Spices; CRC Press: Boca Raton, FL, USA, 2023. [Google Scholar] [CrossRef]
  89. Rossmann, A. Determination of stable isotope ratios in food analysis. Food Rev. Int. 2001, 17, 347–381. [Google Scholar] [CrossRef]
  90. Liu, Y.; Gao, L.; Yu, Z. Quantitative 31P NMR Spectroscopy: Principles, Methodologies, and Applications in Phosphorus-Containing Compound Analysis. Appl. Sci. 2025, 15, 323. [Google Scholar] [CrossRef]
  91. Gougeon, L.; Da Costa, G.; Le Mao, I.; Ma, W.; Teissedre, P.-L.; Guyon, F.; Richard, T. Wine analysis and authenticity using 1H-NMR metabolomics data: Application to Chinese wines. Food Anal. Methods 2018, 11, 3425–3434. [Google Scholar] [CrossRef]
  92. Godelmann, R.; Kost, C.; Patz, C.-D.; Ristow, R.; Wachter, H. Quantitation of compounds in wine using 1H NMR spectroscopy: Description of the method and collaborative study. J. AOAC Int. 2016, 99, 1295–1304. [Google Scholar] [CrossRef] [PubMed]
  93. Ali, K.; Maltese, F.; Fortes, A.M.; Pais, M.S.; Choi, Y.H.; Verpoorte, R. Monitoring biochemical changes during grape berry development in Portuguese cultivars by NMR spectroscopy. Food Chem. 2011, 124, 1760–1769. [Google Scholar] [CrossRef]
  94. Pereira, G.E.; Gaudillere, J.-P.; Van Leeuwen, C.; Hilbert, G.; Lavialle, O.; Maucourt, M.; Deborde, C.; Moing, A.; Rolin, D. 1H NMR and Chemometrics to Characterize Mature Grape Berries in Four Wine-Growing Areas in Bordeaux, France. J. Agric. Food Chem. 2005, 53, 6382–6389. [Google Scholar] [CrossRef]
  95. Mazzei, P.; Celano, G.; Palese, A.M.; Lardo, E.; Drosos, M.; Piccolo, A. HRMAS-NMR metabolomics of Aglianicone grapes pulp to evaluate terroir and vintage effects, and, as assessed by the Electromagnetic Induction (EMI) technique, spatial variability of vineyard soils. Food Chem. 2019, 283, 215–223. [Google Scholar] [CrossRef]
  96. Picone, G.; Trimigno, A.; Tessarin, P.; Donnini, S.; Rombolà, A.D.; Capozzi, F. 1H NMR foodomics reveals that the biodynamic and the organic cultivation managements produce different grape berries (Vitis vinifera L. cv. Sangiovese). Food Chem. 2016, 213, 187–195. [Google Scholar] [CrossRef]
  97. Hu, B.; Yue, Y.; Zhu, Y.; Wen, W.; Zhang, F.; Hardie, J.W. Proton Nuclear Magnetic Resonance-Spectroscopic Discrimination of Wines Reflects Genetic Homology of Several Different Grape (V. vinifera L.) Cultivars. PLoS ONE 2015, 10, e0142840. [Google Scholar] [CrossRef]
  98. Valls Fonayet, J.; Loupit, G.; Richard, T. MS- and NMR-metabolomic tools for the discrimination of wines: Applications for authenticity. Adv. Bot. Res. 2021, 98, 297–357. [Google Scholar] [CrossRef]
  99. Monakhova, Y.B.; Godelmann, R.; Hermann, A.; Kuballa, T.; Cannet, C.; Schäfer, H.; Spraul, M.; Rutledge, D.N. Synergistic effect of the simultaneous chemometric analysis of 1H NMR spectroscopic and stable isotope (SNIF-NMR, 18O, 13C) data: Application to wine analysis. Anal. Chim. Acta 2014, 833, 29–39. [Google Scholar] [CrossRef] [PubMed]
  100. Fan, S.; Zhong, Q.; Fauhl-Hassek, C.; Pfister, M.K.H.; Horn, B.; Huang, Z. Classification of Chinese wine varieties using 1H NMR spectroscopy combined with multivariate statistical analysis. Food Control 2017, 88, 113–122. [Google Scholar] [CrossRef]
  101. Anastasiadi, M.; Zira, A.; Magiatis, P.; Haroutounian, S.A.; Skaltsounis, A.L.; Mikros, E. 1H NMR-based metabonomics for the classification of Greek wines according to variety, region, and vintage. Comparison with HPLC data. J. Agric. Food Chem. 2009, 57, 11067–11074. [Google Scholar] [CrossRef]
  102. Coco, L.; Pascali, S.; Fanizzi, F. NMR-Metabolomic Study on Monocultivar and Blend Salento EVOOs including Some from Secular Olive Trees. Food Sci. Nutr. 2014, 5, 89–95. [Google Scholar] [CrossRef]
  103. Godelmann, R.; Fang, F.; Humpfer, E.; Schütz, B.; Bansbach, M.; Schäfer, H.; Spraul, M. Targeted and nontargeted wine analysis by 1H NMR spectroscopy combined with multivariate statistical analysis. Differentiation of important parameters: Grape variety, geographical origin, year of vintage. J. Agric. Food Chem. 2013, 61, 5610–5619. [Google Scholar] [CrossRef]
  104. Le Mao, I.; Da Costa, G.; Richard, T. 1H-NMR metabolomics for wine screening and analysis. OENO One 2023, 57, 15–31. [Google Scholar] [CrossRef]
  105. Parachalil, D.R.; McIntyre, J.; Byrne, H.J. Potential of Raman spectroscopy for the analysis of plasma/serum in the liquid state: Recent advances. Analy Bioanal. Chem. 2020, 412, 1993–2007. [Google Scholar] [CrossRef]
  106. Magdas, D.A.; Guyon, F.; Feher, I.; Pinzaru, S.C. Wine discrimination based on chemometric analysis of untargeted markers using FT-Raman spectroscopy. Food Control 2018, 85, 385–391. [Google Scholar] [CrossRef]
  107. Magdas, D.A.; Cozar, B.I.; Feher, I.; Guyon, F.; Dehelean, A.; Cinta, P.S. Testing the limits of FT-Raman spectroscopy for wine authentication: Cultivar, geographical origin, vintage and terroir effect influence. Sci. Rep. 2019, 9, 19954. [Google Scholar] [CrossRef] [PubMed]
  108. Dos Santos, R.C.A.T.; Páscoa, N.M.J.; Porto, P.A.L.S.; Cerdeira, A.L.; González-Sáiz, J.M.; Pizarro, C.; Lopes, J.A. Raman spectroscopy for wine analyses: A comparison with near and mid infrared spectroscopy. Talanta 2018, 186, 306–314. [Google Scholar] [CrossRef] [PubMed]
  109. ValiZade, S.; Forooghi, E.; Jannat, B.; Hashempour-baltork, F.; Abdollahi, H. A combined classification modeling strategy for detection and identification of extra virgin olive oil adulteration using Raman spectroscopy Chemometr. Intell. Lab. Syst. 2023, 240, 104903. [Google Scholar] [CrossRef]
  110. Papaspyridakou, P.; Giannoutsou, P.; Orkoula, M.G. Non-Destructive and Non-Invasive Measurement of Ethanol and Toxic Alcohol Strengths in Beverages and Spirits Using Portable Raman Spectroscopy. Biosensors 2023, 13, 135. [Google Scholar] [CrossRef] [PubMed]
  111. Puncochova, K.; Vukosavljevic, B.; Hanus, J.; Beranek, J.; Windbergs, M.; Stepanek, F. Non-invasive insight into the release mechanisms of a poorly soluble drug from amorphous solid dispersions by confocal Raman microscopy. Eur. J. Pharm. Biopharm. 2016, 101, 119–125. [Google Scholar] [CrossRef]
  112. Westley, C.; Fisk, H.; Xu, Y.; Hollywood, K.A.; Carnell, A.J.; Micklefield, J.; Turner, N.J.; Goodacre, R. Real-time monitoring of enzyme-catalysed reactions using deep UV resonance Raman spectroscopy. Chem. Eur. J. 2017, 23, 6983–6987. [Google Scholar] [CrossRef]
  113. Jiang, Y.; Sun, D.-W.; Pu, H.; Wei, Q. Surface-enhanced Raman spectroscopy (SERS): A novel reliable technique for rapid detection of common harmful chemical residues. Trends Food Sci. Technol. 2018, 75, 10–22. [Google Scholar] [CrossRef]
  114. Neng, J.; Wang, J.; Wang, Y.; Zhang, Y.; Chen, P. Trace Analysis of Food by Surface-Enhanced Raman Spectroscopy Combined with Molecular Imprinting Technology: Principle, Application, Challenges, and Prospects. Food Chem. 2023, 429, 136883. [Google Scholar] [CrossRef]
  115. Schulz, H.; Baranska, M. Identification and quantification of valuable plant substances by IR and Raman spectroscopy Vibrational. Spectroscopy 2007, 43, 13–25. [Google Scholar] [CrossRef]
  116. Yang, H.; Irudayaraj, J.; Paradkar, M.M. Discriminant analysis of edible oils fats by FTIR, FT-NIR and FT Raman spectroscopy. Food Chem. 2005, 93, 25–32. [Google Scholar] [CrossRef]
  117. Ojeda-Galván, H.J.; Hernández-Arteaga, A.C.; Rodríguez-Aranda, M.C.; Toro-Vazquez, J.F.; Cruz-González, N.; Ortíz-Chávez, S.; Comas-García, M.; Rodríguez, A.G.; Navarro-Contreras, H.R. Application of Raman spectroscopy for the determination of proteins denaturation and amino acids decomposition temperature. Spectrochim. Acta A Mol. Biomol. Spectrosc. 2023, 285, 121941. [Google Scholar] [CrossRef] [PubMed]
  118. Mathlouthi, M.; Koenig, J.L. Vibrational spectra of carbohydrates. Adv. Carbohydr. Chem. Biochem. 1986, 44, 7–89. [Google Scholar] [CrossRef]
  119. Esteki, M.; Shahsavari, Z.; Simal-Gandara, J. Use of spectroscopic methods in combination with linear discriminant analysis for authentication of food products. Food Control 2018, 91, 100–112. [Google Scholar] [CrossRef]
  120. Mandrile, L.; Zeppa, G.; Giovannozzi, A.M.; Rossi, A.M. Controlling protected designation of origin of wine by Raman. Food Chem. 2016, 211, 260–307. [Google Scholar] [CrossRef]
  121. Martin, C.; Bruneel, J.-L.; Castet, F.; Fritsch, A.; Teissedre, P.-R.; Jourdes, M.; Guillaume, F. Spectroscopic and theoretical investigations of phenolic acids in white wines. Food Chem. 2017, 221, 568–575. [Google Scholar] [CrossRef]
  122. Gautam, R.; Vanga, S.; Madan, A.; Gayathri, N.; Nongthomba, U.; Umapathy, S. Raman spectroscopic studies on screening of myopathies. Anal Chem. 2015, 87, 2187–2194. [Google Scholar] [CrossRef] [PubMed]
  123. Acquarelli, J.; Van Laarhoven, T.; Gerretzen, J.; Tran, T.; Buydens, L.; Marchiori, E. Convolutional neural networks for vibrational spectroscopic data analysis. Anal. Chim. Acta 2017, 954, 22–31. [Google Scholar] [CrossRef]
  124. Stavrakakis, G.; Philippidis, A.; Velegrakis, M. Application of Optical Spectroscopic Techniques and Multivariate Statistical Analysis as a Method of Determining the Percentage and Type of Adulteration of Extra Virgin Olive Oil. Food Anal. Methods 2022, 15, 285–293. [Google Scholar] [CrossRef]
  125. Ranaweera, K.R.; Gilmore, A.M.; Capone, D.L.; Bastian, S.E.P.; Jeffery, D.W. Spectrofluorometric analysis combined with machine learning for geographical and varietal authentication, and prediction of phenolic compound concentrations in red wine. Food Chem. 2021, 361, 130–149. [Google Scholar] [CrossRef]
  126. De Jong, T.; Kok, D.; Torren, A.; Schopmans, H.; Tromp, R.; Molen, S.; Jobst, J. Quantitative analysis of spectroscopic low energy electron microscopy data: High-dynamic-range imaging, drift correction, and cluster analysis. Ultramicroscopy 2019, 213, 112913. [Google Scholar] [CrossRef]
  127. Shah, D.; Wang, J.; He, Q. A feature-based soft sensor for spectroscopic data analysis. J. Process Control. 2019, 78, 98–107. [Google Scholar] [CrossRef]
  128. Cozzolino, D.; Holdstock, M.; Dambergs, R.; Cynkar, W.; Smith, P. Mid-infrared spectroscopy and multivariate analysis: A tool to discriminate between organic and non-organic wines grown in Australia. Food Chem. 2009, 116, 761–765. [Google Scholar] [CrossRef]
  129. Radulescu, C.; Olteanu, R.L.; Nicolescu, C.M.; Bumbac, M.; Buruleanu, L.C.; Holban, G.C. Vibrational Spectroscopy Combined with Chemometrics as Tool for Discriminating Organic vs. Conventional Culture Systems for Red Grape Extracts. Foods 2021, 10, 1856. [Google Scholar] [CrossRef]
  130. Hair, J.F.; Black, W.C.; Babin, B.J.; Anderson, R.E. Multivariate Data Analysis, 7th ed.; Pearson: New York, NY, USA, 2010. [Google Scholar]
  131. Marôco, J. Análise Estatística com o SPSS Statistics, 7th ed.; Report Number: Pêro Pinheiro, Portugal, 2018. [Google Scholar]
  132. Nardecchia, A.; Vitale, R.; Duponchel, L. Fusing spectral and spatial information with 2-D stationary wavelet transform (SWT 2-D) for a deeper exploration of spectroscopic images. Talanta 2020, 224, 121835. [Google Scholar] [CrossRef] [PubMed]
  133. Nieuwoudt, H.H.; Prior, B.A.; Pretorius, I.S.; Marena, M.; Bauer, F.F. Principal Component Analysis Applied to Fourier Transform Infrared Spectroscopy for the Design of Calibration Sets for Glycerol Prediction Models in Wine and for the Detection and Classification of Outlier Samples. J. Agric. Food Chem. 2004, 52, 12. [Google Scholar] [CrossRef] [PubMed]
  134. Rao, C.R.; Toutenburg, H.; Shalabh, H.C. Linear Models and Generalizations: Least Squares and Alternatives, 3rd ed.; Springer: Berlin/Heidelberg, Germany, 2007. [Google Scholar]
  135. Zhang, L.; Henson, M.; Sekulic, S. Multivariate data analysis for Raman imaging of a model pharmaceutical tablet. Anal. Chim. Acta 2005, 545, 262–278. [Google Scholar] [CrossRef]
  136. Gareth, J.; Witten, D.; Hastie, T.; Tibshirani, R. An Introduction to Statistical Learning with Applications in R; Springer: New York, NY, USA, 2021. [Google Scholar]
  137. Murru, C.; Chimeno-Trinchet, C.; Díaz-García, M.; Badía-Laíño, R.; Fernández-González, A. Artificial Neural Network and Attenuated Total Reflectance-Fourier Transform Infrared Spectroscopy to identify the chemical variables related to ripeness and variety classification of grapes for Protected. Designation of Origin wine production. Comput. Electron. Agric. 2019, 164, 104922. [Google Scholar] [CrossRef]
  138. Martelo-Vidal, M.; Vázquez, M. Application of artificial neural networks coupled to UV–VIS–NIR spectroscopy for the rapid quantification of wine compounds in aqueous mixtures. CyTA—J. Food. 2014, 3, 32–39. [Google Scholar] [CrossRef]
  139. Mingione, E.; Leone, C.; Almonti, D.; Menna, E.; Baiocco, G.; Ucciardello, N. Artificial neural networks application for analysis and control of grapes fermentation process. Procedia CIRP 2022, 112, 22–27. [Google Scholar] [CrossRef]
  140. Boido, E.; Fariña, L.; Carrau, F.; Cozzolino, D.; Dellacassa, E. Application of near-infrared spectroscopy/artificial neural network to quantify glycosylated norisoprenoids in Tannat grapes. Food Chem. 2022, 387, 132927. [Google Scholar] [CrossRef]
  141. Ríos-Reina, R.; Segura-Borrego, M.P.; Camiña, J.M.; Callejón, R.M.; Azcarate, S.M. Multiplatform spectral print strategies for the authentication of Spanish PDO fortified wines using AHIMBU, an automatic hierarchical classification tool. Chemom. Intell. Lab. Syst. 2025, 257, 105311. [Google Scholar] [CrossRef]
  142. Galstyan, A.; Semipyatniy, V.; Mikhailova, I.; Gilmanov, K.; Bigaeva, A.; Vafin, R. Methodological Approaches to DNA Authentication of Foods, Wines and Raw Materials for Their Production. Foods 2021, 10, 595. [Google Scholar] [CrossRef]
  143. Song, J.; De Paolis, C.; Boccacci, P.; Ferrero, L.; Moine, A.; Segade, R.; Giacosa, S.; Gambino, G.; Rolle, L.; Paissoni, M. Influence of filtration treatments on grapevine DNA traceability in wine. Food Biosci. 2023, 57, 103533. [Google Scholar] [CrossRef]
  144. García-Beneytez, E.; Moreno-Arribas, M.; Borrego, J.; Polo, M.; Ibáñez, J. Application of a DNA analysis method for the cultivar identification of grape musts and experimental and commercial wines of Vitis vinifera L. using microsatellite markers. J. Agric. Food Chem. 2002, 50, 6090–6096. [Google Scholar] [CrossRef] [PubMed]
  145. Catalano, V.; Moreno-Sanz, P.; Lorenzi, S.; Grando, M. Experimental Review of DNA-Based Methods for Wine Traceability and Development of a Single-Nucleotide Polymorphism (SNP) Genotyping Assay for Quantitative Varietal Authentication. J. Agric. Food Chem. 2016, 64, 6969–6984. [Google Scholar] [CrossRef]
  146. Barrias, S.; Fernandes, J.; Martins-Lopes, P. Newly developed QCM-DNA biosensor for SNP detection in small DNA fragments: A wine authenticity case study. Food Control 2025, 169, 111036. [Google Scholar] [CrossRef]
  147. Barrias, S.; Fernandes, J.; Eiras-Dias, J.; Brazão, J.; Martins-Lopes, P. Label-free DNA-based optical biosensor as a potential system for wine authenticity. Food Chem. 2019, 270, 299–304. [Google Scholar] [CrossRef]
  148. Vignani, R.; Lio’, P.; Scali, M. How to integrate wet lab and bioinformatics procedures for wine DNA admixture analysis and compositional profiling: Case studies and perspectives. PLoS ONE 2019, 14, e0211962. [Google Scholar] [CrossRef]
  149. Villano, C.; Lisanti, M.T.; Gambuti, A.; Vecchio, R.; Moio, L.; Frusciante, L.; Aversano, R.; Carputo, D. Wine varietal authentication based on phenolics, volatiles and DNA markers: State of the art, perspectives and drawbacks. Food Control 2017, 80, 1–10. [Google Scholar] [CrossRef]
  150. Zambianchi, S.; Soffritti, G.; Stagnati, L.; Patrone, V.; Morelli, L.; Vercesi, A.; Busconi, M. Applicability of DNA traceability along the entire wine production chain in the real case of a large Italian cooperative winery. Food Control 2021, 124, 107929. [Google Scholar] [CrossRef]
  151. Cichna-Markl, M.; Mafra, I. Techniques for Food Authentication: Trends and Emerging Approaches. Foods 2023, 12, 1134. [Google Scholar] [CrossRef] [PubMed]
  152. Aiello, G.; Tosi, D. An Artificial Intelligence-based tool to predict “unhealthy” wine and olive oil. J. Agric. Food Res. 2024, 16, 101179. [Google Scholar] [CrossRef]
  153. Hategan, A.R.; Pirnau, A.; Magdas, D.A. Applications of Machine Learning for Wine Recognition Based on 1H-NMR Spectroscopy. Beverages 2025, 11, 45. [Google Scholar] [CrossRef]
  154. Adamashvili, N.; Zhizhilashvili, N.; Tricase, C. The Integration of the Internet of Things, Artificial Intelligence, and Blockchain Technology for Advancing the Wine Supply Chain. Computers 2024, 13, 72. [Google Scholar] [CrossRef]
  155. Wang, J.; Wang, J.; Qiao, L.; Zhang, N.; Sun, B.; Li, H.; Sun, J.; Chen, H. From Traditional to Intelligent, A Review of Application and Progress of Sensory Analysis in Alcoholic Beverage Industry. Food Chem. X 2024, 23, 101542. [Google Scholar] [CrossRef]
  156. Vilela, A.; Bacelar, E.; Pinto, T.; Anjos, R.; Correia, E.; Gonçalves, B.; Cosme, F. Beverage and Food Fragrance Biotechnology, Novel Applications, Sensory and Sensor Techniques: An Overview. Foods 2019, 8, 643. [Google Scholar] [CrossRef]
  157. Seesaard, T.; Goel, N.; Kumar, M.; Wongchoosuk, C. Advances in gas sensors and electronic nose technologies for agricultural cycle applications. Comput. Electron. Agric. 2022, 193, 106673. [Google Scholar] [CrossRef]
  158. Jońca, J.; Pawnuk, M.; Arsen, A.; Sówka, I. Electronic Noses and Their Applications for Sensory and Analytical Measurements in the Waste Management Plants—A Review. Sensors 2022, 22, 1510. [Google Scholar] [CrossRef]
  159. Rodríguez-Méndez, M.L.; De Saja, J.A.; González-Antón, R.; García-Hernández, C.; Medina-Plaza, C.; García-Cabezón, C.; Martín-Pedrosa, F. Electronic Noses and Tongues in Wine Industry. Front. Bioeng. Biotechnol. 2016, 4, 81. [Google Scholar] [CrossRef]
  160. Sarlo, L.; Duroux, C.; Clément, Y.; Lanteri, P.; Rossetti, F.; David, O.; Tillement, O. Enhancing wine authentication: Leveraging 12,000+ international mineral wine profiles and artificial intelligence for accurate origin and variety prediction. OENO One 2024, 58. [Google Scholar] [CrossRef]
  161. Yin, X.-L.; Peng, Z.-X.; Pan, Y.; Lv, Y.; Long, W.; Gu, H.-W.; Fu, H.; She, Y. UHPLC-QTOF-MS-based untargeted metabolomic authentication of Chinese red wines according to their grape varieties. Int. Food Res. 2024, 178, 113923. [Google Scholar] [CrossRef]
  162. Mac, H.X.; Pham, T.T.; Ha, N.T.T.; Nguyen, L.L.P.; Baranyai, L.; Friedrich, L. Current Techniques for Fruit Juice and Wine Adulterant Detection and Authentication. Beverages 2023, 9, 84. [Google Scholar] [CrossRef]
  163. Epova, E.; Bérail, S.; Séby, F.; Vacchina, V.; Bareille, G.; Médina, B.; Sarthou, L.; Donard, O. Strontium elemental and isotopic signatures of Bordeaux wines for authenticity and geographical origin assessment. Food Chem. 2019, 294, 35–45. [Google Scholar] [CrossRef] [PubMed]
  164. Su, Y.; Li, Y.; Zhang, J.; Wang, L.; Rengasamy, K.W.; Zhang, A. Analysis of soils, grapes, and wines for Sr isotope characterization in Diqing Tibetan Autonomous Prefecture (China) and combining multiple elements for wine geographical traceability purposes. J. Food Compos. Anal. 2023, 122, 105470. [Google Scholar] [CrossRef]
  165. Cellier, R.; Bérail, S.; Barre, J.; Epova, E.; Claverie, F.; Ronzani, A.; Milcent, S.; Ors, P.; Donard, O. Analytical strategies for Sr and Pb isotopic signatures by MC-ICP-MS applied to the authentication of Champagne and other sparkling wines. Talanta 2021, 234, 122433. [Google Scholar] [CrossRef] [PubMed]
  166. Kochergina, Y.; Pavloušek, P.; Šanda, M.; Hora, J. 87Sr/86Sr isotopic composition of wine: Uses and limitations. OENO One 2024, 58. [Google Scholar] [CrossRef]
  167. Camin, F.; Boner, M.; Bontempo, L.; Fauhl-Hassek, C.; Kelly, S.D.; Riedl, J.; Rossmann, A. Stable isotope techniques for verifying the declared geographical origin of food in legal cases. Trends Food Sci. Technol. 2017, 61, 176–187. [Google Scholar] [CrossRef]
  168. Geana, E.I.; Popescu, R.; Costinel, D.; Dinca, O.R.; Stefanescu, I.; Ionete, R.E.; Bala, C. Verifying the red wines adulteration through isotopic and chromatographic investigations coupled with multivariate statistic interpretation of the data. Food Control 2016, 62, 1–9. [Google Scholar] [CrossRef]
  169. Wu, H.; Tian, L.; Chen, B.; Jin, B.; Tian, B.; Xie, L.; Rogers, K.M.; Lin, G. Verification of imported red wine origin into China using multi isotope and elemental analyses. Food Chem. 2019, 301, 125137. [Google Scholar] [CrossRef]
  170. Wu, H.; Lin, G.; Tian, L.; Yan, Z.; Yi, B.; Bian, X.; Jin, B.; Xie, L.; Zhou, H.; Rogers, K.M. Origin verification of French red wines using isotope and elemental analyses coupled with chemometrics. Food Chem. 2021, 339, 127760. [Google Scholar] [CrossRef]
  171. Martin, G.; Mazure, M.; Jouitteau, C.; Martin, Y.; Aguile, L.; Allain, P. Characterization of the Geographic Origin of Bordeaux Wines by a Combined Use of Isotopic and Trace Element Measurements. AJEV 1999, 50, 409–417. [Google Scholar] [CrossRef]
  172. Moehring, M.; Harrington, P. Analysis of Wine and Its Use in Tracing the Origin of Grape Cultivation. Crit. Rev. Anal. Chem. 2021, 52, 1901–1912. [Google Scholar] [CrossRef] [PubMed]
  173. Kokkinofta, R.; Fotakis, C.; Zervou, M.; Zoumpoulakis, P.; Savvidou, C.; Poulli, K.; Louka, C.; Economidou, N.; Tzioni, E.; Damianou, K.; et al. Isotopic and Elemental Authenticity Markers: A Case Study on Cypriot Wines. Food Anal. Methods 2017, 10, 3902–3913. [Google Scholar] [CrossRef]
  174. Guyon, F.; Douet, C.; Colas, S.; Salagoïty, M.; Médina, B. Effects of must concentration techniques on wine isotopic parameters. J. Agric. Food Chem. 2006, 54, 9918–9923. [Google Scholar] [CrossRef]
Figure 1. Schematic representation of a UV–Vis spectrophotometer composition and operating mode.
Applsci 15 04457 g001
Figure 2. The electromagnetic spectrum. Retrieved from https://www.metrohm.com/pt_pt/discover/blog/2024/nir-vs-ir.html and accessed on 24 February 2025.
Applsci 15 04457 g002
Figure 3. Schematic representation of how a NIR photometer measures a sample and common chemical groups easily measured by NIR, adapted from https://www.kpmanalytics.com/blog/near-infrared-measurements-how-do-they-work, assessed on 25 February 2025.
Applsci 15 04457 g003
Figure 4. A schematic of a Raman spectrometer measurement principle illustrates how the instrument operates.
Applsci 15 04457 g004
Table 1. Applications and key insights of the most commonly used spectroscopic techniques.
Spectroscopic
Technique
ApplicationKey Insights
NMRWine ingredient quantification and metabolomic fingerprinting1H NMR spectroscopy is gaining attention for its simplicity and speed, although it lacks official recognition. It allows for both targeted and non-targeted analysis, providing a comprehensive profile of wine samples [19,20].
UV–Vis and FT-IRVarietal and vintage year discriminationCombined with chemometric analysis, these techniques effectively classify wines by grape variety and vintage year. UV–Vis is more effective for varietal discrimination, while FT-IR excels in vintage classification [1].
Fluorescence
Spectroscopy (A-TEEM)
Geographical and varietal authenticationA-TEEM, combined with machine learning, achieves high accuracy in classifying wines by variety and origin. It also effectively predicts phenolic compound concentrations [4,21,22].
Raman and IRNon-invasive wine-bottle authenticationThese techniques analyze packaging labels to differentiate genuine bottles from counterfeit ones, offering a non-destructive authentication method [23].
Data Fusion ApproachesPDO wine vinegar classificationCombining multiple spectroscopic techniques (MIR, NIR, EEM, 1H-NMR) enhances classification accuracy and provides a comprehensive analysis of wine vinegar [24].
Table 2. UV–Vis spectroscopy techniques apply to wine and its byproducts.
Wine Type/RegionApplication of UV–Vis SpectroscopyRef.
Spanish Wine VinegarsUsed for the authentication and discrimination of wine vinegars by developing classification models.[24]
Red Wines (DO Rías Baixas and DO Ribeira Sacra, Spain)Determination of polyphenolic compounds using UV–Vis–NIR spectroscopy and chemometrics tools.[33]
Sardinian Wines
(Vermentino and Cannonau)
Characterization of polyphenolic fractions during winemaking using UV–Vis and FTIR spectroscopy.[36]
Industrial and Commercial WinesMonitoring phenolic composition and levels during winemaking using UV–Vis spectroscopy.[31]
Red Wines
(Austrian Cultivars)
Discrimination of wine cultivars using UV–Vis spectroscopy of phenolic extracts.[38]
Chinese Rice WinesClassification of wines from different geographical origins using UV–Vis spectroscopy.[39]
Chinese Cabernet Sauvignon WinesGeographical classification using data fusion of UV–Vis and synchronous fluorescence spectroscopies.[40]
Red WinesQuantification of polyphenols using UV–Vis and FTIR spectroscopy with chemometrics.[32]
Table 3. Mid-infrared (MIR) spectroscopy techniques apply to wine and its byproducts.
Wine Type/VarietyApplication of MIR SpectroscopyRef.
Australian Red and White WinesVarietal classification using MIR spectroscopy combined with PCA and LDA.[47]
White WinesRoutine analysis of alcoholic strength, total acidity, and other parameters using MIR.[48]
Chokeberry, Blackberry, Raspberry Fruit WinesAuthentication and classification of fruit wines using FT-MIR and chemometrics.[49]
Red WinesPrediction of phenolic compounds during fermentation using ATR-MIR spectroscopy.[31]
Various Grape VarietiesPrediction of chemical compositions using combined visible and MIR spectroscopies.[50]
Cabernet Sauvignon and ChardonnayModeling sensory properties of wines using MIR spectra.[51]
Chinese Rice WineDetermination of sugars and acids using FT-MIR spectroscopy.[52]
Italian Straw WinePrediction of alcohol content, sugar levels, and total acidity using FT-MIR spectroscopy.[53]
Table 4. Examples of wines in which near-infrared (NIR) spectroscopy has been applied.
Wine TypeApplication of NIR SpectroscopyRef.
Wine from the Vinho Verde regionQuantification of volatile compounds using FT-NIR transmission spectroscopy.[65]
Red WinePrediction of phenolic compounds during fermentation using NIR spectroscopy.[66]
Red Wine GrapesQuality assessment and quantification of quality attributes like SSC, TA, and tannins.[67]
Various WinesClassification of wines based on the aging process using NIR spectroscopy and multivariate analysis.[68]
Australian WinesMeasurement of elemental concentrations using VIS-NIR spectroscopy.[69]
Disclaimer/Publisher’s Note: The statements, opinions and data contained in all publications are solely those of the individual author(s) and contributor(s) and not of MDPI and/or the editor(s). MDPI and/or the editor(s) disclaim responsibility for any injury to people or property resulting from any ideas, methods, instructions or products referred to in the content.

