Article

A Gene Ontology-Based Pipeline for Selecting Significant Gene Subsets in Biomedical Applications

1
Department of Informatics, Jan Evangelista Purkyně University in Ústí nad Labem, 400 96 Ústí nad Labem, Czech Republic
2
Department of Physics, Kherson State University, 73008 Kherson, Ukraine
3
Department of Digital Economy and Business Analytics, Ivan Franko National University, 79000 Lviv, Ukraine
4
Department of Information Science, Physics and Mathematics Disciplines, Uzhhorod National University, 88000 Uzhhorod, Ukraine
*
Author to whom correspondence should be addressed.
The authors contributed to this work as follows: the first author—50%, the second—30%, the third and the fourth authors—10%.
Appl. Sci. 2025, 15(8), 4471; https://doi.org/10.3390/app15084471
Submission received: 26 February 2025 / Revised: 14 April 2025 / Accepted: 16 April 2025 / Published: 18 April 2025
(This article belongs to the Special Issue Advances in Bioinformatics and Biomedical Engineering)

Abstract

:
The growing volume and complexity of gene expression data necessitate biologically meaningful and statistically robust methods for feature selection to enhance the effectiveness of disease diagnosis systems. The present study addresses this challenge by proposing a pipeline that integrates RNA-seq data preprocessing, differential gene expression analysis, Gene Ontology (GO) enrichment, and ensemble-based machine learning. The pipeline employs the non-parametric Kruskal–Wallis test to identify differentially expressed genes, followed by dual enrichment analysis using both Fisher’s exact test and the Kolmogorov–Smirnov test across three GO categories: Biological Process (BP), Molecular Function (MF), and Cellular Component (CC). Genes associated with GO terms found significant by both tests were used to construct multiple gene subsets, including subsets based on individual categories, their union, and their intersection. Classification experiments using a random forest model, validated via 5-fold cross-validation, demonstrated that gene subsets derived from the CC category and the union of all categories achieved the highest accuracy and weighted F1-scores, exceeding 0.97 across 14 cancer types. In contrast, subsets derived from BP, MF, and especially their intersection exhibited lower performance. These results confirm the discriminative power of spatially localized gene annotations and underscore the value of integrating statistical and functional information into gene selection. The proposed approach improves the reliability of biomarker discovery and supports downstream analyses such as clustering and biclustering, providing a strong foundation for developing precise diagnostic tools in personalized medicine.

1. Introduction and Literature Survey

In modern bioinformatics and precision medicine, gene expression analysis plays a central role in developing advanced tools for early disease detection. The association between gene activity and pathological states provides a robust framework for uncovering novel diagnostic opportunities. This is particularly critical given the rising prevalence of multifactorial diseases such as cancer, Parkinson’s disease, and Alzheimer’s disease, which continue to challenge global healthcare systems. Enhancing methods for analyzing gene expression data is thus both timely and vital for improving the precision with which complex diseases are diagnosed.
Gene expression profiling enables comprehensive examination of the transcriptional landscape within cells, thereby elucidating the molecular mechanisms that drive disease progression. These high-throughput datasets capture dynamic gene activity under specific pathological conditions, laying the groundwork for identifying biomarkers and regulatory pathways. In the context of personalized medicine, such insights are invaluable for tailoring diagnostics and treatments to individual patients. Methods such as Gene Ontology (GO) analysis, clustering, and biclustering provide powerful means to extract biologically relevant and co-expressed gene subsets, thereby enhancing data interpretability and classification accuracy. This approach supports not only early diagnosis but also stratification of patients based on molecular profiles—a cornerstone of personalized therapy. Consequently, gene expression analysis bridges the gap between genomic research and clinical practice, contributing to both improved diagnostics and precision therapeutics.
Ontology, in a broader philosophical sense, pertains to the categorization and nature of being [1,2]. In bioinformatics, ontology refers to the formal representation of domain-specific knowledge using structured concepts and defined relationships. This framework supports data integration, interoperability, and cross-study comparisons. Specifically, Gene Ontology enables modeling of complex biological systems and facilitates both data interpretation and hypothesis generation.
GO provides a controlled and hierarchical vocabulary for annotating genes and their products, thereby allowing systematic interpretation of genomic data. It is structured into three primary domains: Biological Process (BP), which encompasses sequences of molecular events; Molecular Function (MF), which encompasses basic activities such as binding or catalysis; and Cellular Component (CC), which encompasses locations within cellular structures where gene products are active [3,4].
GO enrichment analysis (GOEA) is widely employed to identify statistically overrepresented GO terms among differentially expressed genes (DEGs) derived from technologies such as DNA microarrays or RNA sequencing (RNA-seq) [5,6]. This method reveals potentially disrupted biological pathways and provides insights into disease mechanisms, supporting biomarker discovery for diagnostics and therapy. GO’s ability to integrate functional, spatial, and process-based gene annotations makes it essential for genome-wide studies, enabling cross-species comparisons and the identification of evolutionarily conserved functions. Therefore, constructing biologically meaningful gene subsets via GOEA is both a methodological requirement and a key component of precision diagnostics.
The application of GO-based functional annotation has become a cornerstone for interpreting DEGs across various diseases. For instance, in [7], GOEA was used to investigate the biological impact of DEGs in respiratory diseases, demonstrating that microplastic exposure disrupts key molecular pathways. Similarly, ref. [8] explored colorectal cancer (CRC) in patients with type 2 diabetes mellitus (T2DM), identifying enrichment in O-linked glycosylation processes and revealing mechanistic links and therapeutic targets. Du et al. [9] examined CHAF1B in lung adenocarcinoma (LUAD), finding associations with immune modulation, glycolysis, and cell proliferation. Another study [10] on atonic postpartum hemorrhage (PPH) showed immune–inflammatory enrichment involving T cells and macrophages; biomarkers such as CD163 and FGL2 were proposed for early diagnosis.
Extending GO analysis beyond transcriptomics, Mahajan et al. [11] developed IDSL.GOA, a tool for GO-based metabolomic enrichment. This enabled deeper insight into biological processes at the metabolite level, as demonstrated by identifying 82 enriched GO terms related to metabolism in the aging brain cortex. Similarly, ref. [12] used integrative genomics—including GWAS and plasma proteomics—combined with Mendelian randomization to identify proteins such as GSTM3 and FAM171B as candidate biomarkers for small cell lung cancer (SCLC). Xu et al. [13] applied a similar approach to identify TIMP4 as a potential therapeutic target in acne vulgaris.
Advances in GO analysis tools have further enhanced accessibility and reproducibility. GOnet [14] provides interactive visualization of gene-term relationships, while FunSet [15] clusters semantically similar terms and enables reproducible analysis via version-controlled ontologies. GOTermViewer [16] supports dynamic interpretation of GO enrichment across multiple experiments, such as drug-response studies or time-series analyses.
Despite these advances, key challenges remain. GO term enrichment results often vary across datasets and disease types, leading to inconsistencies. The choice of statistical methods (e.g., Fisher’s exact test or the Kolmogorov–Smirnov test) and DEG selection criteria further influence reproducibility. Moreover, integration with other omics layers—such as proteomics and metabolomics—is still limited, restricting holistic interpretation. Gene–gene interactions, pathway crosstalk, reliance on public datasets such as TCGA, and species-specific annotation discrepancies introduce additional complexity. To address these issues, future approaches must incorporate multi-omics integration, machine learning for prioritization, and more robust statistical frameworks, ultimately improving the translational potential of GO-based diagnostics.
This study proposes a novel pipeline that integrates GO-based feature selection with ensemble learning to classify samples based on gene expression data. The methodology includes four main stages. First, gene expression data are preprocessed through standardization and normalization, with non-informative features removed to improve the quality of downstream analysis. Second, functionally significant gene subsets are extracted using Gene Ontology Enrichment Analysis (GOEA) across the three primary domains: Biological Processes (BP), Molecular Functions (MF), and Cellular Components (CC), to ensure biological relevance. Third, an ensemble classifier, specifically the random forest algorithm, is applied to assess the predictive capacity of the selected gene subsets. Finally, the performance of the classification models is evaluated using standard metrics, including accuracy, precision, recall, and F1-score.
The core contribution of this research is the development of an integrated, hybrid pipeline that enhances the robustness and accuracy of biomarker discovery. This includes preprocessing, DEG identification, multi-domain GO enrichment, and statistical validation using Fisher’s exact test and the Kolmogorov–Smirnov test. A distinctive innovation lies in the hybrid strategy for GO term integration, where gene sets enriched in BP, MF, and CC are intersected and combined to optimize biological relevance and classification performance. Furthermore, model performance is improved via hyperparameter optimization using Bayesian methods within the random forest framework. Together, these contributions establish a comprehensive and biologically grounded methodology for gene-expression-based disease classification and personalized diagnostics.

2. Materials and Methods

2.1. Experimental Dataset

During the simulation procedure, gene expression data from patients with various cancer types were utilized. These data are publicly available on The Cancer Genome Atlas (TCGA) website https://www.cancer.gov/tcga (accessed on 12 June 2024) and were obtained using RNA sequencing (RNA-seq). The classification of cancer types and the corresponding numbers of samples are presented in Figure 1.
Initially, the dataset comprised 6344 samples and 60,660 genes. Data preprocessing was carried out in the R programming environment (version 4.4.1) [17] using appropriate modules from the Bioconductor package https://bioconductor.org/ (accessed on 16 November 2024) [18,19,20]. A detailed step-by-step workflow for the formatting, preprocessing, and normalization of gene expression data is shown in Figure 2.
The dataset was structured as a matrix of size 6344 × 60,660, where each row represents a sample and each column corresponds to a gene. Duplicate entries and incorrect gene identifiers were removed based on the organism annotation.
Gene identifiers in Ensembl format were transformed to Entrez IDs to ensure compatibility with the org.Hs.eg.db database https://bioconductor.org/packages/org.Hs.eg.db (accessed on 22 Desember 2024) [21]. This conversion included extracting gene-specific identifiers, mapping Ensembl IDs to Entrez IDs using the biomaRt package https://bioconductor.org/packages/release/bioc/html/biomaRt.html (accessed on 25 November 2024) [22], and validating the results via org.Hs.eg.db to eliminate incorrect or unmatched entries.
Normalization was applied to raw transcript counts, which originally ranged from 0 to 12,581,910. The pipeline included a counts-per-million (CPM) transformation with log scaling, removal of genes with zero variance, and scaling adjustment by adding a small constant to avoid negative values.

2.2. Gene Ontology-Based Pipeline for Identifying Statistically Significant Genes

The step-by-step procedure for applying GO analysis to the preprocessed gene expression dataset is illustrated in Figure 3.
The pipeline consists of the following stages:
1.
Identification of Differentially Expressed Genes (DEGs). Statistical analysis is performed using the Kruskal–Wallis test, a non-parametric method suitable for comparing gene expression distributions across multiple independent groups. This test is particularly appropriate in the current study, as prior assessment revealed that the majority of gene expression profiles deviate from normality, often exhibiting skewed or multimodal distributions. Given the presence of 14 sample classes, the Kruskal–Wallis test enables the detection of genes with significant expression differences between groups. The output is a vector of p-values, one for each gene, indicating the probability that the observed differences would arise by chance under the null hypothesis.
2.
Multiple Testing Correction Using the Benjamini–Hochberg (BH) Method [23]. Due to the large number of simultaneous hypothesis tests (tens of thousands of genes), the probability of false-positive results increases. The BH procedure addresses this issue by controlling the false discovery rate (FDR), which reflects the expected proportion of incorrect rejections among all rejected hypotheses.
The method consists of several steps. First, the p-values obtained from the tests are sorted in ascending order. Then, each sorted p i is adjusted using the following formula:
q i = p i · m i
where m is the total number of hypotheses tested, while i is the index of the sorted p-value.
To ensure monotonicity, if q i + 1 < q i , then q i + 1 is set equal to q i . This step guarantees that the adjusted q-values do not decrease as the rank increases.
Genes with adjusted q-values below a predefined threshold p max are considered statistically significant.
3.
Threshold Initialization. To determine which genes should be selected for further analysis, a significance threshold p max is defined. In this study, the threshold was set to p max = 0.05 , which is a widely accepted value in statistical hypothesis testing. This value represents a 5% probability of committing a Type I error (false positive), balancing sensitivity and specificity in the identification of differentially expressed genes.
The choice of this threshold was motivated by both statistical convention and practical considerations in high-dimensional biological data analysis. A more stringent threshold could exclude biologically relevant genes by increasing the false-negative rate, whereas a more lenient one might increase the risk of false discoveries. By applying p max = 0.05 in conjunction with the Benjamini–Hochberg correction for multiple testing, the procedure effectively controls the FDR while maintaining adequate sensitivity.
4.
Gene Ranking. Genes are ranked in ascending order based on their adjusted q-values to prioritize those with the strongest statistical significance.
5.
GO Enrichment Analysis. To identify biologically meaningful functional groups among the differentially expressed genes, enrichment analysis is conducted using the topGO package https://bioconductor.org/packages/release/bioc/html/topGO.html (accessed on 29 October 2024) [24]. The analysis is performed separately for each of the three principal Gene Ontology (GO) categories: Biological Process (BP), Molecular Function (MF), and Cellular Component (CC).
The analysis uses a gene universe consisting of all genes tested in the differential expression analysis, with significance determined by adjusted q-values. The selection function identifies genes with q-values below the threshold p max = 0.05 . To ensure functional relevance and statistical robustness, only GO terms with a minimum of 10 annotated genes are considered.
The enrichment of GO terms is evaluated using two complementary statistical tests. First, Fisher’s exact test is applied to detect the overrepresentation of significant genes within each GO term. Second, the Kolmogorov–Smirnov (KS) test is used to assess distributional shifts in gene-level scores across GO terms.
GO terms are retained for downstream analysis only if they are found to be statistically significant by both tests. Gene annotations are mapped using the org.Hs.eg.db database, and all gene identifiers are standardized to the Entrez format.
6.
Extraction of Significant Genes Associated with Enriched GO Terms. Genes that are linked to significantly enriched GO terms—validated by both Fisher’s exact test and the Kolmogorov–Smirnov test—are selected for further analysis. The corresponding Entrez IDs of these genes are extracted and aggregated across all three GO categories (BP, MF, and CC). The resulting gene list is composed of unique identifiers that appear in at least one of the enriched GO categories.
7.
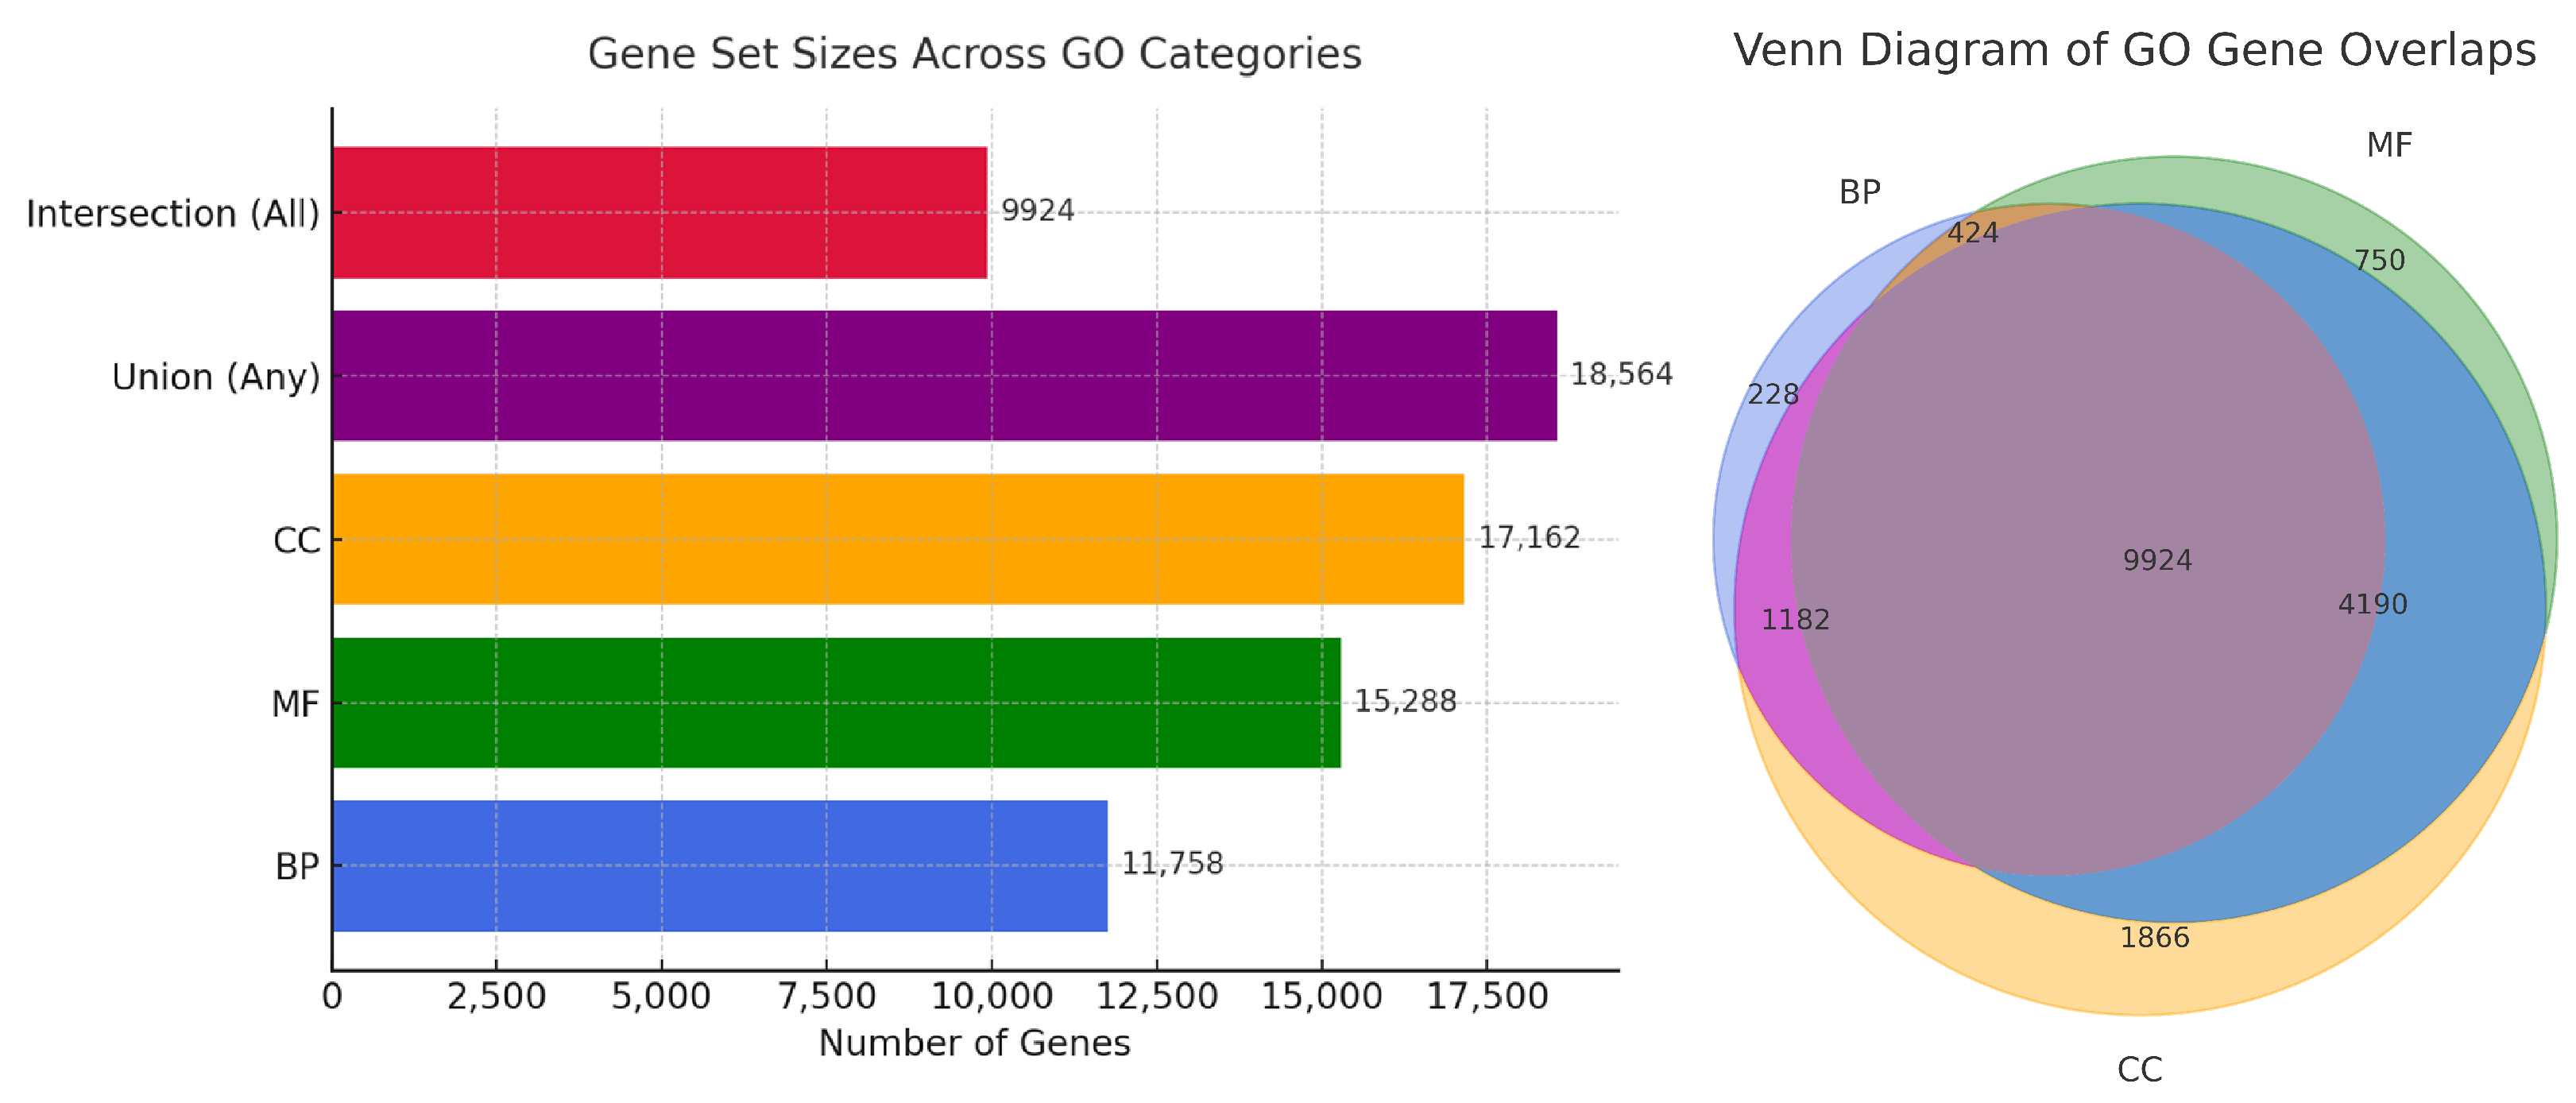
Construction of the Final Dataset. Based on the normalized expression profiles of the selected significant genes, are distinct datasets were constructed to support downstream analysis. The first three datasets were category-specific: the BP-specific dataset contained genes identified as significant within the Biological Process (BP) category; the MF-specific dataset included genes significant in the Molecular Function (MF) category; and the CC-specific dataset comprised genes significant in the Cellular Component (CC) category.
In addition, two integrative datasets were created. The intersection dataset included only those genes that were found to be significant in all three GO categories simultaneously, representing the intersection of BP, MF, and CC. The union dataset, by contrast, contained unique genes that were significant in at least one of the GO categories.
Each of these datasets preserves the normalized expression values of the selected genes across all 6344 samples and serves as the foundation for the subsequent classification and evaluation procedures.
8.
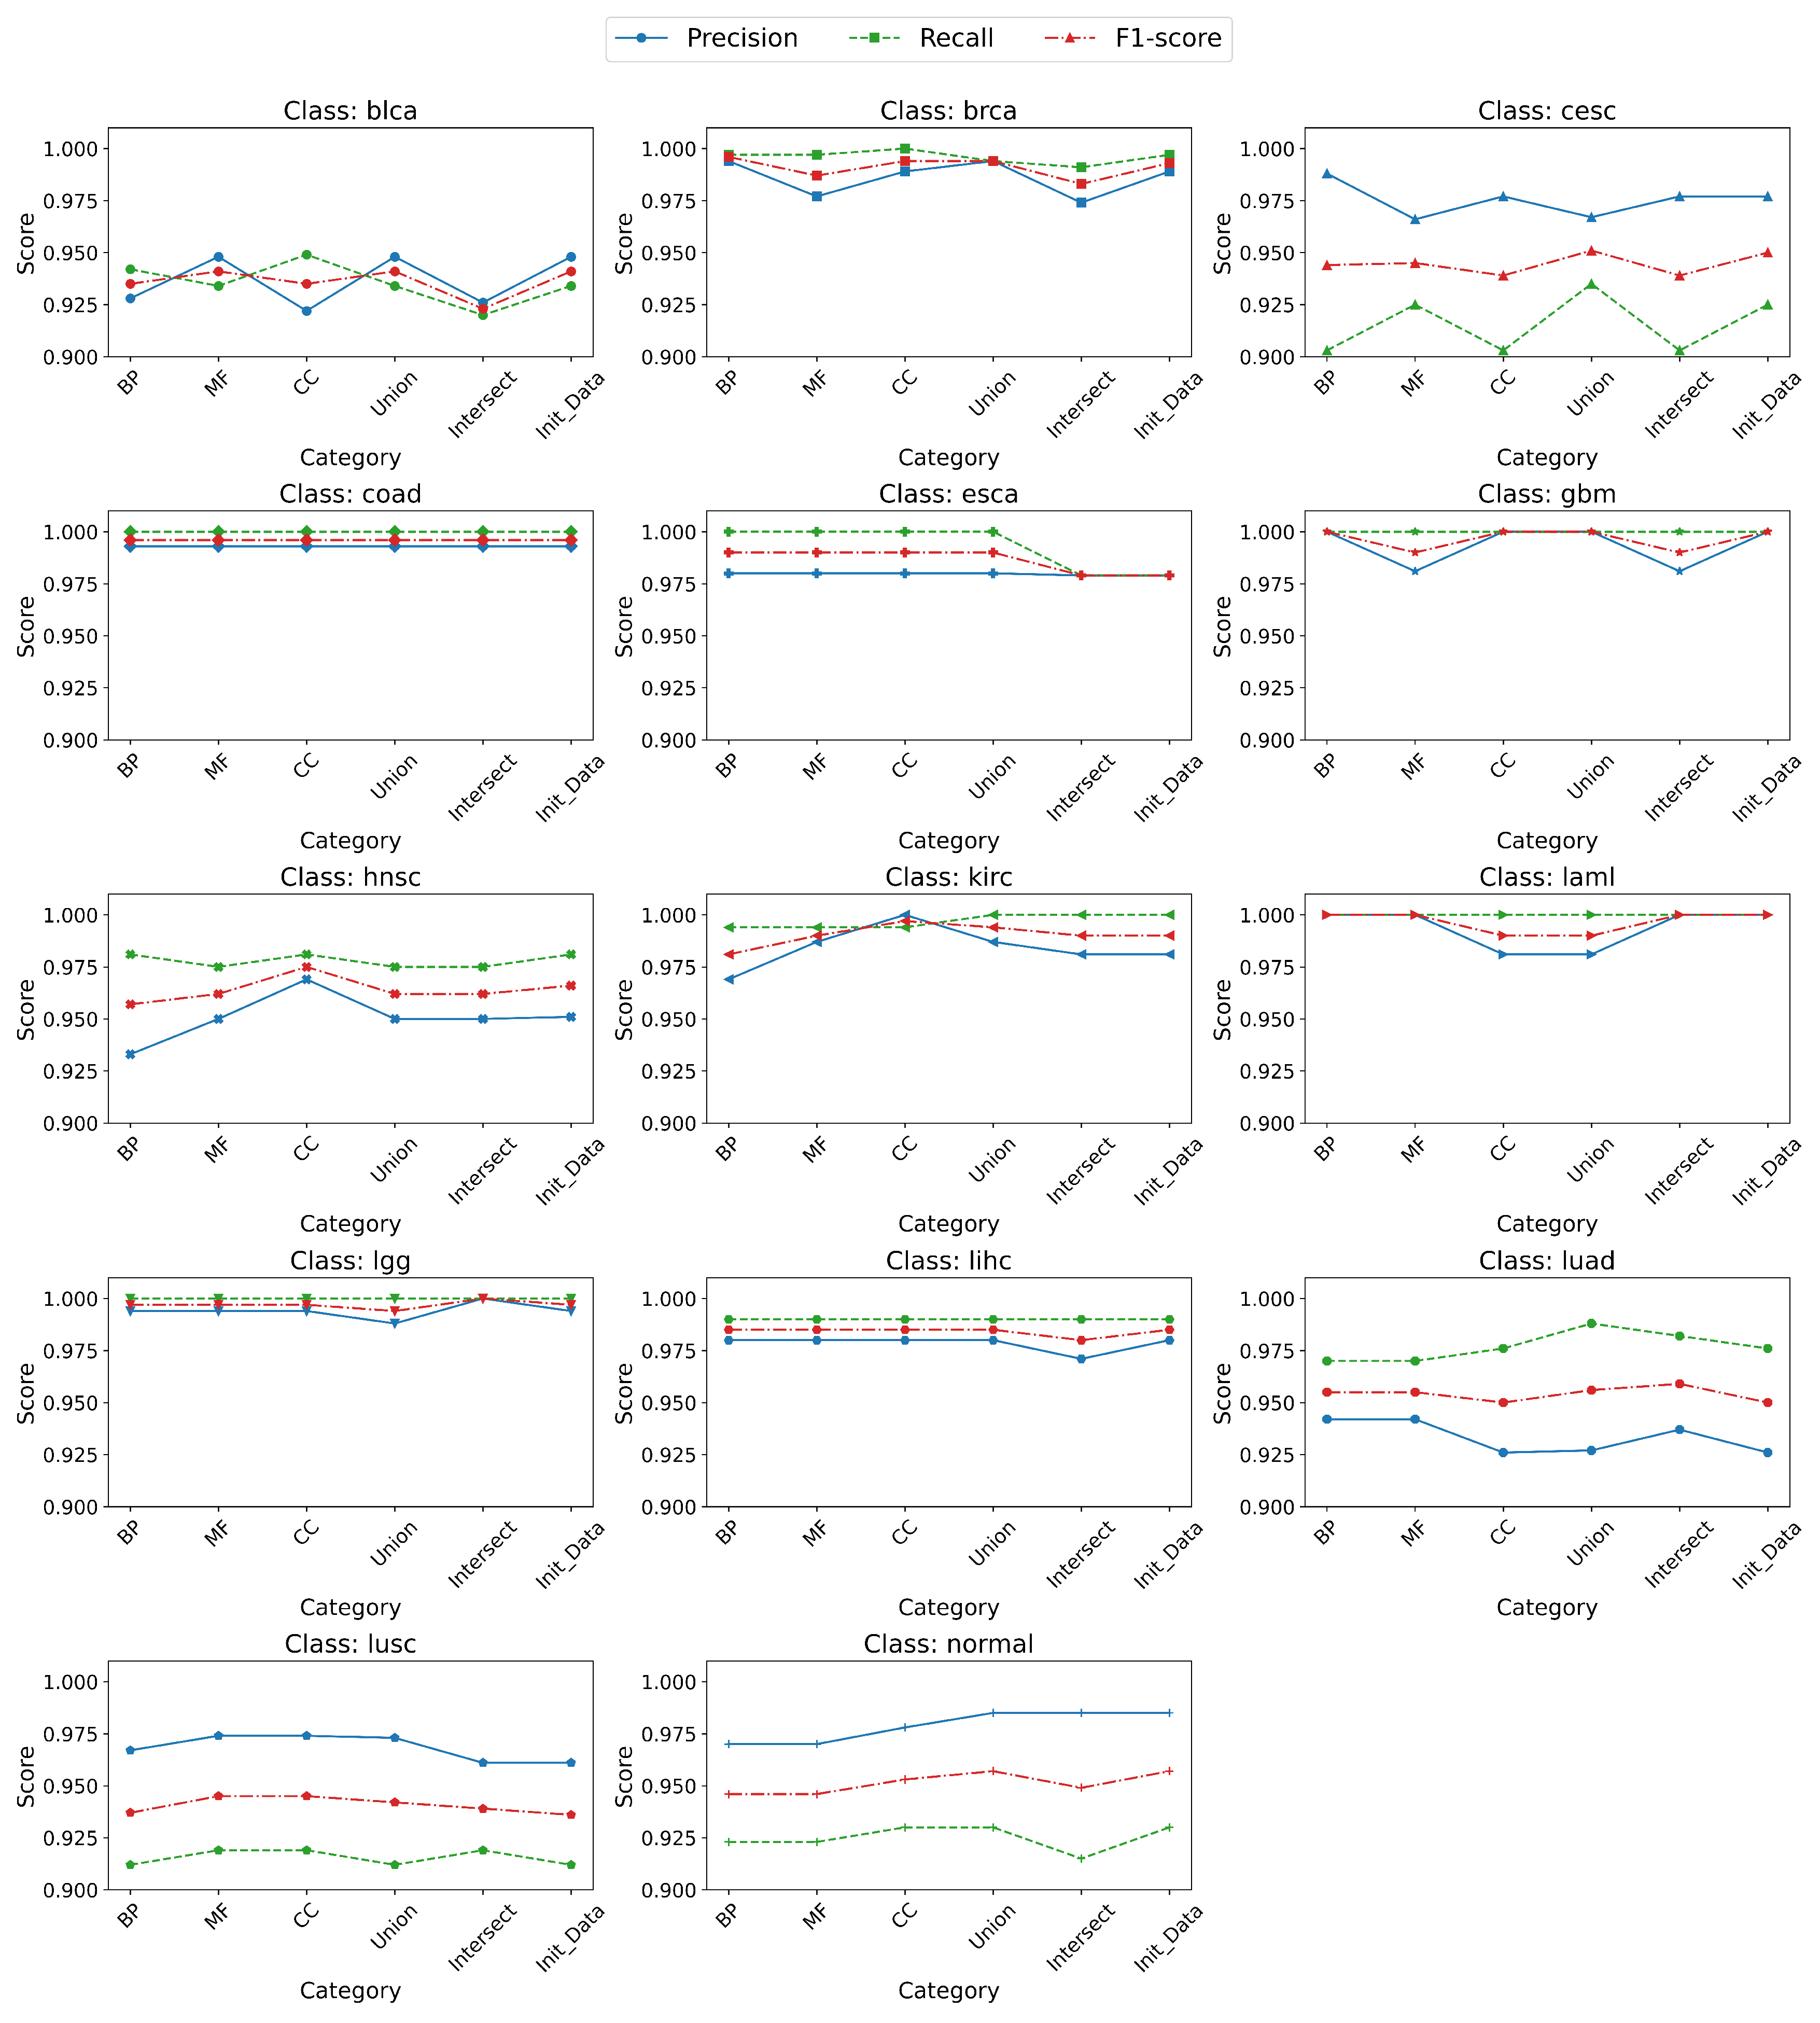
Classification and Model Evaluation. To evaluate the discriminative potential of each constructed dataset, a supervised classification model is applied. A random forest classifier was selected due to its high performance on high-dimensional data, resistance to overfitting, and ability to estimate feature importance [25,26,27].
Model training and evaluation are performed using a 70/30 stratified train–test split. Hyperparameter tuning was conducted exclusively on the training set using Bayesian optimization combined with 5-fold cross-validation to ensure generalizability and prevent information leakage. The independent test set was reserved for final performance evaluation using the optimized model.
Bayesian optimization is a method that leverages probabilistic models (typically Gaussian processes) to iteratively select the most promising hyperparameter values based on a surrogate model of the objective function. Unlike random or grid search, Bayesian optimization strategically explores the hyperparameter space, reducing computational cost while improving convergence to optimal solutions. The objective function was defined as the average classification accuracy across validation folds during training.
The following key hyperparameters are optimized as part of the modeling procedure: the number of decision trees in the ensemble (n_estimators); the maximum depth of individual trees (max_depth); the minimum number of samples required to split an internal node (min_samples_split); the minimum number of samples required to be at a leaf node (min_samples_leaf); the number of features considered when determining the best split (max_features); and the criterion for measuring the quality of a split, such as gini or entropy.
Additionally, bootstrap sampling is enabled during model training to increase model variance and reduce the risk of overfitting.
The trained model is evaluated on the test data using standard performance metrics, including precision, recall, F1-score, weighted F1-score, and accuracy, defined as follows:
Precision = T P T P + F P
Recall = T P T P + F N
F 1 - score = 2 · Precision · Recall Precision + Recall
F 1 weighted = i = 1 C n i N · F 1 - score i
Accuracy = T P + T N T P + T N + F P + F N
where T P , F P , T N , and F N denote true positives, false positives, true negatives, and false negatives, respectively; C is the number of classes; n i is the number of true samples in class i; and N is the total number of samples.
These metrics were used to assess and compare the classification performance for each of the five gene subsets generated during the pipeline.
9.
Analysis of Results. The classification results are analyzed to compare the predictive power of datasets based on individual GO categories and their combination. The impact of GO-based feature selection on classification performance is also evaluated.

3. Results and Discussion

3.1. Results of Data Preprocessing

As a result of the filtering process, the number of genes was progressively reduced. First, 1281 genes were removed due to zero variance, resulting in 59,379 genes. Then, 33,707 genes with low expression levels were excluded, yielding a final expression matrix of size 6344 × 25 , 672 .
To assess the normality of expression distributions, two statistical tests were performed. The Shapiro–Wilk test [28] was applied to a randomly selected subsample of 5000 observations, while the D’Agostino–Pearson omnibus test [29] was applied to the full dataset. Both tests indicated that most gene expression profiles significantly deviated from a normal distribution ( p < 0.05 ), often displaying skewed or multimodal characteristics. This confirmed the need to apply non-parametric methods such as the Kruskal–Wallis test [28] for downstream analysis.

3.2. Application of GO Analysis to Identify a Subset of Significant Genes

Figure 4 illustrates the distribution of p-values obtained from Fisher’s exact test (X-axis) and the Kolmogorov–Smirnov test (Y-axis) for GO term enrichment across the three Gene Ontology categories.
Each point in the plots represents a single GO term. The color indicates the number of associated genes: red points correspond to GO terms with a gene count above a predefined threshold, while blue points represent terms with fewer associated genes. The size of each point is proportional to the number of genes linked to that GO term, allowing visual emphasis on gene-rich functional groups. The horizontal and vertical axes both reflect statistical significance: smaller values indicate stronger enrichment. Consequently, GO terms located near the origin (0,0) are considered highly significant by both tests and represent promising candidates for downstream analysis.
Analysis of the distributions reveals several important patterns. A substantial number of GO terms lie along the axes, exhibiting low p-values in one test but high values in the other. This indicates differing sensitivities of the two tests to distinct data characteristics. In all three GO categories, some GO terms have p-values greater than 0.5 in one test, suggesting a lack of enrichment by that measure, while simultaneously showing p-values close to 0 in the other test, highlighting significant distributional shifts.
This discrepancy underscores the complementarity of the two methods. Fisher’s exact test is sensitive to the presence or absence of gene sets in categories, whereas the Kolmogorov–Smirnov test captures differences in ranked distributions of expression values. Applying both tests in parallel ensures robust detection of functionally enriched GO terms. Their intersection forms a reliable basis for extracting gene subsets consistently enriched from different statistical perspectives, reducing false positives and increasing biological relevance.
The results also allow comparisons across GO categories. The BP category (Figure 4a) shows a broader distribution of points and higher density near the origin, indicating a richer set of biologically meaningful terms. In contrast, the MF and CC categories (panels b and c) contain fewer high-confidence terms, though notable clusters of significant terms still emerge.
From a biological standpoint, GO terms clustered near the origin highlight disease-relevant processes. In the BP category, these terms are predominantly related to the immune response, cell proliferation, apoptosis, and inflammatory signaling. There are well-established mechanisms involved in cancer and complex diseases. The MF category includes kinase activity, receptor binding, and transcription factor activity, reflecting regulation of signaling and gene expression. The CC category shows enrichment in the plasma membrane, extracellular exosomes, and nucleosomes, structures associated with cellular communication and remodeling during tumor progression and metastasis.
Thus, the consistent clustering of significant GO terms across the two tests reinforces the robustness of the method and provides a biologically meaningful gene subset for downstream classification and potential biomarker discovery.
Overall, these results confirm the necessity of using multiple enrichment tests and integrating their outcomes to reliably identify functionally and biologically interpretable subsets of significant genes.

3.3. Quantitative Summary and Visualization of Gene Set Overlaps

The outcome of the GO-based gene selection pipeline, illustrated in Figure 3, is quantitatively and visually summarized in Figure 5.
The left panel of Figure 5 presents a horizontal bar chart showing the number of significant genes identified in each GO category individually, as well as the total number of unique genes (union) and the number of genes shared across all categories (intersection). Specifically, 11,758 genes were identified within the Biological Process (BP) category, 15,288 genes in the Molecular Function (MF) category, and 17,162 genes in the Cellular Component (CC) category. Applying a union operation across all three categories yielded 18,564 unique genes, while the intersection contained 9924 genes that were significant in all three categories simultaneously.
These results demonstrate that each GO category contributes a functionally specific subset of significant genes. Applying set-based operations such as union() and intersect() enables the selection of either a broad gene set with maximal functional coverage or a high-confidence core set of biologically consistent markers.
The right panel of Figure 5 displays a Venn diagram visualizing the overlap between the three GO categories. The central region, labeled 9924, corresponds to genes identified as significant in all three categories simultaneously. In addition, 4190 genes are shared between the MF and CC categories but are not present in BP; 1866 genes are unique to CC; 750 genes are unique to MF; and 228 genes are specific to BP.
This visualization emphasizes both the redundancy and the uniqueness of GO-annotated gene subsets, highlighting the potential for targeted selection depending on the analytical goal—whether it prioritizes broad generalization or high biological specificity.

3.4. Application of the Random Forest Classifier to the Generated Gene Expression Datasets

Following the identification of significant genes based on Gene Ontology (GO) categories, a supervised learning model was applied to evaluate the discriminative power of each constructed gene expression dataset. The random forest (RF) algorithm was chosen due to its robustness, resistance to overfitting, ability to handle high-dimensional data, and capacity to assess feature importance. Table 1 summarizes the RF hyperparameters that were optimized, specifying their search intervals and the final selected values.
The interpretation of the obtained results is as follows. The relatively small number of estimators (50 decision trees) reflects a deliberate compromise between computational efficiency and classification performance. This setting reduces training time while preserving sufficient diversity within the ensemble to maintain predictive accuracy. The selected maximum tree depth (14), along with constraints on the minimum number of samples required for node splitting and leaf formation (e.g., m i n _ s a m p l e s _ s p l i t = 9 ), acts as a regularization mechanism. These constraints help to control model complexity and reduce the risk of overfitting—an essential consideration when working with high-dimensional gene expression data. A particularly low value of m a x _ f e a t u r e s , at 0.113, indicates that only a small fraction of available features (i.e., genes) are randomly selected at each node split. This practice enhances the diversity among trees in the ensemble and improves generalization performance by minimizing correlations between individual learners. The use of bootstrap=True enables each decision tree to be trained on a randomly resampled (bootstrapped) subset of the original data. This technique increases model variance and contributes to overall robustness by aggregating predictions across diverse training subsets.
Finally, the choice of entropy as the criterion for node splitting prioritizes information gain. This makes it particularly well suited for biological classification tasks, where class distributions are often unbalanced or non-uniform. This fine-tuned random forest model was subsequently applied to each of the five datasets generated from the GO-based gene selection pipeline: three corresponding to the individual GO categories (BP, MF, and CC), one representing the intersection of significant genes across all three categories, and one corresponding to their union.
Figure 6 and Figure 7 present the classification results based on gene subsets derived from different Gene Ontology (GO) categories and their combinations.
Figure 6 presents line plots of classification performance metrics (precision, recall, and F1-score) across 14 sample classes, based on gene subsets derived from different GO categories: BP, MF, CC, as well as their union and intersection. Each subplot corresponds to a specific class and illustrates how predictive performance varies depending on the selected subset. Figure 7 complements this by summarizing the overall classification accuracy and weighted F1-score across all categories.
The CC category consistently yields the highest performance, both by class and overall, with metrics often exceeding 0.99 for multiple cancer types. This highlights the value of genes related to spatial localization and structural organization in distinguishing tumor profiles; while the union subset integrates additional genes from BP and MF, it offers only marginal gains over CC, suggesting that the most predictive features are already encompassed within the CC subset. A closer look at class-specific behavior shows that model performance varies not only by GO category but also by cancer type. For example, the CESC class exhibits considerable differences in recall depending on the subset—particularly MF and the intersection of the sets—indicating that critical genes for this class may reside outside the intersection of GO domains. This underscores the importance of considering each GO category independently.
BP and MF subsets demonstrate slightly lower, yet still reliable, classification scores. The intersection subset—limited to genes common across all GO categories—yields the weakest results, likely due to its reduced size and the exclusion of functionally unique genes. The overall consistency of performance across subsets, especially in weighted metrics, reflects the robustness of the RF classifier. Its resilience to noise and suitability for high-dimensional data make it an effective choice for gene expression analysis.
This comparison also supports the use of biologically informed dimensionality reduction. GO-based gene selection not only improves interpretability but also facilitates downstream analyses, such as clustering and module detection. In this context, the CC subset presents an effective balance between simplicity and predictive power. Although this study focuses on classification accuracy, future research will explore interpretability through feature importance methods such as Gini-based ranking and SHAP (Shapley Additive Explanations). This will enhance understanding of which genes and GO terms are most influential in model predictions, thereby increasing biological transparency and clinical relevance.
To provide a comprehensive benchmark, we also evaluated classification using the full set of 25,672 normalized genes, without GO filtering. The performance was highly comparable to that of the union subset, with differences in weighted F1-scores generally below 1%. This confirms that GO-based subsets retain most of the predictive capacity while substantially reducing the feature space. However, GO-based selection has limitations. The filtering and thresholding processes may exclude relevant genes, and the evolving nature of GO annotations introduces variability over time. Therefore, while beneficial for efficiency and clarity, this approach must be applied with caution and awareness of these trade-offs.
In the broader context of personalized medicine, the ability to define compact and functionally coherent gene subsets supports the development of accurate, interpretable, and scalable diagnostic models. These findings form a strong foundation for downstream biomarker discovery and classification tasks in precision oncology.

4. Conclusions

This study presents a comprehensive pipeline that integrates Gene Ontology (GO) enrichment analysis with ensemble-based machine learning to identify statistically and biologically significant gene subsets from high-dimensional gene expression data. The proposed methodology was evaluated across the three principal GO categories, namely, Biological Process (BP), Molecular Function (MF), and Cellular Component (CC), as well as their set-theoretic combinations (union and intersection).
The experimental results demonstrate that gene subsets derived from the CC category consistently yield the highest classification performance, both by class and overall. This indicates that genes associated with spatial localization and structural cellular roles are particularly informative for distinguishing cancer subtypes. The union of all GO categories performs similarly, suggesting that most discriminative genes in BP and MF are already present in the CC subset. By contrast, subsets based solely on BP, MF, or their intersection show reduced classification accuracy, likely due to loss of complementary or category-specific markers.
To validate the effectiveness of GO-based selection, we additionally evaluated the classification performance of the full set of 25,672 normalized genes without any prior filtering. The resulting scores were comparable to those obtained from the union subset, with less than a 1% difference in weighted F1-score. This supports the utility of GO-based feature selection as a form of biologically informed dimensionality reduction that retains most of the predictive power of the data while improving interpretability and computational efficiency.
The random forest classifier demonstrated remarkable robustness across all gene subsets, with minimal variation in performance metrics. Its ensemble structure, ability to handle high-dimensional and noisy data, and resilience to redundant features make it especially suitable for transcriptomic classification tasks. A critical strength of the pipeline lies in its dual validation strategy for GO enrichment. By jointly applying Fisher’s exact test and the Kolmogorov–Smirnov test, the method ensures that selected GO terms exhibit both categorical overrepresentation and distributional divergence. This two-layered filtering enhances the statistical rigor of the resulting gene sets and reduces the likelihood of false positives. Beyond classification accuracy, the pipeline offers an interpretable framework for biologically grounded gene selection; while this study primarily focused on predictive performance, future work will investigate model interpretability through feature importance measures such as Gini impurity reduction and SHAP (Shapley Additive Explanations). These analyses will identify key genes and GO terms driving classification outcomes and enhance the biological transparency of the results.
In the broader context of precision medicine, the ability to extract compact and functionally coherent gene subsets supports the development of efficient, accurate, and interpretable diagnostic models. These findings form a solid foundation for downstream applications such as biomarker discovery, co-expression network analysis, and multi-omics integration. Future research will extend this methodology to deep learning models and hybrid ensemble approaches for improved generalization and biomarker stability across disease cohorts.

Author Contributions

The individual contributions of the authors are the following: conceptualization, methodology, formal analysis, resources, simulation, writing—review and editing: S.B., O.Y. and I.L.; software, validation, statistical analysis, writing—original draft preparation: O.Y.; visualization, writing—original draft preparation: I.L. and N.S. All authors have read and agreed to the published version of the manuscript.

Funding

This research received no external funding.

Institutional Review Board Statement

Not applicable.

Informed Consent Statement

Not applicable.

Data Availability Statement

The original contributions presented in this study are included in the article. Further inquiries can be directed to the corresponding author.

Acknowledgments

We express our gratitude for the support provided by the Faculty of Science at Jan Evangelista Purkyně University in Ústí nad Labem, Czech Republic. Additionally, we acknowledge the use of computational resources made available by Metacentrum under the e-INFRA CZ (ID:90140), supported by the Ministry of Education, Youth, and Sports of the Czech Republic. Furthermore, we note that the Metacentrum wiki documentation has been transitioned to a new format and site as part of its integration into the e-INFRA CZ service.

Conflicts of Interest

The authors declare no conflicts of interest.

Abbreviations

The following abbreviations are used in this manuscript:
GOGene Ontology
BPBiological Process
MFMolecular Function
CCCellular Component
T2DMType 2 Diabetes Mellitus
CRCColorectal Cancer
CHAF1BChromosomal Assembly Factor 1B
LUADLung Adenocarcinoma
PPHPostpartum Hemorrhage
DPYDDihydropyrimidine Dehydrogenase
DEGsDifferentially Expressed Genes
TCGAThe Cancer Genome Atlas
CPMCounts Per Million
FDRFalse Discovery Rate
BHBenjamini–Hochberg
RFRandom Forest
SHAPShapley Additive Explanations

References

  1. He, C.; Liu, M.; Hsiang, S.; Pierce, N.; Megahed, S.; Godfrey, A. An Ontological Knowledge-Driven Smart Contract Framework for Implicit Bridge Preservation Decision Making. J. Constr. Eng. Manag. 2025, 151, 04025008. [Google Scholar] [CrossRef]
  2. Geerts, G.; O’Leary, D. ORSO: The Organizational Structure Ontology. Account. Rev. 2025, 100, 261–290. [Google Scholar] [CrossRef]
  3. Saxena, R.; Bishnoi, R.; Singla, D. Gene Ontology: Application and importance in functional annotation of the genomic data. In Bioinformatics: Methods and Applications; Academic Press: Cambridge, MA, USA, 2021; pp. 145–157. [Google Scholar] [CrossRef]
  4. Ashburner, M.; Ball, C.A.; Blake, J.A.; Botstein, D.; Butler, H.; Cherry, J.M.; Davis, A.P.; Dolinski, K.; Dwight, S.S.; Eppig, J.T.; et al. Gene ontology: Tool for the unification of biology. Nat. Genet. 2000, 25, 25–29. [Google Scholar] [CrossRef] [PubMed]
  5. Combes, F.; Loux, V.; Vandenbrouck, Y. GO Enrichment Analysis for Differential Proteomics Using ProteoRE. Methods Mol. Biol. 2021, 2361, 179–196. [Google Scholar] [CrossRef] [PubMed]
  6. Hassan, H.; Shanak, S. GOTrapper: A tool to navigate through branches of gene ontology hierarchy. BMC Bioinform. 2019, 20, 20. [Google Scholar] [CrossRef]
  7. Paplińska-Goryca, M.; Misiukiewicz-Stępień, P.; Wróbel, M.; Mycroft-Rzeszotarska, K.; Adamska, D.; Rachowka, J.; Królikowska, M.; Goryca, K.; Krenke, R. The impaired response of nasal epithelial cells to microplastic stimulation in asthma and COPD. Sci. Rep. 2025, 15, 4242. [Google Scholar] [CrossRef] [PubMed]
  8. Luo, S.; Zhu, Y.; Guo, Z.; Zheng, C.; Fu, X.; You, F.; Li, X. Exploring biomarkers and molecular mechanisms of Type 2 diabetes mellitus promotes colorectal cancer progression based on transcriptomics. Sci. Rep. 2025, 15, 4086. [Google Scholar] [CrossRef]
  9. Du, W.; Wu, X.W.; Li, Q.F.; Zhang, B.Y.; Wu, J.; Xu, Y.P.; Yi, X. Integrated bioinformatics and experimental analysis of CHAF1B as a novel biomarker and immunotherapy target in LUAD. Discov. Oncol. 2025, 16, 43. [Google Scholar] [CrossRef]
  10. Qu, J.; Jiang, H.; Shi, H.; Huang, N.; Su, J.; Zhang, Y.; Chen, L.; Zhao, Y. Novel predictive biomarkers for atonic postpartum hemorrhage as explored by proteomics and metabolomics. BMC Pregnancy Childbirth 2025, 25, 96. [Google Scholar] [CrossRef]
  11. Mahajan, P.; Fiehn, O.; Barupal, D. IDSL.GOA: Gene ontology analysis for interpreting metabolomic datasets. Sci. Rep. 2024, 14, 1299. [Google Scholar] [CrossRef]
  12. Wu, Y.; Wang, Z.; Yang, Y.; Han, C.; Wang, L.; Kang, K.; Zhao, A. Exploration of potential novel drug targets and biomarkers for small cell lung cancer by plasma proteomescreening. Front. Pharmacol. 2023, 14, 1266782. [Google Scholar] [CrossRef] [PubMed]
  13. Xu, D.; Yang, X.; Wu, W.; Yang, J. Identification of Novel Protein Biomarkers and Drug Targets for Acne Vulgaris by Integrating Human PlasmaProteome with Genome-Wide Association Data. J. Inflamm. Res. 2024, 17, 4431–4441. [Google Scholar] [CrossRef] [PubMed]
  14. Pomaznoy, M.; Ha, B.; Peters, B. GOnet: A tool for interactive Gene Ontology analysis. BMC Bioinform. 2018, 19, 470. [Google Scholar] [CrossRef]
  15. Hale, M.; Thapa, I.; Ghersi, D. FunSet: An open-source software and web server for performing and displaying Gene Ontology enrichmentanalysis. BMC Bioinform. 2019, 20, 359. [Google Scholar] [CrossRef]
  16. Volpato, M.; Hull, M.; Carr, I. GOTermViewer: Visualization of Gene Ontology Enrichment in Multiple Differential Gene Expression Analyses. Bioinform. Biol. Insights 2024, 18, 11779322241271550. [Google Scholar] [CrossRef]
  17. R Core Team. R: A Language and Environment for Statistical Computing; R Foundation for Statistical Computing: Vienna, Austria, 2024. [Google Scholar]
  18. Xu, S.; Hu, E.; Cai, Y.; Xie, Z.; Luo, X.; Zhan, L.; Tang, W.; Wang, Q.; Liu, B.; Wang, R.; et al. Using clusterProfiler to characterize multiomics data. Nat. Protoc. 2024, 19, 3292–3320. [Google Scholar] [CrossRef]
  19. Yu, G.; Wang, L.G.; Yan, G.R.; He, Q.Y. DOSE: An R/Bioconductor package for disease ontology semantic and enrichment analysis. Bioinformatics 2015, 31, 608–609. [Google Scholar] [CrossRef] [PubMed]
  20. Wu, T.; Hu, E.; Xu, S.; Chen, M.; Guo, P.; Dai, Z.; Feng, T.; Zhou, L.; Tang, W.; Zhan, L.I.; et al. clusterProfiler 4.0: A universal enrichment tool for interpreting omics data. Innovation 2021, 2, 100141. [Google Scholar] [CrossRef]
  21. Carlson, M. org.Hs.eg.db: Genome Wide Annotation for Human. R Package Version 3.20.0. Bioconductor. 2024. Available online: https://bioconductor.org/packages/org.Hs.eg.db (accessed on 10 April 2025).
  22. Durinck, S.; Spellman, P.T.; Birney, E.; Huber, W. biomaRt: Mapping identifiers for the integration of genomic datasets with the R/Bioconductor package. Bioinformatics 2009, 25, 526–528. [Google Scholar] [CrossRef]
  23. Haynes, W. Benjamini–Hochberg Method. In Encyclopedia of Systems Biology; Dubitzky, W., Wolkenhauer, O., Cho, K.H., Yokota, H., Eds.; Springer: New York, NY, USA, 2013; p. 78. [Google Scholar] [CrossRef]
  24. Alexa, A.; Rahnenführer, J.; Lengauer, T. Improved scoring of functional groups from gene expression data by decorrelating GO graph structure. Bioinformatics 2006, 22, 1600–1607. [Google Scholar] [CrossRef]
  25. Wang, H.; Len, L.; Hu, L.; Hu, Y. Combining machine learning and single-cell sequencing to identify key immune genes in sepsis. Sci. Rep. 2025, 15, 1557. [Google Scholar] [CrossRef] [PubMed]
  26. Mahmoud, A.; Takaoka, E. An enhanced machine learning approach with stacking ensemble learner for accurate liver cancer diagnosis using feature selection and gene expression data. Healthc. Anal. 2025, 7, 100373. [Google Scholar] [CrossRef]
  27. Li, C.; Hao, R.; Li, C.; Liu, L.; Ding, Z. Integration of single-cell and bulk RNA sequencing data using machine learning identifies oxidative stress-related genes LUM and PCOLCE2 as potential biomarkers for heart failure. Int. J. Biol. Macromol. 2025, 300, 140793. [Google Scholar] [CrossRef] [PubMed]
  28. R Core Team. Stats: The R Stats Package; R Package Version 4.3.1; R Core Team: Vienna, Austria, 2024. [Google Scholar]
  29. Gross, J.; Ligges, U. Nortest: Tests for Normality, R Package Version 1.0-4; 2022. Available online: https://CRAN.R-project.org/package=nortest (accessed on 10 April 2025).
Figure 1. Distribution of cancer types in the TCGA dataset: number of samples in each category.
Applsci 15 04471 g001
Figure 2. Step-by-step workflow for gene expression data preprocessing and normalization.
Applsci 15 04471 g002
Figure 3. Gene Ontology-based pipeline for identifying statistically significant genes.
Applsci 15 04471 g003
Figure 4. Distribution of p-values from Fisher’s exact test (X-axis) and the Kolmogorov–Smirnov test (Y-axis) for enriched GO terms in various GO categories: (a) Biological Process, (b) Molecular Function, and (c) Cellular Component.
Applsci 15 04471 g004
Figure 5. (Left) Gene set sizes across GO categories: BP, MF, CC, their union (genes significant in at least one category), and their intersection (genes significant in all categories). (Right) Venn diagram illustrating the overlaps between significant gene subsets across the three GO categories.
Applsci 15 04471 g005
Figure 6. Performance metrics by class across GO-based gene subsets.
Applsci 15 04471 g006
Figure 7. Overall classification performance for different GO-based gene subsets.
Applsci 15 04471 g007
Table 1. Hyperparameters optimized via Bayesian search for the random forest classifier.
#HyperparameterSearch RangeDescriptionOptimized Value
1Number of Trees ( n _ e s t i m a t o r s )10–200Total trees in the ensemble50
2Maximum Depth ( m a x _ d e p t h )1–20Limits tree depth to avoid overfitting14
3Min. Samples to Split ( m i n _ s a m p l e s _ s p l i t )2–10Minimum number of samples to split a node9
4Min. Samples per Leaf ( m i n _ s a m p l e s _ l e a f )1–4Minimum number of samples in a terminal node4
5Max. Features ( m a x _ f e a t u r e s )0.1–1.0Fraction of features used for splitting0.113
6Bootstrap Sampling ( b o o t s t r a p ){True, False}Enables sampling with replacementTrue
7Split Criterion ( c r i t e r i o n ){Gini, entropy}Function to measure split qualityEntropy
Disclaimer/Publisher’s Note: The statements, opinions and data contained in all publications are solely those of the individual author(s) and contributor(s) and not of MDPI and/or the editor(s). MDPI and/or the editor(s) disclaim responsibility for any injury to people or property resulting from any ideas, methods, instructions or products referred to in the content.

