Abstract
The clinical diagnosis of Parkinson’s disease (PD) primarily relies on clinician-administered observational assessment tools, such as the Unified Parkinson’s Disease Rating Scale (UPDRS). However, these approaches are significantly influenced by subjectivity and exhibit insufficient sensitivity for early-stage symptom detection. The introduction of deep learning techniques has opened new avenues for the early diagnosis of PD. In contrast to traditional methods, deep learning models are capable of processing large-scale, high-dimensional, and complex datasets to automatically learn latent feature relationships, making them particularly suitable for scenarios involving multimodal data fusion. The multimodal diagnosis of PD is confronted with two enduring challenges: (1) the dependence on pre-existing knowledge of established genetic risk loci, and (2) the low efficiency and limited interpretability in handling interactions among cross-modal features. To address these challenges, this study introduces an innovative multimodal deep learning framework with two primary contributions: (1) a Genome-Wide Association Study (GWAS)-Transformer architecture that autonomously selects single nucleotide polymorphism (SNP) features through GWAS and utilizes a multi-head attention mechanism to model potential associations between non-risk loci, thereby eliminating the reliance on known susceptibility genes; (2) a Residual Attention Contrastive Fusion (RACF) module that tackles the heterogeneity of cross-modal features by dynamically allocating attention weights and applying contrastive loss constraints. Evaluation results on the Parkinson’s Progression Markers Initiative (PPMI) dataset demonstrate that our model achieves a classification accuracy of 91.2% and an AUC of 0.94, and predicts nine potential novel risk loci. This work presents a novel paradigm for the discovery of new risk loci based on deep learning and offers valuable insights from a multi-omics perspective for advancing PD research.
1. Introduction
Parkinson’s disease (PD), also known as paralysis agitans, is a prevalent neurodegenerative disorder with an increasing incidence worldwide. Epidemiological data indicate that more than 10 million individuals are affected by PD, and its prevalence has more than doubled in the past 25 years, making it the second most common neurodegenerative disease after Alzheimer’s disease (AD) [1,2,3]. The core clinical symptoms of PD include bradykinesia, resting tremor, muscle rigidity, and postural instability [4]. Traditionally, the diagnosis of PD has relied heavily on clinician-administered observational assessments, such as the Unified Parkinson’s Disease Rating Scale (UPDRS) [5] or handwriting analysis [6]. However, these traditional methods are limited by significant inter-rater variability, temporal inconsistencies in symptom assessment, and insufficient sensitivity for detecting early-stage or prodromal manifestations of the disease.
With the advancement of biomedical technologies, objective biomarker-driven tools such as electroencephalography (EEG) [7], magnetoencephalography (MEG), structural and functional magnetic resonance imaging (sMRI and fMRI) [8], and positron emission tomography (PET) [9] are increasingly integrated into clinical practice. These modalities complement conventional clinical assessments by quantifying neuroelectrical activity, anatomical morphology, and functional/metabolic dynamics, thereby elevating diagnostic precision. However, neurodegenerative disorders like PD and AD cause irreversible neural damage, underscoring the critical need for early identification and intervention. Genetic biomarkers, particularly single nucleotide polymorphisms (SNPs), offer molecular-level insights that enable pre-symptomatic risk stratification and personalized therapeutic planning, effectively bridging the gap between macroscopic imaging findings and subclinical pathological processes.
In this study, we hypothesize that a deep learning framework integrating SNP profiles with sMRI data could establish a robust multimodal diagnostic paradigm for PD. SNPs capture disease-associated genetic susceptibility at the molecular scale, while sMRI detects macroscale neuroanatomical alterations, forming complementary cross-scale analytical dimensions. By leveraging artificial intelligence technology, it may not only enhance diagnostic accuracy but also decipher latent genotype-phenotype correlations, potentially uncovering novel biomarkers for disease progression monitoring.
The evolution of deep learning technologies has redefined intelligent decision-making paradigms in medical practice, catalyzing a precision medicine revolution that shifts from experience-driven to data-driven approaches while markedly enhancing end-to-end efficacy in disease prediction, diagnosis, and therapeutic intervention. In melanoma detection, Cirrincione et al. [10] employed a vision transformer-based approach for classifying skin lesions, achieving notable accuracy in distinguishing malignant cases. Similarly, breast cancer diagnostics have benefited from machine learning techniques applied to mammography images, where advanced feature extraction and classification methods significantly improved diagnostic precision [11]. Within PD diagnosis, deep learning methods have emerged as particularly effective tools. Convolutional neural networks (CNNs), for instance, have excelled in analyzing 2D MRI slices for PD detection [12]. Further innovations include Solana-Lavalle et al. [13], who combined voxel-based morphometry with classifier ensembles to enhance diagnostic reliability, and Sangeetha et al. [14], who enhanced robustness through architectural optimization of CNNs paired with median filtering. Kaplan et al. [15] advanced this field further with their automated model, NP-PHOG-MFSMCIMV, which leveraged multi-dimensional feature analysis of brain MRI data to achieve precise symptom classification.
In terms of multimodal strategies, Karthigeyan et al. [16] developed a stacked classifier combining MRI and genetic data, enabling simultaneous identification of pathological brain regions and associated risk genes. Building on this paradigm, Li et al. [17] proposed PIDGN, a multimodal deep learning framework that employs a Transformer architecture and 3D ResNet18 for feature extraction, coupled with a dynamic gated attention mechanism to fuse multimodal features, achieving both accurate early diagnosis and model interpretability. Similarly, Bi et al. [18] introduced the CERNNE method, which integrates fMRI and SNP data, using a clustering evolution random neural network ensemble to automatically select PD-related features, thereby improving patient identification and disease cause prediction accuracy. Together, these studies highlight the transformative potential of multimodal integration in unraveling the biological complexity of PD and advancing diagnostic precision.
While existing methods have advanced PD diagnosis, two critical challenges remain unresolved and require optimization: persistent dependence on predefined genetic loci and ongoing limitations in static multimodal fusion strategies. To overcome these limitations, this study proposes the Residual Attention Contrastive Fusion (RACF) network, an interpretable deep learning framework designed to integrate Genome-Wide Association Study (GWAS)-prescreened SNPs with structural MRI features for PD diagnosis. The framework introduces two methodological innovations. First, it establishes a priori-agnostic SNP analysis paradigm that synergizes GWAS-based filtering with transformer architectures to model non-linear genetic interactions, eliminating dependency on predefined loci. Second, it implements dynamic cross-modal fusion through attention mechanisms and contrastive learning, enabling adaptive weighting of genetic-neuroanatomical relationships while mitigating static fusion limitations. The model incorporates dual interpretability pathways using SHapley Additive exPlanations (SHAP) values and Gradient-weighted Class Activation Mapping (Grad-CAM) to decode genetic epistasis effects and neuroimaging biomarkers. Validated against existing models, RACF demonstrates superior diagnostic accuracy. The primary contribution of this study lies in creating a novel unified framework that concurrently addresses three critical challenges in neurodegeneration diagnostics: disentangling genetic epistasis complexity, optimizing multimodal fusion dynamics, and bridging the clinical interpretability gap—thereby advancing both mechanistic understanding and translational applications.
2. Materials and Methods
2.1. Dataset and Preprocessing
The study utilized a multimodal dataset from the Parkinson’s Progression Markers Initiative (PPMI), comprising 424 samples (285 PD patients, 139 healthy controls) with both sMRI and SNP data. Table 1 summarizes demographic characteristics.

Table 1.
Demographic characteristics of participants.
2.1.1. SNP Preprocessing
Raw SNP data from NeuroX arrays underwent quality control using PLINK: removing SNPs with missingness , samples with genotyping rate , sex chromosomes, mitochondrial SNPs, and variants with MAF or Hardy-Weinberg equilibrium p-value . Genotype imputation was performed via the Sanger Imputation Server (SHAPEIT2 phasing, Minimac4 imputation), retaining high-confidence SNPs (INFO ). Post-quality control, 442 samples were retained, with 424 samples having matched sMRI data.
2.1.2. MRI Preprocessing
The T1-weighted sMRI data used in this study underwent a comprehensive preprocessing pipeline to ensure both image quality and spatial consistency, in line with the requirements of deep learning models. Initially, the raw images in DICOM format were converted to NIFTI format using the dcm2niix tool, which preserved the original scanning parameters and geometric information. Following this, the converted images underwent N4 bias field correction using the SimpleITK library. This iterative correction process effectively removed low-frequency intensity biases caused by magnetic field inhomogeneities, thereby enhancing the contrast between gray matter and white matter.
Next, skull stripping was performed using the Brain Extraction Tool (BET) from the ANTs toolkit. This procedure removed the skull and non-brain tissues, leaving only the brain parenchyma for further analysis. A hybrid segmentation approach was employed, combining template-based atlas matching with adaptive thresholding, ensuring that the brain parenchyma was accurately preserved while generating a binary mask for subsequent steps.
The skull-stripped images were then spatially normalized by registering them to the Colin27 standard template space using FSL’s FLIRT tool. This step involved applying rigid-body transformation and utilizing mutual information as the similarity metric. The images were resampled to an isotropic resolution of mm3 to achieve precise anatomical correspondence across all subjects. To ensure intensity uniformity, which is critical for computational analysis, we performed whole-brain signal scaling followed by cross-channel normalization, thereby standardizing input characteristics for optimal model convergence during network training.
Finally, to ensure consistency in the dimensions of the input data for the deep learning model, the images were resampled from their original size of to using bilinear interpolation. This resampling step preserved important anatomical details while generating standardized three-dimensional brain images suitable for model input.
2.2. Feature Extraction Networks
2.2.1. SNP Feature Extraction
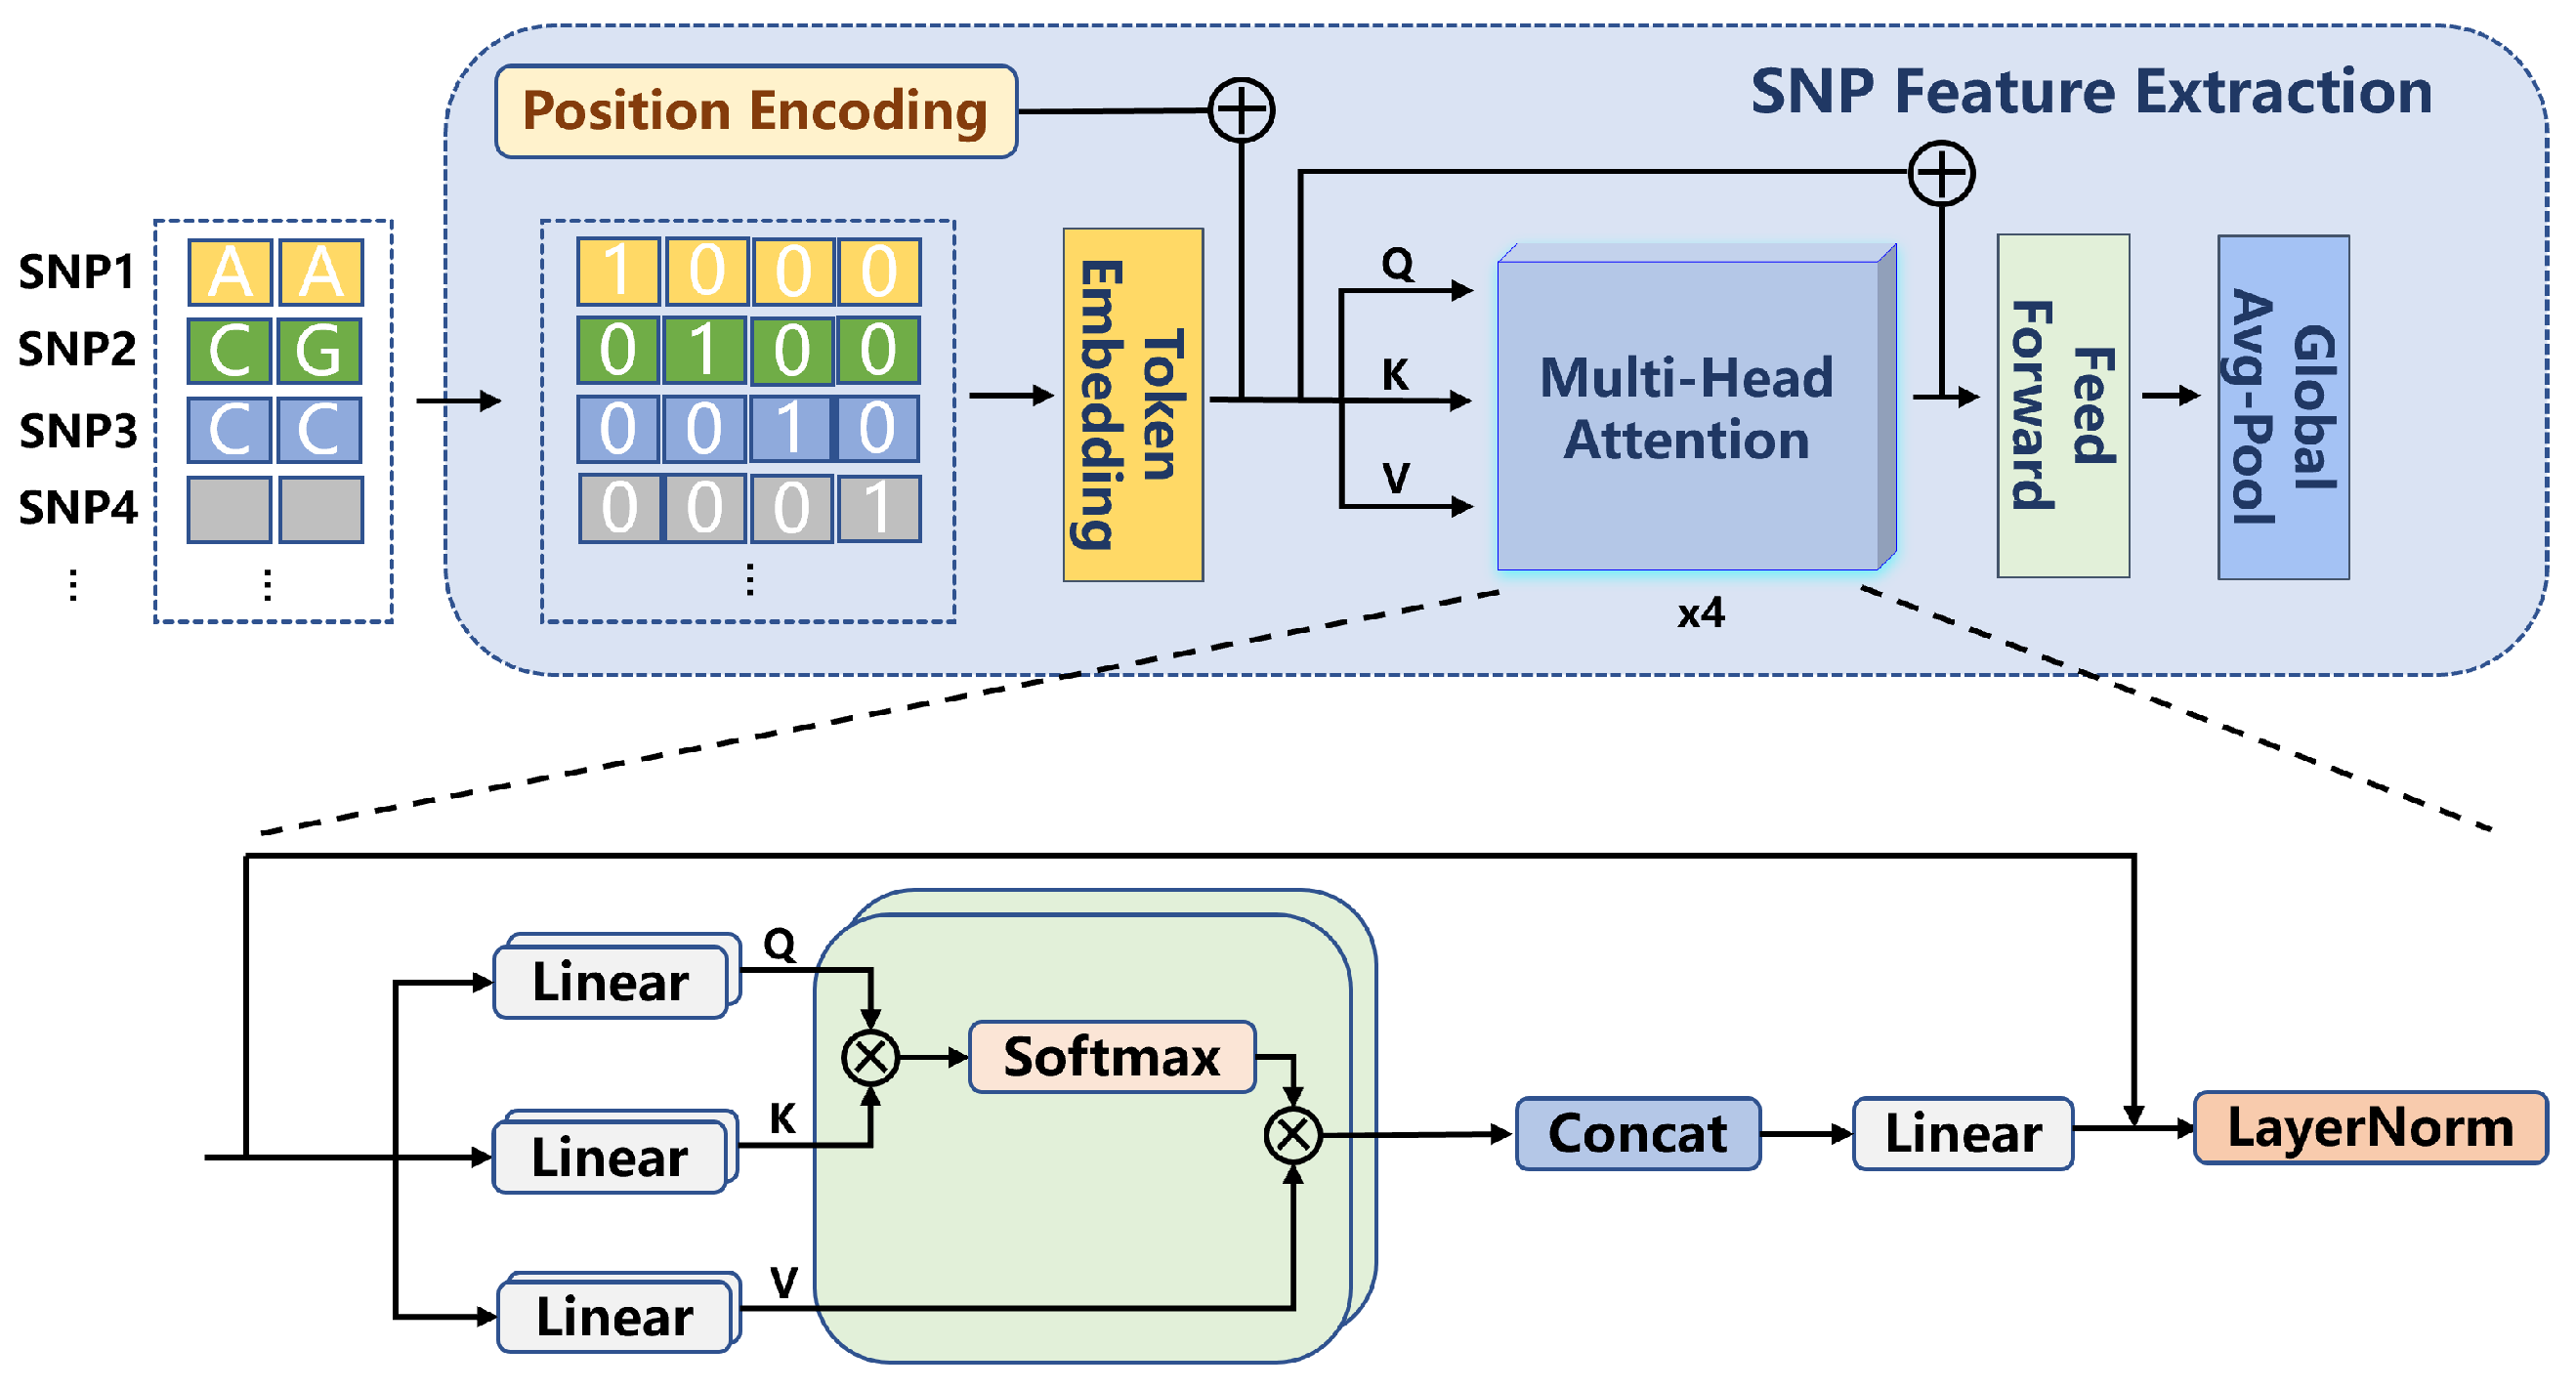
In this study, the extraction of SNP features was performed using a Transformer-based network. First, the SNP data underwent pre-screening using the GWAS approach, retaining SNP loci with p-values smaller than . The selected SNP data were then converted into 4D one-hot encoded vectors with a format of , where B represents the batch size, 434 corresponds to the number of filtered SNP loci, and 4 indicates the four possible allele states at each locus. The input SNP features were subsequently processed through a one-dimensional convolutional layer, generating embedded representations (embeddings). This convolutional layer, utilizing a sliding window approach, processed the input data, enabling the network to capture local patterns within the SNP features. The output from the convolutional layer was then fed into a positional encoding and multi-head attention mechanism module for further processing. The process is shown in Formula (1).
Positional encoding is employed to encode the positional information of SNP loci, enabling the model to capture the relative positional relationships between SNPs. This section utilizes an attention mechanism with a dimension of and two attention heads. By using multi-head attention, the model is able to model subspaces of different features, thereby enhancing its ability to perceive interactions between SNP loci. As shown in Formula (2), this mechanism enables the network to capture complex dependencies among the SNPs.
After processing through the multi-head attention layer, the model applies a Global Average Pooling operation to generate the final extracted SNP features. The entire feature extraction process is illustrated in Figure 1.
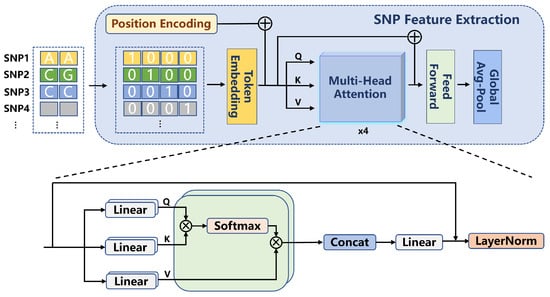
Figure 1.
SNP Feature Extraction Architecture Diagram.
2.2.2. MRI Feature Extraction
The feature extraction from MRI images was performed using a 3D DenseNet network. This network consists of four dense blocks, with each block internally connected through transition layers. The convolutional layers within each dense block facilitate feature reuse by sharing feature maps, which further enhances the network’s ability to extract deep-level features from the images. After passing through the four dense blocks, the final extracted features are generated through a Global Average Pooling operation. These features are then used for subsequent multimodal data fusion and classification tasks. Global Average Pooling computes the average across all spatial locations of each channel, producing output features of fixed dimensions. The MRI feature extraction process is shown in Figure 2.
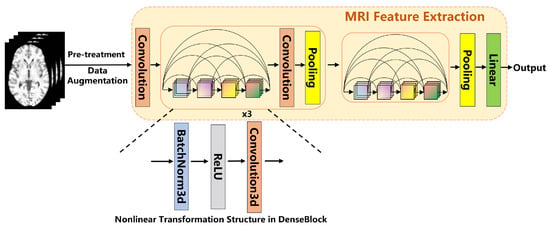
Figure 2.
MRI Feature Extraction Architecture Diagram.
To increase data diversity and mitigate the risk of overfitting, data augmentation techniques were applied to the MRI images in this study. The augmentation methods included random affine transformations ( translation/rotation), Gaussian noise (), and intensity shifts (). These augmentation strategies artificially increase the variability of the data, helping the model generalize better to unseen examples.
2.3. Multimodal Fusion Strategy
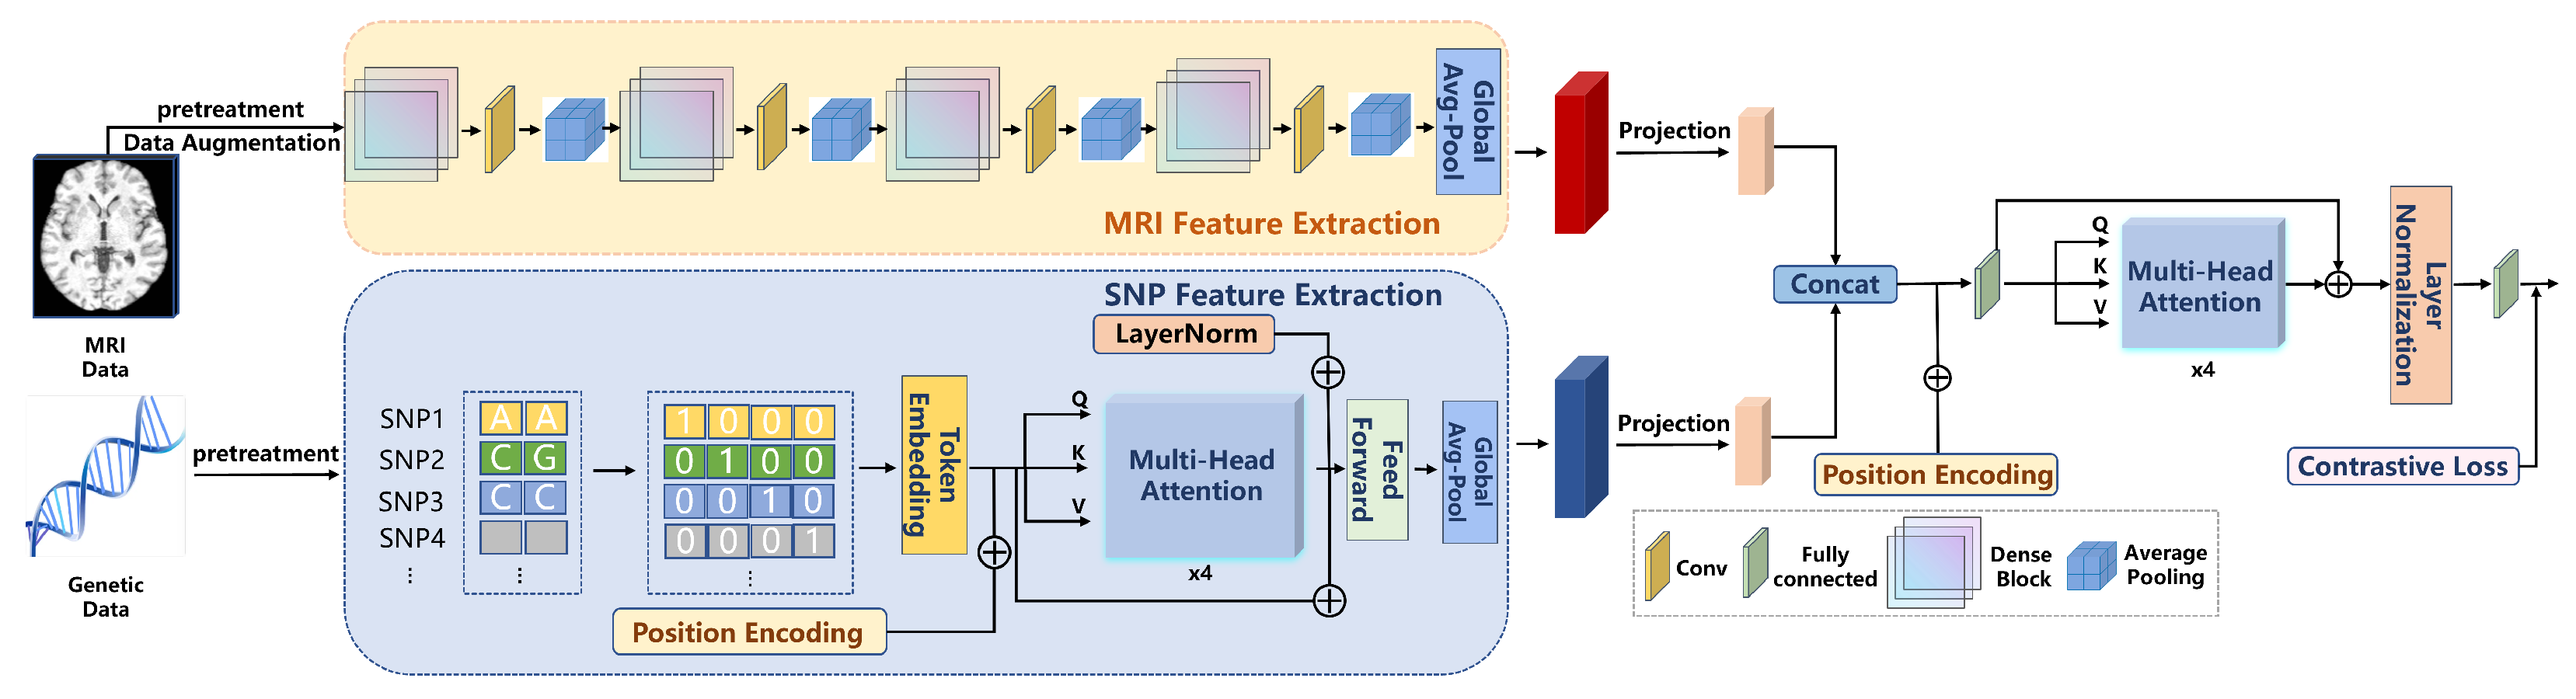
The multimodal deep learning framework (RACF) in this study employs an advanced fusion strategy that effectively combines SNP and MRI data, thereby enhancing the performance of PD classification. The fusion strategy within this framework primarily consists of feature alignment, cross-modal attention mechanisms, and contrastive learning. Through the collaborative operation of these modules, the model is able to better capture the latent associations between the different modalities. The entire experimental flowchart is shown in Figure 3.
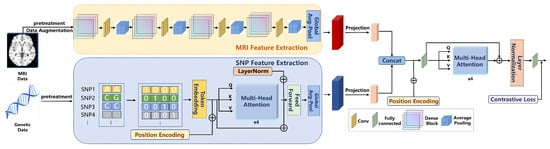
Figure 3.
The flowchart of the RACF model.
Feature Alignment: In the initial stage, the features from SNP and MRI data are aligned through linear projection. Since the feature dimensions of SNP data and MRI images differ, a linear transformation is applied to map them into a unified feature space. This ensures that the features from both modalities can be fused at the same level. This process can be expressed mathematically as shown in Formula (3).
Cross-modal Attention Mechanism: After feature alignment, the model concatenates the SNP and MRI features to form a joint feature representation. The concatenated features are then processed using a 4-head attention mechanism, employing a multi-head attention strategy to model the interactions between the different modalities. The attention mechanism allows the model to assign varying weights to the features from each modality, thereby focusing on the most crucial information for the classification task, which further enhances the performance of the model. This process is illustrated in Formula (4).
Contrastive Learning: During the fusion stage, we also introduce a contrastive learning module, which maps the features to a shared space through projection heads and optimizes the model using contrastive loss. This approach enables the model to effectively learn both the common and discriminative features across different modalities. Contrastive learning facilitates the fine-grained fusion of features between modalities, enhancing the model’s ability to perceive latent disease characteristics. The contrastive loss function is shown in Formula (5).
2.4. Training and Evaluation
In this study, the model was trained using the Adam optimizer and cross-entropy loss function, as shown in Formula (6). The training process was implemented using PyTorch (version 2.0), ensuring optimal utilization of GPU acceleration. All experiments were conducted on four NVIDIA RTX 4090 GPUs (24GB VRAM each) with a batch size of 16, an initial learning rate of , and 100 training epochs, resulting in a total training duration of 15 h.
To evaluate the performance of the model, a five-fold cross-validation strategy was employed. This approach allows for an effective assessment of the generalization ability of the RACF model, ensuring its stability across different data splits. During the evaluation process, the classification performance of the model was comprehensively measured using metrics such as accuracy, AUC, F1-score, as well as precision and recall.
2.5. Comparative Experiments
To comprehensively validate the RACF framework, we conducted multi-level comparisons: (1) single-modal baselines; (2) traditional machine learning methods (SVM, RF, XGBoost, MLP) with feature concatenation; (3) state-of-the-art multimodal frameworks, including the static feature weighting model of Kanyal et al. [19] and the hybrid deep learning–traditional ML approach of Sheng et al. [20]; (4) a comparison with the PIDGN framework [17], which adopts a dynamic feature fusion strategy through dynamic gated attention mechanisms.
3. Experimental Results
3.1. Model Performance and Method Comparison
The RACF proposed in this study demonstrated significant advantages in the classification task of PD versus healthy controls. Under five-fold cross-validation, the RACF model achieved an accuracy of 91.2% and an AUC of 0.94. In comparison to the Transformer network using only SNP data (accuracy of 80.1%) and the 3D DenseNet model using only MRI features (accuracy of 84.1%), RACF substantially enhanced classification performance. Table 2 compares the classification performance of single-modality and multimodal models under identical experimental conditions.
Table 2.
Classification performance comparison between single-modality and multimodal models.
In comparison to traditional machine learning methods, such as SVM, RF, XGBoost (XGB), and MLP, our proposed approach demonstrates superior performance. The accuracies of these traditional methods are 74.9%, 71.1%, 76.4%, and 80.9%, respectively. This performance gap may primarily be attributed to the inefficient handling of cross-modal heterogeneity in feature concatenation strategies.
Moreover, RACF exhibited clear advantages when compared to current multimodal frameworks. The static weighted fusion model proposed by Kanyal et al. and the hybrid network by Sheng et al. demonstrated inferior classification performance compared to RACF. In terms of key evaluation metrics such as accuracy, AUC, precision, and F1 score, RACF outperformed both models. For instance, the model of Kanyal et al. achieved an accuracy of 86.4%, while the model of Sheng et al. reached 82.7%. In contrast, the accuracy of RACF was 91.2%, highlighting its superiority in handling multimodal data. PIDGN, which uses a dynamic feature fusion strategy through a gated attention mechanism, also showed strong performance with an accuracy of 89.5%. However, RACF still outperformed PIDGN across all key evaluation metrics, including accuracy, precision, recall, F1 score, and AUROC. Specifically, PIDGN achieved an accuracy of 89.5%, while RACF achieved 91.2%, demonstrating the better ability of RACF to leverage multimodal data and improve classification performance. Table 3 presents a detailed comparison of the classification performance of different models on multimodal data. RACF excels across all evaluation metrics, achieving an accuracy of 91.2%, precision of 85.9%, recall of 89.5%, F1 score of 94.3%, and AUROC of 0.941.
Table 3.
Classification performance of different models on multimodal data.
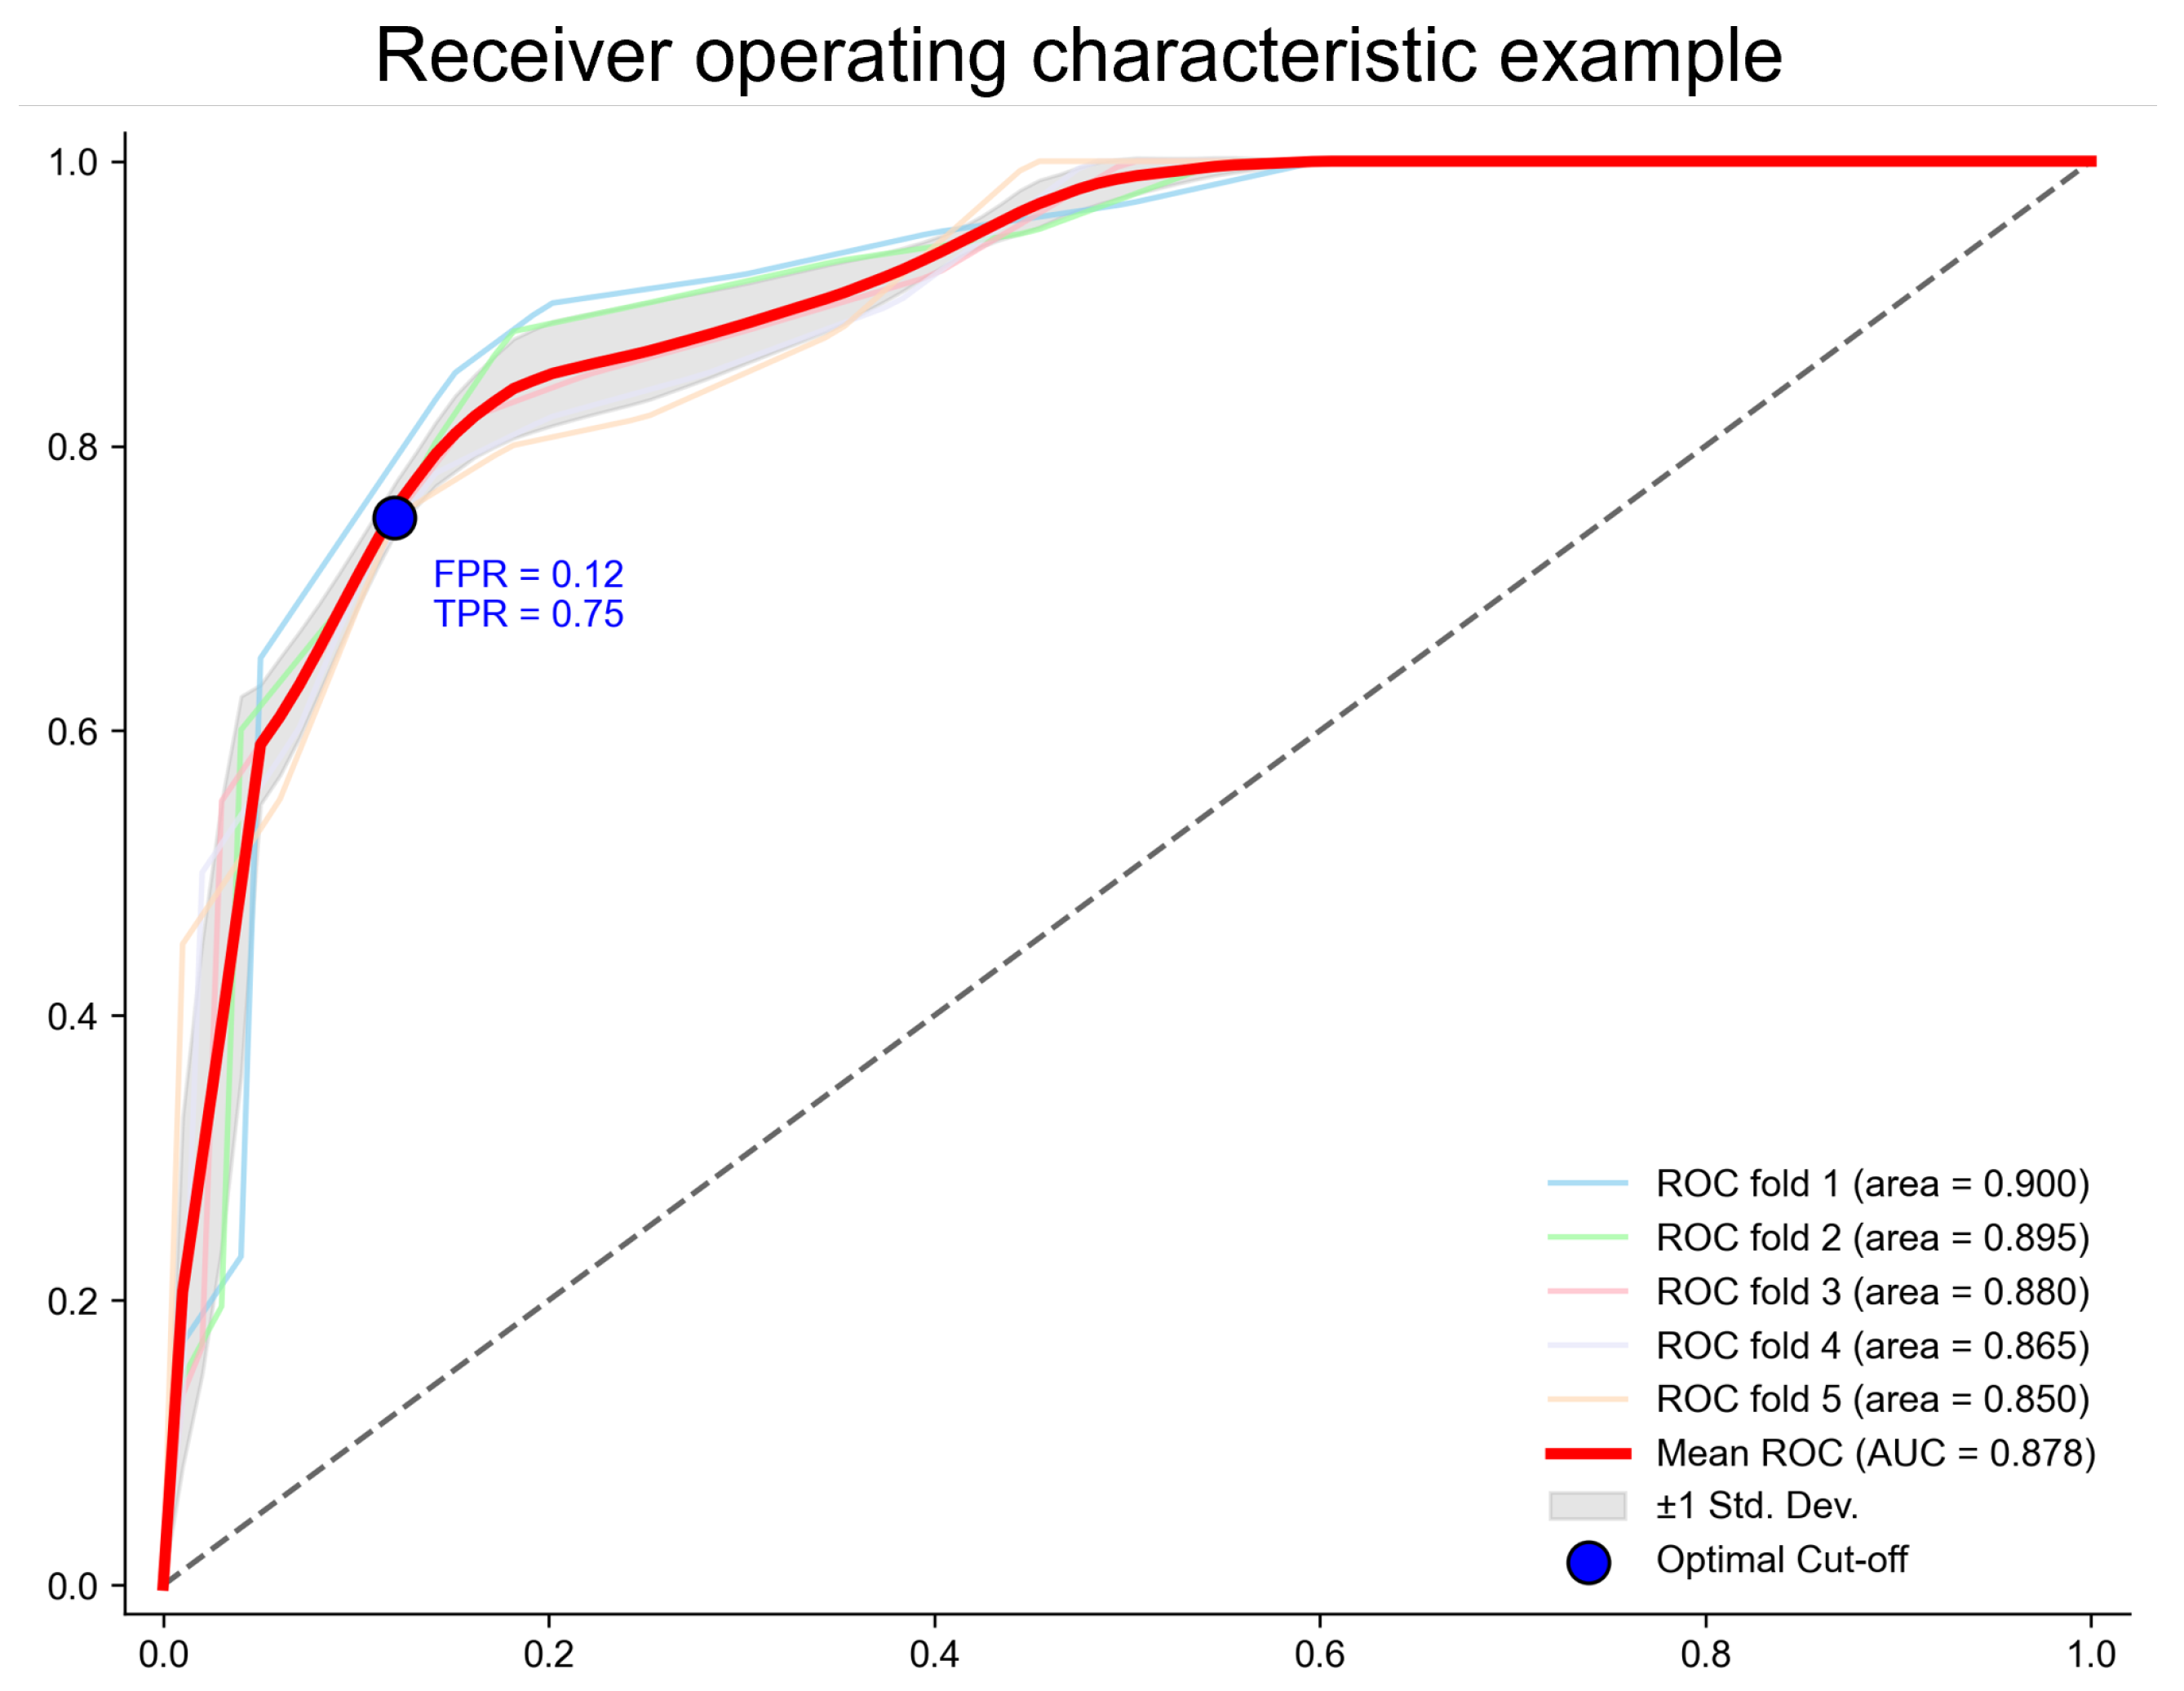
To further validate the stability and robustness of the RACF model, Figure 4 presents five independent ROC curves from the five-fold cross-validation. These curves nearly overlap, indicating that RACF exhibits consistent stability across different training and testing data splits, demonstrating a strong generalization ability.
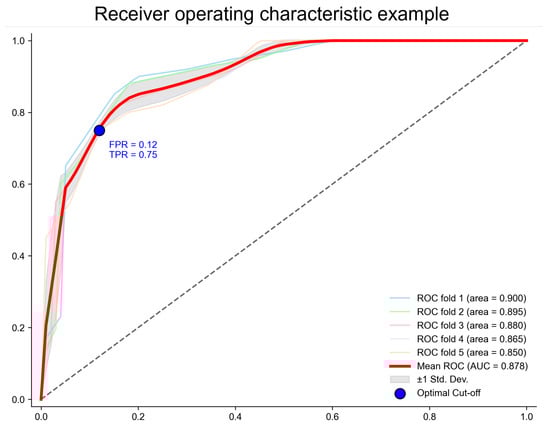
Figure 4.
The ROC curve of the RACF model evaluated using five-fold cross-validation. The points on the ROC curve correspond to the cut-off points that maximize Youden’s index. The values represent Youden’s index at these points, along with the coordinates on the curve. The x-axis represents the false positive rate (FPR = 1 − specificity), and the y-axis represents the true positive rate (TPR = sensitivity).
3.2. Abnormal Brain Regions and Pathogenic Gene Analysis
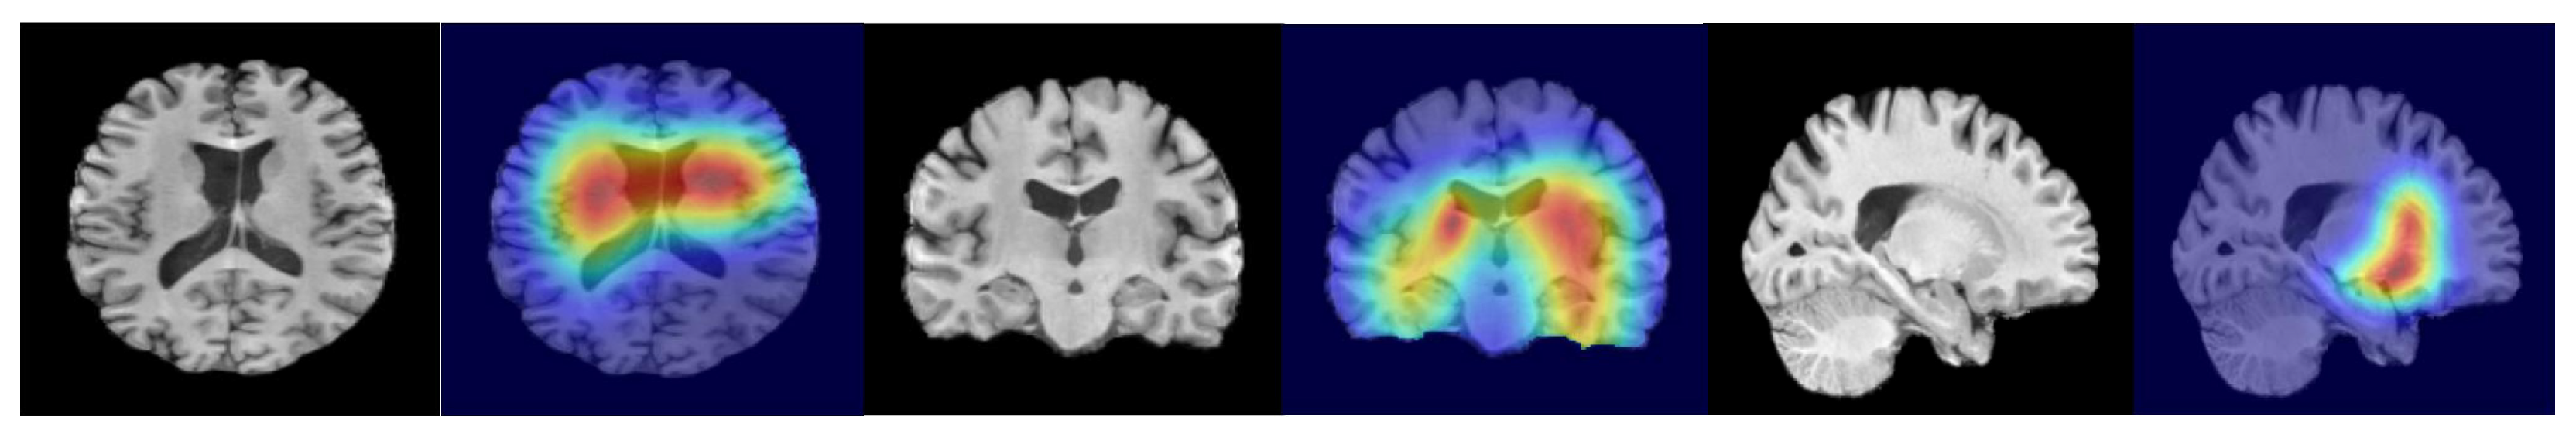
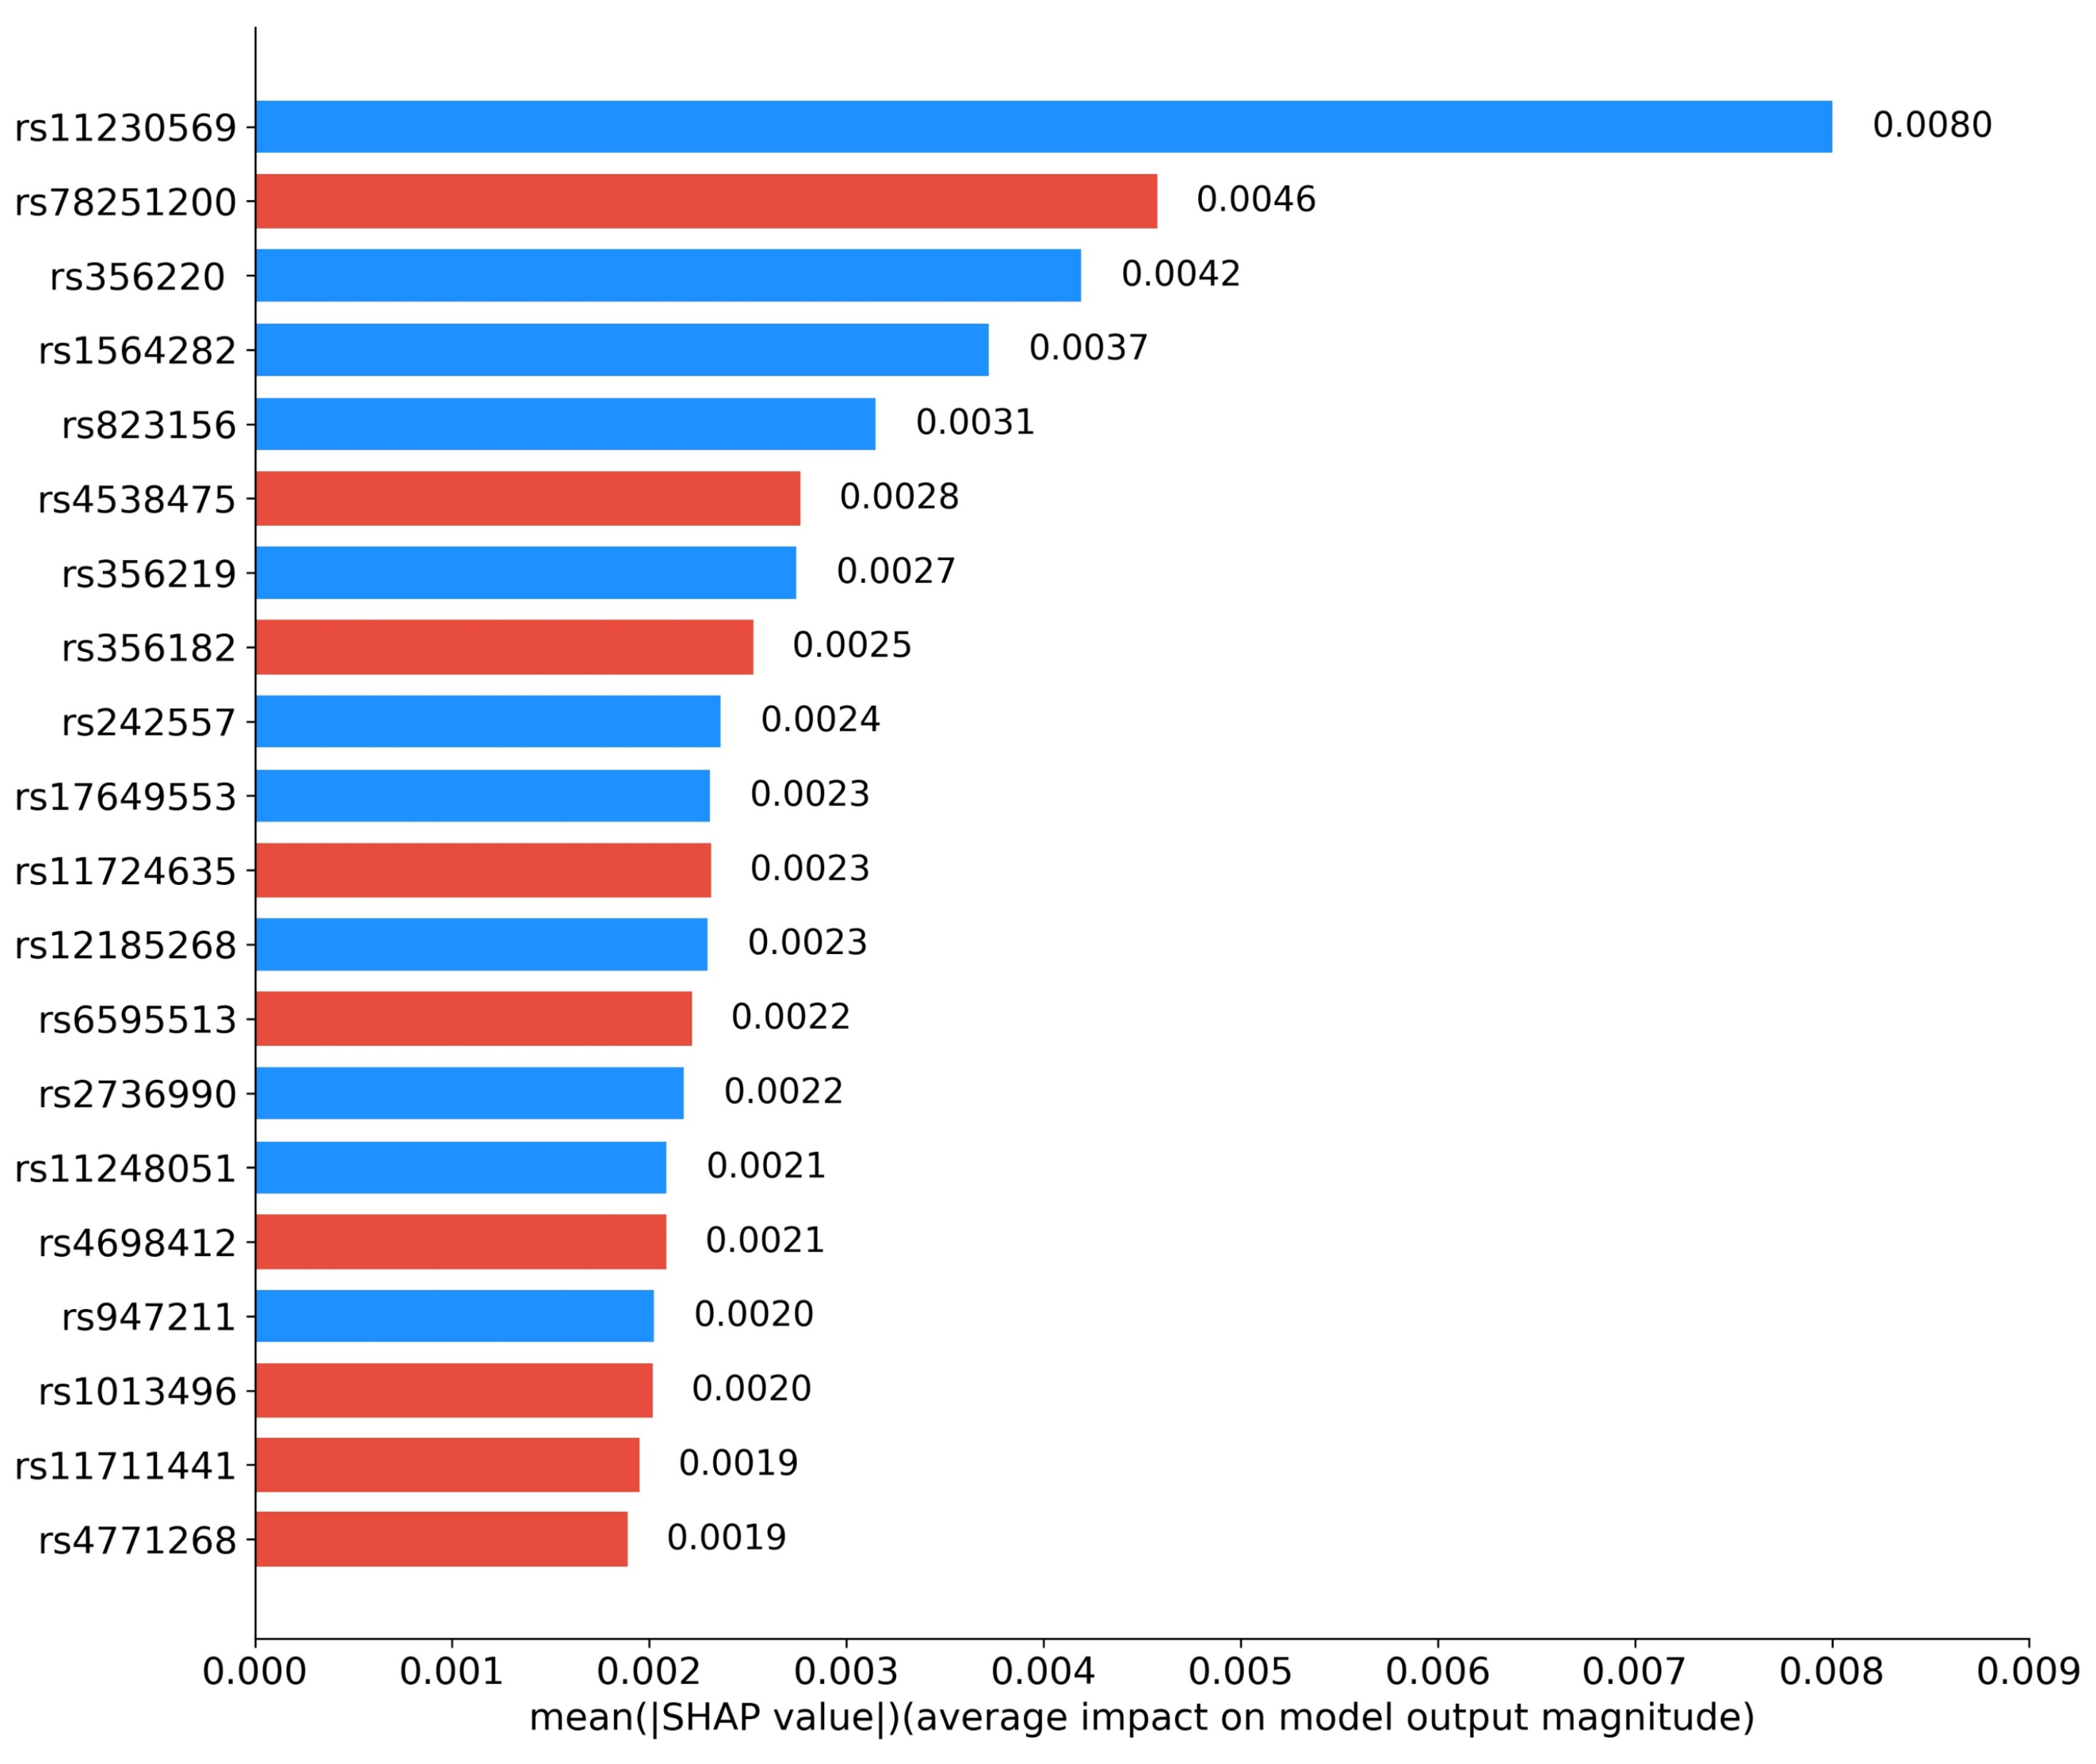
We further investigated the interpretability of RACF in PD diagnosis. By utilizing Grad-CAM, we visualized the key brain regions in sMRI images that drive the predictions of the model. Figure 5 highlights these critical regions, with the model primarily focusing on the basal ganglia and substantia nigra, particularly the caudate nucleus and globus pallidus within the basal ganglia. Figure 6 presents the SHAP value analysis, identifying the top 20 SNPs that contribute the most to the classification decision. In the figure, blue represents SNPs that have been reported in existing studies, while red indicates SNPs predicted as risk loci by our method. Among the top 20 SNPs ranked by SHAP values, rs11230569, rs356220, rs1564282, rs823156, rs356219, rs242557, rs17649553, rs12185268, rs2736990, rs11248051, and rs947211 are all known PD-related loci reported in the literature. rs78251200, rs4538475, rs356228, rs11724635, rs6595513, rs4698412, rs1013496, rs11711441, and rs4771268 are potential risk loci predicted by the RACF model.
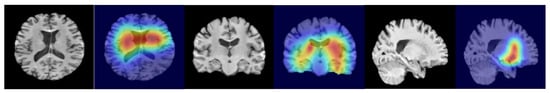
Figure 5.
The activation map for predicting “PD,” showing a slice from three different directions of a randomly selected sample. The highlighted areas correspond to the central regions of the brain, which roughly align with the areas of core pathological changes.

Figure 6.
Top 20 contributing SNPs by RACF model for PD. Blue: reported SNPs; Red: newly predicted risk loci.
The key SNP loci identified through SHAP value analysis were further annotated using the ANNOVAR tool (https://annovar.openbioinformatics.org, accessed on 20 January 2025), with the detailed results provided in Table 4. From the table, it is evident that the biological functions of most selected SNP loci align closely with the core pathological mechanisms of PD.
Table 4.
Gene annotation of top 20 SNPs using ANNOVAR.
3.3. Ablation Studies
Ablation experiments were conducted to validate the necessity of each module in the RACF model. According to the experimental results presented in Table 5, the removal of the contrastive learning module led to a significant drop in model accuracy, highlighting the critical role of contrastive learning in cross-modal semantic alignment. Without this module, the model was unable to effectively constrain feature consistency between different modalities, which consequently impaired classification performance. After the removal of the residual connection, the accuracy decreased by 19.5%, and the recall rate dropped from 0.895 to 0.735, emphasizing the importance of this module in mitigating the gradient vanishing problem. The absence of the residual connection made the training process more challenging, as gradient updates were constrained, resulting in a substantial performance decline.
Table 5.
Ablation Study Results.
Furthermore, when the feature fusion module was replaced with simple feature concatenation, the model’s performance nearly collapsed, with the F1 score dropping to only 0.641. This indicates the necessity of the attention mechanism and residual design for heterogeneous feature fusion. Simple feature concatenation was insufficient to adequately handle data from different modalities, which hindered the ability of the model to capture cross-modal information effectively, severely affecting the final classification results.
In contrast, the complete RACF model demonstrated excellent performance across all evaluation metrics. These results highlight the strong performance of the model in multimodal fusion tasks. Particularly in handling cross-modal features from SNP and MRI data, RACF was able to fully exploit the correlations between the two, providing precise support for PD diagnosis.
4. Discussion
4.1. Advantages and Innovations of the RACF Framework for Multimodal Fusion
The proposed RACF network demonstrates significant performance advantages in the multimodal diagnosis of PD. First, in the extraction of SNP features, the GWAS-Transformer architecture unbiasedly selects significantly associated SNP loci through GWAS, overcoming the traditional reliance on known risk loci. Combined with the MultiHead-Attention mechanism, the model dynamically captures nonlinear interactions between SNP loci, such as the potential regulatory relationship between rs356220 (SNCA gene) and rs947211 (PARK16 gene). Secondly, in the extraction of MRI features, the modified 3D DenseNet121 network captures multiscale brain structure features through dense connections and transition layers, while the data augmentation strategy enhances the robustness of the model. The preprocessing pipeline ensures the input of standardized brain images. For the cross-modal fusion strategy, RACF performs feature alignment through dynamic attention mechanisms (Formula (4)) and contrastive learning (Formula (5)), utilizing a 4-head attention mechanism to compute interaction weights. Finally, residual connections are incorporated to alleviate the vanishing gradient problem. The contrastive learning module maximizes inter-modal consistency using cosine similarity, effectively mitigating the heterogeneity of feature spaces. Experimental results show that RACF can extract rich information from both genetic and imaging data, effectively fuse them, and successfully differentiate PD patients from normal controls in the PPMI dataset.
Compared with unimodal models and existing methods, the proposed multimodal feature fusion method performs better. In the interpretability analysis, the top 20 SNP loci selected by SHAP values include 11 known loci (e.g., rs11230569, rs356220) and 9 novel loci (e.g., rs78251200, rs4538475). The Grad-CAM heatmaps clearly highlight the basal ganglia and substantia nigra regions, particularly key areas such as the caudate nucleus and globus pallidus within the basal ganglia (Figure 5). These regions show a high degree of correspondence with the distribution of Lewy bodies in Braak staging and the areas of metabolic abnormalities observed in PET scans, further validating the pathological relevance and the accuracy of the decision-making process of the model [25].
4.2. Biological Validation from Genetic and Imaging Perspectives
4.2.1. Genetic Analysis
In this study, among the top 20 SNP loci selected through SHAP value analysis, in addition to the 11 risk loci previously reported, 9 potential risk loci predicted by the RACF model were identified (rs78251200, rs4538475, rs356182, rs11724635, rs6595513, rs4698412, rs1013496, rs11711441, rs4771268). The gene functions associated with these loci are highly correlated with the pathological mechanisms of PD, particularly in key pathways such as neuroinflammation, energy metabolism disruption, and synaptic plasticity, suggesting their potential pathogenic roles.
Among the previously reported risk loci, rs11230569 and rs823156, located in SLC41A1, encode magnesium ion transport proteins that regulate intracellular magnesium ion concentration. Chronic magnesium deficiency may lead to the loss of dopaminergic neurons in the substantia nigra, exacerbating synaptic pathology [26]. The loci rs356220, rs356219, and rs2736990 are situated in the core regulatory region of SNCA, which encodes -synuclein. Variants in these loci may disrupt synaptic vesicle transport in dopaminergic neurons, leading to neurodegenerative changes [27]. Furthermore, rs242557, rs17649553, and rs12185268 are located in MAPT, which encodes tau protein. Abnormal phosphorylation of tau is a hallmark of neurofibrillary tangles in Lewy bodies and is significantly associated with the loss of dopaminergic neurons in the substantia nigra [28,29]. Rs947211 in PARK16 regulates the RAB7L1 protein, which influences synaptic vesicle transport efficiency. Dysfunction in this process may result in impaired synaptic transmission, thereby accelerating the progression of PD [30]. Additionally, rs1564282 and rs11248051 in GAK may influence the development of PD by modulating -synuclein degradation and other cellular functions [31].
Although the potential loci predicted by the RACF model have not been explicitly reported in existing literature, their annotated gene functions may also be closely related to PD pathogenesis. For instance, rs78251200 in SAAL1 is thought to be involved in the regulation of the secretion of the inflammatory cytokine IL-6, which is elevated in the substantia nigra of PD patients. Increased IL-6 levels may activate the JAK-STAT signaling pathway, promoting -synuclein aggregation and ultimately leading to dopaminergic neuron death [32]. This suggests that SAAL1 may contribute to the early pathological processes of PD by modulating the neuroinflammatory microenvironment. Additionally, rs4538475, rs11724635, and rs4698412 are located in BST1, which encodes CD38, a key regulator of NAD+ metabolism. Dysfunction of BST1 may influence PD progression [33]. Notably, rs4538475 is located in the promoter region of BST1, suggesting that it may regulate gene expression levels through epigenetic modifications, thereby amplifying its pathological effects. Moreover, rs11711441 is located in the MCCC1/LAMP3 locus. MCCC1 may regulate leucine metabolism and mitochondrial function, whereas LAMP3 may modulate autophagic flux through lysosome-associated membrane proteins [34]. These two genes may act synergistically to exacerbate neuronal energy metabolism disorders, further accelerating PD progression. Lastly, rs4771268 in MBNL2 may influence the expression of proteins related to synaptic plasticity by regulating mRNA alternative splicing [35]. Dysfunction in this process may significantly reduce dopamine transmission efficiency, thereby impairing synaptic maturation, which may promote PD progression.
The biological functions of these newly predicted loci are highly consistent with the core pathological mechanisms of PD, such as neuroinflammation, mitochondrial dysfunction, and protein homeostasis imbalance. Although the direct association between these loci and PD has not been reported in existing literature, functional annotation and pathway analysis suggest that these loci may influence disease progression by modulating key molecular networks. Future studies utilizing genetically engineered model systems could systematically interrogate the functional contributions of these loci while mechanistically delineating their roles in PD pathogenesis, thereby providing orthogonal validation of the detection sensitivity and predictive architecture inherent in our proposed computational framework through experimental biological evidence.
4.2.2. Imaging Analysis
The imaging explainability analysis in this study, conducted using the Grad-CAM technique, revealed key brain regions that the model focuses on in sMRI images (Figure 5). The results show that the regions most significantly activated by the model are concentrated in the basal ganglia (particularly the caudate nucleus and globus pallidus) and the substantia nigra pars compacta. These regions exhibit pathological changes that are highly consistent with the core pathological mechanisms of PD, further validating the biological plausibility of the RACF model’s localized predictions. A deeper analysis of the brain regions identified by the model is presented below, considering typical pathological features and imaging findings in PD.
The basal ganglia are a central component of the cortical-basal ganglia-thalamic circuit, and their dysfunction directly leads to PD motor symptoms, such as bradykinesia and tremor [36]. In this study, the model’s strong focus on the caudate nucleus and globus pallidus (Figure 5) is closely associated with the significant reduction of dopaminergic input to the basal ganglia in PD patients. The caudate nucleus, as part of the striatum, receives dopaminergic projections from the substantia nigra pars compacta, and its volume reduction and decreased metabolism have been confirmed as early markers of PD in multiple imaging studies [37]. For example, studies using Diffusion Tensor Imaging (DTI) have shown that PD patients exhibit a significant decline in white matter integrity in the caudate nucleus, which correlates negatively with UPDRS motor scores [38]. The globus pallidus, as an output nucleus of the basal ganglia, may become over-activated and exacerbate motor dysfunction by inhibiting the thalamocortical pathway. This phenomenon is reflected in resting-state functional MRI (fMRI) studies, where increased functional connectivity between the globus pallidus and motor cortex has been observed in PD patients [39]. The findings of the model align with these previous observations, suggesting that RACF is capable of capturing the critical contributions of structural and functional abnormalities in the basal ganglia to PD diagnosis.
The progressive loss of dopaminergic neurons in the substantia nigra pars compacta is the most prominent pathological feature of PD [4]. The activation observed in the substantia nigra by the model (Figure 5) is directly associated with increased iron deposition and volume shrinkage in this region in PD patients. Quantitative Susceptibility Mapping (QSM) analysis has shown that the magnetic susceptibility values in the substantia nigra of PD patients are approximately 30% higher than in healthy controls, and this increase is significantly correlated with disease severity [40]. Furthermore, ultrastructural changes in the substantia nigra, such as the reduction of neuromelanin, can be detected by neuromelanin-sensitive MRI (NM-MRI), with signal intensity reductions corresponding to the early pathological stages in the Braak staging system [41]. The model’s focus on the substantia nigra may reflect its sensitivity to neurodegenerative changes, which aligns with post-mortem studies showing that dopaminergic neuron loss in the substantia nigra can reach 45% in PD patients [42].
The results from the imaging analysis in this study have significant clinical translational potential. First, the model’s specific focus on the basal ganglia and substantia nigra could provide imaging targets for the early diagnosis of PD. For example, combining measurements of substantia nigra volume (using tools such as FreeSurfer) with functional connectivity analysis of the caudate nucleus could lead to the development of more sensitive PD diagnostic models [43]. Second, dynamic changes in these regions could serve as biomarkers for disease progression. Longitudinal studies have shown that the degree of atrophy in the caudate nucleus of PD patients is significantly higher than that of healthy controls [44].
4.3. Study Limitations and Future Directions
While the RACF framework has exhibited strong performance in PD diagnosis, several opportunities for refinement remain. First, the current validation using 424 PPMI samples, while statistically robust, underscores the inherent challenges of obtaining paired MRI-SNP datasets in clinical practice. While stratified cross-validation partially addresses this limitation, future studies should prioritize expanding the dataset through multi-cohort collaborations incorporating longitudinal data across diverse populations to enhance generalizability. Second, although the framework effectively integrates structural MRI and SNP data, we aim to extend its capabilities by systematically incorporating clinical progression markers, such as UPDRS scores and olfactory testing results, and leveraging Graph Neural Networks (GNNs) to model biomarker association networks, thereby improving disease staging precision. Finally, external validation across diverse populations, particularly in multi-ethnic cohorts with varying disease trajectories, remains imperative to ensure broad clinical applicability.
5. Conclusions
This study presents a novel multimodal framework, named RACF, which integrates SNP and sMRI data to achieve high-accuracy classification for PD diagnosis. The core strengths of this approach are reflected in three key aspects:
- Unbiased SNP Feature Extraction: In the genetic feature extraction stage, the GWAS-Transformer architecture enables unbiased SNP screening without relying on prior knowledge of known risk loci.
- Cross-Modal Fusion Strategy: The proposed residual-attention contrastive fusion strategy facilitates the efficient fusion of multimodal features, fully leveraging the complementary nature of SNP and sMRI data, thereby significantly enhancing classification performance.
- Interpretable Risk Locus Discovery: By analyzing the contribution of model decisions, the framework successfully identifies potential PD-associated risk loci. These findings provide novel insights into the genetic mechanisms of PD and validate the interpretability advantages of RACF.
The RACF framework demonstrates significant potential not only for PD diagnosis and classification but also for broader applications in neurodegenerative disease research. The methodology of multimodal deep learning, as exemplified by RACF, can be extended to other disorders, offering a promising paradigm for early diagnosis and precise classification in complex diseases through the integration of heterogeneous data modalities.
Author Contributions
Conceptualization, J.C.; methodology, J.C.; investigation, J.C.; writing—original draft preparation, J.C.; review and editing, X.L. All authors have read and agreed to the published version of the manuscript.
Funding
This work was supported by the National Key R&D Program of China (2021ZD0200401, 2023YFC2410504), the Shenzhen Science and Technology Program (JCYJ20241202124922031), and the Guangdong Provincial Key Laboratory of Multimodality Non-Invasive Brain–Computer Interfaces (2024B1212010010).
Institutional Review Board Statement
Not applicable.
Informed Consent Statement
Not applicable.
Data Availability Statement
Restrictions apply to the availability of these data. Data are available from https://www.ppmi-info.org/ (last accessed on 8 February 2025).
Acknowledgments
We would like to acknowledge the support of the Michael J. Fox Foundation for allowing access to available data from the PPMI.
Conflicts of Interest
The authors declare no conflicts of interest.
References
- Tysnes, O.B.; Storstein, A. Epidemiology of Parkinson’s Disease. J. Neural Transm. 2017, 124, 901–905. [Google Scholar] [CrossRef] [PubMed]
- Tolosa, E.; Garrido, A.; Scholz, S.W.; Poewe, W. Challenges in the Diagnosis of Parkinson’s Disease. Lancet Neurol. 2021, 20, 385–397. [Google Scholar] [CrossRef]
- De Virgilio, A.; Greco, A.; Fabbrini, G.; Inghilleri, M.; Rizzo, M.I.; Gallo, A.; Conte, M.; Rosato, C.; Appiani, M.C.; de Vincentiis, M. Parkinson’s Disease: Autoimmunity and Neuroinflammation. Autoimmun. Rev. 2016, 15, 1005–1011. [Google Scholar] [CrossRef]
- Poewe, W.; Seppi, K.; Tanner, C.M.; Halliday, G.M.; Brundin, P.; Volkmann, J.; Schrag, A.E.; Lang, A.E. Parkinson Disease. Nat. Rev. Dis. Prim. 2017, 3, 17013. [Google Scholar] [CrossRef]
- Goetz, C.G.; Tilley, B.C.; Shaftman, S.R.; Stebbins, G.T.; Fahn, S.; Martinez-Martin, P.; Poewe, W.; Sampaio, C.; Stern, M.B.; Dodel, R.; et al. Movement Disorder Society-Sponsored Revision of the Unified Parkinson’s Disease Rating Scale (MDS-UPDRS): Scale Presentation and Clinimetric Testing Results. Mov. Disord. 2008, 23, 2129–2170. [Google Scholar] [CrossRef]
- Gupta, U.; Bansal, H.; Joshi, D. An Improved Sex-Specific and Age-Dependent Classification Model for Parkinson’s Diagnosis Using Handwriting Measurement. Comput. Methods Programs Biomed. 2020, 189, 105305. [Google Scholar] [CrossRef]
- Giannopoulos, A.E.; Zioga, I.; Papageorgiou, P.C.; Kapsali, F.; Spantideas, S.T.; Kapsalis, N.C.; Capsalis, C.N.; Kontoangelos, K.; Papageorgiou, C.C. Early auditory-evoked potentials in body dysmorphic disorder: An ERP/sLORETA study. Psychiatry Res. 2021, 299, 113865. [Google Scholar] [CrossRef]
- Rangaprakash, D.; Tadayonnejad, R.; Deshpande, G.; O’Neill, J.; Feusner, J.D. FMRI hemodynamic response function (HRF) as a novel marker of brain function: Applications for understanding obsessive-compulsive disorder pathology and treatment response. Brain Imaging Behav. 2021, 15, 1622–1640. [Google Scholar] [CrossRef] [PubMed]
- Wu, C.; Li, F.; Niu, G.; Chen, X. PET imaging of inflammation biomarkers. Theranostics 2013, 3, 448. [Google Scholar] [CrossRef]
- Cirrincione, G.; Cannata, S.; Cicceri, G.; Prinzi, F.; Currieri, T.; Lovino, M.; Militello, C.; Pasero, E.; Vitabile, S. Transformer-based approach to melanoma detection. Sensors 2023, 23, 5677. [Google Scholar] [CrossRef]
- Bektaş, B.; Emre, İ.E.; Kartal, E.; Gulsecen, S. Classification of mammography images by machine learning techniques. In Proceedings of the 2018 3rd International Conference on Computer Science and Engineering (UBMK), Sarajevo, Bosnia and Herzegovina, 20–23 September 2018; IEEE: New York, NY, USA, 2018; pp. 580–585. [Google Scholar]
- Chakraborty, S.; Aich, S.; Kim, H.C. Detection of Parkinson’s Disease from 3T T1 Weighted MRI Scans Using 3D Convolutional Neural Network. Diagnostics 2020, 10, 402. [Google Scholar] [CrossRef]
- Solana-Lavalle, G.; Rosas-Romero, R. Classification of PPMI MRI Scans with Voxel-Based Morphometry and Machine Learning to Assist in the Diagnosis of Parkinson’s Disease. Comput. Methods Programs Biomed. 2021, 198, 105793. [Google Scholar] [CrossRef]
- Sangeetha, S.; Baskar, K.; Kalaivaani, P.C.D.; Kumaravel, T. Deep Learning-Based Early Parkinson’s Disease Detection from Brain MRI Image. In Proceedings of the 2023 7th International Conference on Intelligent Computing and Control Systems (ICICCS), Madurai, India, 17–19 May 2023; pp. 490–495. [Google Scholar]
- Kaplan, E.; Altunisik, E.; Firat, Y.E.; Barua, P.D.; Dogan, S.; Baygin, M.; Demir, F.B.; Tuncer, T.; Palmer, E.; Tan, R.S.; et al. Novel Nested Patch-Based Feature Extraction Model for Automated Parkinson’s Disease Symptom Classification Using MRI Images. Comput. Methods Programs Biomed. 2022, 224, 107030. [Google Scholar] [CrossRef] [PubMed]
- Karthigeyan, C.M.T.; Rani, C. Optimizing Parkinson’s Disease Diagnosis with Multimodal Data Fusion Techniques. Inf. Technol. Control 2024, 53, 262–279. [Google Scholar] [CrossRef]
- Li, W.; Rao, Q.; Dong, S.; Zhu, M.; Yang, Z.; Huang, X.; Liu, G. PIDGN: An Explainable Multimodal Deep Learning Framework for Early Prediction of Parkinson’s Disease. J. Neurosci. Methods 2025, 110363. [Google Scholar] [CrossRef] [PubMed]
- Bi, X.A.; Hu, X.; Xie, Y.; Wu, H. A Novel CERNNE Approach for Predicting Parkinson’s Disease-Associated Genes and Brain Regions Based on Multimodal Imaging Genetics Data. Med. Image Anal. 2021, 67, 101830. [Google Scholar] [CrossRef]
- Kanyal, A.; Mazumder, B.; Calhoun, V.D.; Preda, A.; Turner, J.; Ford, J.; Ye, D.H. Multi-Modal Deep Learning from Imaging Genomic Data for Schizophrenia Classification. Front. Psychiatry 2024, 15, 1384842. [Google Scholar] [CrossRef]
- Sheng, J.; Xin, Y.; Zhang, Q.; Wang, L.; Yang, Z.; Yin, J. Predictive Classification of Alzheimer’s Disease Using Brain Imaging and Genetic Data. Sci. Rep. 2022, 12, 2405. [Google Scholar] [CrossRef]
- Hearst, M.A.; Dumais, S.T.; Osuna, E.; Platt, J.; Scholkopf, B. Support Vector Machines. IEEE Intell. Syst. Their Appl. 1998, 13, 18–28. [Google Scholar] [CrossRef]
- Breiman, L. Random Forests. Mach. Learn. 2001, 45, 5–32. [Google Scholar] [CrossRef]
- Chen, T.; Guestrin, C. Xgboost: A Scalable Tree Boosting System. In Proceedings of the 22nd ACM SIGKDD International Conference on Knowledge Discovery and Data Mining, San Francisco, CA, USA, 13–17 August 2016; pp. 785–794. [Google Scholar]
- Popescu, M.C.; Balas, V.E.; Perescu-Popescu, L.; Mastorakis, N. Multilayer Perceptron and Neural Networks. WSEAS Trans. Circuits Syst. 2009, 8, 579–588. [Google Scholar]
- Gu, S.C.; Ye, Q.; Yuan, C.X. Metabolic Pattern Analysis of 18F-FDG PET as a Marker for Parkinson’s Disease: A Systematic Review and Meta-Analysis. Rev. Neurosci. 2019, 30, 743–756. [Google Scholar] [CrossRef] [PubMed]
- Bai, Y.; Dong, L.; Huang, X.; Zheng, S.; Qiu, P.; Lan, F. Associations of rs823128, rs1572931, and rs823156 Polymorphisms with Reduced Parkinson’s Disease Risks. Neuroreport 2017, 28, 936–941. [Google Scholar] [CrossRef]
- Guo, X.Y.; Chen, Y.P.; Song, W.; Zhao, B.; Cao, B.; Wei, Q.Q.; Ou, R.W.; Yang, Y.; Yuan, L.X.; Shang, H.F. SNCA Variants rs2736990 and rs356220 as Risk Factors for Parkinson’s Disease but Not for Amyotrophic Lateral Sclerosis and Multiple System Atrophy in a Chinese Population. Neurobiol. Aging 2014, 35, 2882.e1–2882.e6. [Google Scholar] [CrossRef]
- Compta, Y.; Ezquerra, M.; Muñoz, E.; Tolosa, E.; Valldeoriola, F.; Rios, J.; Cámara, A.; Fernández, M.; Buongiorno, M.T.; Marti, M.J. High Cerebrospinal Tau Levels Are Associated with the rs242557 Tau Gene Variant and Low Cerebrospinal β-Amyloid in Parkinson Disease. Neurosci. Lett. 2011, 487, 169–173. [Google Scholar] [CrossRef]
- Chen, Z.; Wu, B.; Li, G.; Zhou, L.; Zhang, L.; Liu, J. MAPT rs17649553 T Allele is Associated with Better Verbal Memory and Higher Small-World Properties in Parkinson’s Disease. Neurobiol. Aging 2023, 129, 219–231. [Google Scholar] [CrossRef]
- Xia, H.; Luo, Q.; Li, X.X.; Yang, X.L. Association between PARK16 Gene Polymorphisms and Susceptibility of Parkinson’s Disease in a Chinese Population. Genet. Mol. Res. 2015, 14, 2978–2985. [Google Scholar] [CrossRef]
- Chen, Y.P.; Song, W.; Huang, R.; Chen, K.; Zhao, B.; Li, J.; Yang, Y.; Shang, H.F. GAK rs1564282 and DGKQ rs11248060 Increase the Risk for Parkinson’s Disease in a Chinese Population. J. Clin. Neurosci. 2013, 20, 880–883. [Google Scholar] [CrossRef]
- Mogi, M.; Harada, M.; Narabayashi, H.; Inagaki, H.; Minami, M.; Nagatsu, T. Interleukin (IL)-1β, IL-2, IL-4, IL-6 and Transforming Growth Factor-α Levels Are Elevated in Ventricular Cerebrospinal Fluid in Juvenile Parkinsonism and Parkinson’s Disease. Neurosci. Lett. 1996, 211, 13–16. [Google Scholar] [CrossRef]
- Saad, M.; Lesage, S.; Saint-Pierre, A.; Corvol, J.C.; Zelenika, D.; Lambert, J.C.; Vidailhet, M.; Mellick, G.D.; Lohmann, E.; Durif, F.; et al. Genome-Wide Association Study Confirms BST1 and Suggests a Locus on 12q24 as the Risk Loci for Parkinson’s Disease in the European Population. Hum. Mol. Genet. 2011, 20, 615–627. [Google Scholar] [CrossRef]
- Li, N.N.; Tan, E.K.; Chang, X.L.; Mao, X.Y.; Zhao, D.M.; Zhang, J.H.; Liao, Q.; Peng, R. MCCC1/LAMP3 Reduces Risk of Sporadic Parkinson’s Disease in Han Chinese. Acta Neurol. Scand. 2013, 128, 136–139. [Google Scholar] [CrossRef] [PubMed]
- Zhao, A.; Li, Y.; Niu, M.; Li, G.; Luo, N.; Zhou, L.; Kang, W.; Liu, J. SNPs in SNCA, MCCC1, DLG2, GBF1 and MBNL2 Are Associated with Parkinson’s Disease in Southern Chinese Population. J. Cell. Mol. Med. 2020, 24, 8744–8752. [Google Scholar] [CrossRef]
- Griffanti, L.; Rolinski, M.; Szewczyk-Krolikowski, K.; Menke, R.A.; Filippini, N.; Zamboni, G.; Jenkinson, M.; Hu, M.T.; Mackay, C.E. Challenges in the Reproducibility of Clinical Studies with Resting State fMRI: An Example in Early Parkinson’s Disease. NeuroImage 2016, 124, 704–713. [Google Scholar] [CrossRef] [PubMed]
- Vaillancourt, D.E.; Spraker, M.B.; Prodoehl, J.; Abraham, I.; Corcos, D.M.; Zhou, X.J.; Comella, C.L.; Little, D.M. High-Resolution Diffusion Tensor Imaging in the Substantia Nigra of De Novo Parkinson Disease. Neurology 2009, 72, 1378–1384. [Google Scholar] [CrossRef]
- Zheng, Z.; Shemmassian, S.; Wijekoon, C.; Kim, W.; Bookheimer, S.Y.; Pouratian, N. DTI Correlates of Distinct Cognitive Impairments in Parkinson’s Disease. Hum. Brain Mapp. 2014, 35, 1325–1333. [Google Scholar] [CrossRef]
- Wu, T.; Long, X.; Wang, L.; Hallett, M.; Zang, Y.; Li, K.; Chan, P. Functional Connectivity of Cortical Motor Areas in the Resting State in Parkinson’s Disease. Hum. Brain Mapp. 2011, 32, 1443–1457. [Google Scholar] [CrossRef]
- Chen, Q.; Chen, Y.; Zhang, Y.; Wang, F.; Yu, H.; Zhang, C.; Jiang, Z.; Luo, W. Iron Deposition in Parkinson’s Disease by Quantitative Susceptibility Mapping. BMC Neurosci. 2019, 20, 1–8. [Google Scholar] [CrossRef]
- Cassidy, C.M.; Zucca, F.A.; Girgis, R.R.; Baker, S.C.; Weinstein, J.J.; Sharp, M.E.; Bellei, C.; Valmadre, A.; Vanegas, N.; Kegeles, L.S.; et al. Neuromelanin-Sensitive MRI as a Noninvasive Proxy Measure of Dopamine Function in the Human Brain. Proc. Natl. Acad. Sci. USA 2019, 116, 5108–5117. [Google Scholar] [CrossRef]
- Fearnley, J.M.; Lees, A.J. Ageing and Parkinson’s Disease: Substantia Nigra Regional Selectivity. Brain 1991, 114, 2283–2301. [Google Scholar] [CrossRef]
- Rohrer, J.D.; Lashley, T.; Schott, J.M.; Warren, J.E.; Mead, S.; Isaacs, A.M.; Beck, J.; Hardy, J.; De Silva, R.; Warrington, E.; et al. Clinical and Neuroanatomical Signatures of Tissue Pathology in Frontotemporal Lobar Degeneration. Brain 2011, 134, 2565–2581. [Google Scholar] [CrossRef]
- Grahn, J.A.; Parkinson, J.A.; Owen, A.M. The Cognitive Functions of the Caudate Nucleus. Prog. Neurobiol. 2008, 86, 141–155. [Google Scholar] [CrossRef]

Disclaimer/Publisher’s Note: The statements, opinions and data contained in all publications are solely those of the individual author(s) and contributor(s) and not of MDPI and/or the editor(s). MDPI and/or the editor(s) disclaim responsibility for any injury to people or property resulting from any ideas, methods, instructions or products referred to in the content. |
© 2025 by the authors. Licensee MDPI, Basel, Switzerland. This article is an open access article distributed under the terms and conditions of the Creative Commons Attribution (CC BY) license (https://creativecommons.org/licenses/by/4.0/).