Abstract
This study was conducted at a fixed monitoring site in the southern dump of the large-scale Antaibao open-pit coal mine of China Coal Pingshuo, using long-term monitoring methods. Based on data from 2019 and 2024 in the reclaimed area of the Pingshuo open-pit coal mine, all seedlings and saplings within the Robinia pseudoacacia L. + Ulmus pumila L. + Ailanthus altissima (Mill.) Swingle mixed forests were studied to analyze changes in their abundance and the driving factors influencing their survival rates from 2019 to 2024. The main conclusions are as follows: (1) The species composition of seedlings and saplings remained unchanged but the number of seedlings increased significantly. The majority of newly recruited seedlings were U. pumila., accounting for 92.22% of the total new seedlings, whereas R. pseudoacacia had the highest mortality rate among seedlings. The distribution patterns of seedling-to-sapling transition, sapling-to-tree transition, and seedling–sapling mortality were generally consistent with the overall distribution of seedlings and saplings at the community level. (2) At both the community and species levels, the optimal models for seedling and sapling survival were the height model and the biological factor model. Overall, survival rates of both seedlings and saplings showed a significant positive correlation with height. (3) The biological factors affecting the survival of U. pumila saplings were the basal area (BA) at breast height and the number of conspecific adult trees. The former was significantly negatively correlated with U. pumila seedling survival, while the latter was positively correlated. For R. pseudoacacia seedlings, the key biological factors were the number of heterospecific adult trees and the number of heterospecific seedlings. The former was significantly negatively correlated with survival, whereas the latter was significantly positively correlated. The primary factor influencing sapling survival was sapling height, which showed a significant positive correlation.
1. Introduction
The Loess Plateau is one of the regions most severely affected by soil erosion in China and the world and is globally recognized as an ecologically fragile zone. Due to its unique geological structure and climatic conditions, the region exhibits significant ecological sensitivity, where any external disturbance can have profound impacts on its ecosystem [1,2]. The intensive extraction of open-pit coal—as a form of high-intensity surface disturbance—has contributed to regional economic development while severely damaging the local ecological environment. The large-scale land degradation caused by coal mining not only manifests as vegetation loss and soil fertility decline but also includes biodiversity reduction, changes in hydrological processes, aggravated soil erosion, and the presence of toxic chemical elements in excessive concentrations [3,4]. Therefore, effectively achieving land reclamation and ecological restoration after open-pit coal mining has become a major research focus in the fields of ecology and environmental science.
In land reclamation practices, the establishment of mixed forests has emerged as an important vegetation restoration model in coal mine reclamation areas due to its diverse ecological functions and strong resistance to disturbances [5,6]. Mixed forests can effectively improve soil structure and water retention capacity in reclamation areas while promoting long-term ecosystem stability through enhanced biodiversity. However, the sustainability of mixed forest ecosystems in reclamation areas still faces numerous challenges, among which the lack of natural regeneration capacity is considered one of the core constraints on ecological restoration. Natural regeneration refers to the ecological process by which plant communities achieve population renewal through seed dispersal, germination, seedling survival, and growth [7,8]. This process serves as both a natural driving mechanism of vegetation restoration and a critical indicator for assessing the self-regulation capacity of ecosystems. In the open-pit coal mine reclamation areas of the Loess Plateau, natural regeneration is often restricted by various limiting factors, including insufficient seed sources, soil degradation, and human disturbances [9,10,11].
Although extensive research has been conducted on vegetation restoration, systematic studies on the specific processes and driving factors of natural regeneration in mixed forests within reclamation areas remain limited. Recent studies on natural regeneration in mixed forests in the Loess Plateau reclamation areas have made some progress, mainly focusing on three aspects: (1) the spatiotemporal patterns of seed dispersal and the mechanisms of dispersal agents [12,13]; (2) the influence of soil physicochemical properties and microbial communities on seed germination and seedling growth [14,15]; and (3) the combined effects of climatic conditions, topography, and human disturbances on natural regeneration patterns [16,17]. These studies provide an essential foundation for understanding the natural regeneration process and its driving factors in reclamation areas. However, the applicability and generalization of the research findings remain limited by regional differences and ecological complexities.
The large-scale mining operations at the Antaibao open-pit coal mine have not only degraded land resources but also posed ecological security risks. Vegetation restoration is fundamental and crucial for the ecological rehabilitation of degraded lands [18,19]. Artificially constructed plant communities based on self-regulation theory must achieve self-renewal during vegetation succession to maintain dynamic equilibrium with the local environment [20]. In the tree life cycle, the transition from seedling to sapling is a critical developmental bottleneck and is considered the stage most sensitive to environmental changes. Therefore, studying the ecological characteristics and influencing factors of seedlings and saplings during vegetation restoration can help to understand species interactions, reveal key vegetation restoration processes, and provide important references for scientifically assessing the adaptability of artificially reconstructed vegetation.
Following the technical specifications of the Center for Tropical Forest Science (CTFS) [21], a permanent monitoring plot was established in 2019 in the vegetation restoration area of the spoil heap at the Antaibao open-pit coal mine. This plot has served as a vital research platform for studying ecological restoration processes, species spatial distribution patterns, and community succession dynamics in mining areas. Using the same monitoring standards, a resurvey was conducted in 2024 to analyze the spatiotemporal dynamics of seedlings and saplings and their environmental constraints. This study aims to enhance the understanding of new strategies and dynamics in artificially reconstructed vegetation species during ecological restoration.
2. Materials and Methods
2.1. Study Area Overview
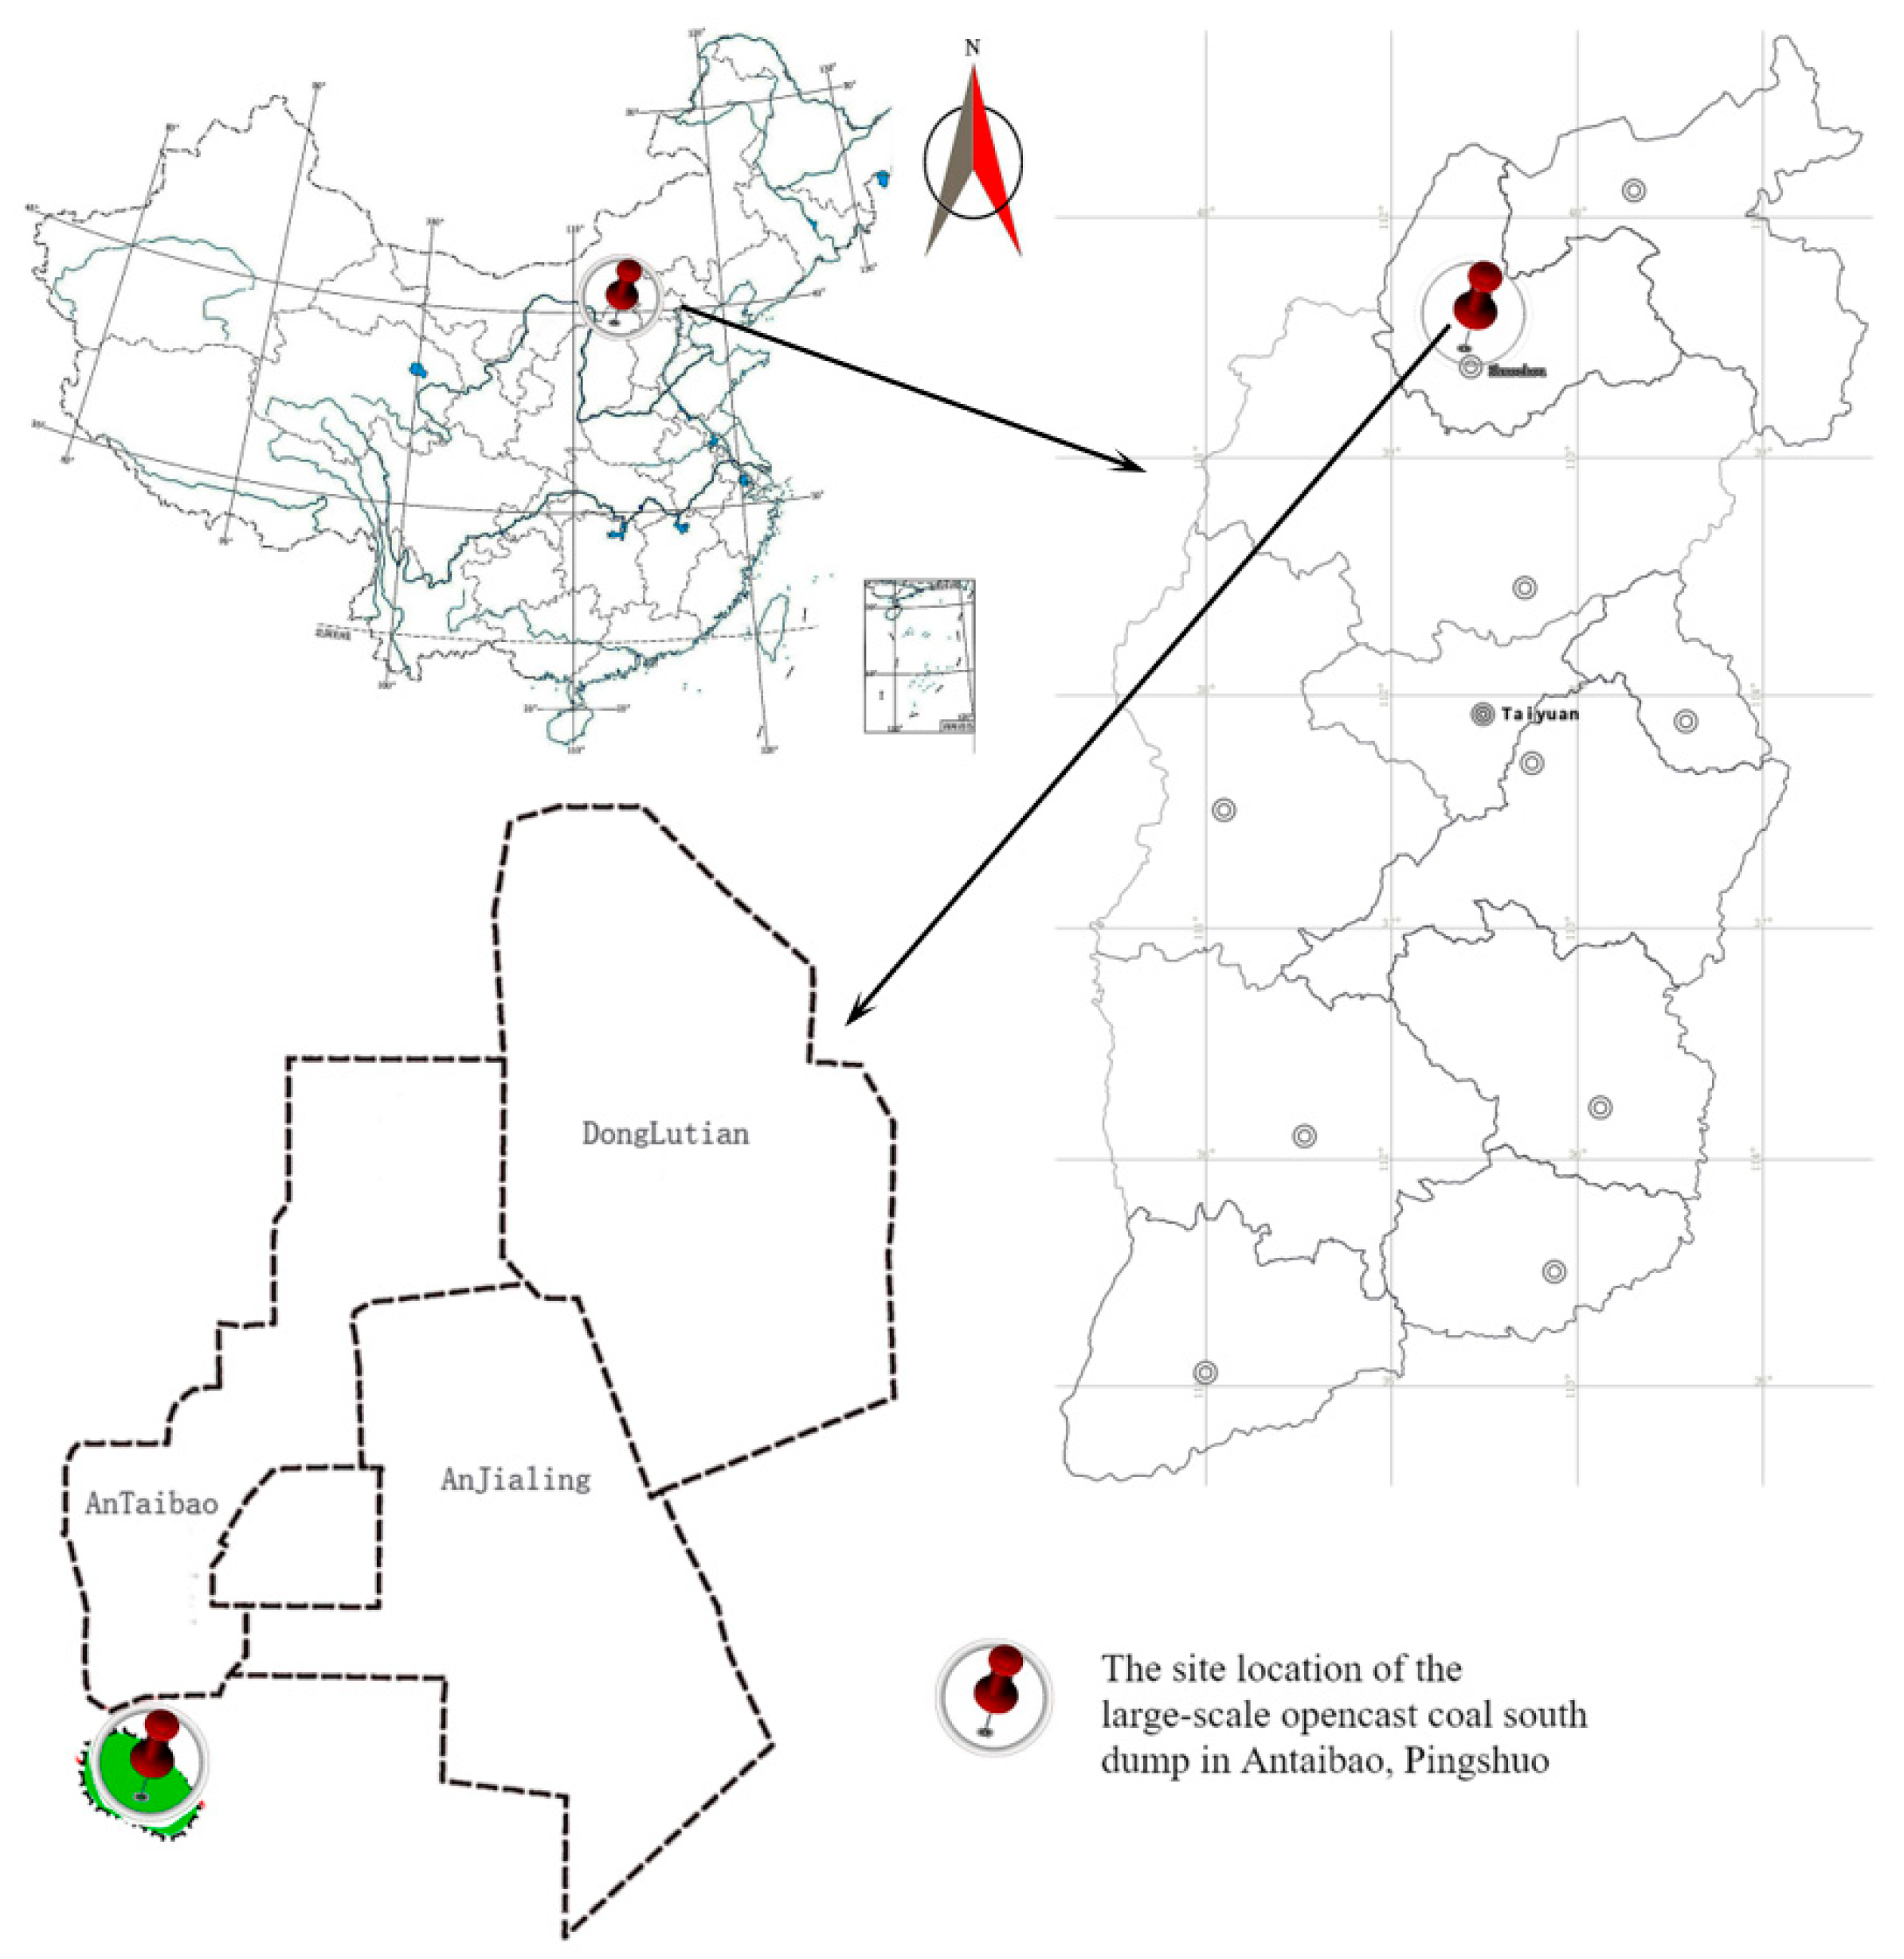
The study site was located at the southern dump of the Antaibao coal mine in Pinglu District, Shuozhou City, northern Shanxi Province, with geographical coordinates ranging from 39°24′ N to 39°38′ N and 112°11′ E to 113°32′ E (Figure 1). The mining area is a typical Loess Plateau region, with most areas covered by loess. There are no perennial surface water bodies in the region. The area has a temperate semi-arid continental monsoon climate, with an average annual precipitation of 428.2 mm, an average annual temperature of 5.5 °C, and a frost-free period of 117 days. The zonal vegetation in the mining area belongs to the steppe type.
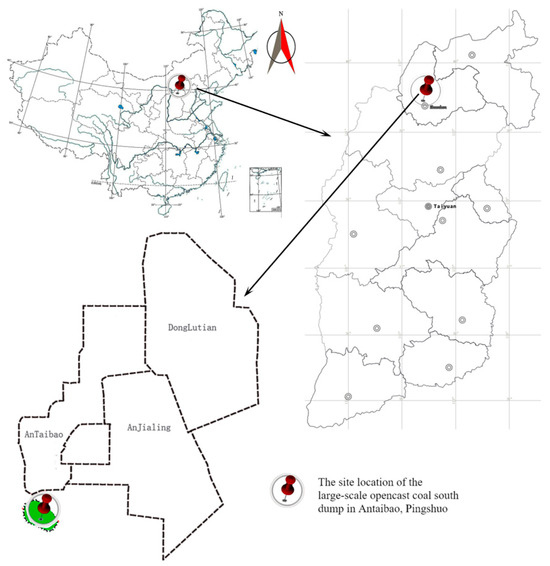
Figure 1.
Location map of the study area.
The southern dump of the Antaibao open-pit coal mine is an external dump with a final elevation of 1465 m, a total capacity of 116 million m3, and a dumping height of 150 m. Dumping began in 1985 and was completed in 1989, while vegetation reconstruction started in 1993. Apart from irrigation during the initial planting period, no artificial irrigation or fertilization was ever applied. At the time of this study, a vegetation restoration area dominated by Robinia pseudoacacia L., Ulmus pumila L., and Ailanthus altissima (P. Mill.) Swingle was established, effectively covering the previously barren surface of the dump and significantly restoring the ecological environment.
2.2. Plot Setup and Investigation
The permanent monitoring plot of the R. pseudoacacia + U. pumila + A. altissima mixed forest is located in the ecological reclamation area of the southern dump, covering an area of 1 ha (100 m × 100 m). The slope is less than 5°, with an average elevation of 1380 m, the highest point at 1381.5 m, and the lowest at 1378.5 m, resulting in a maximum elevation difference of 3 m. Following the methods of the Center for Tropical Forest Science (CTFS), a total station was used to divide the plot into 80 quadrats of 10 m × 10 m each, and each quadrat was further subdivided into four 5 m × 5 m sub-quadrats. All woody plants in the quadrats were identified, measured for height and diameter at breast height (DBH), georeferenced, and tagged.
- (1)
- Vegetation Survey
The criteria and methods for seedling and sapling surveys were as follows: Trees with DBH < 3 cm were classified as seedlings. Trees with 3 cm ≤ DBH < 7 cm were classified as saplings. The recorded parameters included species name, tree height, DBH, and spatial coordinates.
- (2)
- Measurement of Understory Light Conditions
The hemispherical imaging method (Digital Hemisphere Photography) was used to measure light conditions [22]. Each 10 m × 10 m quadrat served as a sampling unit. A Nikon D700 camera with an AF Fisheye Nikkor 16 mm f/2.8D lens was used, with photos taken at the center of each 10 m × 10 m quadrat at a height of 1.5 m (Figure 2) [23,24,25,26,27,28,29,30,31,32,33,34]. To avoid direct light interference and ensure a uniform distribution of scattered light in the sky, three photographs were taken at each point before sunrise [22,23,24,25,26,27,28,29,30,31,32,33,34]. The parameters selected for analysis were direct light transmittance (Trans.Direct) and diffuse light transmittance (Trans.Diffuse). The images were processed using the Gap Light Analyzer (GLA) software (version 2.0) to quantify canopy structure parameters (Figure 3). During processing, plot latitude, longitude, and elevation were set as required, while other settings were kept as default [23,24,25,26,27,28,29,30,31,32,33,34].

Figure 2.
Photos displaying points of a 10 m × 10 m plot.
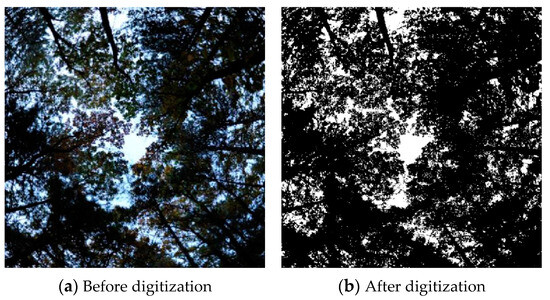
Figure 3.
Example of digital hemisphere photograph.
2.3. Data Processing
- (1)
- Analysis of Seedling and Sapling Dynamics
Based on survey data collected in 2019 and 2024 from the Pinglu open-pit coal mine reclamation area, changes in species composition, numerical composition, and the composition of newly recruited and dead seedlings were analyzed (individual variations < 5 were excluded from analysis).
- (2)
- Spatial Distribution Analysis
Spatial distribution patterns were analyzed and mapped using the akima, spatstat, and spatial packages in R 3.4.1 (http://www.r-project.org (accessed on 14 December 2024)). As the canopy openness of the study plot was classified into only two levels, no further correlation analysis was conducted.
- (3)
- Correlation Analysis of Factors Driving Seedling and Sapling Survival
The relative importance of biotic and abiotic factors in determining seedling and sapling survival has been a long-standing research focus [3]. Using the survival status of seedlings and saplings with an initial count of ≥100 in 2019 as the response variable (1 = survived; 0 = dead) in 2024, a generalized linear mixed model (GLMM) approach was applied to examine survival dynamics. Four GLMMs were constructed based on seedling and sapling height, biotic factors, abiotic factors, and a full model: (a) height model—included quadrat and species as random effects, with height as a fixed effect; (b) abiotic factor model—extended the height model by including only topography and the light environment as fixed effects; (c) biotic factor model—extended the height model by including only seedling and neighboring adult tree interactions as fixed effects; (d) full model—extended the height model by incorporating all variables as fixed effects. Akaike’s Information Criterion (AIC) was used to compare model performance, where a smaller AIC value indicated a better model fit. Biotic factors included the following: the number of conspecific and heterospecific seedlings per quadrat; the number of conspecific and heterospecific adult trees per quadrat; the sum of the ratio of the basal area at breast height (BA) of each adult tree within a 10 m radius to its distance from the target seedling, calculated separately for conspecific and heterospecific trees. Abiotic factors included the following: Elevation, slope, and aspect. Direct light transmittance and diffuse light transmittance were employed as proxies for the understory light conditions.
3. Results
3.1. Seedling and Sapling Dynamics in the Study Plot (2019–2024)
Results showed that over the 4-year period from 2019 to 2024, four species—Salix matsudana Koidz (Chinese willow), Populus simonii Carr (Simon poplar), Rhus typhina L. (staghorn sumac), and Lycium chinensis Mill. (Chinese boxthorn)—disappeared from the plot due to mortality, with no new species recorded (Table 1). In 2019, a total of 4216 seedlings and 687 saplings were recorded. By 2024, the net increase in seedlings was 6917, while the net increase in saplings was 40.

Table 1.
Species composition of the sample plot.
The increase in both seedling and sapling numbers was primarily driven by A. altissima and U. pumila, with newly recruited U. pumila seedlings accounting for 92.22% of the total seedling increase. In contrast, Robinia pseudoacacia experienced the highest seedling mortality, with 932 individuals lost, representing 58.73% of total seedling mortality (Table 2 and Table 3).
Table 2.
Statistics on the number of seedlings and saplings of each species in the sample plots.
Table 3.
Survival dynamics of seedlings and saplings of each species in the sample plots.
3.2. Spatiotemporal Dynamics of Seedlings and Saplings
3.2.1. Spatial Distribution of Ulmus pumila Seedlings and Saplings
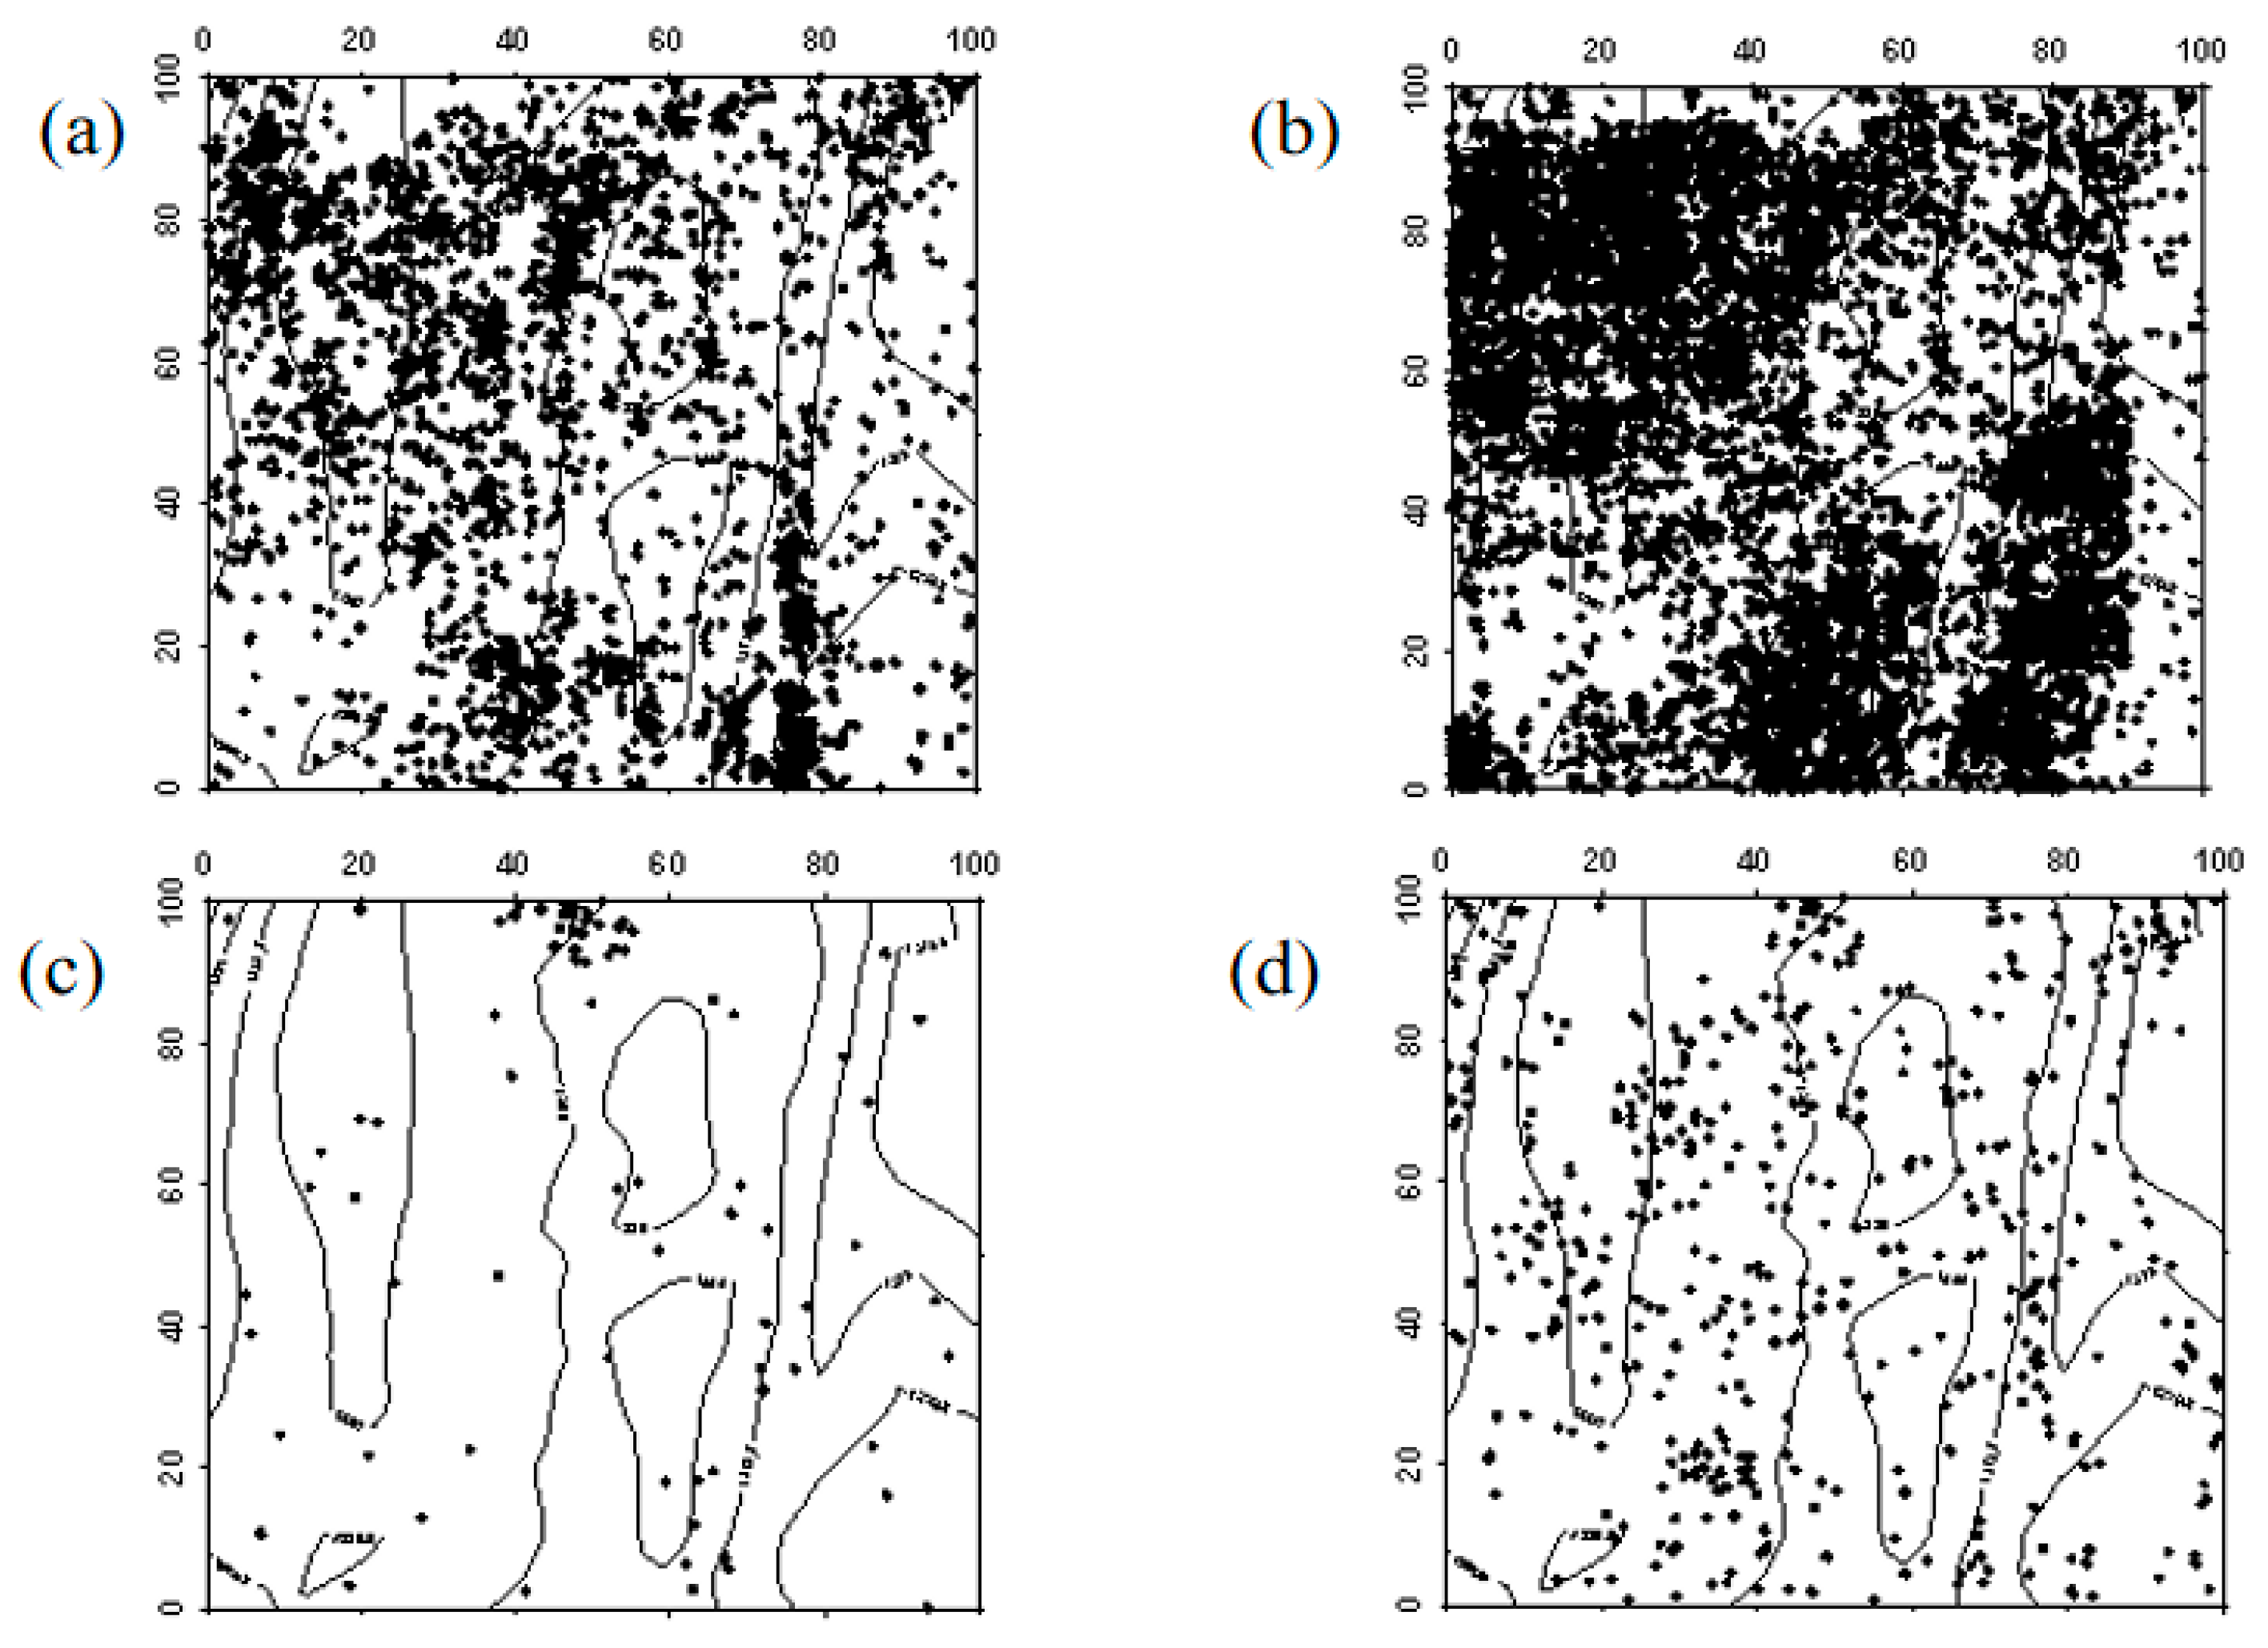
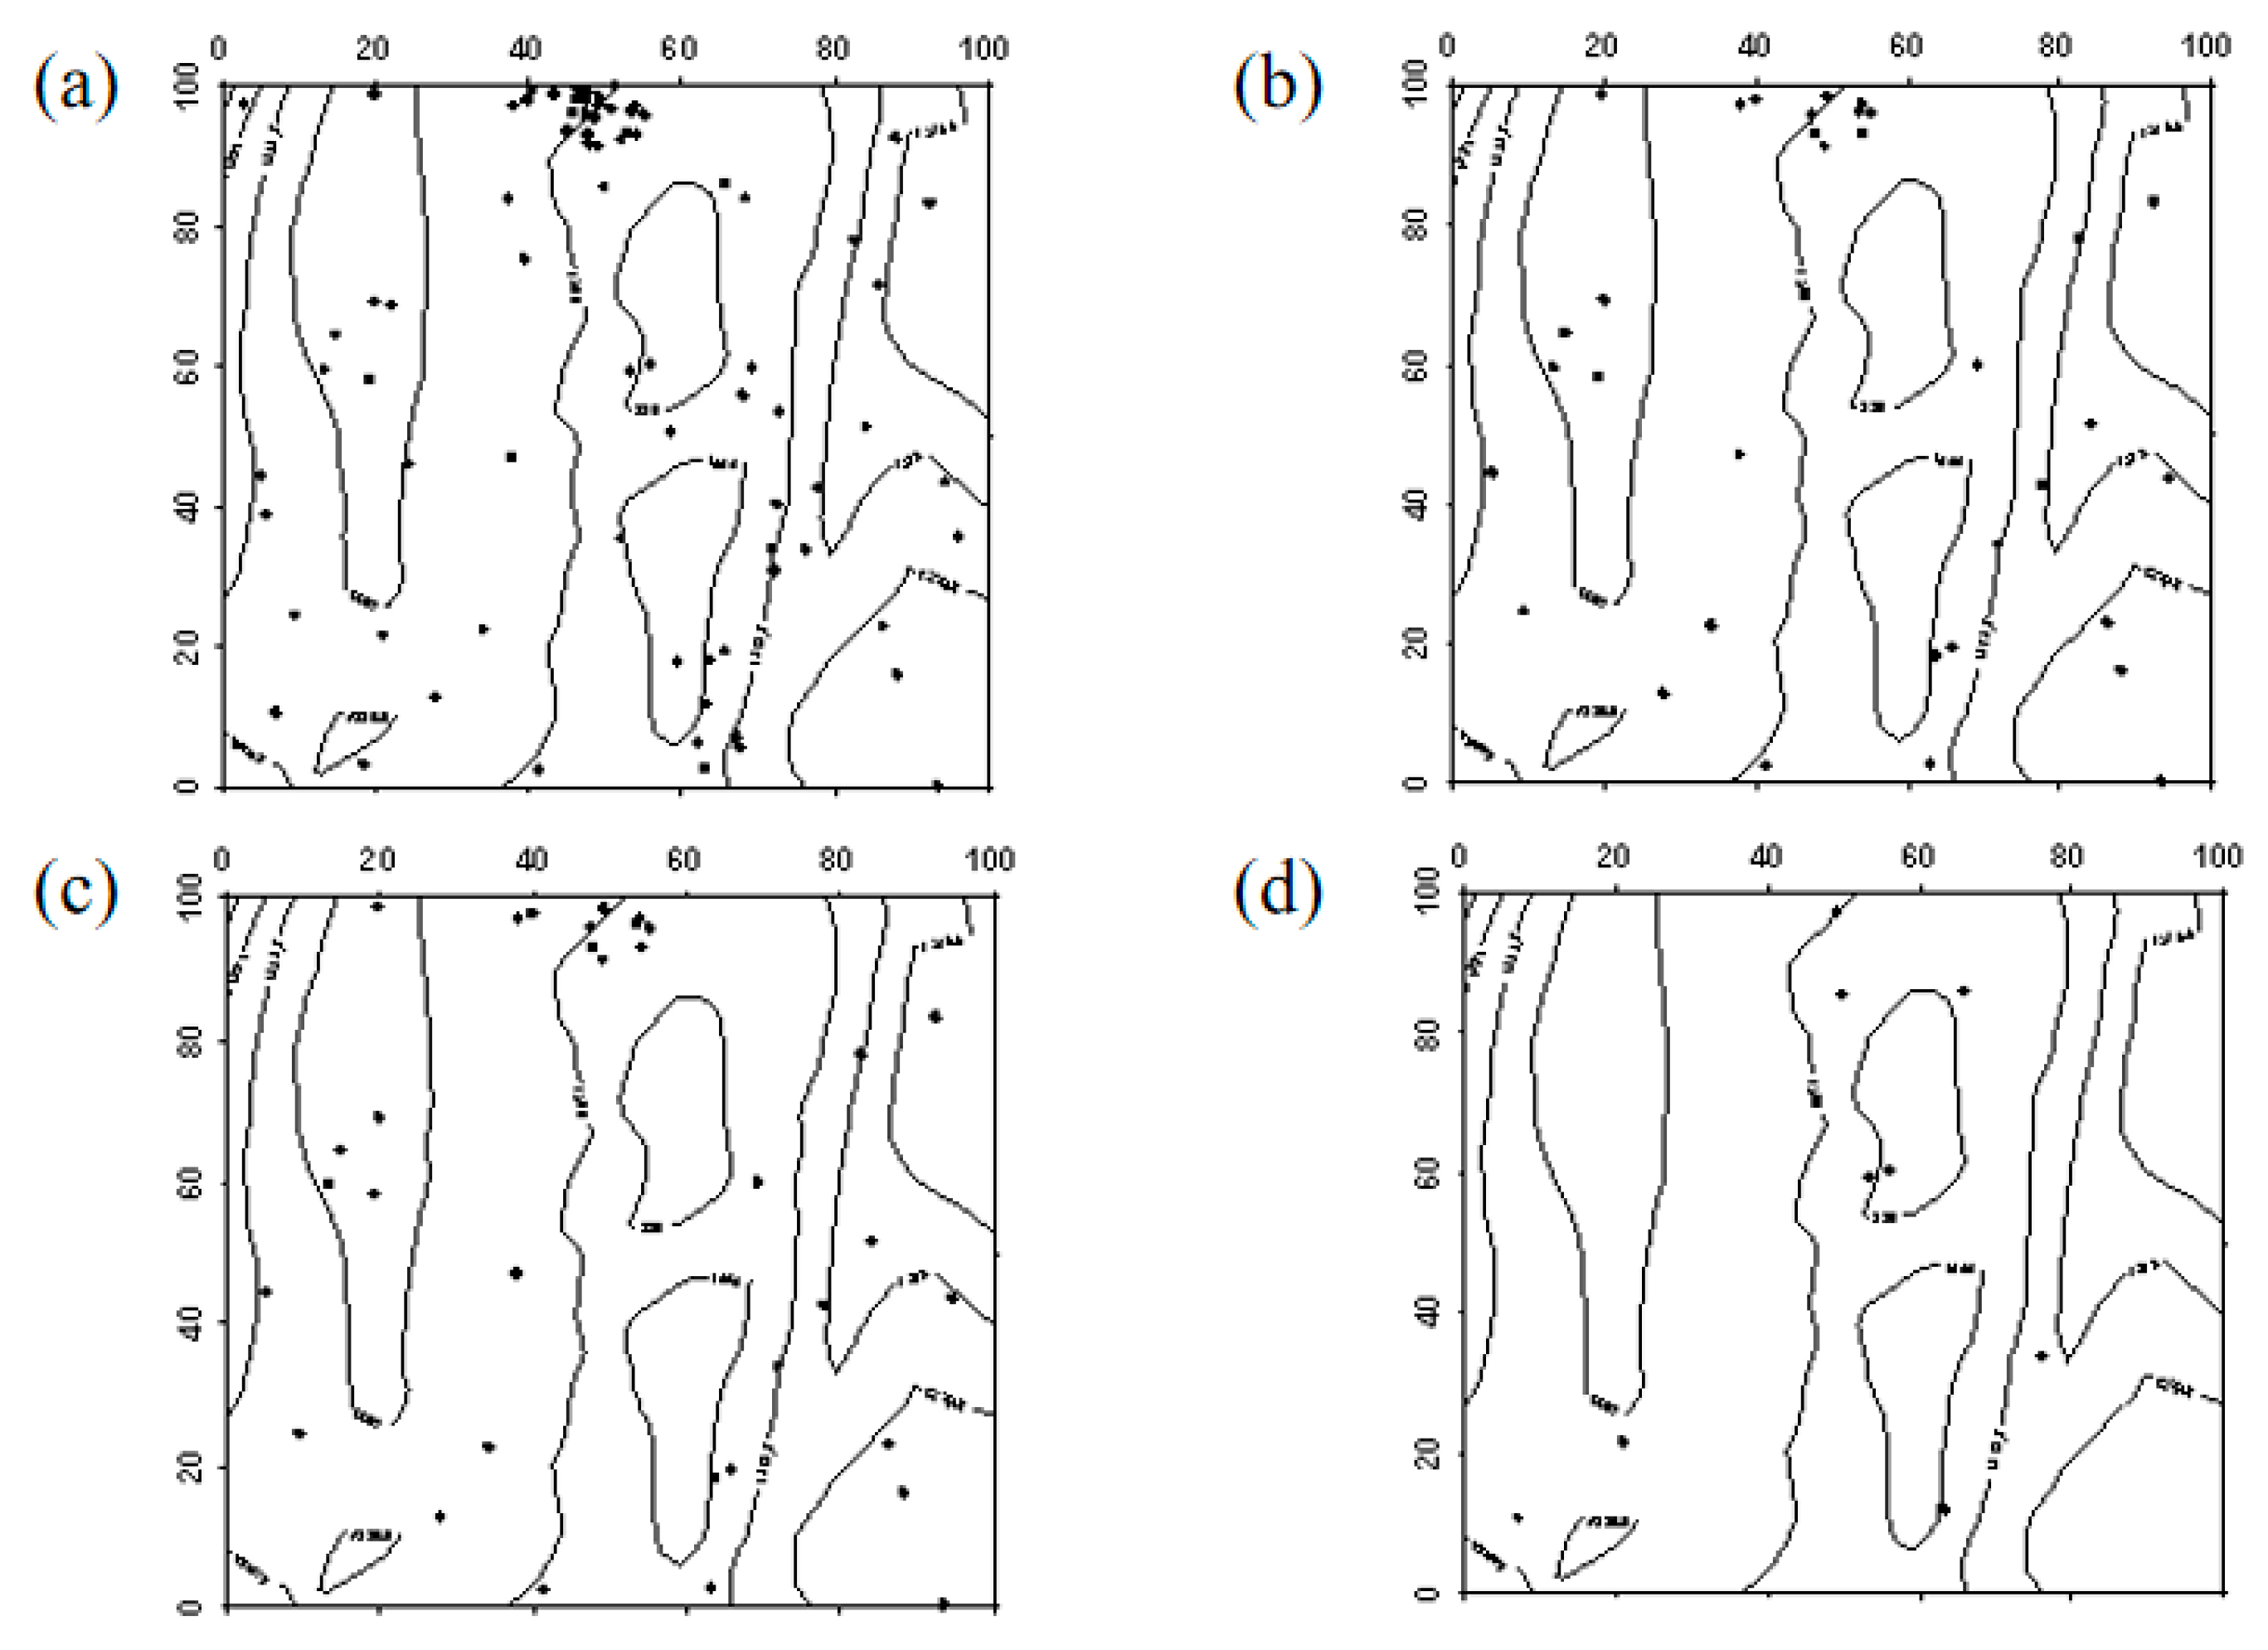
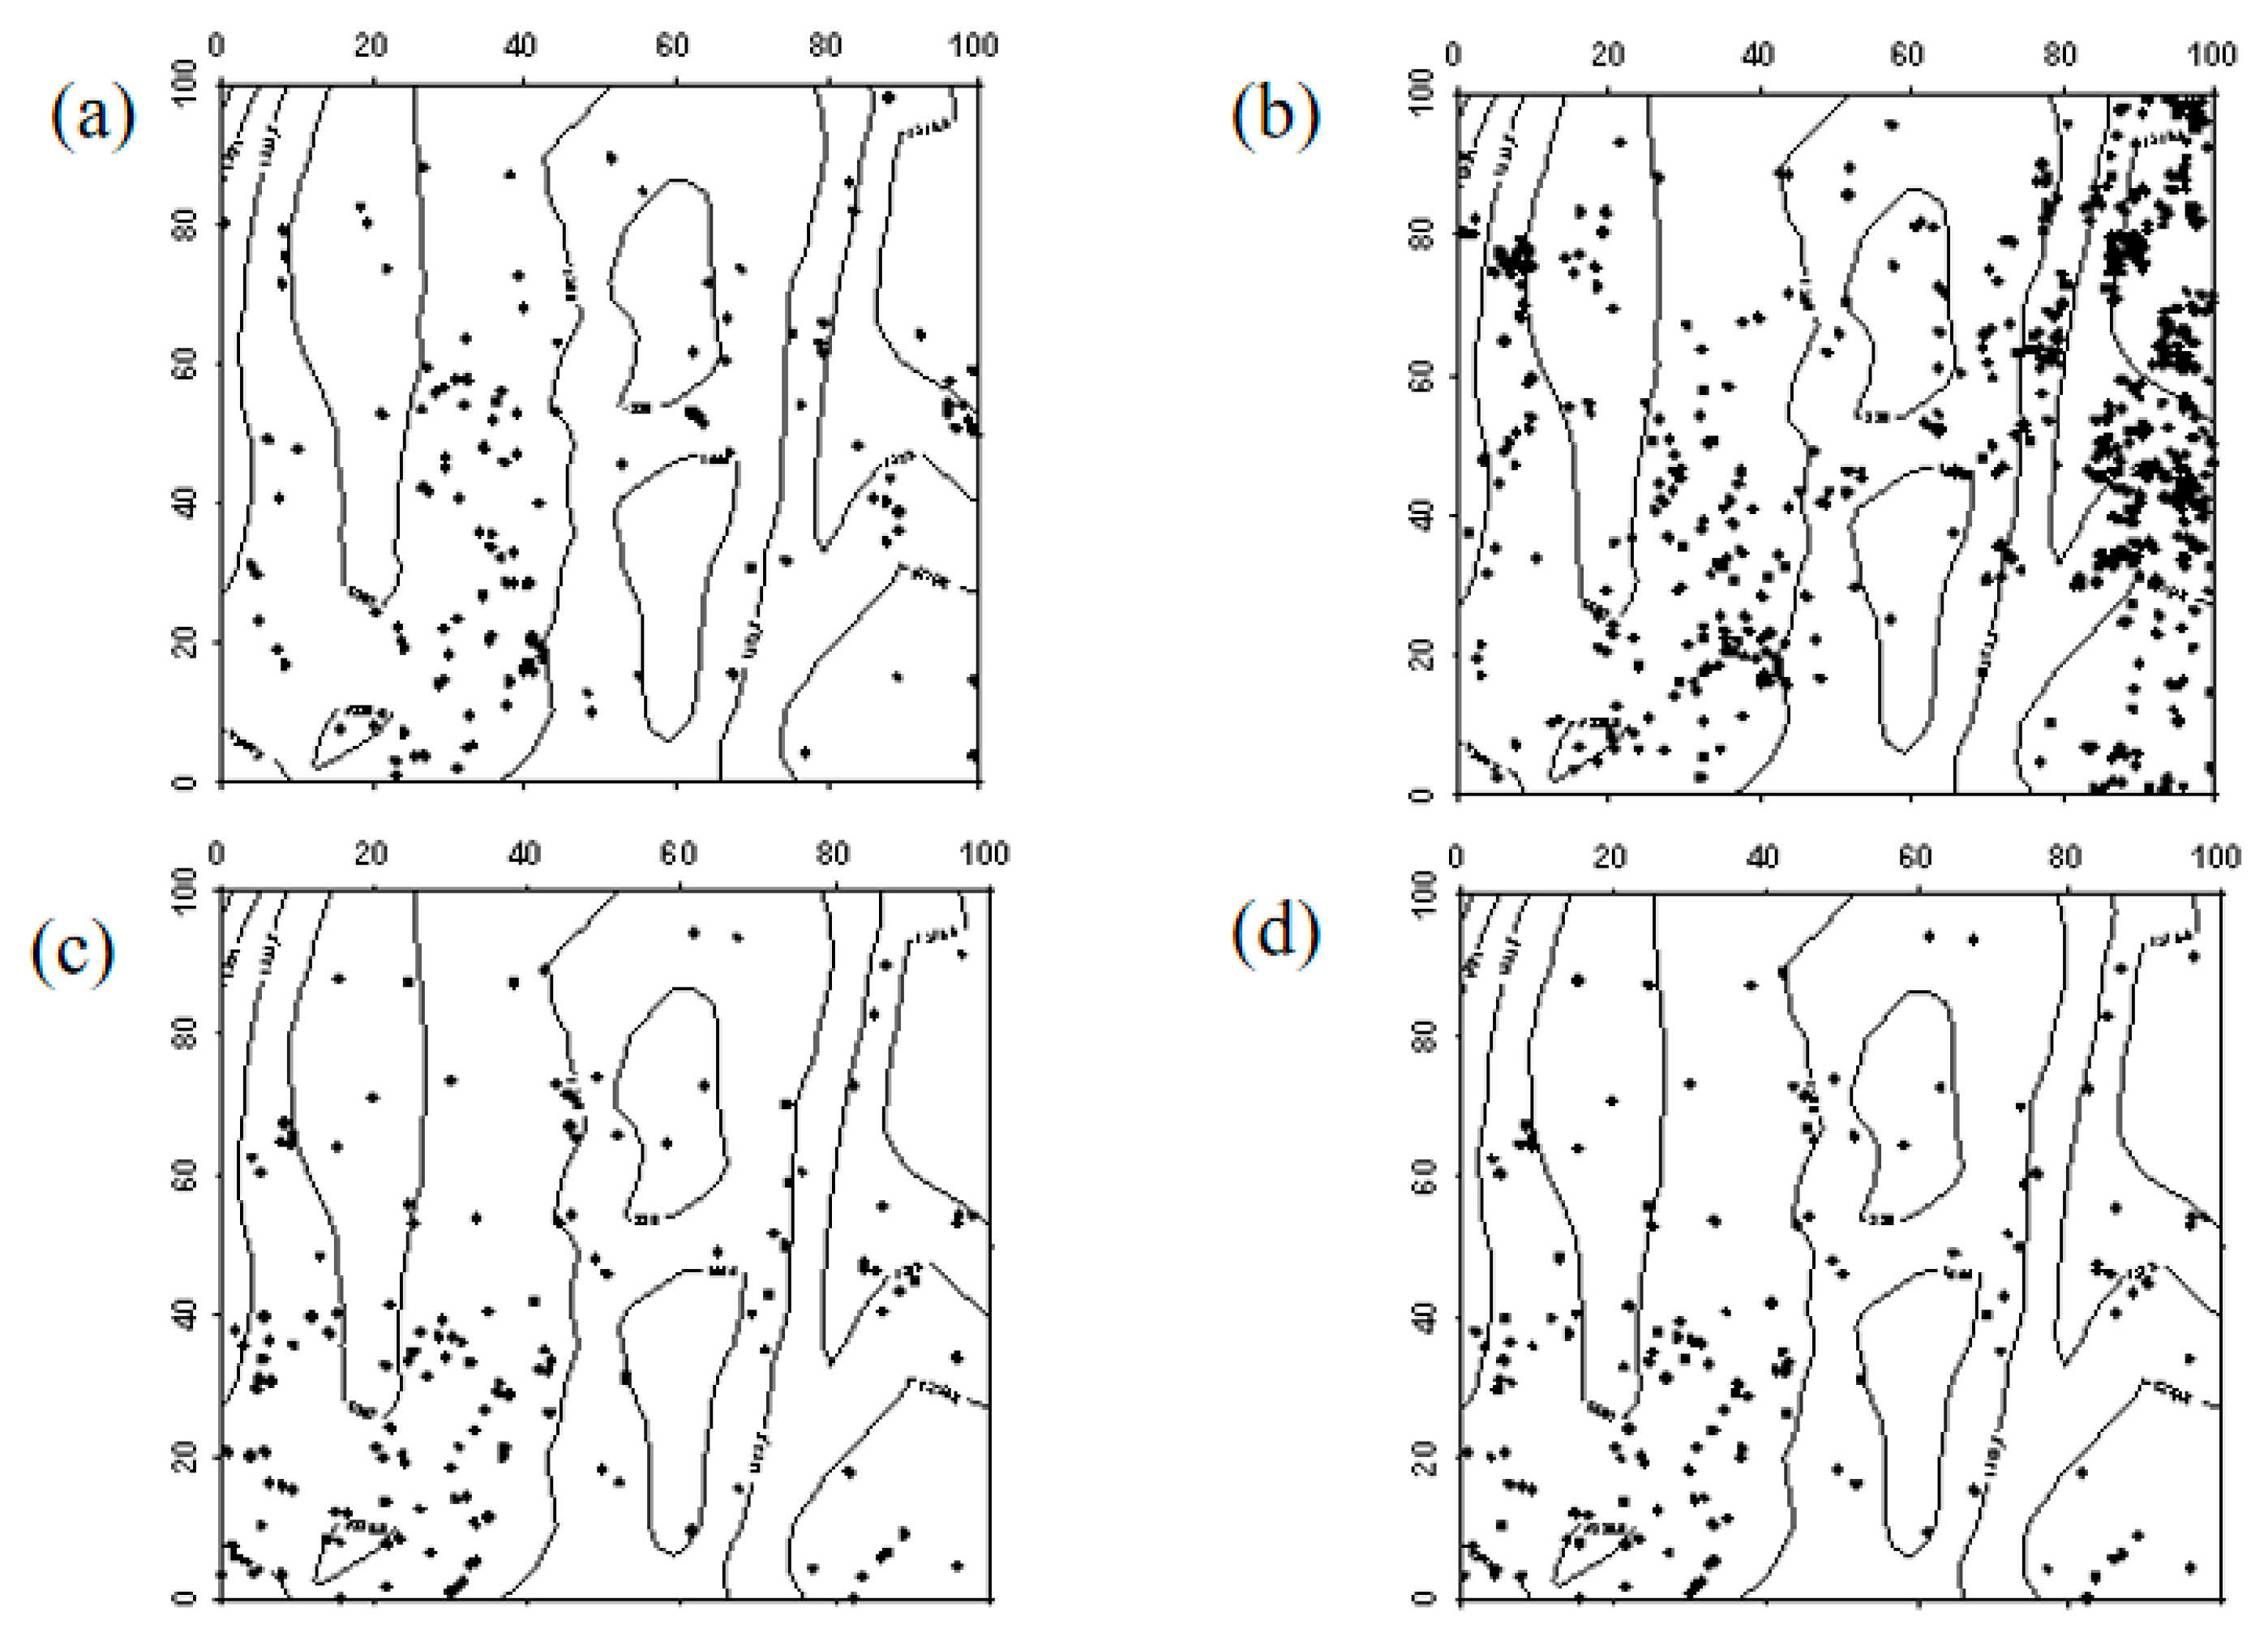
The spatial distribution characteristics of Ulmus pumila seedlings in 2019 and 2024 were similar, primarily exhibiting a random distribution. However, in the northwest and southeast corners of the sample plot, a clustered distribution was observed. In both 2019 and 2024, Ulmus pumila saplings were also mainly randomly distributed. The transition of Ulmus pumila seedlings into saplings, the progression of saplings into mature trees, and the mortality distribution of seedlings and saplings aligned with the overall distribution pattern at the community level (Figure 4, Figure 5 and Figure 6).
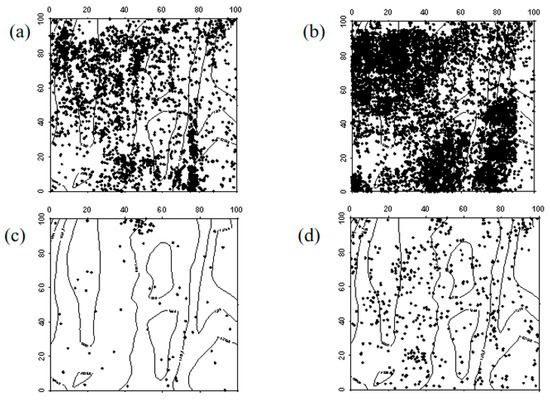
Figure 4.
Spatial distribution patterns of Ulmus pumila seedlings and saplings ((a–d) represent the spatial distribution of Ulmus pumila seedlings in 2019, Ulmus pumila seedlings in 2024, Ulmus pumila saplings in 2019, and Ulmus pumila saplings in 2024, respectively).
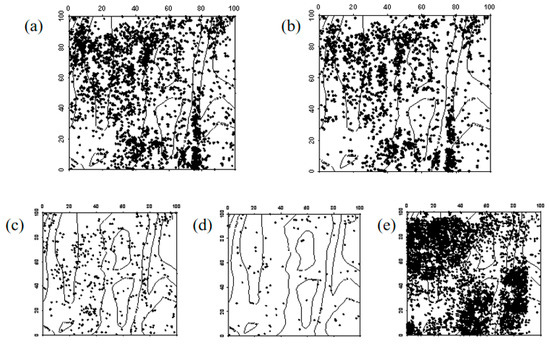
Figure 5.
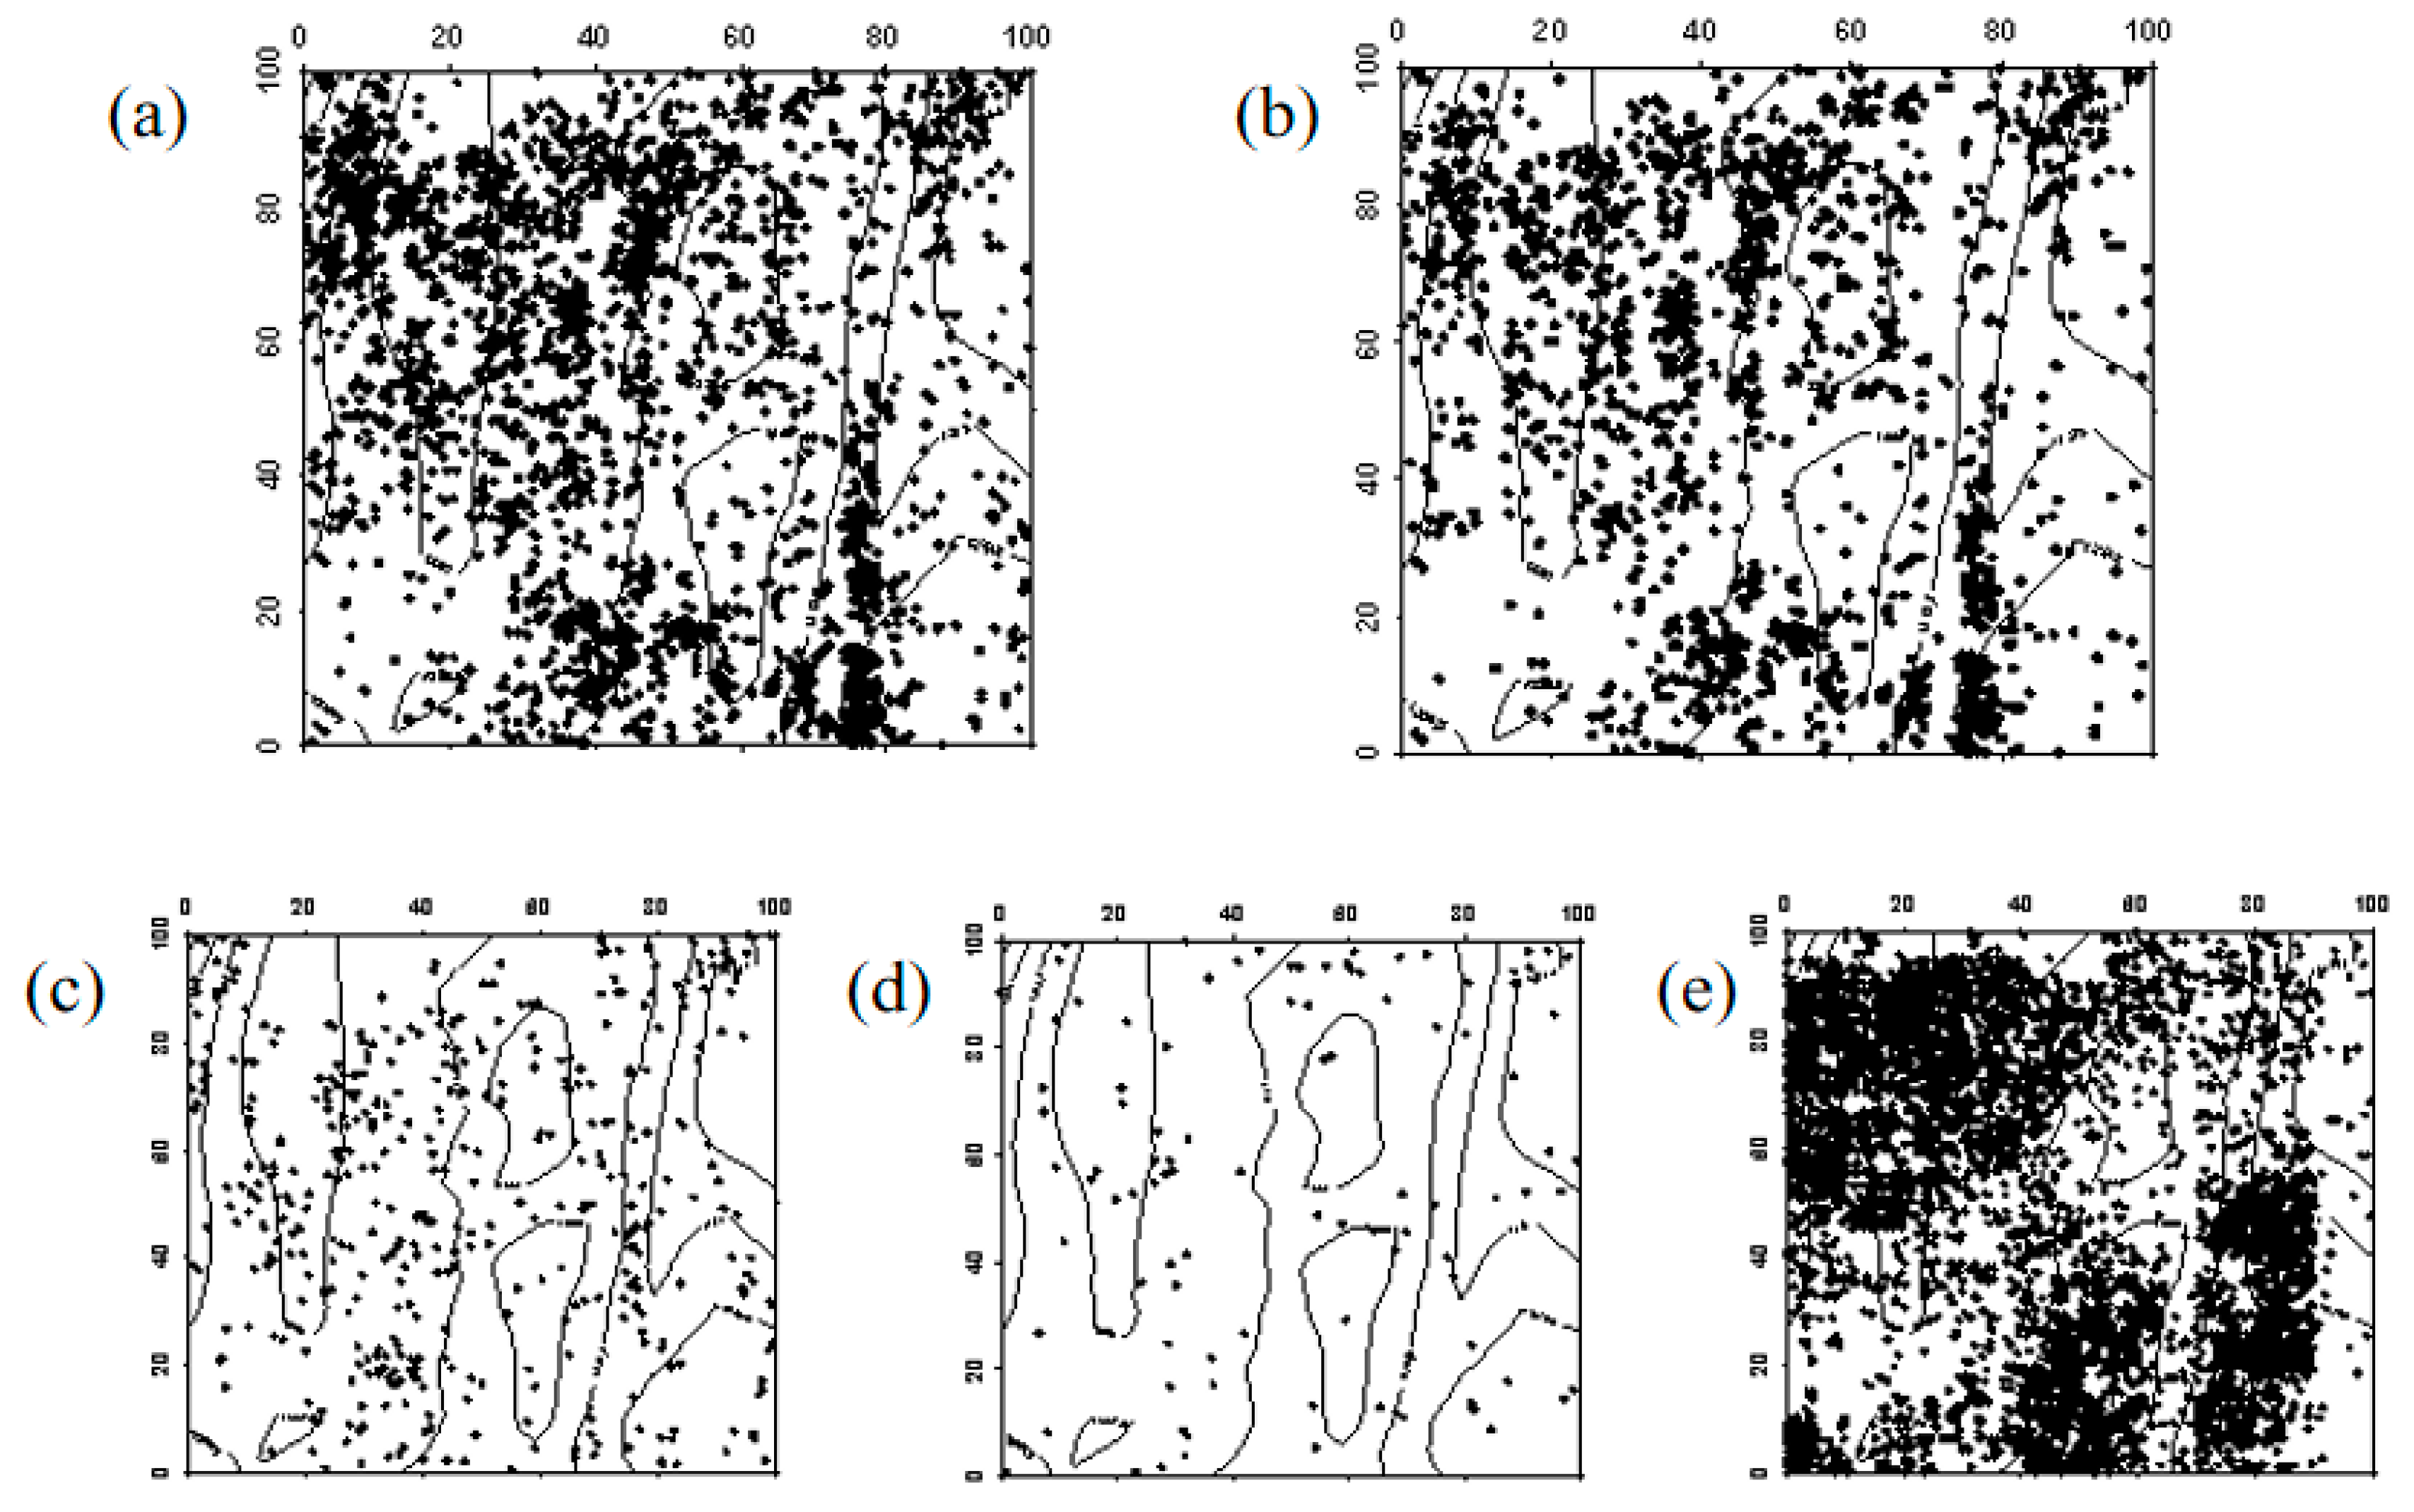
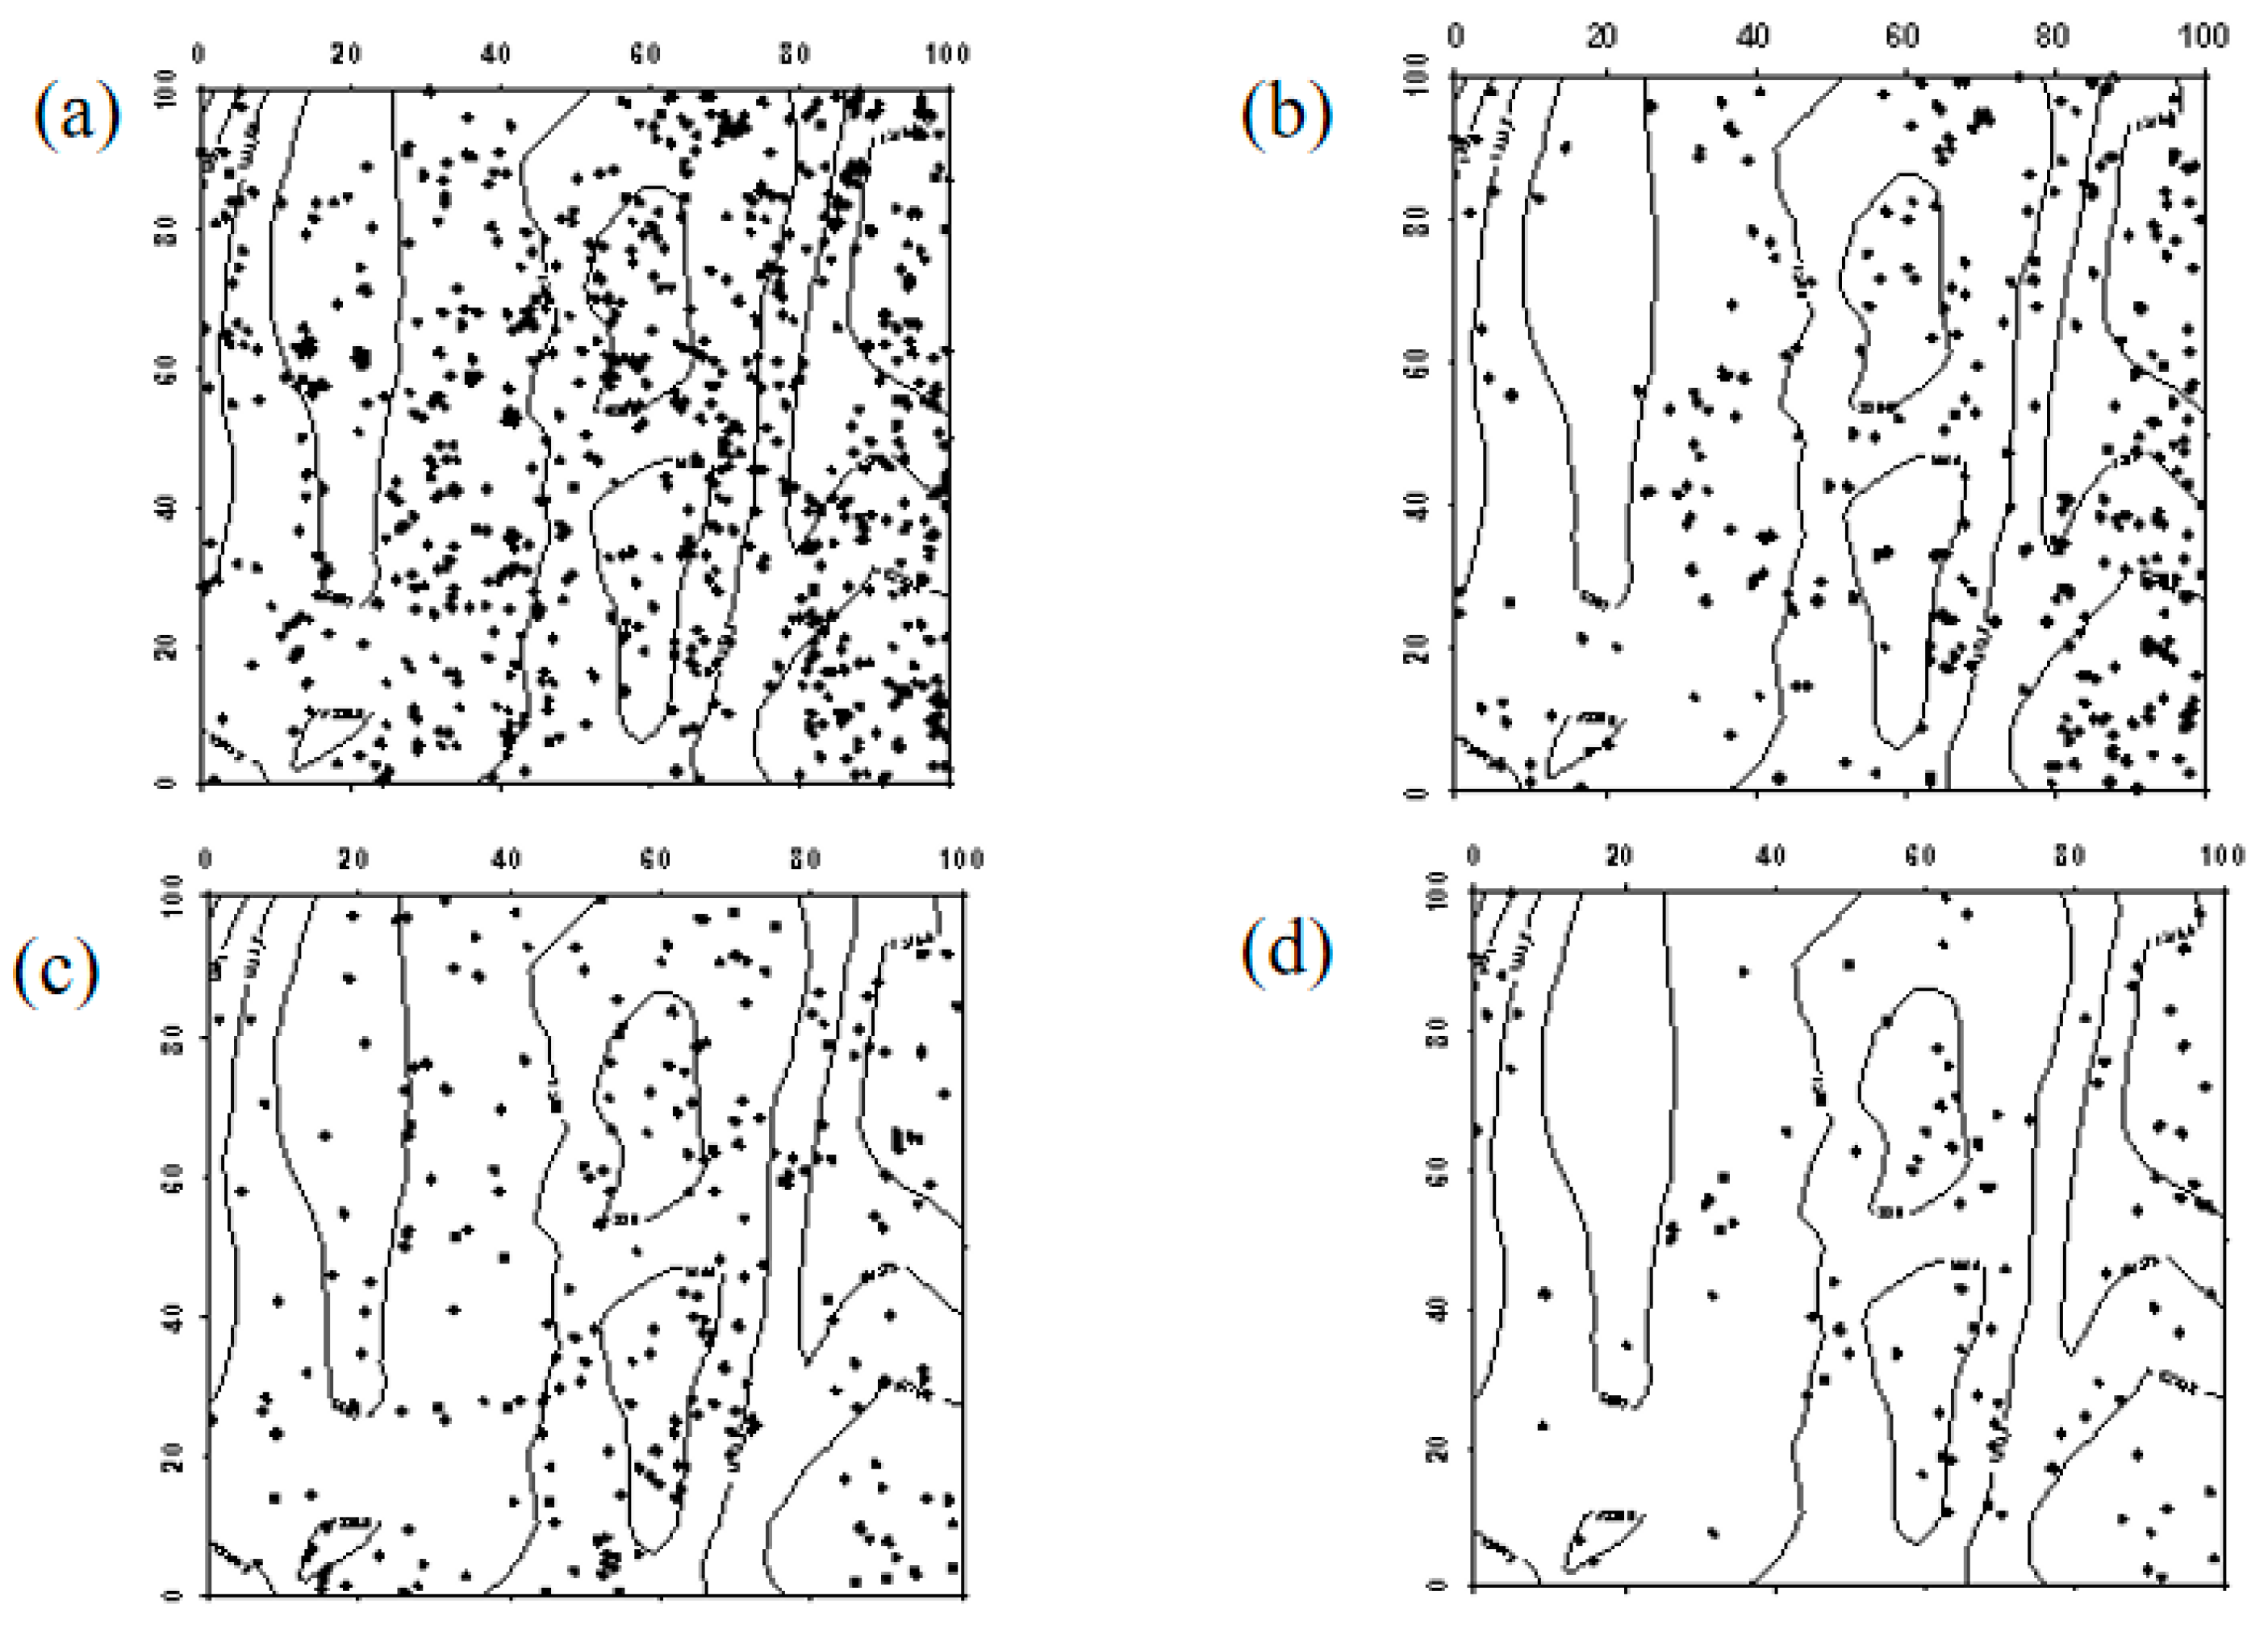
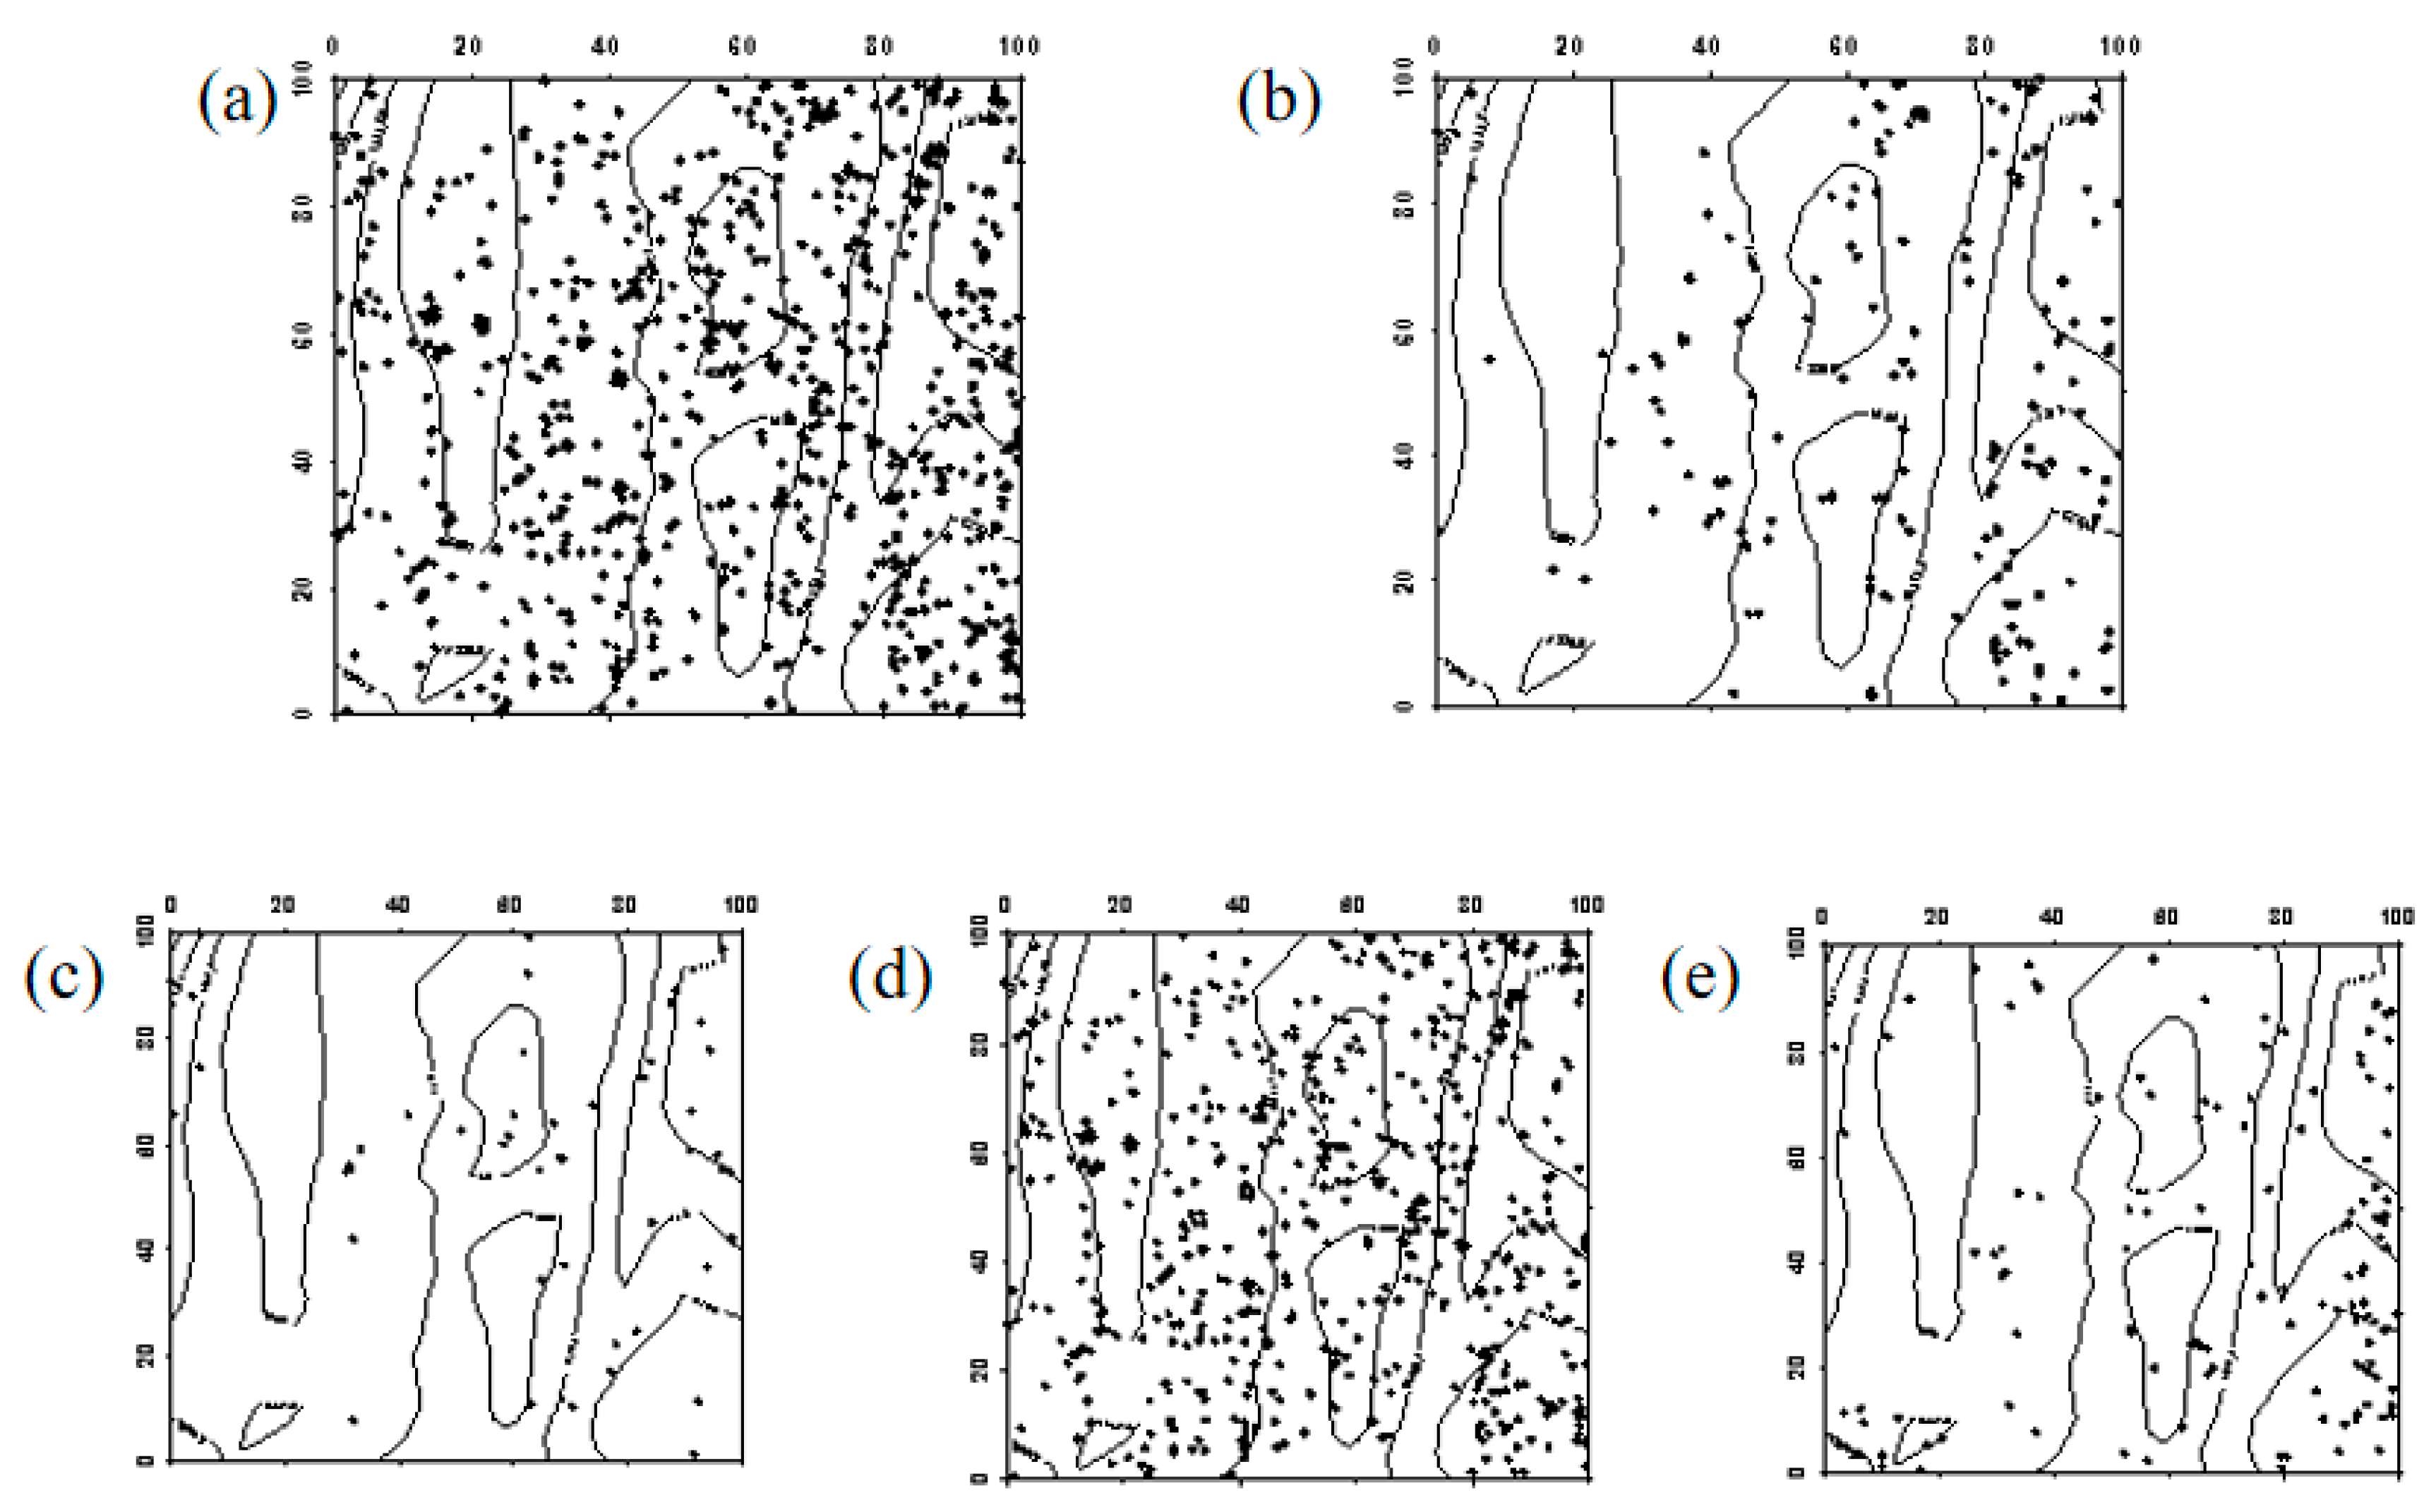
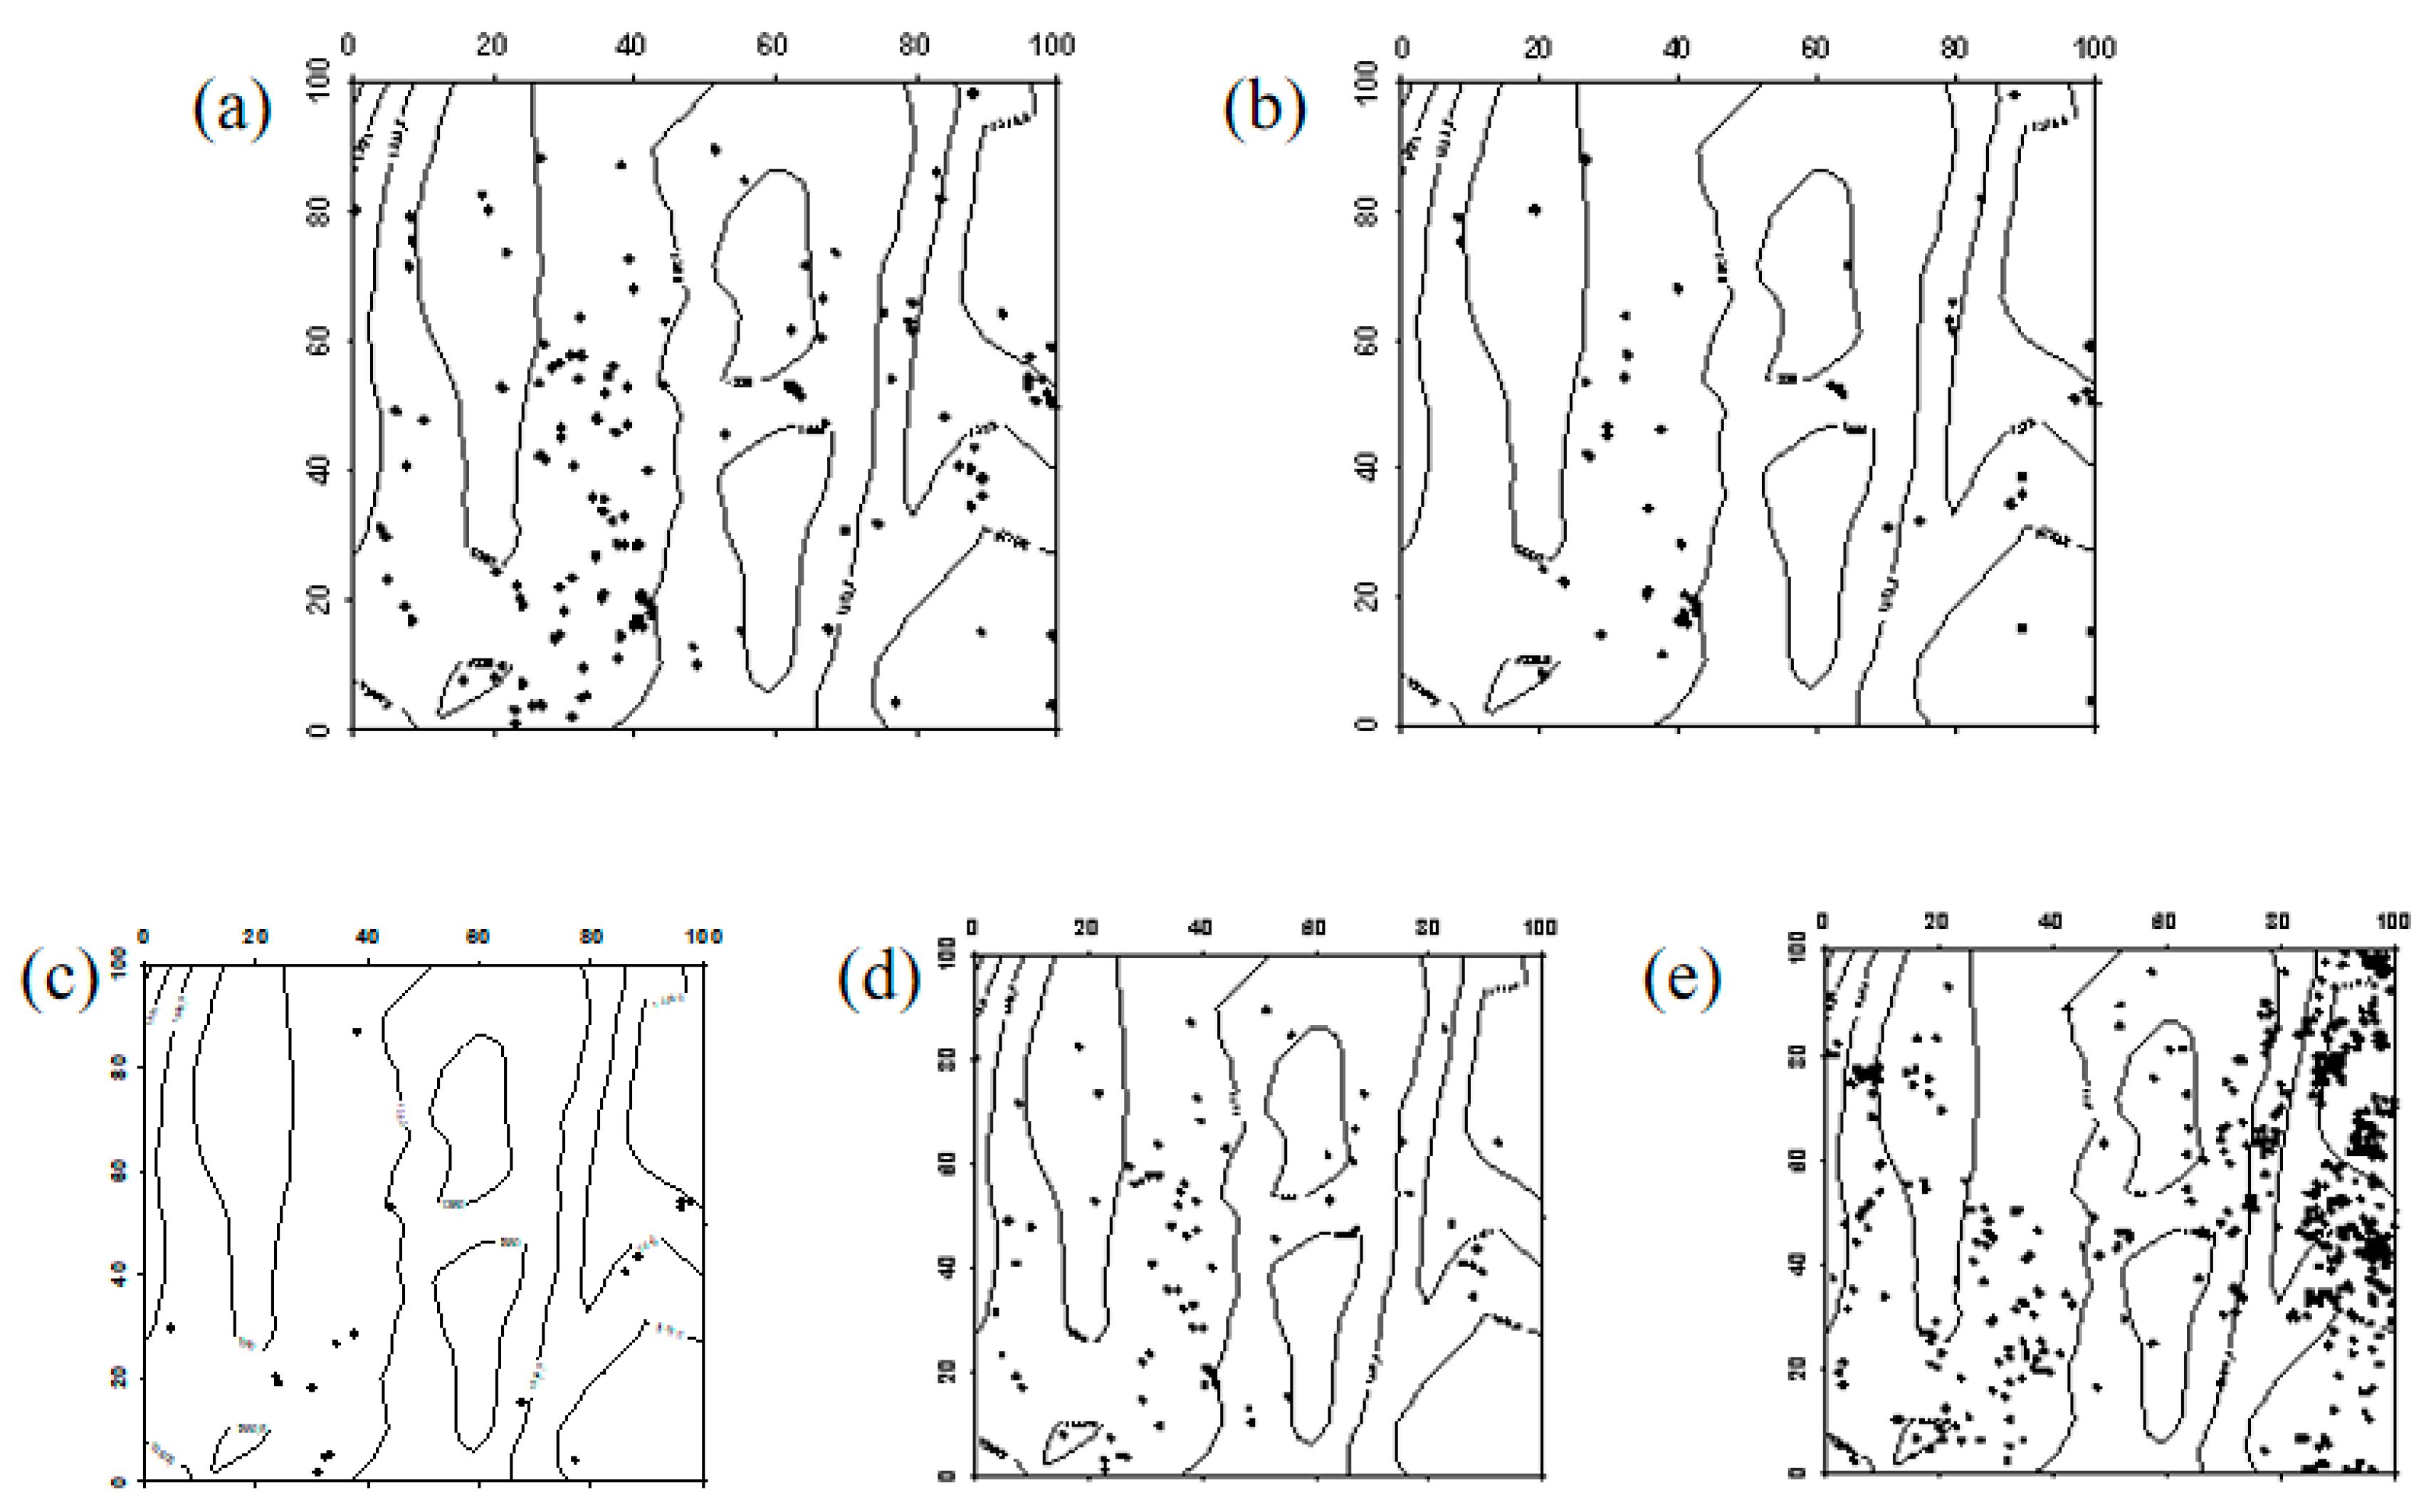
Spatial distribution pattern of surviving Ulmus pumila seedlings ((a–e) represent seedlings in 2019, seedlings that remained seedlings from 2019 to 2024, seedlings that advanced to saplings from 2019 to 2024, seedlings that died between 2019 and 2024, and newly emerged seedlings in 2024, respectively).
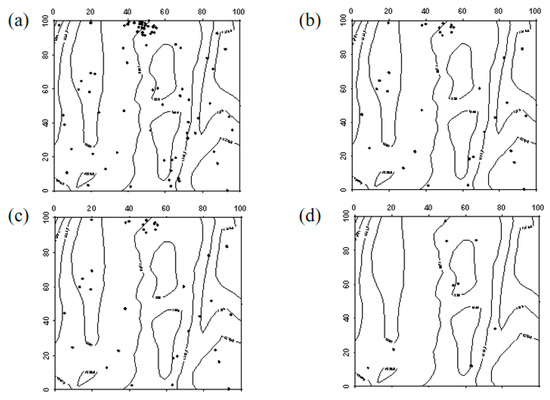
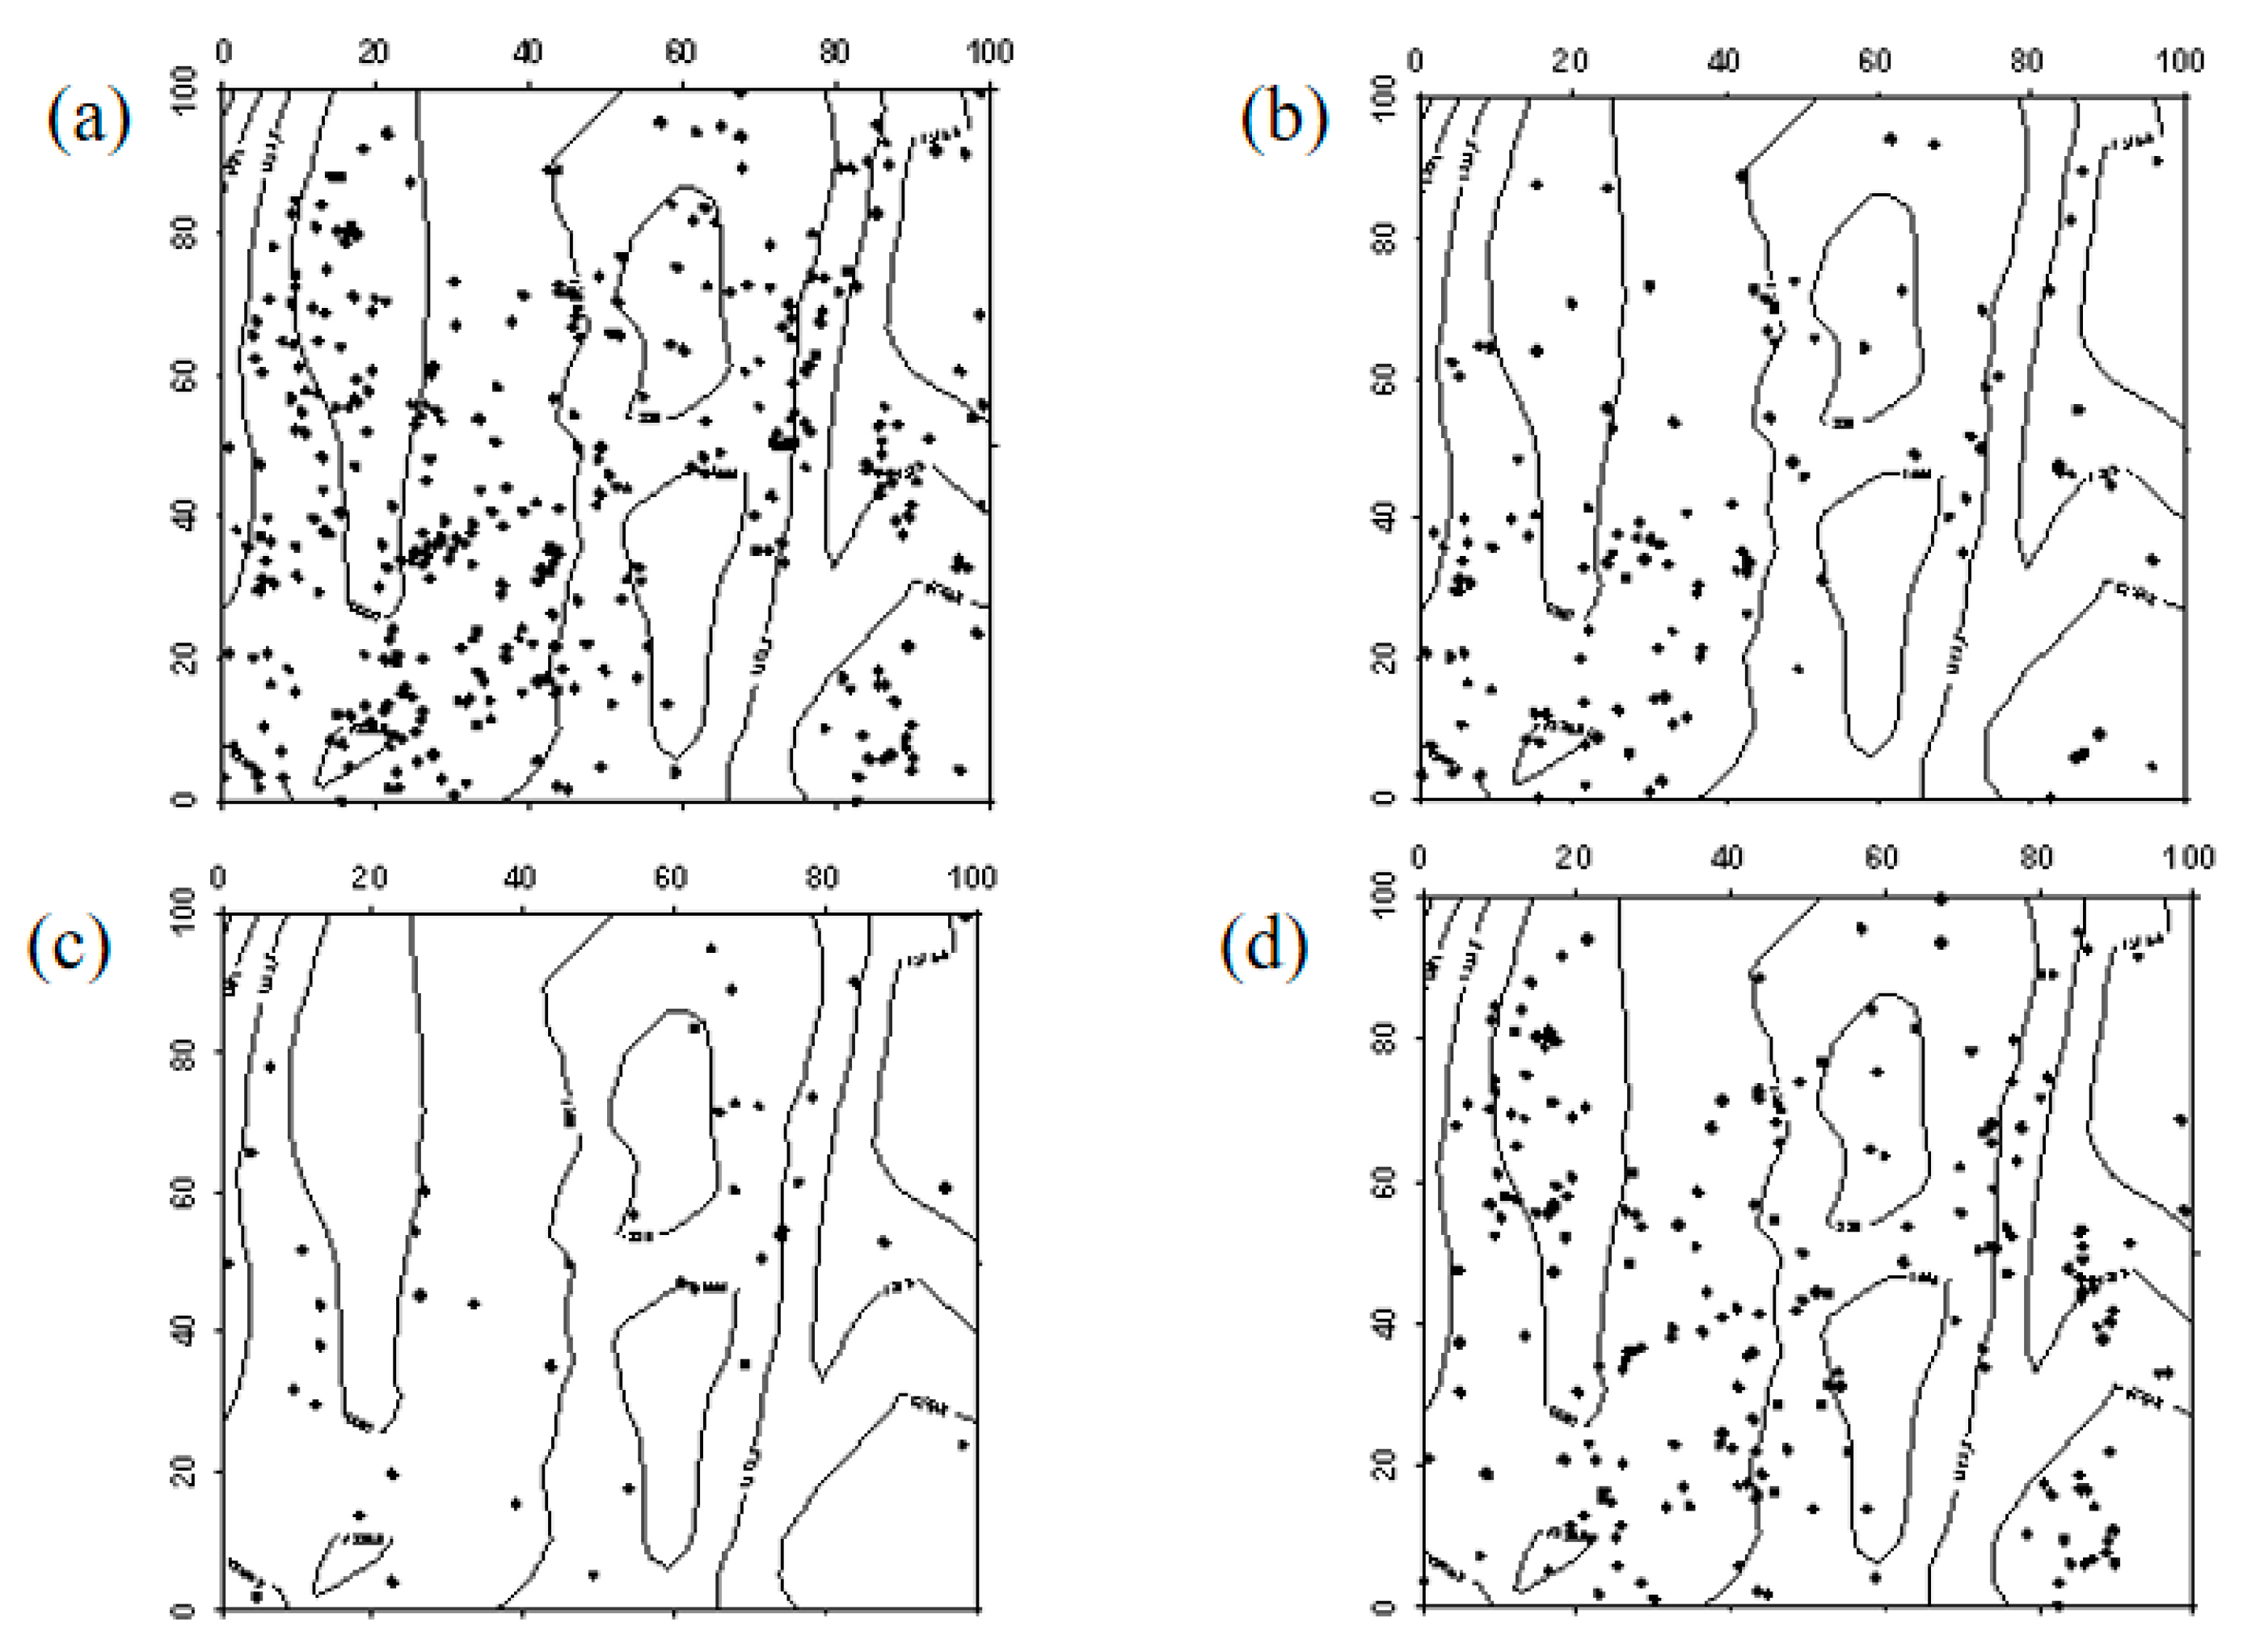
Figure 6.
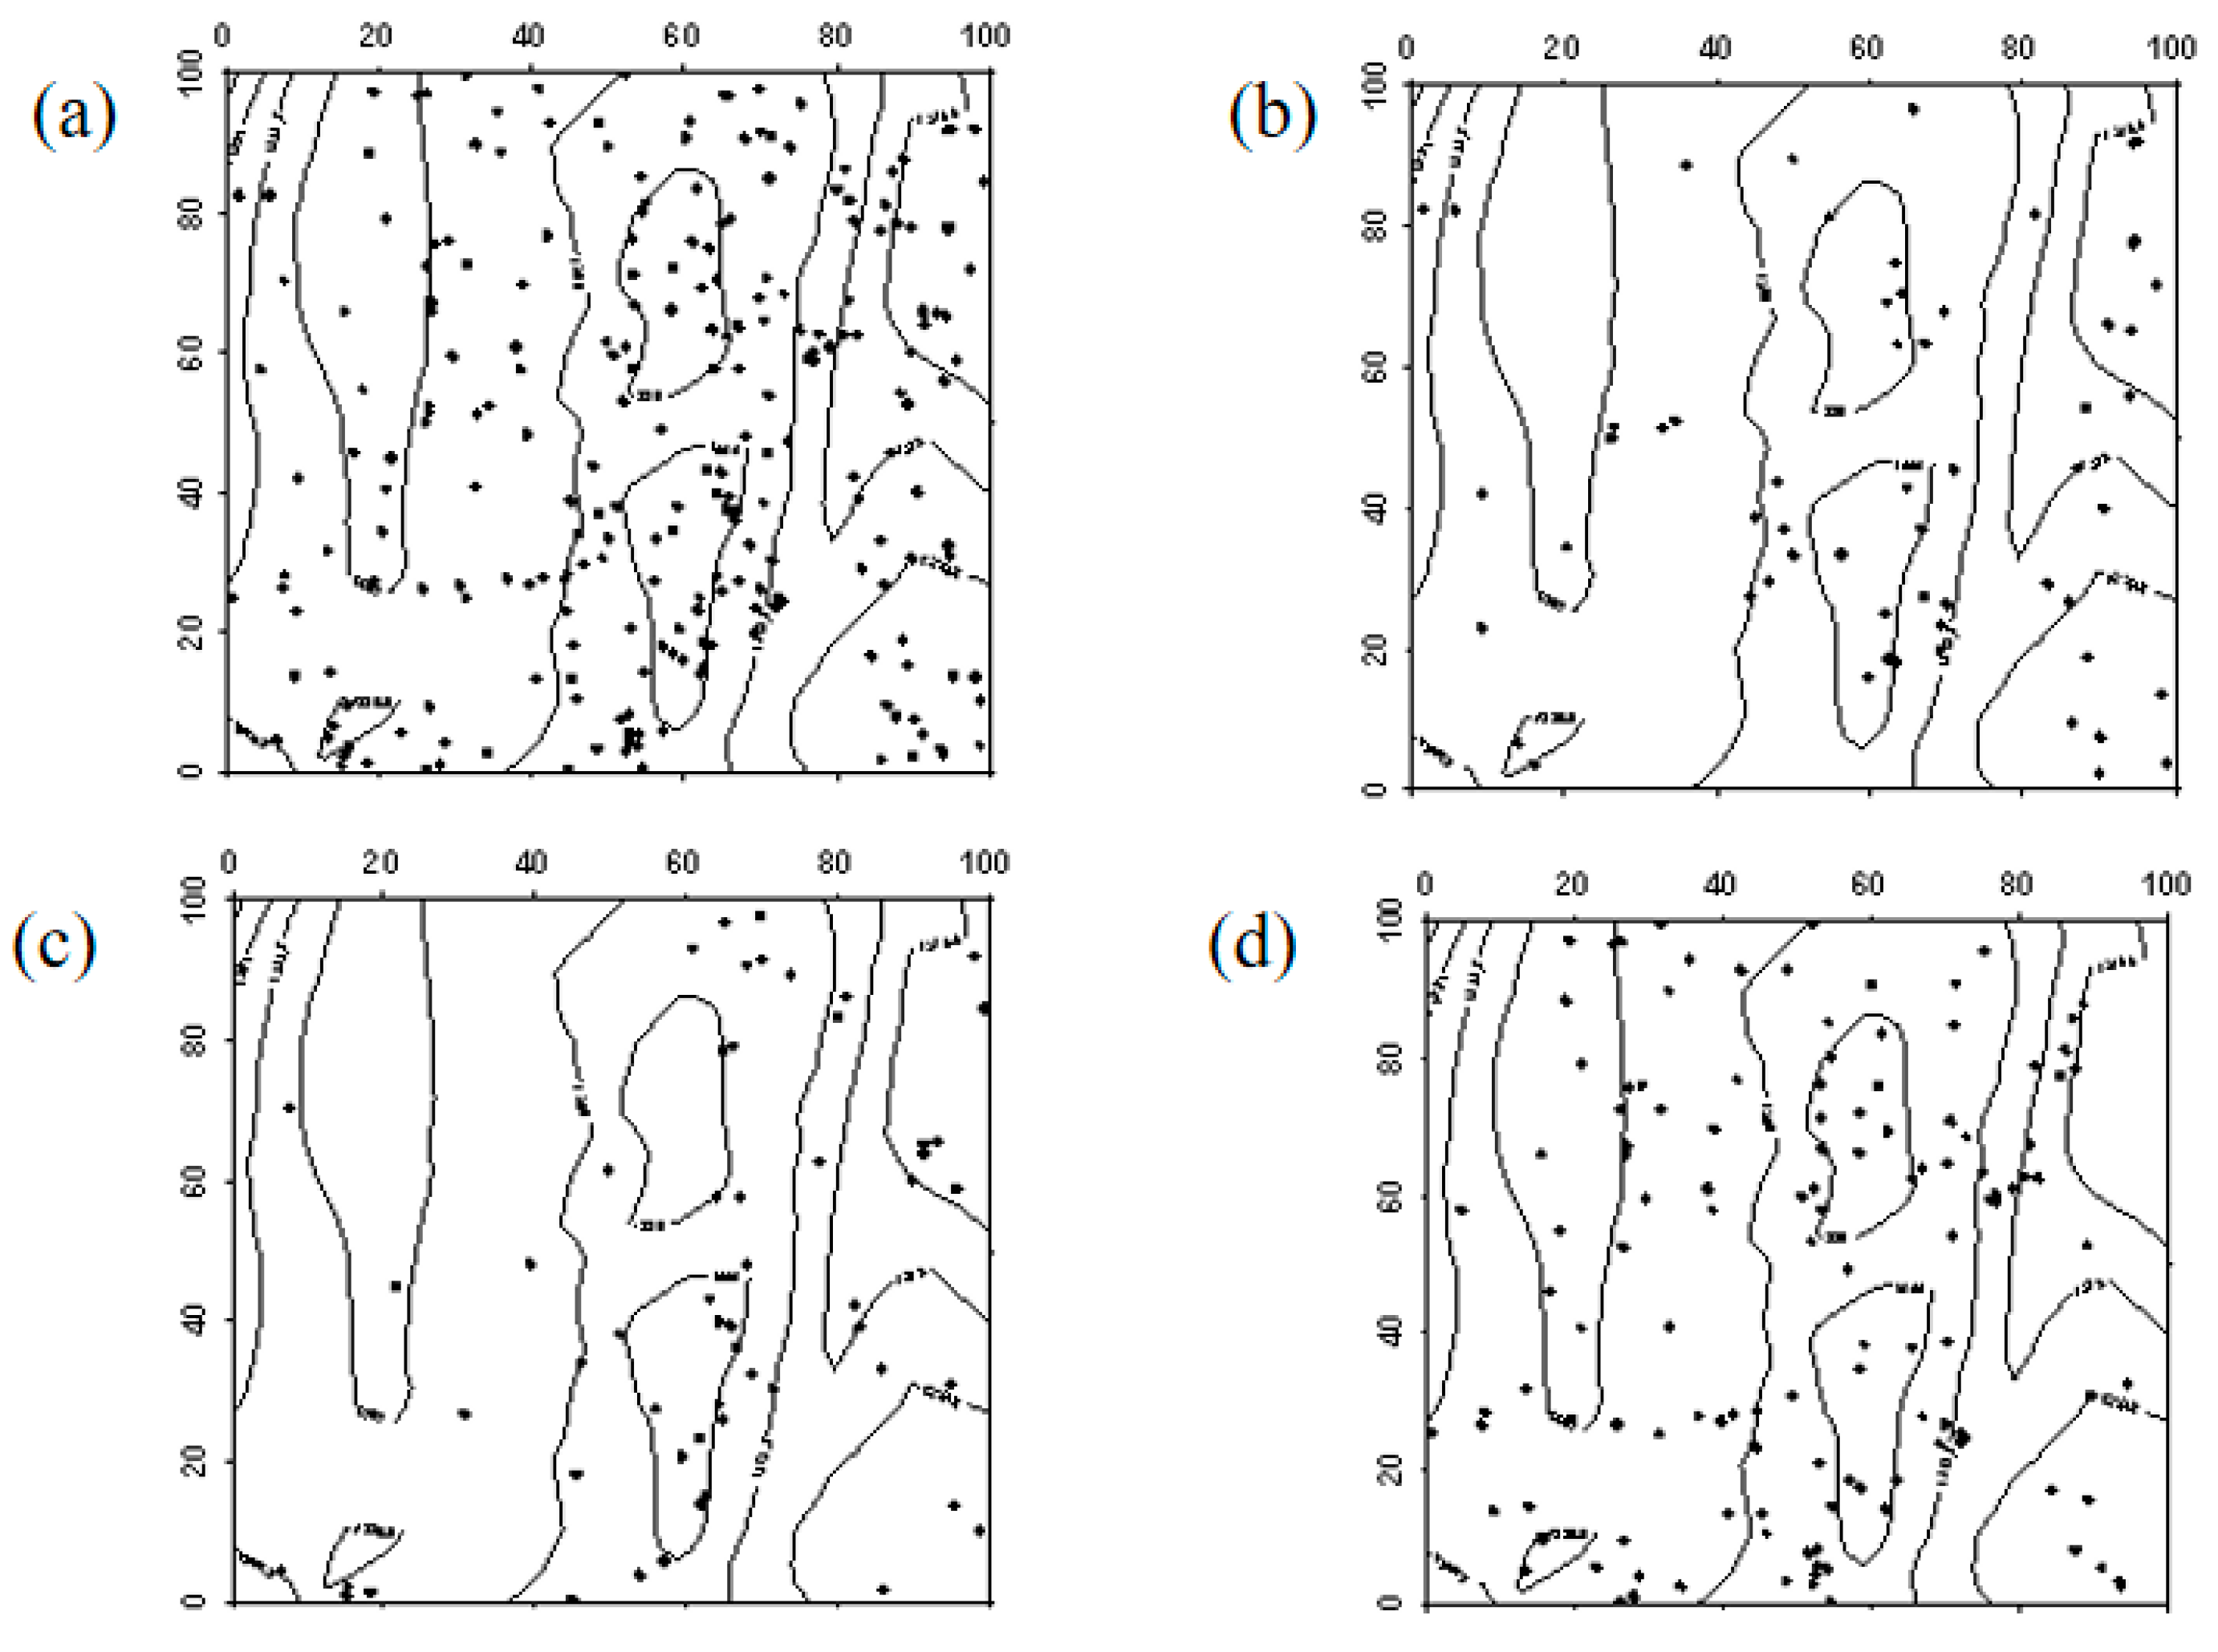
Spatial distribution pattern of surviving Ulmus pumila saplings ((a–d) represent saplings in 2019, saplings that remained saplings from 2019 to 2024, saplings that advanced to mature trees from 2019 to 2024, and saplings that died between 2019 and 2024, respectively).
3.2.2. Spatial Distribution of Robinia pseudoacacia Seedlings and Saplings
In 2019, Robinia pseudoacacia seedlings were evenly distributed within the sample plot. However, due to the high mortality rate of Robinia pseudoacacia in 2024, the number of individuals decreased. In the western part of the sample plot, Robinia pseudoacacia seedlings and saplings showed a random distribution, whereas in the eastern part, they were evenly distributed. The spatial distribution of seedlings transitioning into saplings and saplings progressing into mature trees was similar to the distribution of seedlings (Figure 7, Figure 8 and Figure 9).
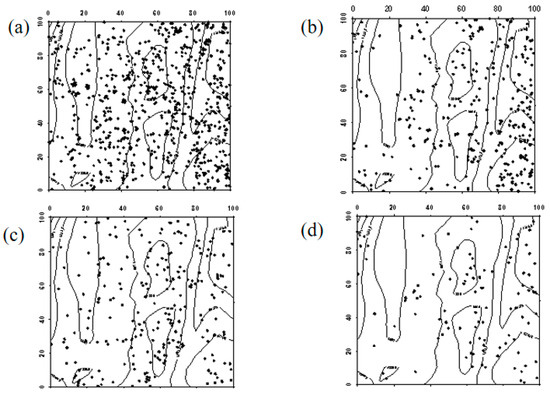
Figure 7.
Spatial distribution patterns of Robinia pseudoacacia seedlings and saplings ((a–d) represent the spatial distribution of Robinia pseudoacacia seedlings in 2019, Robinia pseudoacacia seedlings in 2024, Robinia pseudoacacia saplings in 2019, and Robinia pseudoacacia saplings in 2024, respectively).
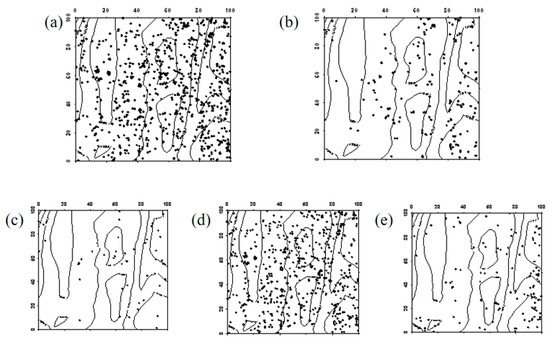
Figure 8.
Spatial distribution pattern of surviving Robinia pseudoacacia seedlings ((a–e) represent seedlings in 2019, seedlings that remained seedlings from 2019 to 2024, seedlings that advanced to saplings from 2019 to 2024, seedlings that died between 2019 and 2024, and newly emerged seedlings in 2024, respectively).
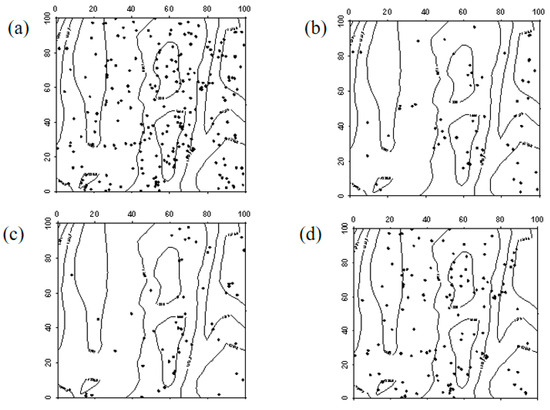
Figure 9.
Spatial distribution pattern of surviving Robinia pseudoacacia saplings ((a–d) represent saplings in 2019, saplings that remained saplings from 2019 to 2024, saplings that advanced to mature trees from 2019 to 2024, and saplings that died between 2019 and 2024, respectively).
3.2.3. Spatial Distribution of Ailanthus altissima Seedlings and Saplings
In 2019, Ailanthus altissima seedlings were generally evenly distributed across the sample plot, with a higher density in the southwest corner. By 2024, the number of Ailanthus altissima seedlings had significantly increased, showing a clustered distribution in the northeast corner of the sample plot, while the rest were mostly randomly distributed. In 2019, Ailanthus altissima saplings were evenly distributed. However, by 2024, due to the high mortality rate, the number of saplings had significantly decreased. Apart from the southwestern part of the sample plot, where saplings remained evenly distributed due to their higher density, the rest showed a random distribution (Figure 10, Figure 11 and Figure 12).
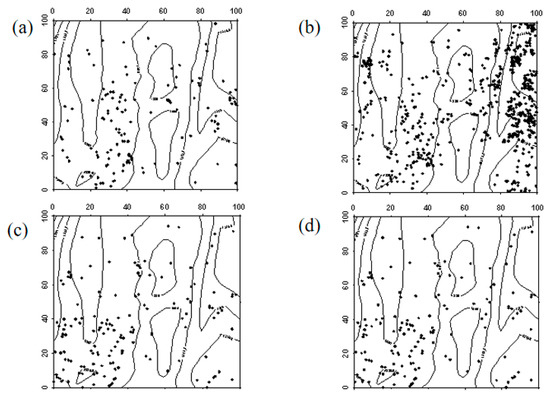
Figure 10.
Spatial distribution patterns of Ailanthus altissima seedlings and saplings ((a–d) represent the spatial distribution of Ailanthus altissima seedlings in 2019, Ailanthus altissima seedlings in 2024, Ailanthus altissima saplings in 2019, and Ailanthus altissima saplings in 2024, respectively).
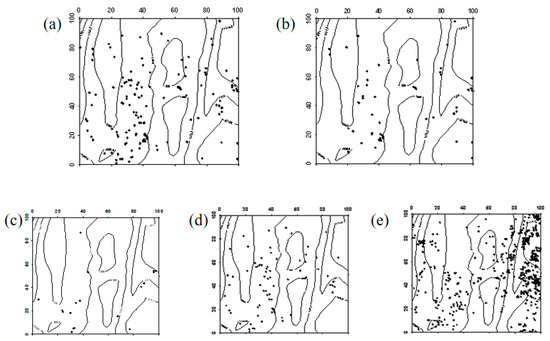
Figure 11.
Spatial distribution pattern of surviving Ailanthus altissima seedlings ((a–e) represent seedlings in 2019, seedlings that remained seedlings from 2019 to 2024, seedlings that advanced to saplings from 2019 to 2024, seedlings that died between 2019 and 2024, and newly emerged seedlings in 2024, respectively).
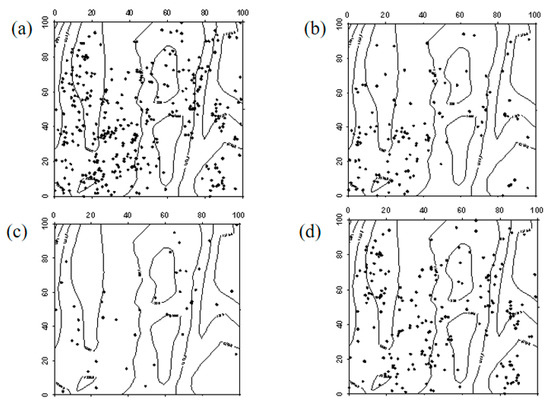
Figure 12.
Spatial distribution pattern of surviving Ailanthus altissima saplings ((a–d) represent saplings in 2019, saplings that remained saplings from 2019 to 2024, saplings that advanced to mature trees from 2019 to 2024, and saplings that died between 2019 and 2024, respectively).
3.3. Relationship Between Seedling and Sapling Survival and Light, Topography, and Biological Factors
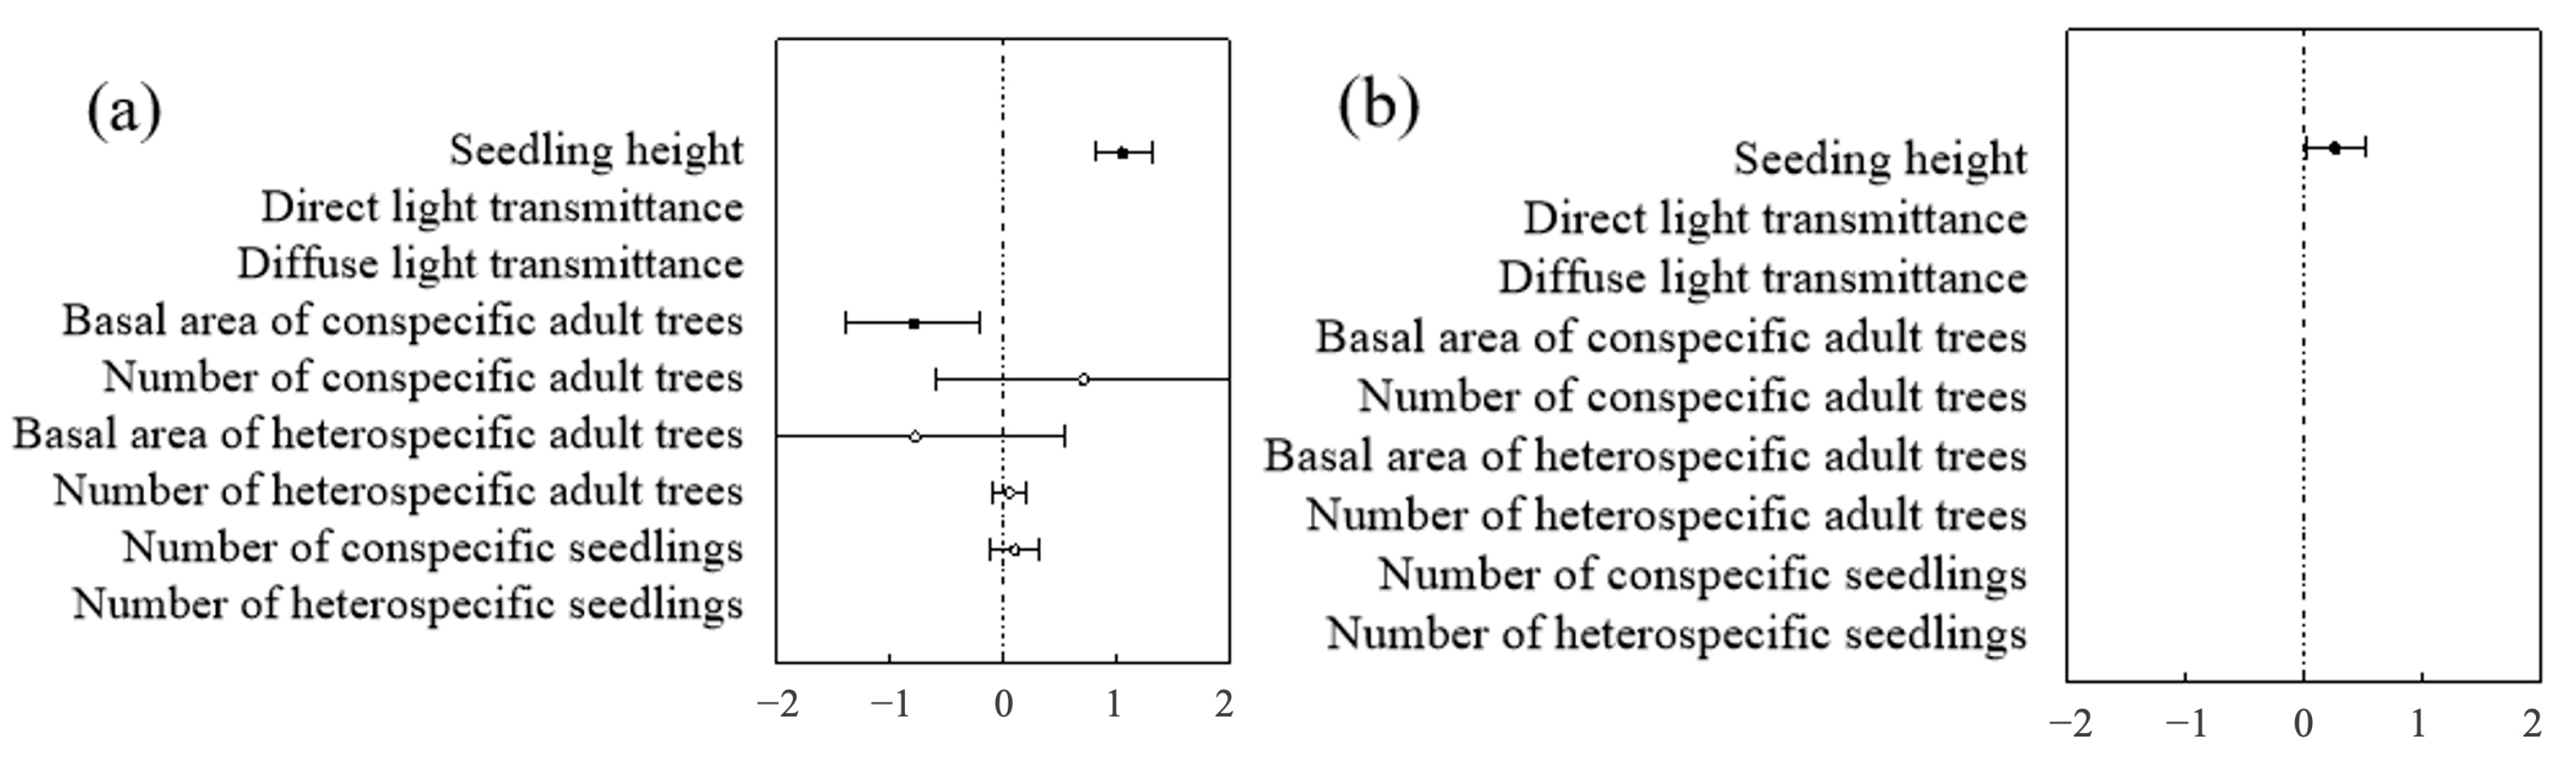
The survival of seedlings and saplings is influenced by numerous factors, which can be classified into biological and non-biological factors. Studies have shown that the number of neighboring individuals is an important factor affecting seedling survival. Additionally, tree seedling height is a critical factor influencing survival rates as survival rates tend to increase with seedling height.
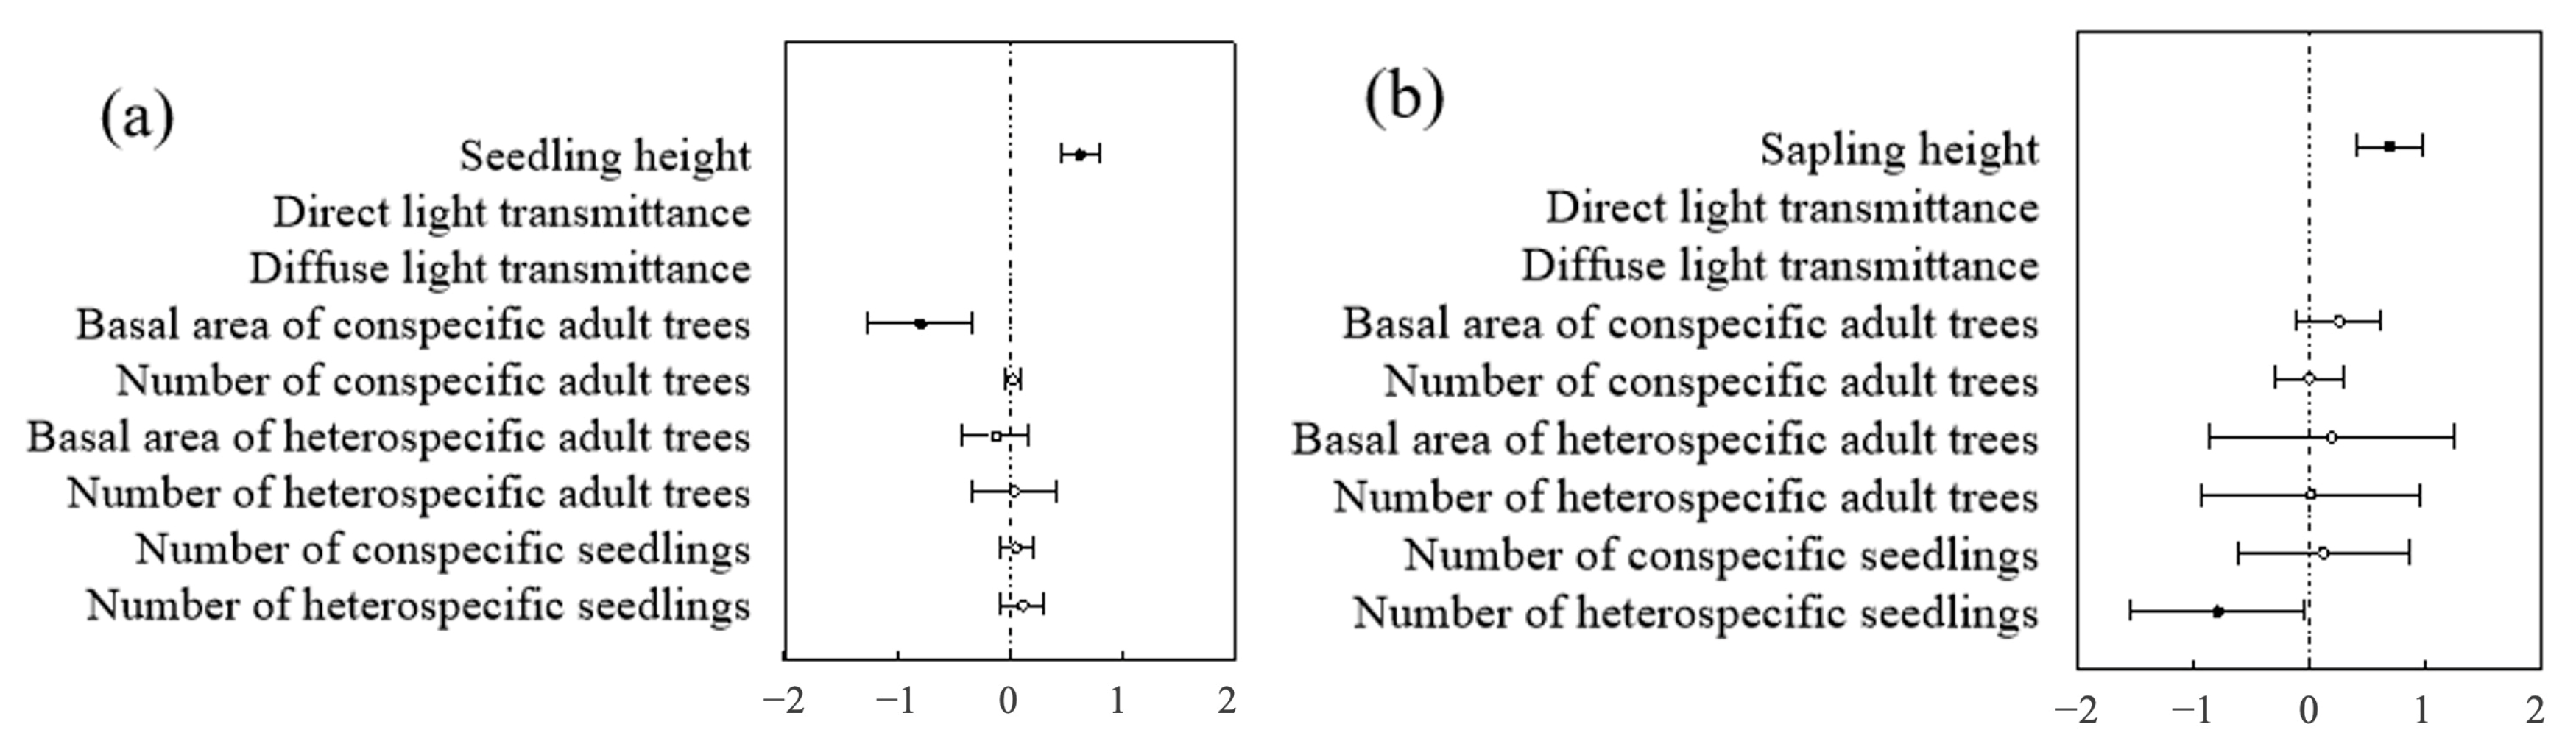
At both the community and species levels, the optimal model for predicting seedling and sapling survival was the height model and the biological factors model (Table 4 and Table 5). In contrast, within the non-biological factors model, light, altitude, slope, and aspect had no significant impact on seedling and sapling survival. In both the optimal height model and the biological factors model, seedling and sapling survival were closely related to height, showing a significant positive correlation—i.e., the taller the seedling or sapling, the higher its likelihood of survival (Figure 13).
Table 4.
AIC values of seedling survival models at the community level.
Table 5.
AIC values of sapling survival models at the community level.
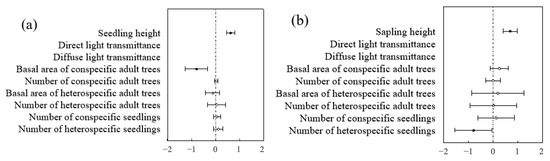
Figure 13.
Community-level analysis of factors influencing seedlings and saplings: (a) represents the community level of seedlings; (b) represents the community level of saplings.
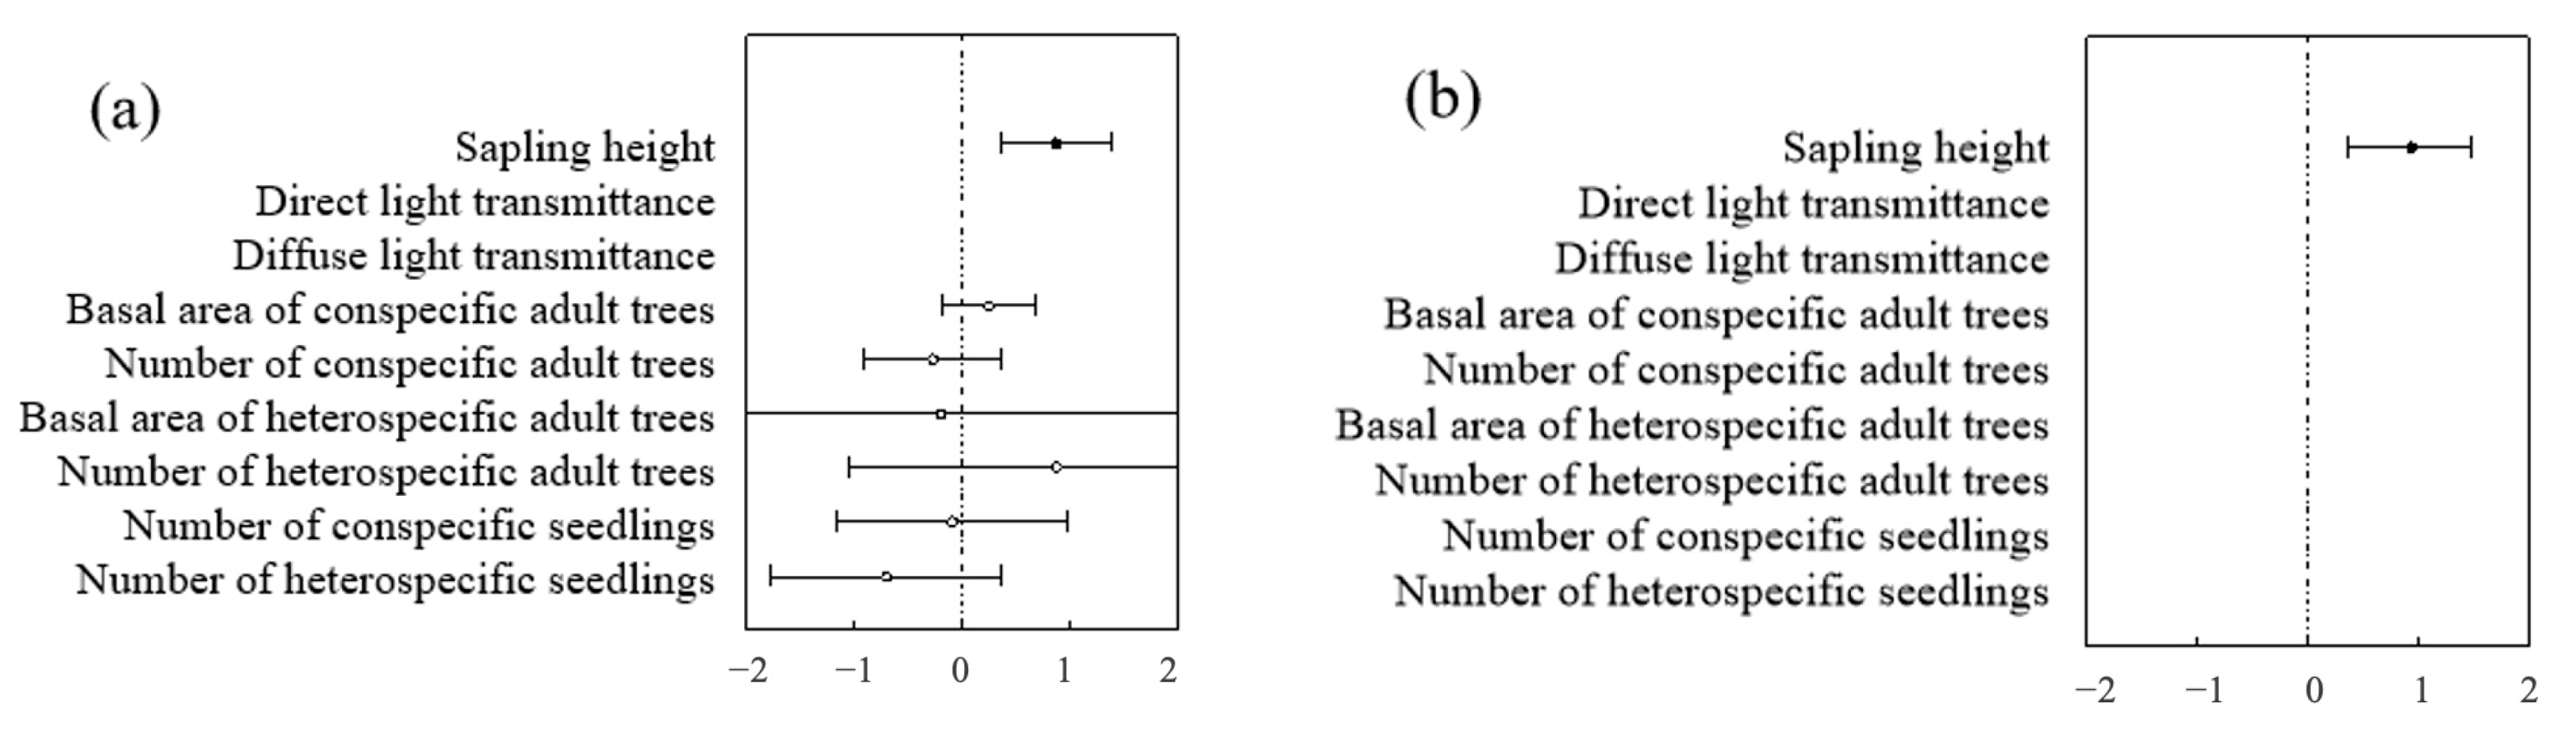
Different species exhibited different influencing factors. The seedlings within the sample plot consisted mainly of Ulmus pumila and Robinia pseudoacacia. The optimal biological model revealed species-specific influencing factors. For Robinia Robinia pseudoacacia. seedlings, the seedling height model demonstrated the strongest predictive power for survival rates based on the AIC value, whereas the biological factor model emerged as the most robust predictor for Ulmus pumila and Ailanthus altissima seedling survival (Table 6 and Table 7). In addition to seedling height, factors influencing Ulmus pumila seedling survival included the basal area at breast height (BAH) and the number of conspecific mature trees, with the former showing a significant negative correlation and the latter a significant positive correlation with survival. In contrast, black locust seedling survival was influenced by the number of heterospecific mature trees and the number of heterospecific seedlings, with the former having a significant negative correlation and the latter a significant positive correlation. The primary factor influencing sapling survival was sapling height, which showed a significant positive correlation (Figure 14 and Figure 15).
Table 6.
AIC values of seedling survival models at the species level.
Table 7.
AIC values of sapling survival models at the species level.

Figure 14.
Species-level analysis of factors influencing seedlings: (a) represents Ulmus pumila seedlings; (b) represents Robinia pseudoacacia seedlings.
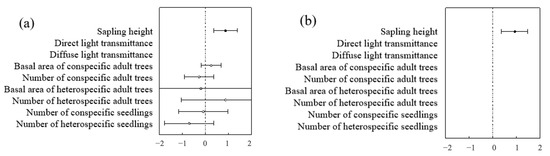
Figure 15.
Species-level analysis of factors influencing saplings: (a) represents Ailanthus altissima saplings; (b) represents Robinia pseudoacacia saplings.
In summary, during the vegetation restoration process in the Pingshuo open-pit coal mine reclamation area, seedling and sapling height and biological factors played a more crucial role in survival than non-biological factors. A significant density-dependent effect was observed but no clear niche differentiation was found. That is, seedling height and density-dependent effects jointly influenced seedling and sapling survival.
4. Discussion
A comparison of survey data from 2019 and 2024 in the sample plots revealed that the survival rate and growth of Ulmus pumila seedlings and saplings were significantly higher than those of Robinia pseudoacacia and Ailanthus altissima. The superior growth performance of Ulmus pumila suggests that it has a competitive advantage over black locust and tree of heaven in interspecific interactions, allowing it to better adapt to the local environmental conditions. In contrast, several species—including Salix matsudana, Populus simonii, Rhus typhina, and Lycium barbarum—disappeared from the sample plots by 2024. This indicates that seedling survival rate is a crucial determinant of species persistence. If seedling survival is low, even initially dominant species may be replaced by other, more competitive species within the community. The disappearance of certain species also highlights the importance of environmental filtering and competitive exclusion in shaping community composition over time.
Spatial distribution patterns describe the horizontal arrangement of individuals within a population and reflect their spatial relationships. These patterns are influenced by both species-specific biological traits and environmental conditions. Spatial structure not only reflects past ecological processes but also plays a crucial role in predicting future vegetation dynamics and species interactions [35,36]. A comparative analysis of the spatial distribution of seedlings and saplings between 2019 and 2024 revealed that the distribution of major tree species in 2024 remained largely consistent with that observed in 2019. In areas where seedlings were densely distributed in 2019, the density remained high in 2024, whereas in previously sparse regions, seedling density showed a moderate increase. These findings align with observed species abundance trends and indicate a degree of spatial stability in the community.
The results of a generalized linear model (GLM) analysis revealed a significant positive correlation between seedling height and survival probability. Although the strength of this correlation varied across different levels, a clear trend emerged: taller seedlings exhibited higher survival rates. Height is often a proxy for competitive ability, as taller seedlings are more likely to access light and other resources, thereby increasing their chances of survival [37,38]. Our findings suggest that biotic factors play a more significant role in seedling and sapling survival than abiotic factors. This is consistent with the conclusions of Shibata et al. [39], who found that tree regeneration in temperate forests of Japan was primarily driven by biological interactions rather than environmental constraints. Specifically, we observed the following: the survival of Ulmus pumila seedlings was negatively affected by both the basal area and the individual number of conspecific mature trees. This suggests that intra-specific competition, likely for light and nutrients, plays a key role in regulating Ulmus pumila seedling survival. In contrast, the survival of Robinia pseudoacacia seedlings was positively correlated with the number of heterospecific seedlings and mature trees but negatively correlated with the number of heterospecific mature trees. This indicates that Robinia pseudoacacia seedlings may benefit from facilitation by certain species while being suppressed by competition from others. These findings highlight the importance of species interactions in shaping community dynamics, supporting the theory of density-dependent regulation in plant populations [40,41]. While biotic factors were dominant, certain abiotic factors, such as elevation and slope, also had significant negative correlations with sapling survival. These findings suggest that topographic conditions impose substantial constraints on tree regeneration in the region. Steeper slopes may be associated with lower soil moisture retention and increased erosion, reducing the establishment success of young trees [42,43]. Future studies should incorporate additional abiotic variables—such as soil properties (e.g., nutrient availability, pH, and moisture content) and microtopography—to provide a more comprehensive understanding of seedling and sapling dynamics in reclaimed mining areas.
By analyzing seedling and sapling abundance, spatial distribution, and survival drivers, this study contributes valuable data for understanding vegetation dynamics in reclaimed mining areas. The findings provide a scientific basis for optimizing species selection and community reconstruction in similar mining reclamation sites. Specifically, the observed competitive dominance of Ulmus pumila suggests that it may be a key species for future restoration efforts. However, its potential impact on biodiversity and community structure should be carefully evaluated. This study also underscores the importance of long-term ecological monitoring in assessing restoration success. While the four-year interval (2019–2024) provides valuable insights, a longer study period is necessary to capture broader successional trends and interactions among species. The positive correlation between Robinia pseudoacacia and certain species may originate from mutually beneficial allelopathic effects. For instance, flavonoids released by leguminous plants can enhance nitrogen fixation by symbiotic bacteria. Allelopathic effects, through suppressing competitors or modifying microbial communities, may explain the interplant interaction patterns observed in Robinia pseudoacacia seedlings. Additionally, future research should expand the scope of analysis to include a more comprehensive set of environmental factors, such as soil characteristics (e.g., organic matter content, microbial diversity, and soil content), hydrological conditions (e.g., groundwater availability, precipitation variability, and water availability), and microclimatic influences (e.g., temperature fluctuations and wind exposure) [44,45]. The Digital Hemisphere Photography method adopted in this study is widely used in light measurement but its assumption that the canopy openings are evenly distributed within the quadrate is controversial. Although statistical methods were used in this study for statistical error correction, some studies have shown that the light intensity can significantly change due to differences in canopy structure within 1 m, and the central point measurement of the 10 m × 10 m quadrate may ignore the influence of local shadows or light-transmitting patches [46]. Therefore, in future studies, multi-scale illumination measurement can be added to supplement the illumination data of small-scale plots (such as a 1 m × 1 m sub-quadrangle), or the mobile hemispheric photography system can be used to shoot multiple points along the diagonal of the quadrangle to capture the spatiotemporal heterogeneity of illumination.
5. Conclusions
This study is based on the reclamation area of the Pingshuo open-pit coal mine in 2019 and 2024, focusing on all seedlings and saplings within the mixed plantation of Robinia pseudoacacia + Ulmus pumila + Ailanthus altissima. This study explored the dynamic changes in the number of seedlings and saplings between 2019 and 2024 and the influencing factors under the ecological restoration model of the mixed plantation. The main conclusions are as follows:
- (1)
- The species composition of seedlings and saplings remained unchanged, while the number of seedlings increased significantly, with the greatest increase observed in Ulmus pumila seedlings. The transition of seedlings into saplings and saplings into mature trees—as well as the mortality distribution of seedlings and saplings—generally aligned with the overall distribution patterns at the community level;
- (2)
- At both the community and species levels, the optimal models for seedling and sapling survival were the height model and the biological factor model. Seedling and sapling survival exhibited a significant positive correlation with height;
- (3)
- The key biological factors influencing Ulmus pumila seedling survival were the basal area and the number of conspecific mature trees, both of which showed a significant negative correlation with survival. In contrast, the main biological factors affecting black locust seedling survival were the number of heterospecific mature trees and the number of heterospecific seedlings, with the former showing a significant negative correlation and the latter a significant positive correlation with survival. The primary factor influencing sapling survival was sapling height, which displayed a significant positive correlation.
Author Contributions
Data processing, J.L.; Supervision, D.G.; Validation, D.G.; Writing—original draft, J.L.; Writing—review and editing, D.G. All authors have read and agreed to the published version of the manuscript.
Funding
This research was supported by the Fundamental Research Program of Shanxi Province (No. 202303021222029).
Institutional Review Board Statement
Not applicable.
Informed Consent Statement
Not applicable.
Data Availability Statement
The original contributions presented in this study are included in the article. Further inquiries can be directed to the corresponding author.
Acknowledgments
We acknowledge Antaibao Open-pit Coal Mine (Pinglu, Shanxi Province, China) for granting site access essential to field data collection.
Conflicts of Interest
The authors declare no conflicts of interest.
References
- Zhang, X.; Zheng, Y.; Yang, Y.; Ren, H.; Liu, J. Spatiotemporal evolution of ecological vulnerability on the Loess Plateau. Ecol. Indic. 2025, 170, 113060. [Google Scholar] [CrossRef]
- Sun, W.; Song, X.; Mu, X.; Gao, P.; Wang, F.; Zhao, G. Spatiotemporal vegetation cover variations associated with climate change and ecological restoration in the Loess Plateau. Agric. For. Meteorol. 2015, 209, 87–99. [Google Scholar] [CrossRef]
- Yang, J.; Wei, H.; Quan, Z.; Xu, R.; Wang, Z.; He, H. A global meta-analysis of coal mining studies provides insights into the hydrologic cycle at watershed scale. J. Hydrol. 2023, 617, 129023. [Google Scholar] [CrossRef]
- Mardonova, M.; Han, Y.S. Environmental, hydrological, and social impacts of coal and nonmetal minerals mining operations. J. Environ. Manag. 2023, 332, 117387. [Google Scholar] [CrossRef]
- Holl, K.D. Long-term vegetation recovery on reclaimed coal surface mines in the eastern USA. J. Appl. Ecol. 2002, 39, 960–970. [Google Scholar] [CrossRef]
- Lei, H.; Peng, Z.; Yigang, H.; Yang, Z. Vegetation and soil restoration in refuse dumps from open pit coal mines. Ecol. Eng. 2016, 94, 638–646. [Google Scholar] [CrossRef]
- Latawiec, A.E.; Crouzeilles, R.; Brancalion, P.H.S.; Rodrigues, R.R.; Sansevero, J.B.; dos Santos, J.S.; Mills, M.; Nave, A.G.; Strassburg, B.B. Natural regeneration and biodiversity: A global meta-analysis and implications for spatial planning. Biotropica 2016, 48, 844–855. [Google Scholar] [CrossRef]
- Yang, Y.; Wang, L.; Yang, Z.; Xu, C.; Xie, J.; Chen, G.; Lin, C.; Guo, J.; Liu, X.; Xiong, D.; et al. Large ecosystem service benefits of assisted natural regeneration. J. Geophys. Res. Biogeosciences 2018, 123, 676–687. [Google Scholar] [CrossRef]
- Yu, Y.; Zhao, W.; Martinez-Murillo, J.F.; Pereira, P. Loess Plateau: From degradation to restoration. Sci. Total Environ. 2020, 738, 140206. [Google Scholar] [CrossRef]
- Jiao, J.; Zhang, Z.; Bai, W.; Jia, Y.; Wang, N. Assessing the ecological success of restoration by afforestation on the Chinese Loess Plateau. Restor. Ecol. 2012, 20, 240–249. [Google Scholar] [CrossRef]
- An, S.S.; Cheng, Y.; Huang, Y.M.; Liu, D. Effects of revegetation on soil microbial biomass, enzyme activities, and nutrient cycling on the Loess Plateau in China. Restor. Ecol. 2013, 21, 600–607. [Google Scholar] [CrossRef]
- Castro, S.; Ferrero, V.; Loureiro, J.; Espadaler, X.; Silveira, P.; Navarro, L. Dispersal mechanisms of the narrow endemic Polygala vayredae: Dispersal syndromes and spatio-temporal variations in ant dispersal assemblages. Plant Ecol. 2010, 207, 359–372. [Google Scholar] [CrossRef]
- Nathan, R.; Muller-Landau, H.C. Spatial patterns of seed dispersal, their determinants and consequences for recruitment. Trends Ecol. Evol. 2000, 15, 278–285. [Google Scholar] [CrossRef] [PubMed]
- Yang, X.; Long, Y.; Sarkar, B.; Li, Y.; Lü, G.; Ali, A.; Yang, J.; Cao, Y.-E. Influence of soil microorganisms and physicochemical properties on plant diversity in an arid desert of Western China. J. For. Res. 2021, 32, 2645–2659. [Google Scholar] [CrossRef]
- Qiang, W.; He, L.; Zhang, Y.; Liu, B.; Liu, Y.; Liu, Q.; Pang, X. Aboveground vegetation and soil physicochemical properties jointly drive the shift of soil microbial community during subalpine secondary succession in southwest China. Catena 2021, 202, 105251. [Google Scholar] [CrossRef]
- Baeza, M.J.; Valdecantos, A.; Alloza, J.A.; Vallejo, V. Human disturbance and environmental factors as drivers of long-term post-fire regeneration patterns in Mediterranean forests. J. Veg. Sci. 2007, 18, 243–252. [Google Scholar]
- Juřička, D.; Kusbach, A.; Pařílková, J.; Houška, J.; Ambrožová, P.; Pecina, V.; Rosická, Z.; Brtnický, M.; Kynický, J. Evaluation of natural forest regeneration as a part of land restoration in the Khentii massif, Mongolia. J. For. Res. 2020, 31, 1773–1786. [Google Scholar] [CrossRef]
- Hu, J.; Ye, B.; Bai, Z.; Feng, Y. Remote sensing monitoring of vegetation reclamation in the Antaibao open-pit mine. Remote Sens. 2022, 14, 5634. [Google Scholar] [CrossRef]
- Wang, J.; Ouyang, J.; Zhang, M. Spatial distribution characteristics of soil and vegetation in a reclaimed area in an opencast coalmine. CATENA 2020, 195, 104773. [Google Scholar] [CrossRef]
- Lan, S.; Zhang, Q.; Wu, L.; Liu, Y.; Zhang, D.; Hu, C. Artificially accelerating the reversal of desertification: Cyanobacterial inoculation facilitates the succession of vegetation communities. Environ. Sci. Technol. 2014, 48, 307–315. [Google Scholar] [CrossRef]
- Anderson-Teixeira, K.J.; Davies, S.J.; Bennett, A.C.; Gonzalez-Akre, E.B.; Muller-Landau, H.C.; Wright, S.J.; Abu Salim, K.; Almeyda Zambrano, A.M.; Alonso, A.; Baltzer, J.L.; et al. CTFS-Forest GEO: A worldwide network monitoring forests in an era of global change. Glob. Change Biol. 2015, 21, 528–549. [Google Scholar] [CrossRef] [PubMed]
- Lin, L.; Comita, L.S.; Zheng, Z.; Cao, M. Seasonal differentiation in density-dependent seedling survival in a tropical rain forest. J. Ecol. 2012, 100, 905–914. [Google Scholar] [CrossRef]
- Liu, Z.; Jia, C.; Qin, Z.; Li, Y. Effects of light environment on the growth of Larch in North China. J. Nanjing For. Univ. (Nat. Sci. Ed.) 2019, 44, 111–117. [Google Scholar]
- Zheng, F.; Li, Z.; Qiu, Z.; Zhao, H.; Zhou, G. Effects of understory light environment on functional traits of young trees in natural evergreen broad-leaved forest in Nanling, Guangdong Province. Acta Ecol. Sin. 2019, 40, 4516–4527. [Google Scholar]
- Zheng, F. Effects of Understory Light on Functional Traits of Evergreen Broad-leaved Forest Saplings in Nanling Xiaokeng Areas Nanling. Master’s Thesis, Chinese Academy of Forestry, Beijing, China, 2020. [Google Scholar] [CrossRef]
- Duan, J.; Zhang, Q.; Bai, J.; Guo, D. Community characteristics and canopy structure of natural pine and oak mixed forest in Lingkongshan, Shanxi Province. Chin. J. Appl. Ecol. 2019, 30, 49–57. [Google Scholar] [CrossRef]
- Duan, J. Light Spirit Empty Mountain Pine Oak Mixed Forest Community Environment Characteristics and Its Influence on Seedling Survival. Master’s Thesis, Shanxi University, Taiyuan, China, 2019. [Google Scholar] [CrossRef]
- Song, Y.; Ryu, Y. Seasonal changes in vertical canopy structure in a temperate broadleaved forest in Korea. Ecol. Res. 2015, 30, 821–831. [Google Scholar] [CrossRef]
- Gastauer, M.; Leyh, W.; Meira-Neto, J.A. Tree diversity and dynamics of the forest of Seu Nico, Viçosa, Minas Gerais, Brazil. Biodivers. Data J. 2015, 31, e5425. [Google Scholar] [CrossRef] [PubMed]
- Comeau, P.G.; Gendron, F.; Letchford, T. A comparison of several methods for estimating light under a paper birch mixedwood stand. Can. J. For. Res. 1998, 28, 1843–1850. [Google Scholar] [CrossRef]
- Engelbrecht, B.M.; Herz, H.M. Evaluation of different methods to estimate understorey light conditions in tropical forests. J. Trop. Ecol. 2001, 17, 207–224. [Google Scholar] [CrossRef]
- Peng, H.; Zhao, C.; Feng, Z.; Xu, Z. Extracting the canopy structure parameters using hemispherical photography method. Shengtai Xuebao/Acta Ecol. Sin. 2011, 31, 3376–3383. [Google Scholar]
- Lin, F.; Comita, L.S.; Wang, X.; Bai, X.; Yuan, Z.; Xing, D.; Hao, Z. The contribution of understory light availability and biotic neighborhood to seedling survival in secondary versus old-growth temperate forest. Plant Ecol. 2014, 215, 795–807. [Google Scholar] [CrossRef]
- Cui, J.Y.; Zeng, H.C.; Wang, Y.Q.; Zhang, Y.; Hu, Y.H.; Su, Z.Y. Canopy structure and radiation attenuation effects of broadleaved forest in Yinshan National Nature Reserve. J. Northwest For. Univ. 2015, 30, 45–49. [Google Scholar]
- Condit, R.; Hubbell, S.P.; Foster, R.B. Mortality rates of 205 neotropical tree and shrub species and the impact of a severe drought. Ecol. Monogr. 1995, 65, 419–439. [Google Scholar] [CrossRef]
- Turner, M.G. Landscape ecology: The effect of pattern on process. Annu. Rev. Ecol. Syst. 1989, 20, 171–197. [Google Scholar] [CrossRef]
- Poorter, L.; Bongers, L.; Bongers, F. Architecture of 54 moist-forest tree species: Traits, trade-offs, and functional groups. Ecology 2006, 87, 1289–1301. [Google Scholar] [CrossRef]
- Wright, S.J.; Kitajima, K.; Kraft, N.J.B.; Reich, P.B.; Wright, I.J.; Bunker, D.E.; Condit, R.; Dalling, J.W.; Davies, S.J.; Diaz, S.; et al. Functional traits and the growth–mortality trade-off in tropical trees. Ecology 2010, 91, 3664–3674. [Google Scholar] [CrossRef]
- Shibata, M.; Masaki, T.; Tanaka, H.; Niiyama, K.; Iida, S.; Abe, S.; Nakashizuka, T. Effects of abiotic and biotic factors and stochasticity on tree regeneration in a temperate forest community. Ecoscience 2010, 17, 137–145. [Google Scholar] [CrossRef]
- Murdoch, W.W. Population regulation in theory and practice. Ecology 1994, 75, 271–287. [Google Scholar] [CrossRef]
- Antonovics, J.; Levin, D.A. The ecological and genetic consequences of density-dependent regulation in plants. Annu. Rev. Ecol. Syst. 1980, 11, 411–452. [Google Scholar] [CrossRef]
- Harper, J.L.; Williams, J.T.; Sagar, G.R. The behaviour of seeds in soil: I. The heterogeneity of soil surfaces and its role in determining the establishment of plants from seed. J. Ecol. 1965, 53, 273–286. [Google Scholar] [CrossRef]
- Maestre, F.T.; Cortina, J.; Bautista, S.; Bellot, J.; Vallejo, R. Small-scale environmental heterogeneity and spatiotemporal dynamics of seedling establishment in a semiarid degraded ecosystem. Ecosystems 2003, 6, 630–643. [Google Scholar] [CrossRef]
- Sewerniak, P.; Puchałka, R. Topographically induced variation of microclimatic and soil conditions drives ground vegetation diversity in managed Scots pine stands on inland dunes. Agric. For. Meteorol. 2020, 291, 108054. [Google Scholar] [CrossRef]
- Hamid, M.; Gulzar, A.; Dar, F.A.; Singh, C.; Malik, A.H.; Kamili, A.N.; Khuroo, A.A. Microclimate heterogeneity modulates fine-scale edaphic and vegetation patterns on the Himalayan treelines: Implications under climate change. Agric. For. Meteorol. 2023, 341, 109688. [Google Scholar] [CrossRef]
- Kimura, K.; Yasutake, D.; Koikawa, K.; Kitano, M. Spatiotemporally variable incident light, leaf photosynthesis, and yield across a greenhouse: Fine-scale hemispherical photography and a photosynthesis model. Precis. Agric. 2023, 24, 114–138. [Google Scholar] [CrossRef]


Disclaimer/Publisher’s Note: The statements, opinions and data contained in all publications are solely those of the individual author(s) and contributor(s) and not of MDPI and/or the editor(s). MDPI and/or the editor(s) disclaim responsibility for any injury to people or property resulting from any ideas, methods, instructions or products referred to in the content. |
© 2025 by the authors. Licensee MDPI, Basel, Switzerland. This article is an open access article distributed under the terms and conditions of the Creative Commons Attribution (CC BY) license (https://creativecommons.org/licenses/by/4.0/).