Article

Assessing Characteristics of Strong Dynamic Loads in Deep Coal Mining and Their Mechanisms in Triggering Secondary Disasters

1
Shandong Energy Group Luxi Mining Co., Ltd., Heze 274700, China
2
The State Key Laboratory of Coal Resources and Safe Mining, China University of Mining and Technology, Xuzhou 221116, China
3
School of Mining Engineering, Anhui University of Science and Technology, Huainan 232001, China
*
Authors to whom correspondence should be addressed.
Appl. Sci. 2025, 15(8), 4529; https://doi.org/10.3390/app15084529
Submission received: 12 March 2025 / Revised: 16 April 2025 / Accepted: 17 April 2025 / Published: 19 April 2025

Abstract

:
After entering deep mining, coal mines often experience various intense dynamic load phenomena due to increasingly complex geological conditions, which can lead to secondary disasters, where it is urgent to identify their sources and analyze their disaster-causing effects. This article takes the 3310 working face in Gu Cheng Coal Mine as the engineering background, and uses theoretical analysis, numerical simulation, on-site monitoring, and other methods to analyze the spatial and temporal distribution of dynamic load events during the mining period of this face. The study classifies dynamic load events based on this background into roof-type, fault-type, and coal pillar-type classes, revealing the differences in the spectra, waveforms, and disaster-causing effects of each class. The results show that the strong dynamic load events are mainly concentrated in the working face roof and fault zone areas. The first principal frequency of the three classes has an estimated boundary between 30 and 60 Hz. The waveform decay coefficients of the roof-type, coal pillar-type, and fault-type strong dynamic load events have average values of 4.53, 1.57, and 1.41, respectively. By adopting the above research methods, a theoretical basis can be provided for the source of dynamic loads, thereby achieving source-based prevention and control of rock burst.

1. Introduction

With the rapid development of industrial economy in China, shallow coal energy can no longer meet the daily needs of the country, and coal mining has gradually moved into deeper levels. Due to factors such as hard roof fractures, fault activation, and coal pillar instability, strong dynamic loads are often generated during mining operations, leading to dynamic disasters such as ground pressure impact. Strong dynamic load in deep coal mining refers to the sudden and instantaneous vibration in the coal and rock mass around the shaft or working face, accompanied by loud noise and shock wave, but without the release of elastic deformation energy of coal and rock being thrown out [1]. With the increase in mining depth, these dynamic loads caused by mining-induced seismic events have shown diverse characteristics, with variable rupture patterns and different propagation and decay of dynamic load waves. This makes it difficult to predict and prevent strong dynamic load disasters induced by mining-induced seismicity. Therefore, it is crucial to study the characteristics of different types of dynamic loads and their mechanisms in triggering ground pressure impact.
Mine seismic activity will trigger coal rock body decompression, and under specific conditions, it will induce mine dynamics disasters such as roofing, sheet ganging, bottom drumming, coal and gas protrusion, impact ground pressure, and so on. In this context, several studies have been conducted on mining earthquakes. Linming et al. [2] not only consider mining-induced seismicity as a response to local stress during mining but also classify it into three types: mining-induced fracturing type, massive overlying strata type, and high-energy mining-induced seismicity type. Fuxing et al. [3] classified mining-induced seismicity into three types: ground pressure impact-induced type, fault structure activation type, and roof movement type. In addition, the roof movement type was further divided into three classes: key layer fracture type, key layer rotation type, and key layer slip type. As for the research on the mechanisms of mining-induced seismicity, Stec and Blaszczyk [4] calculated the source mechanism parameters and seismic source parameters, both processes involved in mining-induced seismicity. These parameters were determined by the seismic moment tensor inversion method and Sejsgram and Multilok seismological analysis software, respectively.
Xuebin et al. [5] categorized micro-seismic signal characteristics into five types: mining-induced seismicity, blasting, coal rock fracture, percussion, and noise. The authors argue that mining-induced seismic events are related to the fracturing of hard rock layers above coal seams, characterized by high maximum amplitude and average amplitude, with energy generally not less than 105 J. As the working face advances, mine earthquakes primarily affect the far-field hard layers. In the early stage of coal mining, the frequency of earthquakes is significantly higher. After the mine earthquake goes into the higher hard strata, the frequency of strong mine earthquakes in lower layers decreases [6]. The main causes associated with large-energy mining-induced seismic events, which even lead to rock burst in fully mechanized coal mining faces, are the fracturing instability of the extremely thick conglomerate layer (main key layer) and the thick hard rock layer (sub-key layer) above the coal seam [7]. Yuezheng et al. [8] take the Yanbei coal mine as research background to explore the triggering effect of solid tides on mine surface earthquakes.
Mingshi et al. [9] conducted seismic wave propagation experiments in different media and concluded that energy in rock and soil media decays exponentially with propagation distance. By analyzing the impact destruction mechanism of coal bodies in tunnels under the combined action of dynamic and static loads, Anye et al. [10] found that the propagation and attenuation characteristics of mine earthquake vibration energy mainly depend on the geometric diffusion of energy, the damping attenuation of the propagating rock medium, and the combined influence of the vibration displacement field and energy radiation characteristics of the mine earthquake source. In this regard, although the main frequency distribution characteristics can reflect the energy distribution at specific frequencies, they cannot capture the waveform decay pattern during seismic wave propagation. Researchers have demonstrated through on-site micro-seismic experiments that the wave amplitude, energy, and velocity of vibrations in deep mining areas decay exponentially during propagation [9,11]. Due to the faster propagation velocity in the medium, P waves arrive first at the seismometer position, while S waves arrive slightly later and gradually attenuate after reaching peak velocity. Figure 1 shows an example of a post-peak amplitude decay curve.
In a study focusing on the induction of rock burst by dynamic loads, Linming et al. [12] studied the energy and stress conditions for ground pressure impact induced by the superposition of dynamic and static loads. The authors analyzed the characteristics of these loads in coal mines, arguing that ground pressure impact occurs under conditions of high static and strong dynamic loads. Yunliang et al. [13] stated that under the combined action of dynamic and static loads, various types of rock burst disasters can be induced, including large-scale gravity-induced rock burst, hard roof-induced rock burst, structural-induced rock burst, coupled mining and structural-induced rock burst, and coal pillar stress concentration-induced rock burst. Mining tremor mechanisms and principal stress directions were analyzed in order to compare the characteristics of seismic events and stress regimes with tectonic settings [14].
At present, scholars have a detailed understanding of the causes and source mechanisms of mining-induced earthquakes. However, there is still no unified and widely accepted theory or view on the mechanism of ground pressure shock induced by strong dynamic loads. The theories commonly used to explain ground pressure impact phenomena include strength theory [15,16], stiffness theory [17,18,19], impact tendency theory [20,21], deformation system instability theory [22,23], and Three-Factor Theory [24,25]. In addition, Khorrami et al. [26] used a hybrid inversion method and found that the depth of the seismic source and the sliding modes had a significant effect on the propagation pattern of seismic waves. Zhang et al. [27] used the waveform inversion technique to estimate the source coefficients of the 2021 magnitude 7.2 Haiti earthquake in detail using data from multiple seismic stations, revealing its source characteristics by inversely analyzing the source depth, epicenter location, and the source mechanism. Aslan et al. [28] analyzed the source coefficients of the 2023 magnitude 7.8 Turkey–Syria earthquake by using inversion to extract the source depth, fault location, and source mechanism from the earthquake waveforms.
Previously, scholars have researched the cause, classification, and impact on the ground pressure mechanism of mining earthquake and proposed specific prevention and control measures for the impact of the ground pressure disaster induced by it [1,2,3,4,5,6,7,8,9,10,11,12,13,14]. However, most of the above studies address the perspective of strong mining earthquakes, studying the mechanism of induced dynamic disaster by analyzing the seismic source parameter of different types of these earthquakes as well as the characteristics of waveforms. In this context, there are few reports on the mechanism of induced impact ground pressure in terms of the strong dynamic loading of deep mining, a gap that must be filled due to the importance of the subject to waveform spectrum analysis in deep underground contexts. In this article, based on the 3310 working face of Gu Cheng Coal Mine, the waveform and energy data of the dynamic load vibration during the mining operation were collected. Furthermore, the conceptual model of strong dynamic load of the coal pillar-type, roof-type, and fault-type and its conceptual model are shown in Figure 2 below.
In this context, Fourier Transform is a mathematical tool that converts a time-domain signal into a frequency-domain signal by decomposing a continuous or discrete signal into a series of sine and cosine functions. Consequently, this technique can be useful to clearly identify the main frequency band of dynamic load events, retain the effective frequency band, and suppress the noise of irrelevant frequency bands.
However, the computational complexity of traditional Fourier Transform algorithms is O(N2), which becomes very high when the signal length N is large. Coal mine seismic signals are often a finite set of discrete data, and a single seismic event corresponds to multiple waveform data from different stations. Therefore, using Discrete Fourier Transform (DFT) for processing these results causes high computational cost and time overhead. In contrast, Fast Fourier Transform [17] (FFT) significantly improves computational efficiency by exploiting the symmetry and repetitive nature of Fourier Transform, reducing the computational complexity from O(N2) to O(NlogN). The main computational steps of FFT are as follows:
  • If the length N of the signal is not a power of 2, perform zero-padding to make it a power of 2.
  • Divide the signal into equal halves and recursively compute each half.
  • Merge the results of the two halves through butterfly operations to obtain the final frequency-domain result.
According to the inversion of seismic source mechanism, FFT uses multifractal methods to solve the seismic source parameter of the dynamic load, analyzing the characteristics of the attenuation of the dynamic load wave, and summarizing the differences in the three types of strong dynamic loads in terms of the waveform characteristics and the response of the seismic source parameter law. In this study, we summarize the differences in waveform characteristics and seismic source parametric response patterns among the three types of strong dynamic loads. Furthermore, we propose a solution capable of partially filling the research gap of strong dynamic load characteristics in deep coal mining, and then provide a theoretical basis for the prevention and control of secondary disasters induced by strong dynamic loads in deep coal mining.
The remainder of this article is divided into the following sections: Section 2 (Materials and Methods); Section 3 (Results and Discussion); and Section 4 (Conclusions). The Methodology Section discusses the source of strong dynamic load data, the method of solving source parameters, FFT analysis theory, and the Multifractal Detrended Fluctuation Analysis (MFDFA) method. On the other hand, Section 3 address the experiments performed in the 3310 working face of Gu Cheng Coal Mine. Finally, Section 4 presents the main findings of this study and propose future contributions. The technical roadmap of this study is shown in Figure 3.

2. Materials and Methods

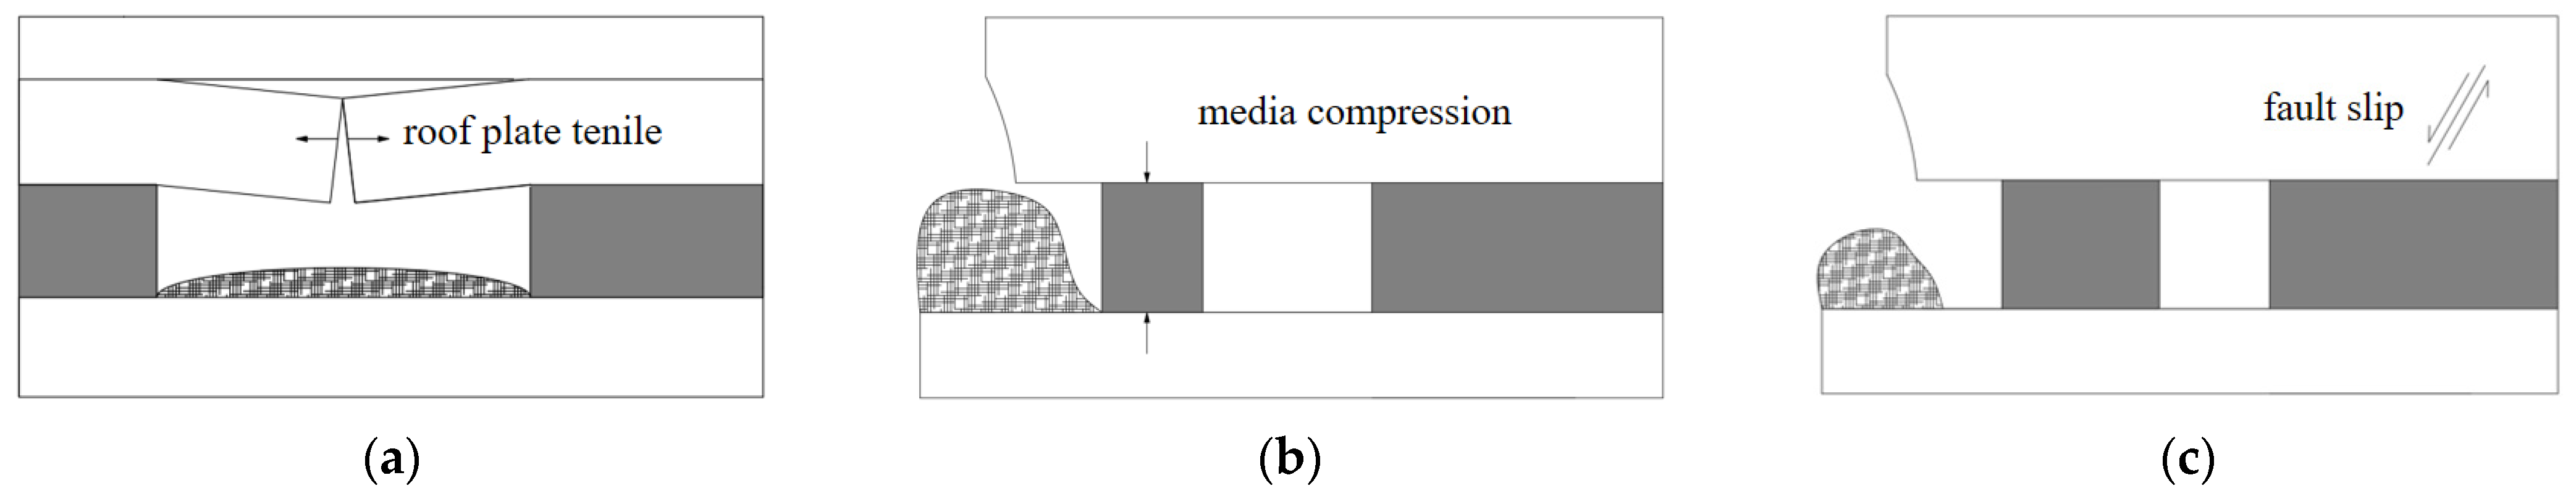
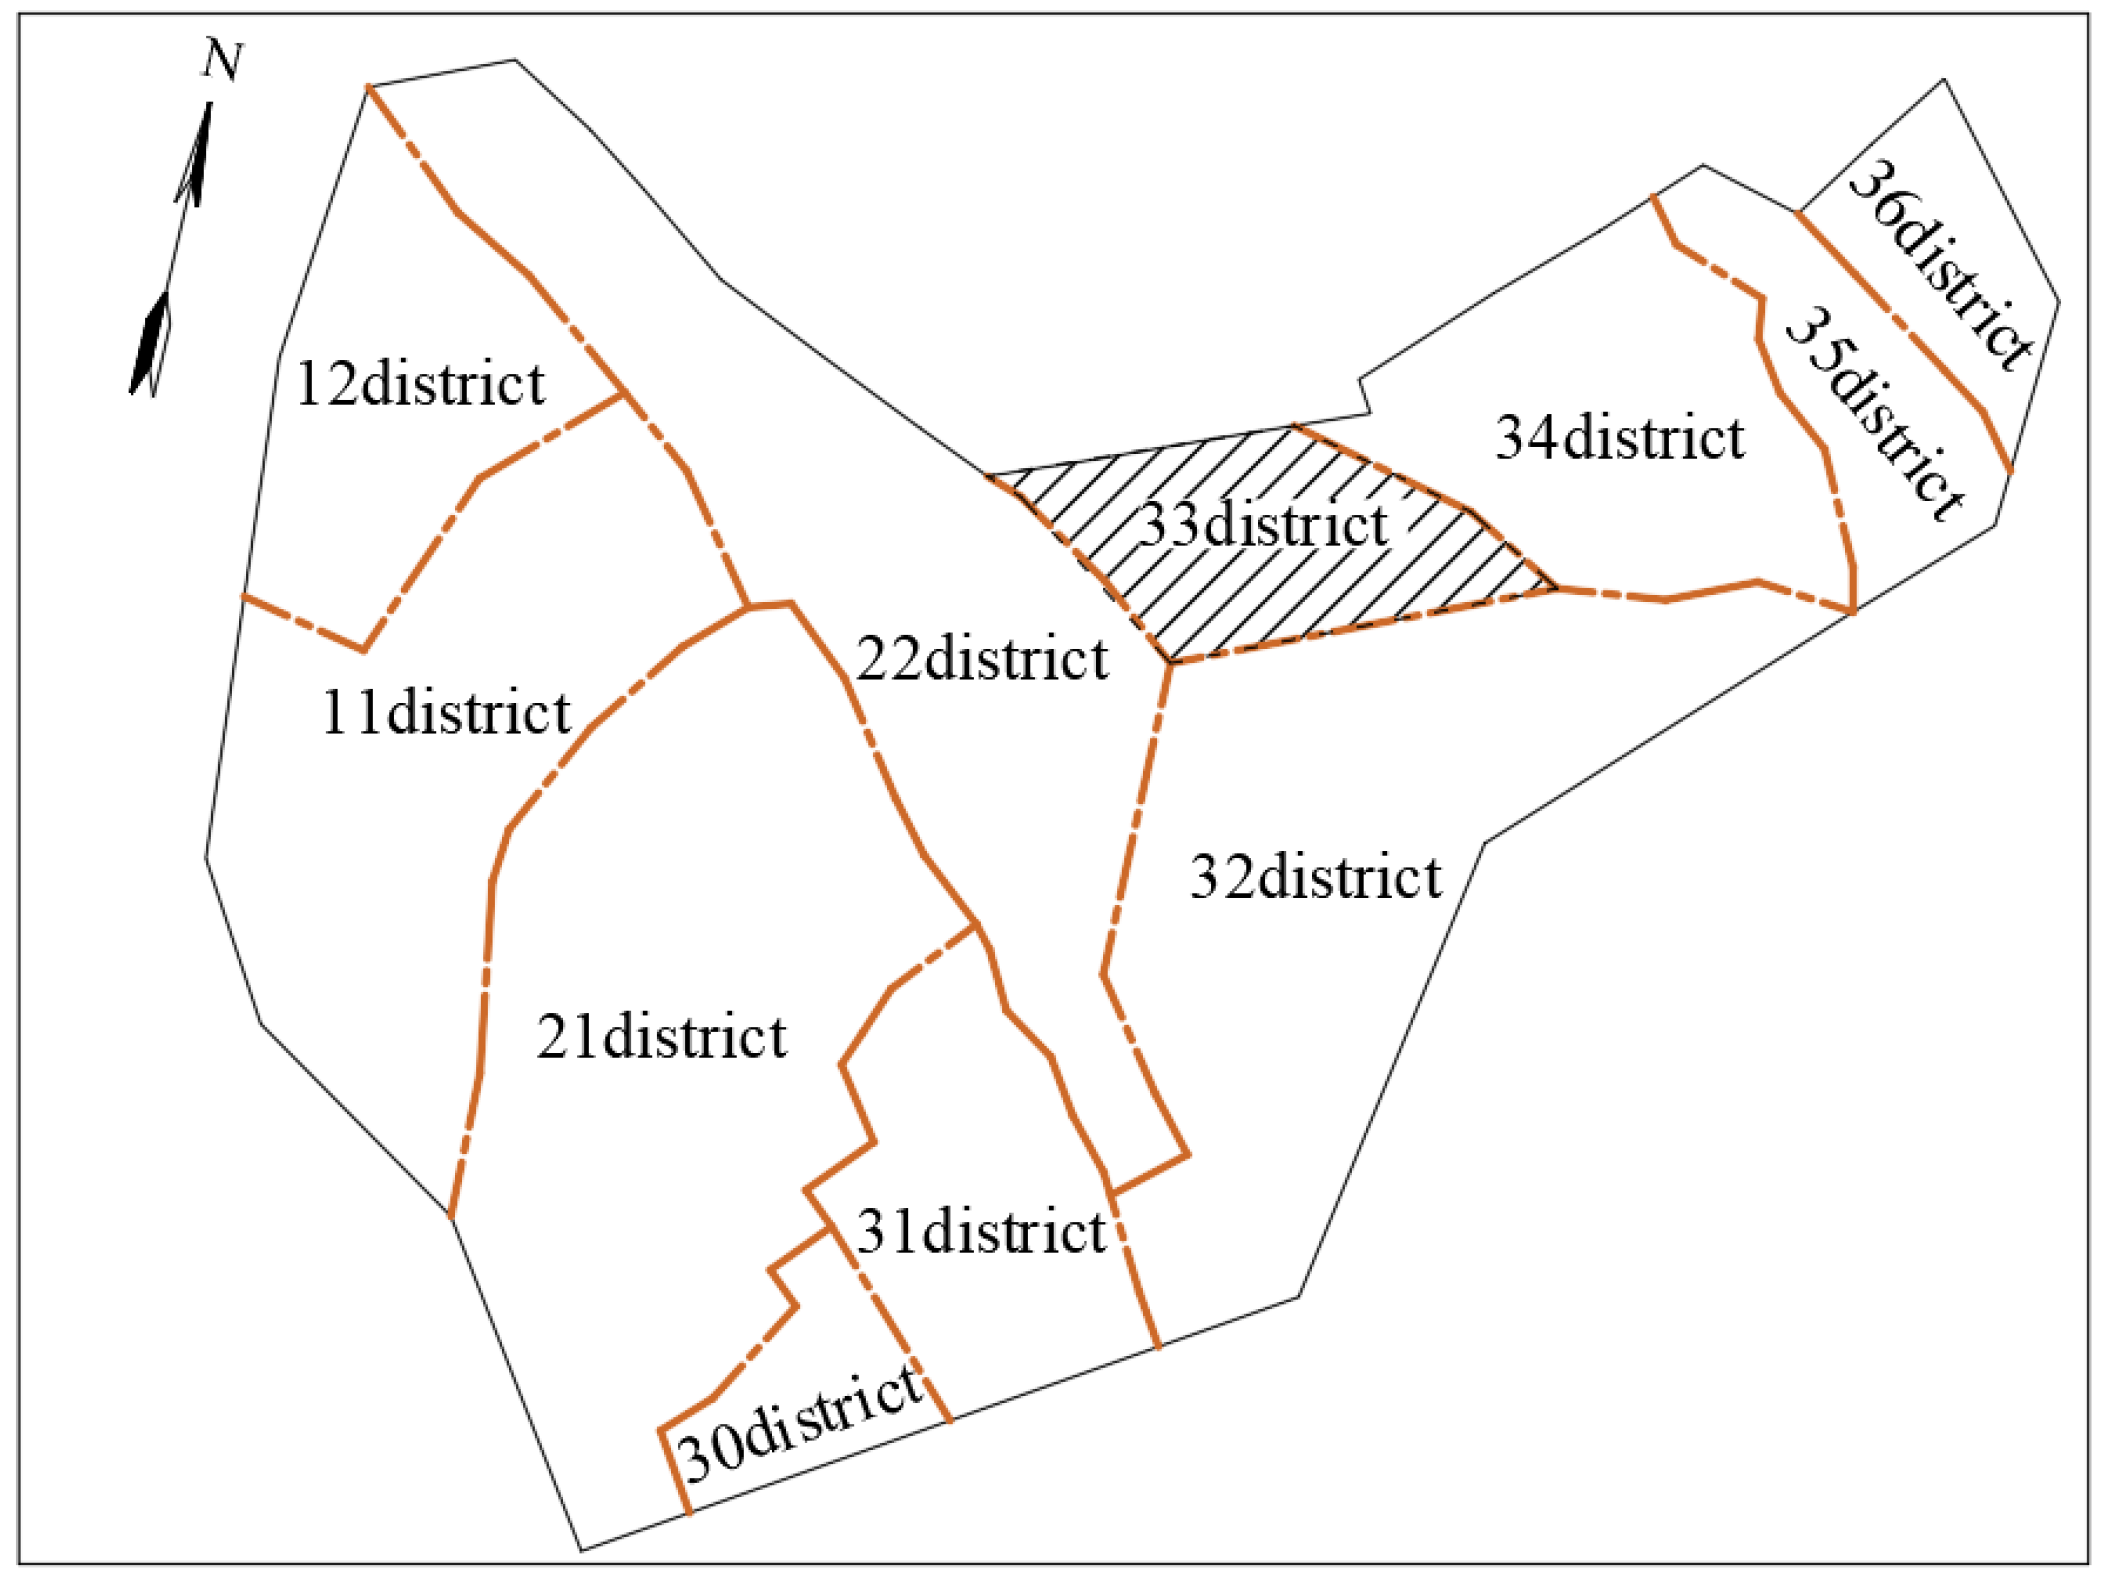
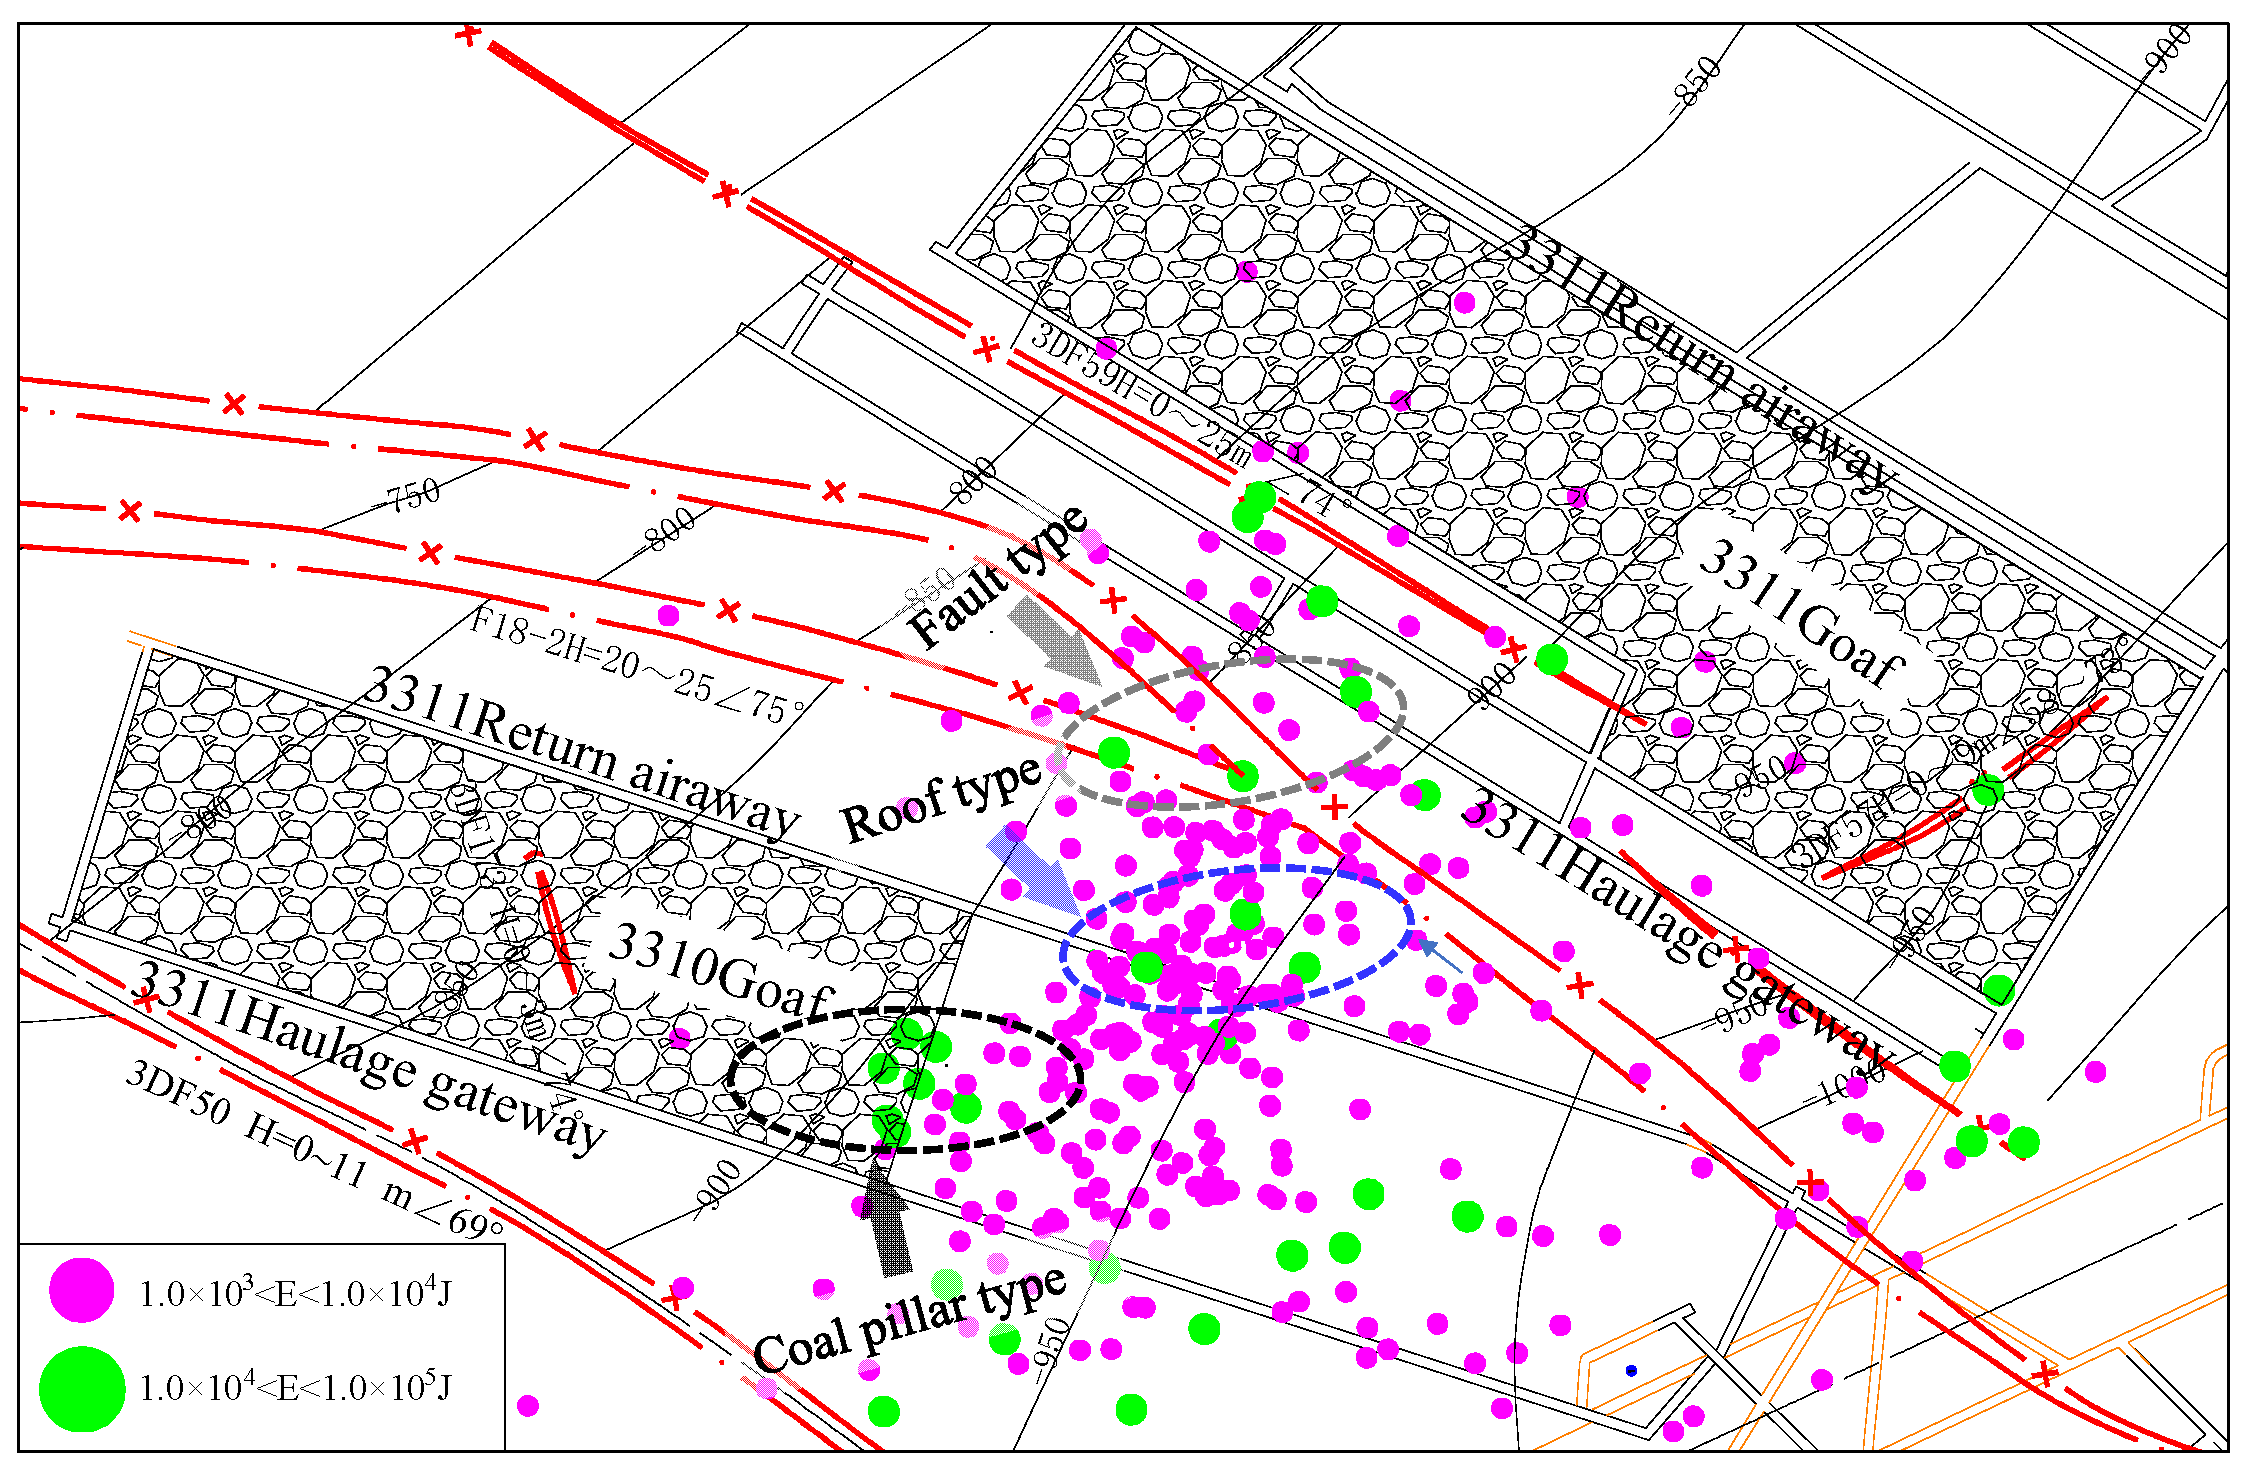
2.1. The Source of Strong Dynamic Load Data

The Gu Cheng Coal Mine is located in the eastern outskirts of Yanzhou District, Jining City, west of Qufu City. The terrain of the Gu Cheng Coal Mine, which belongs to the southwestern plain of Shandong Province, is flat, and it provides convenient transportation. The mining area covers approximately 16.66 km2, with a ground elevation of about +50 m. Overall, the mine exhibits a wide and gentle anticline structure, with the strata dipping southeast. There are local minor axis folds with small amplitudes. The Gu Cheng Coal Mine was established in May 1996 and began production in 2001. Its approved production capacity was 2.2 million tons per year in 2006, which decreased to 1.2 million tons per year in 2020. The mine adopts vertical shafts and inclined shafts with multiple horizontal developments. It is divided into three horizontal development layers, with the first layer at an elevation of −505 m, with the second layer at −850 m and the third layer at −1030 m. The mine can exploit a total of 7 coal seams or parts of coal seams, with an average thickness of 12.86 m. Among them, the 3rd coal seam of the Shanxi Formation is structurally simple and easy to mine, with an average thickness of 8.58 m, making it the main coal seam in the region. Figure 4 presents the division of mining areas in Gu Cheng Coal Mine.
The 33 mining area is located in the northeast part of the mine, with coal seam depths ranging from 770 m to 1030 m. The 3310 working face is situated in the southwest of the 33 mining area, with a maximum mining depth of −1030 m. Mining operations were ceased in March 2020, while its northeastern part was occupied by the 3311 working face, which was depleted in November 2013. The 3rd coal seam is the main coal seam in the 33 mining area, with an average coal thickness of 8.58 m. The immediate roof and floor are composed of fine sandstone, while the main roof and main floor consist of siltstone. During the excavation and mining of the 3310 working face, multiple faults were exposed, and the working face is surrounded by three major faults, with a large fault at the lower boundary of 3310 having a vertical drop from 0 m to 25 m. Overall, the 3310 working face has a large mining depth and complex geological conditions, making it susceptible to strong dynamic loads during mining operations. The seismic data used in this study were sourced from the Gu Cheng Coal Mine’s SOS micro-seismic monitoring system. The micro-seismic monitoring data were obtained by seismic sensors arranged near the studied panels in the coal mine, which can automatically pick up channel information, locate the seismic source on the mine map, and automatically calculate the micro-seismic energy.

2.2. Method for Seismic Source Parameters

Through moment tensor inversion, information about the slip of the rock fracture surface during a mine tremor can be obtained, thereby determining the type of fracture. However, specific parameters of the seismic source, such as intensity and disturbance scale, cannot be quantitatively characterized. To address this issue, the seismic source spectrum theory [30] was applied to estimate seismic parameters in mining-induced earthquakes. Most seismic source theories based on dislocation models suggest that the far-field displacement of the seismic source remains steady at low frequencies and decays in a power-law manner at high frequencies. The key to estimating seismic source parameters lies in determining the low-frequency displacement amplitude and corner frequency. The general seismic source spectrum model is expressed by Equation (1).
ϕ f = Ω 0 1 + f / f 0 γ n 1 / γ
This formula describes the seismic source spectrum, where ϕ(f) represents the far-field displacement spectrum of the seismic source; Ω0 is the low-frequency displacement of the seismic source; f is the frequency of the seismic source spectrum; f0 is the corner frequency; n is the decay rate of the high-frequency part of the seismic source double-log displacement spectrum; and γ is the sharpness of the corner of the seismic source double-log displacement spectrum.
The Brune seismic [31] source model provides a more optimal way to estimate the seismic source spectrum, as shown in Equation (2).
ϕ f = Ω 0 1 + f / f 0 2
The low-frequency displacement Ω0 and the corner frequency f0 can be obtained by solving the seismic source double logarithmic displacement-frequency spectrum through FFT and then fitted using the Brune model.
Underground coal mines typically use multiple monitoring stations for mine tremor monitoring. This means that for the same mine tremor event, there will be multiple time-domain waveforms. Additionally, signals may experience clipping, distortion, etc. In the subsequent solving process, seismic spectra are calculated using waveform data from effective monitoring stations, and the average values of low-frequency displacement and corner frequency are taken for seismic source parameter calculations.
In the double-couple fault source model [32], the scalar seismic moment is used to describe the seismic source rupture intensity, which is equivalent to the moment at the point of the seismic source. The seismic source rupture scale for mine tremors is generally smaller compared to tectonic earthquakes, and it can be determined using the aforementioned low-frequency displacement amplitude. Equation (3) represents the calculation of the seismic source radius.
M 0 = 4 π ρ v c 3 r Ω 0 F c R c
In this equation, M0 stands for the scalar seismic moment; ρ represents the density of the medium at the source, which is equivalent to 2500 kg/m3 at the seismic source location; vc represents the propagation velocity of P-waves or S-waves, with a P-wave velocity (vp) of 3000 m/s; r stands for the absolute distance from the seismic source to the seismometer; Fc represents the radiation coefficient for P-waves or S-waves, with P-waves taking 0.52 and S-waves taking 0.63; and Rc represents the amplitude free-surface amplification coefficient for P-waves or S-waves, which can be disregarded for seismometers in underground coal mines and taken as 1.0.
The seismic source radius can quantitatively describe the rupture scale. For circular fault rupture surfaces, the seismic source radius is inversely proportional to the corner frequency of P-waves or S-waves, calculated in Equation (4).
R 0 = K c v c 2 π f 0
Equation (4) represents the calculation of the volume of the seismic source, where R0 stands for the seismic source radius and Kc represents a constant dependent on the seismic source model, typically taken as 2.34 in the Brune model.
After different forms of rupture occur at the source of the mining earthquake, the inelastic deformation of the coal rock medium at the source will lead to a change in its volume, which can be quantitatively characterized using the apparent volume as in Equation (5), where μ represents the source medium shear modulus and Es represents the source radiant energy.
V s = M 0 2 2 μ E s
After the occurrence of a mining earthquake, the stress adjustment in the source region can be characterized by the stress drop, which is calculated as in Equation (6).
Δ σ = 7 M 0 16 R 0 3
The stress drop characterizes the change in stress level before and after the rupture of the seismic source, and the stress level after the rupture of the source can be determined by Equation (7) [33].
σ v = μ E s M 0

2.3. Peak Decay Analysis

The peak decay curve can be used to describe the decay pattern of the strong dynamic loads’ waveforms. It analyzes the waveform between the TStart and TEnd times. Figure 1 shows an example of a typical peak decay curve of a strong dynamic load signal, calculated as follows:
  • Determine the peak values on the velocity curve of the original signal after the peak.
  • Fit these peak values using spline interpolation to form the upper envelope after the peak.
  • Based on the exponential decay law, fit the upper envelope after the peak using a fitting formula.
v a = m t n
In Equation (8), va represents the post-peak fitting velocity; m is the fitting coefficient related to the peak velocity; and n is the decay coefficient, where a larger n leads to faster decay of va, and vice versa [34].

2.4. Multifractal Detrended Fluctuation Analysis (MFDFA) Method

Fractal theory, initially proposed by Mandelbrot [35], is used to analyze the spatial singularity distribution of non-stationary and nonlinear complex signals. By employing generalized fractal dimensions and multifractal spectra, the relationship between local-scale and global-scale characteristics of signals can be established. Multifractal analysis was applied to study the nonlinear features of natural earthquakes and mining-induced seismic signals. Seismic waveform signals are a type of time series, so calculating fractal dimensions and multifractal spectra can reveal the self-similar characteristics and repetitive patterns of signals, thereby assessing complexity and regularity of the signals. Traditional fractal analysis methods based on partition functions are insufficient to highlight the local singularity features of non-stationary signals. In this study, the Multifractal Detrended Fluctuation Analysis (MFDFA) method [36] is used to determine the fractal characteristics of different types of strong mining seismic signals, which are one-dimensional time series. For a strong mining seismic signal Xk with a length of N, the MFDFA method follows these steps:
  • Remove the mean value of Xk and reconstruct the signal as in Equation (9).
    Y i = k = 1 N X k X ¯
  • Divide Yi into Ns non-overlapping segments of length s. Since the signal length N is usually not a multiple of s, the remaining data segments are not usable. To address the data alignment issue, perform the same segmentation on the signal in reverse order, resulting in 2 Ns data segments.
  • Use the least squares method to calculate the local trend on each segment v (v = 1, …, 2 Ns). Then, calculate the variance of each segment after removing the trend fluctuations, using Equation (10).
    F 2 v , s = 1 s i = 1 s Y v 1 s + i Y v i 2 , v = 1 , , N s
  • For the 2 Ns segments, calculate the qth order fluctuation function F (q, s), using Equation (11).
    F q , s = 1 2 N s v = 1 2 N s F 2 v , s q 2 1 q
    where q represents the fluctuation weight factor.
  • If the strong mine seismic signal Xk exhibits self-similarity, then F (q, s) is in exponential relation with s, as shown as in Equation (12).
    F q , s s h q
    where h(q) represents the generalized Hurst exponent.
If the strong mine seismic signal Xk exhibits multifractal characteristics, then the corresponding h(q) will vary with q. For each q value, the slope can be obtained from the lnFq(s)~lns double-logarithmic coordinates.
  • Based on h(q), the multifractal scaling exponent τ(q) can be calculated using Equation (13).
    τ q = q h q 1
If τ(q) exhibits a nonlinear relationship with q, the signal possesses multifractal characteristics. If τ(q) forms a straight line, the signal exhibits mono-fractal characteristics.
  • Furthermore, through Legendre transformation, two parameters can be calculated to describe multifractal characteristics in Equations (14) and (15).
    α = h q + q h q
    f α = q α h q + 1
If f(α) is a constant, the signal exhibits mono-fractal characteristics, but if the behavior of f(α)~α is a single-peak bell shape, the signal exhibits multifractal characteristics.
  • The width Δα of the multifractal spectrum can describe the unevenness of the seismic waveform. A larger value indicates more severe waveform fluctuations, whereas a smaller value suggests a stable waveform, which represents the ratio of large peaks to small peaks in the seismic waveform. When Δ f ( α ) < 0 , the proportion of large amplitudes is higher, while when Δ f ( α ) > 0 , the proportion of small amplitudes is higher. The width of the multifractal spectrum Δα is calculated by Equation (17).
    Δ α = α max α min
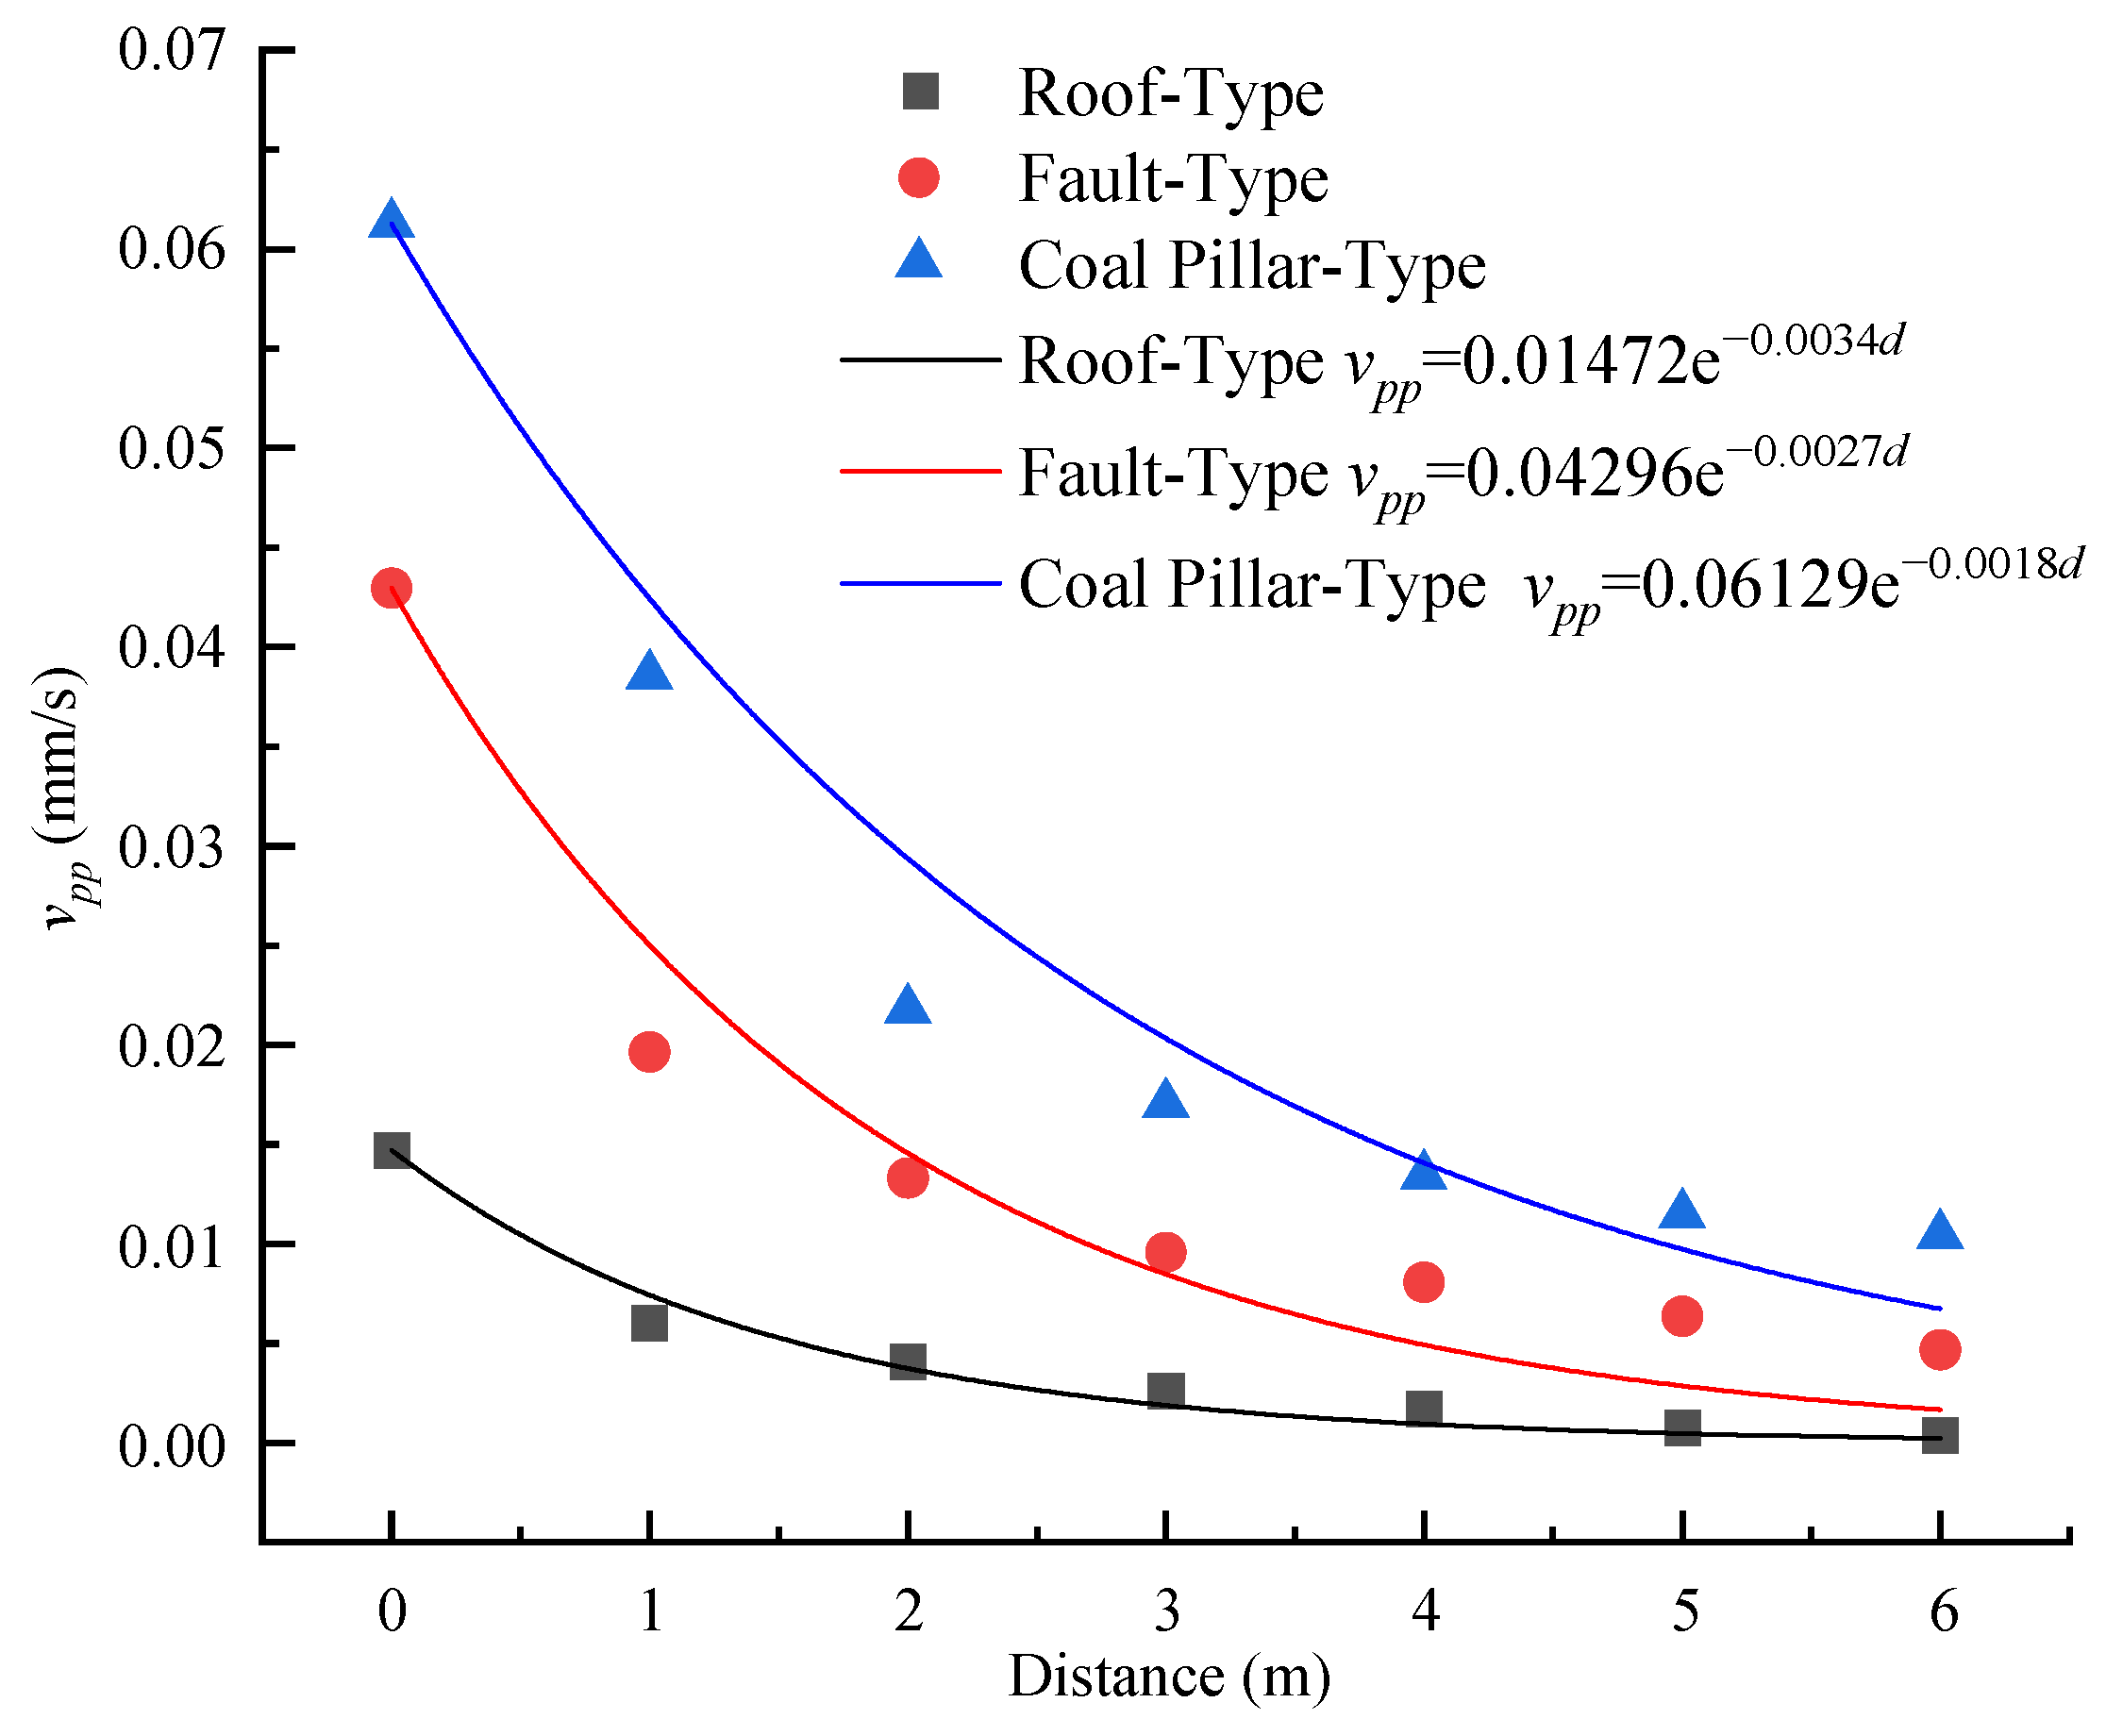
  • In addition, in the field of earthquakes, vibration velocity is often used as an evaluation criterion for vibration intensity. The three types of mine shock waves can be distinguished by the particle peak particle vibration velocity (PPV) attenuation coefficient. PPV propagates in the formation with a power exponential attenuation, and its relationship with the propagation distance can be expressed as Equation (17).
    v p p = v 0 · e α d
    where vpp is the peak particle velocity at a distance of d m from the source; v0 is the peak particle velocity at the source; and α is the velocity attenuation coefficient.

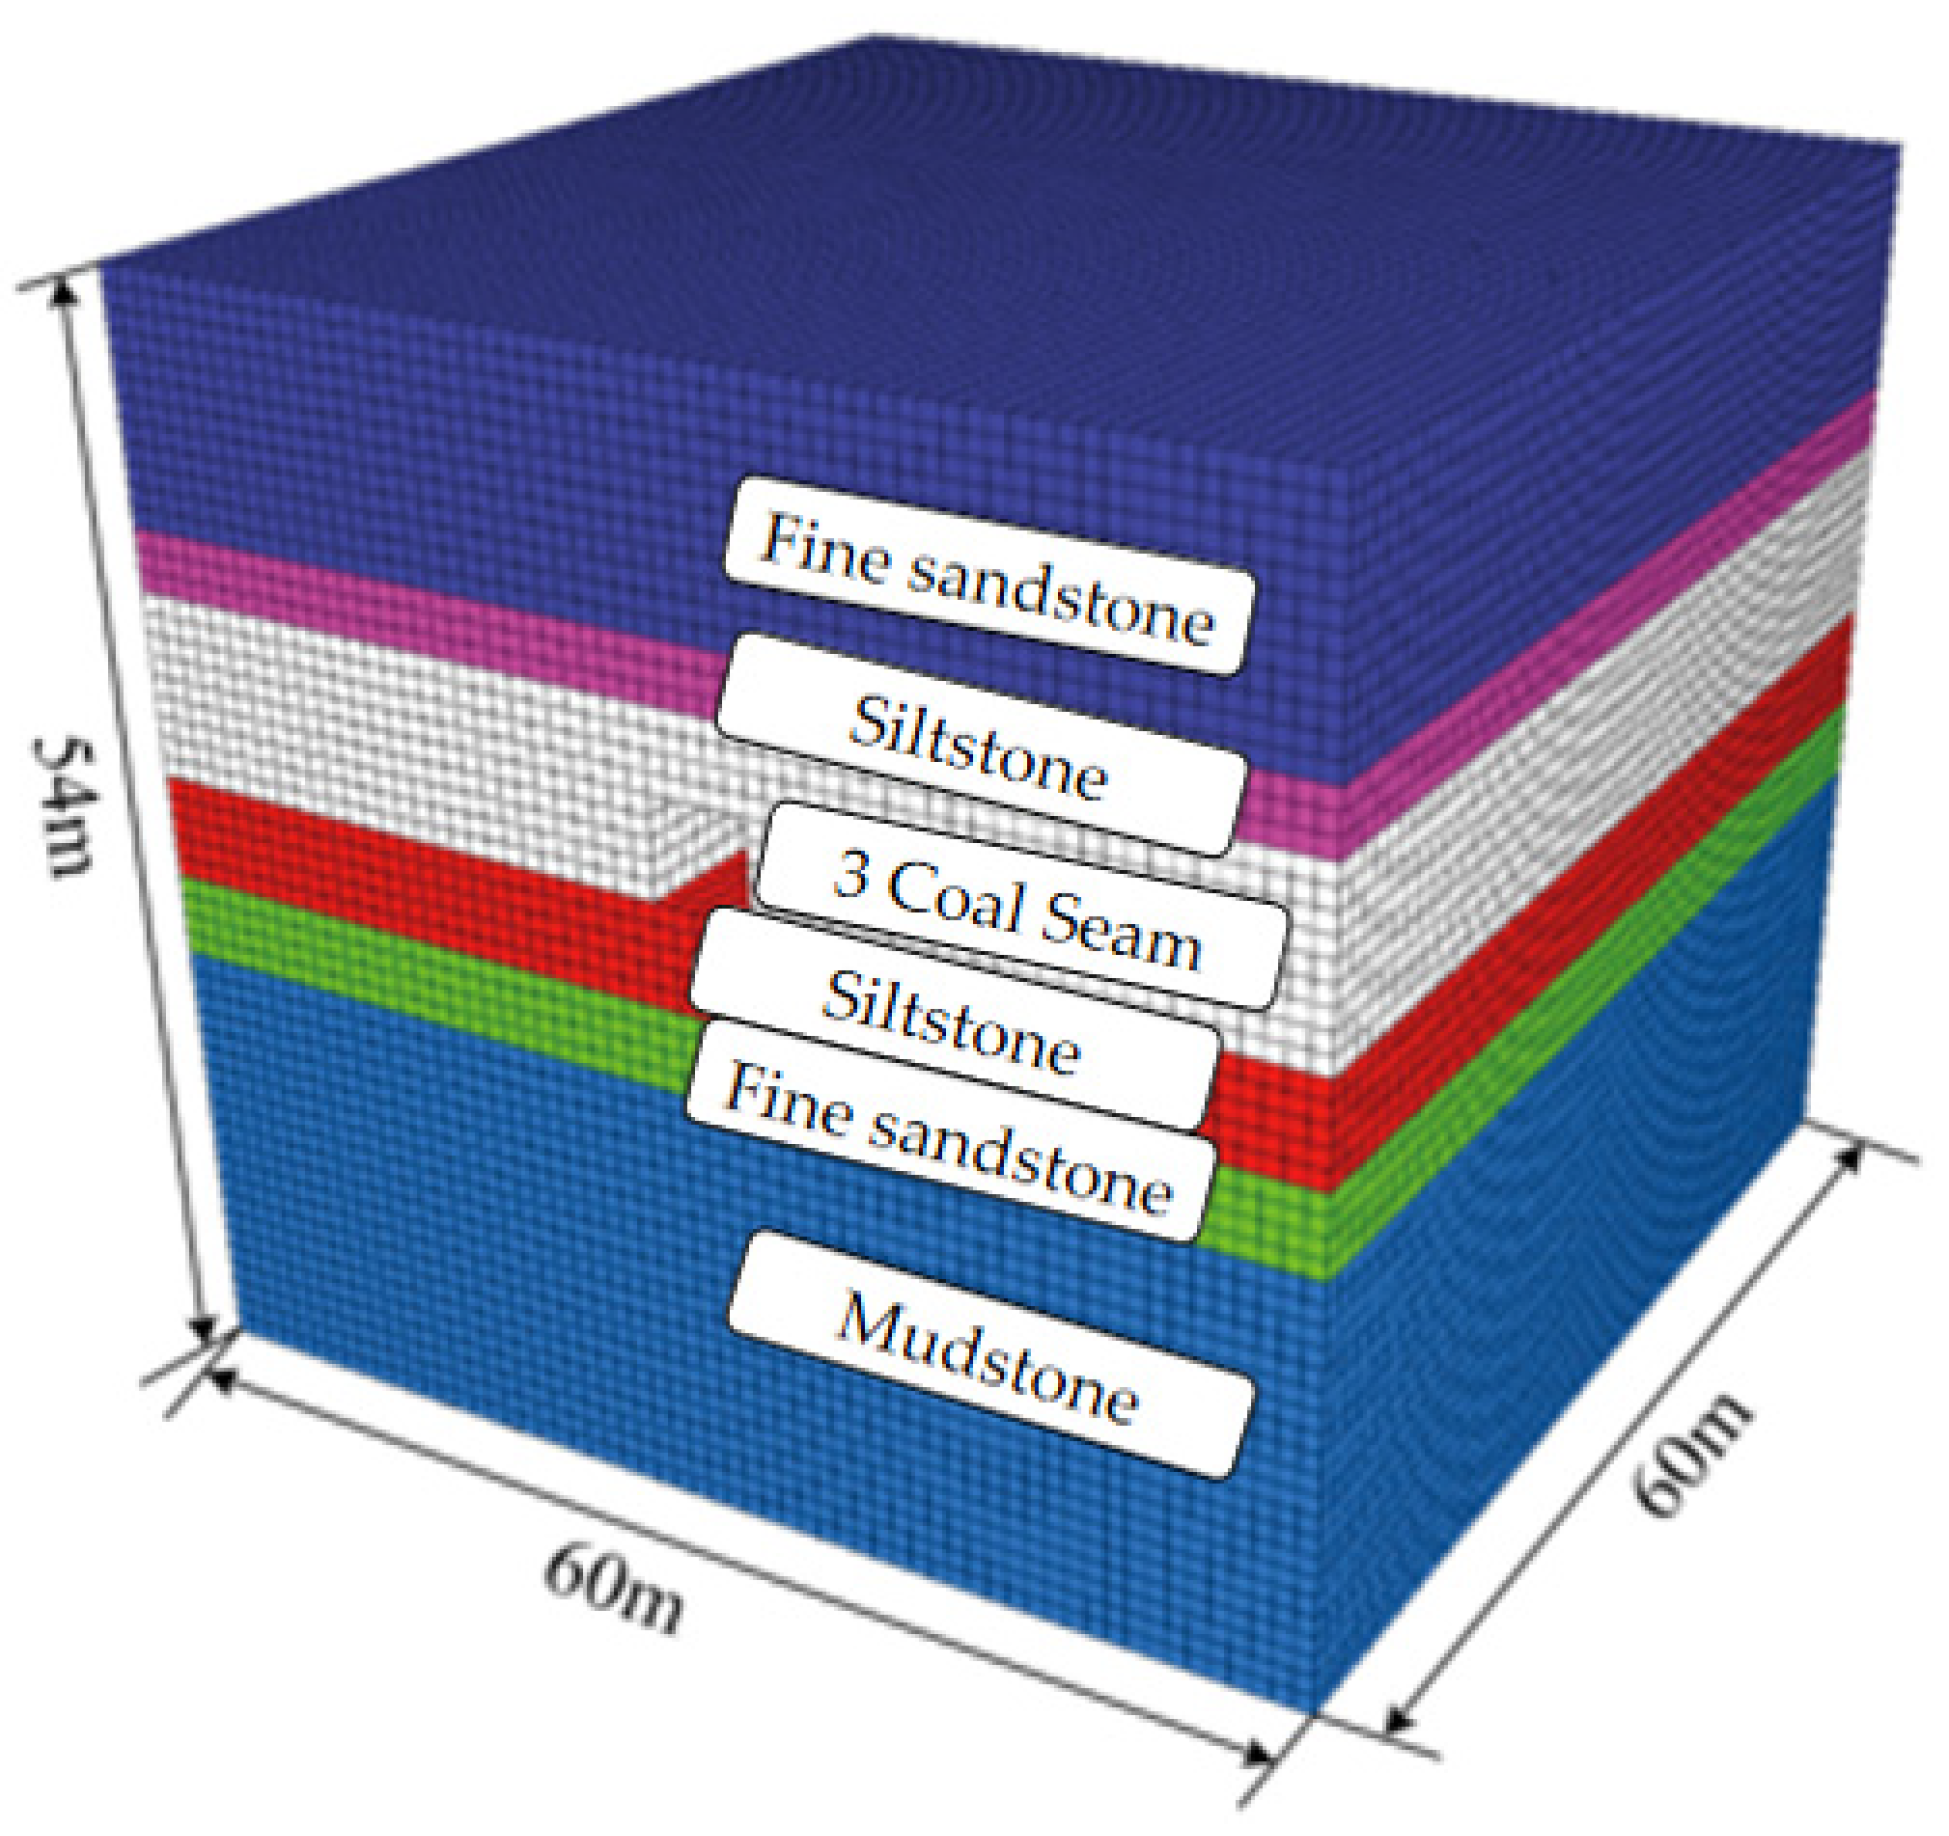
2.5. FLAC3D 5.0 Model Building

FLAC3D is based on the explicit Lagrangian algorithm and hybrid discrete partitioning technology. It can efficiently simulate plastic failure and flow and large deformation problems of materials without constructing a stiffness matrix. It optimizes the time step limit of the explicit solution through automatic inertia and damping coefficients. Its three-dimensional mesh automatic generator supports the rapid construction of complex structures (such as cross tunnels), provides 12 basic models to simplify the modeling process, and integrates multi-field coupling analysis functions such as statics, dynamics, creep, seepage, and temperature. It has 10 built-in material constitutive models to accurately describe the mechanical behavior of geotechnical engineering. The post-processing module supports data visualization, dynamic parameter tracking (history curve), and multi-parameter correlation analysis. It is also equipped with a FISH programming interface to support user-defined variables and algorithm expansion, providing efficient and flexible numerical simulation solutions for three-dimensional geotechnical engineering problems [37].
Aiming at the propagation characteristics of three types of dynamic carrier waves, the maximum principal stress, minimum principal stress, and their difference were used for analysis; the coal seam tunnel on the third floor of Gu Cheng Coal Mine was used as the simulation object. Using the FLAC3D 5.0 software, the model size is 60 m × 60 m × 54 m; the roadway section is rectangular; the roadway height is 5 m, its width is 5 m, and the top coal is left at about 4 m; and the location of the roadway is located in the middle of the modeled coal seam. The original waveform data obtained from the SOS micro-seismic monitoring system was selectively intercepted, and the noisy signals were cut off and loaded on the internal nodes in the model. The numerical model is shown in Figure 5.
According to the research method of this section, the full text research is carried out, and the specific implementation plan process is shown in Figure 6.

3. Results and Discussion

3.1. Strong Dynamic Load Temporal Classification and Spatiotemporal Distribution

In the previous studies mentioned [1,2,3,4,5], numerous scholars have analyzed the types of mine tremors from both macro-triggering and micro-fracture perspectives. In this section, the spatiotemporal distribution of dynamic load monitoring at Gu Cheng Coal Mine was analyzed to identify regions of strong dynamic load aggregation. Through the micro-seismic monitoring system, Gu Cheng Coal Mine can monitor micro-seismic signals across the entire mine. The statistical analysis was conducted on dynamic load events with energy greater than 103 J monitored from January 2019 to February 2019 at the 3310 working face. The spatial distribution of mine tremors is illustrated in Figure 7, where green dots represent 104 J energy events, and pink dots represent 103 J events.
From Figure 7, it can be observed that during the mining period from January to February 2019, the 3310 working face was significantly affected by mining activities. Dynamic load events were concentrated within a 100 m range from the working face and within the wide coal pillars. Among them, strong dynamic loads with energy greater than 103 J mainly were clustered near the 3310 return airway, and there were also a few strong dynamic load events near the intersection of faults F18-2 and F18-0. Overall, dynamic load events were more densely distributed in the roof and coal pillar areas. During the mining period of the 3310 working face, there was no mining activity in the surrounding mining areas. However, a few strong dynamic load events also occurred in the F18 area, which is relatively far from the working face, indicating possible fault activation in that area. The three types of strong dynamic loads can be verified in Figure 7, highlighting the results of their distribution locations.

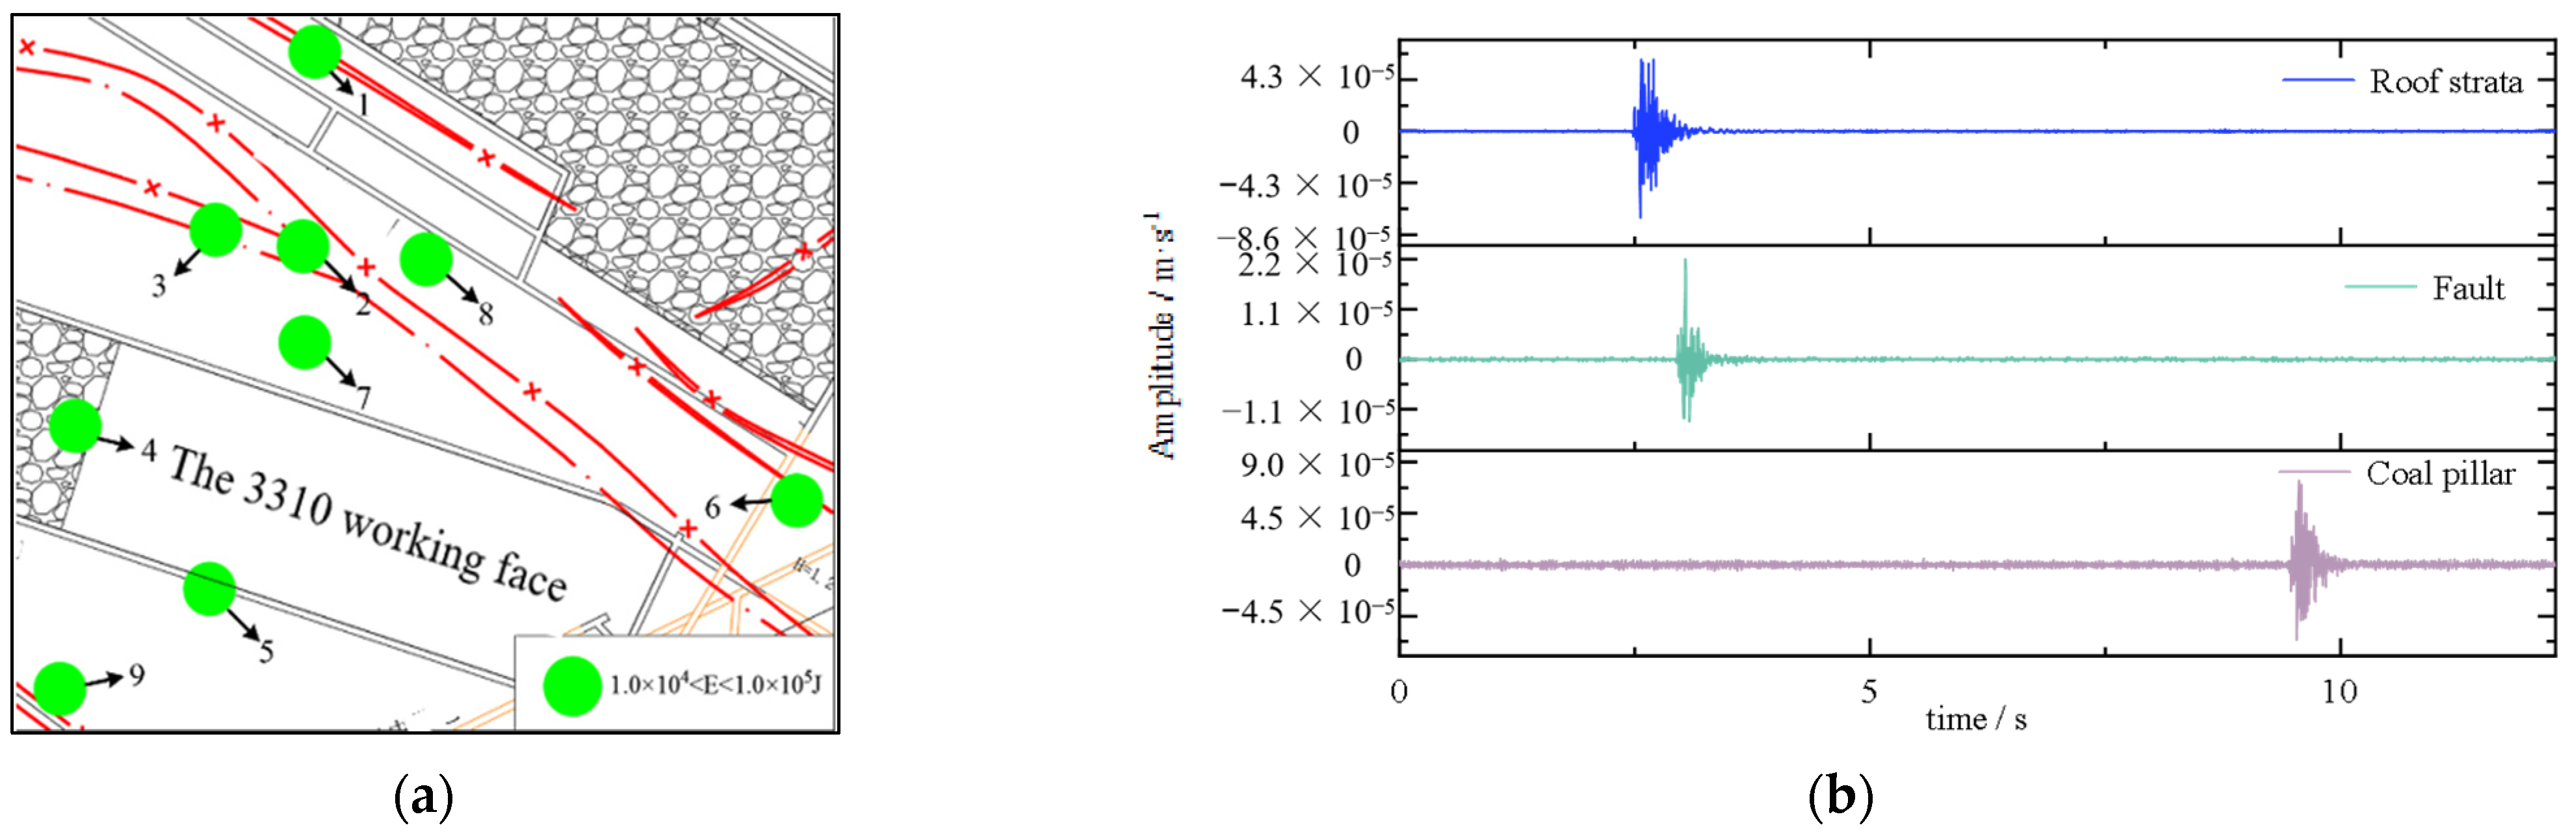
3.2. Strong Seismic Load Waveform Data and Source Parameter Analysis

Nine typical dynamic load data are selected from the area circled in Figure 7 to solve the focal mechanism. The distribution locations of these events are shown in Figure 8a. The station arranged near the working face 3310 was monitored to obtain the velocity–time signal of the mining earthquakes, from which the low-frequency displacements of the respective mining earthquake events were obtained, as well as their low-frequency displacements. The vibration waveform signals of some of the strong mining earthquake events are given in Figure 8b.
Source parameters can characterize the mechanical features of the seismic source in various aspects. In order to further classify the strong dynamic loads, Fast Fourier Transform (FFT) was applied to the waveforms of the nine strong dynamic load events to obtain the double-logarithmic displacement-frequency spectrum. The Brune model was then used for fitting, and the obtained low-frequency displacement Ω0 and corner frequency f0 for each event were calculated, as shown in Table 1. The nine strong dynamic load waveforms were divided into three groups: pillar-type strong dynamic load data (M1, M2, M3), fault-type strong dynamic load data (D1, D2, D3), and roof-type strong dynamic load data (B1, B2, B3).
According to the calculation method described in Section 2.2, the typical strong dynamic load seismic source parameters obtained are shown in Table 2. Figure 9, in turn, shows a comparison of the mean values for each of the three types of strong dynamic loads in terms of seismic moment, source radius. According to the statistical results shown in Table 2 and Figure 9, it can be concluded that the seismic moment of various strong dynamic load events is between 1010 and 1012 N∙m. Under the same radiation energy condition, the coal pillar-type has the largest seismic moment, followed by the roof-type, and the fault-type has the smallest moment, indicating that the coal pillar source rupture intensity is greater. Both the focal radius and apparent volume can reflect the scale of the focal rupture. Under the same focal radius, the volume increase in the coal and rock mass caused by the inelastic deformation of the fault-type source is the largest, followed by the coal pillar-type, and the roof-type has the smallest scale. Overall, the fault-type rupture has the smallest strength and scale, but its stress drop is high, and the stress level adjustment or release amplitude is the largest, followed by the coal pillar-type, and the roof-type is the smallest.

3.3. Waveform Analysis

3.3.1. Principal Frequency Analysis

After conducting FFT frequency statistics on the three types of strong dynamic load waves, it can be observed that fault-type mine seismic waves exhibit two main frequencies, roof-type mine seismic waves exhibit three main frequencies, while coal pillar-type mine seismic waves exhibit four main frequencies. The specific numerical values of the main frequencies can be found in Table 3, Table 4 and Table 5.
Based on the statistical results, it can be observed that the first main frequency of the three types of strong dynamic loads is relatively concentrated. By using the first main frequency, the approximate frequency boundary lines for the three types of signals can be determined to be around 30 Hz and 60 Hz. If we use the first main frequency as the basis for identifying the type of mine seismic event, signals with main frequencies in the range of 0~30 Hz can be identified as fault-type dynamic loads, those in the range of 30~60 Hz as roof-type dynamic loads, and those in the range of 60~80 Hz as coal pillar-type dynamic loads.

3.3.2. Peak Decay Amplitude Analysis

The next step is to solve and fit the nine sets of mine seismic waveforms within the effective range, obtaining the upper envelope and fitting curves as shown in Figure 10. Among them, Figure 10a–c represents the pillar-type strong mine seismic events, Figure 10d–f represents the fault-type strong mine seismic events, and Figure 10g–i represents the roof-type strong mine seismic events. The corresponding fitting coefficients m and attenuation coefficients n are shown in Table 6. It is obvious from Figure 10 that the fitting curves of events M2, B2, and D2 deviate significantly from the envelope, with low fitting accuracy (<0.90), indicating large errors. The fitting accuracy of the other six events is relatively high, all exceeding 0.90, with M3, D3, and B1 events reaching 0.95 or above, indicating very small fitting errors. The envelope decay trends of M2 and M3 are similar, and the average of their decay coefficients can be used as the decay coefficient of the pillar-type strong mine seismic events. Similarly, the envelope decay trends of D1 and D2 are similar, so their average decay coefficients can be used as the decay coefficient of fault-type strong dynamic load. Likewise, the average of B1 and B2 decay coefficients can be used as the decay coefficient of roof-type strong dynamic load. The average decay coefficient of pillar-type strong mine seismic events is 1.57, the fault-type is 1.41, and the roof-type is 4.53. Overall, roof-type strong mine seismic waves decay the fastest, while fault-type strong mine seismic waves decay the slowest, as they are generated by distant fault movement, and their propagation paths generally do not pass through fractured roof strata, resulting in less energy dissipation.

3.3.3. Multifractal Feature Analysis

To verify whether the strong dynamic load signals exhibit multifractal characteristics, the graphs in Figure 11 illustrate the relationships between the fluctuation function F (q, s) and q (Figure 11a), the generalized Hurst exponent h(q) and q (Figure 11b), and the mass exponent τ(q) and q for the F1 event, with q ranging from −10 to 10 and a step size of 0.1 (Figure 11c). Additionally, Figure 11d displays the relationship between f(α) and α. Due to the involvement of 200 curves at a step size of 0.1, only a portion of the curves is shown in the graph for better visualization.
From Figure 11, it can be inferred that the q-order fluctuation function F(q,s) of the F1 event decays following a power-law relationship with the time scale s. The generalized Hurst exponent h(q) exhibits a nonlinear decreasing relationship with q, while the mass exponent τ(q) shows a nonlinear relationship. Therefore, the M1 event demonstrates a certain level of invariance in the time series and exhibits multifractal characteristics. The calculated multifractal parameters ∆α and ∆f(α) for the nine events investigated in this study are presented in Table 7. It can be seen from Table 7 that the three types of strong dynamic carriers are all less than 0, indicating that the proportion of large peak amplitudes in the waveform is large, which reflects the general characteristics of dynamic carriers. The average spectral width of the fault-type strong dynamic carrier is 1.312, the roof-type is 1.543, and the coal pillar-type is 1.622.

3.4. Analysis of Disaster Effects Caused by Different Types of Dynamic Loads

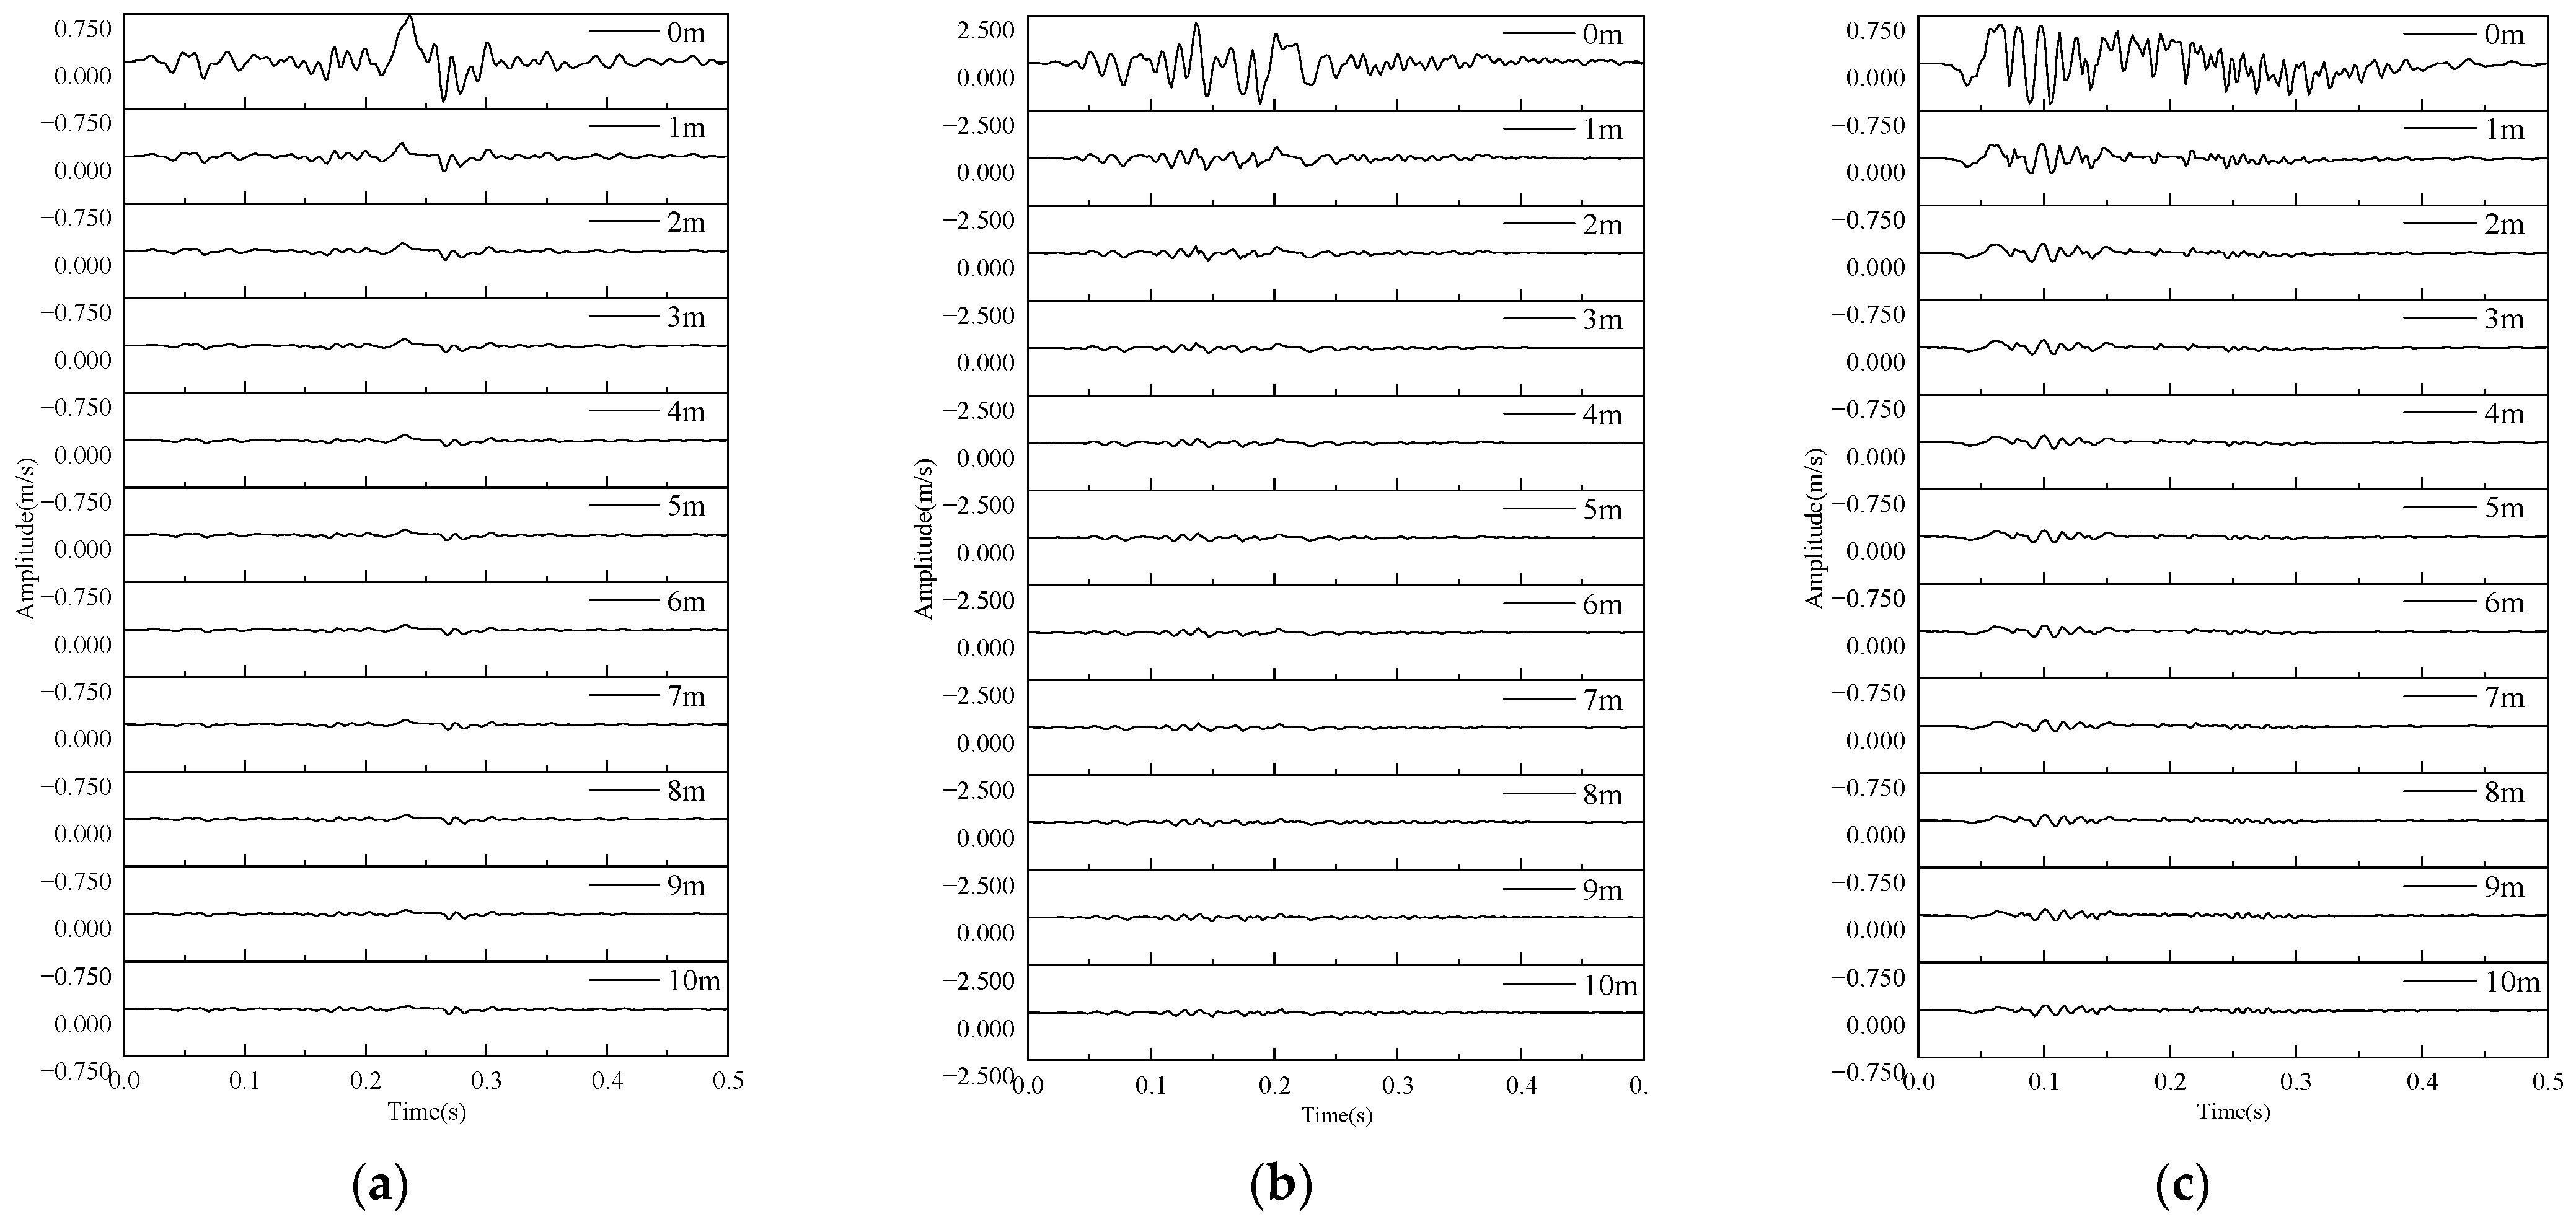
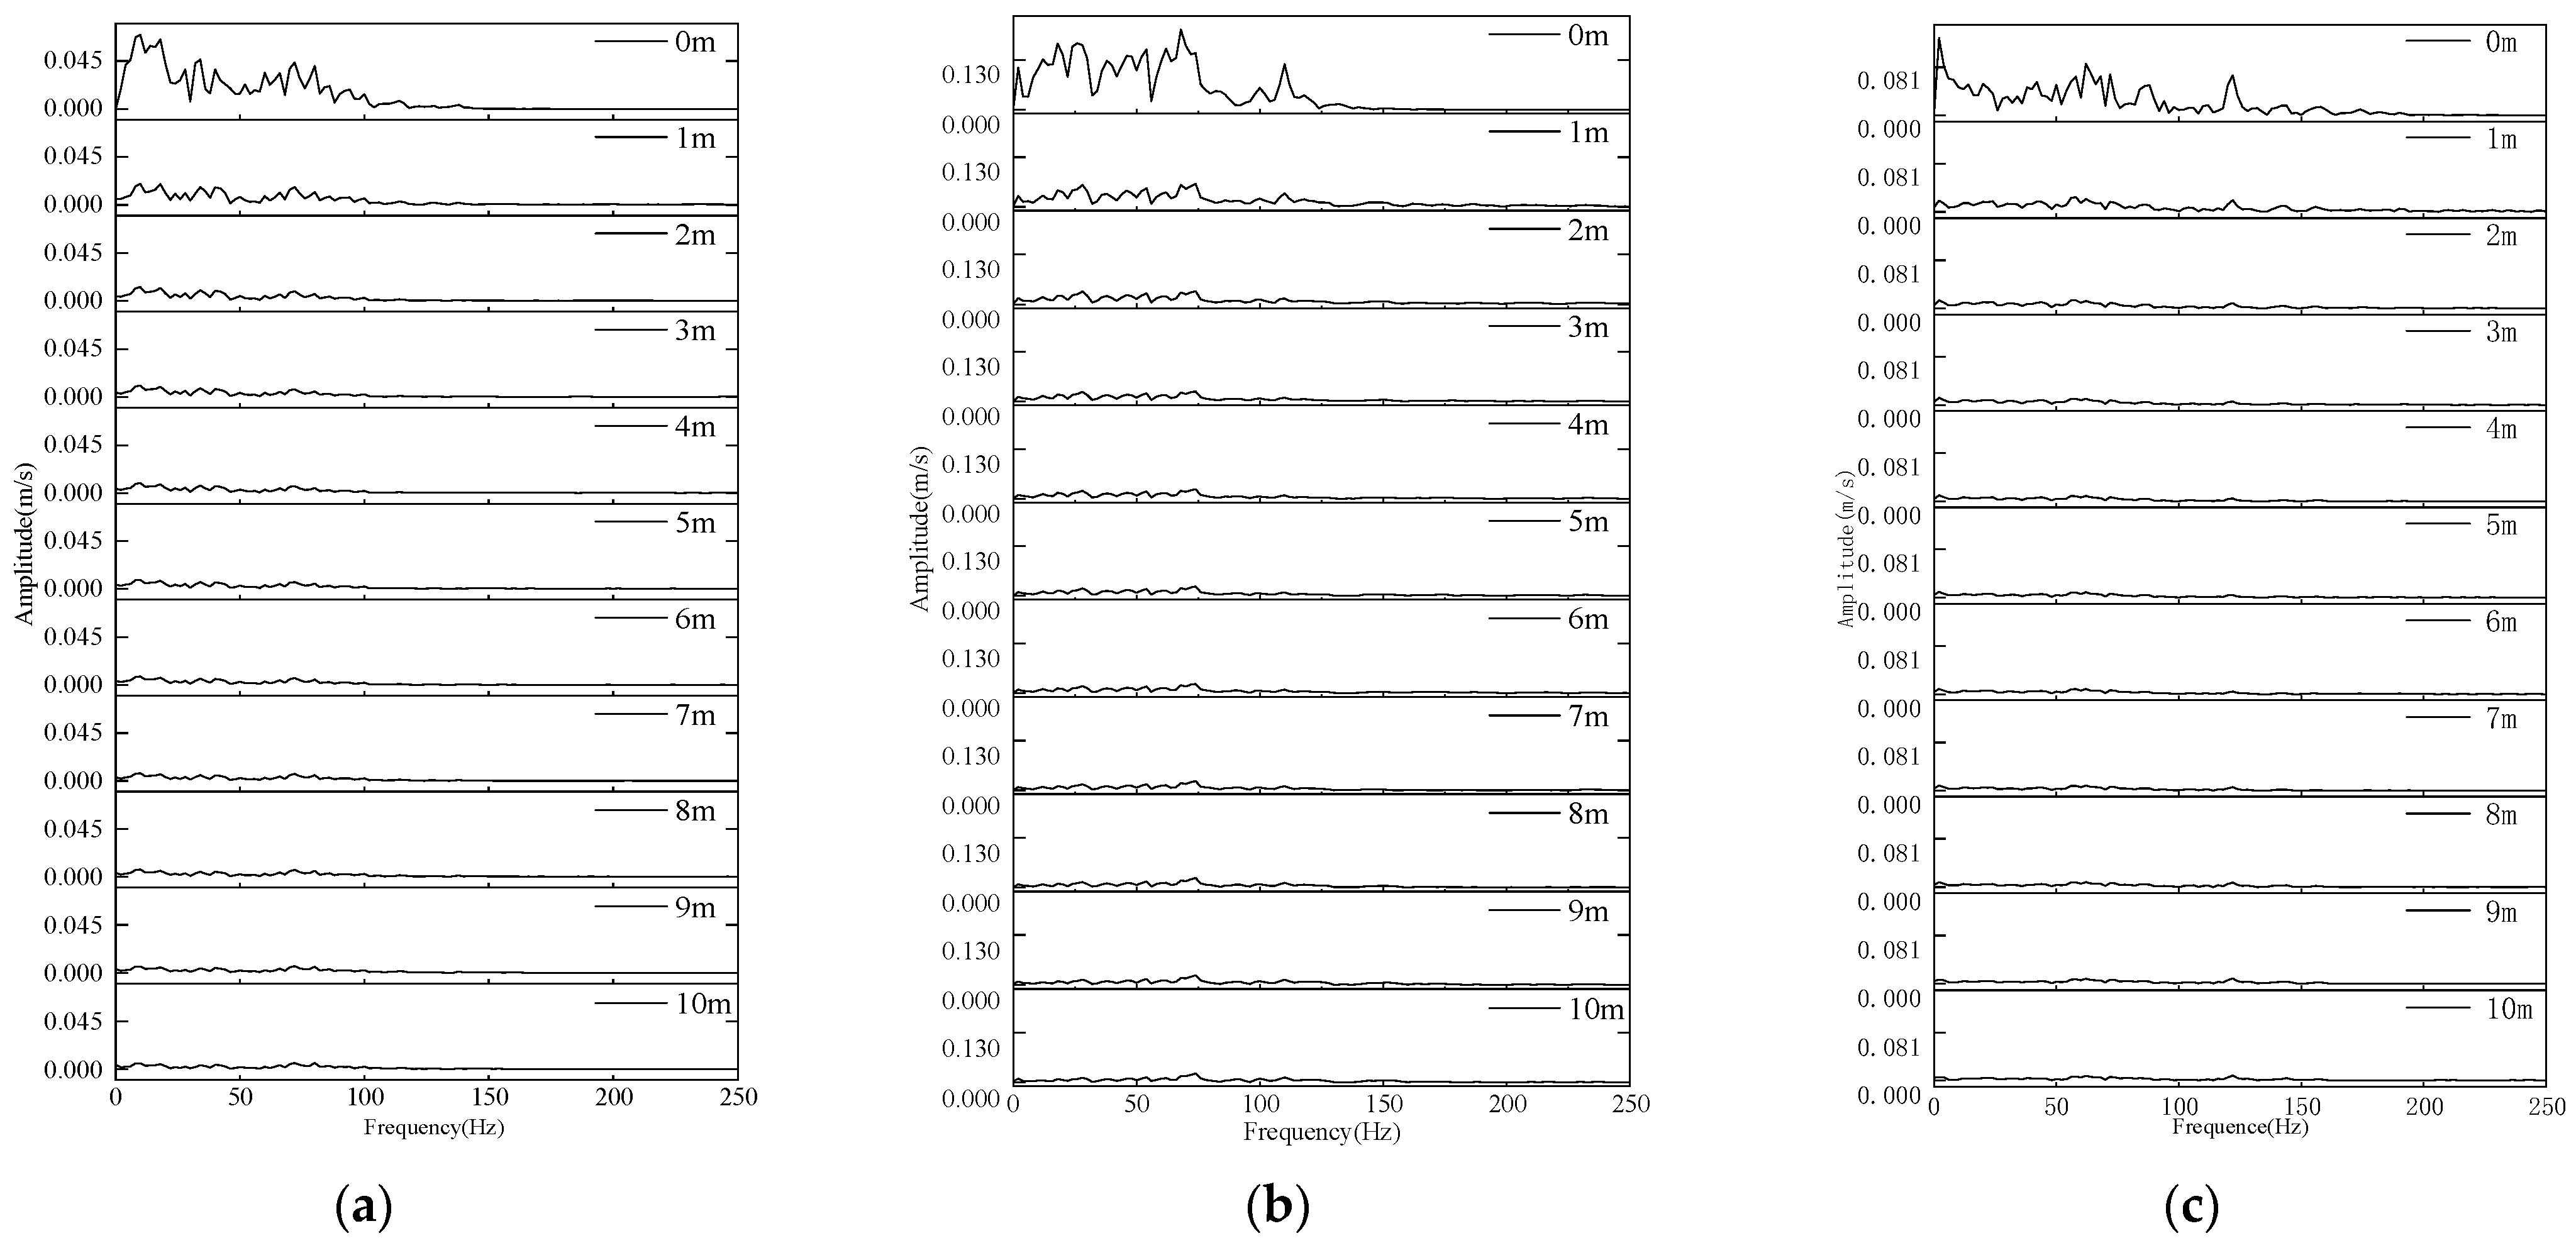
3.4.1. Velocity Field Evolution Law

When dynamic load waves propagate in layered media, they are influenced by factors such as interlayer interfaces and the frequency of the wave itself. Their propagation attenuation mainly stems from interface scattering and medium absorption. This section investigates the attenuation process of three different dynamic load waves in coal-bearing strata, as well as their velocity response characteristics. After loading the three types of dynamic load waves, the velocity information in the Z-direction from the seismic source to the monitoring points in the roadway is obtained, as shown in Figure 12. The waveform data obtained from monitoring are subjected to spectral analysis to obtain the corresponding frequency-domain information, as illustrated in Figure 13.
From Figure 12, it can be observed that as the three types of dynamic load waves propagate through the layers, the particle vibration velocity significantly attenuates with increasing propagation distance. When propagating to a distance of 2 m from the seismic source, the peak vibration velocity decreases to one-third of its value at the source. Subsequently, as the propagation distance increases, the attenuation trend gradually diminishes. After propagating 6 m, the attenuation trend of the signal becomes relatively stable, and the particle vibration velocity is minimally affected.
Figure 13 reveals that as the propagation distance increases, the velocity amplitudes of the three types of dynamic load waves show a decreasing trend. Significant attenuation occurs within 0–2 m, but the frequency attenuation regions differ. The roof-type dynamic load wave exhibits significant attenuation in the low-frequency range (from 0 Hz to 35 Hz), while the fault-type dynamic load wave experiences broader significant attenuation (from 0 Hz to 80 Hz). The coal pillar-type dynamic load wave shows similar attenuation regions to the fault-type, but it attenuates most rapidly in the 0–10 Hz range, with low-frequency components rapidly attenuating during propagation.
As shown in Figure 12, after the dynamic carrier wave propagates for 6 m, the attenuation amplitude is less than 0.01%, and it has basically stopped attenuating. The peak velocity of the dynamic carrier wave at each measuring point from 0 to 6 m was selected, and the attenuation coefficient of the peak vibration velocity of the three types of dynamic carrier particles was calculated according to the formula in Section 2.4. The regression curve of the peak vibration velocity of the particle point obtained by fitting is shown in Figure 14. The peak vibration velocity of the three dynamic carrier waves decays exponentially with the increase in the propagation distance. The attenuation coefficients of the dynamic carrier waves of the roof, fault, and coal pillar are 0.0034, 0.0027, and 0.0018, respectively.

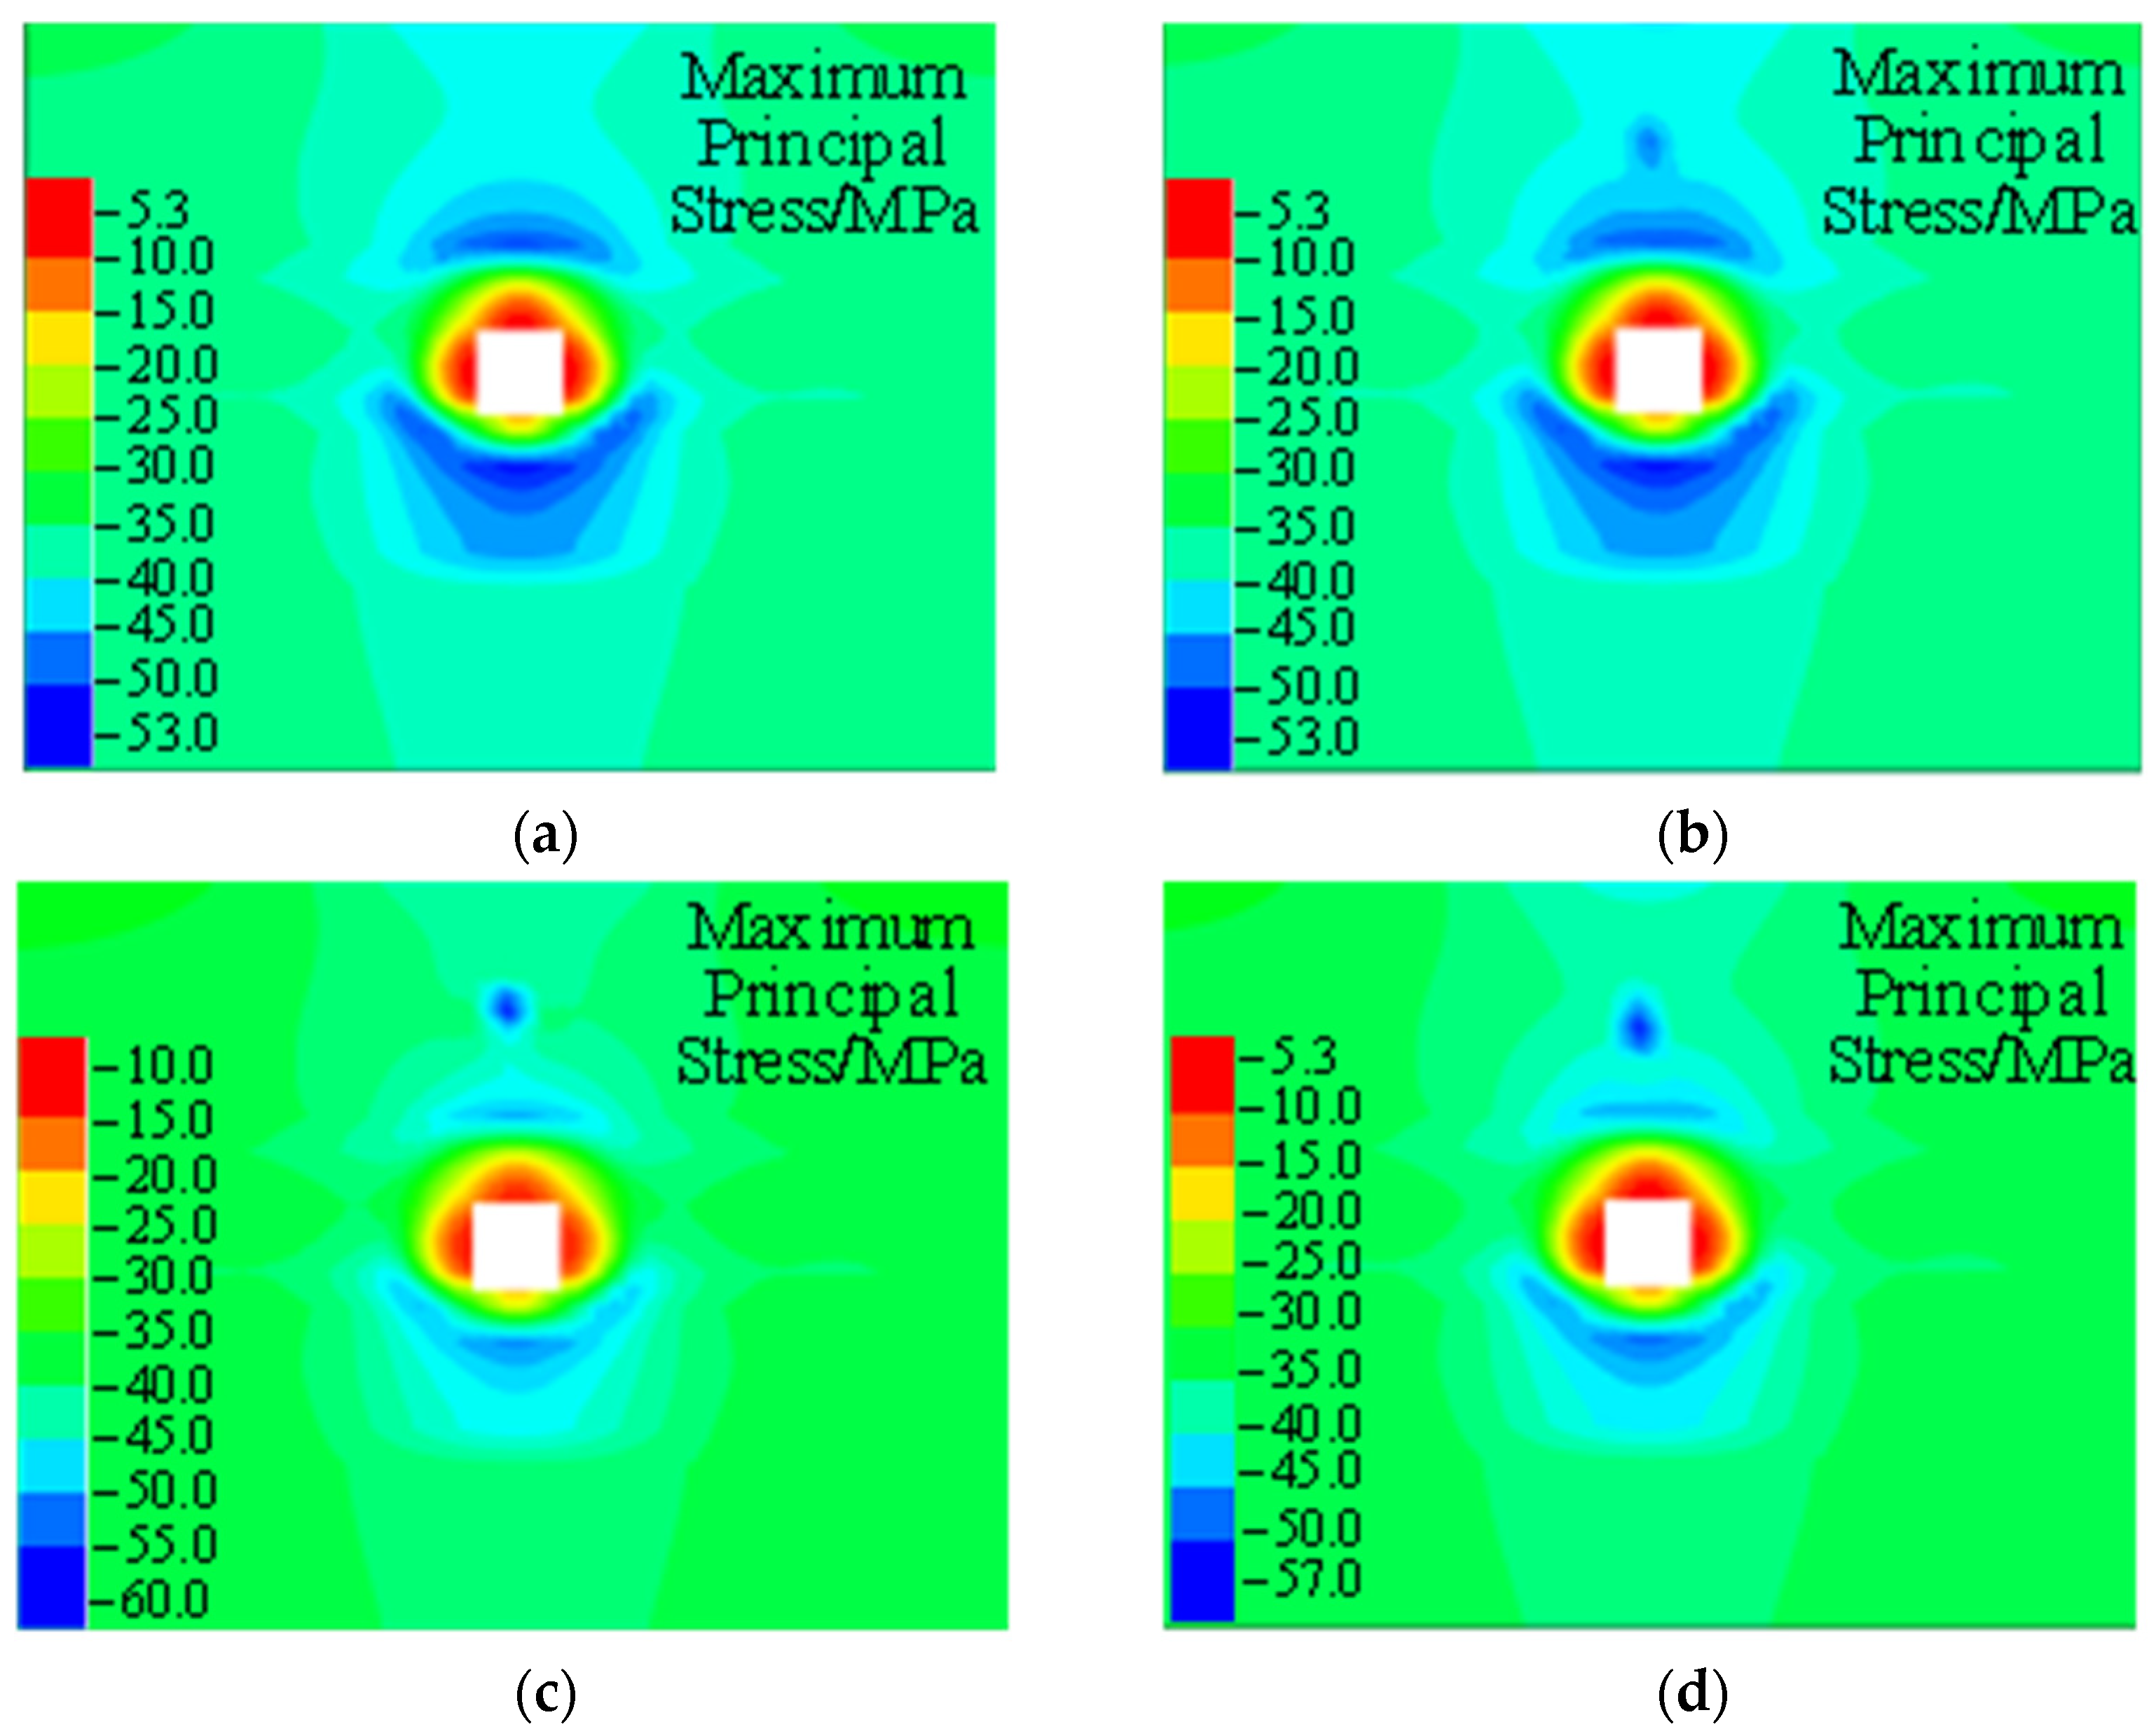
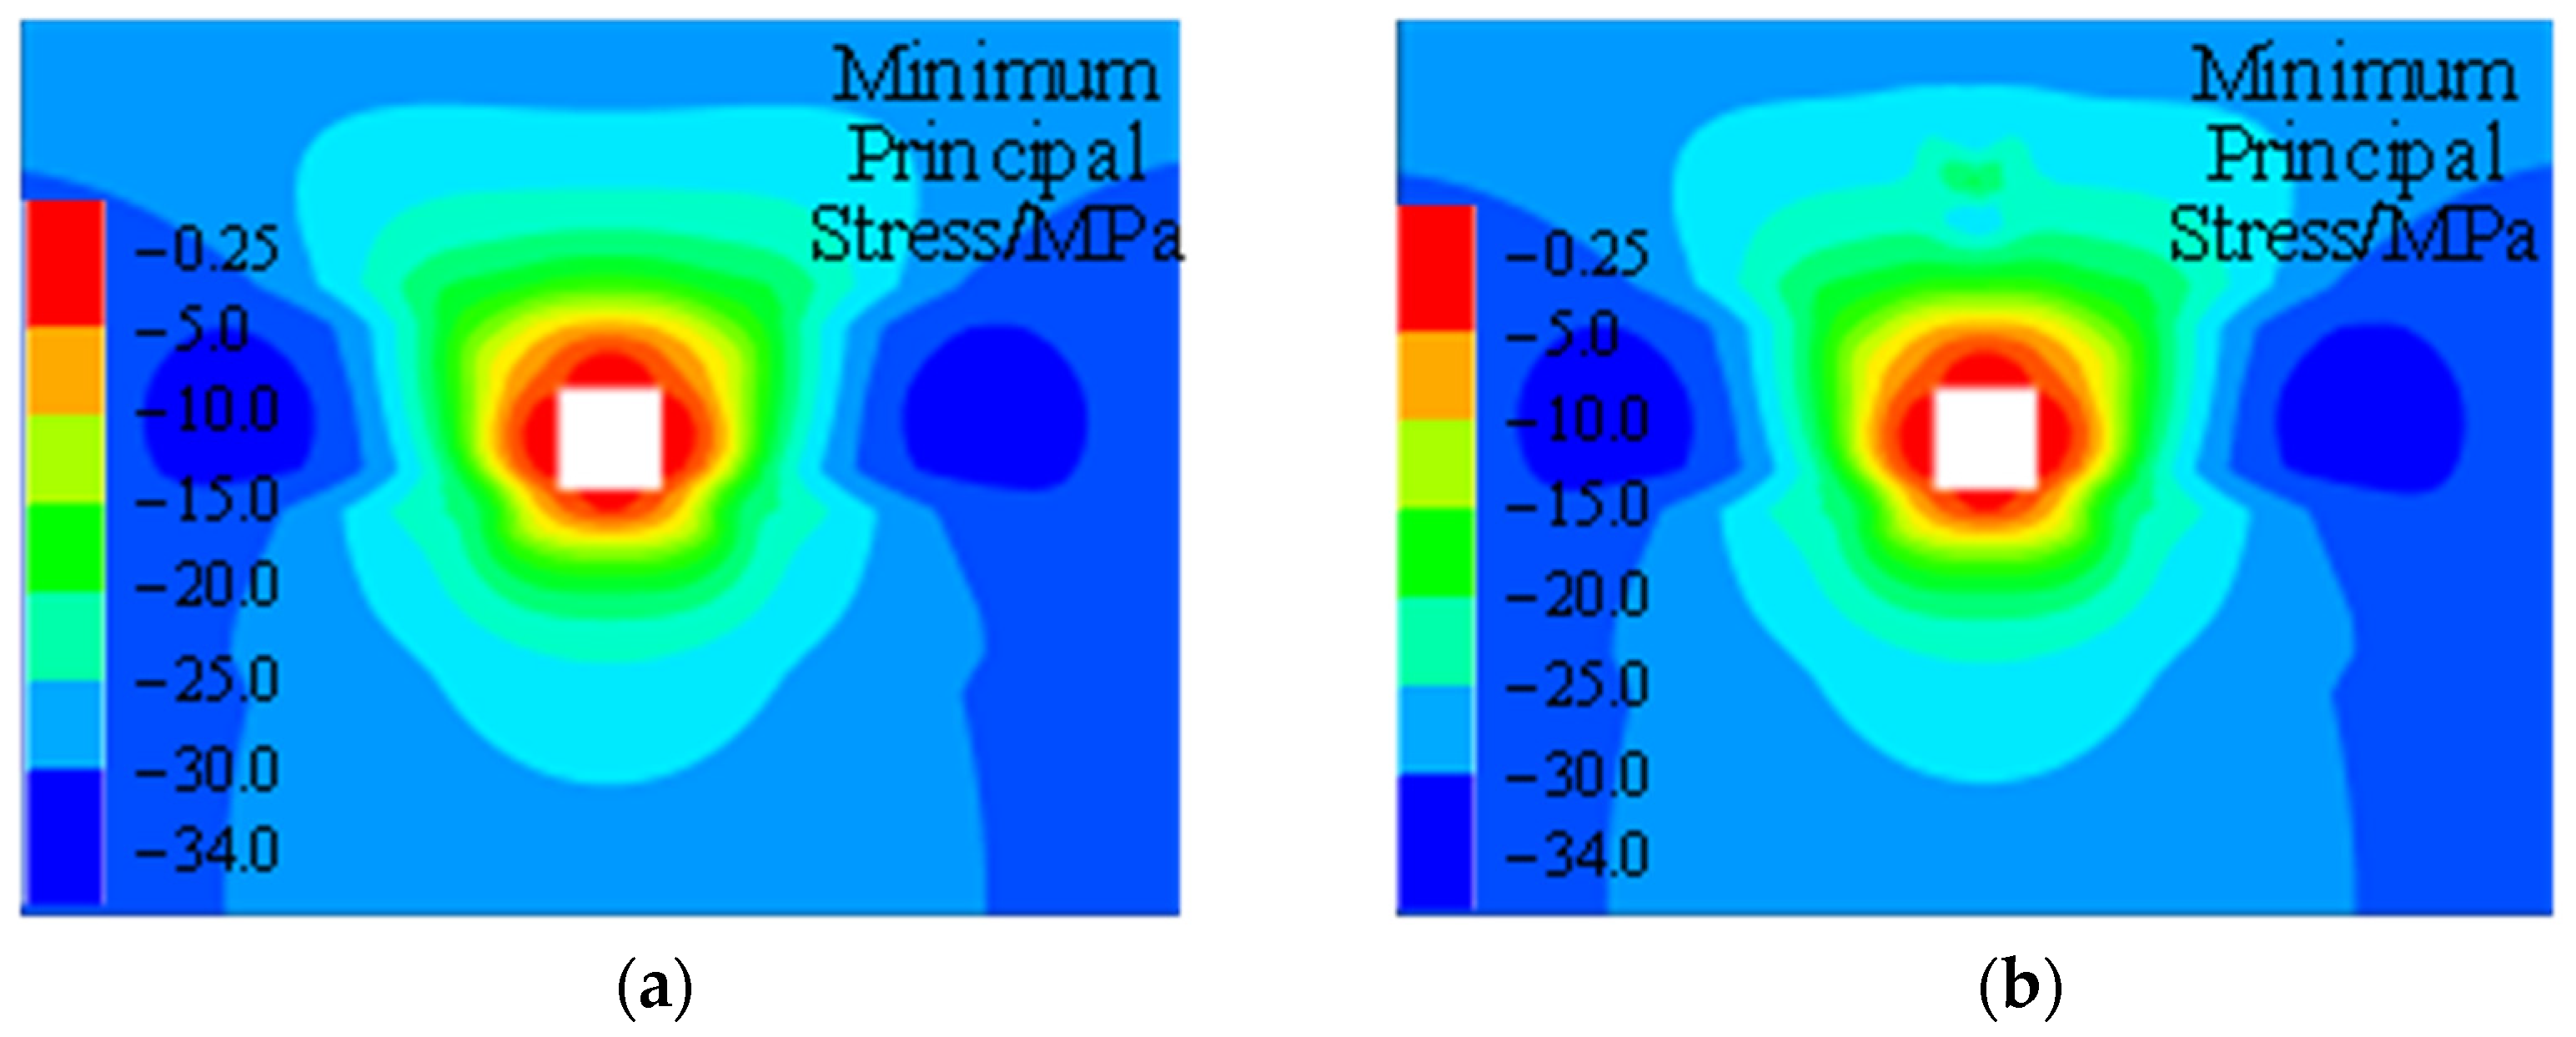
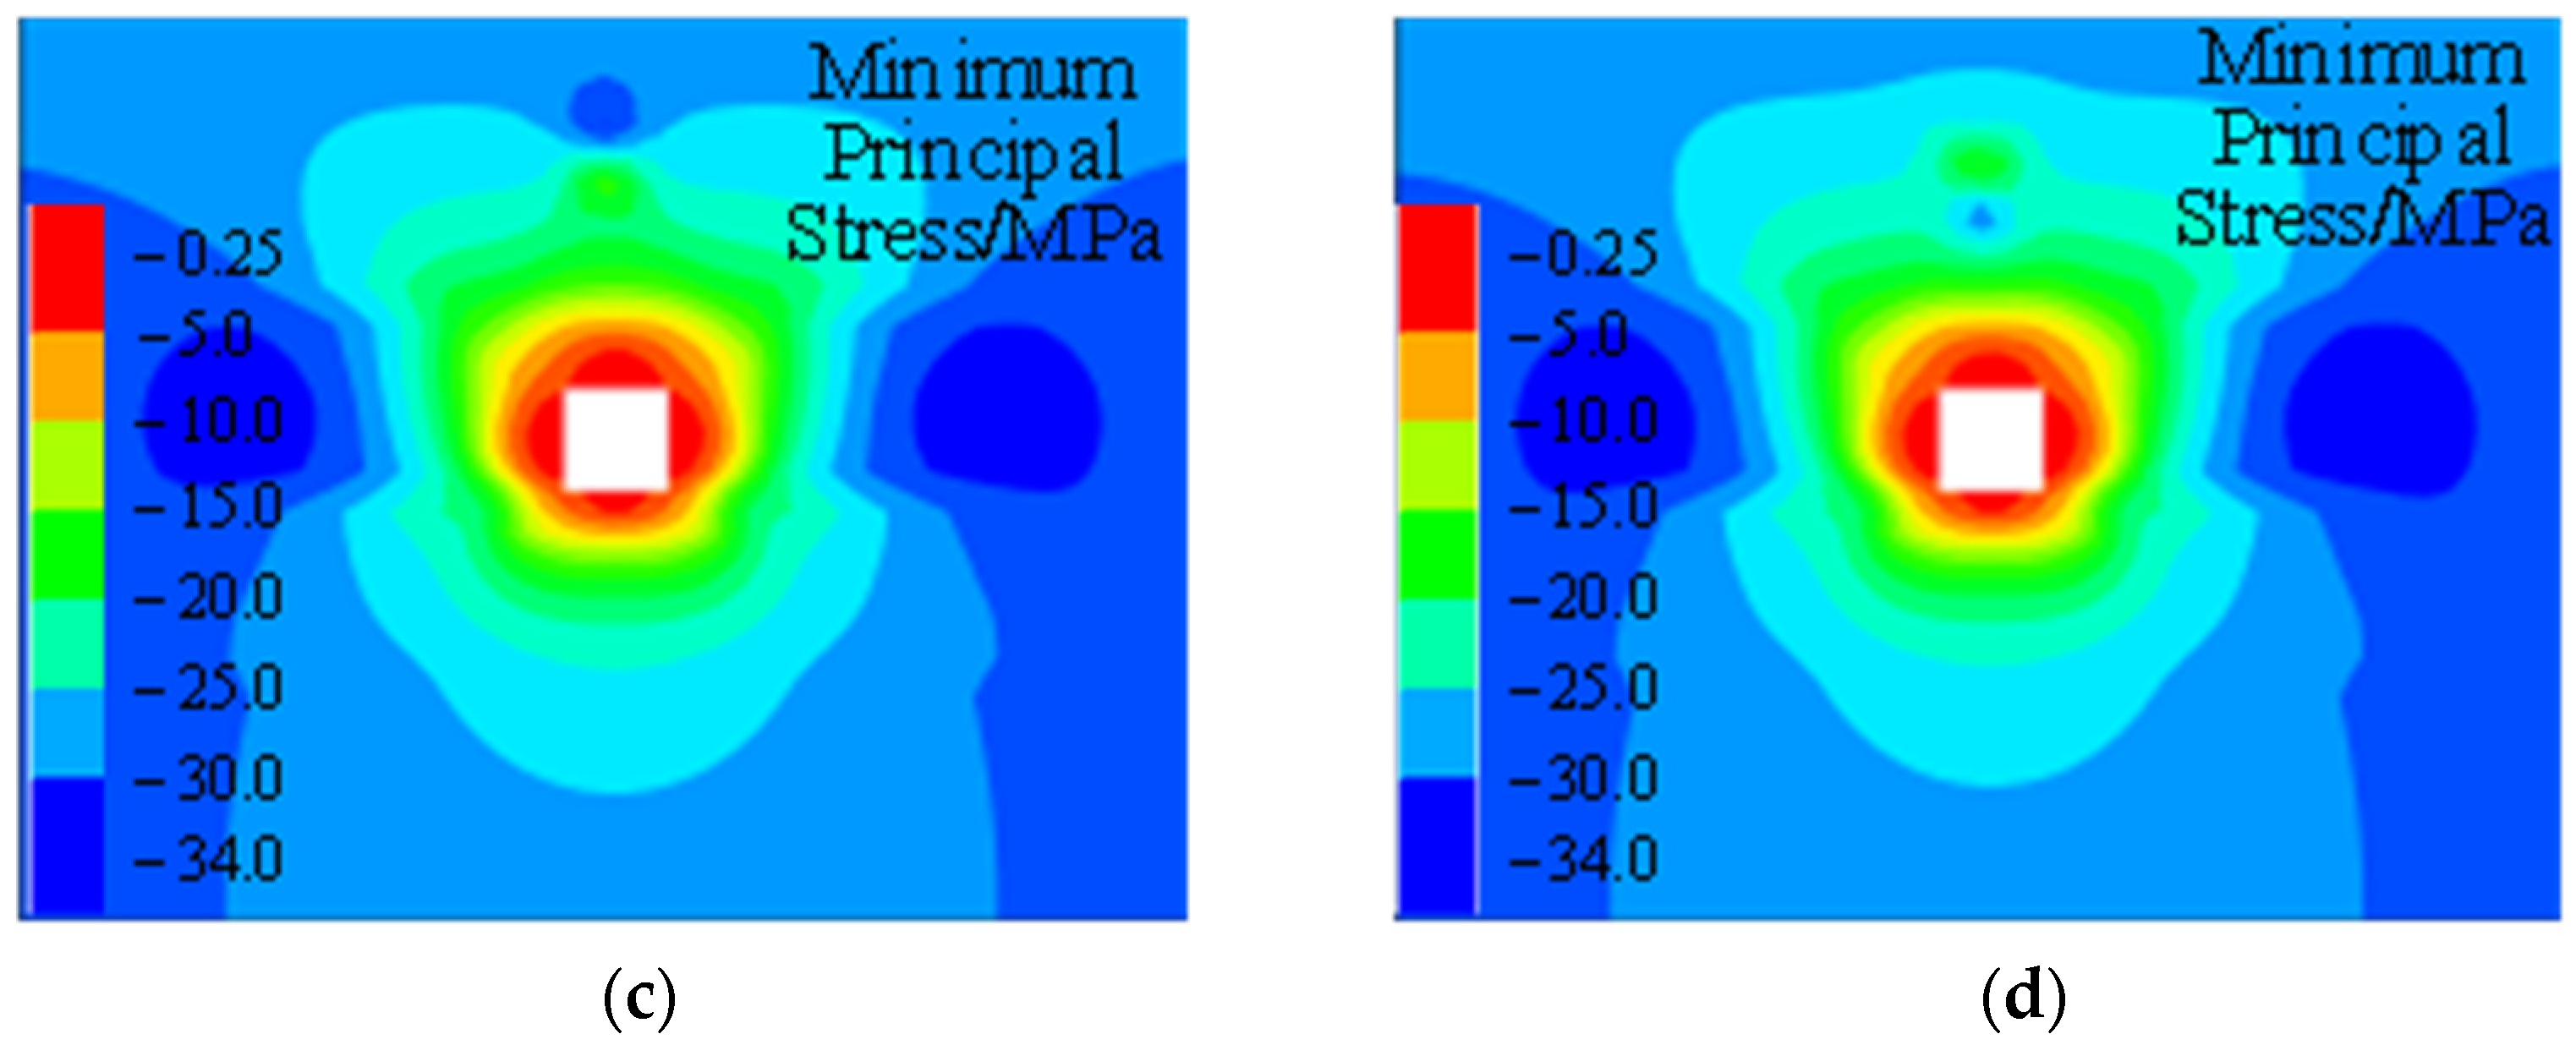
3.4.2. Evolutionary Law of Stress Field Through Numerical Simulation

Generally, the stress state at a point can be decomposed into isotropic tensile (or compressive) stress and anisotropic deviatoric stress tensor. The former mainly leads to volume changes, while the latter primarily induces shape changes. To further understand the distinguishing characteristics of the propagation of the three types of dynamic load waves, a numerical simulation analysis was conducted using the maximum principal stress, minimum principal stress, and their difference. The distributions of the maximum and minimum principal stresses in the 3310 working face in Gu Cheng Coal Mine, as well as the difference in principal stresses before and after perturbation, were simulated and are shown in Figure 15, Figure 16, and Figure 17, respectively. Figure 18, in turn, displays three loads difference in principal stresses before and after disturbance.
From Figure 15 it can be observed that after disturbance by the three types of dynamic load waves, the maximum principal stress concentrates at the seismic source, as well as at the roof and floor of the roadway. Specifically, after disturbance, the maximum principal stress distribution for the roof-type dynamic load forms a funnel-shaped concentration pattern, with the maximum reaching approximately 53.0 MPa. For the fault-type dynamic load, the distribution of maximum principal stress undergoes significant changes, with a single elliptical concentration point forming at the seismic source, reaching a maximum of approximately 60.0 MPa. Compared to the unperturbed state, the range of stress concentration expands from 5 to 10 m below the roof and from 3 to 10 m above the floor of the roadway. Similarly, after disturbance by the coal pillar-type dynamic load, the distribution of maximum principal stress undergoes significant changes, forming a droplet-shaped distribution pattern at the seismic source, with the maximum reaching approximately 57.0 MPa, and the range of stress concentration expanding at the roof and floor of the roadway.
Figure 16 illustrates that after disturbance by the three types of dynamic load waves, the minimum principal stress mainly concentrates at a distance of 10 m or more away from the seismic source and the roadway, while the maximum reaches approximately 32.0~34.0 MPa. For the fault-type dynamic load, the stress concentration position at the seismic source is located above the roof-type and coal pillar-type, further away from the top of the roadway. Figure 18 shows the principal stress difference curve before and after the disturbance. Combined with the principal stress difference Figure 17, it illustrates that within the range of 5–15 m from the top of the tunnel, the fault-type principal stress difference is the largest, within the range of 5–10 m, the roof-type principal stress difference is greater than the coal pillar-type, and in the area deeper than 10 m from the top of the tunnel, the coal pillar-type principal stress difference is greater than the roof-type. The results show that in the tunnel roof within 5 m above and below the source, the fault-type dynamic load has the most obvious effect on the change in the principal stress state of the tunnel. The action range of the roof-type and the coal pillar-type is similar. The principal stress state changes significantly within 3 m above and below the source, but the amplitude is small.
This study provides a theoretical basis and technical path for precise disaster prevention and control by revealing the source characteristics and propagation laws of different strong dynamic load events. First, based on the quantitative difference in waveform attenuation coefficient (roof-type 4.53 > coal pillar-type 1.57 > fault-type 1.41), the support system can be optimized in a targeted manner. For fault-type dynamic loads with slower attenuation, a larger safety distance needs to be reserved in the mining planning stage, and a flexible support structure with anti-shock wave propagation characteristics should be designed; conversely, for roof-type dynamic loads with faster attenuation, high-density energy-absorbing anchors can be laid out in the source area. Secondly, the spectrum feature analysis shows that the main frequency band is concentrated in the characteristic spectrum peak of 30–60 Hz, which provides the core parameters for the development of intelligent monitoring systems. By installing a distributed micro-seismic sensor array to capture the spectrum features in real-time, a dynamic load source identification model can be constructed to achieve a disaster warning closed loop of “source location-type discrimination-energy assessment”. It is worth noting that the spatial aggregation law of dynamic load events found in the study (the first 500 m return air channel area) guides the implementation of graded prevention and control strategies in engineering practice: increase the density of hydraulic supports in the high-incidence area of roof-type, and use grouting reinforcement technology to block the energy transfer path in the fault influence zone. This refined prevention and control system based on the difference in dynamic load characteristics can increase the energy dissipation efficiency of the support system by more than 30%, effectively reducing the probability and degree of damage of dynamic disasters.

4. Conclusions

In this study, conducted in the backdrop of the 3310 working face in the ancient city coal mine, the FFT method and MFDFA were employed to analyze the spectral characteristics and multifractal features of different types of dynamic load waveforms. Through Flac3D dynamic mode simulation, the propagation and attenuation characteristics of different types of dynamic load waves were analyzed, shedding light on dynamic disasters such as strong dynamic load-induced ground pressure impacts in mines. The research findings obtained in this study are summarized as follows:
(1)
Based on the Brune model, the seismic source parameters of strong dynamic loads were estimated and analyzed. It was found that the seismic moment and radiated energy of various types of dynamic loads are positively correlated. Under the same conditions of radiated energy, the seismic moment is the greatest for coal pillar-type dynamic loads, followed by roof-type dynamic loads, with fault-type dynamic loads being the smallest. Additionally, under the same seismic source radius conditions, fault-type dynamic loads result in the largest increase in volume due to non-elastic deformation of the rupture source, followed by coal pillar-type dynamic loads, and then roof-type dynamic loads. Fault-type dynamic loads have the smallest rupture strength and scale, but exhibit higher stress drops, with the greatest magnitude of stress level adjustment or release, followed by coal pillar-type dynamic loads, and then roof-type dynamic loads.
(2)
Based on the analysis of the frequency spectrum and multifractal features of strong dynamic load waveforms using FFT and MFDFA, it was found that the first dominant frequency of the three types of strong dynamic loads tends to cluster. Based on this, it is inferred that the frequency boundary lines of the three types of signals lie within the range of 30–60 HZ. The post-peak decay coefficients of the waveforms for the three types of strong dynamic load events differ, with average values for roof-type, coal pillar-type, and fault-type being 1.41, 1.57, and 4.53, respectively. Regarding multifractal features, coal pillar-type strong dynamic load waves exhibit the highest degree of waveform fluctuation, followed by roof-type, and then fault-type.
(3)
Numerical simulations were conducted to analyze the dynamics of three typical types of strong dynamic loads, obtaining velocity response characteristics during their propagation. The results indicated that during the propagation process, the frequency attenuation regions differ: roof-type dynamic load waves exhibit significant attenuation in the low-frequency range (from 0 Hz to 35 Hz), while fault-type dynamic load waves show broader significant attenuation (from 0 Hz to 80 Hz). Coal pillar-type dynamic load waves exhibit attenuation regions similar to fault-type, but with the fastest attenuation in the 0–10 Hz range, where low-frequency components rapidly decay during propagation. Furthermore, peak vibration velocity decreases with increasing propagation distance, with attenuation coefficients of 0.0034, 0.0027, and 0.0018 for roof-type, fault-type, and coal pillar-type dynamic load waves, respectively.
Although this study has preliminarily revealed the source characteristics, spectral laws, and propagation characteristics of strong dynamic load events in deep mining, there are still many directions worthy of further exploration. Future research can continue, combining artificial intelligence and big data technology to build an intelligent recognition model for dynamic load signals and further optimizing the automatic classification accuracy of source types through deep learning algorithms. In addition, future studies may explore the quantitative relationship between different types of dynamic load events and surrounding rock fractures and energy release, providing dynamic threshold standards for disaster prediction. In view of the differences in the attenuation characteristics of dynamic carrier propagation, it is necessary to combine rock mechanics and wave theory to establish a multi-scale dynamic load propagation model, clarify the modulation mechanism of geological structures (such as faults and fracture zones) on energy transfer paths, and thus propose a differentiated prevention and control strategy for different regions. Based on the spectral characteristics and the distribution law of the main frequency, monitoring equipment with adaptive filtering function can be developed, the sensor layout scheme can be optimized, and the ability to capture high-frequency and low-frequency composite signals can be improved, realizing the transition from “single event monitoring” to “full-cycle energy evolution analysis”. In addition, it is necessary to further explore the multi-field coupling effects (stress–seepage–damage) of dynamic load-induced disasters, and combine grouting, support, and other engineering means to form a full-stage prevention and control system of “source weakening-path blocking-end protection”. Through theoretical innovation and technology integration, it is expected that in the future, the transformation from passive response to active regulation will be achieved in the prevention and control of dynamic disasters in deep mining, providing more solid technical support for safe and efficient mining in mines.

Author Contributions

Conceptualization, W.R.; methodology, J.L.; validation, X.L., C.W. and S.L.; formal analysis, H.Q.; investigation, W.R.; resources, J.L.; writing—original draft preparation, J.L.; writing—review and editing, W.R.; supervision, W.R.; project administration, J.L.; funding acquisition, J.L. All authors have read and agreed to the published version of the manuscript.

Funding

This research was supported by the Natural Science Research Project of Anhui Educational Committee (KJ 2021ZD0051) and the Major Projects of Shandong Energy Science and Technology Program (C000B2023000073).

Institutional Review Board Statement

Not applicable.

Informed Consent Statement

Not applicable.

Data Availability Statement

The data that support the findings of this study are available from the corresponding author upon reasonable request.

Acknowledgments

K.Z. provided theoretical guidance for numerical modeling, and J.K. provided ideas for waveform data analysis.

Conflicts of Interest

Author Wentao Ren was employed by the company Shandong Energy Group Luxi Mining Co., Ltd. The remaining authors declare that the research was conducted in the absence of any commercial or financial relationships that could be construed as a potential conflict of interest.

References

  1. Jiang, Y.; Pan, Y.; Jiang, F.; Dou, L.; Ju, Y. State of the art review on mechanism and prevention of coal bumps in China. J. China Coal Soc. 2014, 39, 205–213. [Google Scholar] [CrossRef]
  2. Dou, L.; Cao, J.; Cao, A.; Chai, Y.; Bai, J.; Kan, J. Research on types of coal mine tremor and propagation law of shock waves. Coal Sci. Technol. 2021, 49, 23–31. [Google Scholar]
  3. Jiang, F.; Zhang, X.; Zhu, S. Discussion on key problems in prevention and control system of coal mine rock burst. Coal Sci. Technol. 2023, 51, 203–213. [Google Scholar]
  4. Stec, K.; Blaszczyk, E. Characteristics of the processes taking place at the sources high energy tremors occurring during mining of coalface no 17 in coal seam no 361 of the Knurow coal mine. Gospod. Surowcami Miner. Miner. Resour. Manag. 2008, 24, 245–259. [Google Scholar]
  5. Gu, X.; Zhang, C.; Guo, W.; Zhang, Y.; Gong, X.; Wang, C.; Zhao, X.; Zhang, L. Characteristics and recognition of typical micro-seismic signals in rock burst mines. J. China Coal Soc. 2024, 49, 694–713. [Google Scholar]
  6. Jiao, Y.; Wu, K.; Zou, J.; Zheng, F.; Zhang, X.; Wang, C.; Li, X.; Zhang, C. On the strong earthquakes induced by deep coal mining under thick strata-a case study. Geomech. Geophys. Geo-Energy Geo-Resour. 2021, 7, 1–11. [Google Scholar] [CrossRef]
  7. Zhai, X.; Liu, Q.; Zhao, X.; Qian, H. Coal bump risk assessment and mine earthquake occurrence characteristics analysis of fully mechanized caving face under hugely-thick conglomerate stratum. J. Henan Polytech. Univ. Nat. Sci. 2023, 42, 1–10. [Google Scholar] [CrossRef]
  8. Zhang, Y.; Ji, H.; Wu, H. Triggering and relationship between mine earthquake activities and stress of earth tides during deep mining. Front. Earth Sci. 2022, 10, 889545. [Google Scholar] [CrossRef]
  9. Gao, M.; Dou, L.; Zhang, N.; Mu, Z.; Wang, K.; Yang, B. Experimental study on earthquake tremor for transmitting law of rockburst in geomaterials. Chin. J. Rock Mech. Eng. 2007, 26, 1365–1371. [Google Scholar]
  10. Cao, A.; Fan, J.; Mu, Z.; Guo, X. Burst failure effect of mining-induced tremor on roadway surrounding rock. J. China Coal Soc. 2010, 35, 2006–2010. [Google Scholar]
  11. Ye, G.; Jiang, F.; Guo, Y.; Wang, C. Experimental research on seismic wave attenuation by field micro-seismic monitoring in a deep coal mine. Chin. J. Rock Mech. Eng. 2008, 27, 1053–1058. [Google Scholar]
  12. Dou, L.; Bai, J.; Li, X.; He, H. Study on prevention and control technology of rockburst disaster based on theory of dynamic and static combined load. Coal Sci. Technol. 2018, 46, 1–8. [Google Scholar] [CrossRef]
  13. Tan, Y.; Guo, W.; Zhao, T.; Zhang, D.; Gu, X.; Tan, Y. Development and application of a novel deep roadway test system with dynamic-static loading. Chin. J. Rock Mech. Eng. 2022, 41, 1513–1524. [Google Scholar]
  14. Mendecki, M.J.; Szczygieł, J.; Lizurek, G.; Teper, L. Mining-triggered seismicity governed by a fold hinge zone: The Upper Silesian Coal Basin, Poland. Eng. Geol. 2020, 274, 105728. [Google Scholar]
  15. Cook, N.G.W. The failure of rock. Int. J. Rock Mech. Min. Sci. 1965, 2, 389–403. [Google Scholar] [CrossRef]
  16. Tan, Y.; Guo, W.; Gu, Q.; Zhao, T.; Yu, F.; Hu, S.; Yin, Y. Research on the rockburst tendency and AE characteristics of inhomogeneous coal-rock combination bodies. Shock Vib. 2016, 1, 9271434. [Google Scholar] [CrossRef]
  17. Diest, F.H. A non-linear continuum approach to the problem of fracture zones and rockbursts. J. S. Afr. Inst. Min. Metall. 1965, 65, 502–522. [Google Scholar]
  18. Cook, N.G.W. A note on rock bursts considered as a problem of stability. J. S. Afr. Inst. Min. Metall. 1965, 65, 437–446. [Google Scholar]
  19. Linkov, A.M. Rock bursts and the instability of rock masses. Int. J. Rock Mech. Min. Sci. Geomech Abstr. 1996, 33, 727–732. [Google Scholar] [CrossRef]
  20. Bieniawski, Z.T. Mechanism of brittle fracture of rock: Part II—Experimental studies. Int. J. Rock Mech. Min. Sci. Geomech Abstr. 1967, 4, 407–423. [Google Scholar] [CrossRef]
  21. Kidybiński, A. Bursting liability indices of coal. Int. J. Rock Mech. Min. Sci. 1981, 18, 295–304. [Google Scholar] [CrossRef]
  22. Zhang, M.; Zhao, B.; Xu, Z.; Benjun, Z.; Zenghe, X. Mechanism, Prediction, and Prevention of Rockburst. Saf. Coal Mines. 1988, 43–44. [Google Scholar]
  23. Zhang, M. Theory and numerical simulation of rockburst instability. Chin. J. Rock Mech. Eng. 1987, 197–204. [Google Scholar]
  24. Qi, Q.; Liu, T.; Shi, Y.; Lv, J. Frictional sliding instability mechanism of rockburst. J. Min. Saf. Eng. 1995, 174–177. [Google Scholar]
  25. Qi, Q.; Gao, Z.; Wang, S. Theory of rockburst causing structural damage in layered coal rock mass. Coal Min. Technol. 1998, 14–17. [Google Scholar]
  26. Khorrami, M.; Shokri, S.; Ghaffari, H. Hybrid seismic inversion for source parameters of the 2021 Kermanshah earthquake. Seismol. Res. Lett. 2023, 94, 1559–1573. [Google Scholar]
  27. Zhang, Y.; Liu, Q.; Zhang, D. Source parameters of the 2021 M7.2 Haiti earthquake from waveform inversion. Geophys. J. Int. 2024, 227, 1609–1627. [Google Scholar]
  28. Aslan, A.; Efe, H.; Pinar, A. Seismic source parameters and fault rupture characteristics of the 2023 Turkey-Syria earthquake. Earth Planet. Sci. Lett. 2023, 608, 258–270. [Google Scholar]
  29. Cao, A.; Dou, L.; Mou, Z.; Lu, C. 4.4.2 Coal and rock vibration classification based on vibration wave field characteristics. In Mining Geophysical Theory and Technology, 1st ed.; Li, X., Zhang, X., Eds.; China Science Publishing & Media Ltd.: Beijing, China, 2014; pp. 83–84. [Google Scholar]
  30. Aki, K. Scaling law of seismic spectrum. J. Geophys. Res. 1967, 72, 1217–1231. [Google Scholar] [CrossRef]
  31. Brune, J.N. Tectonic stress and the spectra of seismic shear waves from earthquakes. J. Geophys. Res. 1970, 75, 4997–5009. [Google Scholar] [CrossRef]
  32. Steketee, J.A. On Volterra’s dislocations in a semi-infinite elastic medium. Can. J. Phys. 1958, 36, 192–205. [Google Scholar] [CrossRef]
  33. Shearer, P.M. Introduction to Seismology, 3rd ed.; Cambridge University Press: Cambridge, UK, 2019. [Google Scholar]
  34. Archuleta, R.J.; Cranswick, E.; Mueller, C.; Spudich, P. Source parameters of the 1980 Mammoth Lakes, California, earthquake sequence. J. Geophys. Res. Solid Earth 1982, 87, 4595–4607. [Google Scholar] [CrossRef]
  35. Mandelbrot, B. How long is the coast of britain? Statistical self-similarity and fractional dimension. Science 1967, 156, 636–638. [Google Scholar] [CrossRef] [PubMed]
  36. Thomas, C.; Halsey, M.H.; Jensen, L.P.; Kadanoff, I.P.; Boris, I.S. Fractal measures and their singularities: The characterization of strange sets. Phys. Rev. 1986, 33, 1601. [Google Scholar]
  37. Yan, C.; Xu, G.; Li, X. Stability analysis of mined-out areas influenced by blasting vibration with FLAC3D. Chin. J. Rock Mech. Eng. 2005, 2894–2899. [Google Scholar]
Figure 1. An example of a post-peak amplitude decay curve.
Applsci 15 04529 g001
Figure 2. Conceptual model of three types of intense dynamic loads: (a) roof plate tenile type; (b) media compression type; (c) fault slip type (modified from Linming et al. [29]).
Applsci 15 04529 g002
Figure 3. Technology roadmap.
Applsci 15 04529 g003
Figure 4. Division of mining areas in Gu Cheng Coal Mine.
Applsci 15 04529 g004
Figure 5. Numerical simulation model diagram.
Applsci 15 04529 g005
Figure 6. Specific implementation plan process.
Applsci 15 04529 g006
Figure 7. Planar distribution map of working face dynamic loading events with energy greater than 103 J, where green dots represent 104 J energy events and pink dots represent 103 J events.
Applsci 15 04529 g007
Figure 8. Spatial distribution (a) and partial waveforms of strong dynamic loads (b).
Applsci 15 04529 g008
Figure 9. Comparison chart of seismic source parameters for different types of ruptures in mine seismic events.
Applsci 15 04529 g009
Figure 10. Decay curve of peak amplitude after strong dynamic load wave. (a) M1. (b) M2. (c) M3. (d) D1. (e) D2. (f) D3. (g) B1. (h) B2. (i) B3.
Applsci 15 04529 g010
Figure 11. Multifractal characteristics of F1 event. (a) F (q, s)~q; (b) h(q)~q; (c) τ(q)~q; (d) f ( α ) ~ α .
Applsci 15 04529 g011
Figure 12. Vertical direction particle vibration velocity–time curve for different dynamic load wave propagation. (a) Roof-type, (b) fault-type, (c) coal pillar-type.
Applsci 15 04529 g012
Figure 13. FFT spectrum of dynamic load waves in vertical direction. (a) Roof-type, (b) fault-type, (c) coal pillar-type.
Applsci 15 04529 g013
Figure 14. Regression curves of particle peak vibration velocity.
Applsci 15 04529 g014
Figure 15. Cloud map of maximum principal stress distribution before and after disturbance. (a) Unperturbed, (b) roof-type, (c) fault-type, (d) coal pillar-type.
Applsci 15 04529 g015
Figure 16. Cloud map of minimum principal stress distribution before and after disturbance. (a) Unperturbed, (b) roof-type, (c) fault-type, (d) coal pillar-type.
Applsci 15 04529 g016aApplsci 15 04529 g016b
Figure 17. Distribution of difference in principal stresses before and after disturbance. (a) Unperturbed, (b) roof-type, (c) fault-type, (d) coal pillar-type.
Applsci 15 04529 g017
Figure 18. Curves of difference in principal stresses before and after disturbance.
Applsci 15 04529 g018
Table 1. Statistics of typical strong dynamic load low-frequency displacement Ω0 and corner frequency f0.
EventΩ0/m∙sf0/HzMark
11.29 × 10−71.83D1
21.54 × 10−72.22D2
32.47 × 10−710.42D3
44.56 × 10−72.09B1
51.13 × 10−816.84B2
61.19 × 10−837.96B3
71.62 × 10−87.19M1
82.65 × 10−82.77M2
96.02 × 10−79.86M3
Table 2. Statistical analysis of typical strong dynamic load seismic source parameters.
EventSeismic Moment/N∙mSource
Radius/m
Radiated
Energy/J
Apparent Volume/m3Stress
Drop/MPa
Apparent Stress/MPa
13.08 × 101085.912.00 × 1047.89 × 10521.2380.195
24.59 × 101071.661.00 × 1044.05 × 10663.6390.077
31.27 × 101129.761.20 × 1045.63 × 10739.3780.153
41.03 × 101175.341.81 × 1041.54 × 10710.1090.087
53.58 × 1099.521.49 × 1041.96 × 10424.7231.953
65.56 × 1094.151.67 × 1043.09 × 10434.0450.901
74.25 × 10936.651.34 × 1042.26 × 10441.8350.952
82.47 × 10956.941.37 × 1047.40 × 10358.4331.667
96.24 × 101051.881.60 × 1046.01 × 10615.8310.674
Table 3. Main frequency characteristics of fault-type dynamic load waves.
EventFirst Main
Frequency/Hz
Second Main
Frequency/Hz
Frequency Range/Hz
M113.130.7[10, 40]
M215.627.6
M312.749.1
Table 4. Main frequency characteristics of roof-type dynamic load waves.
EventFirst Main Frequency/HzSecond Main Frequency/HzThird Main FrequencyFrequency Range/Hz
D160.850.833.1[30, 60]
D245.357.635.2
D369.138.78.7
Table 5. Main frequency characteristics of coal pillar-type dynamic load waves.
EventFirst Main Frequency/HzSecond Main Frequency/HzThird Main FrequencyFourth Main FrequencyFrequency Range/Hz
B161.839.812.123.4[40, 80]
B245.749.422.911.1
B383.477.268.449.6
Table 6. Fitting parameters of decay curve of peak amplitude after strong dynamic load wave.
EventFitting Coefficient mDecay Coefficient nR2
M11.75 × 10−73.710.94896
M22.22 × 10−61.090.84846
M31.95 × 10−61.240.95688
D14.63 × 10−71.730.93215
D22.41 × 10−61.090.77968
D38.19 × 10−85.210.96950
B12.32 × 10−74.910.96279
B27.73 × 10−84.140.81614
B36.92 × 10−62.180.94912
Table 7. Multifractal spectrum parameters of three types of strong dynamic load.
Event∆αf(α)Event∆αf(α)Event∆αf(α)
M11.172−0.697D11.650−0.570B11.600−0.284
M21.405−0.728D21.527−0.598B21.639−0.433
M31.358−0.675D31.453−0.446B31.626−0.366
Disclaimer/Publisher’s Note: The statements, opinions and data contained in all publications are solely those of the individual author(s) and contributor(s) and not of MDPI and/or the editor(s). MDPI and/or the editor(s) disclaim responsibility for any injury to people or property resulting from any ideas, methods, instructions or products referred to in the content.

