Review

Innovative Approaches in Sensory Food Science: From Digital Tools to Virtual Reality

1
Chemistry Research Centre-Vila Real (CQ-VR), Biology and Environment Department, School of Life Sciences and Environment, University of Trás-os-Montes and Alto Douro, 5000-801 Vila Real, Portugal
2
Institute for Systems and Computer Engineering, Technology and Science (INESC TEC), 4200-465 Porto, Portugal
3
Centre for the Research and Technology of Agro-Environmental and Biological Sciences (CITAB) and Institute for Innovation, Capacity Building and Sustainability of Agri-Food Production (Inov4Agro), University of Trás-os-Montes and Alto Douro, 5000-801 Vila Real, Portugal
4
Chemistry Research Centre-Vila Real (CQ-VR), Department of Agronomy, School of Agrarian and Veterinary Sciences, University of Trás-os-Montes and Alto Douro, 5000-801 Vila Real, Portugal
*
Author to whom correspondence should be addressed.
Appl. Sci. 2025, 15(8), 4538; https://doi.org/10.3390/app15084538
Submission received: 31 January 2025 / Revised: 24 March 2025 / Accepted: 14 April 2025 / Published: 20 April 2025

Abstract

:
The food industry faces growing challenges due to evolving consumer demands, requiring digital technologies to enhance sensory analysis. Innovations such as eye tracking, FaceReader, virtual reality (VR), augmented reality (AR), and artificial intelligence (AI) are transforming consumer behavior research by providing deeper insights into sensory experiences. For instance, FaceReader captures emotional responses to food by analyzing facial expressions, offering valuable data on consumer preferences for taste, texture, and aroma. Together, these technologies provide a comprehensive understanding of the sensory experience, aiding product development and branding. Electronic nose, tongue, and eye technologies also replicate human sensory capabilities, enabling objective and efficient assessment of aroma, taste, and color. The electronic nose (E-nose) detects volatile compounds for aroma evaluation, while the electronic tongue (E-tongue) evaluates taste through electrochemical sensors, ensuring accuracy and consistency in sensory analysis. The electronic eye (E-eye) analyzes food color, supporting quality control processes. These advancements offer rapid, non-invasive, reproducible assessments, benefiting research and industrial applications. By improving the precision and efficiency of sensory analysis, digital tools help enhance product quality and consumer satisfaction in the competitive food industry. This review explores the latest digital methods shaping food sensory research and innovation.

1. Introduction

The food sector faces growing challenges driven by evolving consumer demands, making adopting innovative technologies essential to maintaining and enhancing competitiveness [1,2]. Advances in digital technologies have significantly improved sensory science by increasing objectivity and reducing bias in data collection and interpretation compared to conventional methods. These technologies enable the integration of panelists’ physiological and emotional responses to food and beverage stimuli, providing precise and objective data through various sensor systems [3]. The test environment shapes consumer responses, acceptance, and perceptions of stimuli evaluated during sensory sessions [4]. Therefore, incorporating physiological and emotional reactions into sensory analysis is essential to mitigating biases that hinder effective product development in the food and beverage industry.
Among these innovations, intelligent and biometric technologies are gaining increasing attention in sensory analysis. Initially, it was found that the number of experienced experts was limited and that emotional tendencies and subjective biases could influence their judgments. To address this, intelligent sensory techniques that mimic human sensory organs are becoming more prevalent. Additionally, sensory analysis is now widely used for consumer testing, with biometric techniques gaining attention for capturing consumers’ unconscious responses to food stimuli [5,6].
Moreover, the application of sensory analysis differs between laboratory and industrial settings. Time and labor constraints are often overlooked in laboratory environments, whereas these factors are crucial in real-world production. As a result, sensory analysis methods are evolving to become faster, more efficient, and less influenced by subjective bias. This highlights the need to develop intelligent instruments capable of performing sensory analysis without human intervention [5,6].
Recent advances in sensory testing have introduced tools like Virtual Reality (VR) to help food scientists evaluate product design, labeling, placement, and store layout while gaining deeper consumer insights [7]. Virtual reality immerses users in simulated environments, engaging multiple senses through visual, auditory, and tactile stimuli. A key application is consumer sensory testing, which allows researchers to study food experiences and shopping behavior in virtual settings [8]. However, validating VR studies is crucial to ensuring their reliability compared to real-life scenarios.
Xu et al. [9] investigated the validity of VR by having participants rank cereals based on perceived healthiness in both VR and real-life environments. The results showed a strong correlation between the rankings in both settings, although the tasks in VR took longer. Information-seeking behavior remained similar across environments, confirming VR’s potential as a reliable tool for sensory research.
Digital technologies include electronic and digital data acquisition, storage, and analysis tools. Many emerging digital technologies rely on remote sensing or non-contact, non-invasive methods, such as video and infrared thermal imaging, to collect information. The primary goal of these technologies is to eliminate the need for contact-based or invasive sensors, which can introduce bias by making panelists overly aware of the assessment process. This heightened awareness can lead to stress and distraction, ultimately affecting their focus on the sensory tasks [10]. This reduces bias in the emotional interpretation of data, even among trained individuals conducting double-masked assessments, and these technologies enhance the reliability of sensory research [11]. The objective is not to replace consumers or trained sensory panels but to integrate advanced methods into food and beverage production processes, enabling real-time adjustments and improvements.
This review explores the current trends in digital approaches to the sensory analysis of food products.

2. Integrating Virtual Reality and Augmented Reality into Sensory Food Research

Integrating virtual reality (VR) and augmented reality (AR) into sensory food research represents a novel approach to studying and enhancing users’ experiences with food. These technologies provide immersive and interactive environments that allow researchers to simulate different contexts and assess their impact on sensory perceptions [12,13].
Recent research has compared consumer responses in immersive VR environments and traditional sensory laboratory settings across various food products, including cheese [14], tea break snacks [15], chocolate [16], and alcoholic beverages [17]. Findings suggest that hedonic evaluations can vary depending on the context for certain products [14], while others remain unaffected [16,17], likely due to differences in environmental settings. Beyond academic research, the food industry actively explores VR to enhance multisensory experiences. Studies have shown that VR-based simulations of tea color had minimal impact on taste ratings but influenced perceived saltiness when the color matched taste expectations [18]. Similarly, a VR sensory test examined how product color influenced flavor identification. Participants viewed orange juice either in its original orange color or in an atypical green color before tasting it. Results showed that identifying the dominant flavor was more challenging when the juice was presented in an atypical color [19].
Multisensory congruence also plays a role—participants spent more time evaluating coffee when visual, auditory, and olfactory cues were aligned, and beverages were perceived as sweeter in a sweet-congruent VR environment [20]. An essential application of VR is the simulation of food environments, allowing researchers to create different settings, such as restaurants or outdoor locations, to assess how context influences sensory evaluations. Research has shown that specific virtual environments can significantly affect participants’ hedonic responses to food [21]. Another significant advantage is the enhanced ecological validity of sensory evaluations. Traditional methods in controlled laboratory settings often fail to replicate real-world conditions. These findings highlight the substantial role of VR in sensory perception, mainly through congruent or incongruent multisensory cues.
Augmented reality (AR) is an immersive technology that overlays computer-generated virtual information—primarily visual, auditory, and tactile elements—onto the real world [22]. Controlled studies have shown that AR overlays can significantly influence the sensory perception of food. Users interact with digital overlays, making AR a valuable tool for visualizing new products, exploring product concepts, and conducting nutrition-related studies, such as assessing meal sizes. However, AR cannot replicate real-world eating experiences or test environments [23]. Despite these constraints, research highlights the potential of AR to modify and enhance sensory experiences, demonstrating its ability to influence food perception in controlled settings.
By simulating realistic environments using VR and AR, researchers can make more accurate predictions about consumer behavior [24]. In addition, these technologies facilitate in-depth studies of consumer behavior by allowing researchers to observe decision-making processes in immersive virtual environments that resemble real-life scenarios, thus providing valuable insights into how consumers select and interact with food [25]. In particular, AR has the potential to enhance sensory perception by overlaying digital information onto actual food products, modifying the perception of taste, smell, or appearance without physically altering the food itself [26].
From a technological perspective, the level of immersion in VR systems plays a crucial role. Fully immersive setups, such as head-mounted displays, can increase the effectiveness of sensory evaluations compared to semi-immersive or desktop systems [27]. Moreover, combining VR/AR with biometric measurements, such as eye tracking or facial recognition, provides deeper insights into unconscious consumer responses [27].
Integrating VR and AR into sensory food research, particularly wine tasting and analysis, offers innovative opportunities. A key example is the “E-Flavor” project, which aimed to enhance sensory flavor analysis using immersive technology. In this project, researchers developed virtual tasting environments using Blender for 3D modeling and Unity to ensure compatibility with the VR headset. These virtual environments were explicitly optimized to simulate real-world sensory evaluations, providing an interactive experience for both consumers and evaluators.
User testing confirmed the effectiveness of the VR setup, ensuring smooth interaction with controllers when manipulating tasting elements. The findings highlighted several benefits:
  • Educational and Scientific Value: VR enhances learning by creating engaging, interactive experiences.
  • Cost Reduction: Virtual environments minimize the need for physical laboratory setups, reducing research costs.
  • Expanded Research Opportunities: Researchers can conduct sensory studies in controlled virtual settings, improving data collection and analysis [28].

3. The Role of Artificial Intelligence in Sensory Analysis and Food Innovation

Integrating artificial intelligence (AI) into sensory analysis represents a transformative advance in technology and science, enabling a deeper understanding of sensory perception and consumer preferences. AI facilitates the analysis of large datasets, identifying complex patterns that traditional methods may miss. Machine learning algorithms make it possible to predict how individuals or groups of consumers perceive sensory attributes, such as taste, aroma, texture, and appearance. This predictive capability accelerates product development, reduces costs, and shortens iterative processes, making AI a highly efficient tool for the food industry [29]. AI enhances the prediction of sensory preferences by analyzing complex data. Researchers use machine learning models tailored to specific sensory datasets [30]. Different machine learning models are applied, depending on the sensory data being analyzed. For example, artificial neural networks [31,32] predict taste and aroma profiles based on chemical composition, while convolutional neural networks [33,34] assess food texture and visual appeal; recurrent neural networks [35] analyze time-series sensory data, such as changes during storage, fermentation, or aging; support vector machines [36,37,38] classify flavor profiles based on sensory attributes, and random forest [39] and decision trees [40,41] identify key sensory attributes. Researchers can use these AI techniques to develop predictive models that enhance sensory evaluations.
Traditionally, sensory evaluation relies on human panels, which can introduce subjectivity and variability. AI mitigates these challenges by standardizing sensory data interpretation through models trained on consumer preferences and sensory responses. For instance, neural networks can analyze chemical properties, flavor compounds, and consumer ratings to provide objective, quantified assessments of sensory appeal, leading to more consistent and reliable results [42]. However, high-quality training data are essential for the accuracy and reliability of AI-driven sensory research. A system providing descriptors (non-sensory measures) for predicting flavor or sensory properties must be appropriately defined. This means ensuring that its responses have a valid correlation with the parameters being predicted. Additionally, the algorithms must be precise enough to meet the system’s requirements for the intended task. Furthermore, predictive models must undergo rigorous validation to confirm their accuracy beyond the training set and to prevent overfitting [43,44]. Data preprocessing techniques like normalization, noise reduction, and feature selection refine the raw data to improve pattern recognition and minimize irrelevant variation [44,45]. Diverse training samples and rigorous validation across consumer groups should be used to mitigate algorithmic bias. Critical analysis of the effectiveness of these models in different scenarios provides insight into the trade-offs between bias reduction and model performance [31,44,46,47].
AI is critical to analyzing food composition, flavors, and chemical components. Researchers use it to study complex flavors, understand consumer preferences, and develop flavor molecule databases to identify volatile compounds [48,49,50]. Integrating targeted metabolomics with machine learning enhances flavor chemistry analysis, enabling precise sensory perception predictions in fruit flavors [51]. AI-driven taste profiling helps identify key flavor compounds, as demonstrated in studies of dry-aged beef, wet- and dry-aged mutton, and cheddar cheese at various stages of maturation [42,52].
Machine learning further enhances flavor pattern recognition for food quality improvement, natural flavor development, and sensory perception prediction [49]. Ji et al. [49] introduced a reinforcement learning framework for discovering new flavor compounds, demonstrating the potential of AI in flavor engineering. Additionally, artificial neural networks optimize food texture prediction and quality, ensuring consistency and improving consumer satisfaction [53]. This approach can help standardize yogurt texture by identifying key variables that affect product quality. Artificial neural networks typically consist of input variables, hidden layers, and output variables [53].
Beyond individual sensory attributes, AI integrates data from multiple sources, including electronic nose and tongue, biochemical analysis, and consumer feedback, offering comprehensive insights into sensory attributes and consumer preferences. This integration expands research capabilities and fosters innovation in sensory studies.
AI is also driving advances in food personalization by leveraging individual preference data. Sophisticated algorithms enable the development of customized formulations tailored to specific dietary needs or sensory preferences, addressing the rising demand for personalized food experiences. This capability fosters innovation in specialized markets, such as functional foods and alternative proteins [54].
In addition, AI is advancing the scientific understanding of sensory perception by identifying correlations between sensory data and neural or biochemical responses. These insights contribute to broader research areas, including neuroscience, psychology, and nutrition, and deepen our understanding of the complex interplay between human perception and food attributes.

4. Electronic Nose, Electronic Tongue, and Electronic Eye in Sensory Food Sciences

Electronic nose (E-nose) and electronic tongue (E-tongue) are gas sensors or chemical sensors that mimic the human sense of smell and taste, respectively [55]. An E-nose is a gas sensor array that generates a unique fingerprint response to specific volatile compounds. These data are processed using pattern recognition algorithms, such as artificial neural networks, to enable discrimination and classification [56]. E-nose devices typically use metal oxide semiconductor field-effect transistors, conductive polymers, quartz crystal microbalances, or, most commonly, metal oxide semiconductor sensors. These sensors detect specific gases by changing their material resistance. Shooshtari and Salehi [57] recently confirmed the potential of carbon nanotube–titanium dioxide hybrids for detecting volatile organic compounds in E-nose devices. The E-tongue is commonly used with chemical sensors such as electrochemical sensors, including voltammetric, amperometric, potentiometric, conductometric, impedimetric, biosensors, and optical sensors like spectroscopic sensors [58,59,60]. Like the gas sensors in an E-nose, the chemical sensors in an E-tongue interact with analytes, inducing reversible changes in their electrical properties. These changes generate measurable electrical signals, which are then analyzed for pattern recognition and classification [56]. A typical E-tongue system comprises a chemical sensor array, a reaction vessel, measurement devices, transducers, data acquisition units, and data processing and pattern recognition algorithms [56].
The primary purpose of E-nose and E-tongue technologies is to enhance sensory analysis by providing objective, quantifiable data that account for human perceptions’ inherent subjectivity and variability. Unlike human sensory evaluation, which depends on memory recall and individual experience, these electronic systems offer consistency, reproducibility, and the ability to detect subtle differences that may go unnoticed by the human senses [61]. While the human nose can evaluate smell, individual judgments may be biased as they cannot be used to detect toxic volatile compounds. In addition, the human nose has detection limits for different volatile compounds, making it unsuitable as a universal tool for all smell-related discrimination and classification [56]. Moreover, training and maintaining a sensory panel is time-consuming and costly. In some cases, sensory panels may introduce bias if the panelists are not well-trained. To address these limitations, researchers have increasingly employed the E-tongue as a rapid, unbiased, and cost-effective alternative to human sensory evaluation [62]. In the food and beverage industry, these devices are widely used to evaluate the sensory characteristics of products, either complementing or replacing traditional sensory analysis and serving as quality indicators.
Initially, E-nose and E-tongue devices were expensive, required significant laboratory space, and were neither portable nor easily accessible to many companies and researchers [63]. However, recent advances have focused on developing low-cost sensors to create smaller, portable devices, significantly increasing their usability and accessibility.

4.1. Electronic-Nose

Until the 1990s, sensory analysis was commonly used to determine the olfactory characteristics of food products. However, it was often inconsistent, imprecise, and highly subjective, as human senses, including smell, are influenced by physical, mental, and external factors. Sensory analysis is typically combined with analytical tools such as gas chromatography to improve accuracy. While effective, these methods require significant time, expertise, and expensive equipment [64]. The E-nose has emerged as a widely used alternative to address the food industry’s need for faster and more efficient quality assessment. The E-nose detects volatile compounds in food matrices and converts them into electronic signals using a sensor array. A key advantage of the E-nose technology is its ability to leverage machine learning for data processing and interpretation. Advanced algorithms enhance their predictive capabilities, including support vector machines, artificial neural networks, and deep learning. Boosting techniques, such as AdaBoost, gradient boosting, XGBoost, and LightGBM, improve predictive accuracy by combining weak models into a strong learner. Compared to traditional sensory analysis, E-nose technology offers greater accuracy, reliability, and efficiency while being less affected by environmental factors. Additionally, unlike analytical methods such as gas chromatography, it is easier to use and interpret and requires less specialized expertise [65,66].
The E-nose consists of three main components: a sample delivery system, an array of gas or chemical sensors, and a pattern recognition system. This technology is widely used to detect simple and complex volatile organic compounds, making it an invaluable tool in the food industry [65]. Since the introduction of the first E-nose in 1982, which incorporated chemical sensors and pattern recognition, significant technological advances have been made [67]. The E-nose effectively complements human sensory panels by providing fast, reliable, and consistent results [68].
Like the human nose, the E-nose operates through sensors that detect odors and generate specific patterns based on the type of odor detected. These patterns are analyzed and trained to discriminate between different odors, enabling the system to recognize new patterns tailored to the needs of the food industry [69].
Štefániková et al. [70] evaluated cheese aroma using a gas chromatography-based E-nose and compared its performance with sensory analysis. Their results demonstrated that the E-nose is well suited for monitoring cheese aroma quality and successfully identified significant differences between smoked cheese treatments.
E-nose systems have been applied in the bakery industry to analyze volatile compounds in flours, ingredients, processing steps, and storage conditions [71]. Many studies focus on detecting volatile compounds to identify spoilage and fungal growth. For example, a non-destructive E-nose was developed to monitor bread spoilage by analyzing changes in volatile compounds and fungal growth during storage [72].
Gonzalez Viejo and Fuentes [73] developed a low-cost, wireless E-nose equipped with nine gas sensors to evaluate volatile compounds in beer. Similarly, Fuentes et al. [74] applied this technology to assess smoke-tainted red wine treatments. They also developed an artificial neural network (ANN) model to predict the acceptability of sensory attributes, such as appearance, overall aroma, smoke aroma, bitterness, sweetness, acidity, warming mouthfeel, overall liking, perceived quality, and smoke aroma intensity. Additionally, the model assessed emotions using a 0–100 FaceScale.
Nomura et al. [75] used an E-nose with ten different sensors to monitor changes in the aroma of banana juice over time. Similarly, Farahmand et al. [76] utilized an E-nose to complement sensory analysis in evaluating the aroma of sourdough. Their E-nose, equipped with six gas sensors sensitive to alcohol, carbon monoxide, ammonia, and hydrogen sulfide, analyzed aroma, while consumer sensory analysis assessed acceptability.
Hübert et al. [77] demonstrated the ability of the E-nose to identify basil, cardamom, pepper, and turmeric using 12 conductive polymers with a time-delayed neural network.
The complexity of coffee aroma has led to several applications of E-nose technology. Traditionally, the roasting degree is assessed visually, requiring highly skilled operators. To address this, a portable E-nose with 10 temperature-controlled metal oxide sensors was tested to automate the roasting process [78]. This reproducible method evaluates coffee bean quality and complements industry standard parameters.

4.2. Electronic Tongue

The human sense of taste recognizes five basic tastes: sweetness, acidity, bitterness, saltiness, and umami. Sensory panels are commonly used to evaluate food taste, but they can be costly, time-consuming, and subject to bias. To address these challenges, researchers have developed the E-tongue as a fast and objective alternative [79].
An E-tongue is a multi-sensor system consisting of an array of sensors or biosensors combined with multivariate statistical analysis techniques such as principal component analysis (PCA), linear discriminant analysis (LDA), soft independent modeling of class analogy (SIMCA), and partial least squares (PLS) regression. It is widely used for fast, reproducible, quantitative, and qualitative measurements [80]. The E-tongue mimics the human taste system and consists of three main components: a sample preprocessor, similar to the taste receptors in the oral cavity, which converts the characteristics of the liquid sample into electronic signals [81]; a sensor/biosensor array which functions like the neural sensory system, which detects the signals from the preprocessor and transmits them to the data processing unit; and a data processing and pattern recognition system, which analyzes and interprets the collected information. This system includes three key elements: non-specific chemical sensors with partial selectivity, a pattern recognition method for data interpretation, and multivariate calibration for advanced processing [82]. Pattern recognition and classification are performed using measurable electrical signals [83]. The sensor array determines system performance by converting chemical interactions into signal outputs. E-tongues operate in liquid phases using electrochemical techniques like voltammetry, potentiometry, and conductometry [84], with potentiometric and voltammetric sensors being the most widely used [85]. While both methods are based on electrochemical principles, voltammetry differs from potentiometry because it involves current flow between electrodes and often produces more complex data. Voltammetry provides higher-order information, including reaction kinetics, but is limited to redox-active species. In contrast, potentiometric sensors are sensitive to charged molecules. Due to their complementary characteristics, hybrid E-tongues have been developed by combining these techniques. A hybrid E-tongue can integrate potentiometric, voltammetric, and/or conductivity sensors and optical, amperometric, mass sensors, and enzymatic biosensors [86]. After collecting signals from all sensor types, chemometric methods are applied to process the data, as the response of each sensor depends on the concentration of multiple components. Combining different sensor types, the hybrid E-tongue provides more comprehensive information about a sample, enhancing reliability, accuracy, and classification precision [86]. Biosensors are also being integrated into hybrid systems. For example, a combination of potentiometric and voltammetric sensors with a multi-enzymatic biosensor has been used to analyze wine samples for the determination of sugars (glucose, fructose, maltose) and fermentation products (ethanol, glycerol) [87].
These hybrid systems have been applied in various fields, including the classification of fermented milk [86], the measurement of NaCl, NaNO3, and KNO3 concentrations [88], the monitoring of beer fermentation [89], the quality control of wine [90], the tracking of wine fermentation and storage [91], and the detection of trinitrotoluene (TNT) [92]. For example, ion-selective electrodes have been used to measure pH, carbon dioxide, and chloride ion concentrations in the classification of fermented milk. The voltammetric E-tongue had six working electrodes (gold, iridium, palladium, platinum, rhenium, and rhodium) and an Ag/AgCl reference electrode. Pulse voltammetry was used to record current transients in response to voltage pulses at decreasing potentials [86]. E-tongue systems have been widely used for food analysis, offering a wide range of applications by minimizing interference from external substances and effectively differentiating highly complex samples [60]. These systems employ chemometric methods and artificial intelligence to achieve key objectives, such as sample discrimination, identification, and quantification [58,93]. Applications of E-tongue systems include various areas, such as quality control [94], food identification [95,96,97], taste evaluation [98,99], and process monitoring [100,101].
Paup et al. [102] used a potentiometric E-tongue to detect spicy compounds in solutions, providing a potential method for evaluating spicy foods while reducing sensory panelist fatigue.
Nery and Kubota [103] successfully developed a paper-based potentiometric E-tongue capable of discriminating between beer and wine samples. Similarly, Daikuzono et al. [104] developed a paper-based disposable E-tongue connected to an impedance analyzer for chemical compound detection. This system was used to identify sugar types and predict the brand of apple juice samples using principal component analysis. Although paper-based E-tongues have demonstrated effectiveness and accuracy in analyzing various products, no commercial applications have been developed.
A significant challenge in their implementation is ensuring consistent electrical responses from sensing units, which requires recalibration each time a unit is replaced. However, studies have shown that an E-tongue maintained stability over 90 samples without recalibration. Storage stability was assessed over four weeks by comparing each electrode’s standard deviations (N = 3) using single-factor ANOVA, showing no significant differences between measurements and high reproducibility [103].
Data reproducibility was unsatisfactory in triplicate measurements using three independent E-tongues in complex samples like apple juice. Achieving precise fabrication and functionalization of twelve consistently sensitive units for triplicate measurements remains a significant challenge [104].
E-tongues are widely used in the wine industry to classify alcohols, detect adulterations, classify wines by geographic origin, and differentiate wines based on specific fingerprints [105].
Voltammetric E-tongues have also been applied to detect argan oil adulteration, differentiate honey by flower type, assess pasteurized milk quality, and analyze spring water quality [106].
Integrating multimodal sensor data requires combining hybrid sensor technologies, machine learning calibration, data fusion strategies, and AI-driven predictive modeling. These advances effectively address challenges such as sensor drift, cross-reactivity, and the complexity of real-world samples, resulting in a more precise and reliable sensory analysis platform.
In this context, hybrid E-tongue systems that incorporate potentiometric, voltammetry, and enzymatic biosensors enhance the accuracy and reliability of sensory analysis. As mentioned above, these systems improve selectivity using chemometric techniques, e.g., PCA and LDA, to differentiate complex sample matrices and mitigate cross-reactivity issues [80,86]. By processing data from multiple sensor modalities, a hybrid E-tongue provides a more comprehensive representation of taste-related properties, improving classifiable accuracy in food and beverage applications.
To address sensor drift, real-time calibration models based on machine learning can detect and compensate for sensor response drift over time. Adaptive machine learning techniques such as support vector machines (SVMs) and artificial neural networks (ANNs) allow for continuous recalibration, ensuring long-term sensor stability with minimal human intervention [44]. These models are trained on large datasets that include various environmental conditions and product-specific attributes, making the sensors more robust.
Integrating multimodal information from E-nose, E-tongue, and E-eye provides a multilayered approach to sensory analysis to minimize cross-reactivity. E-nose sensors measure volatile compounds, while E-eye systems assess color and appearance, complementing the liquid phase measurement of the E-tongue. This modality fusion decreases cross-reactivity among chemically similar compounds and maximizes the specificity of sensory testing [55,61].
The complexity of real-world samples is addressed through advanced data fusion techniques integrating information from multiple sensors. Hybrid systems combining electrochemical, optical, and spectrometric sensors provide a more comprehensive characterization of food matrices. Chemometric techniques such as PLS regression and SIMCA improve classification accuracy by identifying slight differences in highly complex samples [80,86]. This facilitates the detection of food authenticity and adulteration with greater precision.
Lastly, artificial intelligence (AI) and deep learning algorithms enhance the analysis and interpretation by identifying inherent patterns from large datasets. AI-based predictive modeling results in real-time food and beverage quality evaluation and improves the efficacy and reliability of sensory evaluation tests [31,42]. By integrating multimodal sensor data and supervised learning approaches, predictive models continuously learn and improve their accuracy, improving stability and robustness to food analysis technologies [44,45].

4.3. Electronic Eye

Color is a critical factor in food quality, significantly influencing perceptions of freshness, desirability, ripeness, and safety and, ultimately, influencing consumer choices [107]. It results from the interaction of light with retinal receptors, which transmit signals to the brain via the optic nerve. However, perception is also affected by lighting conditions [108].
The E-eye is a low-cost, portable technology designed for food quality assessment. It differentiates colors by detecting wavelengths and utilizes various color spaces, including HSI (hue, saturation, intensity), HSV (hue, saturation, value), HSL (hue, saturation, lightness), and HSB (hue, saturation, brightness) [79]. Techniques such as colorimetry, spectrophotometry, and computer vision provide precise color analysis, making the E-eye suitable for large-scale applications [109].
An E-eye is a computer vision system that employs an image sensor to convert optical images into digital data, eliminating the subjectivity of human vision [110]. Combined with machine learning, it can process complex sensory information, develop predictive models based on training data, and establish relationships between input and output data—providing valuable insights for manufacturers [110]. This technology is widely used in food quality assessment, offering rapid, precise, and non-invasive evaluation of key attributes such as shape, size, color, and texture [111].
This innovative system integrates multiple disciplines, including mechanics, optics, electromagnetic detection, colorimetry, spectrophotometry, digital video, and image processing. These capabilities make it essential for tracking changes in visual quality during production [112]. The E-eye ensures accurate and consistent monitoring, as appearance and color influence consumers’ perceptions of quality. Its advantages include objective and reproducible measurements, data storage for traceability, and the ability to analyze products without altering their texture or consistency. Furthermore, it complements sensory panel evaluations by providing detailed analytical data, thereby increasing the depth of quality assessment [113]. E-eyes are widely applied in the food industry to evaluate sensory attributes, from monitoring ripening and harvesting stages to assessing raw materials and processed foods [111].
The color of liquid foods can be difficult to assess visually, yet it plays a crucial role in consumer preference. Studies have demonstrated a strong correlation between beverage color and consumer perception. For instance, Fernández-Vázquez et al. [114] investigated the color of orange juice using trained panelists and instrumental measurements and found a significant relationship between sensory evaluations and instrumental data. Similarly, visual color estimates correlated with instrumental measurements for red wine, although discrepancies in hue perception were observed [115]. In the honey industry, color is an important quality indicator associated with the floral origin and chemical composition. Sahameh et al. [116] used machine vision to classify honey by floral origin and predict chemical parameters but found it insufficient for comprehensive characterization. Integrating multiple technologies, such as E-tongue and E-nose with the E-eye, could improve honey characterization, offering a more reliable and robust assessment method. Sreeraj et al. [117] investigated using an E-eye to predict ripening parameters. This process typically involves capturing images with a flatbed scanner and analyzing color levels using the RGB scale. A satisfactory calibration model was developed to correlate image color data with the phenolic composition of grapes, allowing real-time monitoring of the ripening process [118]. Similarly, Yang et al. [113] investigated the physical properties and sensory analysis of citrus oil-based nanoemulsions using a digital imaging system. Their study demonstrated how the electronic eye technology effectively detects color variations in emulsion samples. This method can be extended to industries dealing with high-density oils or beverages, enhancing quality control and product consistency. Extensive research has also explored the application of E-eye technology in evaluating the quality of fresh meat and meat products. It is beneficial for assessing and tracking color changes, key indicators of meat freshness, and overall quality [119].

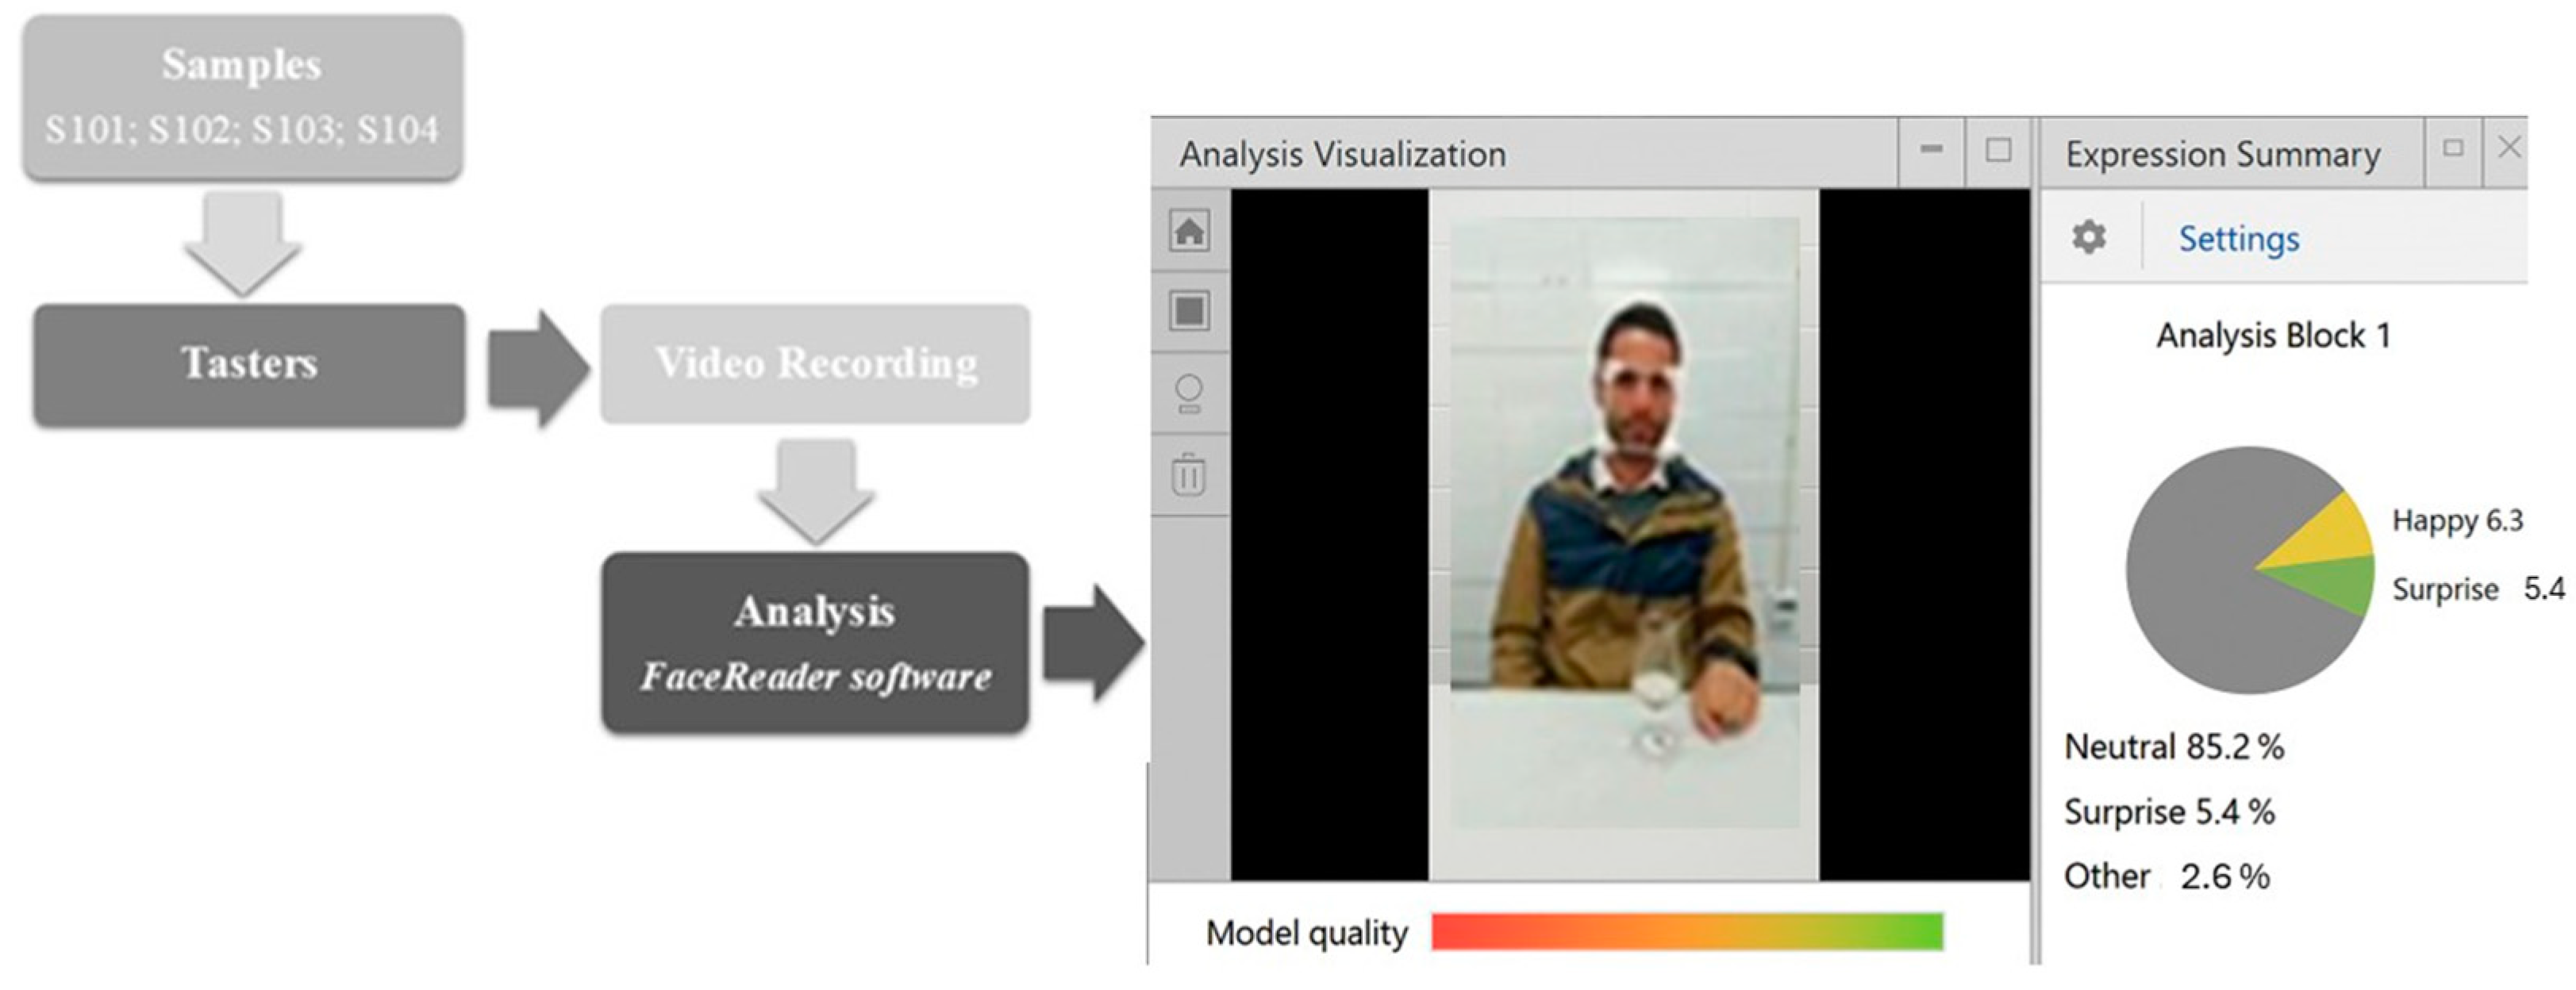
5. The Use of Eye Tracking and FaceReader for Food Products

In recent years, consumer behavior research has increasingly integrated innovative technologies to gain deeper insights into how food products are perceived and evaluated [120]. Eye tracking and FaceReader have emerged as powerful tools, providing valuable data on consumer attention, emotional responses, and sensory engagement during food product evaluation.
Eye tracking technology monitors eye movements and gaze patterns, offering a unique way to measure visual attention to food packaging, product features, and advertising [121]. This technology enables researchers to identify visual cues that attract consumer attention, such as product color, shape, and labeling. It can be effectively applied in face-to-face and online contexts, including healthcare marketing, to enhance consumer understanding and optimize marketing strategies [122]. Researchers can identify key product attributes that attract attention by tracking where and for how long consumers focus their gaze. For example, a study by Graham and Jeffery [123] showed that prominently positioned nutrition information attracts significant consumer attention, highlighting how label placement can influence food choices.
Beyond product evaluation, eye tracking is pivotal to food sustainability research. A recent systematic review by Ruppenthal [124] highlights how eye tracking helps uncover consumers’ growing interest in eco-friendly products, offering valuable insights for sustainable product development and marketing. Studies by Peng et al. [125] compared real-life and virtual eye-tracking tasks, demonstrating that while virtual eye-tracking data can reflect visual preferences, these data do not fully capture the complex cognitive processes involved in real-life food choices. Although eye-tracking data in virtual environments can reflect visual preferences, they do not fully capture the complex cognitive processes involved in real-life food choices. Factors such as multisensory influence, social context, and physical product interaction are crucial in consumer behaviors and are difficult to replicate in virtual settings [121].
Furthermore, studies have shown that eye-tracking technology captures different attention phases. The “orientation” phase occurs when consumers’ gaze is drawn to visually salient features, while the “discovery” phase involves shifting focus to specific details such as logos or product names. As described by Husić-Mehmedović et al. [126], these phases are essential for understanding how consumer attention is initially captured and later distributed across different product attributes.
The influence of visual cues extends to the packaging design. Gvoka et al. [127], demonstrated that specific packaging elements, such as font weight and illustration size, significantly influence gaze duration and fixation count, with illustrations generally attracting the most attention. These findings highlight how targeted packaging features can shape consumer preferences, enhance product recall, and underscore the importance of strategic design elements.
Eye tracking contributes to understanding consumer decision-making processes by showing how visual cues impact product choice and purchase behavior. It provides a comprehensive view of how eye movements influence food-related decisions, with visual attention playing a critical role. Gunaratne and colleagues [128] further illustrated this in their study of chocolate packaging, showing that color, logos, and arrangement strongly influenced consumer fixation and preferences. Notably, familiar packaging designs evoked more positive emotional responses, such as happiness, suggesting familiarity and appealing visual elements drive consumer interest and satisfaction.
Another valuable tool for studying consumer behavior toward food products is FaceReader software (2023), which analyzes facial expressions to detect emotional responses in real-time. By evaluating emotions such as happiness, sadness, anger, surprise, fear, and disgust, FaceReader captures consumers’ affective experiences during tasting sessions or product interactions [129]. FaceReader assesses emotional responses by analyzing facial expressions triggered by sensory stimuli, including olfactory experiences. Studies have demonstrated its capability to detect nuanced emotional reactions to different scents by measuring expressions linked to emotions such as happiness, surprise, or disgust [130]. When applied to olfactory research, the FaceReader can correlate specific scent exposures with emotional responses, providing insight into consumer preferences and product acceptance [131]. These data are valuable for understanding how taste, texture, or aroma influences consumer acceptance and emotional engagement [132].
Figure 1 illustrates an experimental design to evaluate the emotions elicited by different Douro wine samples.
Further studies have highlighted the role of FaceReader in other areas, such as measuring emotional responses to food products through health claims. An experiment on extra-virgin olive oil showed that claims associated with high clarity increased perceived product healthiness and arousal, positively influencing consumer intentions [130].
Similarly, research on wine tasting underscored the effectiveness of FaceReader in detecting nuanced emotional responses associated with specific flavor profiles [133]. Several studies have identified key differences between traditional sensory evaluation and consumer research methods [120,129,133]. Traditional sensory analysis typically focuses on objective attributes such as taste intensity, texture, and chemical composition, relying on trained panels to assess product characteristics [120]. In contrast, consumer research incorporates emotional and psychological responses, providing a more holistic understanding of consumer preferences [134]. Marques and Vilela [129] found that the sweetness and acidity of Douro wines elicited emotions like happiness and surprise, highlighting how sensory experiences shape consumer preferences and guide product optimization. By integrating FaceReader with traditional sensory evaluation methods, food companies can develop products tailored to elicit positive emotional responses, increasing consumer satisfaction and brand loyalty. In addition, FaceReader software can be applied as a neuromarketing tool to compare the olfactory preferences of customers in selected markets [131].
Eye tracking and FaceReader offer a complementary approach to sensory and consumer research. Eye tracking provides objective, visual data on consumer attention, while FaceReader captures the emotional engagement associated with product experiences. Combining these technologies enables a comprehensive understanding of how food products are perceived and how emotional responses correlate with visual attention. This integrated methodology is valuable for evaluating new product concepts, optimizing packaging design, and tailoring marketing campaigns to align with consumer preferences.
Despite their advantages, these technologies also present several challenges (Table 1). For example, eye tracking requires specialized, high-cost equipment and controlled environments, which may limit its application in real-world settings. Similarly, FaceReader (facial recognition) has its limitations. The reliance on facial expressions as indicators of emotion can sometimes be influenced by external factors such as cultural differences, individual mood, or social context, potentially affecting the accuracy of emotional interpretations.
Integrating eye tracking and FaceReader into food product research offers a new perspective on consumer behavior, attention, and emotional responses. These technologies provide a deeper understanding of how food products engage consumers, from visual appeal to emotional satisfaction. As these methods evolve, their application in food marketing, product development, and sensory evaluation will likely expand.

6. Holistic Research Based on Sensory and Consumer Studies

Human sensory analysis is often labeled as “subjective,” leading to attempts to replace it with instrumental methods. However, no instrumental substitute can fully capture human perception as sensory experiences are inherently complex and influenced by numerous factors beyond what instruments can measure [138]. The subjective nature of sensory perception involves personal and cultural factors that are difficult to quantify instrumentally [139].
Efforts to relate sensory perception to instrumental measurements face several challenges. While instrumental methods can measure physical properties like texture or chemical composition, they often fail to capture the nuanced sensory attributes humans perceive, such as taste and aroma [140]. For instance, food texture is highly complex. It requires understanding both the physical transformations during consumption and the subjective sensory experience, which cannot be fully replicated by instrumentation alone [141].
Although instrumental methods are valued for their consistency and objectivity, they have limitations in predicting sensory experience. For example, texture profile analysis (TPA) can measure specific textural properties. Still, its results do not always align with human sensory evaluations, as demonstrated in studies of apple texture and cooked rice [142,143]. Instruments can quantify material properties, but these do not necessarily correspond to sensory properties, highlighting the need to distinguish between the two [139].
Bridging the gap between instrumental measurements and sensory experience requires a multidisciplinary approach. This involves integrating insights from sensory science, materials science, and even fields like dentistry and psychology to better understand and predict sensory experiences [141]. Recent advances in the human-machine interface in sensory science show promise for enhancing the accuracy of sensory evaluations by combining dynamic sensory methods with instrumental analysis [144].
The fundamental limitations in bridging the gap between instrumental measurements and human sensory experience lie in human perception’s inherent complexity and subjectivity. While instrumental methods provide valuable data, they cannot fully replicate sensory experiences’ nuanced and subjective nature. A multidisciplinary approach combining instrumental analysis with sensory science is essential for a complete understanding and accurate prediction of human sensory perceptions.
Holistic approaches to understanding consumer preferences emphasize integrating multiple factors, including individual, social, cultural, and technological influences. By considering these diverse elements, companies can develop more effective marketing strategies that resonate with consumers’ complex decision-making processes. These approaches highlight the importance of a holistic view to capture the dynamic nature of consumer preferences. Recent studies have explored various aspects of this topic.
Salam et al. [145] studied marketing strategies for Gen Z. Known as “digital natives,” Generation Z exhibits unique consumer preferences influenced by social values, environmental concerns, and sustainability. According to the authors [145], Gen Z relies heavily on social media influencers and prefers personalized experiences, highlighting the importance of marketing strategies that integrate social and technological factors to engage this demographic effectively. On the other hand, the online shopping behaviors of millennial consumers are significantly influenced by cultural and social factors [146]. Kalariya et al. [146] concluded that understanding these influences allows marketers to develop more effective strategies tailored to this demographic, demonstrating the importance of considering cultural and social dimensions in marketing.
Haris [147] examined the role of marketing research in understanding consumer behavior and preferences. The study highlighted how digital channels and social media have changed consumer behavior, underscoring the need for personalized marketing strategies. By leveraging digital analytics and consumer psychology, companies can better understand and influence consumer–brand interactions, integrating technological and psychological marketing factors [147,148].
Utami and colleagues [149] investigated the effect of marketing strategy on pricing and purchase interest. Their findings revealed that (1) Marketing strategies significantly affect pricing. (2) Marketing strategies do not significantly affect service quality or consumer willingness to purchase. (3) Pricing significantly affects purchase intention, especially when aligned with perceived value. (4) Service quality does not significantly affect purchase intentions. (5) Marketing strategy affects purchase intention through pricing but not through service quality, indicating that service quality is not a potent mediator in this relationship.
The interplay between individual traits, social dynamics, cultural norms, and technological innovations significantly shapes consumer behavior. As Rusdian et al. [148] concluded, marketers must consider these factors when designing effective strategies, highlighting the integration of artistic and technological influences.
Big data analytics in digital marketing also allows companies to tailor strategies to individual consumers, increasing customer satisfaction and engagement. This approach integrates technological advances with consumer insights, emphasizing the essential role of technology in understanding consumer behavior [150].
Holistic approaches to understanding consumer preferences require integrating individual, social, cultural, and technological influences. By considering these diverse elements, companies can develop marketing strategies that resonate with consumers’ complex decision-making processes, ultimately increasing sales and loyalty.
There are three main holistic frameworks and models: (i) The PIE framework—this model considers three primary sources of consumer preferences: the physical attributes of the product (P), individual characteristics of the consumer (I), and external peer group influences (E). It emphasizes the role of social interactions in shaping preferences and proposes a group-sourced mechanism for measuring these influences [151]. (ii) Holistic consumer experience—this approach integrates physical and sensory environmental triggers with subjective consumer evaluations to create shopping experiences. It highlights the importance of comfort and product evaluation in the physical and sensory dimensions, suggesting that consumer experiences are not static but dynamically produced by environmental interactions [152]. (iii) Holistic online consumer behavior—this model considers the entire consumer journey in online shopping, from pre-purchase to post-purchase stages. It incorporates dynamic factors and applies the push-pull-mooring theory to understand how different influences affect consumer decisions in digital environments [153].
Several factors can influence consumer preferences and purchase decisions. Personality traits and values significantly impact consumer preferences and purchase behavior. These individual characteristics interact with other factors to shape decision-making processes [141]. Social identity, reference groups, and cultural norms are critical in determining consumer behavior. These factors can vary significantly in different cultural contexts, affecting how consumers perceive and choose products [148]. The rise of digital channels and big data analytics has transformed consumer behavior by enabling personalized marketing strategies and enhancing the customer experience. These technologies allow companies to tailor their approaches to individual consumer needs and preferences [150].
As consumer demand for personalization increases, food manufacturers must adapt by understanding and predicting hedonic preferences to maintain market share [38]. Traditional methods for evaluating sensory quality rely heavily on human sensory evaluations, which are essential in product development and food research. However, multi-sensor technologies have gained interest as an alternative approach to obtaining more precise and comprehensive sensory analysis results. While electronic sensory evaluation provides valuable insights into product quality, it does not directly reflect consumer hedonic responses but is an indirect indicator [36]. Katsikari et al. [131] introduced an innovative approach integrating fused electronic sensory analysis with artificial neural networks to predict sensory hedonic ratings for fruit juices. Using quantitative descriptive analysis (QDA) and a scoring test method for human sensory evaluation, this approach suggests the potential of combining electronic sensory technologies to mimic human perception. This advancement paves the way for developing devices capable of evaluating multiple sensory attributes simultaneously. Artificial intelligence is transforming sensory and consumer science by analyzing complex datasets, bridging the gap between instrumental and human evaluation, and increasing the efficiency of food research [42].

6.1. Holistic Approaches and Food Marketing

The current food market is highly saturated in almost all categories, leading to increased competition among producers. This competitive environment continuously requires new product development [154]. Strategic marketing, including new business creation, is essential to promoting product innovation, attracting consumer interest, and driving purchases. However, in the food industry, between 50% and 67% of product launches fail [155]. Given the saturation of the market and the wide variety of products available, food manufacturers face significant challenges in achieving commercial success. To overcome these challenges, food marketers must identify the key product attributes that contribute to either market success or failure.
Retail consumers make quick purchase decisions based on extrinsic product attributes such as brand, packaging, labeling, price, and expected intrinsic qualities, such as taste. When buying a food product for the first time, consumers lack direct sensory information and must rely on these extrinsic attributes to make decisions. Recent studies in marketing and economics literature indicate that consumers often form judgments based on heuristic assessments of the product’s extrinsic attributes without considering its intrinsic sensory properties [156].
Once consumers purchase and experience a product, they have direct access to sensory information, eliminating the need to infer taste from heuristic cues [157]. Previous research has shown that taste judgments are primarily based on actual sensory experiences with intrinsic attributes rather than expectations based on extrinsic attributes [158]. Although some studies suggest that extrinsic cues may influence actual taste experiences [159], most research has traditionally examined intrinsic and extrinsic food attributes separately. Thus, recent research has increasingly focused on integrating sensory and consumer studies to develop a more comprehensive understanding of consumer behavior and product evaluation. This holistic approach considers intrinsic and extrinsic product attributes and their effects on consumer decision-making.
A systematic review by [160] emphasizes the importance of intrinsic attributes, such as taste, and extrinsic attributes, such as labeling and price, in consumer decision-making. However, existing research also reveals a lack of focus on other sensory attributes, including appearance, smell, and texture. This oversight calls for more comprehensive study designs to avoid reaching misleading conclusions. Additionally, Giboreau [161] suggests that integrating culinary expertise with sensory science could enhance methodological approaches and better understand consumer perceptions and preferences in real-life situations.
Table 2 summarizes holistic sensory approaches and their application in food marketing based on some of the referenced articles.
Table 2 shows that holistic sensory approaches to food marketing integrate sensory experiences to enhance consumer engagement and product differentiation. These strategies include sensory marketing, cross-modal correspondences, and sensory quality signals to create memorable and emotionally resonant consumer experiences.

6.2. Holistic Frameworks and Methodologies for Wine and Food Sensory Evaluation

A holistic framework has been developed to understand consumer experiences in retail environments, emphasizing the interaction between physical and sensory triggers and subjective evaluations. This framework includes both physical and psychological comfort and product assessment, highlighting the role of comfort and sensory attributes in shaping the shopping experience [152]. In addition, a new three-part holistic sensory evaluation method for textiles and apparel has been proposed, focusing on a full range of sensory attributes to assess consumer perceptions of novel materials [168].
While various examples highlight different food products, wine has predominantly been the research focus. Consequently, much of the literature available pertains to wine. However, the techniques and methods discussed apply to various food products, demonstrating their versatility.
In wine sensory evaluation, holistic frameworks integrate sensory and cognitive factors to better understand wine preferences and quality judgments. These frameworks consider the complex interplay between sensory attributes, consumer preferences, and expert evaluations to provide a comprehensive understanding of wine quality.
Several sensory evaluation techniques, such as correspondence analysis (CA), can be used, which is particularly effective for analyzing wine sensory data. This method handles categorical and non-parametric data, helping to identify wines based on their aromatic characteristics and providing a solid basis for sensory evaluation [169]. Techniques like Napping and Flash Profile are used to assess sensory differences efficiently. Napping involves a holistic assessment, while Flash Profile focuses on attribute evaluation, making both methods effective in highlighting qualitative and quantitative differences in wines [170,171].
Table 3 summarizes different holistic food and wine sensory evaluation approaches, briefly describing each method and key insights.
Recent advances in neuroscience suggest that olfaction’s synthetic and emotional aspects should be considered in wine-tasting methods. Integrating these elements may improve our understanding of how the brain processes flavor perceptions [173]. Using E-nose and E-tongue represents a holistic approach inspired by mammalian sensory perception. These technologies are being developed for quality control and fraud detection in the wine industry [172].
The sensory experience involves all five senses and is critical in wine education. This approach is essential for developing a comprehensive understanding of wine’s sensory properties and enhancing consumer engagement [176].

7. Conclusions

Integrating cutting-edge digital technologies such as virtual reality, augmented reality, artificial intelligence, and sensory evaluation tools like electronic noses, tongues, and eyes has transformed sensory food research and product development in the food and beverage industry. These technologies offer a more accurate, efficient, and objective way to understand and predict consumer sensory preferences, overcoming the limitations of traditional sensory panels. Incorporating physiological and emotional responses provides valuable insights into how consumers perceive food, ultimately improving product quality, consumer satisfaction, and marketing strategies.
Technologies like eye tracking and FaceReader have proven instrumental in capturing visual attention and emotional responses, providing a holistic view of consumer behavior. This more profound understanding of how visual cues and emotional engagement influence product evaluation can guide the development of packaging, advertising, and product innovation. Moreover, the rise of holistic frameworks in consumer behavior research has highlighted the need to consider various physical, social, and cultural factors when designing marketing strategies and food products. The adoption of these technologies varies between small and medium-sized enterprises and larger organizations due to differences in resources and operational constraints. In food science, using facial recognition for emotional analysis—such as assessing consumer reactions to different foods—requires careful management of consumer consent to ensure ethical and legal compliance.
As these technologies continue to advance, they are expected to personalize the food experience further and improve quality assessment across the food industry. Artificial intelligence mimics human behavior and accelerates research and problem-solving in sensory science. It enhances business strategies, reduces costs, and improves food quality assessments through precise, non-destructive testing technologies. By integrating digital innovation with consumer-centric approaches, companies can better align their products with consumer preferences and increase their chances of success in a competitive marketplace. This data-driven approach to food research fosters continuous innovation and enables the creation of products that resonate with consumers. A key application of artificial intelligence in food innovation is personalized nutrition—artificial intelligence tailors dietary recommendations using genetic data to improve health and prevent disease. Research highlights the role of artificial intelligence in recipe analysis, diet planning, and chronic disease management through machine learning, demonstrating its potential to revolutionize nutrition solutions.

Funding

This research was funded by the Chemistry Research Centre-Vila Real (CQ-VR) (UIDB/00616/2020 and UIDP/00616/2020). (https://doi.org/10.54499/UIDP/00616/2020 and https://doi.org/10.54499/UIDB/00616/2020).

Acknowledgments

The authors acknowledge the financial support provided by the CQ-VR.

Conflicts of Interest

The authors declare no conflicts of interest.

References

  1. Dumitru, L.M.; Irimia-Vladu, M.; Sariciftci, N.S. Biocompatible Integration of Electronics into Food Sensors. In Comprehensive Analytical Chemistry; Elsevier: Amsterdam, The Netherlands, 2016; Volume 74, pp. 247–271. [Google Scholar] [CrossRef]
  2. Méndez Pérez, R.; Cheein, F.A.; Rosell-Polo, J.R. Flexible system of multiple RGB-D sensors for measuring and classifying fruits in agri-food Industry. Comput. Electron. Agric. 2017, 139, 231–242. [Google Scholar] [CrossRef]
  3. Fuentes, S.; Viejo, C.; Torrico, D.; Dunshea, F. Digital Integration and Automated Assessment of Eye-Tracking and Emotional Response Data Using the BioSensory App to Maximize Packaging Label Analysis. Sensors 2021, 21, 7641. [Google Scholar] [CrossRef] [PubMed]
  4. Lichters, M.; Möslein, R.; Sarstedt, M.; Scharf, A. Segmenting consumers based on sensory acceptance tests in sensory labs, immersive environments, and natural consumption settings. Food Qual. Prefer. 2021, 89, 104138. [Google Scholar] [CrossRef]
  5. Torrico, D.D.; Mehta, A.; Borssato, A.B. New methods to assess sensory responses: A brief review of innovative techniques in sensory evaluation. Curr. Opin. Food Sci. 2023, 49, 100978. [Google Scholar] [CrossRef]
  6. Wang, J.; Wang, J.; Qiao, L.; Zhang, N.; Sun, B.; Li, H.; Sun, J.; Chen, H. From Traditional to Intelligent, A Review of Application and Progress of Sensory Analysis in Alcoholic Beverage Industry. Food Chem. 2024, 23, 101542. [Google Scholar] [CrossRef]
  7. Gere, A.; Zulkarnain, A.H.; Szakál, D.; Fehér, O.; Kókai, Z. Virtual reality applications in food science. Current knowledge and prospects. Prog. Agric. Eng. Sci. 2021, 17, 3–14. [Google Scholar] [CrossRef]
  8. Ares, G. Special issue on “Virtual reality and food: Applications in sensory and consumer science”. Food Res. Int. 2019, 117, 1. [Google Scholar] [CrossRef]
  9. Xu, C.; Demir-Kaymaz, Y.; Hartmann, C.; Menozzi, M.; Siegrist, M. The comparability of consumers’ behavior in virtual reality and real life: A validation study of virtual reality based on a ranking task. Food Qual. Prefer. 2021, 87, 104071. [Google Scholar] [CrossRef]
  10. Gonzalez Viejo, C.; Fuentes, S.; Torrico, D.D.; Dunshea, F.R. Non-Contact Heart Rate and Blood Pressure Estimations from Video Analysis and Machine Learning Modelling Applied to Food Sensory Responses: A Case Study for Chocolate. Sensors 2018, 18, 1802. [Google Scholar] [CrossRef]
  11. Torrico, D.D.; Fuentes, S.; Viejo, C.G.; Ashman, H.; Gunaratne, N.M.; Gunaratne, T.M.; Dunshea, F.R. Images and chocolate stimuli affect physiological and affective responses of consumers: A cross-cultural study. Food Qual. Prefer. 2018, 65, 60–71. [Google Scholar] [CrossRef]
  12. Milgram, P.; Kishino, F. A taxonomy of mixed reality visual displays. IEICE Trans. Inf. Syst. 1994, 77, 1321–1329. [Google Scholar]
  13. Zulkarnain, A.H.B.; Gere, A. Virtual reality sensory analysis approaches for sustainable food production. Appl. Food Res. 2025, 5, 100780. [Google Scholar] [CrossRef]
  14. Stelick, A.; Penano, A.G.; Riak, A.C.; Dando, R. Dynamic context sensory testing–A proof of concept study bringing virtual reality to the sensory booth. J. Food Sci. 2018, 83, 2047–2051. [Google Scholar] [CrossRef]
  15. Low, J.Y.Q.; Lin, V.H.F.; Jun Yeon, L.; Hort, J. Considering the application of a mixed reality context and consumer segmentation when evaluating emotional response to tea break snacks. Food Qual. Prefer. 2021, 88, 104113. [Google Scholar] [CrossRef]
  16. Kong, Y.; Sharma, C.; Kanala, M.; Thakur, M.; Li, L.; Xu, D.; Harrison, R.; Torrico, D. Virtual reality and immersive environments on sensory perception of chocolate products: A preliminary study. Foods 2020, 9, 515. [Google Scholar] [CrossRef] [PubMed]
  17. Torrico, D.D.; Han, Y.; Sharma, C.; Fuentes, S.; Gonzalez Viejo, C.; Dunshea, F.R. Effects of context and virtual reality environments on the wine tasting experience, acceptability, and emotional responses of consumers. Foods 2020, 9, 191. [Google Scholar] [CrossRef]
  18. Huang, F.; Huang, J.; Wan, X. Influence of virtual color on taste: Multisensory integration between virtual and real worlds. Comput. Hum. Behav. 2019, 95, 168–174. [Google Scholar] [CrossRef]
  19. Ammann, J.; Stucki, M.; Siegrist, M. True colours: Advantages and challenges of virtual reality in a sensory science experiment on the influence of colour on flavour identification. Food Qual Prefer. 2020, 86, 103998. [Google Scholar] [CrossRef]
  20. Liu, R.; Hannum, M.; Simons, C.T. Using immersive technologies to explore the effects of congruent and incongruent contextual cues on context recall, product evaluation time, and preference and liking during consumer hedonic testing. Food Res. Int. 2019, 117, 19–29. [Google Scholar] [CrossRef]
  21. de Wijk, D.; Polet, C.; Holthuysen, E.; van der Laan, J. Virtual Reality: Applications in Sensory and Consumer Science. Foods 2021, 10, 1154. [Google Scholar] [CrossRef]
  22. Chylinski, M.; Heller, J.; Hilken, T.; Keeling, D.I.; Mahr, D.; de Ruyter, K. Augmented reality marketing: A technology-enabled approach to situated customer experience. Australas. Mark. J. 2020, 28, 374–384. [Google Scholar] [CrossRef]
  23. Crofton, E.; Botinestean, C. Using virtual reality as a context-enhancing technology in sensory science. Digit. Sens. Sci. 2023, 213–228. [Google Scholar] [CrossRef]
  24. Crofton, E.C.; Botinestean, C.; Fenelon, M.; Gallagher, E. Potential Applications for Virtual and Augmented Reality technologies in Sensory Science. Innov. Food Sci. Emerg. Technol. 2019, 56, 102178. [Google Scholar] [CrossRef]
  25. Taufik, D.; Marvin, C.K.; Onwezen, M. C Changing consumer behaviour in virtual reality: A systematic literature review. Comput. Hum. Behav. Rep. 2021, 3, 100093. [Google Scholar] [CrossRef]
  26. Zulkarnain, A.H.B.; Moskowitz, H.R.; Kókai, Z.; Gere, A. Enhancing consumer sensory science approach through augmented virtuality. Curr. Res. Food Sci. 2024, 9, 100834. [Google Scholar] [CrossRef]
  27. Taboada, I.; Daneshpajouh, A.; Toledo, N.; de Vass, T. Artificial Intelligence Enabled Project Management: A Systematic Literature Review. Appl. Sci. 2023, 13, 5014. [Google Scholar] [CrossRef]
  28. Akbari, M.; Vilela, A.; Barroso, J.; Rocha, T. Modeling an Integrated Oenology Laboratory in Blender; v3_AV; University of Trás-os-Montes e Alto Douro: Vila Real, Portugal, 2023. [Google Scholar]
  29. Zatsu, V.; Shine, A.E.; Tharakan, J.M.; Peter, D.; Ranganathan, T.V.; Alotaibi, S.S.; Mugabi, R.; Muhsinah, A.B.; Waseem, M.; Nayik, G.A. Revolutionizing the food industry: The transformative power of artificial intelligence-a review. Food Chem X. 2024, 24, 101867. [Google Scholar] [CrossRef]
  30. Zou, W.; Pan, F.; Yi, J.; Peng, W.; Tian, W.; Zhou, L. Targeted prediction of sensory preference for fermented pomegranate juice based on machine learning. LWT 2024, 201, 116260. [Google Scholar] [CrossRef]
  31. Carvalho, N.; Minim, V.P.R.; Silva, R.C.S.N.; Lucia, S.M.D.; Minim, L. Artificial Neural Networks (ANN): Prediction of sensory measurements from instrumental data. Food Sci. Technol. 2023, 33, 722–729. [Google Scholar] [CrossRef]
  32. Yang, H.; Wang, Y.; Zhao, J.; Li, P.; Li, L.; Wang, F. A machine learning method for juice human sensory hedonic prediction using electronic sensory features. Curr. Res. Food Sci. 2023, 7, 100576. [Google Scholar] [CrossRef]
  33. Shibata, A.; Ikegami, A.; Nakauma, M.; Higashimori, M. Convolutional Neural Network based Estimation of Gel-like Food Texture by a Robotic Sensing System. Robotics 2017, 6, 37. [Google Scholar] [CrossRef]
  34. Pietro Cavallo, D.; Cefola, M.; Pace, B.; Logrieco, A.F.; Attolico, G. Non-destructive automatic quality evaluation of fresh-cut iceberg lettuce through packaging material. J. Food Eng. 2018, 223, 46–52. [Google Scholar] [CrossRef]
  35. Natsume, H.; Okamoto, S. Prediction of Temporal Liking from Temporal Dominance of Sensations by Using Reservoir Computing and Its Sensitivity Analysis. Foods 2024, 13, 3755. [Google Scholar] [CrossRef] [PubMed]
  36. Bi, K.; Qiu, T.; Huang, Y. A deep learning method for yogurt preferences prediction using sensory attributes. Processes 2020, 8, 518. [Google Scholar] [CrossRef]
  37. Bi, K.; Zhang, S.; Zhang, C. Consumer-oriented sensory optimization of yogurt: An artificial intelligence approach. Food Control 2022, 138, 108995. [Google Scholar] [CrossRef]
  38. Mahesh, B. Machine learning algorithms—A review. Int. J. Sci. Res. 2020, 9, 381–386. [Google Scholar] [CrossRef]
  39. Jiménez-Carvelo, A.M.; González-Casado, A.; Bagur-González, M.G.; Cuadros-Rodríguez, L. Alternative data mining/machine learning methods for the analytical evaluation of food quality and authenticity—A review. Food Res. Int. 2019, 122, 25–39. [Google Scholar] [CrossRef]
  40. Dębska, B.; Guzowska-Świder, B. Decision trees in selection of featured determined food quality. Anal. Chim. Acta 2011, 705, 261–271. [Google Scholar] [CrossRef]
  41. Kotsiantis, S.B. Decision trees: A recent overview. Artif. Intell. Rev. 2013, 39, 261–283. [Google Scholar] [CrossRef]
  42. Chen, H.; Wang, X.; Zhang, L. Neural Networks for Sensory Analysis: Applications in Food Chemistry. Sensors 2020, 20, 485. [Google Scholar] [CrossRef]
  43. Nunes, C.A.; Ribeiro, M.N.; de Carvalho, T.C.; Ferreira, D.D.; de Oliveira, L.L.; Pinheiro, A.C. Artificial intelligence in sensory and consumer studies of food products. Curr. Opin. Food Sci. 2023, 50, 101002. [Google Scholar] [CrossRef]
  44. Dhal, S.B.; Kar, D. Leveraging artificial intelligence and advanced food processing techniques for enhanced food safety, quality, and security: A comprehensive review. Discov. Appl. Sci. 2025, 7, 75. [Google Scholar] [CrossRef]
  45. Tawakuli, A.; Engel, T. Make your data fair: A survey of data preprocessing techniques that address biases in data towards fair AI. J. Eng. Res. 2024, in press. [CrossRef]
  46. Hooker, S. Moving beyond “algorithmic bias is a data problem”. Patterns 2021, 2, 100241. [Google Scholar] [CrossRef]
  47. Chen, P.; Wu, L.; Wang, L. AI Fairness in Data Management and Analytics: A Review on Challenges, Methodologies and Applications. Appl. Sci. 2023, 13, 10258. [Google Scholar] [CrossRef]
  48. Tseng, Y.J.; Chuang, P.J.; Appell, M. When machine learning and deep learning come to the big data in food chemistry. ACS Omega 2023, 8, 15854–15864. [Google Scholar] [CrossRef] [PubMed]
  49. Ji, H.; Pu, D.; Yan, W.; Zhang, Q.; Zuo, M.; Yuyu, Z. Recent advances and application of machine learning in food flavor prediction and regulation. Trends Food Sci. 2023, 138, 738–751. [Google Scholar] [CrossRef]
  50. Kou, X.; Shi, P.; Gao, C.; Ma, P.; Xing, H.; Ke, Q.; Zhang, D. Data-driven elucidation of flavor chemistry. J. Agric. Food Chem. 2023, 71, 6789–6802. [Google Scholar] [CrossRef]
  51. Colantonio, V.; Ferrão, L.F.V.; Tieman, D.M.; Bliznyuk, N.; Sims, C.; Klee, H.J.; Resende, M.F., Jr. Metabolomic selection for enhanced fruit flavor. Proc. Natl. Acad. Sci. USA 2022, 119, e2115865119. [Google Scholar] [CrossRef]
  52. Hastie, M.; Torrico, D.; Li, Z.; Ha, M.; Warner, R. Consumer characterization of wet-and dry-aged mutton flavor profile using check-all-that-apply. Foods 2022, 11, 3167. [Google Scholar] [CrossRef]
  53. Goyache, F.; Bahamonde, A.; Alonso, J.; López, S.; Del Coz, J.J.; Quevedo, J.R.; Luaces, O.; Alvarez, I.; Royo, L.J.; Diez, J.; et al. The usefulness of artificial intelligence techniques to assess subjective quality of products in the food industry. Trends Food Sci. 2001, 12, 370–381. [Google Scholar] [CrossRef]
  54. Lakeh, M.A. Reporting the Work Plan Activities; Final Report; University of Trás-os-Montes e Alto Douro: Vila Real, Portugal, 2023. [Google Scholar]
  55. Orlandi, G.; Calvini, R.; Foca, G.; Pigani, L.; Vasile Simone, G.; Ulrici, A. Data fusion of electronic eye and electronic tongue signals to monitor grape ripening. Talanta 2019, 195, 181–189. [Google Scholar] [CrossRef] [PubMed]
  56. Tan, J.; Xu, J. Applications of electronic nose (e-nose) and electronic tongue (e-tongue) in food quality-related properties determination: A review. Artif. Intell. Agric. 2020, 4, 104–115. [Google Scholar] [CrossRef]
  57. Shooshtari, M.; Salehi, A. An electronic nose based on carbon nanotube -titanium dioxide hybrid nanostructures for detection and discrimination of volatile organic compounds. Sens. Actuators B Chem. 2022, 357, 131418. [Google Scholar] [CrossRef]
  58. Ciosek, P.; Wróblewski, W. Sensor arrays for liquid sensing—Electronic tongue systems. Analyst 2007, 132, 963–978. [Google Scholar] [CrossRef]
  59. Del Valle, M. Sensor Arrays and Electronic Tongue Systems. Int. J. Electrochem. 2012, 2012, 986025. [Google Scholar] [CrossRef]
  60. Podrażka, M.; Bączyńska, E.; Kundys, M.; Jeleń, P.S.; Witkowska Nery, E. Electronic Tongue—A Tool for All Tastes? Biosensors 2018, 8, 3. [Google Scholar] [CrossRef]
  61. Kuswandi, B.; Siddiqui, M.W. Sensor-Based Quality Assessment Systems for Fruits and Vegetables; Apple Academic Press: Cambridge, MA, USA, 2020. [Google Scholar]
  62. Schlossareck, C.; Ross, C.F. Electronic tongue and consumer sensory evaluation of spicy paneer cheese. J. Food Sci. 2019, 84, 1563–1569. [Google Scholar] [CrossRef]
  63. Gonzalez Viejo, C.; Fuentes, S.; Godbole, A.; Widdicombe, B.; Unnithan, R.R. Development of a low-cost E-nose to assess aroma profiles: An artificial intelligence application to assess beer quality. Sens. Actuators B Chem. 2020, 308, 127688. [Google Scholar] [CrossRef]
  64. Jiarpinijnun, A.; Osako, K.; Siripatrawan, U. Visualization of Volatomic Profiles for Early Detection of Fungal Infection on Storage Jasmine Brown Rice Using Electronic Nose Coupled with Chemometrics. Meas. J. Int. Meas. Confed. 2020, 157, 107561. [Google Scholar] [CrossRef]
  65. Shi, H.; Zhang, M.; Adhikari, B. Advances of electronic nose and its application in fresh foods: A review. Crit. Rev. Food Sci. Nutr. 2018, 58, 2700–2710. [Google Scholar] [CrossRef]
  66. Aouadi, B.; Zaukuu, J.-L.Z.; Vitális, F.; Bodor, Z.; Fehér, O.; Gillay, Z.; Bazar, G.; Kovacs, Z. Historical Evolution and Food Control Achievements of Near Infrared Spectroscopy, Electronic Nose, and Electronic Tongue—Critical Overview. Sensors 2020, 20, 5479. [Google Scholar] [CrossRef] [PubMed]
  67. Cipriano, D.; Capelli, L. Evolution of electronic noses from research objects to engineered environmental odour monitoring systems: A review of standardization approaches. Biosensors 2019, 9, 75. [Google Scholar] [CrossRef]
  68. Wei, Z.; Xiao, X.; Wang, J. Identification of the rice wines with different marked ages by electronic nose coupled with smartphone and cloud storage platform. Sensors 2017, 17, 2500. [Google Scholar] [CrossRef] [PubMed]
  69. Deshmukh, S.; Bandyopadhyay, R.; Bhattacharyya, N.; Pandey, R.A.; Jana, A. Application of electronic nose for industrial odors and gaseous emissions measurement and monitoring—An overview. Talanta 2015, 144, 329–340. [Google Scholar] [CrossRef] [PubMed]
  70. Štefániková, J.; Martišová, P.; Árvay, J.; Jankura, E.; Kačániová, M.; Gálová, J.; Vietoris, V. Comparison of electronic systems with sensory analysis for the quality evaluation of parenica cheese. Czech J. Food Sci. 2020, 38, 273–279. [Google Scholar] [CrossRef]
  71. Romani, S.; Rodriguez-Estrada, M. Bakery Products and Electronic Nose. In Electronic Noses and Tongues in Food Science; Elsevier Inc.: Amsterdam, The Netherlands, 2016; pp. 39–47. [Google Scholar] [CrossRef]
  72. Rusinek, R.; Gancarz, M.; Nawrocka, A. Application of an electronic nose with novel method for generation of smellprints for testing the suitability for consumption of wheat bread during 4-day storage. LWT 2020, 117, 108665. [Google Scholar] [CrossRef]
  73. Gonzalez Viejo, C.; Fuentes, S. Low-cost methods to assess beer quality using artificial intelligence involving robotics, an electronic nose, and machine learning. Fermentation 2020, 6, 104. [Google Scholar] [CrossRef]
  74. Fuentes, S.; Summerson, V.; Gonzalez Viejo, C.; Tongson, E.; Lipovetzky, N.; Wilkinson, K.L.; Szeto, C.; Unnithan, R.R. Assessment of smoke contamination in grapevine berries and taint in wines due to bushfires using a low-cost E-nose and an artificial intelligence approach. Sensors 2020, 20, 5108. [Google Scholar] [CrossRef]
  75. Nomura, M.; Osada, E.; Tokita, T.; Iwamoto, T.; Manome, Y. Measurement and differentiation of banana juice scent using an electronic nose FF-2A. PeerJ 2021, 9, e10638. [Google Scholar] [CrossRef]
  76. Farahmand, E.; Razavi, S.H.; Mohtasebi, S.S. Investigating effective variables to produce desirable aroma in sourdough using enose and sensory panel. J. Food Process Preserv. 2021, 45, e15157. [Google Scholar] [CrossRef]
  77. Hübert, T.; Tiebe, C.; Banach, U. Electronic Noses for the Quality Control of Spices. In Electronic Noses and Tongues in Food Science; Elsevier Inc.: Amsterdam, The Netherlands, 2016; pp. 115–124. [Google Scholar] [CrossRef]
  78. Radi, M.; Rivai, M.; Purnomo, M. Study on electronic-nose-based quality monitoring system for coffee under roasting. J. Circuits Syst. Comput. 2016, 25, 1650116. [Google Scholar] [CrossRef]
  79. Di Rosa, A.R.; Leone, F.; Cheli, F.; Chiofalo, V. Fusion of electronic nose, electronic tongue and computer vision for animal source food authentication and quality assessment—A review. J. Food Eng. 2017, 210, 62–75. [Google Scholar] [CrossRef]
  80. Geană, E.I.; Ciucure, C.T.; Apetrei, C. Electrochemical sensors coupled with multivariate statistical analysis as screening tools for wine authentication issues: A review. Chemosensors 2020, 8, 59. [Google Scholar] [CrossRef]
  81. Calvini, R.; Pigani, L. Toward the Development of Combined Artificial Sensing Systems for Food Quality Evaluation: A Review on the Application of Data Fusion of Electronic Noses, Electronic Tongues and Electronic Eyes. Sensors 2022, 22, 577. [Google Scholar] [CrossRef]
  82. Wang, W.; Liu, Y. Electronic tongue for food sensory evaluation. In Evaluation Technologies for Food Quality; Elsevier Inc.: Amsterdam, The Netherlands, 2019; pp. 23–36. [Google Scholar]
  83. Nam, S.H.; Lee, J.; Kim, E.; Koo, J.W.; Shin, Y.; Hwang, T.M. Electronic tongue for the simple and rapid determination of taste and odor compounds in water. Chemosphere 2023, 338, 139511. [Google Scholar] [CrossRef] [PubMed]
  84. Vagin, M.Y.; Eriksson, M.; Winquist, F. Drinking Water Analysis Using Electronic Tongues. In Electronic Noses and Tongues in Food Science; Elsevier Inc.: Amsterdam, The Netherlands, 2016; pp. 255–264. [Google Scholar]
  85. Del Valle, M. Bioelectronic tongues employing electrochemical biosensors. Bioanal. Rev. 2017, 6, 143–202. [Google Scholar]
  86. Winquist, F.; Holmin, S.; Krantz-Rülcker, C.; Wide, P.; Lundström, I. A hybrid electronic tongue. Anal. Chim. Acta 2000, 406, 147–157. [Google Scholar] [CrossRef]
  87. Zeravik, J.; Hlavacek, A.; Lacina, K.; Skladal, P. State of the art in the field of electronic and bioelectronic tongues—Towards the analysis of wines. Electroanalysis 2009, 21, 2503–2520. [Google Scholar] [CrossRef]
  88. Nuñez, L.; Cetó, X.; Pividori, M.I.; Zanoni, M.V.B.; del Valle, M. Development and application of an electronic tongue for detection and monitoring of nitrate, nitrite and ammonium levels in waters. Microchem. J. 2013, 110, 273–279. [Google Scholar] [CrossRef]
  89. Kutyła-Olesiuk, A.; Zaborowski, M.; Prokaryn, P.; Ciosek, P. Monitoring of beer fermentation based on hybrid electronic tongue. Bioelectrochemistry 2012, 87, 104–113. [Google Scholar] [CrossRef]
  90. Gutiérrez, M.; Llobera, A.; Vila-Planas, J.; Capdevila, F.; Demming, S.; Büttgenbach, S.; Mínguez, S.; Jiménez-Jorquera, C. Hybrid electronic tongue based on optical and electrochemical microsensors for quality control of wine. Analyst 2010, 135, 1718–1725. [Google Scholar] [CrossRef] [PubMed]
  91. Kutyla-Olesluk, A.; Wesoly, M.; Wróblewaki, W. Hybrid Electronic Tongue as a Tool for the Monitoring of Wine Fermentation and Storage Process. Electroanalysis 2018, 30, 1983–1989. [Google Scholar] [CrossRef]
  92. Breijo, E.G.; Pinatti, C.O.; Peris, R.M.; Fillol, M.A.; Martínez-Máñez, R.; Camino, J.S. TNT detection using a voltammetric electronic tongue based on neural networks. Sens. Actuators A Phys. 2013, 192, 1–8. [Google Scholar] [CrossRef]
  93. Vlasov, Y.; Legin, A. Non-selective chemical sensors in analytical chemistry: From “electronic nose” to “electronic tongue”. Fresenius J. Anal. Chem. 1998, 361, 255–260. [Google Scholar] [CrossRef]
  94. Tian, X.; Wang, J.; Zhang, X. Discrimination of preserved licorice apricot using electronic tongue. Math. Comput. Model. 2013, 58, 737–745. [Google Scholar] [CrossRef]
  95. Dong, W.; Zhao, J.; Hu, R.; Dong, Y.; Tan, L. Differentiation of Chinese robusta coffees according to species, using a combined electronic nose and tongue, with the aid of chemometrics. Food Chem. 2017, 229, 743–751. [Google Scholar] [CrossRef]
  96. He, W.; Hu, X.; Zhao, L.; Liao, X.; Zhang, Y.; Zhang, M.; Wu, J. Evaluation of Chinese tea by the electronic tongue: Correlation with sensory properties and classification according to geographical origin and grade level. Food Res. Int. 2009, 42, 1462–1467. [Google Scholar] [CrossRef]
  97. Xu, S.; Li, J.; Baldwin, E.A.; Plotto, A.; Rosskopf, E.; Hong, J.C.; Bai, J. Electronic tongue discrimination of four tomato cultivars harvested at six maturities and exposed to blanching and refrigeration treatments. Postharvest Biol. Technol. 2018, 136, 42–49. [Google Scholar] [CrossRef]
  98. Beullens, K.; Mészáros, P.; Vermeir, S.; Kirsanov, D.; Legin, A.; Buysens, S.; Cap, N.; Nicolaï, B.M.; Lammertyn, J. Analysis of tomato taste using two types of electronic tongues. Sens. Actuators B Chem. 2008, 131, 10–17. [Google Scholar] [CrossRef]
  99. Jung, H.Y.; Kwak, H.S.; Kim, M.J.; Kim, Y.; Kim, K.-O.; Kim, S.S. Comparison of a descriptive analysis and instrumental measurements (electronic nose and electronic tongue) for the sensory profiling of Korean fermented soybean paste (doenjang). J. Sens. Stud. 2017, 32, e12282. [Google Scholar] [CrossRef]
  100. Yan, S.; Ping, C.; Weijun, C.; Haiming, C. Monitoring the Quality Change of Fresh Coconut Milk Using an Electronic Tongue. J. Food Process. Preserv. 2016, 41, e13110. [Google Scholar] [CrossRef]
  101. Jambrak, A.R.; Šimunek, M.; Petrović, M.; Bedić, H.; Herceg, Z.; Juretić, H. Aromatic profile and sensory characterisation of ultrasound treated cranberry juice and nectar. Ultrason. Sonochem. 2017, 38, 783–793. [Google Scholar] [CrossRef] [PubMed]
  102. Paup, V.D.; Barnett, S.M.; Diako, C.; Ross, C.F. Detection of spicy compounds using the electronic tongue. J. Food Sci. 2019, 84, 2619–2627. [Google Scholar] [CrossRef]
  103. Nery, E.W.; Kubota, L.T. Integrated, paper-based potentiometric electronic tongue for the analysis of beer and wine. Anal. Chim. Acta 2016, 918, 60–68. [Google Scholar] [CrossRef]
  104. Daikuzono, C.M.; Delaney, C.; Morrin, A.; Diamond, D.; Florea, L.; Oliveira, O.N. Paper based electronic tongue–a low-cost solution for the distinction of sugar type and apple juice brand. Analyst 2019, 144, 2827–2832. [Google Scholar] [CrossRef]
  105. Rodríguez-Méndez, M.L. Electronic Noses and Tongues in Food Industry; Academic Press: London, UK, 2016. [Google Scholar]
  106. Litvinenko, S.V.; Bielobrov, D.; Lysenko, V.; Nychyporuk, T.; Skryshevsky, V.A. Might silicon surface be used for electronic tongue application? ACS Appl. Mater. Interfaces 2015, 6, 18440–18444. [Google Scholar] [CrossRef]
  107. McCaig, T.N. Extending the use of visible/near-infrared reflectance spectrophotometers to measure colour of food and agricultural products. Food Res. Int. 2002, 35, 731–736. [Google Scholar] [CrossRef]
  108. Wu, D.; Sun, D.W. Colour measurements by computer vision for food quality control—A review. Trends Food Sci. Technol. 2013, 29, 5–20. [Google Scholar] [CrossRef]
  109. Cui, Y.X.; Liu, R.X.; Lin, Z.Z.; Chen, P.J.; Wang, L.L.; Wang, Y.L.; Chen, S.Q. Quality evaluation based on color grading: Quality discrimination of the Chinese medicine Corni Fructus by an E-eye. Sci. Rep. 2019, 9, 17006. [Google Scholar]
  110. Xu, C. Electronic eye for food sensory evaluation. In Evaluation Technologies for Food Quality; Elsevier Inc.: Amsterdam, The Netherlands, 2019; pp. 37–59. [Google Scholar]
  111. Ordoñez-Araque, R.; Rodríguez-Villacres, J.; Urresto-Villegas, J. Electronic nose, tongue and eye: Their usefulness for the food industry. Vitae 2022, 27, e1. [Google Scholar] [CrossRef]
  112. Ismael, D.; Ploeger, A. Development of a sensory method to detect food-elicited emotions using emotion-color association and eye-tracking. Foods 2019, 8, 217. [Google Scholar] [CrossRef] [PubMed]
  113. Yang, Y.; Zhao, C.; Tian, G. Characterization of physical properties and electronic sensory analyses of citrus oil-based nanoemulsions. Food Res. Int. 2018, 109, 149–158. [Google Scholar] [CrossRef] [PubMed]
  114. Fernández-Vázquez, R.; Stinco, C.M.; Melendez-Martínez, A.J.; Heredia, F.J.; Vicario, I.M. Visual and instrumental evaluation of orange juice color: A consumers’ preference study. J. Sens. Stud. 2011, 26, 436–444. [Google Scholar] [CrossRef]
  115. Martin, M.L.G.-M.; Wei, J.; Luo, R.; Hutchings, J.; Heredia, F.J. Measuring colour appearance of red wines. Food Qual. Prefer. 2007, 18, 862–871. [Google Scholar] [CrossRef]
  116. Sahameh, S.; Saeid, M.; Mahdi, M.-C.; Nasrollah, G.-V.; Mohsen, B. Potential application of machine vision to honey characterization. Trends Food Sci. Technol. 2013, 30, 174–177. [Google Scholar]
  117. Sreeraj, M.; Joy, J.; Kuriakose, A.; Sujith, M.R.; Vishnu, P.K.; Haritha, U. CLadron*: AI assisted device for identifying artificially ripened climacteric fruits. Procedia Comput. Sci. 2020, 171, 635–643. [Google Scholar] [CrossRef]
  118. Orlandi, G.; Calvini, R.; Pigani, L. Electronic eye for the prediction of parameters related to grape ripening. Talanta 2018, 186, 381–388. [Google Scholar] [CrossRef]
  119. Sun, X.; Young, J.; Liu, J.H.; Chen, Q.; Newman, D. Predicting pork color scores using computer vision and support vector machine technology. Meat Muscle Biol. 2018, 2, 296–302. [Google Scholar] [CrossRef]
  120. Marques, C.; Correia, E.; Dinis, L.-T.; Vilela, A. An Overview of Sensory Characterization Techniques: From Classical Descriptive Analysis to the Emergence of Novel Profiling Methods. Foods 2022, 11, 255. [Google Scholar] [CrossRef]
  121. Motoki, K.; Saito, T.; Onuma, T. Eye-tracking research on sensory and consumer science: A review, pitfalls and future directions. Food Res. Int. 2021, 145, 110389. [Google Scholar] [CrossRef] [PubMed]
  122. Gheorghe, C.M.; Purcărea, V.L.; Gheorghe, I.R. Using eye-tracking technology in Neuromarketing. Rom. J. Ophthalmol. 2023, 67, 2–6. [Google Scholar] [CrossRef]
  123. Graham, D.J.; Jeffery, R.W. Location, location, location: Eye-tracking evidence that consumers preferentially view prominently positioned nutrition information. J. Am. Diet. Assoc. 2011, 111, 1704–1711. [Google Scholar] [CrossRef] [PubMed]
  124. Ruppenthal, T. Eye-Tracking Studies on Sustainable Food Consumption: A Systematic Literature Review. Sustainability 2023, 15, 16434. [Google Scholar] [CrossRef]
  125. Peng, M.; Browne, H.; Cahayadi, J.; Cakmak, Y. Predicting food choices based on eye-tracking data: Comparisons between real-life and virtual tasks. Appetite 2021, 166, 105477. [Google Scholar] [CrossRef]
  126. Husić-Mehmedović, M.; Omeragić, I.; Batagelj, Z.; Kolar, T. Seeing is not necessarily liking: Advancing research on package design with eye-tracking. J. Bus. Res. 2017, 80, 145–154. [Google Scholar] [CrossRef]
  127. Gvoka, T.; Vladić, G.; Bošnjaković, G.; Pál, M.; Maričić, K. Identification of Gaze Patterns in the Observation of Font-Weight and Illustration Size on the Packaging Using Eye-Tracking Analysis. Int. Symp. Graph. Eng. Des. 2024, 57–67. [Google Scholar] [CrossRef]
  128. Gunaratne, N.M.; Fuentes, S.; Gunaratne, T.M.; Torrico, D.D.; Ashman, H.; Francis, C.; Gonzalez Viejo, C.; Dunshea, F.R. Consumer Acceptability, Eye Fixation, and Physiological Responses: A Study of Novel and Familiar Chocolate Packaging Designs Using Eye-Tracking Devices. Foods 2019, 8, 253. [Google Scholar] [CrossRef]
  129. Marques, C.; Vilela, A. FaceReader Insights into the Emotional Response of Douro Wines. Appl. Sci. 2024, 14, 10053. [Google Scholar] [CrossRef]
  130. Pichierri, M.; Peluso, A.M.; Pino, G.; Guido, G. Health claims’ text clarity, perceived healthiness of extra-virgin olive oil, and arousal: An experiment using FaceReader. Trends Food Sci. Technol. 2021, 116, 1186–1194. [Google Scholar] [CrossRef]
  131. Katsikari, A.; Pedersen, M.E.; Berget, I.; Varela, P. Use of face reading to measure oral processing behaviour and its relation to product perception. Food Qual. Prefer. 2024, 119, 105209. [Google Scholar] [CrossRef]
  132. Marques, C.; Dinis, L.T.; Modesti, M.; Bellincontro, A.; Correia, E.; Vilela, A. Exploring the influence of terroir on Douro white and red wines characteristics: A study of human perception and electronic analysis. Eur. Food Res. Technol. 2024, 250, 3011–3027. [Google Scholar] [CrossRef]
  133. Berčík, J.; Mravcová, A.; Nadal, E.S.; Lluch, D.B.L.; Farkaš, A. FaceReader as a neuromarketing tool to compare the olfactory preferences of customers in selected markets. Span. J. Mark.-ESIC. 2024. ahead-of-print. [Google Scholar] [CrossRef]
  134. Landmann, E. I can see how you feel—Methodological considerations and handling of Noldus’s FaceReader software for emotion measurement. Technol. Forecast. Soc. Chang. 2023, 197, 122889. [Google Scholar] [CrossRef]
  135. Fontana, L.; Albayay, J.; Zurlo, L.; Ciliberto, V.; Zampini, M. Olfactory modulation of visual attention and preference towards congruent food products: An eye tracking study. Food Qual. Pref. 2025, 124, 105373. [Google Scholar] [CrossRef]
  136. Gonzalez-Sanchez, J.; Baydogan, M.; Chavez-Echeagaray, M.E.; Atkinson, R.K.; Burleson, W. Chapter 11—Affect Measurement: A Roadmap Through Approaches, Technologies, and Data Analysis. In Emotions and Affect in Human Factors and Human-Computer Interaction; Jeon, M., Ed.; Academic Press: Cambridge, MA, USA, 2017; pp. 255–288. [Google Scholar] [CrossRef]
  137. Liu, X.; Cui, Y. Eye tracking technology for examining cognitive processes in education: A systematic review. Comput. Educ. 2025, 229, 105263. [Google Scholar] [CrossRef]
  138. Andrewes, P.; Bullock, S.; Turnbull, R.; Coolbear, T. Chemical instrumental analysis versus human evaluation to measure sensory properties of dairy products: What is fit for purpose? Int. Dairy. J. 2021, 121, 105098. [Google Scholar] [CrossRef]
  139. Chen, J. It is important to differentiate sensory property from the material property. Trend Food Sci. Technol. 2020, 96, 268–270. [Google Scholar] [CrossRef]
  140. Abbott, J. Quality measurement of fruits and vegetables. Post. Biol. Technol. 1999, 15, 207–225. [Google Scholar] [CrossRef]
  141. Nishinari, K.; Fang, Y. Perception and measurement of food texture: Solid foods. J. Text. Stud. 2018, 49, 160–201. [Google Scholar] [CrossRef]
  142. Harker, F.; Maindonald, J.; Murray, S.; Gunson, F.; Hallett, I.; Walker, S. Sensory interpretation of instrumental measurements 1: Texture of apple fruit. Post. Biol. Technol. 2002, 24, 225–239. [Google Scholar] [CrossRef]
  143. Tao, K.; Yu, W.; Prakash, S.; Gilbert, R. Investigating cooked rice textural properties by instrumental measurements. Food Sci. Hum. Wellness. 2020, 9, 130–135. [Google Scholar] [CrossRef]
  144. Ross, C. Sensory science at the human–machine interface. Trend Food Sci. Technol. 2009, 20, 63–72. [Google Scholar] [CrossRef]
  145. Salam, K.N.; Singkeruang, A.W.T.F.; Husni, M.F.; Baharuddin, B.; Ar, D.P. Gen-Z Marketing Strategies: Understanding Consumer Preferences and Building Sustainable Relationships. Gold. Ratio Mapp. Idea Lit. Format 2024, 4, 53–77. [Google Scholar] [CrossRef]
  146. Kalariya, K.; Chauhan, R.; Soni, P.; Patel, M.; Patel, H. Unraveling Millennial Online Shopping Preferences: A Comprehensive Analysis of Factors Influencing Consumer Behaviour in the Digital Marketplace. J. Bus. Halal Ind. 2024, 1, 1–12. [Google Scholar] [CrossRef]
  147. Haris, A. The Role of Marketing Research in Understanding Consumer Behavior and Preferences. Adv. Bus. Ind. Mark. Res. 2024, 2, 59–71. [Google Scholar] [CrossRef]
  148. Rusdian, S.; Sugiat, J.; Tojiri, Y. Understanding Consumer Behavior in Marketing Management: A Descriptive Study and Review of Literature. Gold. Ratio Mark. Appl. Psychol. Bus. 2024, 4, 76–87. [Google Scholar] [CrossRef]
  149. Utami, C.V.; Karunia, L.; Marwan, J. The Role of Marketing Strategy on Pricing and its Impact on Purchasing Interest. Moestopo Int. Rev. Soc. Humanit. Sci. 2024, 4, 206–217. [Google Scholar] [CrossRef]
  150. Theodorakopoulos, L.; Theodoropoulou, A. Leveraging Big Data Analytics for Understanding Consumer Behavior in Digital Marketing: A Systematic Review. Hum. Behav. Emerg. 2024, 2024, 3641502. [Google Scholar] [CrossRef]
  151. Kim, H.; Park, Y.; Bradlow, E.; Ding, M. PIE: A Holistic Preference Concept and Measurement Model. J. Mark. Res. 2013, 51, 335–351. [Google Scholar] [CrossRef]
  152. Dalmoro, M.; Isabella, G.; De Almeida, S.; Fleck, J. Developing a holistic understanding of consumers’ experiences. Eur. J. Mark. 2019, 53, 2054–2079. [Google Scholar] [CrossRef]
  153. Puengwattanapong, P.; Leelasantitham, A. A Holistic Perspective Model of Plenary Online Consumer Behaviors for Sustainable Guidelines of the Electronic Business Platforms. Sustainability 2022, 14, 6131. [Google Scholar] [CrossRef]
  154. Combris, P.; Bazoche, P.; Giraud-Héraud, E.; Issanchou, S. Food choices: What do we learn from combining sensory and economic experiments? Food Qual. Prefer. 2009, 20, 550–557. [Google Scholar] [CrossRef]
  155. Dijksterhuis, G. New product failure: Five potential sources discussed. Trends Food Sci. Technol. 2016, 50, 243–248. [Google Scholar] [CrossRef]
  156. Deng, X.; Srinivasan, R. When do transparent packages increase (or decrease) food consumption? J. Mark. 2013, 77, 104–117. [Google Scholar] [CrossRef]
  157. Mai, R.; Symmank, C.; Seeberg-Elverfeldt, B. Light and pale colors in food packaging: When does this package cue signal superior healthiness or inferior tastiness? J. Retail. 2016, 92, 426–444. [Google Scholar] [CrossRef]
  158. Hoegg, J.; Alba, J.W. Taste perception: More than meets the tongue. J. Consum. Res. 2007, 33, 490–498. [Google Scholar] [CrossRef]
  159. Naylor, R.W.; Droms, C.M.; Haws, K.L. Eating with a purpose: Consumer response to functional food health claims in conflicting versus complementary information environments. J. Public Policy Mark. 2009, 28, 221–233. [Google Scholar] [CrossRef]
  160. Symmank, C. Extrinsic and intrinsic food product attributes in consumer and sensory research: Literature review and quantification of the findings. Manag. Rev. Q. 2018, 69, 39–74. [Google Scholar] [CrossRef]
  161. Giboreau, A. Sensory and consumer research in culinary approaches to food. Curr. Opin. Food Sci. 2017, 15, 87–92. [Google Scholar] [CrossRef]
  162. Deb, P.; Maity, P. Unveiling the Senses: A Bibliometrics Analysis on the Role of Sensory Marketing in impacting Consumer Behaviour. Int. J. Sci. Res. Eng. Manag. 2024, 8, 1–16. [Google Scholar] [CrossRef]
  163. Spence, C. Managing sensory expectations concerning products and brands: Capitalizing on the potential of sound and shape symbolism. J. Consum. Psychol. 2012, 22, 37–54. [Google Scholar] [CrossRef]
  164. Jürkenbeck, K.; Spiller, A. Importance of sensory quality signals in consumers’ food choice. Food Qual. Pref. 2021, 90, 104155. [Google Scholar] [CrossRef]
  165. Trijp, H.; Schifferstein, H. Sensory Analysis in Marketing Practice: Comparison and Integration. J. Sens. Stud. 1995, 10, 127–147. [Google Scholar] [CrossRef]
  166. Iannario, M.; Manisera, M.; Piccolo, D.; Zuccolotto, P. Sensory analysis in the food industry as a tool for marketing decisions. Adv. Data Anal. Classif. 2012, 6, 303–321. [Google Scholar] [CrossRef]
  167. Alongi, M.; Anese, M. Re-thinking functional food development through a holistic approach. J. Funct. Foods. 2021, 81, 104466. [Google Scholar] [CrossRef]
  168. Ghalachyan, A.; Karpova, E.; Frattali, A. Developing a holistic sensory evaluation three-part method for textiles and apparel: A practical application for novel materials and products. Res. J. Text. 2023, 28, 948–964. [Google Scholar] [CrossRef]
  169. Magalios, P.; Kosmas, P.; Tsakiris, A.; Theocharous, A. Sensory evaluation of wine through correspondence analysis: A theoretical and empirical rationale. J. Wine Res. 2019, 30, 62–77. [Google Scholar] [CrossRef]
  170. Liu, J.; Grønbeck, M.; Monaco, R.; Giacalone, D.; Bredie, W. Performance of Flash Profile and Napping with and without training for describing small sensory differences in a model wine. Food Qual. Prefer. 2016, 48, 41–49. [Google Scholar] [CrossRef]
  171. Barton, A.; Hayward, L.; Richardson, C.; McSweeney, M. Use of different panelists (experienced, trained, consumers, and experts) and the projective mapping task to evaluate white wine. Food Qual. Pref. 2020, 83, 103900. [Google Scholar] [CrossRef]
  172. Rodriguez-Mendez, M.; De Saja, J.; González-Antón, R.; García-Hernández, C.; Medina-Plaza, C.; García-Cabezón, C.; Martín-Pedrosa, F. Electronic Noses and Tongues in Wine Industry. Front. Bioeng. Biotechnol. 2016, 4, 81. [Google Scholar] [CrossRef] [PubMed]
  173. Malfeito-Ferreira, M. Fine wine flavour perception and appreciation: Blending neuronal processes, tasting methods and expertise. Trends Food Sci. Technol. 2021, 115, 332–346. [Google Scholar] [CrossRef]
  174. Etaio, I.; Albisu, M.; Ojeda, M.; Gil, P.; Salmerón, J.; Elortondo, F. Sensory quality control for food certification: A case study on wine. Method development. Food Control 2010, 21, 533–541. [Google Scholar] [CrossRef]
  175. Etaio, I.; Albisu, M.; Ojeda, M.; Gil, P.; Salmerón, J.; Elortondo, F. Sensory quality control for food certification: A case study on wine. Panel training and qualification, method validation and monitoring. Food Control 2010, 21, 542–548. [Google Scholar] [CrossRef]
  176. Carmer, A.; Kleypas, J.; Orlowski, M. Wine sensory experience in hospitality education: A systematic review. Br. Food J. 2024, 126, 1365–1386. [Google Scholar] [CrossRef]
Figure 1. The experimental scheme evaluated the emotions elicited by different types of Douro wine samples. The co-author, Catarina Marques, permitted the use of the original picture.
Applsci 15 04538 g001
Table 1. Eye tracking and FaceReader advantages and challenges.
TechnologyAdvantagesChallengesReference
Eye TrackingProvides precise insights into visual attention and gaze patternsHigh-cost and specialized equipment and software[121,135,136,137]
Generates objective, unconscious data, reducing biasRequires precise calibration for accuracy
Produces detailed metrics like a heatmapIntrusive devices (e.g., glasses) may affect natural behavior
Applicable in various fields, including marketing and neuroscienceGenerates complex datasets requiring specialized analytical skills
FaceReaderAutomatically detects facial expressions and emotions in real-time Accuracy is affected by lighting, camera quality, and participant movement[6,129,133,134]
Non-intrusive and user-friendly, requiring no wearable devicesMay oversimplify or misinterpret mixed or subtle emotions
Applicable across disciplines like psychology, marketing, and usability testingCultural and individual variations in expressions can impact the reliability of results
Reduces the need for manual emotion coding, saving time and effortHigh initial investment in software and support equipment
Table 2. Holistic sensory approaches and their application in food marketing.
ConceptDescriptionApplication in Food MarketingReference
Sensory MarketingIntegrates human senses (sight, sound, touch, taste, and smell) into marketing to evoke emotions and influence consumer behavior.
  • Used to create emotional connections and memorable brand experiences;
  • Enhances consumer engagement and brand loyalty.
[162]
Crossmodal CorrespondencesUtilizes sound and shape symbolism to align sensory expectations with product attributes.
  • Enhances product experiences by ensuring congruence between sensory cues (e.g., sound and shape) and product expectations;
  • Influences consumer perceptions and preferences.
[163]
Sensory Quality SignalsEmploys extrinsic sensory cues like sensory descriptions and labels to influence consumer choices.
  • Particularly effective in the wine market, empowering consumer choice, increasing loyalty, and reducing food waste;
  • Applied to other food products, such as fruits and vegetables.
[164]
Integration of Sensory AnalysisCombines sensory analysis with marketing to improve product development and market strategies.
  • Helps in product positioning, market segmentation, and advertising strategies;
  • Provides insights into consumer preferences and sensory evaluation.
[165,166]
Holistic Food DevelopmentProposes a comprehensive approach to functional food development, integrating technological and nutritional perspectives.
  • Aims to create effective functional foods by balancing quality and functionality, supported by dedicated communication strategies to inform consumer needs and regulatory development.
[167]
Culinary and Sensory ResearchEncourages collaboration between food scientists and culinary experts to enhance food offerings and consumer experiences.
  • Integrates disciplines like cognitive psychology and linguistics;
  • Enrich sensory and consumer science, leading to innovative products and services.
[160]
Table 3. Holistic food and wine sensory evaluation approaches, brief method description, and key insights.
MethodDescriptionKey InsightsRef
NappingA rapid sensory method based on holistic assessment where samples are arranged on a sheet based on perceived similarities and differences.Napping effectively highlights qualitative sample differences and can be improved with panel training on method or product familiarity. [170].
Electronic Noses and TonguesThese devices use sensor arrays and pattern recognition software to create fingerprints of samples inspired by mammalian sensory recognition.They are widely used in the wine industry for quality control, aging control, and fraud detection, offering a holistic approach to sensory evaluation.[172]
Projective MappingA method where panelists place samples on a two-dimensional space based on perceived similarities is often used with Ultra-Flash Profiling to provide detailed descriptions.Experienced panelists show high similarity in results with trained panelists, indicating that familiarity with the method influences evaluations.[170,171]
Holistic Wine AssessmentIt focuses on olfaction’s synthetic, emotional, and mental imagery features and considers cross-modal influences on flavor perception.This approach argues for recognizing synthetic properties like complexity and harmony and suggests that cognitive factors and preferences can bias expert judgments.[173]
Sensory Quality ControlIt involves developing specific methods for sensory quality control, including assessor selection, training, and method validation, which are often accredited by official bodies.This method increases reliability and is crucial for products with quality distinctiveness labels, such as wines with the Protected Designation of Origin.[174,175]
Disclaimer/Publisher’s Note: The statements, opinions and data contained in all publications are solely those of the individual author(s) and contributor(s) and not of MDPI and/or the editor(s). MDPI and/or the editor(s) disclaim responsibility for any injury to people or property resulting from any ideas, methods, instructions or products referred to in the content.

