Article

From Vine to Wine: Non-Colored Flavonoids as Fingerprints

by
Jesús Heras-Roger
1,2,
Néstor Benítez-Brito
1 and
Carlos Díaz-Romero
1,*
1
Departamento de Ingeniería Química y Tecnología Farmacéutica, Universidad de La Laguna, 38201 Santa Cruz de Tenerife, Spain
2
Cátedra de Agroturismo y Enoturismo de Canarias ICCA-ULL, 38200 La Laguna, Spain
*
Author to whom correspondence should be addressed.
Appl. Sci. 2025, 15(8), 4543; https://doi.org/10.3390/app15084543
Submission received: 28 February 2025 / Revised: 17 April 2025 / Accepted: 18 April 2025 / Published: 20 April 2025

Abstract

:

Featured Application

This research shows a practical application of using comprehensive non-colored flavonoid compound profiles as chemical fingerprints for the authentication and characterization of red wines. Utilizing HPLC-UV analysis combined with multivariate statistical analyses, we used a relatively fast and cost-effective method for origin, cultivar, and aging discrimination of red wines from the Canary Islands. This approach could enhance the quality control and authenticity verification within the wine industry, so contributing to the prevention of fraud and increasing the confidence of consumers.

Abstract

Fourteen non-colored flavonoids, including flavanols (catequine and epicatequine) and flavonols (myricetin, quercetin, and isorhamnetin and their glucoside/glucuronide derivatives) were investigated in over two hundred monovarietal red wines from the Canary Islands, as a continuation of a previous study available in this journal. This is the first comprehensive study on non-colored flavonoids in monovarietal Canary wines, highlighting their potential as chemical fingerprints for wine characterization. Flavanal and flavanol concentrations were similar to values reported in other regions. Concentrations of these flavonoids significantly varied by grape cultivar, denomination of origin (DO), island, and aging. International grape cultivars generally showed higher non-colored flavonoid concentrations than autochthonous cultivars. Strong correlations were observed among flavonols of the same chemical groups, as well as between flavonols and anthocyanins, indicating a shared biosynthesis pathway in grapes and equilibria in wine. Principal component analysis revealed relationships among the individual flavonoids. Lineal discriminant analysis (LDA) resulted in high percentages of correct classification by cultivar, DO, precedence island, and aging. The classification accuracy achieved through LDA, except for aging, notably improved compared to the previous study that examined only visible flavonoids, underscoring the importance and effectiveness of non-colored flavonoid profiling.

1. Introduction

Flavonoids are a group of secondary plant metabolites belonging to the polyphenol family. They are commonly present in fruits, vegetables, flowers, and beverages such as tea and wine, as they play biological roles in the plant kingdom. Its basic chemical structure is based on a 15-carbon skeleton composed of two aromatic rings connected by an oxygenated bridge. The coloration of flavonoids depends on their degree of conjugation and the pH of the environment [1]. Non-colored flavonoids, such as flavanols and flavonols, generally lack extensive conjugation between their aromatic rings, which limits their ability to absorb visible light. Instead, they primarily absorb ultraviolet (UV) radiation due to their aromatic structure and the presence of hydroxyl groups. Their electronic transitions occur at wavelengths below the visible spectrum (typically between 250 and 350 nm), making them appear colorless to the human eye [2]. However, non-colored flavonoids can sometimes exhibit a slight yellowish tone, although in red wines this subtle coloration is usually masked by the intense red pigments of anthocyanins. In contrast, colored flavonoids have extended conjugation systems that absorb visible light, thus providing distinctive coloration to plants and derived products [3].
Flavonoids are typically distinguished by the functional groups attached to their core structure. They are primarily classified into seven major families based on their structural variations: chalcones, flavones, flavonols, flavandiols (or flavan-3-ols), anthocyanins, condensed tannins (or proanthocyanidins), and aurones. While aurones and chalcones are rare in wine, the rest are commonly found in wines [3]. Most representative flavonoid groups in red wines can be divided into two groups: (1) Anthocyanins, which are visible pigments responsible for the red, purple, and blue colors in flowers and fruits; and (2) Non-colored flavonoids, mostly flavan-3-ols, commonly referred to as flavanols, and flavonols. Flavanols are highly related to tannins and thus are fundamental to the sensory quality characteristics of wines, as they influence bitter taste and mouthfeel, while flavonols are more related to color persistence [4].
Flavonoid compounds in grapevines are synthesized during grape development. These compounds play an important role in the plant physiology, as they are involved in defense mechanisms against pathogens and radiation [5]. Flavanols, including catechin and epicatechin, are also synthesized through the flavonoid biosynthetic pathway [6]. Key enzymes involved in this synthesis are leucoanthocyanidin reductase and anthocyanidin reductase, which reduce leucoanthocyanidins and anthocyanidins to produce catechins and epicatechins [7]. Flavonols are synthesized via the flavonoid biosynthetic pathway from the amino acid phenylalanine, through the action of phenylalanine ammonia-lyase and other enzymes [8]. Common flavonols in grapes include quercetin, kaempferol, and myricetin [9]. They are primarily accumulated in the grape skin and serve as protectors again ultraviolet radiation preventing damage to the plant tissues [10].
The flavonoid profile of wines is shaped by factors such as grape cultivar, terroir, environmental conditions, and viticultural practices [1,11]. Therefore, the flavonoid composition of each wine can contribute in the authentication of grape cultivars, geographical origins, and even production methods [12]. This is increasingly important in the global wine market to prevent fraud and ensure consumer confidence [13]. Scientific studies have demonstrated the potential of using these types of profiles for wine authentication and classification [14].
In a previous study we used the anthocyanin composition to characterize red Canary wines [15]. The present research seeks to explore the potential use of the non-visible flavonoid compounds—flavanols and flavonols with less visible spectra influence—present in those Canary red wines to assess their effectiveness as fingerprints for their authentication and characterization and explore their relationships. To the best of our knowledge, this is the first study on non-visible flavonoids strictly focused on monovarietal Canary red wines. A correlation analysis was conducted to identify relationships between the analyzed flavonoid compounds, alongside multivariate analysis techniques to classify the monovarietal red wines based on the characteristics

2. Materials and Methods

2.1. Red Wine Samples

A total of 205 monovarietal red wines in commercial bottled form were obtained from the Canary Islands (Spain), covering ten grape cultivars across six islands and six vintages. Detailed information on geographical origin, grape variety, and aging parameters is provided in Table 1.

2.2. Analytical Methods

High-performance liquid chromatography (HPLC) was employed to separate flavonoid compounds, following a slightly modified method from Ibern-Gómez et al. [16]. The analysis was conducted using a Waters 2690 Separation Module coupled with a Waters 996 Photodiode Array Detector (DAD). Prior to injection, the red wine samples were filtered through a 0.45 μm membrane, and 15 μL aliquots were injected into a head of column Nova-Pak C18 reversed-phase column (3.9 × 150 mm, 4 μm particle size; Waters, Milford, MA, USA) maintained at 30 °C. The mobile phase consisted of Milli-Q water (solvent A) and acetonitrile (solvent B, Sigma-Aldrich, St. Louis, MO, USA), both acidified with 0.2% trifluoroacetic acid (spectrophotometric grade, ≥99%, Sigma-Aldrich). A linear gradient was applied, with a flow rate of 1.5 mL/min.
Flavonoid compounds were identified using their retention times and UV-visible spectra (200–700 nm), with direct comparison to commercial standards (Sigma-Aldrich) when available through spiking experiments. Those commercial standards available were individually injected into the HPLC system, and their retention times and spectral characteristics were recorded and used as benchmarks. These peaks from the wine samples were then compared against the benchmarks to confirm identity. Identification of other compounds was based on spectral data and relative retention times reported in the literature for the same methodology and similar experimental conditions, taking into account UV-visible characteristic absorption maxima, elution time, and spectral profiles previously described in similar red wine studies and specific flavonoid databases [2,17,18,19,20,21,22,23,24]. The use of HPLC coupled with DAD provides a suitable balance between analytical performance, cost-effectiveness, and ease of implementation in routine laboratories, facilitating its widespread use for qualitative and quantitative analysis in enological studies. Specific chromatographic details from non-visible flavonoids such as retention time, characteristic absorption wavelengths, and detection are presented in Table S1.
Calibration curves were constructed over the concentration ranges observed in the wine samples for the flavonoid compounds with available standards. Typically, flavanol compounds and rutin detected at 280 nm were quantified using gallic acid as standard and the results were expressed as milligrams of gallic acid per liter (mg GAE/L); flavonols were detected at 365 nm and they were quantified using quercetin as the standard and the results were expressed accordingly. Limits of detection (LOD) and limits of quantification (LOQ) were calculated as the lowest concentration that yielded a signal to noise ratio of three and ten, respectively.
Commercial standards used to spike the samples included catechin, epicatechin, quercetin, and rutin (all ≥98% purity, Sigma-Aldrich). Calibration curves for these compounds were generated by plotting peak area (absorbance) as a function of concentration (mg/L). Each flavonoid standard exhibited excellent linearity, with correlation coefficients (r) ranging from 0.994 to 0.999, confirming that the assessed concentration ranges fell within the linear response region.
The two flavanols identified were catechin (Cate) and epicatechin (Epic). The addition of both compounds are expressed as:
Total Flavanols (TFla) = Cate + Epic
The flavonol compounds identified (abbreviated names are included between brackets) were the following: myricetin-3-glucuronide (M3gu); myricetin-3-glucoside (M3gl); laricitrin-3-glucoside (L3gl); kaempferol-3-glucoside (K3gl); myricetin (Myri); quercetin-3-glucuronide (Q3gu); quercetin-3-glucoside (Q3gl); rutin (Ruti); isorhamnetin-3-glucoside (I3gl); isorhamnetin (Isor); syringetin-3-glucoside (S3gl); quercetin (Quer).
Using these twelve individual flavonol compounds determined, several derivative groups were calculated. First, flavonols were classified based on their glycosylation level, distinguishing between aglycone flavonols and glycosylated flavonols. Another classification grouped flavonols with the same basic structure but different glycosylation forms, categorizing them as quercetin, myricetin, or isorhamnetin derivatives. Total flavonol content was calculated summing all the flavonols.
Aglyconed Flavonols (AFlo) = Myri + Isor + Quer
Glycosilated Flavonols (GFlo) = M3gu + M3gl + L3gl + K3gl + Q3gu + Q3gl + Ruti + I3gl + S3gl
Quercetin Derivatives (Qder) = Quer + Q3gu + Q3gl + Ruti
Myricetin Derivatives (Mder) = Myri + M3gu + M3gl
Isorhamnetin Derivatives (Ider) = Isor + I3gl
Total Flavonols (TFlo) = Myri + Isor + Quer + M3gu + M3gl + L3gl + K3gl + Q3gu+ Q3gl + Ruti + I3gl + S3gl

2.3. Statistical Analysis

SPSS version 18 program was used to carry out the statistical analyses. One-way ANOVA was applied to evaluate significant differences between groups, considering statistical significance when the p value < 0.05. Post hoc comparisons were conducted using Duncan’s multiple range test to identify specific variations within each group. Pearson’s correlation coefficient was employed to examine bivariate positive or inverse relationship correlations among variables.
Principal component analysis (PCA) was utilized to explore data structure and reduce the dimensionality of the system. Linear discriminant analysis (LDA) was carried out, including all quantitative variables to examine the potential discriminant of the system and relationships between factors. Additionally, a stepwise selection approach was performed to identify the most relevant variables contributing to the group differentiation. Probabilities were calculated based on population sample sizes and an intra-group variance matrix.

3. Results

In this section, the results are firstly organized by the statistical techniques applied (univariate, correlation, and multivariate analyses). For each group of statistical techniques, the data were studied to differentiate red wines according to the qualitative variable considered. Table 1 shows details on cultivar and geographical abbreviations; additionally, they are described in the specific tables where they are used.

3.1. Univariate Analysis

The mean and standard deviation of non-visible flavonoid concentrations were determined for the red wine samples, and variance analysis (one-way ANOVA) followed by Duncan’s test was performed considering grape cultivar, geographical origin, and aging. The high variability observed in the flavonoid content of the analyzed red wines could be attributed to their naturally low concentrations and inherent variability associated with biological samples of this nature.

3.1.1. Grape Cultivar

Table 2 presents the results of the flavonoid compounds analyzed in monovarietal red wines, categorized by grape cultivar used in its elaboration.
In relation to the two flavanols considered, T cultivar showed the highest mean concentration. The mean Epic concentration in red wines from T cultivar was significantly higher than those of red wines produced from the rest of the cultivars, except B cultivar. Mean Cate concentration was higher than those mean concentrations obtained for red wines from S and C cultivars and these were higher than that observed for red wines from LP cultivar. The behavior of TFla was very similar to the Epi which is explained because it is the major flavanol.
M3gl showed the highest mean concentration in red wines produced from LP, N, and LN cultivars, with significant differences comparing with red wines from B, T, S, and R cultivars. Red wines elaborated with the S and R cultivars had the highest mean L3gl concentrations with significant differences in relation to the red wines from V, LP, and B cultivars. Similarly, Q3gl was most abundant in red wines from C and S, whereas the red wines of V and B contained the lowest amounts. Mean Q3gl concentrations in red wines produced from M and S cultivars were significantly higher than those mean concentrations obtained in red wines from the rest of the cultivars, except those elaborated from LP and C cultivars. Rutin and Myri contents showed notable differences in the red wines according to cultivars used in their elaboration. R and C cultivars exhibited the highest mean Ruti concentrations, while red wines from V, N, LP, and B cultivars had significantly (p < 0.05) lower mean concentrations than them. On the other hand, red wines elaborated with international cultivars (M, S, and R) and C cultivar had a mean Myri concentration around 10–12 mg/L, which was significantly higher than the mean concentrations found in red wines from the rest of the cultivars. Analogously, the highest mean Isor concentrations were found in red wines produced from M, S, and R international cultivars, which were significantly higher than the mean concentrations found in red wines from the rest of the cultivars, except T cultivar. Additionally, the highest mean Quer concentrations were obtained in red wines produced from M, S, and N cultivars, with significant differences comparing with those red wines from B, T, LN, and C cultivars. In contrast, no significant differences were found in the mean K3gl concentrations obtained in red wines according to grape cultivars.
M3gu and Q3gu contents presented also significant differences according to the grape cultivars used in their elaboration. So, red wines from C, M, S, LP, and V cultivars contained the highest mean M3gu concentrations, with significant differences only in relation to red wines from N cultivar. A similar behavior was observed in Q3gu. So, the international cultivars (particularly S followed by M cultivar) showed the highest mean Q3gu concentrations. After those international cultivars, the mean concentrations of red wines from R, C, and LP cultivars were the highest, with significant differences with respect to red wines from V, N, B, and T cultivars. In the case of Isor and I3gl, the highest levels were found in red wines elaborated from M and S cultivars, while the red wines from N, LP, B, and V cultivars contained the lowest mean concentrations. The S3gl was the flavonol compound with the lowest concentration, ranging in a relatively narrow interval, 0.32 and 0.91 mg/L.
Regarding flavonol derivatives obtained by calculations, significant differences were observed among cultivars. AFlo had significantly higher mean concentrations in red wines from S, C, and R cultivars than those mean concentrations observed in red wines from V, N, LP, B, T, and LN. A similar trend was observed for GFlo, which had the highest mean concentrations in red wines produced from S cultivar and the lowest in red wines from V, B, and T cultivars.
Qder revealed a clear differentiation among the red wines elaborated from different grape cultivars. Red wines from S and M cultivars contained the highest mean concentrations, while the red wines from V, B, and T cultivars had the lowest mean concentrations. The mean Mder concentration according to grape cultivar used in this elaboration followed a pattern similar to the previous ones. So, red wines using most of the grape cultivars had between 17 and 20 mg/L; only red wines from V, B, and T cultivars showed a mean Mder concentration lower (p < 0.05) than the red wines produced from the rest of the cultivars. Red wines from S cultivar presented the highest (p > 0.05) mean Ider concentration; after, the red wines produced from the other two international cultivars (M and R) presented higher (p > 0.05) mean Ider concentrations than those mean concentrations obtained from the rest of the grape cultivars, except T. This general pattern was also evident when TFlo was considered. Red wines from S and M cultivars exhibited the highest mean TFlo concentrations, whereas V and B had the lowest mean values, with significant differences between both groups.

3.1.2. Geographical Origin

In relation to the geographical origin, two factors were considered: Island of precedence and DO in Tenerife Island.

Island of Precedence

The ANOVA results of non-visible flavonoid concentrations in monovarietal red wines from different Canary Islands (Table 3) revealed that some flavonoid compounds exhibit clear (p < 0.05) geographical differentiation, while others show more uniform distribution across islands.
Regarding flavanols, the mean Cate concentration was significantly higher in red wines of Gran Canaria compared to those mean concentrations observed in the wines of the westernmost islands such as El Hierro, La Gomera, and La Palma islands. Similarly, the mean Epic and TFla concentrations in red wines from La Gomera was the lowest, with significant differences with respect to the mean concentrations observed in red wines from the rest of the islands (except La Palma for TFla).
The flavonol concentration varied significantly among the islands, with notable differences in many flavonols, as observed in Table 3. In terms of specific individual compounds, M3gu showed the highest mean concentration in red wines from Gran Canaria Island, while the red wines produced in La Gomera had the lowest concentration, with significant differences between the mean concentrations found in both islands. In contrast, the mean M3gl concentrations did not exhibit significant differences among the red wines according to the production island, with all values remaining within a relatively narrow range. Red wines from Tenerife, Gran Canaria, and La Palma islands had higher mean L3gl concentrations than the mean concentration obtained in red wines from El Hierro. Gran Canaria produced the red wines with the highest mean K3gl concentration, followed by the red wines from Tenerife and Lanzarote Islands. Red wines produced in La Palma and La Gomera Islands had a lower (p < 0.05) mean K3gl concentration than that observed in red wines from Gran Canaria Island.
Mean Myri concentrations were markedly elevated in red wines from Lanzarote and Tenerife islands, with significant differences with respect to those mean concentrations observed in the red wines of the westernmost islands (El Hierro, La Gomera, and La Palma Islands). Red wines from Lanzarote had the highest (p < 0.05) mean Q3gu and Q3gl concentrations, with Tenerife Island also displaying elevated levels, distinguishing the red wines produced in these islands from the others. Mean Rutin concentration in red wines from Tenerife was higher than those mean concentrations found in the rest of the islands, except Lanzarote, which presented similar values. I3gl and Isor concentrations followed a comparable pattern. Red wines from Lanzarote and Tenerife Islands presented a higher mean concentration than those observed in the rest of the islands. S3gl exhibited the highest mean concentration in red wines from Gran Canaria Island, with significant differences with red wines from La Palma and La Gomera. Red wines produced in Lanzarote Island showed the highest mean Quer concentrations, while red wines from La Palma Island had a lower (p < 0.05) mean Quer concentration than those from Lanzarote.
With respect to derivative flavonols obtained by calculation, AFlo and GFlo had a similar trend. Red wines produced in Lanzarote Island, followed by those from Tenerife, exhibited the highest mean AFlo and GFlo concentrations. On the other hand, the red wines from of the westernmost islands (El Hierro, La Gomera, and La Palma Islands) showed the lowest mean concentrations, reinforcing their distinct flavonol profiles which has been observed in the individual flavonoids. Moreover, the results obtained for other derivatives such as Qder, Mder, and Ider were very similar; red wines from Lanzarote presented the highest mean concentration with significant differences compared with red wines from other islands; the westernmost islands had the lowest mean concentrations. Mean TFlo concentrations showed the most striking differences, with the red wines from Lanzarote Island, followed by Tenerife Island, presenting significantly higher mean concentrations compared to the rest of the islands.

Denomination of Origin in Tenerife Island
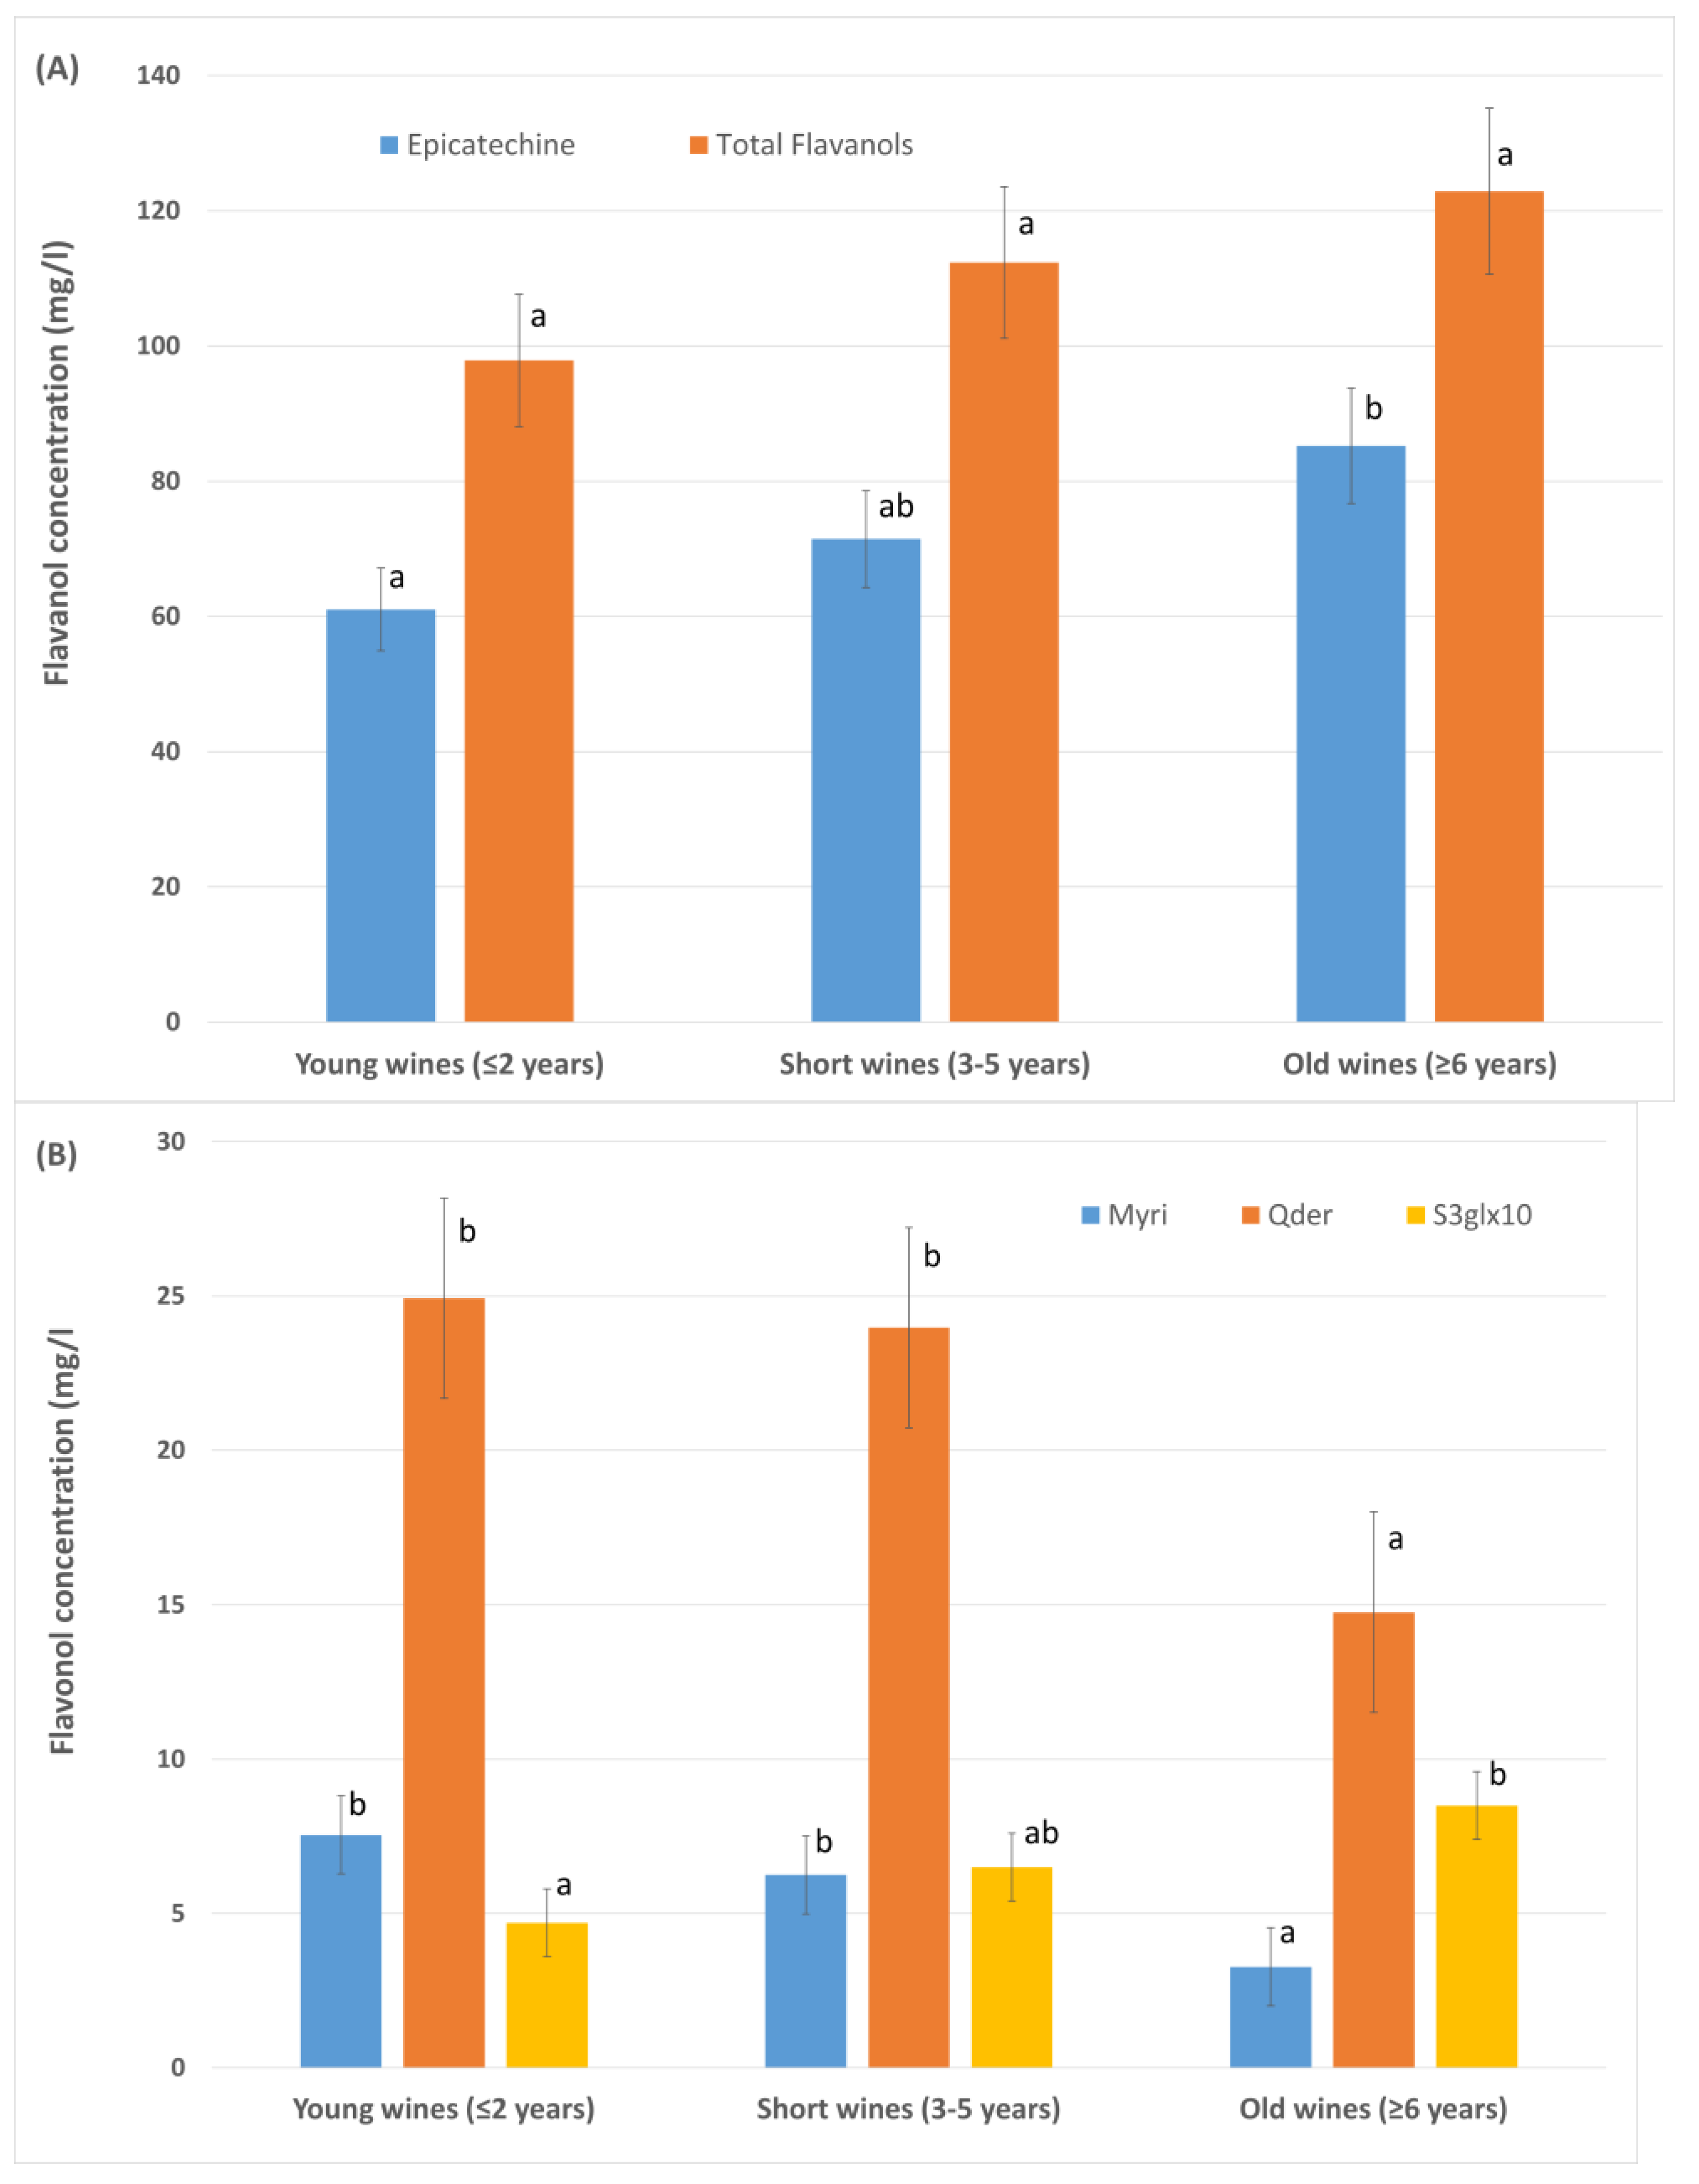
The mean concentrations of non-visible flavonoids exhibited significant variability across the different DOs belonging to Tenerife Island, as can be observed in Table S2. There was different behavior in the two flavanols included in this paper. Mean Epic concentration showed significant differences according to the DO considered. So, red wines produced in DO T, followed by DO Y, exhibited the highest mean Epic concentration, finding significant differences in relation to those mean concentrations observed in DO G and DO A, which were located toward the southern slope of the island. In contrast, mean Cate concentrations remained constant among all the DOs, without significant differences among their mean concentrations. Red wines from DO Y and DO T had a higher mean TFla concentration higher than those mean concentrations observed in the rest of the DOs, although these differences reached statistical significance only when compared with red wines from DO G.
The highest mean M3gu concentrations were observed in red wines produced in the southern slope of the island (DO A and DO G), with significant differences in relation to the mean concentrations observed in DO Y. However, the M3gl showed a different pattern. The highest mean M3gl concentration was found in red wines from DO O, followed by the mean concentration in DO Y, whereas red wines precedent from the rest of the DOs presented lower (p < 0.01) mean concentrations. Mean L3gl concentrations remained relatively stable among all the DOs without significant differences among their mean concentrations. Red wines from DO G had the highest mean K3gl concentration, next the red wines from DO A, with significant differences in relation to the mean concentration observed in red wines from DO O. Mean Q3gu and Q3gl concentrations in red wines decreased progressively (p < 0.01) according to the following sequence: DO G, DO O > DO T > DO Y, which demonstrated a similar pattern in both Quercetin glycosides, finding the highest mean concentration in red wines from DO G and the lowest in DO Y. Red wines from DO G presented the highest mean Rutin concentration, although the significant differences were reached only when they were compared with the mean concentrations in red wines from DO T.
Red wines from DO G exhibited a higher mean I3gl concentration than those from the other DOs studied; in contrast, red wines from DO Y presented lower (p < 0.05) mean I3gl values relative to DO G and DO A. The highest mean Isor concentration was also observed in red wines from DO G, showing significant differences compared with red wines from DO O and DO Y. The S3gl pattern followed that of the other glycoside flavanols, with red wines from DO A and DO G displaying higher (p < 0.05) mean S3gl levels than those observed in DO O. Mean Quer concentrations were also highest in red wines from DO A, DO G, and DO T, with statistically significant differences compared to DO Y.
There are many similarities in the pattern of derivative flavonols obtained by calculation (AFlo, GFlo, Qder, Mder, Ider, and TFlo). The mean concentration of all these derivatives showed the highest and lowest values for the red wines from DO G and DO Y, respectively (except in the highest concentration for Mder); the differences being statistically significant in many cases. The sequence in which the DOs of wine production are most frequently ordered based on mean concentrations of these derivative flavonols is as follows: DO G > DO O > DO A > DO T > DO Y, which was observed for GFlo, Qder, and TFlo.

3.1.3. Aging

Many non-visible flavonoids detected in red wines were significantly influenced by the aging process. The mean concentrations and standard deviation are presented in Table S3 differentiating the aging time; additionally, the variance analyses (ANOVA) and results of the Duncan’s test for comparing mean concentrations according to aging are included in this table.
In terms of flavanols, Cate did not show significant differences between their mean concentrations according to aging, while mean Epic concentration increased with aging. The mean Epic concentrations of the young wines (≤2 years) was significantly lower than that mean concentration found in old wines (≥6 years of aging). As Cate content across aging was relatively constant, the sum of the two flavanols (TFla) also increased in a similar way to Epic concentration; however, no significant differences were observed. Figure 1A shows the increase in mean Epic and TFla concentrations as a function of aging.
Flavonols had a variable behaviour depending on the compound considered. On one hand, Quer, K3gl, M3gl, and M3gu did not show significant differences among their mean concentrations according to aging. On the other hand, Myri, Ruti, Q3gu, Q3gl, and L3gl decreased their mean concentrations with aging; in particular, red wines ≥6 years of aging had significantly lower mean concentrations than young wines (≤2 years) and wines with 3–5 years of aging. In contrast, mean S3gl concentration clearly increased with aging with significant differences between the mean concentrations found for red wines with ≤2 years and ≥6 years of aging. Surprisingly, Ider, Isor, and GFlo had the highest mean concentrations for red wines with 3–5 years of aging, with remarkable differences compared with those mean concentrations observed for red wines ≤2 years and/or ≥6 years of aging. Figure 1B shows how the mean Myri and Qder concentrations decreased with aging, while the mean S3gl concentrations increases.

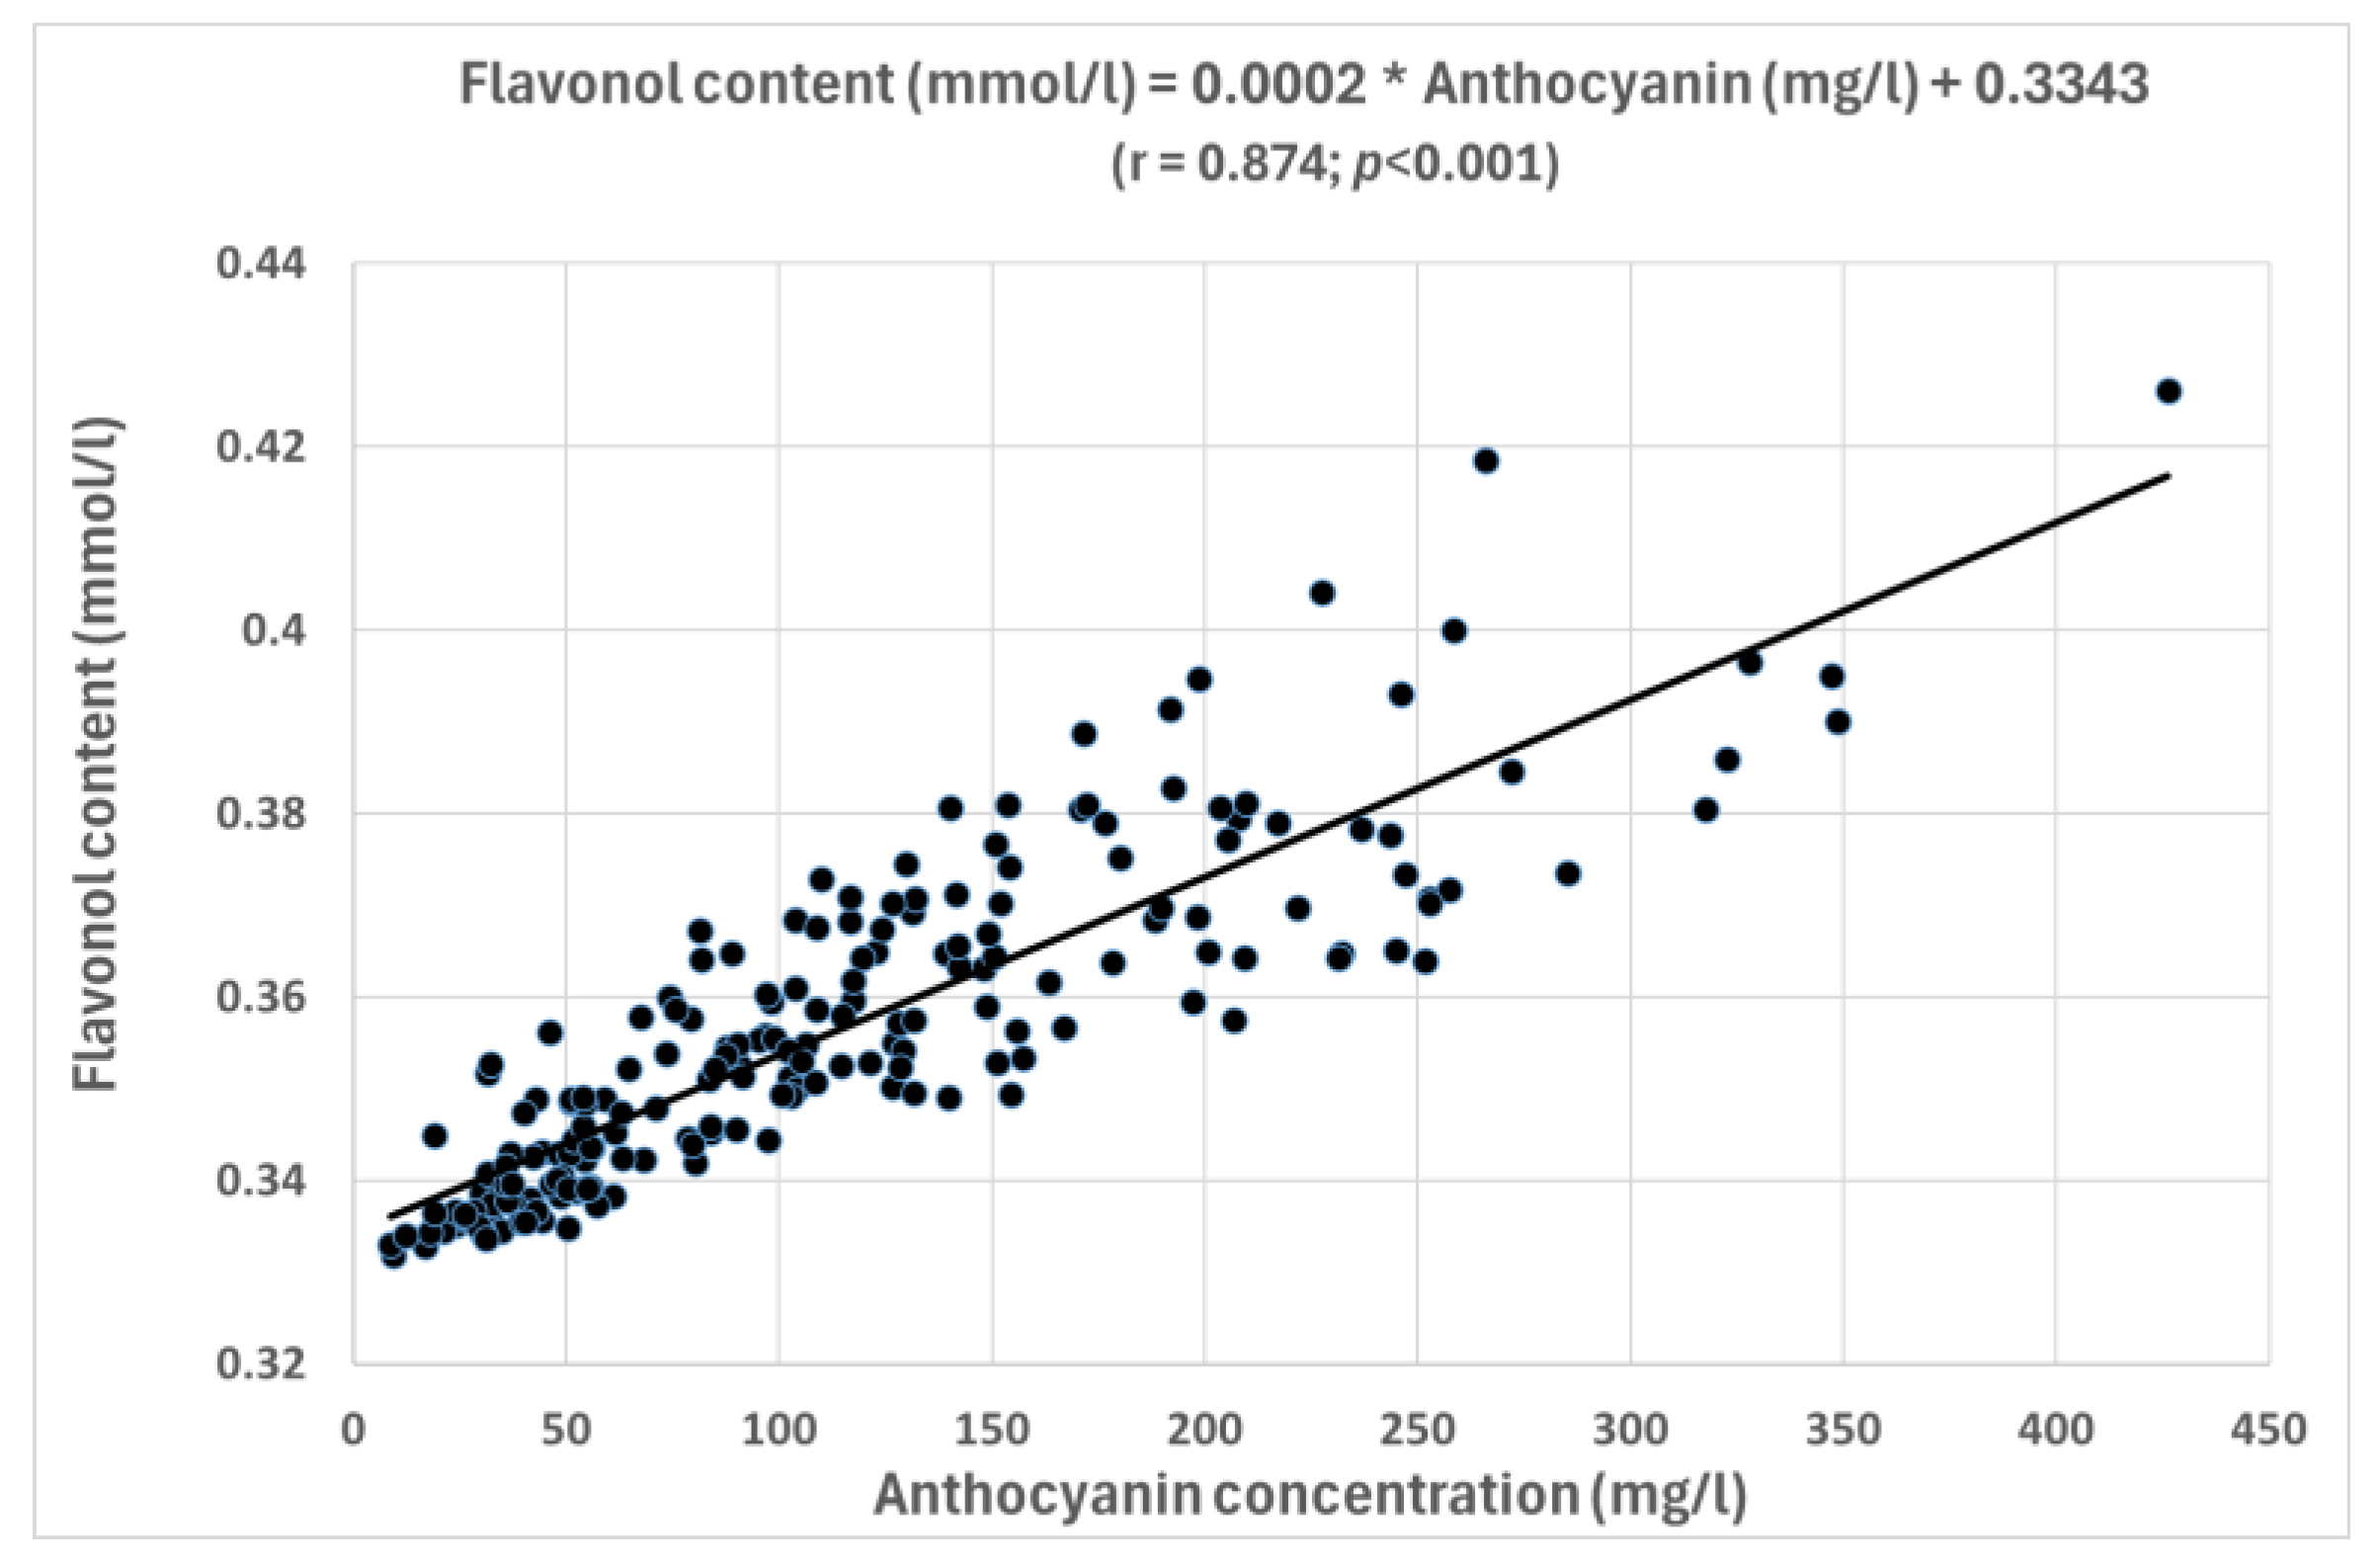
3.2. Correlation Study

Results of correlation analysis of the individual flavonoids and the calculated flavonoid groups based on the flavonol derivatives showed many significant relationships (Table 4). Most of the relationships established among the flavonoid compounds were highly significant (p < 0.001).

3.3. Multivariate Analysis

3.3.1. Principal Compound Analysis

Principal compound analysis (PCA) was performed to reduce the complexity of the non-visible flavonoid dataset, encompassing both directly measured and calculated parameters. After applying Varimax rotation to minimize the influence of overlapping variables on each factor, five factors were extracted with eigenvalues ≥1, collectively accounting for 80.0% of the total variance. The first factor, explaining 43.3% of the variance, was strongly associated with TFlo and GFlo, and to a lesser extent with Qder and Mder. The second factor (15.3% of the variance) was linked to Ider and Quer and inversely related to Mder. The third factor (8.4% of the variance) was predominantly related to flavanols, displaying strong associations with Cate and Epic, as well as their combined measure (TFla). The fourth factor, explaining 7.9% of the variance, was primarily associated with L3Gl and Ruti. Figure S1 illustrates these results using only the first two factors, facilitating the identification of relationships among flavonoid compounds; variables positioned close together on the plot suggest shared attributes. It can be noticed that the positive side of the factor 1 is predominantly related with Qder, GFlo, and TFlo, which are near to Q3gu, Q3gl, and Mder. On the other hand, the factor 2 contributes mainly to the differentiation between Ider and Isor (upper right quadrant) versus M3gl and Mder (lower right quadrant).
Factor analysis was performed to investigate differentiation based on cultivar, geographical origin, and aging. However, the visual distribution of the wine samples did not exhibit a clear separation. Nonetheless, a slight tendency was observed to distinguish the three aging groups, as well as between certain islands (e.g., Lanzarote and Tenerife).

3.3.2. Linear Discriminant Analysis

Results of a linear discriminant analysis (LDA) performed to classify the Canary red wines analyzed according to grape cultivar, island of precedence, DO (Tenerife Island), and wine aging are presented in Table 5. Variable levels of correct classification were found before and after cross-validation. This table also shows the non-visible flavonoids influencing each of the discriminant functions that were selected from the stepwise analysis.
Using the full set of flavonoid variables, LDA achieved an 82.9% correct classification of red wines by grape cultivar, which dropped to 68.8% after cross-validation. When stepwise LDA was applied, the classification accuracy declined to 62.4% (58% after cross-validation), with M3gl, Isor, Myri, and Q3gl emerging as key variables for distinguishing grape cultivars. For instance, specifically for the Listán Negro samples, M3gl and Q3gl present relatively high mean concentrations compared to several other cultivars, whereas Isor and Myri show intermediate concentration levels. Such concentration patterns of these flavonoids collectively enable accurate differentiation and classification of Listán Negro samples.
When classifying red wines by island of origin, LDA using all flavonoid variables yielded the highest correct classification rate of 84.9%, which decreased to 73.7% after cross-validation. In contrast, the stepwise LDA approach produced a lower accuracy of 73.2% (72.7% after cross-validation), with Myri, AFlo, and Q3gu emerging as the most relevant variables for differentiating the red wines according to the production island. Red wines from La Gomera and Lanzarote islands achieved a 100% accuracy of correct classification, indicating no misclassification for these red wines. Red wines produced in Tenerife Island exhibited a high correct classification accuracy (91.1%), with minor misclassifications into La Gomera (2.7%), Gran Canaria (2.7%), El Hierro (2.1%), and La Palma (1.4%). Red wines from El Hierro and La Palma islands were moderately well classified in 72.2% and 73.3% of cases, respectively. In contrast, red wines produced in Gran Canaria Island had the lowest accuracy (30.8%), with significant misclassification in Tenerife (53.8%) and smaller proportions in La Gomera and El Hierro (both 7.7%).
Wine aging yielded red wines which showed 81.5% of correct classification (76.6% after cross-validation) using all the variables. When stepwise LDA was applied, the correct classification lowered to 75.1% (74.6% after cross-validation). The relevant variables selected by the stepwise LDA for classifying red wines according to aging were K3gl, Isor, AFlo, Myri, TFlo, and Cate. Red wines highly aged were correctly classified in 71.4% of the cases, though some were misclassified as younger wines. Red wines aged ≥6 years had a 64.4% accuracy, with 34.2% being incorrectly assigned to the youngest category. The best classification was observed for the red wines with ≤2 years of aging, which were correctly identified in 92.0% of cases. The misclassifications primarily occurred in the intermediate category, suggesting that distinguishing between medium-aged and younger or elder wines posed a greater challenge.
Table 6 shows the percentage of correct classification after applying LDA for red wines according to the grape cultivar used in their production. The original grape cultivars are listed in the first column, while the predicted classifications are shown across the table. The diagonal values in the table indicate the proportion of red wines correctly classified for each cultivar, while the off-diagonal entries represent misclassification rates. Wines from cultivars C and M were classified with complete accuracy, whereas those from N and LP also achieved near-perfect classification at 92.3% and 92.9%, respectively. Additionally, the correct classification for LN and R cultivars were relatively high at 83.9% and 80%; B, T, and S presented a moderate correct classification (≥75%) and there were notable misclassifications as LN (13.3%, 22.2%, 16.7%, respectively). V cultivar was characterized by less appealing results, with 70.6% of correct classification.
Similarly, the classification results of different denomination of origin (DO) zones based on a predictive model, independently of the precedence island, are presented in Table 7. Overall, the model achieved an 82.0% classification accuracy, meaning that most cases were correctly assigned to their respective DO. In general, DO which included a whole island, like HI, GO, and LZ, showed a complete classification rate (100%). LP, including all wines coming from La Palma Island, had also a very high classification accuracy (93.3%).
Tenerife has five different DOs, which explains that the prediction model is not as good as for the rest of the islands encompassing in their area an only DO. However, the DO O had a particularly strong performance, with 92.6% of cases correctly classified, followed by DO T with 84.4% accuracy, though some cases were misclassified into DO O and GO. Similarly, DO A achieved 71.7% accuracy, with some cases being incorrectly classified as DO T and DO O. Meanwhile, GC (wines from Gran Canaria Island) had a slightly lower accuracy of 69.2%, with 23.1% of cases misclassified with DO T. One of the regions with lower classification accuracy was DO Y, where only 55.6% of cases were correctly classified. DO Y has a south and north side on Tenerife Island, which could explain the misclassifications from this region. In fact, the misclassifications mainly occurred with DO O (north border of the vineyards included in DO Y), DO A (south border of the vineyards included in DO Y), and DO T (north side of the island), suggesting that these DO areas inside Tenerife Island share similar characteristics, and their common flavonoid profile might have confused the model.
In terms of flavanols, a positive correlation was observed between the two flavanol compounds Cate and Epic (r = 0.430, p < 0.001). Interestingly Epic presents quite less significant correlations with flavonols (just with I3gl, Isor, and Quer) whereas Cate was significantly related with almost all the flavonols quantified, except M3gu and Q3gl, and usually with a higher Pearson coefficient. Similar behavior was observed in the flavonol group, as the concentration of both miricetyn glycosided derivatives, M3gu and M3gl, was relatively less related to the other flavonoids, but for instance, Myri was significantly related to most of them, such as with M3Gl, L3gl, K3gl, Myri, Q3gu, Ruti, I3gl, Isor, S3gl, and Quer.
The presence of strong correlations between glycosylated flavonols (GFlo) and their aglycone counterparts (AFlo) suggests a dynamic equilibrium between glycosylation and deglycosylation processes in flavonols, as illustrated in Figure 2A (r = 0.697; p < 0.01). Interestingly, when this analysis was conducted for specific flavonol structures, the association between aglycone and glycosylated flavonols was most pronounced in the case of Isor and I3gl (r = 0.877; p < 0.01) (Figure 2B). In contrast, this correlation was less significant in other flavonol structures, such as Quer and Q3gl (r = 0.297; p < 0.01) and Quer-Q3gu (r = 0.271; p < 0.01). Moreover, no significant correlations (p > 0.05) were observed for other aglycone glycosylated forms, such as Myri and M3gu, Quer and Ruti, or Myri and M3gl. Additionally, a highly significant correlation (r = 0.832; p < 0.01) was observed between Myri and Q3gu (Figure 2C). There was also a highly significant relationship (r = 0.900; p < 0.01) between the different glycosylation forms of quercetin, such as Q3gl and Q3gu (Figure 2D).
In terms of flavonoid calculations, GFlo significantly (p < 0.001) correlated with most of the flavonols employed for its calculation (M3gl, r = 0.494; L3gl, r = 0.263; Q3gu, r = 0.941; Q3gl, r = 0.909; Ruti, r = 0.470; I3gl, r = 0.633). However, there was no significant relationship (p > 0.01) with other compounds, such as M3gu, K3gl, or S3gl, which could be explained because of the low concentrations of these glycosylated derivatives. In contrast, GFlo was significantly related to some aglycone compound concentrations, such as Myri (r = 0.701), Isor (r = 0.426), and Quer (r = 0.315). A similar pattern was observed in the AFlo, which was significantly correlated with all free flavonols, flavanols, and most glycosylated flavonols, except for K3gl and M3gl.
Figure 3 presents the distribution of Mder and Ider as a function of Qder in the red wines analyzed. This graph shows a positive correlation between Qder and both Mder and Ider, with Mder values generally being higher than Ider for a given Qder concentration. Mder shows a broader range of values, reaching up to 40 mg/L, while Ider values remain less concentrated below 20 mg/L, but both with a high degree of correlation. Interestingly the correlation between Mder and Ider concentrations was relatively low (r = 0.223), although it reached statistical significance (p = 0.001).
An interesting and highly significant correlation relationship between the concentration of visible anthocyanin concentrations, described in a previous study [15], and specific non-visible pigments from this study (flavonols in particular) was found despite the high heterogeneity of the red wine samples (Figure 4).

4. Discussion

This section is also divided into the same subsections as in the Results section: univariate analysis, correlation, and multivariate analyses.
Total flavonol concentrations obtained in this research were similar to those concentrations reported in the literature for other red wines from relatively warm regions, like Australia [22], but a little bit higher than those reported in red wines from Europe [25]. This agrees with the fact that flavonol accumulation is highly dependent on environmental conditions, in particular UV exposure [26]. Similarly, TFla concentrations obtained here were within the usual range for red wines from other regions [1].
Regarding the individual flavonol concentration, all possible flavonol glucosides were detected (M3gl, L3gl, K3gl, Q3gl, I3gl, and S3gl), while only two glucuronide compounds (Q3gu and M3gu) were identified. Myri, Quer, and Isor were detected in their aglycone form. Additionally, it is noteworthy that Ruti was the only derived flavonol quantified that included a disaccharide in its structure (glucose—ramnose). In general. Qder and Mder dominated the flavonol profile, being Q3gu the most abundant glycoside present, which is in agreement with previous studies carried out in red wines [22,23].

4.1. Univariate Analyses

The profile of non-visible flavonoids in red wines is modulated by grape cultivar, geographical provenance, and maturation processes, providing insights into the factors influencing these bioactive compounds. In this investigation, all wines produced from international grape cultivars were sourced from grapevines obtained through commercial nurseries, where they are rigorously selected and typically grafted onto designated rootstocks to maintain genetic consistency and adaptability to environmental conditions [27]. Conversely, traditional cultivars from the Canary Islands examined in this study have been progressively selected over time by local viticulturists through extended field cultivation practices and are predominantly cultivated ungrafted, thereby preserving greater genetic heterogeneity and distinctly contributing to variability in wine characteristics. Furthermore, the geographical fragmentation of the Canary Islands, comprising eight main islands, leads to significant edaphoclimatic heterogeneity across wine-producing regions, further influencing the flavonoid composition and overall wine profile.

4.1.1. Cultivar

Regarding flavanols, the predominance of epicatechin over catechin and their concentrations in our red wine samples align with previous findings for Syrah red wines [28]. Epicatechin is known to be more prevalent in condensed tannins and contributes significantly to wine astringency and potential aging [29] This pattern might be due to differences in the chemical structure of tannins, grape skin composition, and seed-derived flavanols.
In agreement with previous research, most of the concentrated flavonols in our study were those derived from quercetin (Quer, Q3gu), while kaempferol and laricitrin were found in lower concentrations [22]. This predominance of quercetin derivatives may be attributed to its greater natural abundance in grape skins [25].
Interestingly, in the red wines analyzed, GFlo were generally found at higher concentrations than their aglycone counterparts, which are in agreement with most of the studies that indicate that flavonols in wines are predominantly present in their glycosylated forms [30,31,32]. In contrast, results obtained for Australian red wines [22] found higher contents of the free flavonols or aglycones. This discrepancy could be explained by differences in vinification techniques between both regions or to variations in enzymatic activity during fermentation. Specifically, differences in the activity of β-glucosidases and other hydrolytic enzymes, which cleave glycosidic bonds and release aglycones, might result in a higher retention of glycosylated flavonols in the Canary red wines [32]. Additionally, factors such as pH, fermentation temperature, and maceration time could influence the relative abundance of glycosylated versus the corresponding free flavonols [31]. For instance, acidic conditions can promote hydrolysis, leading to the release of aglycones [33].
When the non-visible flavonoids (flavanols and flavonols) were compared with visible flavonoids (anthocyanins) obtained in our previous study [15], it was observed that, in general, flavanol content exceeded anthocyanin content, except in highly pigmented cultivars (S, C, and R), where anthocyanin concentrations were nearly double those of flavanols. This suggests that anthocyanin biosynthesis and accumulation might vary more significantly by grape cultivar than flavanol production, possibly influenced by genetic factors and ripening conditions. T cultivar exhibited the highest flavanol concentration, which could result in red wines with more structured tannins and an increased astringency. Flavanols, particularly catechins and epicatechins, are precursors to condensed tannins (proanthocyanidins), which impact the texture, mouthfeel, and aging potential of red wines [34].
On the other hand, the flavonol concentrations were lower than anthocyanin concentrations for red wines produced from most of the cultivars, except for N cultivar. This unusual profile obtained in N cultivar could be explained by differences in grape skin thickness or similar specific varietal traits that could favor a higher flavonol accumulation than anthocyanins [35]. Additionally, differences in anthocyanin stability, polymerization, and degradation during winemaking and aging in this cultivar may also play a role in its differential behavior observed.
The variation in GFlo according to grape cultivars observed in this study confirms a strong cultivar influence on flavonol biosynthesis in single-cultivar red wines. This aligns with previous findings that flavonol accumulation is highly dependent on genetic factors and environmental conditions, particularly UV exposure [26]. Notwithstanding this genetic variability, flavonoid concentrations measured in red wines produced from the Canary Islands autochthonous cultivars align with the typical ranges documented in existing literature [1]. Wines derived from international grape cultivars generally exhibited elevated levels of most flavonols compared to those from local cultivars. This observation aligns with prior studies conducted in different viticultural regions, reflecting the preference for international cultivars in red wine production owing to their enhanced color stability during aging. Comparing our results obtained for the S and M cultivars, the flavonol contents were similar to those obtained in mainland Spain [23].
The higher flavonol concentrations observed in red wines elaborated from S, C, and R cultivars, with respect to red wines from traditional Canary grape cultivars, suggest that foreign cultivars (such as S and R) could respond differently to UV radiation and flavonoid biosynthesis compared to autochthonous cultivars which are obviously more adapted to the environment. This could be due to differences in the expression of key flavonoid biosynthesis genes, which modulate flavonol accumulation in response to sunlight [36]. In this context, Q3gu, Q3gl, and Mder were particularly abundant in red wines from S and C cultivars, suggesting they might contribute to grape oxidative stability and self-preservation. Flavonols, particularly Qder and Mder, are known to act as photoprotective compounds in grape skins and leaves, mitigating UV-induced oxidative stress and enhancing resilience [37].
The higher FTot, Q3gu, Q3gl, and Mder contents observed in in red wines from S, C, and R cultivars could also suggest a greater potential for long-term color stability and oxidative resistance. This could be due to that flavonols interact with anthocyanins, delaying their polymerization into more stable pigments, which is critical for maintaining wine color during aging [38]. In contrast, the lower flavonol concentrations obtained in red wines from V and B cultivars could make these cultivars more prone to color degradation and oxidative browning, as flavonols are known to inhibit oxidation reactions and stabilize wine color by copigmentation effects [39]. Flavonol profiling provides valuable markers for wine authentication and classification, as distinct flavonol compositions among cultivars can help differentiate traditional Canary wines from foreign cultivars [24].

4.1.2. Geographical Origin

The impact of geographical origin on the non-visible phenolic composition of Canary Island red wines is evident in this study, corroborating previous findings that terroir—including factors like climate and soil composition—significantly affects wine flavonoid profile [15]. In terms of flavanols, Cate and Epic were significantly higher in red wines from El Hierro and Gran Canaria islands, suggesting that these wines may have a stronger tannic structure and greater aging potential [40].
Variations in temperature and sunlight exposure can, in general, alter the biosynthesis of phenolic compounds, leading to regional differences in wine profiles [41]. The observed variations in flavonol levels may be attributed to differences in UV radiation exposure, as flavonol biosynthesis is known to be a protective response to UV light [42]. In this sense, red wines from Lanzarote and Tenerife Islands exhibited the highest flavonol concentrations. The environments with more exposure to the action of UV radiation of Lanzarote and some areas from the south of Tenerife could stimulate flavonol biosynthesis as a protective mechanism. The elevated Qder and Mder levels in red wines produced in Lanzarote Island further suggest an adaptive response favoring specifically the synthesis of these antioxidant derivatives. In contrast, the lower flavonol levels observed in red wines from La Gomera and El Hierro indicate a reduced level of environmental stress in terms of UV radiation. In fact, the intensity of solar radiation in La Gomera and El Hierro Islands is significantly lower than those radiations observed in Lanzarote Island and south Tenerife [43].
Rutin and Myri concentrations differences observed in red wines among the islands of production also suggest variations in flavonol biosynthesis pathways, but with a less significant differentiation. This may be related to a greater dispersion between the concentrations of these compounds in the red samples, as they might be more influenced by cultivar differences among local grape populations or winemaking techniques than from the effect of geographical areas.
Within Tenerife Island, there are five denominations of origin (DOs) because of the diversity in terroir [44]. DO T seem to be favorable for flavanol retention; red wines from this DO T showed the highest mean TFla and Cate concentrations, while similar mean Epic concentrations were observed in all the DOs. These differences possibly could be due to changes in the skin extraction or cultivar differences [40]. Flavonol profiles further reinforce regional differentiation, with higher Q3gu, Q3gl, and FTot in DO G, suggesting a greater accumulation of Qder in response to the higher sun exposure and UV radiation detected in this DO [36]. It is interesting to note the lower M3gl levels in DO G, despite its high TFlo content. Additionally, those vineyards within Tenerife Island with the most sun exposure (DO G and DO O) presented the highest GFlo, AFlo, and flavonol derivatives, which suggest a distinct chemical signature that could enhance wine traceability.

4.1.3. Aging

The aging process significantly influenced the non-visible flavonoid composition of red wines. In relation to flavanols, Cate concentrations remained stable with aging, while Epic concentrations significantly increased in older wines (≥6 years of aging). This increase in mean Epic concentration could be due to its specific selection by winemakers for aging, as these wines were considered more suitable for consumption after some time in the bottle, or due to an increase in its concentration over time.
Notable differences in flavonol profiles were observed depending on the specific compound. While M3gu, M3gl, and K3gl remained stable according to aging, L3gl, Q3gu, Q3gl, Ruti, and Myri showed a clear decline in aged wines, finding significant differences particularly in red wines ≥6 years old. This agrees with the fact that the flavonols degrade over time [32], possibly due to oxidative reactions or reduced extraction during bottle aging. In contrast, S3gl concentrations increased with aging, suggesting a potential conversion of other major flavonols into this minor derivative glucoside over time, which has not been previously described.
TFlo, GFlo, and Qder significantly lowered in aged wines, confirming the decrease in most of the flavonols over time [33]. Unlike the pattern of Qder, Mder and Ider remained relatively stable, suggesting that these derivatives may be less susceptible to degradation compared to Qder.

4.2. Bivariate Analysis

The strong association between Cate and Epic aligns with previous findings, supporting that flavanols are synthesized through a shared pathway [29]. Additionally, the significant correlations among individual flavonols, such as quercetin, myricetin, and isorhamnetin, suggest that it must have common enzymatic modifications, particularly glycosylation processes, that regulate their solubility and stability [31,32].
In spite of the high diversity of the red wine samples, an interesting and highly significant correlation between the anthocyanin concentrations, whose detailed content was analyzed in a previous study [15], and flavonols has been described in Figure 4. This association could support the role of these flavonoid compounds in the color stabilization of red wines through copigmentation [39]. Given the high heterogeneity of the red wine samples analyzed, the unexpected correlation observed in this figure should be carefully analyzed. Winemaking grapes arriving at a winery have different anthocyanin and flavonol contents and profiles. Therefore, the strong correlation obtained suggests that combined extraction processes, including copigmentation, may play an important role as an additional driving force in transferring these compounds from grapes to wine. Another hypothesis is that their natural biosynthesis is balanced; however, this alone may not explain such a high correlation in wine content across different cultivars, islands, and aging conditions. It is likely that both factors are interrelated. In fact, a previous study focused exclusively on Australian red wines from the Shiraz cultivar suggested that the anthocyanins might increase tannin (including flavanols) solubility and extraction into wine [45]. According to our results, anthocyanin concentration does not correlate with flavanols (r = 0.0325), but instead, it could increase the solubility and extraction of flavonols, enhancing their final concentration in wines as a result. Additionally, some individual flavonols such as quercetin and isorhamnetin showed significant correlations with anthocyanins, which could be associated with their potential role in copigmentation [46].

4.3. Multivariate Analysis

The PCA plot shows that the positive side of Factor 1 is predominantly related to Qder and GFlo, which are near Q3gu, Q3gl, Mder, and Myri (Figure S1). This might suggest that Quer and Myri-derived compounds share common metabolic pathways or co-exist in similar conditions within the red wine matrix. In fact, a previous study [23] selected Myri and Quer to PC 1 to explain the variance of its red wine samples. In our study, Ider and other minor flavonols (L3gl, S3gl) also cluster in this region, indicating their similar role in wine.
On the negative side of Factor 1, flavanols (Cate, Epic, and TFlav) were positioned separately. This separation highlights the distinct biosynthetic and functional roles of flavanols compared to flavonols and their derivatives [31]. Moreover, the flavanols are much more associated with mouthfeel properties, because of their role in astringency [34], than flavonols, while the flavonols are more related to long-term color retention [39]. Anyhow, both groups of flavonoid compounds are involved in the potential aging of red wines.
Factor 2 contributes mainly to the differentiation between Ider and M3gl, and to a lesser extent, Mder, suggesting potential differences between their concentration or wine structural roles. It is interesting to note the distinct positioning of Mder and M3gl with respect to other flavonoids, which suggests they may have unique interactions or degradation pathways that differentiate from them.
In terms of the application of LDA to classify red wines using non-visible flavonoids according to cultivars, the data obtained herein showed better classification performance than previous studies involving international cultivars and only flavonols, where 73.1% of the variance was explained [23]. This suggests that the combined use of flavanols and flavonols may increase the accuracy of the model.
When comparing the accuracy of the classifications obtained using LDA on the non-visible flavonoids (flavanols and flavonols) with those classifications in our previous study, which used visible flavonoids (anthocyanins) [15], it is evident that the prediction model based on flavanols and flavonols improves accuracy according to both grape cultivar (from 75.6% to 82.9%) and precedence island (from 75.9% to 84.9%). Thus, the non-visible flavonoids may serve as more robust chemical markers for differentiating grape cultivars and geographical provenance, likely due to their greater stability compared to anthocyanins [9]. In contrast, the classification accuracy for designations of DOs within Tenerife showed minimal improvement (from 65.8% to 66.7%), indicating that flavonoid composition alone may not sufficiently discriminate between DOs in this region. This could be explained by overlapping environmental factors and viticultural practices that contribute to similar flavonoid profiles across different DOs on the same island [47]. While flavonol profiles could be useful for broader geographical differentiation, their effectiveness may diminish at more localized scales where growing conditions and practices are comparable.
Interestingly, the predictive accuracy for wine aging classification decreased slightly when using flavanols and flavonols (from 86.3% to 81.5%) in relation to the classification using anthocyanins [15]. This suggests that visible flavonoids, particularly anthocyanins, might be more reliable indicators of aging status, likely due to their progressive degradation, oxidation, and polymerization over time [48]. Although flavonols and flavanols are involved in red wine aging, they are generally more stable and less directly impacted by oxidative reactions, which might explain their lower predictive power for distinguishing aging categories [49].

5. Conclusions

The variability among individual and derivative flavonoids indicates that the flavonol profile could serve as a chemical marker for the differentiation of red wines according to grape cultivars, aging, and origin, enhancing traceability and quality control. Red wines from foreign cultivars exhibited higher flavonol concentrations than traditional Canary cultivars, possibly due to different responses to UV radiation and biosynthetic regulation. Significant differences in non-visible flavonoid concentrations according to island origin confirm the influence of geographical factors on wine composition. Distinctive flavonoid profiles were especially evident in La Gomera and Lanzarote, whereas Gran Canaria and Tenerife showed considerable overlap. Wines from areas with greater solar exposure and environmental stress, such as Lanzarote or the southern Tenerife, had higher flavonol concentrations. Within Tenerife, a strong terroir effect on flavonoid composition was observed, although differentiation by DO using non-visible flavonoids did not surpass that achieved with anthocyanins.
Flavonols generally decreased over time, suggesting extended aging reduces antioxidant and color-stabilizing compounds, potentially affecting sensory properties and aging capability. Notably, S3gl concentrations increased with aging, though further investigation is needed. An unexpected correlation between flavonols and anthocyanins was observed, potentially informing new strategies to optimize wine stability and color retention.
Multivariate analysis confirmed that non-visible flavonoids effectively differentiate red wines by grape cultivar and geographical origin, outperforming visible flavonoids in classification accuracy. These findings highlight the potential of phenolic profiling combined with chemometrics for wine authentication and quality assurance.
While the interaction between grape variety and geographical area was not explored in this study, it is an interesting avenue for future research. The primary focus of this work was to independently analyze the impact of grape variety and geographical origin on flavonoid concentrations. However, a more detailed exploration of this interaction could be considered in future studies with a differently structured dataset to further clarify any synergistic effects.
This research also provides insights for technological advancements in wine production, suggesting targeted vineyard and winemaking practices to optimize phenolic composition and wine aging potential. Controlled vineyard stress management could enhance flavonol content, improving wine quality and health-related properties. Further studies on environmental influences like altitude and vineyard management are recommended, alongside advanced analytical and machine learning approaches to enhance classification accuracy.

Supplementary Materials

The following supporting information can be downloaded at: https://www.mdpi.com/article/10.3390/app15084543/s1, Figure S1: Projections of flavonoids on the factor analysis in space defined by the two first factors; Table S1: Abbreviations of the non-colored flavonoid compounds considered in this study and means of identification (retention time, wavelength detection, characteristic wavelength, commercial standard and scientific literature employed); Table S2: Non-visible flavonoids (mg/L) according to the DO from Tenerife Island; Table S3: Results of non-visible flavonoid concentrations (mg/L) according to aging.

Author Contributions

Conceptualization, C.D.-R. and J.H.-R.; methodology, C.D.-R.; software, J.H.-R.; validation, C.D.-R.; formal analysis, J.H.-R.; investigation, J.H.-R.; resources, C.D.-R.; data curation, C.D.-R.; writing—original draft preparation, J.H.-R.; writing—review and editing, C.D.-R. and N.B.-B.; visualization, J.H.-R.; supervision, C.D.-R.; project administration, J.H.-R.; funding acquisition, C.D.-R. All authors have read and agreed to the published version of the manuscript.

Funding

This research received no external funding.

Institutional Review Board Statement

Not applicable.

Informed Consent Statement

Not applicable.

Data Availability Statement

The data presented in this study are available on request from the corresponding author. The data are not publicly available due to confidentiality agreements with the participating wineries.

Acknowledgments

We acknowledge Canary Island wineries for their support with the samples.

Conflicts of Interest

The authors declare no conflicts of interest.

References

  1. Gutiérrez-Escobar, R.; Aliaño-González, M.J.; Cantos-Villar, E. Wine polyphenol content and its influence on wine quality and properties: A review. Molecules 2021, 26, 718. [Google Scholar] [CrossRef] [PubMed]
  2. Taniguchi, M.; LaRocca, C.A.; Bernat, J.D.; Lindsey, J.S. Digital database of absorption spectra of diverse flavonoids enables structural comparisons and quantitative evaluations. J. Nat. Prod. 2023, 86, 1087–1119. [Google Scholar] [CrossRef]
  3. He, F.; Mu, L.; Yan, G.; Liang, N.; Pan, Q.; Wang, J.; Reeves, M.J.; Duan, C. Biosynthesis of anthocyanins and their regulation in colored grapes. Molecules 2010, 15, 9057–9091. [Google Scholar] [CrossRef] [PubMed]
  4. Cheynier, V. Polyphenols in foods are more complex than often thought. Am. J. Clin. Nutr. 2005, 81, 223S–229S. [Google Scholar] [CrossRef]
  5. Dixon, R.A.; Paiva, N.L. Stress-induced phenylpropanoid metabolism. Plant Cell 1995, 7, 1085. [Google Scholar] [CrossRef]
  6. Xie, D.; Sharma, S.B.; Paiva, N.L.; Ferreira, D.; Dixon, R.A. Role of anthocyanidin reductase, encoded by BANYULS in plant flavonoid biosynthesis. Science 2003, 299, 396–399. [Google Scholar] [CrossRef]
  7. Bogs, J.; Downey, M.O.; Harvey, J.S.; Ashton, A.R.; Tanner, G.J.; Robinson, S.P. Proanthocyanidin synthesis and expression of genes encoding leucoanthocyanidin reductase and anthocyanidin reductase in developing grape berries and grapevine leaves. Plant Physiol. 2005, 139, 652–663. [Google Scholar] [CrossRef] [PubMed]
  8. Ferrer, J.; Austin, M.B.; Stewart Jr, C.; Noel, J.P. Structure and function of enzymes involved in the biosynthesis of phenylpropanoids. Plant Physiol. Biochem. 2008, 46, 356–370. [Google Scholar] [CrossRef]
  9. Mattivi, F.; Guzzon, R.; Vrhovsek, U.; Stefanini, M.; Velasco, R. Metabolite profiling of grape: Flavonols and anthocyanins. J. Agric. Food Chem. 2006, 54, 7692–7702. [Google Scholar] [CrossRef]
  10. Agati, G.; Tattini, M. Multiple functional roles of flavonoids in photoprotection. New Phytol. 2010, 186, 786–793. [Google Scholar] [CrossRef]
  11. Obreque-Slier, E.; Peña-Neira, Á.; López-Solís, R.; Zamora-Marín, F.; Ricardo-da Silva, J.M.; Laureano, O. Comparative study of the phenolic composition of seeds and skins from Carménère and Cabernet Sauvignon grape varieties (Vitis vinifera L.) during ripening. J. Agric. Food Chem. 2010, 58, 3591–3599. [Google Scholar] [CrossRef]
  12. Versari, A.; Laurie, V.F.; Ricci, A.; Laghi, L.; Parpinello, G.P. Progress in authentication, typification and traceability of grapes and wines by chemometric approaches. Food Res. Int. 2014, 60, 2–18. [Google Scholar] [CrossRef]
  13. Badia-Melis, R.; Mishra, P.; Ruiz-García, L. Food traceability: New trends and recent advances. A review. Food Control 2015, 57, 393–401. [Google Scholar] [CrossRef]
  14. Koljančić, N.; Furdíková, K.; de Araújo Gomes, A.; Špánik, I. Wine authentication: Current progress and state of the art. Trends Food Sci. Technol. 2024, 150, 104598. [Google Scholar] [CrossRef]
  15. Heras-Roger, J.; Díaz-Romero, C. From Vine to Wine: Coloured Phenolics as Fingerprints. Appl. Sci. 2025, 15, 1755. [Google Scholar] [CrossRef]
  16. Ibern-Gómez, M.; Andrés-Lacueva, C.; Lamuela-Raventós, R.M.; Waterhouse, A.L. Rapid HPLC analysis of phenolic compounds in red wines. Am. J. Enol. Vitic. 2002, 53, 218–221. [Google Scholar] [CrossRef]
  17. Baiano, A.; Terracone, C. Varietal differences among the phenolic profiles and antioxidant activities of seven table grape cultivars grown in the south of Italy based on chemometrics. J. Agric. Food Chem. 2011, 59, 9815–9826. [Google Scholar] [CrossRef]
  18. Ginjom, I.; D’Arcy, B.; Caffin, N.; Gidley, M. Phenolic compound profiles in selected Queensland red wines at all stages of the wine-making process. Food Chem. 2011, 125, 823–834. [Google Scholar] [CrossRef]
  19. Meng, J.; Fang, Y.; Qin, M.; Zhuang, X.; Zhang, Z. Varietal differences among the phenolic profiles and antioxidant properties of four cultivars of spine grape (Vitis davidii Foex) in Chongyi County (China). Food Chem. 2012, 134, 2049–2056. [Google Scholar] [CrossRef]
  20. Hernández, T.; Estrella, I.; Carlavilla, D.; Martín-Álvarez, P.J.; Moreno-Arribas, M.V. Phenolic compounds in red wine subjected to industrial malolactic fermentation and ageing on lees. Anal. Chim. Acta 2006, 563, 116–125. [Google Scholar] [CrossRef]
  21. Milbury, P.E.; Chen, C.; Dolnikowski, G.G.; Blumberg, J.B. Determination of flavonoids and phenolics and their distribution in almonds. J. Agric. Food Chem. 2006, 54, 5027–5033. [Google Scholar] [CrossRef] [PubMed]
  22. Jeffery, D.W.; Parker, M.; Smith, P.A. Flavonol composition of Australian red and white wines determined by high-performance liquid chromatography. Aust. J. Grape Wine Res. 2008, 14, 153–161. [Google Scholar] [CrossRef]
  23. Castillo-Muñoz, N.; Gómez-Alonso, S.; García-Romero, E.; Hermosín-Gutiérrez, I. Flavonol profiles of Vitis vinifera red grapes and their single-cultivar wines. J. Agric. Food Chem. 2007, 55, 992–1002. [Google Scholar] [CrossRef] [PubMed]
  24. Hermosín-Gutiérrez, I.; Castillo-Muñoz, N.; Gómez-Alonso, S.; García-Romero, E. Flavonol profiles for grape and wine authentication. In Progress in Authentication of Food and Wine; ACS Publications: Washington, DC, USA, 2011; pp. 113–129. [Google Scholar]
  25. Makris, D.P.; Kallithraka, S.; Kefalas, P. Flavonols in grapes, grape products and wines: Burden, profile and influential parameters. J. Food Compos. Anal. 2006, 19, 396–404. [Google Scholar] [CrossRef]
  26. Martínez-Lüscher, J.; Brillante, L.; Kurtural, S.K. Flavonol profile is a reliable indicator to assess canopy architecture and the exposure of red wine grapes to solar radiation. Front. Plant Sci. 2019, 10, 10. [Google Scholar] [CrossRef]
  27. Theocharis, S.; Gkrimpizis, T.; Karadimou, C.; Alatzas, A.; Koundouras, S.; Taskos, D. Modulating ‘Xinomavro’(Vitis vinifera L.) Vine Growth and Berry Composition: A Comparative Analysis of Rootstock Effects. Horticulturae 2024, 10, 490. [Google Scholar] [CrossRef]
  28. Gordillo, B.; Rivero, F.J.; Jara-Palacios, M.J.; González-Miret, M.L.; Heredia, F.J. Impact of a double post-fermentative maceration with ripe and overripe seeds on the phenolic composition and color stability of Syrah red wines from warm climate. Food Chem. 2021, 346, 128919. [Google Scholar] [CrossRef]
  29. Padilla-González, G.F.; Grosskopf, E.; Sadgrove, N.J.; Simmonds, M.S. Chemical diversity of Flavan-3-Ols in grape seeds: Modulating factors and quality requirements. Plants 2022, 11, 809. [Google Scholar] [CrossRef]
  30. Castillo-Muñoz, N.; Gómez-Alonso, S.; García-Romero, E.; Gómez, M.V.; Velders, A.H.; Hermosín-Gutiérrez, I. Flavonol 3-O-glycosides series of Vitis vinifera cv. Petit Verdot red wine grapes. J. Agric. Food Chem. 2009, 57, 209–219. [Google Scholar] [CrossRef]
  31. Casassa, L.F.; Harbertson, J.F. Extraction, evolution, and sensory impact of phenolic compounds during red wine maceration. Annu. Rev. Food Sci. Technol. 2014, 5, 83–109. [Google Scholar] [CrossRef]
  32. Vendramin, V.; Pizzinato, D.; Sparrow, C.; Pagni, D.; Cascella, F.; Carapelli, C.; Vincenzi, S. Prevention of quercetin precipitation in red wines: A promising enzymatic solution. OENO One 2022, 56, 41–51. [Google Scholar] [CrossRef]
  33. El Rayess, Y.; Nehme, N.; Azzi-Achkouty, S.; Julien, S.G. Wine phenolic compounds: Chemistry, functionality and health benefits. Antioxidants 2024, 13, 1312. [Google Scholar] [CrossRef]
  34. Ma, W.; Guo, A.; Zhang, Y.; Wang, H.; Liu, Y.; Li, H. A review on astringency and bitterness perception of tannins in wine. Trends Food Sci. Technol. 2014, 40, 6–19. [Google Scholar] [CrossRef]
  35. Rolle, L.; Torchio, F.; Ferrandino, A.; Guidoni, S. Influence of wine-grape skin hardness on the kinetics of anthocyanin extraction. Int. J. Food Prop. 2012, 15, 249–261. [Google Scholar] [CrossRef]
  36. Blancquaert, E.H.; Oberholster, A.; Ricardo-da-Silva, J.M.; Deloire, A.J. Grape flavonoid evolution and composition under altered light and temperature conditions in Cabernet Sauvignon (Vitis vinifera L.). Front. Plant Sci. 2019, 10, 1062. [Google Scholar] [CrossRef]
  37. Bouderias, S.; Teszlák, P.; Jakab, G.; Kőrösi, L. Age-and season-dependent pattern of flavonol glycosides in Cabernet Sauvignon grapevine leaves. Sci. Rep. 2020, 10, 14241. [Google Scholar] [CrossRef]
  38. Heras-Roger, J.; Darias-Rosales, J.; Díaz-Romero, C. Red wine color: The role of polymeric pigments and pyranoanthocyanins in SO2 bleachable methods. Ciência E Técnica Vitivinícola 2024, 39, 84–92. [Google Scholar] [CrossRef]
  39. T Escribano-Bailon, M.; Santos-Buelga, C. Anthocyanin copigmentation-evaluation, mechanisms and implications for the colour of red wines. Curr. Org. Chem. 2012, 16, 715–723. [Google Scholar] [CrossRef]
  40. Wang, Z.; Yang, J.; Ren, Y.; Yuan, C.; Wang, Z. The effects of the grape varieties and the wine aging periods on the tannin profiles and the astringency perceptions of wines. J. Food Meas. Charact. 2022, 16, 2726–2737. [Google Scholar] [CrossRef]
  41. Gouot, J.C.; Smith, J.P.; Holzapfel, B.P.; Walker, A.R.; Barril, C. Grape berry flavonoids: A review of their biochemical responses to high and extreme high temperatures. J. Exp. Bot. 2019, 70, 397–423. [Google Scholar] [CrossRef]
  42. Eder, R.; Šćepanović, R.P.; Raičević, D.; Popović, T.; Korntheuer, K.; Wendelin, S.; Forneck, A.; Philipp, C. Study of the effects of climatic conditions on the phenolic content and antioxidant activity of Austrian and Montenegrin red wines. OENO One 2023, 57, 69–85. [Google Scholar] [CrossRef]
  43. Spanish Meteorological Agency (AEMET). Available online: https://www.aemet.es/es/serviciosclimaticos/datosclimatologicos/valoresclimatologicos?k=coo (accessed on 12 February 2024).
  44. Rienth, M.; Vigneron, N.; Darriet, P.; Sweetman, C.; Burbidge, C.; Bonghi, C.; Walker, R.P.; Famiani, F.; Castellarin, S.D. Grape berry secondary metabolites and their modulation by abiotic factors in a climate change scenario—A review. Front. Plant Sci. 2021, 12, 643258. [Google Scholar] [CrossRef] [PubMed]
  45. Kilmister, R.L.; Mazza, M.; Baker, N.K.; Faulkner, P.; Downey, M.O. A role for anthocyanin in determining wine tannin concentration in Shiraz. Food Chem. 2014, 152, 475–482. [Google Scholar] [CrossRef]
  46. Heras-Roger, J.; Díaz-Romero, C.; Darias-Martín, J. What gives a wine its strong red color? Main correlations affecting copigmentation. J. Agric. Food Chem. 2016, 64, 6567–6574. [Google Scholar] [CrossRef] [PubMed]
  47. Fanzone, M.; Zamora, F.; Jofré, V.; Assof, M.; Gómez-Cordovés, C.; Peña-Neira, Á. Phenolic characterisation of red wines from different grape varieties cultivated in Mendoza province (Argentina). J. Sci. Food Agric. 2012, 92, 704–718. [Google Scholar] [CrossRef] [PubMed]
  48. He, F.; Liang, N.; Mu, L.; Pan, Q.; Wang, J.; Reeves, M.J.; Duan, C. Anthocyanins and their variation in red wines II. Anthocyanin derived pigments and their color evolution. Molecules 2012, 17, 1483–1519. [Google Scholar] [CrossRef]
  49. Kennedy, J.A.; Saucier, C.; Glories, Y. Grape and wine phenolics: History and perspective. Am. J. Enol. Vitic. 2006, 57, 239–248. [Google Scholar] [CrossRef]
Figure 1. Distribution of some flavanols (A) and flavonols (B) in wine according to aging. Different letters (a, b, ab) in each compound indicate the differences between means are significant (p < 0.05).
Applsci 15 04543 g001
Figure 2. Dispersion diagram for some of the flavonol correlations from Table 4 in wines. (A) Dispersion diagram for glycosilated flavonols and aglyconed flavonols wine concentration. (B) Dispersion diagram for isorhamnetin and isorhamnetin-3-glucoside wine concentration. (C) Dispersion diagram for quercetin-3-glucuronide and myricetin wine concentration. (D) Dispersion diagram for quercetin-3-glucuronide and quercetin-3-glucoside concentration.
Applsci 15 04543 g002
Figure 3. Dispersion diagram for quercetin, myricetin, and isorhamnetin derivatives in wines.
Applsci 15 04543 g003
Figure 4. Relationship between anthocyanin and flavonol content in single-cultivar red wines.
Applsci 15 04543 g004
Table 1. Wine samples distribution with cultivar and DO abbreviations.
Samples Distribution by Different Characteristics
Geographical Origin (D.O.)nVine CultivarnWine aging (years)n
Abona (A.)46Listan Negro (LN)93Young (≤2)125
Tacoronte-Acentejo (TA.)45Baboso (B)30Medium (3–5)73
Valle de la Orotava (O.)27Vijariego (V)17Old (≥6)7
Ycoden Daute Isora (Y.)18Negramoll (N)13
El Hierro (H.)18Listán Prieto (LP)14
La Palma (LP.)15Syrah (S)12Total number of samples:
Gran Canaria (GC.)13Tintilla (T)9205
Valle de Güímar (G.)10Castellana (C)7
Lanzarote (LZ.)7Rubí Cabernet (R)5
La Gomera (GO.)6Merlot (M)5
Table 2. Mean and standard deviation of flavonoids (mg/L) according to the grape cultivar.
VNLPBTLNMSCR
Cate32.68 ab
(9.79)
34.31 abc
(25.93)
27.12 a
(15.26)
43.84 bc
(16.62)
64.72 d
(28.91)
35.81 abc
(11.84)
37.21 abc
(11.05)
48.96 c
(14.54)
48.13 c
(10.45)
42.04 abc
(13.05)
Epic68.03 a
(24.46)
72.94 a
(29.54)
53.27 a
(34.31)
75.74 ab
(33.15)
99.99 b
(48.62)
60.82 a
(23.10)
62.24 a
(22.86)
62.35 a
(38.96)
53.40 a
(10.57)
49.40 a
(17.88)
TFla100.71 ab
(26.89)
107.25 ab
(50.47)
80.39 a
(44.94)
119.58 b
(42.20)
164.71 c
(65.89)
96.63 ab
(28.03)
99.45 ab
(32.12)
111.31 ab
(51.36)
101.52 ab
(12.76)
91.45 ab
(30.86)
M3gu0.39 b
(0.22)
0.17 a
(0.12)
0.40 b
(0.13)
0.25 ab
(0.15)
0.36 ab
(0.31)
0.28 ab
(0.22)
0.44 b
(0.22)
0.43 b
(0.30)
0.45 b
(0.31)
0.32 ab
(0.26)
M3gl10.10 cd
(2.23)
12.73 de
(3.55)
15.03 e
(6.12)
6.35 ab
(3.14)
4.63 ab
(3.84)
12.03 de
(5.23)
8.30 bcd
(3.61)
5.51 ab
(3.65)
8.28 bcd
(6.95)
3.55 a
(1.41)
L3gl1.81 ab
(0.84)
2.20 abc
(0.92)
1.86 b
(0.69)
1.71 ab
(0.71)
2.59 abc
(0.80)
2.62 bc
(1.14)
1.55 a
(0.39)
3.01 cd
(1.76)
2.36 bc
(0.83)
3.61 d
(1.50)
K3gl0.57 a
(0.37)
0.39 a
(0.11)
0.37 a
(0.14)
0.40 a
(0.16)
0.45 a
(0.15)
0.42 a
(0.17)
0.39 a
(0.17)
0.53 a
(0.48)
0.43 a
(0.19)
0.45 a
(0.13)
Myri3.35 a
(2.08)
4.36 ab
(1.96)
5.00 ab
(3.62)
4.31 b
(3.23)
6.53 ab
(3.94)
7.40 bc
(3.40)
11.14 d
(4.08)
12.10 d
(3.67)
10.24 cd
(2.54)
10.74 d
(5.34)
Q3gu6.39 a
(2.77)
10.72 ab
(3.67)
14.90 cd
(9.90)
8.57 ab
(4.91)
9.77 ab
(5.31)
13.68 bcd
(5.82)
19.27 de
(7.10)
22.94 e
(9.43)
15.66 cd
(6.83)
15.65 cd
(5.44)
Q3gl3.37 a
(1.34)
7.57 abc
(3.12)
12.57 def
(8.52)
5.19 ab
(3.41)
5.00 abc
(3.73)
8.93 bcd
(4.50)
14.01 ef
(5.48)
16.43 f
(8.46)
11.34 cde
(4.57)
7.05 abc
(2.64)
Ruti4.04 a
(2.96)
4.35 a
(1.91)
4.50 a
(3.48)
6.08 a
(4.35)
7.98 ab
(8.09)
8.43 abc
(5.24)
7.90 ab
(4.69)
10.90 bc
(6.40)
13.04 c
(4.85)
13.00 c
(4.22)
I3gl3.25 a
(1.47)
3.24 a
(1.88)
3.87 ab
(2.39)
3.67 ab
(1.63)
4.44 abc
(1.56)
3.71 ab
(1.58)
5.82 c
(1.56)
7.73 d
(3.76)
3.78 ab
(1.82)
5.41 bc
(2.24)
Isor2.95 ab
(1.58)
2.91 ab
(1.88)
2.17 a
(1.32)
3.05 ab
(1.36)
3.95 bc
(1.45)
3.08 ab
(1.46)
5.63 de
(2.10)
6.90 e
(3.54)
2.84 ab
(1.34)
5.00 cd
(2.95)
S3gl0.60 ab
(0.69)
0.32 a
(0.32)
0.35 ab
(0.34)
0.57 ab
(0.53)
0.91 b
(1.23)
0.48 ab
(0.53)
0.72 ab
(0.50)
0.87 ab
(0.54)
0.50 ab
(0.20)
0.58 ab
(0.23)
Quer2.40 ab
(2.03)
5.34 c
(3.61)
3.95 abc
(3.08)
2.03 a
(1.68)
2.08 a
(2.73)
2.11 a
(2.14)
4.58 bc
(3.20)
4.01 bc
(2.96)
1.77 a
(2.12)
4.02 abc
(3.00)
AFlo8.35 a
(4.02)
12.24 ab
(5.86)
11.15 ab
(7.15)
9.39 a
(4.86)
12.46 ab
(3.58)
12.41 ab
(5.03)
21.78 d
(6.71)
22.90 d
(7.17)
15.32 bc
(4.39)
19.67 cd
(8.27)
GFlo26.48 a
(5.96)
37.35 ab
(9.58)
49.34 bc
(22.21)
26.70 a
(11.36)
28.31 a
(8.92)
42.16 b
(13.71)
50.50 bc
(15.63)
57.45 c
(21.75)
42.78 b
(18.69)
36.60 ab
(9.27)
Qder12.16 a
(4.37)
23.63 bc
(8.88)
31.41 cd
(20.54)
15.79 ab
(8.72)
16.85 ab
(8.84)
24.72 bc
(10.64)
37.86 de
(13.60)
43.38 e
(17.40)
28.77 cd
(12.89)
26.72 bc
(8.10)
Mder13.84 ab
(3.19)
17.26 bc
(4.11)
20.42 c
(7.97)
10.9 a
(5.11)
11.52 a
(4.23)
19.72 bc
(6.54)
19.88 c
(6.46)
18.04 bc
(5.42)
18.97 bc
(7.14)
14.61 abc
(4.07)
Ider6.20 a
(2.97)
6.16 a
(3.72)
6.62 a
(3.61)
6.72 a
(2.83)
8.40 ab
(2.71)
6.79 a
(2.91)
11.46 b
(3.46)
14.63 c
(7.11)
6.62 a
(3.11)
10.41 b
(5.14)
TFlo35.19 a
(8.44)
49.96 abc
(14.03)
60.45 cd
(28.64)
36.10 a
(15.38)
40.87 ab
(11.74)
54.76 bcd
(17.73)
71.85 de
(19.51)
80.45 e
(27.26)
57.64 bcd
(21.97)
56.37 bcd
(15.12)
Standard deviations are provided between brackets Distinct letters within a row signify significant differences between means (p < 0.05). The grape cultivar abbreviations are as follows: LN (Listán Negro), B (Baboso), V (Vijariego), N (Negramoll), LP (Listán Prieto), S (Syrah), T (Tintilla), C (Castellana), R (Rubí Cabernet), and M (Merlot). Flavonol abbreviations: Cate: catechin; Epic: epicatechin; TFla: total flavanols; M3gu: myricetin-3-glucuronide; M3gl: myricetin-3-glucoside; L3gl: laricitrin-3-glucoside; K3gl: kaempferol-3-glucoside; Myri: myricetin; Q3gu: quercetin-3-glucuronide; Q3gl: quercetin-3-glucoside; Ruti: rutin; I3gl: isorhamnetin-3-glucoside; Isor: isorhamnetin; S3gl: syringetin-3-glucoside; Quer: quercetin; AFlo: aglyconed flavonols; GFlo: glycosided flavonols; Qder: quercetin derivatives; Mder: myricetin derivatives; Ider: isorhamnetin derivatives; TFlo: total flavonols.
Table 3. Mean and standard deviation of non-visible flavonoid concentration (mg/L) according to the precedence island.
El HierroLa GomeraLa PalmaGran CanariaLanzaroteTenerife
Cate32.46 ab
(10.60)
25.17 a
(7.40)
23.47 a
(7.66)
46.59 c
(31.63)
33.76 abc
(12.46)
41.57 bc
(15.48)
Epic86.55 b
(25.29)
36.69 a
(13.88)
63.81 b
(19.78)
63.75 b
(34.79)
65.4 b
(22.95)
64.34 b
(29.38)
TFla119.01 b
(29.15)
61.86 a
(19.79)
88.76 ab
(24.88)
110.35 b
(48.51)
99.16 b
(30.47)
104.90 b
(40.88)
M3gu0.36 ab
(0.22)
0.19 a
(0.09)
0.24 ab
(0.21)
0.4 b
(0.25)
0.3 ab
(0.22)
0.31 ab
(0.22)
M3gl8.69 a
(2.67)
10.08 a
(4.51)
15.32 a
(4.31)
11.91 ab
(5.36)
15.51 a
(7.21)
9.31 a
(5.50)
L3gl1.27 a
(0.21)
1.78 ab
(0.80)
2.28 b
(0.84)
2.31 b
(1.04)
1.93 ab
(0.41)
2.59 b
(1.20)
K3gl0.44 ab
(0.12)
0.36 a
(0.15)
0.36 a
(0.09)
0.64 b
(0.44)
0.43 ab
(0.19)
0.44 ab
(0.24)
Myri2.43 a
(1.50)
3.61 a
(2.25)
3.79 a
(2.04)
5.11 ab
(3.12)
9.87 c
(3.86)
7.99 bc
(3.99)
Q3gu6.07 a
(3.09)
8.49 a
(5.05)
9.78 ab
(4.41)
9.41 ab
(4.96)
22.27 c
(8.70)
14.3 b
(6.85)
Q3gl3.5 a
(2.06)
6.4 ab
(3.78)
7.45 ab
(3.74)
6.51 ab
(3.13)
18.02 c
(5.46)
9.11 b
(5.60)
Rutin3.58 a
(2.35)
4.33 a
(3.13)
4.23 a
(2.44)
4.3 a
(3.82)
6.7 ab
(4.89)
9.16 b
(5.55)
I3gl3.23 ab
(1.30)
2.32 a
(1.85)
2.55 a
(1.24)
3.66 ab
(1.85)
4.88 b
(2.97)
4.37 b
(2.11)
Isor3.21 ab
(1.34)
2.13 a
(1.72)
2.3 a
(1.37)
3.04 ab
(2.05)
4.11 b
(2.98)
3.55 ab
(1.97)
S3gl0.49 ab
(0.60)
0.36 a
(0.32)
0.3 a
(0.33)
0.87 b
(1.20)
0.4 ab
(0.36)
0.56 ab
(0.49)
Quer2.46 ab
(1.80)
2.15 ab
(2.16)
1.51 a
(3.39)
3.24 ab
(2.85)
3.91 b
(1.09)
2.54 ab
(2.50)
AFlo7.85 a
(3.65)
7.4 a
(4.97)
9.73 ab
(5.02)
11.17 abc
(6.63)
15.38 c
(6.63)
14.02 bc
(6.28)
GFlo24.04 a
(6.82)
29.97 ab
(14.67)
38.28 b
(10.42)
35.82 ab
(11.10)
63.73 c
(17.65)
41.0 b
(16.14)
Qder12.02 a
(5.72)
17.04 ab
(10.48)
21.15 ab
(9.55)
19.16 ab
(9.61)
41.80 c
(13.86)
25.96 b
(13.21)
Mder11.49 a
(3.65)
13.87 ab
(6.41)
19.35 b
(5.09)
17.42 b
(5.70)
25.67 c
(7.93)
17.61 b
(6.89)
Ider6.44 abc
(2.57)
4.45 a
(3.56)
4.86 ab
(2.55)
6.7 abc
(3.70)
8.99 c
(5.87)
7.92 bc
(3.94)
TFlo32.14 a
(9.84)
37.85 ab
(19.73)
48.29 ab
(14.58)
47.21 ab
(16.21)
79.22 c
(23.25)
55.08 b
(20.91)
Standard deviation was included between brackets. Different letters in each row indicate the differences between means are significant (p < 0.05). Flavonoid abbreviations: Cate: catechin; Epic: epicatechin; TFla: total flavanols; M3gu: myricetin-3-glucuronide; M3gl: myricetin-3-glucoside; L3gl: laricitrin-3-glucoside; K3gl: kaempferol-3-glucoside; Myri: myricetin; Q3gu: quercetin-3-glucuronide; Q3gl: quercetin-3-glucoside; Ruti: rutin; I3gl: isorhamnetin-3-glucoside; Isor: isorhamnetin; S3gl: syringetin-3-glucoside; Quer: quercetin; AFlo: aglyconed flavonols; GFlo: sugar-derived flavonols; Qder: quercetin derivatives; Mder: myricetin derivatives; Ider: isorhamnetin derivatives; TFlo: total flavonols.
Table 4. Correlations among the flavonoid concentrations (in mg/L) obtained in the red wine analyzed.
CateEpicM3guM3glL3glK3glMyriQ3guQ3glRutiI3glIsorS3glQuer
Cate10.430 **0.069−0.234 **0.253 **0.179 *0.341 **0.222 **0.0980.339 **0.400 **0.340 **0.287 **0.151 *
Epic0.00010.080−0.0380.0400.0220.0490.0560.0040.1180.267 **0.334 **−0.0220.277 **
M3gu0.3260.2551−0.0720.196 **0.0980.0580.0890.149 *−0.0530.1310.191 **0.0690.140 *
M3gl0.0010.5910.3021−0.1360.0960.0010.220 **0.250 **0.002−0.059−0.157 *−0.226 **0.042
L3gl0.0000.5680.0050.05210.233 **0.423 **0.308 **0.150 *0.457 **0.293 **0.253 **0.237 **0.065
K3gl0.0100.7580.1620.1720.00110.0840.042−0.0990.184 **0.1130.0540.240 **0.063
Myri0.0000.4890.4090.9900.0000.23210.832 **0.638 **0.733 **0.573 **0.427 **0.243 **0.076
Q3gu0.0010.4260.2070.0020.0000.5510.00010.900 **0.607 **0.684 **0.473 **0.149 *0.271 **
Q3gl0.1630.9600.0330.0000.0320.1570.0000.00010.293 **0.546 **0.374 **0.0480.297 **
Ruti0.0000.0910.4520.9810.0000.0080.0000.0000.00010.471 **0.334 **0.220 **−0.010
I3gl0.0000.0000.0610.4050.0000.1070.0000.0000.0000.00010.877 **0.309 **0.524 **
Isor0.0000.0000.0060.0250.0000.4390.0000.0000.0000.0000.00010.233 **0.591 **
S3gl0.0000.7530.3270.0010.0010.0010.0000.0330.4960.0020.0000.00110.112
Quer0.0310.0000.0450.5450.3550.3720.2810.0000.0000.8900.0000.0000.1091
Coefficient of correlation (r) are exposed above the diagonal, while those below represent p-values. ** The correlation is significant at p < 0.01 (two-tailed). * The correlation is significant between 0.01 and 0.05 (two-tailed). Flavonoid abbreviations: Cate: catechin; Epic: epicatechin; M3gu: myricetin-3-glucuronide; M3gl: myricetin-3-glucoside; L3gl: laricitrin-3-glucoside; K3gl: kaempferol-3-glucoside; Myri: myricetin; Q3gu: quercetin-3-glucuronide; Q3gl: quercetin-3-glucoside; Ruti: rutin; I3gl: isorhamnetin-3-glucoside; Isor: isorhamnetin; S3gl: syringetin-3-glucoside; Quer: quercetin.
Table 5. LDA outcomes for classifying red wines based on the considered influencing factors.
Influencing FactorsType of LDACorrect Classification
(% After Cross-Validation)
Selected Variables for
F1 and F2
1.
Grape Cultivar
All variables82.9%F1: M3gl, Ider, Isor, I3gl
(68.8%)F2: TFlo, GFlo, Qder
Stepwise62.4%F1: Myri, Isor, Q3gl
(58.0%)F2: M3gl, AFl, TFla, GFlo
2.
Precedence Island
All variables84.9%F1: Myri, Q3gu, AFlo
(73.7%)F2: L3gl, Quer
Stepwise73.2%F1: Myri, AFlo, Q3gu
(72.7%)F2: M3gl, Mder, GFlo
3.
Tenerife DO
All variables65.8%F1: Myri, I3gl, Ider
(49.3%)F2: Qder, TFlo, GFlo
Stepwise47.3%F1: Epic, Myri, I3gl
(45.2%)F2: Qder, Q3gl, AFlo
4.
Wine Aging
All variables81.5%F1: Isor, Quer, Cate
(76.6%)F2: L3gl, Ider, AFlo
Stepwise75.4%F1: K3gl, Isor, AFlo
(74.6%)F2: Myri, TFlo, Cate
Table 6. Correct and incorrect classification rates (%) obtained from the LDA used to distinguish red wines according to their grape cultivars.
Original →
↓ Predicted
LNNB LPTCRMVS
LN83.97.713.30.022.20.020.00.023.516.7
N0.092.33.30.00.00.00.00.05.90.0
B3.20.076.77.10.00.00.00.00.00.0
LP0.00.00.092.90.00.00.00.00.00.0
T3.20.00.00.077.80.00.00.00.00.0
C1.10.00.00.00.0100.00.00.00.00.0
R5.40.00.00.00.00.080.00.00.08.3
M0.00.00.00.00.00.00.0100.00.00.0
V3.20.06.70.00.00.00.00.070.60.0
S0.00.00.00.00.00.00.00.00.075.0
The first column represents the predicted cultivar, and the top row represents the real classification by cultivar. Grape cultivar abbreviations: LN: Listán Negro; N: Negramoll; B: Baboso; LP: Listán Prieto; T: Tintilla; C: Castellana; R: Rubí Cabernet; M: Merlot; V: Vijariego; S: Syrah.
Table 7. Correct classification rates (diagonal values) and misclassifications obtained from the LDA employed to differentiate red wines according to DO on Tenerife Island.
Original →
↓ Predicted
DO TDO ODO YDO GDO ALPHILZGOGC
DO T84.43.75.610.015.20.00.00.00.023.1
DO O6.792.616.70.06.56.70.00.00.00.0
DO Y0.00.055.60.06.50.00.00.00.00.0
DO G0.00.05.680.00.00.00.00.00.00.0
DO A4.40.05.610.071.70.00.00.00.07.7
LP0.00.00.00.00.093.30.00.00.00.0
HI0.00.05.60.00.00.0100.00.00.00.0
LZ0.03.70.00.00.00.00.0100.00.00.0
GO4.40.00.00.00.00.00.00.0100.00.0
GC0.00.05.60.00.00.00.00.00.069.2
The first column represents the predicted DO, and the top row represents the real classification by DO. Denomination of origin abbreviations: DO T: Tacoronte-Acentejo (Tenerife Island); DO O: Valle de la Orotava (Tenerife Island), DO Y: Ycoden Daute Isora (Tenerife Island); DO G: Valle de Güímar (Tenerife Island); DO A: Abona (Tenerife Island); LP: DO La Palma; HI: DO El Hierro; LZ: DO Lanzarote; GO: DO La Gomera; GC: DO Gran Canaria.
Disclaimer/Publisher’s Note: The statements, opinions and data contained in all publications are solely those of the individual author(s) and contributor(s) and not of MDPI and/or the editor(s). MDPI and/or the editor(s) disclaim responsibility for any injury to people or property resulting from any ideas, methods, instructions or products referred to in the content.

