Article

Comparing Workloads Among Different Age Groups in Official Masters’ Basketball Matches: Implications for Physical Activity

by
Dimitrios Pantazis
1,
Theodoros Stampoulis
1,
Dimitrios Balampanos
1,
Alexandra Avloniti
1,
Christos Kokkotis
1,
Panagiotis Aggelakis
1,
Maria Protopapa
1,
Dimitrios Draganidis
2,
Maria Emmanouilidou
1,
Nikolaos-Orestis Retzepis
1,
Anastasia Gkachtsou
1,
Stavros Kallidis
1,
Maria Koutra
1,
Nikolaos Zaras
1,3,
Maria Michalopoulou
1,
Antonis Kambas
1,
Ioannis G. Fatouros
2 and
Athanasios Chatzinikolaou
1,*
1
Department of Physical Education and Sport Science, School of Physical Education, Sport Science and Occupational Therapy, Democritus University of Thrace, 69100 Komotini, Greece
2
Department of Physical Education and Sport Science, School of Physical Education, Sport Science and Dietetics, University of Thessaly, 43100 Trikala, Greece
3
Department of Life Sciences, School of Life and Health Sciences, University of Nicosia, Nicosia 1700, Cyprus
*
Author to whom correspondence should be addressed.
Appl. Sci. 2025, 15(8), 4547; https://doi.org/10.3390/app15084547
Submission received: 22 January 2025 / Revised: 11 April 2025 / Accepted: 14 April 2025 / Published: 20 April 2025
(This article belongs to the Special Issue Current Advances in Performance Analysis and Technologies for Sports)

Abstract

:
Background/Objectives: Master athletes in team sports represent a growing population of individuals who continue to engage in structured training and competition. Among these sports, basketball has primarily been investigated in older athletes; however, age-related effects on training load within the broader master athlete population remain largely unexplored. This study aimed to examine the age-related differences in workloads among master basketball athletes and determine whether game participation can facilitate the achievement of the recommended physical activity level. Methods: A total of 178 male athletes were divided into three age groups (35–45, 46–60, and ≥60 years) and participated in a national tournament. External load metrics, including accumulated acceleration load (AAL), mechanical load (ML), and jump load (JL), were recorded using tri-axial microsensors. Internal load (IL) was assessed via session ratings of perceived exertion (sRPE). Physical activity levels were categorized into light, moderate, and vigorous intensity using accelerometry-derived metabolic equivalents. Results: Significant age-related differences (p < 0.01) were observed in AAL, ML, and JL, with the youngest group showing the highest values. Likewise, the time spent in moderate-to-vigorous physical activity (MVPA) displayed an age-dependent manner and decreased with age. Older athletes spent more time in low-intensity activities and employed energy-conserving strategies, avoiding high-speed and high-impact actions. Despite these variations, sRPE ratings were similar among groups. Conclusions: In conclusion, age is a crucial regulator of training load and physical activity and should be considered by practitioners and coaches who design training and physical activity plans for master basketball athletes. Despite the age-related differences, participation in basketball matches provides a substantial opportunity for increasing daily MVPA.

1. Introduction

Participation in team sports, either as recreational sports activities or through structured training and competition, results in numerous health-related benefits for middle-aged and older master athletes [1,2,3,4]. Recreational team sports activities, such as small-sided soccer [4,5,6,7,8,9,10], futsal [2,11,12], walking soccer [1,13,14,15,16], modified basketball [17,18], handball [12,19,20], and volleyball [21,22] offer a wide array of training stimuli contributing to improved health status. Interventions lasting 10 to 16 weeks, typically involving one to three sessions per week of approximately one hour each, have demonstrated significant health-related improvements in various age groups, including older adults, middle-aged men, postmenopausal women, and individuals with comorbidities [4,10,23]. The health-related benefits of recreational team sports extend across many physical and mental health aspects. Beyond cardiorespiratory fitness, body composition, and metabolic health, these activities induce meaningful improvements in functional capacity, psychological well-being, and social relationships that increase adherence to physical activity routines [2,3,8,10,11,19,21,22,23,24,25,26]. In recent years, there has been an increase in the number of master athletes who continue to train and compete in tournaments [27,28], which serves to promote sustained physical activity in later life [27]. Due to their athletic performance and physiological and functional abilities, master athletes are regularly proposed as examples of successful aging [29,30,31]. Studies in strength, endurance, and team sports master athletes have indicated that they exhibit superior motor unit and muscle fiber types [32,33,34], greater muscle mass, strength, and power during maximal exercise tests [27,33,35], better running economy [36] and higher VO2 max [37], better BMI [31] lower injury rates [31], improved psychological and general well-being [31], and reduced cardiovascular risk, including lower resting systolic and diastolic blood pressure and healthier blood lipid profiles [31] compared to age-matched, less active counterparts. Master athletes often display physiological traits comparable to less active, younger individuals, with their maximal aerobic capacity offering protection against muscular weakness, aerobic decline, and mortality risks [35]. These adaptations are driven by the varied demands of team sports, where the combination of endurance, strength, and agility training creates a well-rounded stimulus that supports long-term health and functional capacity [27,35].
Although it is documented that participation in recreational team sport activities results in numerous health-related benefits, it is crucial to quantify these activities by monitoring training load (TL), including both external load (EL) as mechanical stress on musculoskeletal tissues such as bones, muscles, cartilage, and tendons, and internal load (IL) as a combination of biochemical and psychological stresses experienced by the athlete [38,39,40]. Studies monitoring TL in master team sports athletes, such as soccer and basketball, have employed various methodologies, including different match durations and metrics analyzed [41,42,43,44]. Specifically, in basketball, a study of ten senior athletes found that heart rate (HR) rarely exceeded 70% HRmax, with blood lactate levels at the end of the match being higher than resting values but remained similar across match phases [44]. Cortis et al. [45] reported that master athletes spent 67% of match time in low-intensity activities and only 17% in high-intensity running. In addition, heart rate exceeded 85% of HRmax, with post-matc rate of perceived exertion RPE scores significantly higher than pre-match values [45]. In their recent work, Conte et al. [43] examined the IL and EL during official basketball games in 13 older adults by using microsensors for the assessment of training load characteristics. The authors reported that EL metrics, such as Player Load (PL) (269.9 ± 83.3 AU) and PL/min (6.54 ± 1.29 AU/min), alongside a higher frequency of movements such as jumps, accelerations, and changes of direction performed at low-intensity zones. The IL analysis revealed high HR values with a maximum HR of 81.7 ± 8.1% and a low (sRPE of 148.9 ± 69.7 AU for the actual game duration, implying that high physiological demand did not correspond to relatively low perceived effort [43].
Engaging in regular and organized recreational team sport activities can help seniors meet the current World Health Organization (WHO) recommendations of 150 min of moderate-intensity or 75 min of vigorous-intensity physical activity per week, or an equivalent combination of the two, to achieve significant health-related benefits [46,47]. To date, numerous studies have attempted to relate TL to PA guidelines by employing disparate methodological approaches [15,16,24,25]. Based on their findings, recreational walking soccer (WS) is classified as moderate-intensity activity, with HRmean at ~80% of HRmax and GPS-measured distance (~2409 m) supporting this classification [15,16]. Recreational futsal yields energy expenditures aligning with international guidelines, with one session equating to ~634 kcal [24]. Recreational handball showed high HR values (>80% HRmax for 42 min), though accelerometer data indicated that only 27% of the game time was moderate-to-vigorous physical activity (MVPA) [25,46,47].
Basketball is an easily accessible team sport, as only a ball and a hoop are required, and can be played in diverse settings, from dedicated courts to improvised open spaces [48]. Its flexibility accommodates various group sizes, from full teams to just two players, making it highly inclusive. Beyond its accessibility, basketball is characterized by intermittent high-intensity activities, and it has been proposed as a well-rounded approach for maintaining physical activity throughout the lifespan. Although physical activity in, and biological adaptations resulting from, team sports such as football, volleyball, and handball have been thoroughly examined across various populations [2,4,7,21,22], their investigation in basketball remains obscure. While the demands of basketball training sessions and games on smaller courts have been assessed in males and females, no study has quantified TL during a basketball game using PA as a metric and compared it among different age groups. Therefore, understanding the quantification of TL and PA will allow practitioners to consider it as a form of exercise and determine effective training load characteristics. Hence, the aim of the present study was to objectively assess and compare TL and PA among different age groups of master basketball athletes and to determine whether participation in official basketball competitions aligns with PA guidelines. We hypothesized that participation in a basketball game provides an adequate physical activity stimulus and that both TL and PA differ among age groups.

2. Materials and Methods
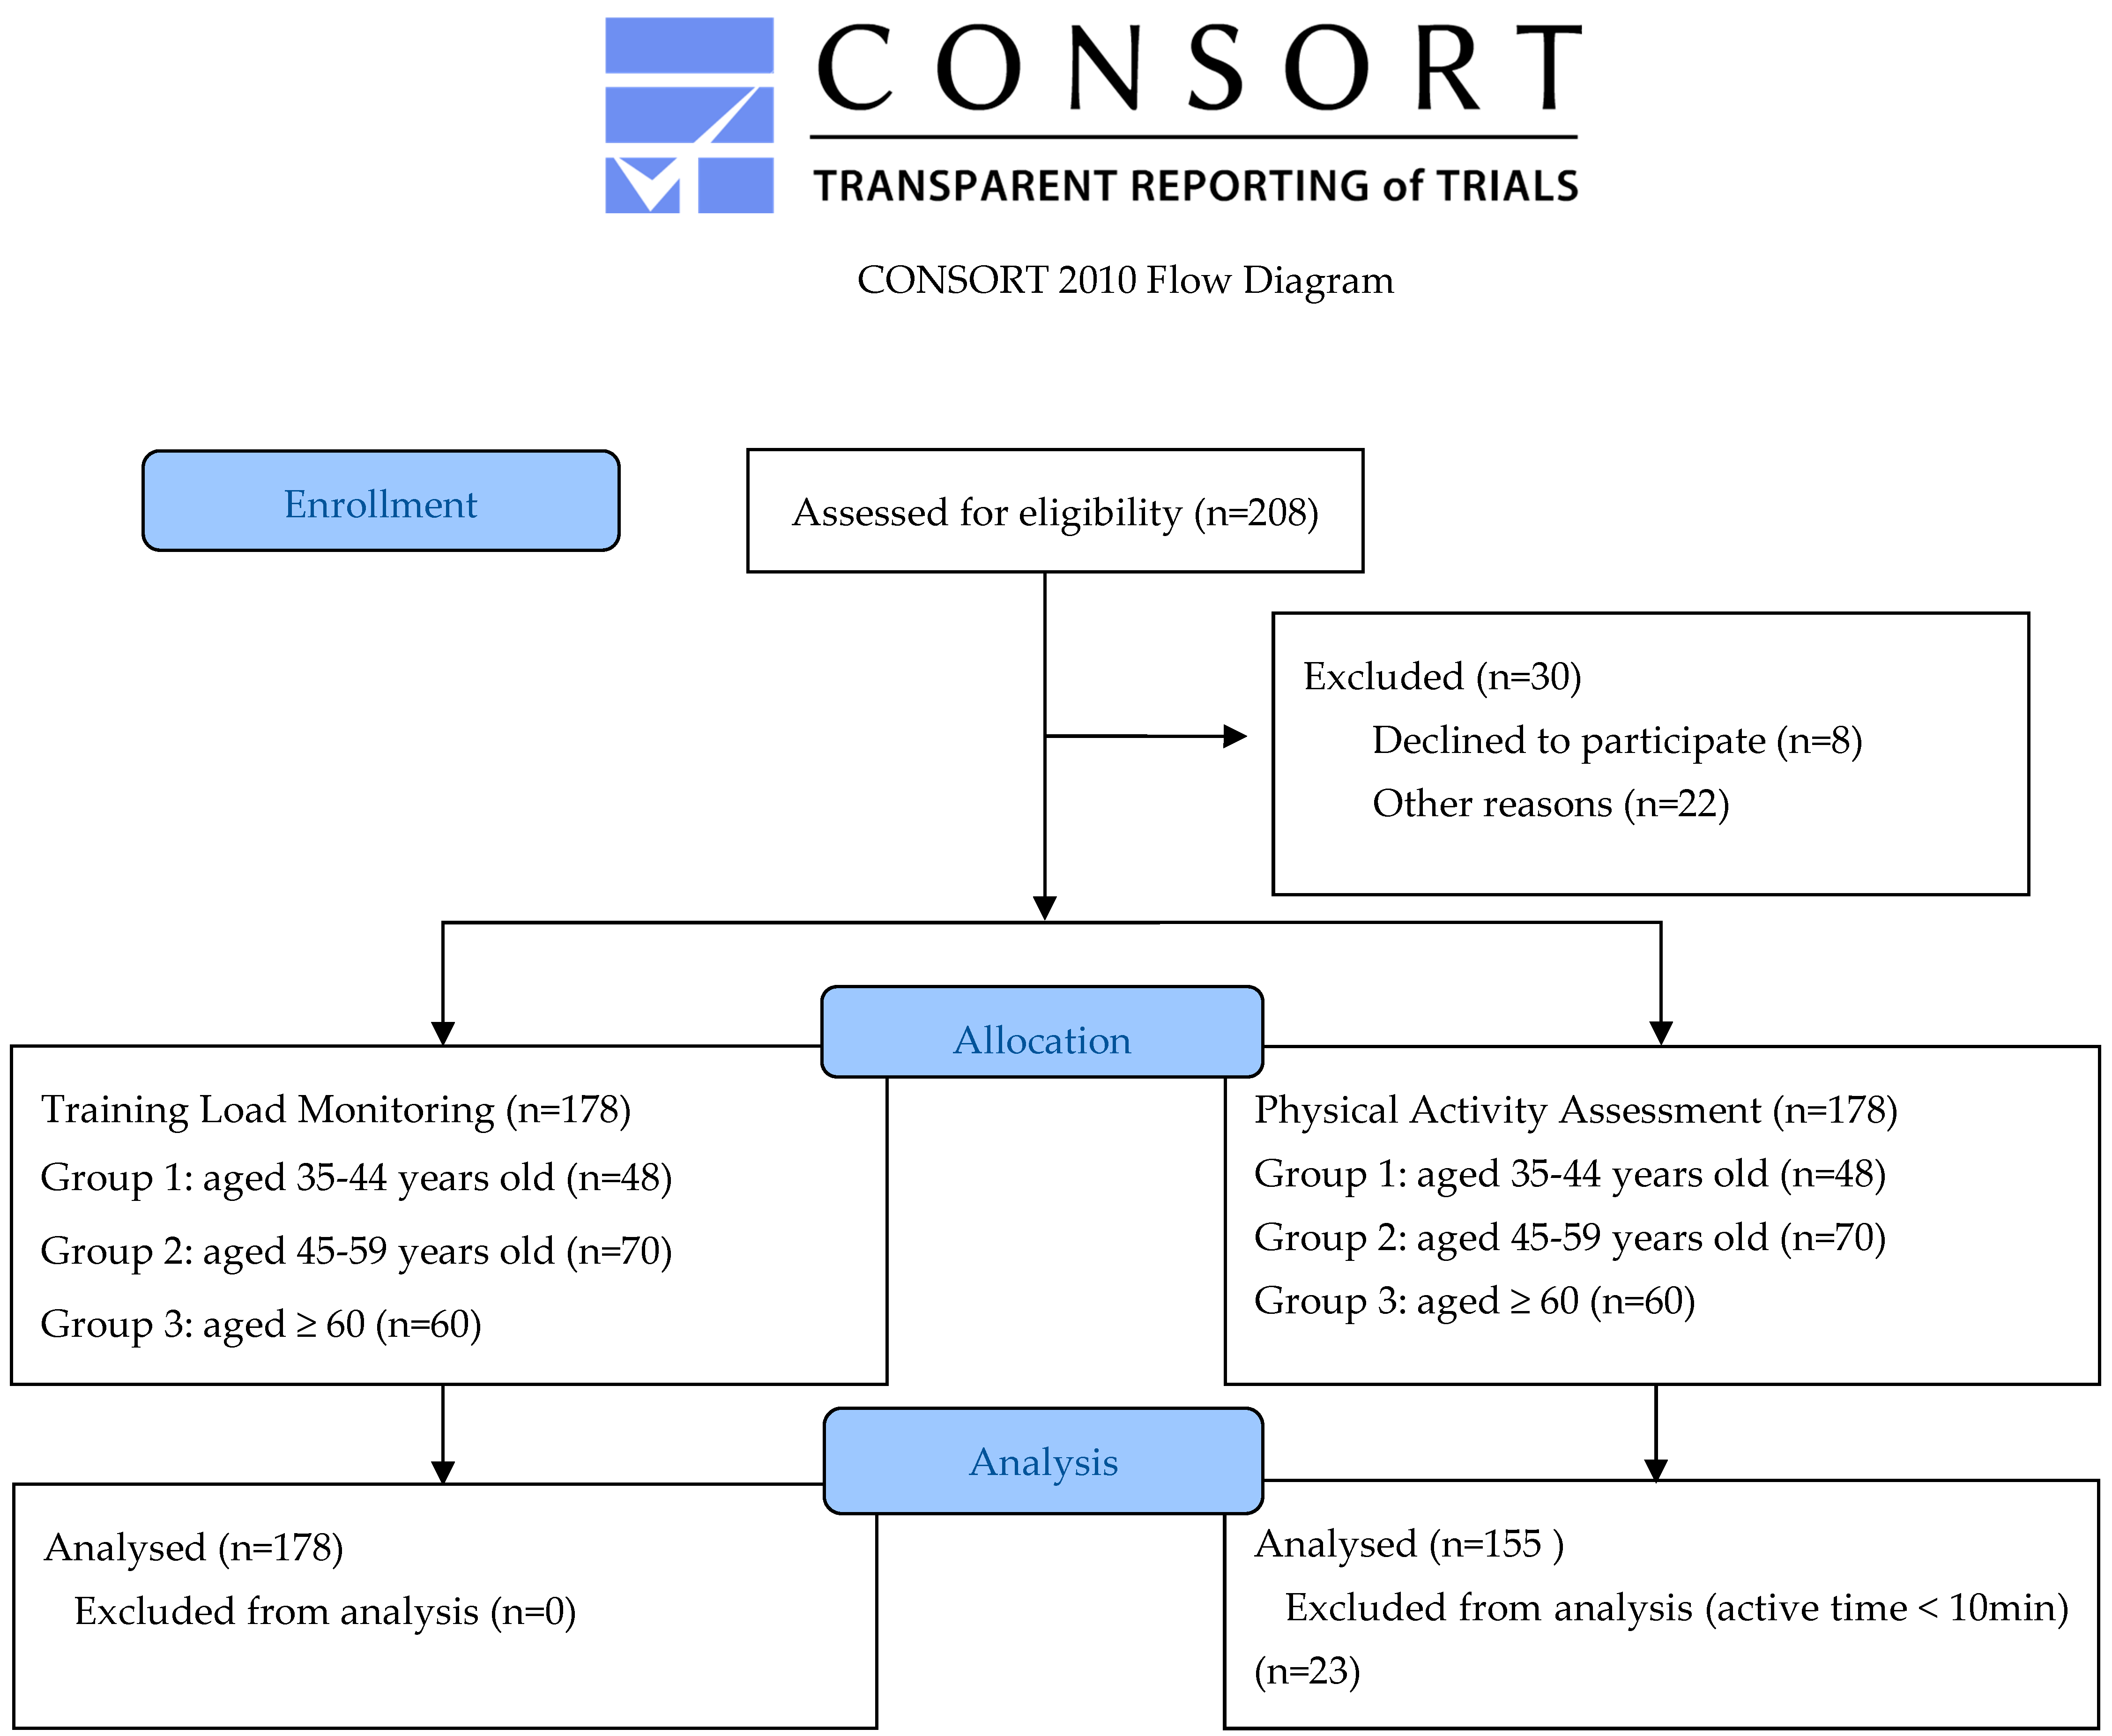
2.1. Participants

A priori power analysis was conducted using G*Power software (version 3.1.9.7) to determine the required sample size. The analysis indicated that a minimum of 132 participants was needed to detect a medium effect size (f = 0.35) with a statistical power of 0.95 and an alpha level of 0.05. Accordingly, a total of 178 athletes aged 35–84 were measured in a national master basketball tournament (10th National Greek Basketball Maxi Tournament) held in Komotini (Greece). To be eligible for the study, volunteers had to meet the following inclusion criteria: (1) a playing history of over 10 years, (2) participation in structured basketball training sessions at least twice a week for the last 5 years, (3) free of musculoskeletal injuries that could affect their performance, illnesses, or metabolic disorders, (4) no use of supplements or medications in the six months preceding the study, and (5) non-smoking status. Athletes who had sustained injuries within the past six months had chronic health conditions affecting physical performance, or used medications, alcohol, or tobacco were excluded from participation. Permission to monitor games was obtained from the teams, and all players and coaches were informed about the research protocol, requirements, benefits, and risks. Each participant was fully informed about the benefits and potential risks associated with the study and provided signed informed consent prior to participation. All procedures complied with the 2024 Declaration of Helsinki, the eighth revision, approved at the 75th Meeting in Helsinki, and ethical approval was obtained from the Ethics Committee of the Department of Physical Education and Sport Science, Democritus University of Thrace (Protocol No: DUTH/EHDE/29660/206-21/01/2022).

2.2. Study Design

All matches were played according to International Basketball Federation (FIBA) rules but with a modified time of four 8 min periods. Matches began with a 25 min warm-up that involved ball dribbling, layups, shooting, and dynamic stretching exercises. During each match, all players were continuously monitored from the start of the warm-up until the end of the match. However, EL data were quantified based on active time in the matches, i.e., only when players were playing on the court, excluding periods of warm-ups, inactive phases such as time-outs, substitutions, and rest time between quarters or halftime [43,49]. For the assessment of PA, data were analyzed over the entire session, from the beginning of the warm-up to the end of the game. Nevertheless, only data from athletes who accumulated over 10 min of active time during the matches were included to ensure a reliable evaluation of their activity levels (Figure 1). Players were allowed to replenish fluid loss by drinking ad libitum during the recovery periods. A total of 10 matches from the entire three-day tournament were monitored. The number of matches monitored was limited due to the distance between basketball courts and monitoring system procedures, such as charging the microsensor battery and downloading data to ensure nothing was missed from previous games. The sample was divided into three age groups: Group 1: 35–44, Group 2: 45–59, and Group 3: ≥ 60. Participants’ characteristics are shown in Table 1.

2.3. External Load Monitoring

Before the start of each game, a microsensor inertial measurement unit (IMU) (Kinexon Perform IMU, KINEXON Precision Technologies, Munich, Germany) was placed in a leather case with a clip that attached to the waistband of each participant’s team uniform [50,51]. The IMU was placed at the center of mass (COM), which was determined by placing the clip case at the intersection of the axial and sagittal planes in a straight line with the iliac crest on the posterior side of the body, as described by Barrett [51]. Positioning the accelerometer closer to the COM provides greater accuracy in quantifying physical work, as it is less sensitive to vertical vector motion noise resulting from upper body motions such as scapular oscillation, arm oscillation, torso flexion, and vector quantities that represent the total dynamic acceleration of the body [51]. Across all games, microsensor data were recorded via IMU microsensors and downloaded after each game to a system computer for analysis using Kinexon software (Kinexon Perform IMU 12.0, KINEXON Precision Technologies, Munich, Germany). The IMU microsensor included a 3-axis accelerometer with a range of ±16 G at 1 KHz (provided with 100 Hz), a 3-axis gyroscope with a range of ±4000 deg/sec at 200 Hz, and a 3-axis magnetometer with a range of ±16 μT at 100 Hz. EL metrics included accumulated acceleration load (AAL), also referred to as Player Load (within-device CV = 0.91–1.05%, between-device CV = 1.02–1.90%) [38,43,50,52,53,54], which was calculated as the square root of the sum of the squares of the instantaneous rate of change of acceleration on each of the three vectors (X, Y, and Z axes) and divided by 100 [51,55]. Data were expressed in arbitrary units (AU) [38,43,50,52,53]. Mechanical load (ML) is derived by accumulating all the instantaneous acceleration and deceleration samples in the x and y planes. Jump load (JL) is derived from the equation JL = M × g × vertical displacement, where M is the mass (kg), g is the gravitational constant (m/s2), and vertical displacement is the jump height (meters). Jump events were also identified and quantified using Kinexon’s athlete tracking system, which integrates high-resolution positional and inertial sensor data. The system calculates jump height and frequency based on vertical acceleration and displacement parameters derived from the inertial data. These calculations are processed through Kinexon’s proprietary software algorithms. While the specific computational formulas are not publicly available due to intellectual property protections, the detection of jumps is based on identifying characteristic vertical movement patterns exceeding predefined thresholds within the acceleration data. Distance in speed zones was categorized as in the following zones: 1. low (≤5.04 km/h), 2. medium (5.04–10.8 km/h), 3. high (10.8–18.72 km/h), and 4. very high (over 18.72 km/h). These zones are similar to those used in basketball research [56,57].

2.4. Internal Load Monitoring

Internal Load was monitored using the sRPE, which has been used extensively in basketball research [38,43,50,58,59,60,61]. To calculate sRPE values, the RPE score (1–10) was obtained, which was then multiplied by the duration of actual active time [43]. Thirty minutes after each game, research team members approached each athlete individually, presented them with a card displaying a translated version of the modified Borg CR-10 scale, and requested them to rate the intensity of the game by answering the following question: “How intense was the game?” [62].

2.5. Tri-Axial Acceleration Data Processing and Physical Activity Classification

Immediately after each match, the activity monitors were removed, and the data were downloaded to a personal computer using the manufacturer’s software. The raw tri-axial acceleration data were processed to create a single, omnidirectional measure of body acceleration. This was achieved by calculating the vector magnitude from the three axes and subtracting the gravitational constant, following the formula
E N M O = x 2 + y 2 + z 2 1
where x, y, and z represent the acceleration values along the three axes, expressed in units of gravitational acceleration (g), with g = 9.81 m/s2. Any negative values resulting from this calculation were set to zero, as defined by the Euclidean Norm Minus One (ENMO) approach [63]. This method isolates the acceleration due to body movement by removing the constant effect of gravity. The data were then averaged over 1 s epochs to reduce variability and facilitate analysis. All data processing was performed using custom scripts written in Python 3.9.
To categorize the measured accelerations into PA intensity zones, we utilized specific cutoff values based on established metabolic equivalent (MET) thresholds [64]. The classification was as follows:
  • No Physical Activity (NPA): Accelerations below 0.03 g, indicating minimal physical movement;
  • Light Physical Activity (LPA): Accelerations between 0.03 g and <0.1 g, corresponding to activities with an intensity of ≥2 METs;
  • Moderate Physical Activity (MPA): Accelerations between 0.1 g and <0.4 g, aligning with ≥3 METs;
  • Vigorous Physical Activity (VPA): Accelerations of ≥0.4 g, associated with ≥6 METs.

2.6. Statistical Analysis

Descriptive statistics, including means and standard deviations (SD), were calculated for all variables, which included age, weight, height, BMI, time, sRPE, accumulated acceleration load, mechanical load, jump load, total jumps, total distance, distance covered in speed zones (1–4), and physical activity metrics (No PA, Low PA, Moderate PA, Vigorous PA, and MVPA). The normality of the data distribution was assessed by examining skewness and kurtosis values. To determine statistically significant differences among the three age groups (35–45 years (G1), 46–60 years (G2), and ≥60 years (G3)), a one-way analysis of variance (ANOVA) was performed for each variable. When the ANOVA indicated significant differences, post hoc analyses were conducted using the Bonferroni correction to adjust for multiple comparisons. Pearson’s r was conducted to examine the correlation between active time and MVPA. All data were analyzed using IBM Corp. Released 2023. IBM SPSS Statistics for Windows, Version 29.0.2.0 Armonk, NY, USA: IBM Corp.

3. Results

This section presents the findings of a one-way ANOVA to evaluate differences among three age groups (G1, G2, and G3) across various variables. The analyses included demographic measures such as age, weight, height, BMI, and active time. Workload metrics were examined, including sRPE, accumulated acceleration load, mechanical load, jump load, and total number of jumps. Additionally, performance-related variables such as total distance covered and distance traveled within speed zones were analyzed. The correlation between active time and MVPA was also examined. Physical activity metrics were also assessed, encompassing minutes spent in No PA, Low PA, Moderate PA, Vigorous PA, and MVPA.

Figures, Tables, and Schemes

Significant differences were observed in weight, height, and BMI across the three age groups, with F(2, 177) = 8.449, p < 0.01, and F(2, 177) = 4.403, p = 0.014, respectively (Table 1). Post hoc analyses using the Bonferroni correction revealed that participants of G1 had significantly higher weights than those of G2 (p < 0.01) and G3. However, there was no significant difference in weight between G2 and G3. The G1 had a significantly higher BMI than the G2 (p < 0.05) groups, but not G3. No significant differences in BMI were observed between G2 and G3. No significant differences in active time among the groups (F(2, 177) = 1.987, p = 0.140) and in height (F(2, 177) = 56.455, p = 0.40) between groups were observed.
Accumulated acceleration load, mechanical load, jump load, and total jumps differed significantly across the three age groups, with F(2, 177) = 74.343, p < 0.001, F(2, 177) = 42.958, p < 0.001, F(2, 177) = 12.767, p < 0.001, and F(2, 177) = 9.464, p < 0.001, respectively (Table 2). Post hoc analyses using the Bonferroni correction revealed that participants in the G1 age group demonstrated significantly higher accumulated acceleration load, mechanical load, jump load, and total jumps compared to both the G2 and G3 age groups (p < 0.01). Additionally, the G2 age group exhibited significantly higher values for these metrics compared to the G3 age group (p < 0.01). No significant differences were observed in sRPE among the age groups (F(2, 177) = 0.555, p = 0.577).
Total distance and distances covered within speed zones 2, 3, and 4 showed significant differences across the three age groups, with F(2, 177) = 60.627, p < 0.01, F(2, 177) = 55.643, p < 0.01, F(2, 177) = 52.615, p < 0.001, and F(2, 177) = 36.575, p < 0.01, respectively (Table 3). Post hoc analyses using the Bonferroni correction revealed that participants in the G1 age group covered significantly greater total distances and covered more within each speed zone compared to participants in the G2 and G3 age groups (p < 0.01). Furthermore, the G2 age group covered significantly greater distances in these metrics compared to the G3 age group (p < 0.01). No significant differences were observed in distance covered within speed zone 1 among the age groups (F(2, 175) = 0.280, p = 0.756).
A moderate, positive correlation was found between the two variables, r = 0.524, p < 0.001, suggesting that higher levels of active time were associated with greater MVPA. When analyzed by group, a significant, moderate-to-strong correlation was observed in G1, r = 0.586, p < 0.001. In G2, a moderate and significant correlation was also identified, r = 0.523, p < 0.001. A strong positive correlation was found in G3, r = 0.668, p < 0.001 (Figure 2).
Significant differences were observed across all physical activity metrics: NPA (F(2, 154) = 7.139, p = 0.01), LPA (F(2, 154) = 24.800, p < 0.001), MPA (F(2, 152) = 10.137, p < 0.01), Vigorous PA (F(2, 152) = 25.550, p < 0.001), and MVPA (F(2, 152) = 15.134, p < 0.01) (Table 4). Post hoc analyses using the Bonferroni correction revealed that participants in G2 spent significantly more time in No PA and Low PA compared to the G1 (p < 0.01). Additionally, participants in the G3 spent significantly more time in LPA than those in the G2 (p < 0.01). MPA, VPA, and MVPA were significantly lower in the G3 compared to the other two groups (p < 0.01). The G2 also showed reduced levels of VPA compared to the G1 (p < 0.01). These results highlight significant age-related differences in physical activity levels, with older groups engaging in less vigorous activity and spending more time in low-intensity or no physical activity.

4. Discussion

The present study monitored and compared IL, EL, and PA among basketball master athletes in different age groups during official games. The primary findings were that (1) significant age-related declines in relative AAL, total jumps, total distance, and distance covered in speed zones 2–4 were observed in all age groups; (2) JL exhibited a steeper decline with age compared to ML; (3) despite these age-related reductions in EL metrics, subjective IL, measured through sRPE, remained consistent across all age groups; and (4) older athletes spent more time in LPA and NPA zones, alongside a concurrent reduction in MVPA. Significant age-related differences in EL metrics were observed among master basketball athletes during official games. Methodological differences, particularly in data reduction related to active time, should be considered when comparing these findings with previous research. Nevertheless, several studies employing similar methods and metrics provide valuable insights into age-related performance differences [43,65].
The AAL for G1 was 11.35 ± 2.27 AU/min, aligning closely with values reported for professional players (11.1 ± 2.0 AU/min) [65] but slightly lower than semi-professional players (11.6 ± 1.5 AU/min) [66]. The AAL of G3 (6.74 ± 1.86 AU/min) was 40.6% lower than G1 and 15.2% lower than G2 (7.95 ± 1.94 AU/min). These values are consistent with findings from Conte et al. [43] for players over 65 years of age (6.54 ± 1.29 AU/min) [43]. Regarding total jumps performed per minute, G3 recorded 0.25 ± 0.22 jumps/min, closely aligning with findings from Conte et al. [43] for older adults (0.28 ± 0.13 jumps/min). These values were 40.5% lower than G1 (0.42 ± 0.17 jumps/min) and 19.4% lower than G2 (0.31 ± 0.19 jumps/min). Professional players, who recorded 1.11 ± 0.53 jumps/min [65], far exceeded all groups, indicating that the decline in vertical power actions is not confined to older players but is also present in younger master athletes. This supports the notion that older athletes may adjust their movement patterns to avoid high-impact actions requiring significant lower-body power. The age-related decline in performance can be explained by a combination of factors, including reductions in muscle mass, strength, and neuromuscular function [67,68].
Furthermore, the relative total distance also exhibited an age-related decline. G2 and G3 covered 25.2% and 36.1% less distance per minute than G1, respectively. These values were considerably lower than distances reported for male professional players (133.1 ± 1.0 m/min) and elite young players (114.5 ± 8.7 m/min) [69]. However, they were closer to distances observed in female college players (100.8 ± 4.4 m/min) and professional female players (95.2 ± 2.8 m/min) [69,70]. While relative metrics were expressed per minute to account for differences in active time and game intensity [38,43,66], speed-based intensity zones provided additional insights. In speed zone 2, G2 and G3 covered 27.7% and 41.9% less distance, respectively, than G1. In speed zone 3, G2 and G3 exhibited reductions of 39.3% and 59.2%, respectively, while the greatest differences were observed in speed zone 4, where G2 covered 66.4% less and G3 82.0% less distance than G1. Interestingly, no significant differences were found in speed zone 1, which typically reflects standing and walking, suggesting that low-intensity movements remain consistent across age groups. This pattern may imply that older players conserve energy by limiting high-speed efforts to avoid fast transitions or fast breaks rather than reducing overall movement during play [44].
Significant differences in ML and JL between age groups were observed, suggesting pronounced age-related adaptations in movement patterns. Unlike commonly used metrics, ML and JL offer a more differentiated approach for quantifying how athletes distribute physical effort across horizontal and vertical planes. To the authors’ knowledge, this is one of the first implementations of these metrics in this context. G1’s ML was 23.4% higher than G2 and 38.5% higher than G3, while G2’s ML exceeded G3 by 19.2%. Similarly, G1’s JL was 32.2% higher than G2 and 46.7% higher than G3, with G2’s JL being 21.4% higher than G3. These findings underscore the sharper decline in vertical efforts with age and highlight the value of ML and JL as novel methods for assessing age-related movement pattern adaptations. Studies have shown that type II (“fast twitch”) muscle fibers, which are essential for power movements like jumping and sprinting, are predominantly affected [71]. This decrease in fast-twitch muscle fibers aligns with the lower jump frequencies and the lower distance covered in the running speed zones observed in older athletes, strengthening the perspective that they may adapt their game to compensate for reduced power output by limiting vertical actions, such as jumping for rebounds or performing high jump layups or shots [44]. Instead, they may rely more on tactical positioning, short runs, and defensive coverage. This change may also be influenced by the elevated injury risk associated with high-impact vertical actions, which place a substantial load on knees, ankles, and other musculoskeletal structures, increasing the likelihood of strains and sprained joints. A linear decline in athletic performance in various sports, particularly in jumping and running events, supports these adaptations [72]. In basketball, these adaptations may expand to shooting patterns, with older athletes potentially preferring mid-distance shots over three-point attempts, given the reduced lower-body power required for shorter distances [44]. Indeed, these adaptations agree with previous research in older adults, where during a friendly basketball match, players performed a limited number of high-intensity actions, emphasizing on defensive rebounding and mid-range shooting [44].
Although there were no significant differences in subjective ratings of perceived exertion among age groups, the values were significantly higher than those reported in other studies that consider master basketball matches as a light to moderate activity, indicating that despite the age-related decline in EL, IL remains relatively unaffected [43]. A study by Conte et al. [43] reported an average sRPE load of 148.9 ± 69.7 AU during a 4 × 10 min game format, which was lower than the values recorded in all groups. However, these sRPE values were still significantly lower than those reported for semi-professional basketball players, who recorded an average sRPE load of 313.69 ± 139.73 AU [66]. Previous studies in older adults participating in soccer and basketball matches have demonstrated that, although heart rate and blood lactate levels can be elevated, athletes often report a moderate rate of perceived exertion [41,42,44,45]. This phenomenon has been linked to the enjoyment associated with recreational activities, which may induce a psychological “buffer effect”, resulting in a reduced perception of exertion rather than physiological stress [44]. This enjoyment, along with the social aspects of team sports, is vital in supporting adherence to long-term physical activity programs and promoting overall well-being [72]. This suggests that the recreational nature of master basketball, combined with the enjoyment of participation and the anticipation of competing in an official game, may mitigate players’ subjective perception of exertion despite the physiological demands [43].
To date, various studies have attempted to relate TL to PA using different methods [15,16,24]. Physical activity plays a critical role in maintaining and improving overall health, promoting healthy aging, and preventing and managing chronic diseases [73]. The intensity of PA is commonly classified as inactive, low-intensity, moderate-intensity, vigorous, and very vigorous [74]. Findings from this study demonstrate that participation in official basketball matches provides a substantial opportunity for master athletes to engage in MVPA. However, as expected, MVPA exhibited a gradual decline with age. G3 spent 19.58 ± 8.12 min in MVPA, 28.7% less than G1 (27.46 ± 7.97 min) and 30.1% less than G2 (27.99 ± 10.18 min). Although participants in G3 spent less time in MVPA compared to G1 and G2, this time is sufficient to increase their daily PA levels and make it easier for them to reach the WHO guidelines for PA [75,76]. From the data analysis, a moderate-to-strong significant correlation was observed between active time and MVPA in all age-related groups, suggesting that increasing the active time in each game as well as the frequency of game participation during the week could be an efficient strategy to meet the current guidelines for daily and weekly amounts of MVPA. Additionally, for a notable portion of the match duration, athletes engaged in low-intensity physical activity, aligning with WHO recommendations that emphasize substituting sedentary behavior with any form of movement. Even light-intensity activity provides significant health-related benefits, with small amounts of PA contributing to improved overall health [77]. For example, a study of recreational handball players aged 33–55 reported that 75% of game time was spent standing or walking, 27% was classified as MVPA, and only 10% was spent in vigorous-intensity PA [26]. Comparatively, in this study, basketball players demonstrated higher engagement in MVPA, and more specifically, G1 recorded 38.3%, G2 30.9%, and G3 26.6%, with G1 also achieving 15.7% of the time in vigorous-intensity PA, G2 achieving 10.5%, and G3 8.3%. These findings suggest that basketball matches, even among older athletes, may involve a higher proportion of moderate-to-vigorous-intensity activities compared to other recreational sports, potentially reflecting differences in game dynamics and physical demands. Studies on other recreational sports further illustrate the variability in PA metrics. In recreational walking football, HR measurements combined with HR reserve (HRR) revealed alternating light- and moderate-intensity activities, with occasional peaks of vigorous intensity in older adults with type 2 diabetes [16]. Another study using HR, GPS, and RPE metrics estimated that a 40 min WS match corresponds to moderate-intensity PA [15]. Similarly, recreational futsal showed that one session per week could meet 50% of the recommended energy expenditure (634 ± 92 kcal), with three sessions achieving 150% [24]. These comparisons underscore the unique value of basketball as an accessible and effective form of PA for older adults. Basketball not only promotes MVPA but also replaces sedentary behavior with a variety of movement intensities, making it an excellent option for achieving WHO-recommended activity levels. However, methodological differences, such as game format, monitoring tools, and data reduction techniques, complicate direct comparisons between studies and highlight the need for standardized approaches to evaluating PA across different sports.
An important limitation of the present study is the lack of detailed information regarding participants’ training status, training history, and previous injuries, which can significantly affect physical performance and perceived exertion, particularly in older athletes. The intensity zones for EL and PA metrics were standardized across all age groups; however, incorporating assessments of physical capacities could have facilitated individualized intensity thresholds. This approach might have revealed differences in perceived exertion, which remained similar despite the observed variations in EL and PA metrics. Furthermore, another limitation of our study relates to the methods used to evaluate the IL. While microsensors and accelerometers provided detailed information on EL, sRPE was the only measure of IL. Future research could focus on measuring both training and official competitions to assess variations in TL between competitive and non-competitive settings. Longitudinal studies covering an entire training season or year could provide valuable data on how training demands change over time and how seasonal fluctuations impact performance and health outcomes. Furthermore, assessing participants’ physical abilities, body composition, and overall health metrics, such as cardiovascular fitness, muscle strength, and injury incidence, could help explain individual variability and provide a more holistic understanding of master athletes’ performance. Intervention studies focusing on structured practices and competitions could also assess the effects of a structured training program on cardiovascular fitness, bone status, metabolic and mental health, and other medical conditions. These studies could explore whether game format and intensity modifications impact adherence, performance, and overall health. Additionally, comparing basketball to other team sports could provide further insights into sport-specific adaptations and help inform guidelines for promoting successful aging through physical activity in team sports interventions.

5. Conclusions

This study identified significant age-related differences in TL among master basketball athletes, with older groups exhibiting lower AAL, ML, JL, and total distance covered compared to younger counterparts. The observed differences in ML and JL suggest distinct age-related adaptations in movement patterns, indicating that older athletes may adopt energy-conserving strategies by limiting high-speed efforts to avoid fast transitions or fast breaks rather than reducing overall movement during play. These adaptations likely reflect the physical limitations associated with aging while allowing continued participation in competitive settings. Despite the reductions in EL, IL, as measured by sRPE, remained consistent across age groups, highlighting the psychological resilience and enjoyment of playing basketball. Moreover, participation in basketball matches significantly contributed to MVPA across all age groups, highlighting the sport’s alignment with physical activity guidelines and its potential to promote an active lifestyle among older adults.

Author Contributions

Conceptualization, A.C., I.G.F., D.P. and A.A.; methodology, A.C., D.P., T.S. and A.A.; software, C.K., D.B. and D.P.; validation, D.P., T.S., C.K. and D.B.; formal analysis, D.P., C.K., D.B. and A.C.; investigation, D.P., D.B., M.P., P.A. and N.-O.R.; data curation, T.S., C.K., D.B., M.E., A.G., S.K. and M.K.; writing—original draft preparation, D.P., A.C., D.D., T.S. and A.A.; review and editing, A.C., D.D., I.G.F., A.K., A.G., M.M. and N.Z.; visualization, D.P., C.K., A.A., T.S. and D.B.; supervision, A.C. and I.G.F. All authors have read and agreed to the published version of the manuscript.

Funding

This research received no external funding.

Institutional Review Board Statement

The study was conducted in accordance with the Declaration of Helsinki and approved by the Institutional Review Board (or Ethics Committee) of Democritus University of Thrace, Department of Physical Education and Sport Science (Protocol No: DUTH/EHDE/29660/206-21/01/2022).

Informed Consent Statement

Informed consent was obtained from all subjects involved in the study.

Data Availability Statement

The data used in this study are confidential and cannot be shared due to stringent primary regulations and ethical considerations. Access to the data is strictly restricted to the research team so we can protect the participants’ identity and well-being.

Acknowledgments

This study was supported by the host institutions and the SBEKKO (Association of Veteran and Amateur Basketball Players of Komotini), which served as the organizing committee. The authors are grateful to all the basketball players for their contribution and commitment to this study. The authors would also like to thank Paris Petras, for his valuable support and facilitation of the research process.

Conflicts of Interest

The authors declare no conflicts of interest.

References

  1. Arnold, J.T.; Bruce-Low, S.; Sammut, L. The Impact of 12 Weeks Walking Football on Health and Fitness in Males over 50 Years of Age. BMJ Open Sport Exerc. Med. 2015, 1, bmjsem-2015-000048. [Google Scholar] [CrossRef] [PubMed]
  2. Beato, M.; Coratella, G.; Schena, F.; Impellizzeri, F.M. Effects of Recreational Football Performed Once a Week (1 h per 12 Weeks) on Cardiovascular Risk Factors in Middle-Aged Sedentary Men. Sci. Med. Footb. 2017, 1, 171–177. [Google Scholar] [CrossRef]
  3. Luo, H.; Newton, R.U.; Ma’ayah, F.; Galvão, D.A.; Taaffe, D.R. Recreational Soccer as Sport Medicine for Middle-Aged and Older Adults: A Systematic Review. BMJ Open Sport Exerc. Med. 2018, 4, e000336. [Google Scholar] [CrossRef] [PubMed]
  4. Milanović, Z.; Čović, N.; Helge, E.W.; Krustrup, P.; Mohr, M. Recreational Football and Bone Health: A Systematic Review and Meta-Analysis. Sports Med. 2022, 52, 3021–3037. [Google Scholar] [CrossRef]
  5. Vorup, J.; Pedersen, M.T.; Brahe, L.K.; Melcher, P.S.; Alstrøm, J.M.; Bangsbo, J. Effect of Small-Sided Team Sport Training and Protein Intake on Muscle Mass, Physical Function and Markers of Health in Older Untrained Adults: A Randomized Trial. PLoS ONE 2017, 12, e0186202. [Google Scholar] [CrossRef]
  6. Andersen, T.R.; Schmidt, J.F.; Pedersen, M.T.; Krustrup, P.; Bangsbo, J. The Effects of 52 Weeks of Soccer or Resistance Training on Body Composition and Muscle Function in +65-Year-Old Healthy Males—A Randomized Controlled Trial. PLoS ONE 2016, 11, e0148236. [Google Scholar] [CrossRef]
  7. Schmidt, J.F.; Hansen, P.R.; Andersen, T.R.; Andersen, L.J.; Hornstrup, T.; Krustrup, P.; Bangsbo, J. Cardiovascular Adaptations to 4 and 12 Months of Football or Strength Training in 65- to 75-year-old Untrained Men. Scand. J. Med. Sci. Sports 2014, 24, 86–97. [Google Scholar] [CrossRef]
  8. Bangsbo, J.; Hansen, P.R.; Dvorak, J.; Krustrup, P. Recreational Football for Disease Prevention and Treatment in Untrained Men: A Narrative Review Examining Cardiovascular Health, Lipid Profile, Body Composition, Muscle Strength and Functional Capacity. Br. J. Sports Med. 2015, 49, 568–576. [Google Scholar] [CrossRef]
  9. Krustrup, P.; Christensen, J.F.; Randers, M.B.; Pedersen, H.; Sundstrup, E.; Jakobsen, M.D.; Krustrup, B.R.; Nielsen, J.J.; Suetta, C.; Nybo, L.; et al. Muscle Adaptations and Performance Enhancements of Soccer Training for Untrained Men. Eur. J. Appl. Physiol. 2010, 108, 1247–1258. [Google Scholar] [CrossRef]
  10. Duncan, M.J.; Mowle, S.; Noon, M.; Eyre, E.; Clarke, N.D.; Hill, M.; Tallis, J.; Julin, M. The Effect of 12-Weeks Recreational Football (Soccer) for Health Intervention on Functional Movement in Older Adults. Int. J. Environ. Res. Public Health 2022, 19, 13625. [Google Scholar] [CrossRef]
  11. Modena, R.; Impellizzeri, F.M.; Fornasiero, A.; Schena, F. Effects of Low vs. Moderate Dose of Recreational Football on Cardiovascular Risk Factors. Eur. J. Sport Sci. 2023, 23, 1047–1055. [Google Scholar] [CrossRef] [PubMed]
  12. Castagna, C.; Krustrup, P.; Póvoas, S. Cardiovascular Fitness and Health Effects of Various Types of Team Sports for Adult and Elderly Inactive Individuals—A Brief Narrative Review. Prog. Cardiovasc. Dis. 2020, 63, 709–722. [Google Scholar] [CrossRef]
  13. Reddy, P.; Dias, I.; Holland, C.; Campbell, N.; Nagar, I.; Connolly, L.; Krustrup, P.; Hubball, H. Walking Football as Sustainable Exercise for Older Adults—A Pilot Investigation. Eur. J. Sport Sci. 2017, 17, 638–645. [Google Scholar] [CrossRef] [PubMed]
  14. Corepal, R.; Zhang, J.Y.; Grover, S.; Hubball, H.; Ashe, M.C. Walking Soccer: A Systematic Review of a Modified Sport. Scand. J. Med. Sci. Sports 2020, 30, 2282–2290. [Google Scholar] [CrossRef]
  15. Andersson, H.; Caspers, A.; Godhe, M.; Helge, T.; Eriksen, J.; Fransson, D.; Börjesson, M.; Ekblom-Bak, E. Walking Football for Health—Physiological Response to Playing and Characteristics of the Players. Sci. Med. Footb. 2025, 9, 68–75. [Google Scholar] [CrossRef]
  16. Barbosa, A.; Brito, J.; Costa, J.; Figueiredo, P.; Seabra, A.; Mendes, R. Feasibility and Safety of a Walking Football Program in Middle-Aged and Older Men with Type 2 Diabetes. Prog. Cardiovasc. Dis. 2020, 63, 786–791. [Google Scholar] [CrossRef]
  17. Randers, M.B.; Hagman, M.; Brix, J.; Christensen, J.F.; Pedersen, M.T.; Nielsen, J.J.; Krustrup, P. Effects of 3 Months of Full-Court and Half-Court Street Basketball Training on Health Profile in Untrained Men. J. Sport Health Sci. 2018, 7, 132–138. [Google Scholar] [CrossRef] [PubMed]
  18. Karatrantou, K.; Pappas, K.; Batatolis, C.; Ioakimidis, P.; Gerodimos, V. A 3-Month Modified Basketball Exercise Program as a Health-Enhancing Sport Activity for Middle-Aged Individuals. Life 2024, 14, 709. [Google Scholar] [CrossRef]
  19. Carneiro, I.; Krustrup, P.; Castagna, C.; Mohr, M.; Magalhães, J.; Pereira, R.; Santos, R.; Martins, S.; Guimarães, J.T.; Coelho, E.; et al. Dose-response Effect of a Recreational Team Handball-based Exercise Programme on Cardiometabolic Health and Physical Fitness in Inactive Middle-aged-to-elderly Males—A Randomised Controlled Trial. Eur. J. Sport Sci. 2023, 23, 2178–2190. [Google Scholar] [CrossRef]
  20. Carneiro, I.; Krustrup, P.; Castagna, C.; Pereira, R.; Coelho, E.; Póvoas, S. Acute Physiological Response to Different Recreational Team Handball Game Formats in over 60-Year-Old Inactive Men. PLoS ONE 2022, 17, e0275483. [Google Scholar] [CrossRef]
  21. Trajković, N.; Sporiš, G.; Krističević, T.; Bogataj, Š. Effects of Small-Sided Recreational Volleyball on Health Markers and Physical Fitness in Middle-Aged Men. Int. J. Environ. Res. Public Health 2020, 17, 3021. [Google Scholar] [CrossRef] [PubMed]
  22. Vasić, G.; Trajković, N.; Mačak, D.; Sattler, T.; Krustrup, P.; Starčević, N.; Sporiš, G.; Bogataj, Š. Intensity-Modified Recreational Volleyball Training Improves Health Markers and Physical Fitness in 25–55-Year-Old Men. BioMed Res. Int. 2021, 2021, 9938344. [Google Scholar] [CrossRef]
  23. Pereira, R.; Krustrup, P.; Castagna, C.; Coelho, E.; Santos, R.; Martins, S.; Guimarães, J.T.; Magalhães, J.; Póvoas, S. Effects of a 16-Week Recreational Team Handball Intervention on Aerobic Performance and Cardiometabolic Fitness Markers in Postmenopausal Women: A Randomized Controlled Trial. Prog. Cardiovasc. Dis. 2020, 63, 800–806. [Google Scholar] [CrossRef]
  24. Beato, M.; Impellizzeri, F.M.; Coratella, G.; Schena, F. Quantification of Energy Expenditure of Recreational Football. J. Sports Sci. 2016, 34, 2185–2188. [Google Scholar] [CrossRef] [PubMed]
  25. Póvoas, S.C.A.; Castagna, C.; Resende, C.; Coelho, E.F.; Silva, P.; Santos, R.; Seabra, A.; Tamames, J.; Lopes, M.; Randers, M.B.; et al. Physical and Physiological Demands of Recreational Team Handball for Adult Untrained Men. BioMed Res. Int. 2017, 2017, 6204603. [Google Scholar] [CrossRef] [PubMed]
  26. Póvoas, S.C.A.; Castagna, C.; Resende, C.; Coelho, E.F.; Silva, P.; Santos, R.; Pereira, R.; Krustrup, P. Effects of a Short-Term Recreational Team Handball-Based Programme on Physical Fitness and Cardiovascular and Metabolic Health of 33-55-Year-Old Men: A Pilot Study. BioMed Res. Int. 2018, 2018, 4109796. [Google Scholar] [CrossRef]
  27. Geard, D.; Reaburn, P.R.J.; Rebar, A.L.; Dionigi, R.A. Masters Athletes: Exemplars of Successful Aging? J. Aging Phys. Act. 2017, 25, 490–500. [Google Scholar] [CrossRef]
  28. Lepers, R.; Stapley, P.J. Master Athletes Are Extending the Limits of Human Endurance. Front. Physiol. 2016, 7, 613. [Google Scholar] [CrossRef]
  29. Cheng, S.-T. Defining Successful Aging: The Need to Distinguish Pathways from Outcomes. Int. Psychogeriatr. 2014, 26, 527–531. [Google Scholar] [CrossRef]
  30. Lin, Y.-H.; Chen, Y.-C.; Tseng, Y.-C.; Tsai, S.; Tseng, Y.-H. Physical Activity and Successful Aging among Middle-Aged and Older Adults: A Systematic Review and Meta-Analysis of Cohort Studies. Aging 2020, 12, 7704–7716. [Google Scholar] [CrossRef]
  31. Climstein, M.; Walsh, J.; Heazlewood, T.; DeBeliso, M. Endurance Masters Athletes: A Model of Successful Ageing and Consequently Reduced Risk for Chronic Disease? Sports Exerc. Med.—Open J. 2018, 4, 77–82. [Google Scholar] [CrossRef]
  32. McKendry, J.; Joanisse, S.; Baig, S.; Liu, B.; Parise, G.; Greig, C.A.; Breen, L. Superior Aerobic Capacity and Indices of Skeletal Muscle Morphology in Chronically Trained Master Endurance Athletes Compared With Untrained Older Adults. J. Gerontol. Ser. A 2020, 75, 1079–1088. [Google Scholar] [CrossRef] [PubMed]
  33. Mckendry, J.; Breen, L.; Shad, B.J.; Greig, C.A. Muscle Morphology and Performance in Master Athletes: A Systematic Review and Meta-Analyses. Ageing Res. Rev. 2018, 45, 62–82. [Google Scholar] [CrossRef]
  34. Power, G.A.; Minozzo, F.C.; Spendiff, S.; Filion, M.-E.; Konokhova, Y.; Purves-Smith, M.F.; Pion, C.; Aubertin-Leheudre, M.; Morais, J.A.; Herzog, W.; et al. Reduction in Single Muscle Fiber Rate of Force Development with Aging Is Not Attenuated in World Class Older Masters Athletes. Am. J. Physiol.—Cell Physiol. 2016, 310, C318–C327. [Google Scholar] [CrossRef]
  35. Trappe, S.; Hayes, E.; Galpin, A.; Kaminsky, L.; Jemiolo, B.; Fink, W.; Trappe, T.; Jansson, A.; Gustafsson, T.; Tesch, P. New Records in Aerobic Power among Octogenarian Lifelong Endurance Athletes. J. Appl. Physiol. 2013, 114, 3–10. [Google Scholar] [CrossRef]
  36. Piacentini, M.F.; De Ioannon, G.; Comotto, S.; Spedicato, A.; Vernillo, G.; La Torre, A. Concurrent Strength and Endurance Training Effects on Running Economy in Master Endurance Runners. J. Strength Cond. Res. 2013, 27, 2295–2303. [Google Scholar] [CrossRef]
  37. Burtscher, J.; Strasser, B.; Burtscher, M.; Millet, G.P. The Impact of Training on the Loss of Cardiorespiratory Fitness in Aging Masters Endurance Athletes. Int. J. Environ. Res. Public Health 2022, 19, 11050. [Google Scholar] [CrossRef] [PubMed]
  38. Svilar, L.; Jukic, I. Load Monitoring System in Top-Level Basketball Team: Relationship between External and Internal Training Load. Kinesiology 2018, 50, 25–33. [Google Scholar] [CrossRef]
  39. Foster, C.; Rodriguez-Marroyo, J.A.; de Koning, J.J. Monitoring Training Loads: The Past, the Present, and the Future. Int. J. Sports Physiol. Perform. 2017, 12, S2-2–S2-8. [Google Scholar] [CrossRef]
  40. Gabbett, T.J. The Training—Injury Prevention Paradox: Should Athletes Be Training Smarter and Harder? Br. J. Sports Med. 2016, 50, 273–280. [Google Scholar] [CrossRef]
  41. Tessitore, A.; Meeusen, R.; Tiberi, M.; Cortis, C.; Pagano, R.; Capranica, L. Aerobic and Anaerobic Profiles, Heart Rate and Match Analysis in Older Soccer Players. Ergonomics 2005, 48, 1365–1377. [Google Scholar] [CrossRef] [PubMed]
  42. Cortis, C.; Tessitore, A.; Lupo, C.; Perroni, F.; Pesce, C.; Capranica, L. Changes in Jump, Sprint, and Coordinative Performances After a Senior Soccer Match. J. Strength Cond. Res. 2013, 27, 2989–2996. [Google Scholar] [CrossRef] [PubMed]
  43. Conte, D.; Palumbo, F.; Guidotti, F.; Matulaitis, K.; Capranica, L.; Tessitore, A. Investigating External and Internal Loads in Male Older Adult Basketball Players During Official Games. J. Funct. Morphol. Kinesiol. 2022, 7, 111. [Google Scholar] [CrossRef] [PubMed]
  44. Tessitore, A.; Tiberi, M.; Cortis, C.; Rapisarda, E.; Meeusen, R.; Capranica, L. Aerobic-Anaerobic Profiles, Heart Rate and Match Analysis in Old Basketball Players. Gerontology 2006, 52, 214–222. [Google Scholar] [CrossRef]
  45. Cortis, C.; Tessitore, A.; Pesce, C.; Piacentini, M.F.; Olivi, M.; Meeusen, R.; Capranica, L. Inter-Limb Coordination, Strength, and Jump Performances Following a Senior Basketball Match. In Contemporary Sport, Leisure and Ergonomics; Taylor & Francis Group: Abingdon, UK, 2009. [Google Scholar]
  46. Kahlmeier, S.; Wijnhoven, T.M.A.; Alpiger, P.; Schweizer, C.; Breda, J.; Martin, B.W. National Physical Activity Recommendations: Systematic Overview and Analysis of the Situation in European Countries. BMC Public Health 2015, 15, 133. [Google Scholar] [CrossRef]
  47. Oja, P.; Titze, S. Physical Activity Recommendations for Public Health: Development and Policy Context. EPMA J. 2011, 2, 253–259. [Google Scholar] [CrossRef]
  48. Shao, Z.; Bezmylov, M.M.; Shynkaruk, O.A. Individual Characteristics of Physical and Mental Development and Their Connection with Regular Physical Exercises When Playing Basketball. Curr. Psychol. 2023, 42, 25996–26005. [Google Scholar] [CrossRef]
  49. Salazar, H.G.; Paulis, J.C. Analysis of Basketball Game: Relationship between Live Actions and Stoppages in Different Levels of Competition. Rev. Cienc. Deporte 2020, 16, 109–118. [Google Scholar]
  50. Koyama, T.; Nishikawa, J.; Yaguchi, K.; Irino, T.; Rikukawa, A. A Comparison of the Physical Demands Generated by Playing Different Opponents in Basketball Friendly Matches. Biol. Sport 2024, 41, 253–260. [Google Scholar] [CrossRef]
  51. Barrett, S.; Midgley, A.; Lovell, R. PlayerLoadTM: Reliability, Convergent Validity, and Influence of Unit Position during Treadmill Running. Int. J. Sports Physiol. Perform. 2014, 9, 945–952. [Google Scholar] [CrossRef]
  52. Salazar, H.; Castellano, J.; Svilar, L. Differences in External Load Variables Between Playing Positions in Elite Basketball Match-Play. J. Hum. Kinet. 2020, 75, 257–266. [Google Scholar] [CrossRef] [PubMed]
  53. McLaren, S.J.; Macpherson, T.W.; Coutts, A.J.; Hurst, C.; Spears, I.R.; Weston, M. The Relationships Between Internal and External Measures of Training Load and Intensity in Team Sports: A Meta-Analysis. Sports Med. 2018, 48, 641–658. [Google Scholar] [CrossRef] [PubMed]
  54. Pernigoni, M.; Ferioli, D.; Butautas, R.; La Torre, A.; Conte, D. Assessing the External Load Associated With High-Intensity Activities Recorded During Official Basketball Games. Front. Psychol. 2021, 12, 668194. [Google Scholar] [CrossRef]
  55. Boyd, L.J.; Ball, K.; Aughey, R.J. The Reliability of MinimaxX Accelerometers for Measuring Physical Activity in Australian Football. Int. J. Sports Physiol. Perform. 2011, 6, 311–321. [Google Scholar] [CrossRef] [PubMed]
  56. Ibáñez, S.J.; Gómez-Carmona, C.D.; López-Sierra, P.; Feu, S. Intensity Thresholds for External Workload Demands in Basketball: Is Individualization Based on Playing Positions Necessary? Sensors 2024, 24, 1146. [Google Scholar] [CrossRef]
  57. Puente, C.; Abián-Vicén, J.; Areces, F.; López, R.; Del Coso, J. Physical and Physiological Demands of Experienced Male Basketball Players During a Competitive Game. J. Strength Cond. Res. 2017, 31, 956–962. [Google Scholar] [CrossRef]
  58. Kamarauskas, P.; Lukonaitienė, I.; Scanlan, A.T.; Ferioli, D.; Paulauskas, H.; Conte, D. Weekly Fluctuations in Salivary Hormone Responses and Their Relationships With Load and Well-Being in Semiprofessional, Male Basketball Players During a Congested In-Season Phase. Int. J. Sports Physiol. Perform. 2022, 17, 263–269. [Google Scholar] [CrossRef]
  59. Espasa Labrador, J.; Peña, J.; Caparrós Pons, T.; Cook, M.; Fort Vanmeerhaeghe, A. Relationship between Internal and External Load in Elite Female Youth Basketball Players. Apunt. Sports Med. 2021, 56, 100357. [Google Scholar] [CrossRef]
  60. Garcia, L.; Planas, A.; Peirau, X. Analysis of the Injuries and Workload Evolution Using the RPE and S-RPE Method in Basketball. Apunt. Sports Med. 2022, 57, 100372. [Google Scholar] [CrossRef]
  61. Fox, J.L.; Stanton, R.; Scanlan, A.T. A Comparison of Training and Competition Demands in Semiprofessional Male Basketball Players. Res. Q. Exerc. Sport 2018, 89, 103–111. [Google Scholar] [CrossRef] [PubMed]
  62. Kilpatrick, M.W.; Newsome, A.M.; Foster, C.C.; Robertson, R.J.; Green, M. Scientific Rationale for RPE Use in Fitness Assessment and Exercise Participation. ACSM’s Health Fit. J. 2020, 24, 24–30. [Google Scholar] [CrossRef]
  63. Hildebrand, M.; Van Hees, V.T.; Hansen, B.H.; Ekelund, U. Age Group Comparability of Raw Accelerometer Output from Wrist- and Hip-Worn Monitors. Med. Sci. Sports Exerc. 2014, 46, 1816–1824. [Google Scholar] [CrossRef] [PubMed]
  64. Schwendinger, F.; Wagner, J.; Infanger, D.; Schmidt-Trucksäss, A.; Knaier, R. Methodological Aspects for Accelerometer-Based Assessment of Physical Activity in Heart Failure and Health. BMC Med. Res. Methodol. 2021, 21, 251. [Google Scholar] [CrossRef] [PubMed]
  65. Svilar, L.; Castellano, J.; Jukic, I. Comparison of 5vs5 Training Games and Match-Play Using Microsensor Technology in Elite Basketball. J. Strength Cond. Res. 2019, 33, 1897–1903. [Google Scholar] [CrossRef]
  66. Conte, D.; Kamarauskas, P.; Ferioli, D.; Scanlan, A.T.; Kamandulis, S.; Palauskas, H.; Lukonaitienė, I. Workload and Well-Being across Games Played on Consecutive Days during in-Season Phase in Basketball Players. J. Sports Med. Phys. Fitness 2021, 61, 534–541. [Google Scholar] [CrossRef] [PubMed]
  67. Jones, R.L.; Paul, L.; Steultjens, M.P.M.; Smith, S.L. Biomarkers Associated with Lower Limb Muscle Function in Individuals with Sarcopenia: A Systematic Review. J. Cachexia Sarcopenia Muscle 2022, 13, 2791–2806. [Google Scholar] [CrossRef]
  68. Kumar, P.; Umakanth, S.; Girish, N. Correction: A Review of the Components of Exercise Prescription for Sarcopenic Older Adults. Eur. Geriatr. Med. 2023, 14, 1155–1186. [Google Scholar] [CrossRef]
  69. Scanlan, A.; Dascombe, B.; Reaburn, P. A Comparison of the Activity Demands of Elite and Sub-Elite Australian Men’s Basketball Competition. J. Sports Sci. 2011, 29, 1153–1160. [Google Scholar] [CrossRef]
  70. Scanlan, A.T.; Dascombe, B.J.; Reaburn, P.; Dalbo, V.J. The Physiological and Activity Demands Experienced by Australian Female Basketball Players during Competition. J. Sci. Med. Sport 2012, 15, 341–347. [Google Scholar] [CrossRef]
  71. Gustafsson, T.; Ulfhake, B. Aging Skeletal Muscles: What Are the Mechanisms of Age-Related Loss of Strength and Muscle Mass, and Can We Impede Its Development and Progression? Int. J. Mol. Sci. 2024, 25, 10932. [Google Scholar] [CrossRef]
  72. Cortis, C.; Tessitore, A.; Perroni, F.; Lupo, C.; Pesce, C.; Ammendolia, A.; Capranica, L. Interlimb Coordination, Strength, and Power in Soccer Players Across the Lifespan. J. Strength Cond. Res. 2009, 23, 2458–2466. [Google Scholar] [CrossRef] [PubMed]
  73. Ross, R.; Neeland, I.J.; Yamashita, S.; Shai, I.; Seidell, J.; Magni, P.; Santos, R.D.; Arsenault, B.; Cuevas, A.; Hu, F.B.; et al. Waist Circumference as a Vital Sign in Clinical Practice: A Consensus Statement from the IAS and ICCR Working Group on Visceral Obesity. Nat. Rev. Endocrinol. 2020, 16, 177–189. [Google Scholar] [CrossRef] [PubMed]
  74. Rowlands, A.V.; Mirkes, E.M.; Yates, T.; Clemes, S.; Davies, M.; Khunti, K.; Edwardson, C.L. Accelerometer-Assessed Physical Activity in Epidemiology. Med. Sci. Sports Exerc. 2018, 50, 257–265. [Google Scholar] [CrossRef] [PubMed]
  75. Moreira, N.B.; Mazzardo, O.; Vagetti, G.C.; De Oliveira, V.; De Campos, W. Quality of Life Perception of Basketball Master Athletes: Association with Physical Activity Level and Sports Injuries. J. Sports Sci. 2016, 34, 988–996. [Google Scholar] [CrossRef]
  76. Fien, S.; Climstein, M.; Quilter, C.; Buckley, G.; Henwood, T.; Grigg, J.; Keogh, J.W.L. Anthropometric, Physical Function and General Health Markers of Masters Athletes: A Cross-Sectional Study. PeerJ 2017, 5, e3768. [Google Scholar] [CrossRef]
  77. Chastin, S.F.M.; De Craemer, M.; De Cocker, K.; Powell, L.; Van Cauwenberg, J.; Dall, P.; Hamer, M.; Stamatakis, E. How Does Light-Intensity Physical Activity Associate with Adult Cardiometabolic Health and Mortality? Systematic Review with Meta-Analysis of Experimental and Observational Studies. Br. J. Sports Med. 2019, 53, 370–376. [Google Scholar] [CrossRef]
Figure 1. The CONSORT flow diagram of the study for physical activity metrics.
Applsci 15 04547 g001
Figure 2. Correlation between active time (min) and MVPA (min).
Applsci 15 04547 g002
Table 1. Subject’s characteristics among age groups.
DescriptivesG1 (n = 48)G2 (n = 70)G3 (n = 60)F(2, 177)p
Age (years)39.73 ± 3.3152.61 ± 2.9463.75 ± 4.62567,0720.000
Weight (kg)99.54 ± 12.8091.10 ± 10.05 *92.87 ± 11.27 +8.4490.000
Height (m)1.98 ± 0.052.00 ± 0.021.89 ± 0.09 +,#56.4550.400
BMI (kg/m2)27.69 ± 3.4126.24 ± 2.27 *26.68 ± 2.244.4030.014
Active Time (min)29.05 ± 11.5633.13 ± 13.7329.85 ± 10.321.9870.140
Data are presented as means ± SD. * Significant difference between G1 and G2, + Significant difference between G1 and G3, and # Significant difference between G2 and G3.
Table 2. Workload metrics among age groups.
Workload MetricsG1 (n = 48)G2 (n = 70)G3 (n = 60)F(2, 177)p
sRPE (AU)184.32 ± 99.60201.24 ± 118.96183.78 ± 95.910.5550.575
Accumulated Acceleration Load (AU/min)11.35 ± 2.277.95 ± 1.94 *6.74 ± 1.86 +,#74.3430.000
Mechanical Load (AU/min)27.45 ± 3.5822.24 ± 4.80 *19.75 ± 4.34 +,#42.9580.000
Jump Load (AU/min)109.62 ± 51.4974.33 ± 51.97 *58.42 ± 55.52 +12.7670.000
Total Jumps (Events/min)0.42 ± 0.170.31 ± 0.19 *0.25 ± 0.22 +9.4640.000
Data are presented as means ± SD. * Significant difference between G1 and G2, + Significant difference between G1 and G3, and # Significant difference between G2 and G3.
Table 3. Distance-based metrics among age groups.
Distance-Based MetricsG1 (n = 48)G2 (n = 70)G3 (n = 60)F(2, 177)p
Total Distance (m/min)82.45 ± 12.8561.70 ± 15.03 *52.71 ± 14.15 +,#60.6270.000
Distance in speed zone 1 (m/min)24.98 ± 4.2024.37 ± 5.6224.97 ± 5.710.2800.756
Distance in speed zone 2 (m/min)29.79 ± 6.9921.54 ± 5.98 *17.30 ± 5.66 +,#55.6430.000
Distance in speed zone 3 (m/min)23.83 ± 8.3314.47 ± 6.69 *9.73 ± 6.68 +,#52.6150.000
Distance in speed zone 4 (m/min)3.84 ± 3.371.29 ± 1.33 *0.69 ± 0.84 +36.5750.000
Data are presented as means ± SD. * Significant difference between G1 and G2, + Significant difference between G1 and G3, and # Significant difference between G2 and G3.
Table 4. Physical activity among age groups.
Physical ActivityG1 (n = 36)G2 (n = 62)G3 (n = 57)F(2, 154)p
ΝPA (min)31.30 ± 8.9141.81 ± 15.3437.27 ± 13.267.1390.001
LPA (min)13.05 ± 2.3320.83 ± 6.5716.54 ± 5.38 +,#24.8000.000
MPA (min)16.21 ± 4.5118.51 ± 7.2213.45 ± 5.66 #10.1370.000
VPA (min)11.25 ± 4.109.48 ± 3.76 *6.12 ± 2.93 +,#25.5500.000
MVPA (min)27.46 ± 7.9727.99 ± 10.1819.58 ± 8.12 +,#15.1340.000
Data are presented as means ± SD. * Significant difference between G1 and G2, + Significant difference between G1 and G3, and # Significant difference between G2 and G3.
Disclaimer/Publisher’s Note: The statements, opinions and data contained in all publications are solely those of the individual author(s) and contributor(s) and not of MDPI and/or the editor(s). MDPI and/or the editor(s) disclaim responsibility for any injury to people or property resulting from any ideas, methods, instructions or products referred to in the content.

