Abstract
Tensile strength perpendicular to the plane of the board (also known as the Internal Bond—IB), determined in accordance with standard EN 319, is one of the most critical properties in particleboard quality control. Given the need for efficient, rapid methods to assess the IB in industrial contexts, artificial neural networks (ANN) have been used as a predictive modelling tool. However, one of the main limitations of these techniques is the absence of estimates associated with the uncertainty of their predictions. The present study addresses this shortfall by applying bootstrap techniques to obtain confidence intervals using estimates generated by ANN. To achieve this, multiple models were trained and validated using experimental data taken from real production processes. The results show that the methodology proposed can be used to obtain a high level of accuracy (determination coefficient R2 = 0.96) and a coverage probability of 93%. It also provides a robust criterion to assess conformity with standard specifications. This study concludes that adding bootstrap to ANN modelling is a very useful tool for application in industrial quality control systems, as it allows decision making based on confidence intervals rather than individual values.
1. Introduction
European Standard EN 309 [1] states that a particleboard is a wood-based product manufactured by applying pressure and heat to particles of wood or other lignocellulosic materials glued with different types of adhesive depending on their final destination.
Global particleboard production grew slightly until the early 2000s, stabilising at around 100 million cubic metres a year and generating a market of around 14.2 × 10³ million USD [2].
One of the most important properties assessed in a particleboard is the internal bond because it is an indication of correct bonding and pressing. This property is measured by determining the tensile strength perpendicular to the plane of the board, following EN 319 [3]. However, the correct manufacture is affected by many parameters that influence the final performance of a particleboard [4,5,6]. Major advances in electronics in recent years have enhanced the ability to collect a large amount of reliable data from industrial processes. Along with the increase in computational power in the last 10 years, these advances have led to the development of powerful tools based on artificial intelligence that can be applied to assess how production parameters influence particleboard properties and optimise industrial processes. Process optimisation, based on statistical studies of industrial processes, can be approached in two ways. The first is to use descriptive statistical techniques, such as Shewart control charts [7,8]. The second is to apply modelling techniques based on multivariate regressions or artificial neural networks (ANN) to model a mechanical property using production parameters or physical properties, obtaining a mathematical model for the subsequent optimisation of variables [6,9,10,11,12,13,14,15,16,17]. Some studies have even combined neural network modelling techniques and Shewart control charts [18,19,20,21].
While these techniques, particularly those based on ANN, provide models with high reliability (determination coefficients higher than 70%) [13,14,22], they lack necessary information about the accuracy of the output of the modelling, which is typically expressed as confidence intervals or uncertainty. This uncertainty is a result of the inability to determine an optimum set of independent variables to model a process, and the uncertainties associated with the variables when they are measured. Moreover, the simplifications, insufficiencies, and ambiguity inherent to representing real-world processes by mathematical equations add to the structural uncertainty of the final models. This is a significant limitation on the efficacy of ANN, particularly in decision-making tasks, where it can compromise the reproducibility and reliability of the results of a model [23].
The measure of accuracy, expressed as the standard deviation or the confidence intervals of the estimator, is one of the most important aspects of the statistic process of modelling [24] because it provides very precise indications of the reliability of the modelling process and supports future decision making based on the estimator [25,26]. Similarly, production control cannot be based solely on obtaining the data of a property alongside traditional statistical measures such as variance or mode. Other estimates are required, including the confidence intervals of the control variable [27], because without these estimates, any specification compliance report based on the models developed would not be completely reliable [28,29].
Several authors have obtained the confidence intervals of the control variable at an industry level, using both production data and simulation data. Young et al. [27] evaluated three bootstrap methods for obtaining confidence intervals (a fully nonparametric, fully parametric, and nonparametric bootstrap for parametric inference (NBSP)) to analyse the modulus of elasticity (MOE) and the modulus of rupture (MOR) in wood–plastic composites (WPC) using test data. They concluded that, although one method may be preferable to another depending on the circumstances, obtaining the confidence intervals can help to improve the characterisation of the properties of a material and aid early failure detection. In a later study, also using test data, these authors noted the importance of obtaining the confidence intervals, but in this case, they applied Bayesian methods for the estimate [30]. Edwards et al. [31] noted the importance of estimating confidence intervals in medium-density fibreboard (MDF) production processes, reporting that bootstrapping provides an efficient solution to estimate confidence intervals when other approaches are inefficient or less realistic. They used 2000 resamplings for the bootstrapping, less than half the number applied in the present article, to calculate the lower percentiles of the internal bond from board manufacturing data.
Khosravi et al. [32] used data from various fields, including mathematics, medicine, transport, environmental studies, electronics, and production processes, and trained the neural network so that instead of providing a simulation of the result, it would provide the confidence intervals of the result, using two neurons in the output layer. Khosravi et al. [33] also conducted a comparative study of various techniques used to obtain confidence intervals from neural network results and the delta, Bayesian, bootstrap, and mean–variance estimation (MVE) methods. They concluded that bootstrapping is a powerful tool for constructing confidence intervals that balances current computational power with the accuracy of the result.
Similarly, Khosravi et al. [34] reaffirmed the bootstrap technique as a powerful tool for generating confidence intervals. In this study, they combined artificial neural networks and bootstrap methods to obtain confidence intervals using the estimate of variance and real-world and simulated data to assess the reliability of the method.
García Fernández et al. [35] addressed the need to know the confidence intervals of a neural network prediction, and the problem of neural networks being regarded as some sort of black box. They addressed the problem using a Monte Carlo simulation, a slightly different resampling technique from bootstrapping, and concluded that Monte Carlo is also a useful method to obtain confidence intervals.
Hosen et al. [36,37] proposed a combination of neural networks to generate prediction confidence intervals, using a weighted average of each network in the final result and improving the quality of the confidence intervals with regard to the accuracy and the coverage index.
The objective of this study was to use bootstrapping to determine the confidence intervals of the prediction of a standard particleboard internal bond obtained by artificial intelligence techniques, enabling greater reliability in factory decision making about specification compliance. Following Nerea Portillo et al. [38] and Stoma et al. [39], bootstrapping is the most appropriate method to address input data uncertainty because it enables an optimum performance while also minimising computation costs. Moreover, bootstrapping is relatively simple compared to other methods of constructing prediction intervals (PI), such as the delta [40] or Bayesian [41] techniques. As bootstrap-generated PI tend to be narrower, they generate better information about the result. Unlike alternative approaches, bootstrapping does not require a calculation of complex matrices such as the Jacobian or Hessian matrices. This improves the stability of the method and avoids problems associated with mathematical singularities [25,34]. To this end, the internal bond was calculated by combining the outputs of 20 artificial neural networks to improve the accuracy of the overall result.
2. Materials and Methods
Particleboard is a highly industrialised wood-based product. It was first mentioned in 1887, but until 1910, it was not possible to obtain suitable wood flakes for production [5]. Particleboard is manufactured mainly from debarked round wood that has been chipped in a wood chipper. After drying, the flakes, or particles, are put through a gluing machine, normally horizontal, where they are sprayed with adhesive to evenly coat their entire surface. Once the particles have been glued, they are dosed through a spreading machine on a mat assembly belt, and the final board is obtained from the mat in a press.
Material comprised 300 panels of particleboard type P2 taken at random from the production line during one production year. Following EN 312 [42], these panels are made using urea formaldehyde resin and are intended mostly for the manufacture of indoor furniture. The most commonly used bonding quality test is internal bond (Figure 1) or tensile strength perpendicular to the plane of the board. Panels were cut following standard EN 326-1 [43] and tested for internal bond (N/mm2) as per EN 319 [3], moisture content of the board at the time of testing (%) as per EN 322 [44], and density of the board at the time of testing (kg/m3) as per EN 323 [45] in the factory production control laboratory. The internal bond test consists of determining internal bond strength of a board by tensile strength perpendicular to the plane. It is crucial in production control, as it indicates how the gluing and pressing process is proceeding.
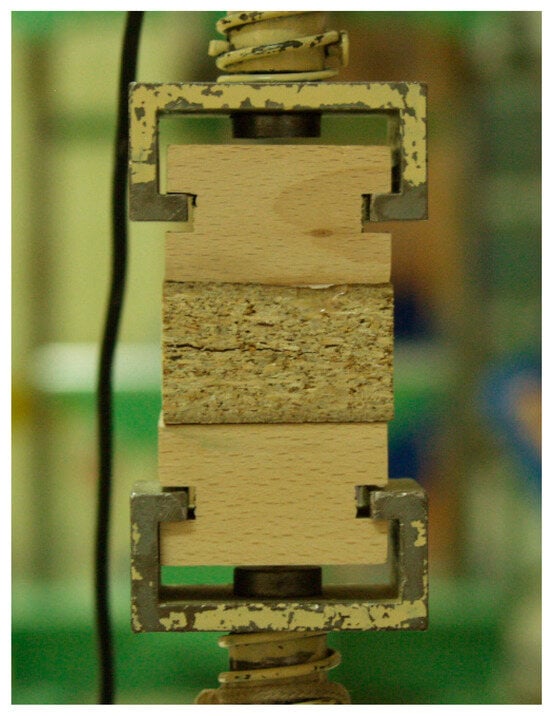
Figure 1.
Internal bond test following EN 319 [3].
Other production line data were collected at the same time from the production line sensors: particle temperature (°C), measured after drying; resin temperature (°C), measured when the flakes entered the gluing machine; mat moisture content (%), measured after drying; mat speed (mm/s); resin percentage (%), measured from board weight; additive (paraffin) percentage (%); and mean press temperature (°C) during the process.
2.1. Bootstrap Methodology
Bootstrapping is a resampling technique used to determine the parameters of an unknown distribution of an estimator through an empirical distribution [46]. The idea underlying bootstrapping is that the empirical distribution is a good approximation of the theoretical distribution of the estimator [31]. The empirical distribution can be used to calculate the error, bias, percentiles, and confidence intervals of the estimator. In this study, BCa (Bias-Corrected and accelerated) bootstrapping is applied. This produces good confidence intervals based on the percentiles of the bootstrap distribution of the estimator. Described by Efron and Tibshirani [46], this methodology has been used to obtain robust confidence intervals for various properties of wood-based products [27,30,31].
When applying bootstrapping to ANN modelling, we start from n ANN developed from various training, validation, and testing sets obtained at random. The modelling output will be the mean of n outputs [32].
Let be the vector formed by the outputs of the n networks developed. Let the bootstrap sample be the sample obtained through random replacement sampling B number of times. And let () be the real distribution of the estimator we want to obtain from the sample, in this case, the mean.
Using the mean of every bth bootstrap sample (), the empirical distribution of the bootstrap estimator for the mean is calculated (). Following Efron and Tibshirani [38] the distribution () can be used as the estimator of the real distribution () of the mean.
One of the major advantages of this resampling method is that is not necessary to assume any hypotheses about the underlying distribution () of the statistic studied, in this case, the mean [27].
Of all the methods for determining confidence intervals described by Efron and Tibshirani [46], BCa is the only one that is second-order accurate and transformation respecting and produces better results because they are closest to the real confidence intervals.
The BCa method is based on the percentiles of the bootstrap distribution (), but the percentiles are corrected using two parameters ( and ) known as acceleration and bias correction (Equation (1)).
where is the inverse function of a standard normal cumulative distribution function. In other words, measures the bias of the median of ; i.e., the discrepancy between the median of and .
Therefore, a BCa confidence interval with coverage of 100(1 − α) percent for our estimator will have the form (Equation (2)):
where and are the acceleration (Equation (3)):
where is the standard normal cumulative function and is the 100αth percentile of the standard normal distribution.
To assess the quality of the confidence intervals, the prediction interval coverage probability (PICP) was used. This indicator has been widely applied to determine confidence interval quality [25,33,47,48,49,50,51,52] (Equation (4)). It assesses the number of experimental data included in the confidence interval. Following Khosravi et al. [33], PICP is a good indicator of the quality of the confidence intervals obtained.
where is the number of experimental data, ti is the i-th experimental value, and Li and Ui are the upper and lower limits of the confidence intervals of the i-th value.
2.2. Artificial Neural Networks (ANN)
The nature of some ANNs, such as the multilayer perceptron, as universal approximators (Figure 2) [53], and their robustness against outliers, give them the ability to model all kinds of relations between variables with a high degree of reliability, especially when obtaining an accurate result is more important than knowing the relationships between the variables involved in the process [54].
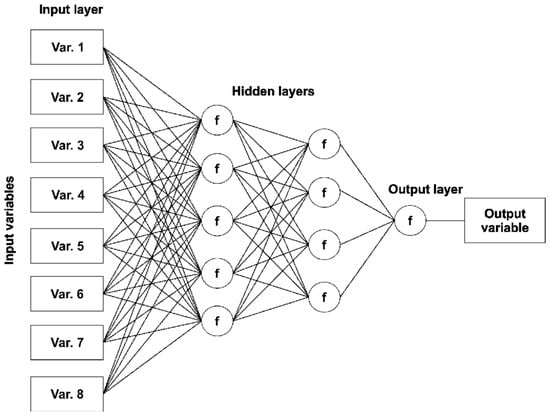
Figure 2.
Example of a typical artificial neural network structure with eight input variables and two hidden layers.
The ANN model chosen was the multilayer perceptron. This network type has demonstrated its ability to model various properties of wood-based products, particularly in boards [12,13,14,55,56], but also in solid wood [57] and other products [16,58,59].
The network input variables were the temperature of particles and resin, mat moisture content, resin percentage, percentage of additives, mat speed, and press temperature. The output variable was internal bond.
The type of network chosen to develop the internal structure was the multilayer perceptron, as described by the authors elsewhere [12,13,60]. As there is no precise rule to define the internal structure of a network, it was determined in each case by trial and error. To avoid the problem of overfitting, the initial dataset was randomly divided into three subsets (training, validation, and testing) at percentages of 60, 20, and 20% of the total dataset, with the condition of there being no significant differences between the subsets for a confidence level of 95%. In this way, the representativeness of the datasets in respect to the total dataset was verified. The training subset was used for the learning of the model, while the validation subset was used to monitor and prevent over-fitting during training. The test subset was used to independently assess the reliability of the model. Training was controlled by the early-stopping technique. This stops the process when a 10% variation occurs in the validation set in two consecutive cycles, either in the mean squared error (mse) or in the correlation coefficient.
Before the network was designed, a principal component analysis was conducted on the input vector to detect any correlation between the input variables and improve the network output [61]. The selection criterion for the variables was that they had to contribute more than 2% to sample variability [61,62].
All data were normalised (Equation (5)) before they were used to develop the networks, to improve network performance [61].
where X′ is the value after vector X has been normalised, Xm is the mean of vector X, and S is the standard deviation of vector X.
In all the networks, the transfer function used was the hyperbolic tangent sigmoid (Equation (6)), to enhance network performance [61].
where f(x) is the output value of the neuron and x is the input value of the neuron.
All the networks were developed so that they would be mathematically defined [63]; i.e., the training set had more data than the number of internal connections in the network.
The acceptance criterion for the networks was defined as the absence of significant differences between the real data and the simulators for the testing set, following the 2014 version of standard EN 326-2 [64]. For greater assurance in the modelling output, the criterion applied was a correlation coefficient (R) greater than 0.70 between the real data and the simulated data, following the requirements of the 2000 version of standard EN 326-2 [65] to accept test results obtained using non-standard test methods.
To calculate the confidence intervals, 250 different ANN were initially developed, varying the number of hidden layers and the number of neurons in each layer. Twenty of these ANN were selected as having the highest number of correlation coefficients in the testing set (Figure 3) and complied with the criterion of standards EN 326-2 [64,65]. The number of networks chosen agrees with that used by Papadopoulus, Edwards and Murray [66], and Secchi, Zoi, and di Maio [67], who included 20 and 15 networks, respectively, in their simulations, and exceeds the number of networks used by Khosravi et al. [25] and Khosravi et al. [32], who used only 10 different ANN models in their research, and Stoma et al. [39], who used 10 data items for their simulation.
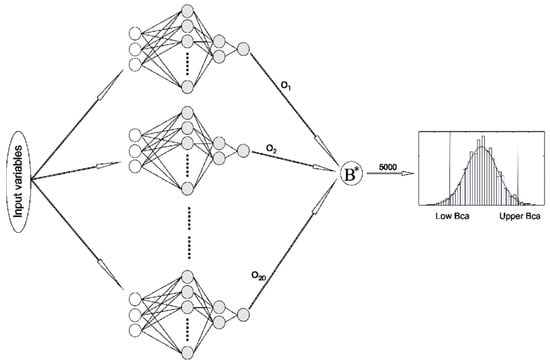
Figure 3.
Structure of the ensemble of the 20 ANN to generate the bootstrap set.
The empirical distributions of each output vector were calculated from 5000 datasets obtained by random resampling with replacement. The intervals were obtained using a significance index of 95%, which is commonly applied to obtain the confidence intervals of particleboard test results.
3. Results
The characteristics of the particleboards manufactured are shown in Table 1.

Table 1.
Particleboard characteristics. MC: moisture content.
The values of the production parameters obtained in real time and the value of the internal bond determined in the laboratory are shown in Table 2.
Table 2.
Production and internal bond parameters.
As the principal component analysis showed that each variable contributed more than 2% to variability, the variables were not transformed.
3.1. Artificial Neural Network (ANN) Results
Table 3 shows the results of the training, validation, and testing processes for the internal bond test.
Table 3.
Results of the artificial neural network design process. R2: determination coefficient, R: correlation coefficient, p-value: statistic to identify significant differences between simulated and experimental values.
For the testing sets, the value of the determination coefficients (R2) obtained shows that the models developed can explain at least 50% of sample variability.
The correlation coefficients in the testing set (0.71 to 0.81) exceed the minimum value of 0.70 indicated in the 2000 version of standard EN 326-2 [65] to accept the test results obtained using a non-standard method.
The p-value exceeds 0.05 in all cases, and therefore, there are no significant differences between the test values and the ANN outputs for a significance level of 95%, as specified in the 2014 version of standard EN 326-2 [64]. This means that all the conditions have been met for the acceptance of the ANNs developed.
3.2. Bootstrap Results
Table 4 shows the correlation and the root mean square error for all the data between the original values and the mean of the simulations by the 20 chosen networks.
Table 4.
Results of the regression between the mean value of the 20 networks and the real value.
The determination coefficient obtained (R2) indicates that bootstrapping neural networks is capable of explaining at least 96% of the variability in the sample. In addition, the correlation coefficient obtained (R) exceeds the threshold established in standard EN 326-2 [65] for accepting an alternative method to the standard procedure. This standard states that, for an alternative method to be valid, a minimum correlation coefficient of 0.70 must be obtained, otherwise the method is not acceptable.
In addition, the p-value obtained is greater than 0.05, and thus it can be concluded that there are no statistically significant differences between the experimental results and the result obtained by bootstrapping the neural networks, applying a confidence level of 95%, following the criteria established in standard EN 326-2 [64].
Therefore, compliance of all the requirements to consider the bootstrap ensemble valid and acceptable is verified from the results obtained using the neural networks developed in this study.
The PICP value obtained (93%) indicates that almost all the experimental data are within the confidence intervals generated.
Figure 4 shows the relation between the experimental values and the mean of the outputs of each network for the total dataset.

Figure 4.
Regression line between the mean value of the 20 networks and the real value.
4. Discussion
As initially stated, the main problem of ANN-based modelling is that, although it can provide accurate predictions, it provides no information about the uncertainty of the predictions. In the context of industrial production, it is not sufficient to obtain an estimated value of a mechanical property such as the internal bond. The confidence interval of the estimate must also be known, to ensure that both the mean and its margin of variability comply with the specifications [24,30].
In this study, all the individual networks chosen comply with the requirements of standard EN 326-2 in the 2000 [65] and 2014 [64] versions and would, therefore, be suitable for production control as an alternative to the standard method. The same occurs with the data obtained by bootstrapping the 20 neural networks: the correlation coefficient obtained is 0.98 and complies with standard EN 326-2 in the 2000 [65] version, and the p-value is 0.97, in compliance with the requirements of standard EN 326-2 in the 2014 [64] version, indicating that this ensemble is suitable for production control as an alternative to the standard method. However, no individual network provides the confidence interval of the modelling result. This means that bootstrapping must be applied, as indicated in Section 2.1, to obtain the confidence intervals.
It should also be noted that modelling with these neural networks allows considerable time saving in factory control, as the authors reported elsewhere [12,13], because conducting standard laboratory tests requires the mechanisation of the test pieces and conditioning before testing, whereas a neural network model based on production parameters would generate the test result in real time from values collected from production line sensors.
With regard to the degree of reliability of the networks obtained and their bootstrap ensemble compared to the reliability reported in other studies, both the determination coefficient (R2) and the correlation coefficient (R) obtained for the ANN (shown in Table 3) are lower than those reported in similar studies that modelled a mechanical property of a wood-based panel from production data. The smallest determination coefficient in the present study was 0.50, whereas Cook et al. [55] obtained determination coefficients greater than 0.8 for the mechanical properties of a particleboard panel calculated from production parameters by combining a radial-based ANN and a genetic algorithm. Demirkir et al. [68] reported determination coefficients greater than 0.97 when modelling the plywood bending strength from laboratory production data. Ozsahin [56] obtained determination coefficients of 0.88 and 0.92 when modelling the moisture absorption and swelling, respectively, of an OSB panel from the production data of the resin and additive type and content. Bardak, Tiryaki, Nemli, and Aydin [69] obtained a determination coefficient of 0.94 when modelling the bonding strength of wood joints from production data.
The authors of the present study also obtained higher determination coefficients in earlier studies with wood-based boards. García Fernández et al. [12] and Esteban et al. [20] reported determination coefficients of 0.75 to 0.85, respectively, when modelling particleboard mechanical properties using physical properties, and Esteban et al. [13] obtained determination coefficients of 0.92 and 0.94 when modelling the properties of a moisture-resistant particleboard after cyclic ageing. García Fernandez et al. [70] reported determination coefficients of 0.66 to 0.73 for the testing set when modelling the bending strength and modulus of the elasticity of structural plywood using other physico-mechanical properties. In a study on the influence of the physical properties on the internal bond of particleboard P2, they obtained a determination coefficient of 0.83 [60].
However, in all these investigations, most of the board production and the experiments to determine the values of the input and the output variables were carried out in the laboratory, whereas in the present study, all the input variables came from the production line and only the internal bond experiment was performed in controlled laboratory conditions. The higher correlation and determination coefficients obtained by these authors in earlier studies are probably due to the use of panels produced in the laboratory under very controlled production conditions that cannot always be replicated in daily factory production [4]. This is corroborated in the study by André et al. [71], who modelled the internal bond of fibreboard using data taken directly from the production line and reported correlation coefficients of 0.58 to 0.76 for the testing set, compared to the range of 0.71 to 0.81 in the present study. It, therefore, appears that the regression coefficients obtained in the present study are the result of using data and panels straight from the factory production line.
With regard to the combination of ANN by bootstrapping (Table 4), as Hosen et al. [36] and Hosen et al. [37] reported, the combined output of the 20 networks is greater than the outputs of the individual networks. In this case, the correlation coefficient improved from 0.95 in the best case, corresponding to the training set of the 12th network [7 2 1], to 0.98. These differences are more pronounced if the regressions are taken into account across all data, improving in this case from 0.87, corresponding to the regression of the total data of the first network [7 3 3], to 0.98. This shows how combining all the networks considerably improves the accuracy of the output.
For the quality of the intervals of confidence, the PICP (%) value obtained is 93% (Table 4), indicating that almost all the experimental data are included in the confidence interval. The PICP (%) value is similar to that of 95% reported by Mazloumi et al. [47] and by Khosravi et al. [72] in their study of the confidence intervals of energy market forecasts, where the PICP (%) were from 92.6 to 94.1%.
The value is also within the ranges obtained by Mazloumi et al. [47] and Khosravi et al. [25,32,33], who reported confidence intervals of 75 to 100% depending on the method used in the simulation. Hosen et al. [36] and Hosen et al. [37] obtained a very similar PICP of 82 to 94% and 80 to 95%, respectively, and Khosravi and Nahavandi [73] obtained a PICP higher than 95% from 50 simulations.
The result of this study also agrees with that of Shrivastava and Panigrahi [74] in their study of the confidence intervals of electricity market forecasts, where the PICP (%) was 50 to 100%, and with most of the results reported by Wan et al. [75], for a 95% coverage factor, they obtained a PICP (%) of 89.6 to 99.6% depending on the modelling method used.
Similarly, the PICP value agrees with the values obtained by Kasiviswanathan et al. [52], who referred to these values as POC of 92 to 97% when modelling rainfall runoff, although in critical situations, the PICP value was at times lower than 50%, and is slightly lower than the values reported by Kasiviswanathan and Sudheer [76], where the PICP values obtained for the bootstrap intervals ranged from 95.8 to 99.9%. It also agrees with the results of Hadjicharalambous et al. [26] in their study on neural network confidence intervals using various calculation methods (bootstrap, LUBE, and BLM), where the PICPs obtained were from 66 to 96% depending on the method used and, in the case of bootstrapping, from 66 to 83.23%.
Nourani et al. [77] also bootstrapped various neural networks to obtain the mean monthly precipitation and temperature at two weather stations (Tabriz and Ardabil, northwest Iran), using the bootstrap and LUBE methods, as Hadjicharalambous et al. [26] demonstrated. They obtained PICPs of 67 to 96% depending on the method used and the station and property modelled. These values are very similar to the PICP of 93% obtained in this study. In a later article on climatology, Nourani et al. [78] also studied the confidence intervals for models using artificial neural networks, generated using the methods of bootstrap, mean-variance estimation (MVE), delta, and LUBE. They reached the conclusion, previously indicated by Nerea Portillo et al. [38], Stoma et al. [39], and Khosravi et al. [33,34], that bootstrap intervals generate reliable confidence intervals. They also assessed the level of reliability of the intervals obtained through the PICP parameter, obtaining values higher than 95% for the bootstrap intervals, slightly higher than the 93% obtained in the present study.
Al-Dahidi et al. [79] similarly used the bootstrap technique to ensemble several artificial neural networks and obtain the prediction confidence intervals using the PICP parameter (%) to assess the prediction intervals. They modelled the prediction of the 24h-ahead solar photovoltaic production of a system of solar panels installed on the roof of the Faculty of Engineering at the Applied Science Private University (ASU) in Amman, Jordan. Their results were slightly lower than those obtained in the present study, as they reported a PICP of 84% for confidence intervals with a coverage factor of 80%, compared to the PICP of 93% for a coverage factor of 95% in the confidence intervals in the present study.
Seyedian et al. [80] studied the water discharge in an open channel, modelling the discharge using artificial neural networks, and obtained the intervals using the bootstrap from 17 initial data and a resampling set of 500 data. They also used the PICP parameter (%) for the final assessment of the confidence intervals, and obtained PICP values no higher than 92%, slightly lower than the 93% obtained in the present study.
More recently, in the oil field, Cheng et al. [81] studied the confidence intervals of the minimum miscibility pressure (MMP) of the CO2-crude oil system, a critical parameter in assessing the efficiency of a CO2 injection for enhanced oil recovery (EOR). They combined different modelling techniques using artificial intelligence with traditional models and assessed the result by the prediction interval coverage probability (PICP). The results obtained (PICP of 87 to 97%,) concur with the PICP of 93% obtained in the present study.
5. Conclusions
Modelling using a combination of neural networks is suitable for predicting the internal bond value of a standard particleboard from production parameters.
The reliability of the results is higher than the requirements of the standard for wood-based panels, indicating that this system is suitable for in-factory control.
Bootstrapping was used to calculate the confidence intervals of the output values of the value modelled, obtaining a 93% coverage factor in the results.
This study demonstrates the validity of using bootstrapping to calculate the confidence intervals of internal bond values obtained by simulation using a group of artificial neural networks.
The feasibility of using artificial neural networks for the in-factory control of the internal bond has been improved, given that the confidence intervals provide information about the degree of compliance with a specification when the results are close to the limits of the specification.
All of this would allow more accurate production control, based not only on having a modelling result that complies with the specification, but also on ensuring that the confidence interval of the result complies with the specification. This would bring production closer to product specification limits and help to ensure better the characterisation of the product and improve early failure detection on the production line.
Although the results obtained confirm the utility of bootstrapping for estimating confidence intervals in the quality control of wood-based boards using results modelled through artificial neural networks, this study has some limitations, as it addresses only the tensile strength perpendicular to the plane of the board, in a specific database. Therefore, given the growing integration of artificial intelligence techniques into quality control processes, future research must examine these methodologies of combining neural network modelling with traditional statistical techniques such as bootstraps in other physico-mechanical properties and different materials.
Author Contributions
Conceptualisation, F.G.F., L.G.E. and P.d.P.; data curation, A.G.-I.; formal analysis, F.G.F.; funding acquisition, P.d.P.; investigation, L.G.E., P.d.P., F.G.F. and A.G.-I.; methodology, F.G.F. and A.G.-I.; project administration, P.d.P.; resources, P.d.P.; software, F.G.F.; supervision, F.G.F. and L.G.E.; validation, F.G.F. and L.G.E.; visualisation, L.G.E.; writing—original draft, L.G.E., P.d.P., F.G.F. and A.G.-I.; writing—review and editing, P.d.P. and F.G.F. All authors have read and agreed to the published version of the manuscript.
Funding
This study is part of the AGL2013-43510-R project of the National Programme for Research Aimed at the Challenges of Society (module 1, “Research Challenges”: RDI Projects), funded by the Spanish Ministry of Economy and Competitiveness as part of the National Plan for Scientific and Technical Research and Innovation 2013–2016.
Institutional Review Board Statement
Not applicable.
Informed Consent Statement
Not applicable.
Data Availability Statement
The primary data used in this article is not available due to the confidentiality agreement with the company that provides it.
Conflicts of Interest
The authors declare no conflicts of interest.
References
- EN 309; Particleboards. Definition and Classification. European Committee of Standardization (CEN): Brussels, Belgium, 2005.
- Food and Agriculture Organization of the United Nations (FAO). ForesSTAT. 2025. Available online: https://www.fao.org/faostat/en/#data/FO (accessed on 10 January 2025).
- EN 319; Particleboards and Fibreboards. Determination of Tensile Strength Perpendicular to the Plane of the Board. European Committee of Standardization (CEN): Brussels, Belgium, 1993.
- Kelly, M.W. Critical Literature Review of Relationships Between Processing Parameters and Physical Properties of Particleboard; Department of Agriculture, Forest Service, Forest Products Laboratory: Madison, WI, USA, 1977; p. 65.
- Esteban, L.G.; Guindeo Casasús, A.; Peraza Oramas, C.; de Palacios, P. La Madera y su Tecnología; Fundación Conde del Valle de Salazar, Mundiprensa and AITIM: Madrid, Spain, 2002; p. 332. [Google Scholar]
- Nemli, G.; Aydin, I.; Zekoviç, E. Evaluation of some of the properties of particleboard as function of manufacturing parameters. Mater. Des. 2007, 28, 1169–1176. [Google Scholar] [CrossRef]
- Young, T.M.L.B.; Winistorfer, P.M.; Wang, S. Multivariate control charts of MDF and OSB vertical density profiles attributes. For. Prod. J. 1999, 49, 79–86. [Google Scholar]
- Montgomery, D. Introduction to Statistical Quality Control, 6th ed.; John Wiley and Sons: New York, NY, USA, 2008; p. 754. [Google Scholar]
- Cook, D.F.; Chiu, C.C. Predicting the internal bond strength of particleboard, utilizing a radial basis function neural network. Eng. Appl. Artif. Intell. 1997, 10, 171–177. [Google Scholar] [CrossRef]
- Cai, Z.; Wu, Q.; Lee, J.; Hiziroglu, S. Influence of board density, mat construction, and chip type on performance of particleboard made from eastern red cedar. For. Prod. J. 2004, 54, 226–232. [Google Scholar]
- Clapp, N.E., Jr.; Young, T.M.; Guess, F.M. Predictive modeling the internal bond of medium density fiberboard using a modified principal component analysis. For. Prod. J. 2008, 58, 49–55. [Google Scholar]
- García Fernández, F.; Esteban, L.G.; de Palacios, P.; Navarro, N.; Conde, M. Prediction of standard particleboard mechanical properties utilizing an artificial neural network and subsequent comparison with a multivariate regression model. Investig. Agrar. Sist. Recur. For. 2008, 17, 178–187. [Google Scholar] [CrossRef]
- Esteban, L.G.; García Fernández, F.; de Palacios, P.; González Rodrigo, B. Use of artificial neural networks as a predictive method to determine moisture resistance of particle and fiber boards under cyclic testing conditions (UNE-EN 321). Wood Fiber Sci. 2010, 42, 335–345. [Google Scholar]
- Ozsahin, S. Optimization of process parameters in oriented strand board manufacturing with artificial neural network analysis. Eur. J. Wood Wood Prod. 2013, 71, 769–777. [Google Scholar] [CrossRef]
- Shao, Y.E.; Hou, C.D. Hybrid Artificial Neural Networks Modeling for Faults Identification of a Stochastic Multivariate Process. Abstr. Appl. Anal. 2013, 2013, 386757. [Google Scholar] [CrossRef][Green Version]
- Tiryaki, S.; Bardak, S.; Bardak, T. Experimental investigation and prediction of bonding strength of Oriental beech (Fagus orientalis Lipsky) bonded with polyvinyl acetate adhesive. J. Adhes. Sci. Technol. 2015, 29, 2521–2536. [Google Scholar] [CrossRef]
- Chen, C.; Li, J.; Yin, J.; Zhang, F.; Yao, J. Quality Prediction Based on ANN in Tobacco Redrying Process. Adv. Mater. Res. 2011, 211–212, 1046–1050. [Google Scholar] [CrossRef]
- Cheng, C.S.; Cheng, H.P. Identifying the source of variance shifts in the multivariate process using neural networks and support vector machines. Expert Syst. Appl. 2008, 35, 198–206. [Google Scholar] [CrossRef]
- Abbasi, B. A neural network applied to estimate process capability of non-normal processes. Expert Syst. Appl. 2019, 36, 3093–3100. [Google Scholar] [CrossRef]
- Esteban, L.G.; García Fernández, F.; de Palacios, P.; Conde, M. Artificial neural networks in variable process control: Application in particleboard manufacture. For. Syst. 2009, 18, 92–100. [Google Scholar] [CrossRef]
- Hosseinifard, S.Z.; Abdollahian, M.; Zeephongsekul, P. Application of artificial neural networks in linear profile monitoring. Expert Syst. Appl. 2011, 38, 4920–4928. [Google Scholar] [CrossRef]
- Cook, D.F.; Whittaker, A.D. Neural network models for prediction of process parameters in wood products manufacturing. In Proceedings of the 1st Industrial Engineering Research Conference, Chicago, IL, USA, 20–21 May 1992. [Google Scholar]
- Cabaneros, S.M.; Huges, B. Methods used for handling and quantifying model uncertainty of artificial neural network models for air pollution forecasting. Environ. Modell. Softw. 2022, 158, 105529. [Google Scholar] [CrossRef]
- Cao, R. An overview of bootstrap methods for estimating and predicting in time series. Test 1999, 8, 95–116. [Google Scholar] [CrossRef]
- Khosravi, A.; Nahavandi, S.; Creighton, D. Quantifying uncertainties of neural network-based electricity price forecast. Appl. Energy 2013, 112, 120–129. [Google Scholar] [CrossRef]
- Hadjicharalambous, M.; Polycarpou, M.M.; Panayiotou, C.G. Online Approximation of Prediction Intervals Using Artificial Neural Networks. In Artificial Neural Networks and Machine Learning—ICANN 2018: 27th International Conference on Artificial Neural Networks, Rhodes, Greece, 4–7 October 2018; Kůrková, V., Manolopoulos, Y., Hammer, B., Iliadis, L., Maglogiannis, I., Eds.; Springer: Cham, Switzerland, 2018. [Google Scholar] [CrossRef]
- Young, T.M.; Perhac, D.G.; Guess, F.; León, R.V. Bootstrap confidence intervals for percentiles of reliability data for wood-plastic composites. For. Prod. J. 2008, 58, 106–114. [Google Scholar]
- International Laboratory Accreditation Cooperation (ILAC). Guidelines on the Reporting of Compliance with Specification; ILAC-G8:03; ILAC: Silverwater, Australia, 2009. [Google Scholar]
- Shahanaghi, K.; Nakhjiri, P. A new optimized uncertainty evaluation applied to Monte-Carlo simulation in platinum resistance thermometer calibration. Measurement 2010, 43, 901–911. [Google Scholar] [CrossRef]
- Young, T.M.; Leon, R.V.; Chen, C.H.; Chen, W.W.; Guess, F.M. Robustly Estimating Lower Percentiles When Observations Are Costly. Qual. Eng. 2015, 27, 361–373. [Google Scholar] [CrossRef]
- Edwards, D.J.; Guess, F.M.; Young, T.M. Improved estimation of the lower percentiles of material properties. Wood Sci. Technol. 2011, 45, 533–546. [Google Scholar] [CrossRef][Green Version]
- Khosravi, A.; Nahavandi, S.; Creigton, D.; Atiya, A.F. Lower upper bound estimation method for construction of neural network-based prediction intervals. IEEE Trans. Neural Netw. 2011, 22, 337–346. [Google Scholar] [CrossRef] [PubMed]
- Khosravi, A.; Nahavandi, S.; Creigton, D.; Atiya, A.F. Comprehensive review of neural network-based prediction intervals and new advances. IEEE Trans. Neural Netw. 2011, 22, 1341–1356. [Google Scholar] [CrossRef]
- Khosravi, A.; Nahavandi, S.; Srinivasan, D.; Khosravi, R. Constructing Optimal Prediction Intervals by Using Neural Networks and Bootstrap Method. IEEE Trans. Neural Netw. Learn. Syst. 2015, 26, 1810–1815. [Google Scholar] [CrossRef] [PubMed]
- García Fernández, F.; Esteban, L.G.; de Palacios, P.; García-Iruela, A.; Cabedo Gallén, R. Estimating the Uncertainty of a Multilayer Perceptron Using the Monte Carlo Method. Adv. Mater. Res. 2013, 628, 324–329. [Google Scholar] [CrossRef]
- Hosen, M.A.; Khosravi, A.; Nahavandi, S.; Creighton, D. Aggregation of PI-based Forecast to Enhance Prediction Accuracy. In Proceedings of the 2014 International Joint Conference on Neural Networks (IJCNN) IEEE International Joint Conference on Neural Networks, Beijing, China, 6–11 July 2014. [Google Scholar]
- Hosen, M.A.; Khosravi, A.; Nahavandi, S.; Creighton, D. Improving the Quality of Prediction Intervals Through Optimal Aggregation. IEEE Trans. Ind. Electron. 2015, 62, 4420–4429. [Google Scholar] [CrossRef]
- Nerea Portillo, J.; Matutano, C.; Negro Valdecantos, V. Uncertainties in the application of artificial neural networks in ocean engineering. Ocean Eng. 2023, 284, 115193. [Google Scholar] [CrossRef]
- Stoma, P.; Stoma, M.; Dudziak, A.; Caban, J. Bootstrap Analysis of the Production Processes Capability Assessment. Appl. Sci. 2019, 9, 5360. [Google Scholar] [CrossRef]
- Chryssolouris, G.; Lee, M.; Ramsey, A. Confidence interval prediction for neural network models. IEEE Trans. Neural Netw. 1996, 7, 229–232. [Google Scholar] [CrossRef]
- MacKay, K.J.C. A practical Bayesian framework for backpropagation networks. Neural Comput. 1992, 4, 448–472. [Google Scholar] [CrossRef]
- EN 312; Particleboards. Specifications. European Committee of Standardization (CEN): Brussels, Belgium, 2010.
- EN 326-1; Wood-Based Panels. Sampling, Cutting and Inspection. Part 1: Sampling and Cutting of Test Pieces and Expression of Test Results. European Committee of Standardization (CEN): Brussels, Belgium, 1994.
- EN 322; Wood-Based Panels. Determination of the Moisture Content. European Committee of Standardization (CEN): Brussels, Belgium, 1993.
- EN 323; Wood-Based Panels. Determination of Density. European Committee of Standardization (CEN): Brussels, Belgium, 1993.
- Efron, B.; Tibshirani, R.J. An Introduction to the Bootstrap; Chapman & Hall: New York, NY, USA, 1993; p. 436. [Google Scholar]
- Mazloumi, E.; Rose, G.; Currie, G.; Moridpour, S. Prediction intervals to account for uncertainties in neural network predictions: Methodology and application in bus travel time prediction. Eng. Appl. Artif. Intell. 2011, 24, 534–542. [Google Scholar] [CrossRef]
- Zhang, C.; Fu, Y. Probalilistic electricity price forecast with optimal prediction intervals. IEEE Trans. Power Syst. 2024, 39, 442–452. [Google Scholar] [CrossRef]
- Su, D.; Ting, Y.Y.; Ansel, J. Tight prediction intervals using expanded internal minimization. arXiv 2018, arXiv:1806.11222. [Google Scholar] [CrossRef]
- Lai, Y.; Shi, Y.; Han, Y.; Shao, Y.; Qi, M.; Li, B. Exploring uncertainty in regression neural networks for construction of prediction intervals. IEEE Trans. Knowl. Data Eng. 2022, 481, 249–257. [Google Scholar] [CrossRef]
- Zhang, J.; Liu, Z.; Chen, T. Interval prediction of ultra-short-term photovoltaic power based on a hybrid model. Electr. Power Syst. Res. 2023, 216, 109035. [Google Scholar] [CrossRef]
- Kasiviswanathan, K.S.; Cibin, R.; Sudheer, K.P.; Chaubey, I. Constructing prediction interval for artificial neural network rainfall runoff models based on ensemble simulations. J. Hidrol. 2013, 499, 275–288. [Google Scholar] [CrossRef]
- Hornik, K.; Stinchcombe, M.; White, H. Multilayer feedforward networks are universal approximators. Neural Netw. 1989, 2, 359–366. [Google Scholar] [CrossRef]
- De Veaux, R.; Ungar, L.H. Neural networks in applied statistics—Discussion. Technometrics 1996, 38, 215–218. [Google Scholar] [CrossRef]
- Cook, D.F.; Ragsdale, C.T.; Major, R.L. Combining a neural network with a genetic algorithm for process parameter optimization. Eng. Appl. Artif. Intell. 2000, 13, 391–396. [Google Scholar] [CrossRef]
- Ozsahin, S. The use of an artificial neural network for modeling the moisture absorption and thickness swelling of oriented strand board. BioResources 2012, 7, 1053–1067. [Google Scholar] [CrossRef]
- Iliadis, L.; Tachos, S.; Avramidis, S.; Mansfield, S. Hybrid e-regression and validation soft computing techniques: The case of wood dielectric loss factor. Neurocomputing 2013, 107, 33–39. [Google Scholar] [CrossRef]
- Buratti, C.; Barelli, L.; Moretti, E. Application of artificial neural network to predict thermal transmittance of wooden windows. Appl. Energy 2012, 98, 425–432. [Google Scholar] [CrossRef]
- Buratti, C.; Barelli, L.; Moretti, E. Wooden windows: Sound insulation evaluation by means of artificial neural networks. Appl. Acoust. 2013, 74, 740–745. [Google Scholar] [CrossRef]
- De Palacios, P.; Fernández, F.G.; García-Iruela, A.; González-Rodrigo, B.; Esteban, L.G. Study of the influence of physical properties on internal bond of particleboard type P2 using artificial neural networks. Comput. Electron. Agric. 2018, 155, 142–149. [Google Scholar] [CrossRef]
- Demuth, H.; Beale, M.; Hagan, M. Neural Network Toolbox User’s Guide Release 13, 4th ed.; The MathWorks Inc.: Natick, MA, USA, 2002; p. 808. [Google Scholar]
- Sarle, W.S. Neural Network FAQ, Part 1 of 7: Introduction, Periodic Posting to the Usenet Newsgroup comp.ai.neural-nets. 2022. Available online: https://gbif.es/wp-content/uploads/2010/05/NeuralNetworkFAQ.pdf (accessed on 10 January 2025).
- Sha, W. Comment on the issues of statistical modelling with particular reference to the use of artificial neural networks. Appl. Catal. A-Gen. 2007, 324, 87–89. [Google Scholar] [CrossRef]
- EN 326-2; Wood-Based Panels. Sampling, Cutting and Inspection. Part 2: Initial Type Testing and Factory Production Control. European Committee of Standardization (CEN): Brussels, Belgium, 2014.
- EN 326-2; Sampling, Cutting and Inspection. Part 2: Quality Control in the Factory. European Committee of Standardization (CEN): Brussels, Belgium, 2000.
- Papadopoulus, G.; Edwards, P.; Murray, A.F. Confidence estimation methods for neural networks: A practical comparison. IEEE Trans. Neural Netw. 2001, 12, 1278–1287. [Google Scholar] [CrossRef]
- Secchi, P.; Zoi, E.; di Maio, F. Quantifying uncertainties in the estimation of safety parameters by using bootstrapped artificial neural networks. Ann. Nucl. Energy 2008, 35, 2338–2350. [Google Scholar] [CrossRef]
- Demirkir, C.; Özsahin, S.; Aydin, I.; Colakoglu, G. Optimization of some panel manufacturing parameters for the best bonding strength of plywood. Int. J. Adhes. Adhes. 2013, 46, 14–20. [Google Scholar] [CrossRef]
- Bardak, S.; Tiryaki, S.; Nemli, G.; Aydin, A. Investigation and neural network prediction of wood bonding quality based on pressing conditions. Int. J. Adhes. Adhes. 2016, 68, 115–123. [Google Scholar] [CrossRef]
- García Fernández, F.; de Palacios, P.; Esteban, L.G.; García-Iruela, A.; Gonzalez Rodrigo, B.; Menasalvas, E. Prediction of MOR and MOE of structural plywood board using an artificial neural network and comparison with a multivariate regression model. Compos. Part B Eng. 2012, 43, 3528–3533. [Google Scholar] [CrossRef]
- André, N.; Cho, H.W.; Baek, S.H.; Jeong, M.K.; Young, T.M. Prediction of internal bond strength in a medium density fiberboard process using multivariate statistical methods and variable selection. Wood Sci. Technol. 2008, 42, 521–534. [Google Scholar] [CrossRef]
- Khosravi, A.; Nahavandi, S.; Creigton, D. Construction of optimal prediction intervals for load forecasting problems. IEEE Trans. Power Syst. 2010, 25, 1496–1503. [Google Scholar] [CrossRef]
- Khosravi, A.; Nahavandi, S. An optimized mean variance estimation method for uncertainty quantification of wind power forecasts. Int. J. Electr. Power Energy Syst. 2014, 61, 446–454. [Google Scholar] [CrossRef]
- Shrivastava, N.A.; Panigrahi, B.K. Point and prediction interval estimation for electricity markets with machine learning techniques and wavelet transforms. Neurocomputing 2013, 118, 301–310. [Google Scholar] [CrossRef]
- Wan, C.; Xu, Z.; Pinson, P.; Dong, Z.Y.; Wong, K.P. Optimal prediction of wind power generation. IEEE Trans. Power Syst. 2014, 29, 1166–1174. [Google Scholar] [CrossRef]
- Kasiviswanathan, K.S.; Sudheer, K.P. Comparison of methods used for quantifying prediction interval in artificial neural network hydrologic models. Model. Earth Syst. Environ. 2016, 2, 22. [Google Scholar] [CrossRef]
- Nourani, V.; Paknezhad, N.J.; Sharghi, E.; Khosravi, A. Estimation of prediction intervals in ANN-based multi-GCMs downscaling of hydro-climatologic parameters. J. Hydrol. 2019, 579, 124226. [Google Scholar] [CrossRef]
- Nourani, V.; Sayyah-Fard, M.; Kantoush, S.A.; Bharambe, K.P.; Sumi, T.; Saber, M. Optimization-based prediction uncertainty qualification of climatic parameters. J. Hydrometeorol. 2023, 24, 1679–1697. [Google Scholar] [CrossRef]
- Al-Dahidi, S.; Ayadi, O.; Alrbai, M.; Adeeb, J. Ensemble approach of optimized artificial neural networks for solar photovoltaic power prediction. IEEE Access 2019, 7, 81741–81758. [Google Scholar] [CrossRef]
- Seyedian, S.M.; Kisi, O.; Parsaie, A.; Kashani, M. Improving the reliability of compound chanel discharge prediction using machine learning techniques and resampling methods. Water Resour. Manag. 2024, 38, 4685–4709. [Google Scholar] [CrossRef]
- Chen, H.; Zheng, Y.; Huang, H.; Wang, Z.; Yang, B. A point-interval prediction framework for minimum miscibility pressure of CO2-crude oil systems. Fuel 2025, 381, 133573. [Google Scholar] [CrossRef]


Disclaimer/Publisher’s Note: The statements, opinions and data contained in all publications are solely those of the individual author(s) and contributor(s) and not of MDPI and/or the editor(s). MDPI and/or the editor(s) disclaim responsibility for any injury to people or property resulting from any ideas, methods, instructions or products referred to in the content. |
© 2025 by the authors. Licensee MDPI, Basel, Switzerland. This article is an open access article distributed under the terms and conditions of the Creative Commons Attribution (CC BY) license (https://creativecommons.org/licenses/by/4.0/).