Abstract
Mining companies are increasingly being motivated to become High Reliability Organisations (HROs) in order to achieve better results in critical areas such as safety, environment management, and loss avoidance despite their complex environments. High Reliability Organisations are recognised by their abilities to effectively anticipate failures and disasters, including use of lessons learnt from previous failures. This paper seeks to demonstrate how designers for systems in the mining industry can learn from failures to anticipate failures and effectively manage them. It also demonstrates the applicability of a hybrid model which incorporates and integrates Fault Tree Analysis (FTA), Reliability Block Diagram (RBD) analysis, Risk Priority Number (RPN) concepts, and Analytical Hierarchy Processes (AHPs) in a case study for a High Potential Incident (HPI) at an underground hard rock mine. It shows how valuable lessons can be extracted and how these lessons can be used in decision making to prevent and manage future failures. The main contribution of this work is the demonstration of incorporating HRO principles with a hybrid modelling framework for learning from failures.
1. Introduction
Mining-related failures can be catastrophic and result in loss of life, environmental consequences, and financial losses for the company [1]. High Reliability Organisations have the ability to learn from failures and disasters through the use of various tools and methods to prevent the occurrence or repeats of the same failures. Organisations, designers, and engineers can implement measures that can prevent the reoccurrences of failures or disasters by learning from these failures [2]. Various studies [2,3] have demonstrated how several reliability analysis techniques can be applied as framework models for learning from failures.
In this paper, a hybrid model that consists of a number of reliability analysis techniques such as Fault Tree Analysis (FTA), Reliability Block Diagrams (RBDs), and Failure Mode Effect and Criticality Analysis (FMECA) are applied to a case study of a High Potential Incident (HPI) fire incident at an underground hard rock mine in Southern Africa, which will be referred in this paper as the PGM mine, as PGM is the name of the case study organisation, which for reasons of anonymity cannot be revealed. Studies have indicated that mine fires are the highest contributing factors to mass deaths in mines [4,5]. Another study [5] further expressed concerns over the threats these fires pose to underground mine workers.
Therefore, the main research questions of this work are: (1) How can a hybrid model that combines various useful features be employed? (2) Can this approach be demonstrated through a case study? To explain the usefulness of the hybrid model through the case study, the analysis will also be carried out with the perspective of the High Reliability Organisation principles.
The next section will detail how the various tools mentioned above have been used by other researchers to learn from failures. A brief summary of the HPI to be used for analysis is also provided, with the next sections outlining the methodology applied, analysis performed, and results obtained. The last section will give the conclusions of this study, outlining the strengths and weaknesses of the approach and future work.
2. Theoretical Frameworks
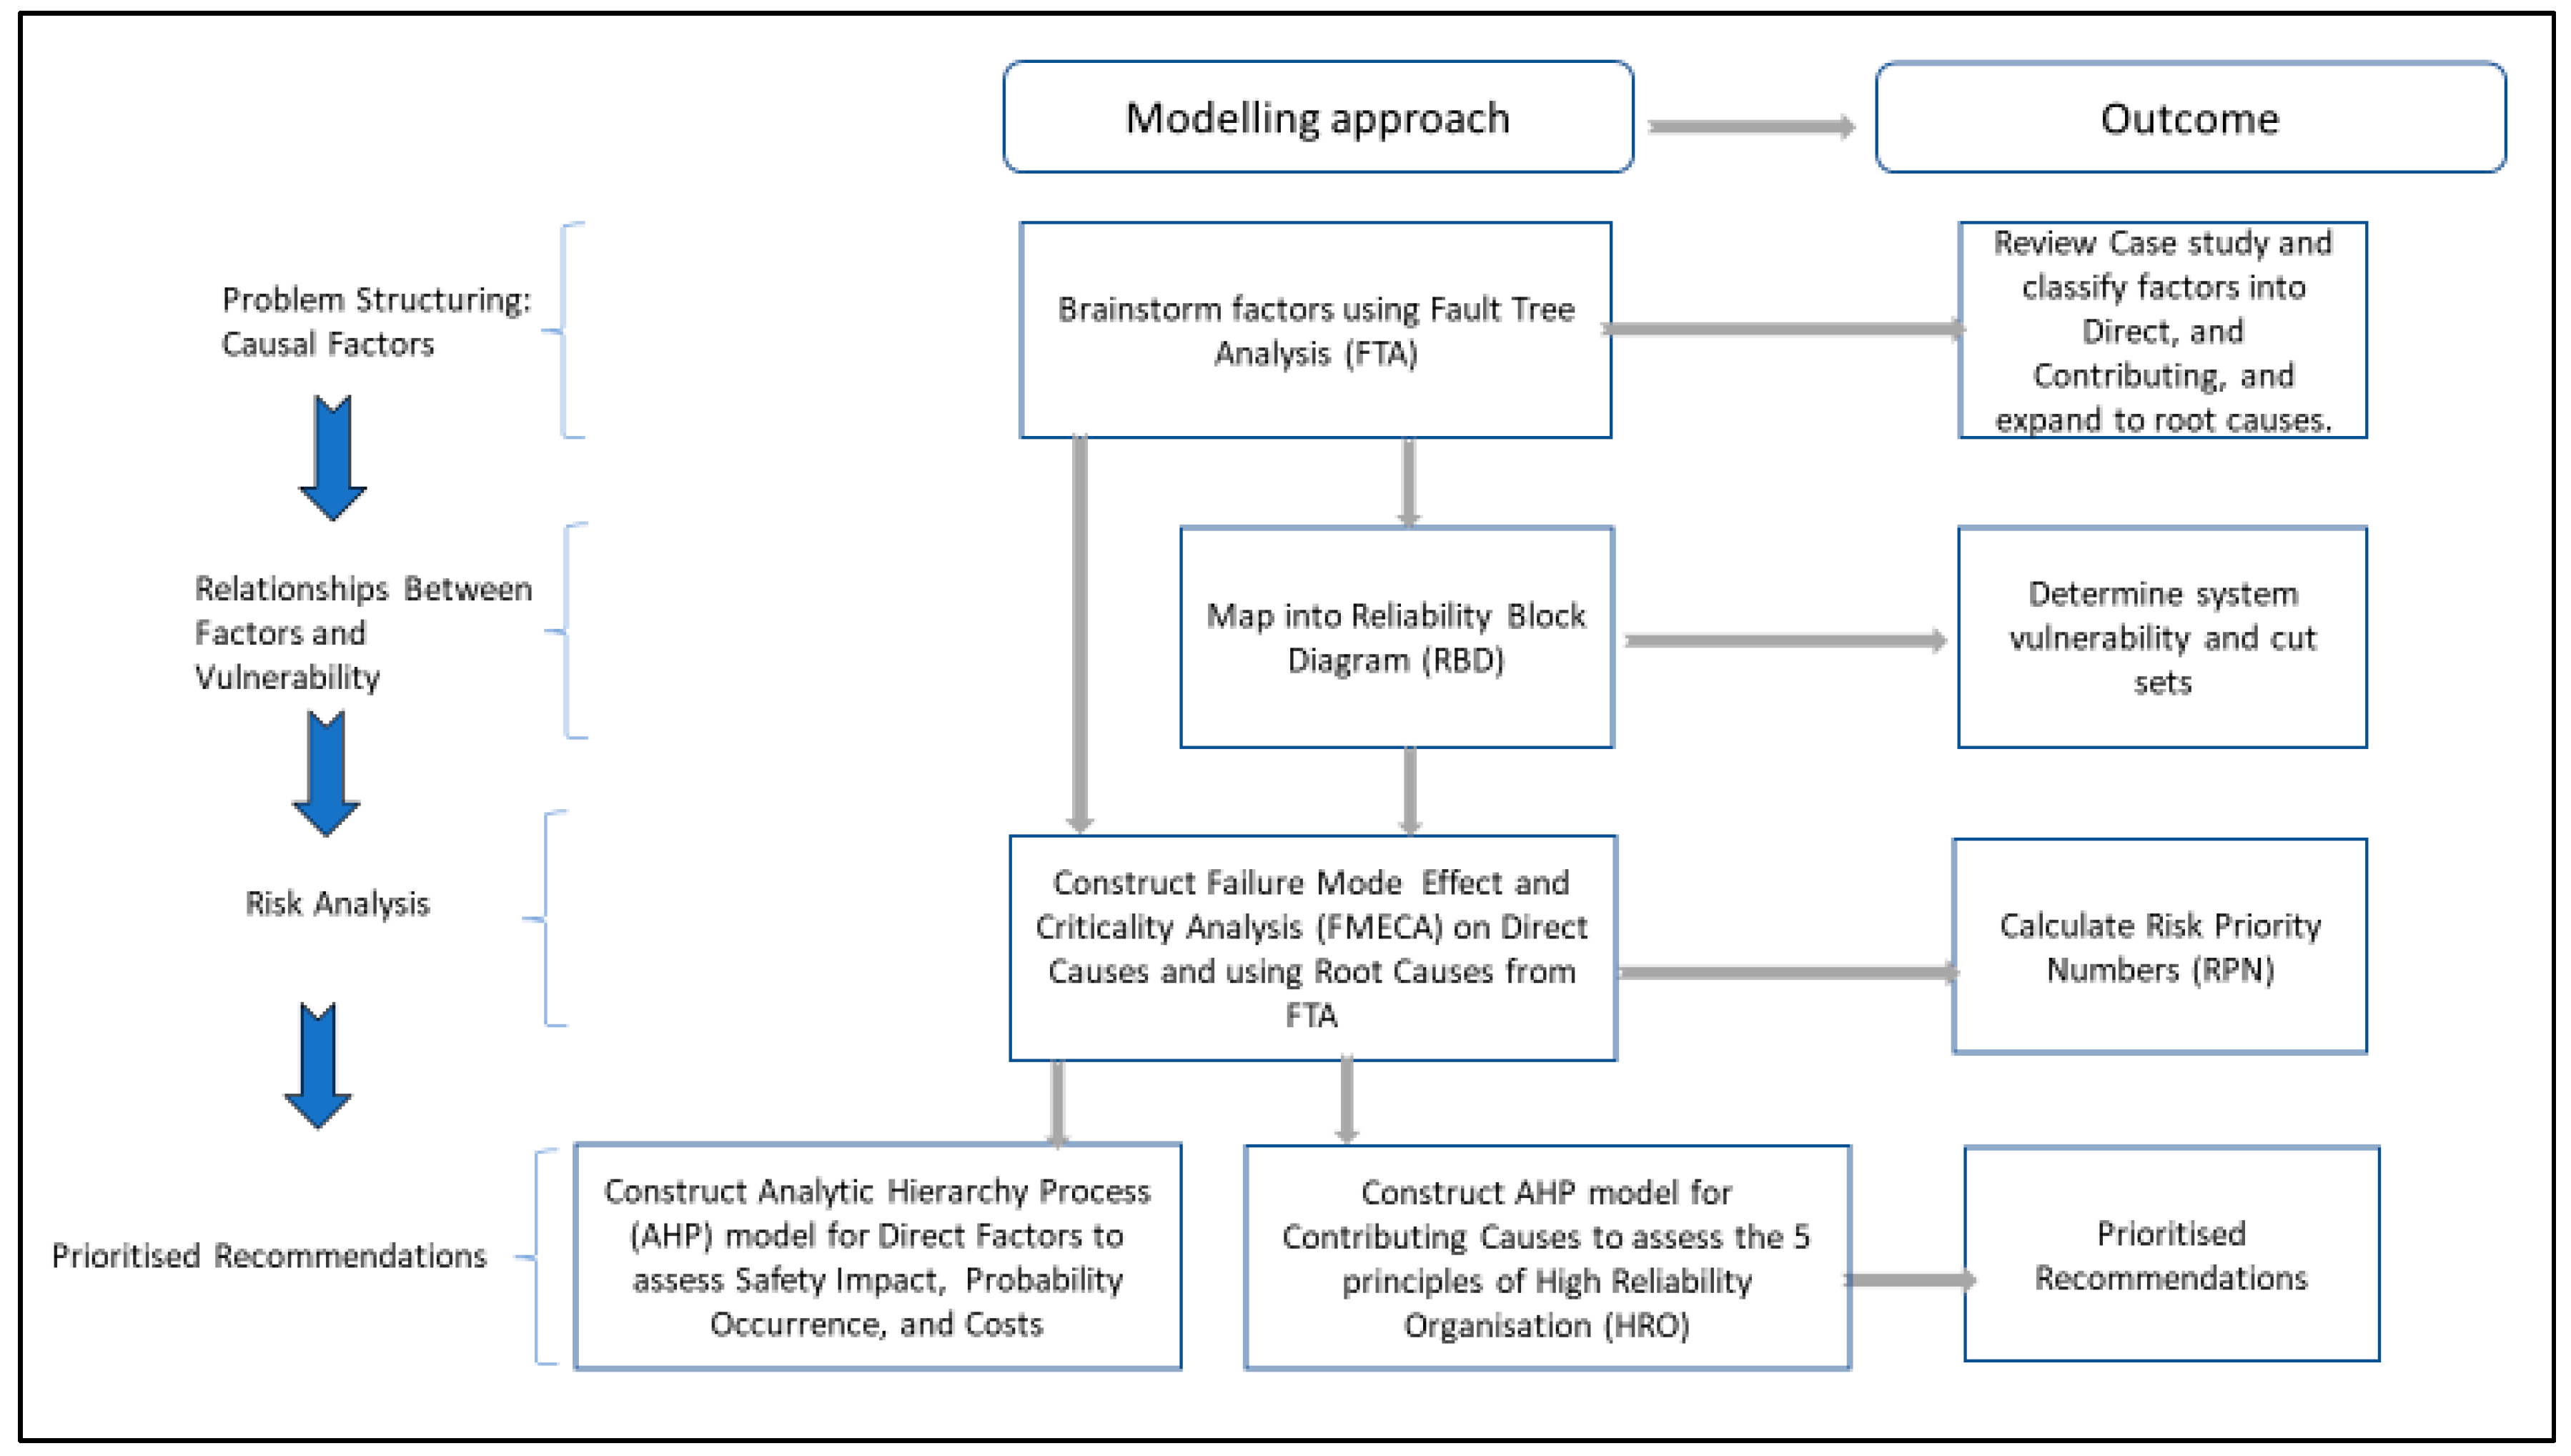
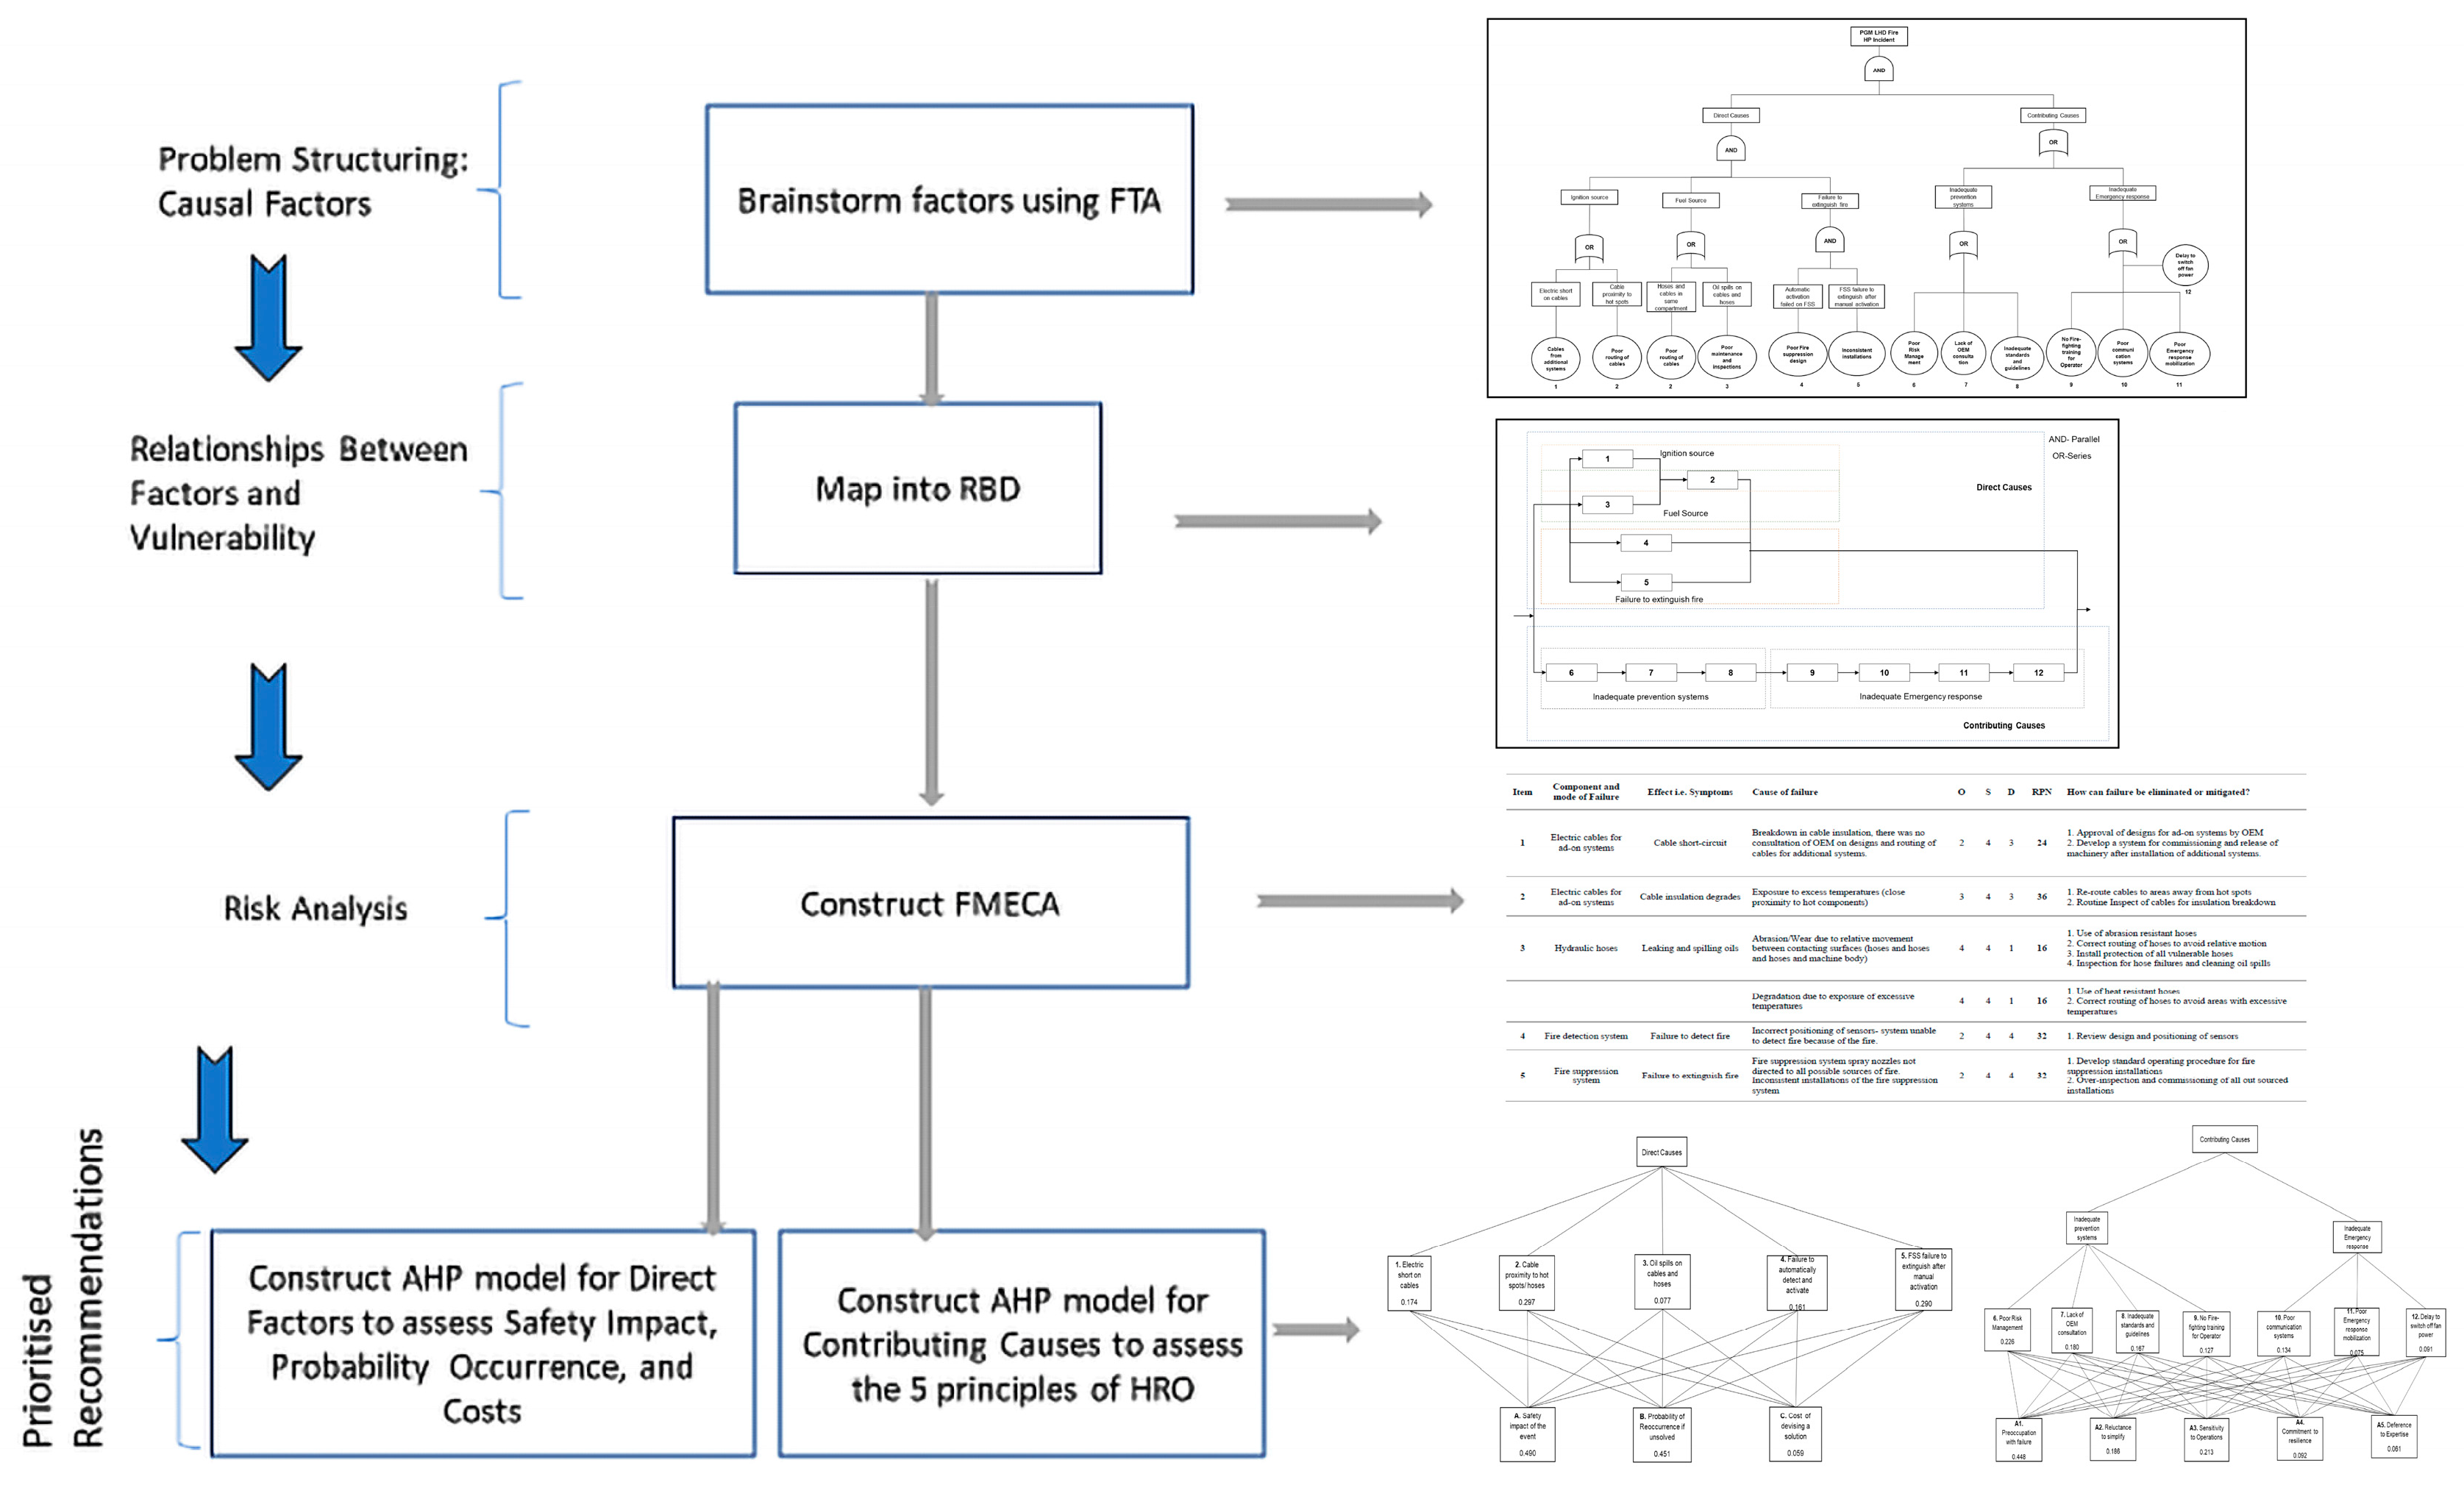
The proposed hybrid model consists of techniques organised in different phases. The first one is a problem-structuring phase in terms of analysing causal factors. This includes a brainstorming exercise of different factors using the FTA modelling approach. The outcome of this phase is to systematise the review of the case study by classifying the factors into direct and contributing (indirect) factors, as well as expanding them into sublevels of root causes. The second phase aims at establishing the relationships between different factors and an assessment of vulnerability scenarios within the whole system. This is achieved through mapping the FTA into a RBD using a set of mapping rules. This phase produces a cut set analysis. The third phase is involves risk assessment, including the construction of FMECA focused on the direct causes and using the root causes from the FTA model. The aim of this phase is to determine the Risk Priority Numbers (RPNs) of different failure modes. The reason for focussing only on direct causes here is that it is more practical to quantify the components of RPN for direct compared to indirect causes. The final phase prioritises recommendations in terms of assessment of safety impact, probability of occurrence, and costs. It also prioritises the changes needed in order to become a High Reliability Organisation (HRO). This is achieved by constructing two models based on the Analytic Hierarchy Process (AHP) for direct factors and contributing (indirect) causes.
The proposed framework aims at disaster risk reduction. Specifically, the framework demonstrates the main objective of this paper to show how a combination of integrated techniques in the form of a hybrid model can be applied to a case study in such a way to demonstrate the benefits obtained from every technique. The design of the framework also provides a societal impact through interdisciplinary studies, as it combines techniques inspired from reliability (through the use of FTA, RBD, and FMECA), operational research (through the use of AHP), and organisational resilience (through the incorporation of HRO) disciplines.
A summary of the theoretical framework is shown in Figure 1 below.
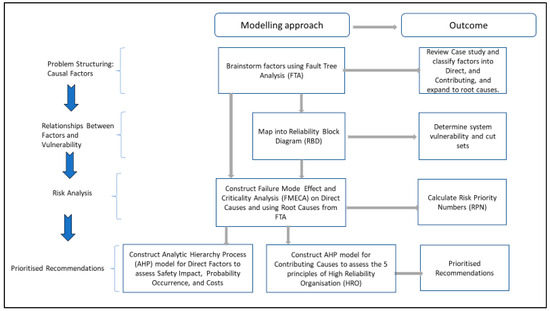
Figure 1.
Proposed hybrid framework.
Note that in Figure 1, the FMECA can be obtained either directly from the FTA or from a combination of FTA and RBD. When selecting different techniques for the hybrid model, we ensured that the output of every technique fed as an input to the subsequent used technique. Each of the mentioned modelling techniques above is explained in the following subsections.
2.1. HRO Principles
High Reliability Organisations continue to operate with performance almost free from errors and harm despite using complex technologies in extremely hazardous environments where minor failures can be catastrophic. They operate to avoid catastrophic failures, but if these failures eventually occur, they are setup to contain the consequences [6]. Various studies [1,6,7] have reviewed the five characteristics of these organisations, which were outlined by ref. [8]. The same authors [8] identified these as five key ideas of mindful infrastructure and attributed the performance of highly reliable organisations to them. The first three are preoccupancy with failure, reluctance to simplify, and sensitivity to operations, which define the organisation’s capacity to deal with unexpected failures [6,8]. The last two, identified as commitment to resilience and deference to expertise, deal with the capacity to contain the failures [6,8]. These principles will be reviewed in detail in this section.
Preoccupancy with failure is a characteristic that allows HROs to proactively identify signs of possible failures. Minor errors and near missies are treated as opportunities to learn and improve potential weaknesses [6,8]. As an illustrative practice, “pre-operatively people spend time identifying activities they do not want to go wrong. In handoffs or reports to oncoming staff, people discuss what to look out for” [9]. As an example, the failure to report haze noticed in the horizon was identified as lack of preoccupancy with failure and one of the reasons for the Titanic disaster [6].
Reluctancy to simplify “shows how organisations continuously balance simplification and standardization of processes, with undue generalisations. They have standardized processes, yet actively seek divergent viewpoints that question received wisdom, uncover blind spots and detect changing demands” [6]. Reference [6] provides the NASA Challenger disaster as an example of when management oversimplified the concerns on design flaws, which resulted in a disaster.
Sensitivity to operations can be identified as “fostering strong working relationships throughout the organisation, so that minor issues with operational processes or practices can be identified and fixed quickly before they worsen” [1]. The HROs are alert to the operation details with the right people, competence, and motivation. Ref. [9] provided illustrative practice for sensitivity to operations as “People interact often enough to build a clear picture of what is happening here and now. People have a good ‘map’ of each other’s talents and skills. People have access to a variety of resources whenever unexpected surprises crop up”.
Commitment to resilience is characterised by “developing capabilities to cope with, contain, and bounce back from mishaps that have already occurred, before they worsen and cause more serious harm” [9]. The lack of emergency response processes to enable emergency rescue missions was identified as lack of commitment to resilience [6].
Deference to expertise describes the condition where decision making is yielded to a subject matter expert, regardless of their roles during emergencies. This is unlike what happens during normal operations, where there is reliance on a hierarchy with clearly defined roles and responsibilities [6]. The Piper Alpha incident was referred to as a clear example of failure to defer to expertise [6], where experienced staff qualified to make decisions during the emergency waited to receive shutdown instructions from their leadership.
2.2. FTA
The FTA involves the development of a fault tree, which is a logical model that shows how basic events interact to result in an overall undesirable event known as a ‘TOP Event’ [2]. Different causes of a TOP event are related through logic gates [10]. The OR-gate represents whether one event is sufficient, and the AND-gate denotes all factors required to happen simultaneously. The FTA is used to identify the causes of a failure and illustrate how these causes relate during failure analysis. The information obtained from the FTA can be used at input in RBDs. FTA is one of the commonly used reliability analysis techniques in learning from failure studies [2,10], with demonstration of how this technique can be used to learn from disasters and major failures.
2.3. Reliability Block Diagram (RBD)
The RBD is a mental model developed from the FTA to attempt to visualise the relationship between basic events to identify vulnerabilities in the model. A summary of rules on how to develop an RBD from an FTA model is shown below [10].
- OR relationships in the FTA become series configurations on the equivalent RBD
- AND relationships in the FTA become parallel configurations in the equivalent RBD
- Extraction is performed from the top of the tree
- Only the basic events are modelled
- The order does not matter on the RBD
- Real root causes should be identified
- Both the FTA and RBD are mental models for risk analysis, not risk assessment
Appendix A shows the theoretical foundation for mapping FTA to RBD. Further analysis from the RBD model can be performed by applying axioms of Boolean algebra to identify the cut sets, which are a group of basic events on the FTA whose occurrence will lead to the occurrence of the top event [3]. The Boolean algebra rules are applied to determine the cut set for the analysis. Various studies [2,3] have used this analysis to identify vulnerable aspects of models.
2.4. FMECA
The FMECA is a methodology designed to identify the failure modes of a process, the associated effects, the cause of the failure, and how the failure can be prevented [10]. Through an analysis of other types of disasters [10], it was illustrated how the FMECA can be used to learn from failures or disasters. The study also outlined how the assessment of the likelihood of occurrence, severity, and detection can be achieved, as well as how the Risk Priority Number (RPN) is calculated. The RPN can be used to prioritise the identified failure modes and devise corrective action plans [10].
2.5. AHP
The Analytical Hierarchy Process (AHP) is a method that is used to assign weights to criteria in a multi-criteria decision-making process [11]. This method is used to rank a set of alternatives or to select the best in a set of alternatives. The ranking or selection is performed with respect to an overall goal, which is broken down into a set of criteria. In summary, the method aims at establishing weights to be associated with each criterion in defining the overall goal [12]. The AHP is structured in a hierarchy consisting of a minimum of three levels, i.e., the top level, the second level, and the lowest level. The top, second, and lowest levels are represented by the goal of the decision-making problem, the criteria, and the alternatives, respectively. The AHP consists of four main steps in its analysis. The first step involves identifying the goal, criteria, and alternatives. In the second step, the weights of the alternatives are determined based on pairwise comparisons. In the third step, the criteria are ranked using the alternative weights. Step four is a criteria-alternative performance scores analysis [13]. The pairwise comparison method compares the relative importance of each attribute in relation to the other attributes. The importance of each attribute is dependent on the responses of the decision makers, which are considered to be devised based on their experience and the information about the attributes that is available. The decision makers make the judgements, which are represented by numbers on a fundamental scale. One of the earliest scales of comparison was introduced [14] in the 1980s with the introduction of the standard scale of 1–9, where an integer value of 1 indicates equal importance, 9 indicates extreme importance, and reciprocals are considered to indicate a degree of less importance; that is, 1/9 indicates very low importance [14]. The AHP is a reliable method and has been applied to a variety of industries and in a variety of decision-making problems, including integrated resource planning, environmental impact assessment, climate change negotiations, etc. [12].
3. Case Study
The case study is based on an HPI fire that occurred due to mobile machinery at an underground hard rock mine in Southern Africa that will be referred to as the PGM mine for the purposes of this study. There was no information on the incident published prior to this study. Despite the lack of information publicly available regarding the incident, this case study provides a good foundation for the use of the tools demonstrated in this study. This also allows readers to learn or apply reliability analysis techniques to learn from failures that have not been studied before. The authors will provide the details and background of the incident for the reader’s familiarisation.
3.1. Background
The PGM mine is an underground hard rock mine in Southern Africa with mining operations to extract precious metals through bord and pillar mining. The mine uses trackless mobile machinery for its operations, except for conveyance of ore from the underground mining sections to the processing plant, which uses fixed conveyor belts. There are three main categories for this production trackless mobile machinery—face drilling machines, roof supporting machines, and hoisting machines, which are commonly known as Load, Haul, and Dump (LHD) machines. The incident reviewed in this case study occurred on one of the LHD machines. The mine utilizes three models for these machines, which will be referred to as model A, 500, and model C. The LHD machines are used to hoist broken ore from the blasted faces to tipping points for sizing by hydraulic breakers before conveyance to the processing plant. These machines are hydraulic-operated machines powered by diesel engines.
3.2. Synopsis of the Incident
On 2 March 2022, as the LHD operator was moving a model B (Machine number 47) to the tipping area, he noticed fire in the transverter section, and he stopped the machine and activated the automatic fire suppression system. However, the automatic fire suppression system could not extinguish the fire completely. He went on to use the portable fire extinguisher to suppress the fire. He then proceeded to look for his supervisor to inform him about the fire, which he thought he had put out. On his return to the machine, accompanied by the support team leader, they found that the fire had reignited. They went on to look for backup firefighting equipment to put out the fire but did not manage to quench the fire completely. The LHD continued burning until the fire was extinguished by the mine rescue team 35 min later.
3.3. Consequences and Potential Consequences
The following consequences were a result of the incident:
- Injuries and Fatalities: There were no injuries or fatalities. However, the incident had the potential to directly expose personnel to the fire or compromise the mine’s ventilation. More than 10 people were operating in that section, and a total of more than 150 people were in the mine at the time of the incident. For this reason, the incident was classified as a High Potential Incident (HPI).
- Damage/Loss of property: The affected machine was damaged beyond recovery, and replacement of the machine would cost the company more than EUR 500,000, which is considered a significant amount of loss given the size of the company. The machine had only used 18% of its useful life. The incident also had had the potential to result in further loss of property due to propagation of the fire to other assets if it was not contained in time.
- Production Losses: It was estimated that production volumes of up to 20,000 tonnes of ore would be lost in that year as a result of this incident. Again, the incident had the potential of far greater consequences if the fire was to propagate to other production areas.
Based on the summary of the consequences above, it can be understood why the incident was classified as an HPI. The case study was also selected based on the nature of these consequences. The potential consequences justify the need to analyse and learn from this incident and the associated failures in order to develop measures to prevent reoccurrence, which can result in more catastrophic failures. As already highlighted, various studies have indicated that mine fires are the highest contributing factors to mass deaths in mines [4,5,15].
HROs are characterised by preoccupation with failure, which enables continuous improvement through learning and driving proactive analyses of any potential weaknesses [6,8]. Although there were no fatalities in this incident, the history of fire incidents in mines has shown that they can be catastrophic and fatal. For this reason, learning from this incident is essential.
3.4. Investigation Findings
In this section, we summarise the key findings from the investigations that were carried out without specifying the causes. Insights from these findings provide the analysis to unpack the direct and contributing causes, which will be outlined in the next section.
The location of origin for the fire was confirmed through the investigations carried out. A high-pressure filter and hydraulic pump had melted in the transverter section of the machine, where the fire was intense. This was consistent with the observations made by the operator at the time of the incident. These machines are equipped with automated fire suppression systems, which should be able to detect and suppress fires in areas with a high likelihood of fires. The fire suppression systems should also have the means to manually activate the suppression system in the event of a fire, provided the system fails to automatically activate and discharge. In this particular case, the system was unable to detect the fire. However, the operator managed to manually activate the fire suppression system, but it was unable to extinguish the fire after discharging. It was discovered that there were no fire suppression system spray bar nozzles directed to this area of the machine. Inspections carried out on the fire suppression system installation on the other model B machines showed inconsistencies in nozzle orientation.
Investigations carried out on another model B machine indicated that there were electric cables close to hot components in the transverter areas. Thermal imaging was carried out on the components with temperatures that would compromise the insulation integrity of these cables. These cables were intertwined with hydraulic hoses, which showed signs of previous leaks and spills. Other cabling inconsistencies such as excess cables and incomplete cable installations were also noticed. Furthermore, several additional systems had been installed on these machines, which were not included in the original design of the machine. Management of these changes did not involve the Original Equipment Manufacturer (OEM), and the commissioning of these alterations were improperly managed.
After investigating why the operator was unable to fully extinguish the fire with a portable fire extinguisher, it was noted that the operator was a learner operator and had not received any firefighting training. It was noted that the portable fire extinguisher was unable to effectively extinguish the fire in this area with the covers in place. This also raised interest to understand why the operator had to leave the machine unattended to physically look for the supervisor to report the incident. It was noted that the operator did not have any communication device that would allow him to immediately communicate to trigger emergency response teams.
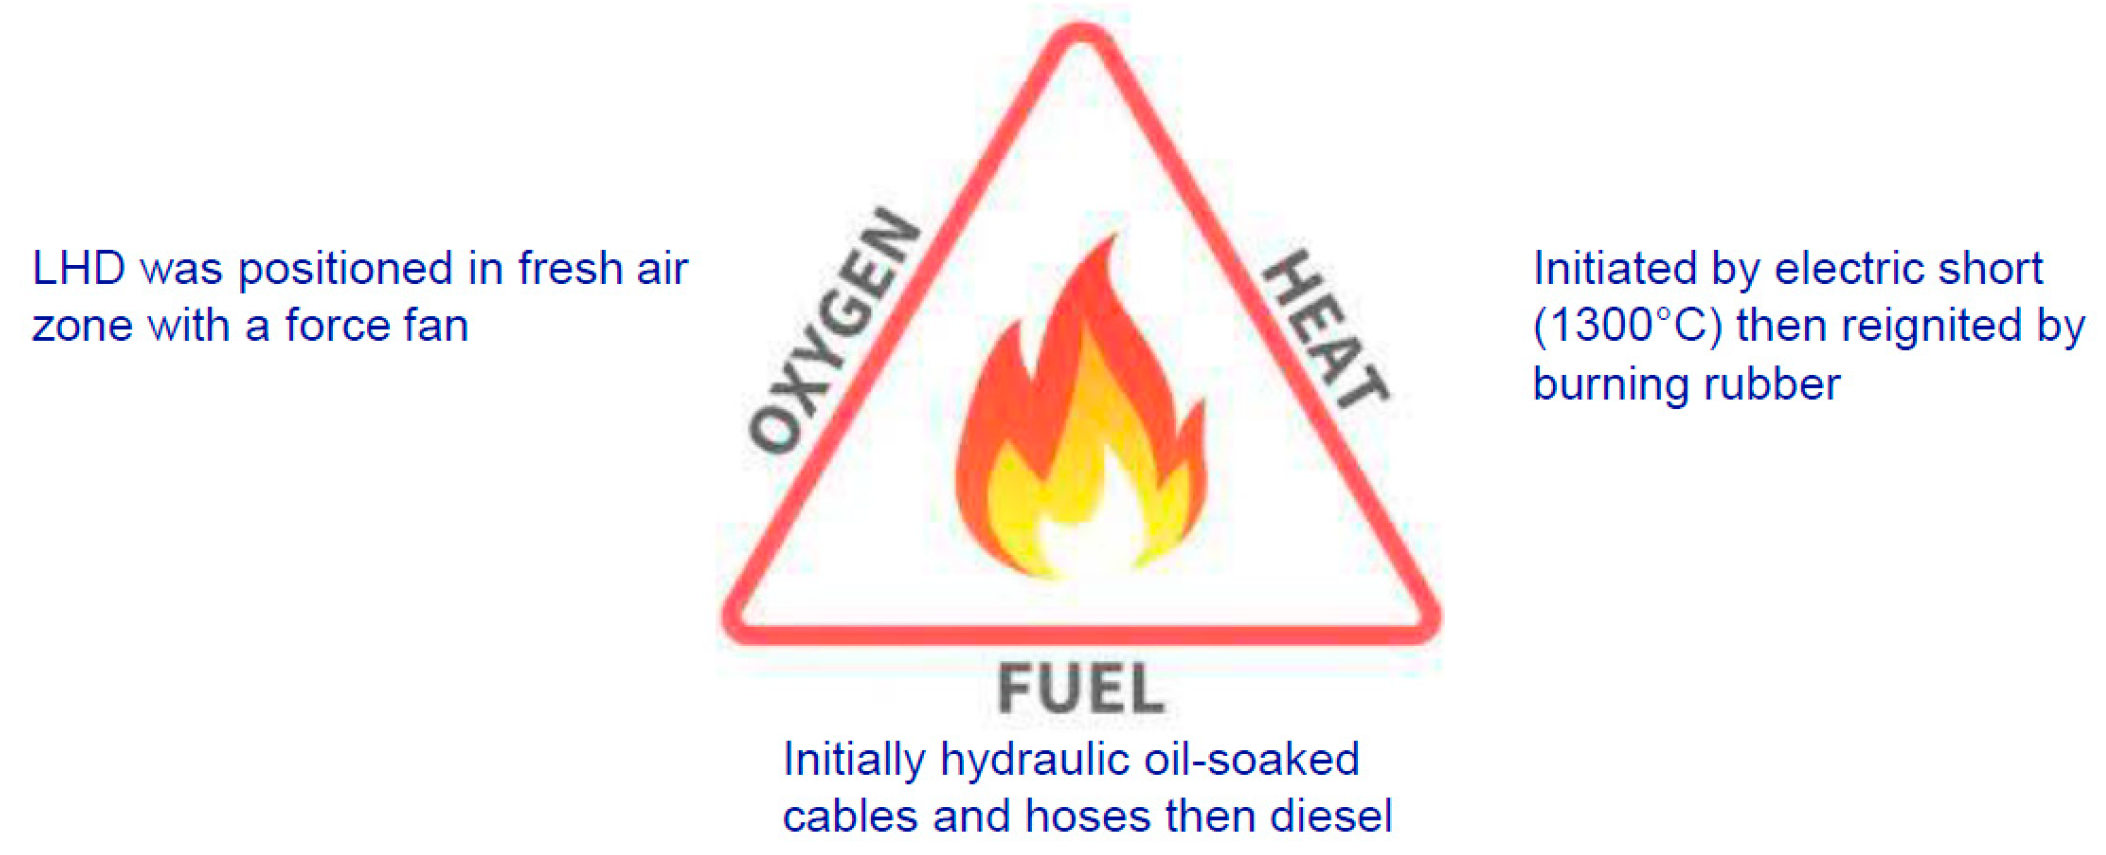
3.5. Direct Causes
A number of sources have indicated that three components are required for a fire to occur—oxygen, fuel, and an ignition or heat source, which is known as the “fire triangle” [16,17]. These elements were used to identify the direct causes of the incident in this study, as illustrated in Figure 2.
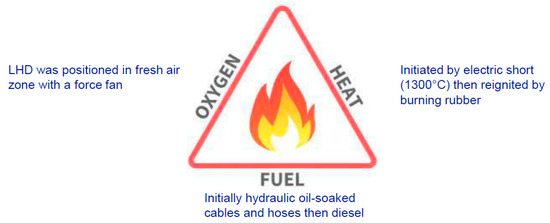
Figure 2.
Fire triangle for the PGM mine LHD HP incident.
The same author [16] further expressed that if we “remove any one of these and the fire will be extinguished”. Failure to extinguish the fire when the fire was initiated was also identified as a direct cause to the incident since the machine was equipped with an automatic fire suppression system.
These causes are summarized below:
- (a)
- Oxygen source: The machine was positioned in a fresh air zone with a force fan, which continued to supply the oxidizing agent to sustain the fire. The force fan power was not immediately switched off. This was, however, classified under the contributing causes in the FTA based on its reliance on management systems.
- (b)
- Fuel Source: The inital source was hydraulic oil-soaked cables and hoses. The hydraulic oil was a result of leaks and spills that had not been adequately cleaned. When the fire propagated, it then resulted in ignition of diesel.
- (c)
- Heat or ignition source: The fire was initiated by a short circuit on the electric cables for the additonal systems that had been installed on the machine. It was then reignited by burning rubber of the hydraulic hoses. The cables for the additional systems were not installed in consultation with the original equipment manufacturer to ensure adequate risk assessment. In addition to this, these cables were installed in close promixity to hot spots on the machine.
- (d)
- Failure to extinguish fire at initiation: The automatic fire suppression system was unable to detect the fire and automatically discharge. Even after maual activation, the system was unable to extinguish the fire at the source. This was because the fire suppression system nozzles were not directed to all the possible sources of fire.
3.6. Indirect or Contributing Causes
- (a)
- The factors that did not directly cause the fire but may have contributed indirectly to the incident and the consequences were also identified. These may have contributed to creating an environment to make the three elements of fire present in sequences leading to the incident, or they may have contributed to the failure of response systems to mitigate the consequences of the incident after the fire occurred. For example, after use of the portable fire extinguisher to extinguish the fire, the operator proceeded to look for the suprvisor, leaving the scene unattended, and the fire was reignited. With proper communication systems, communication should have occurred immediately at the scene to trigger emergency response teams. The operator’s failure to fully extinguish the fire with a portable fire extinguisher can also be attributed to the organisation’s failure to provide the operator with fire fighting training.
The contributing causes are summarized below:
- Poor risk management: No release or commissioning process was performed to certify the installations of the electricals for the additional systems.
- Lack of OEM consultation: The management of the change process did not involve the OEM to approve the installation of the electrical components of the additional systems.
- Inadequate standards and procedures: There was no standard procedure for the installation of the fire suppression system. The fire procedures did not outline the need for a fire watch in the event of a fire.
- No fire fighting training for the operator: The operator had only received training on how to activate the fire supression system and had not received any fire fighting training.
- Poor communication systems: The underground phone used to report the issue was further away from the scene, and the operator was unable to immediately report or call for assistance while still at the machine.
- Poor Emergency mobilization: The mobilization of resources and transportation of the emergency response teams took a long time. There was also no clarity of roles between the fire fighting crews and emergency response teams.
4. Proposed Model
The proposed model integrates the reliability analysis techniques of FTA, FMEC, RBD, and the MCDM tool of AHP. It is an extension of the model proposed by Labib and Read (2015) [10]. The extended model uses the HRO principles as alternatives for the AHP to identify contributing causes. Previous studies have also proposed this technique [18].
A summary of the methodology is given below:
- Step 1: Review case study and event and develop FTA for the direct, contributing, and root causes of the event.
- Step 2: Map the FTA into an RBD and determining the cut sets.
- Step 3: Formulate a FMECA study on the direct causes using the root causes from the FTA. Calculate the RPNs and propose ways of eliminating or mitigating the basic events.
- Step 4: Complete AHP based on safety and impacts of the event, probability of reoccurrence if unsolved, and cost of devising a solution as an alternative to the direct causes and the HRO principles for the contributing causes.
5. Analysis and Discussion
5.1. Fault Tree Analysis
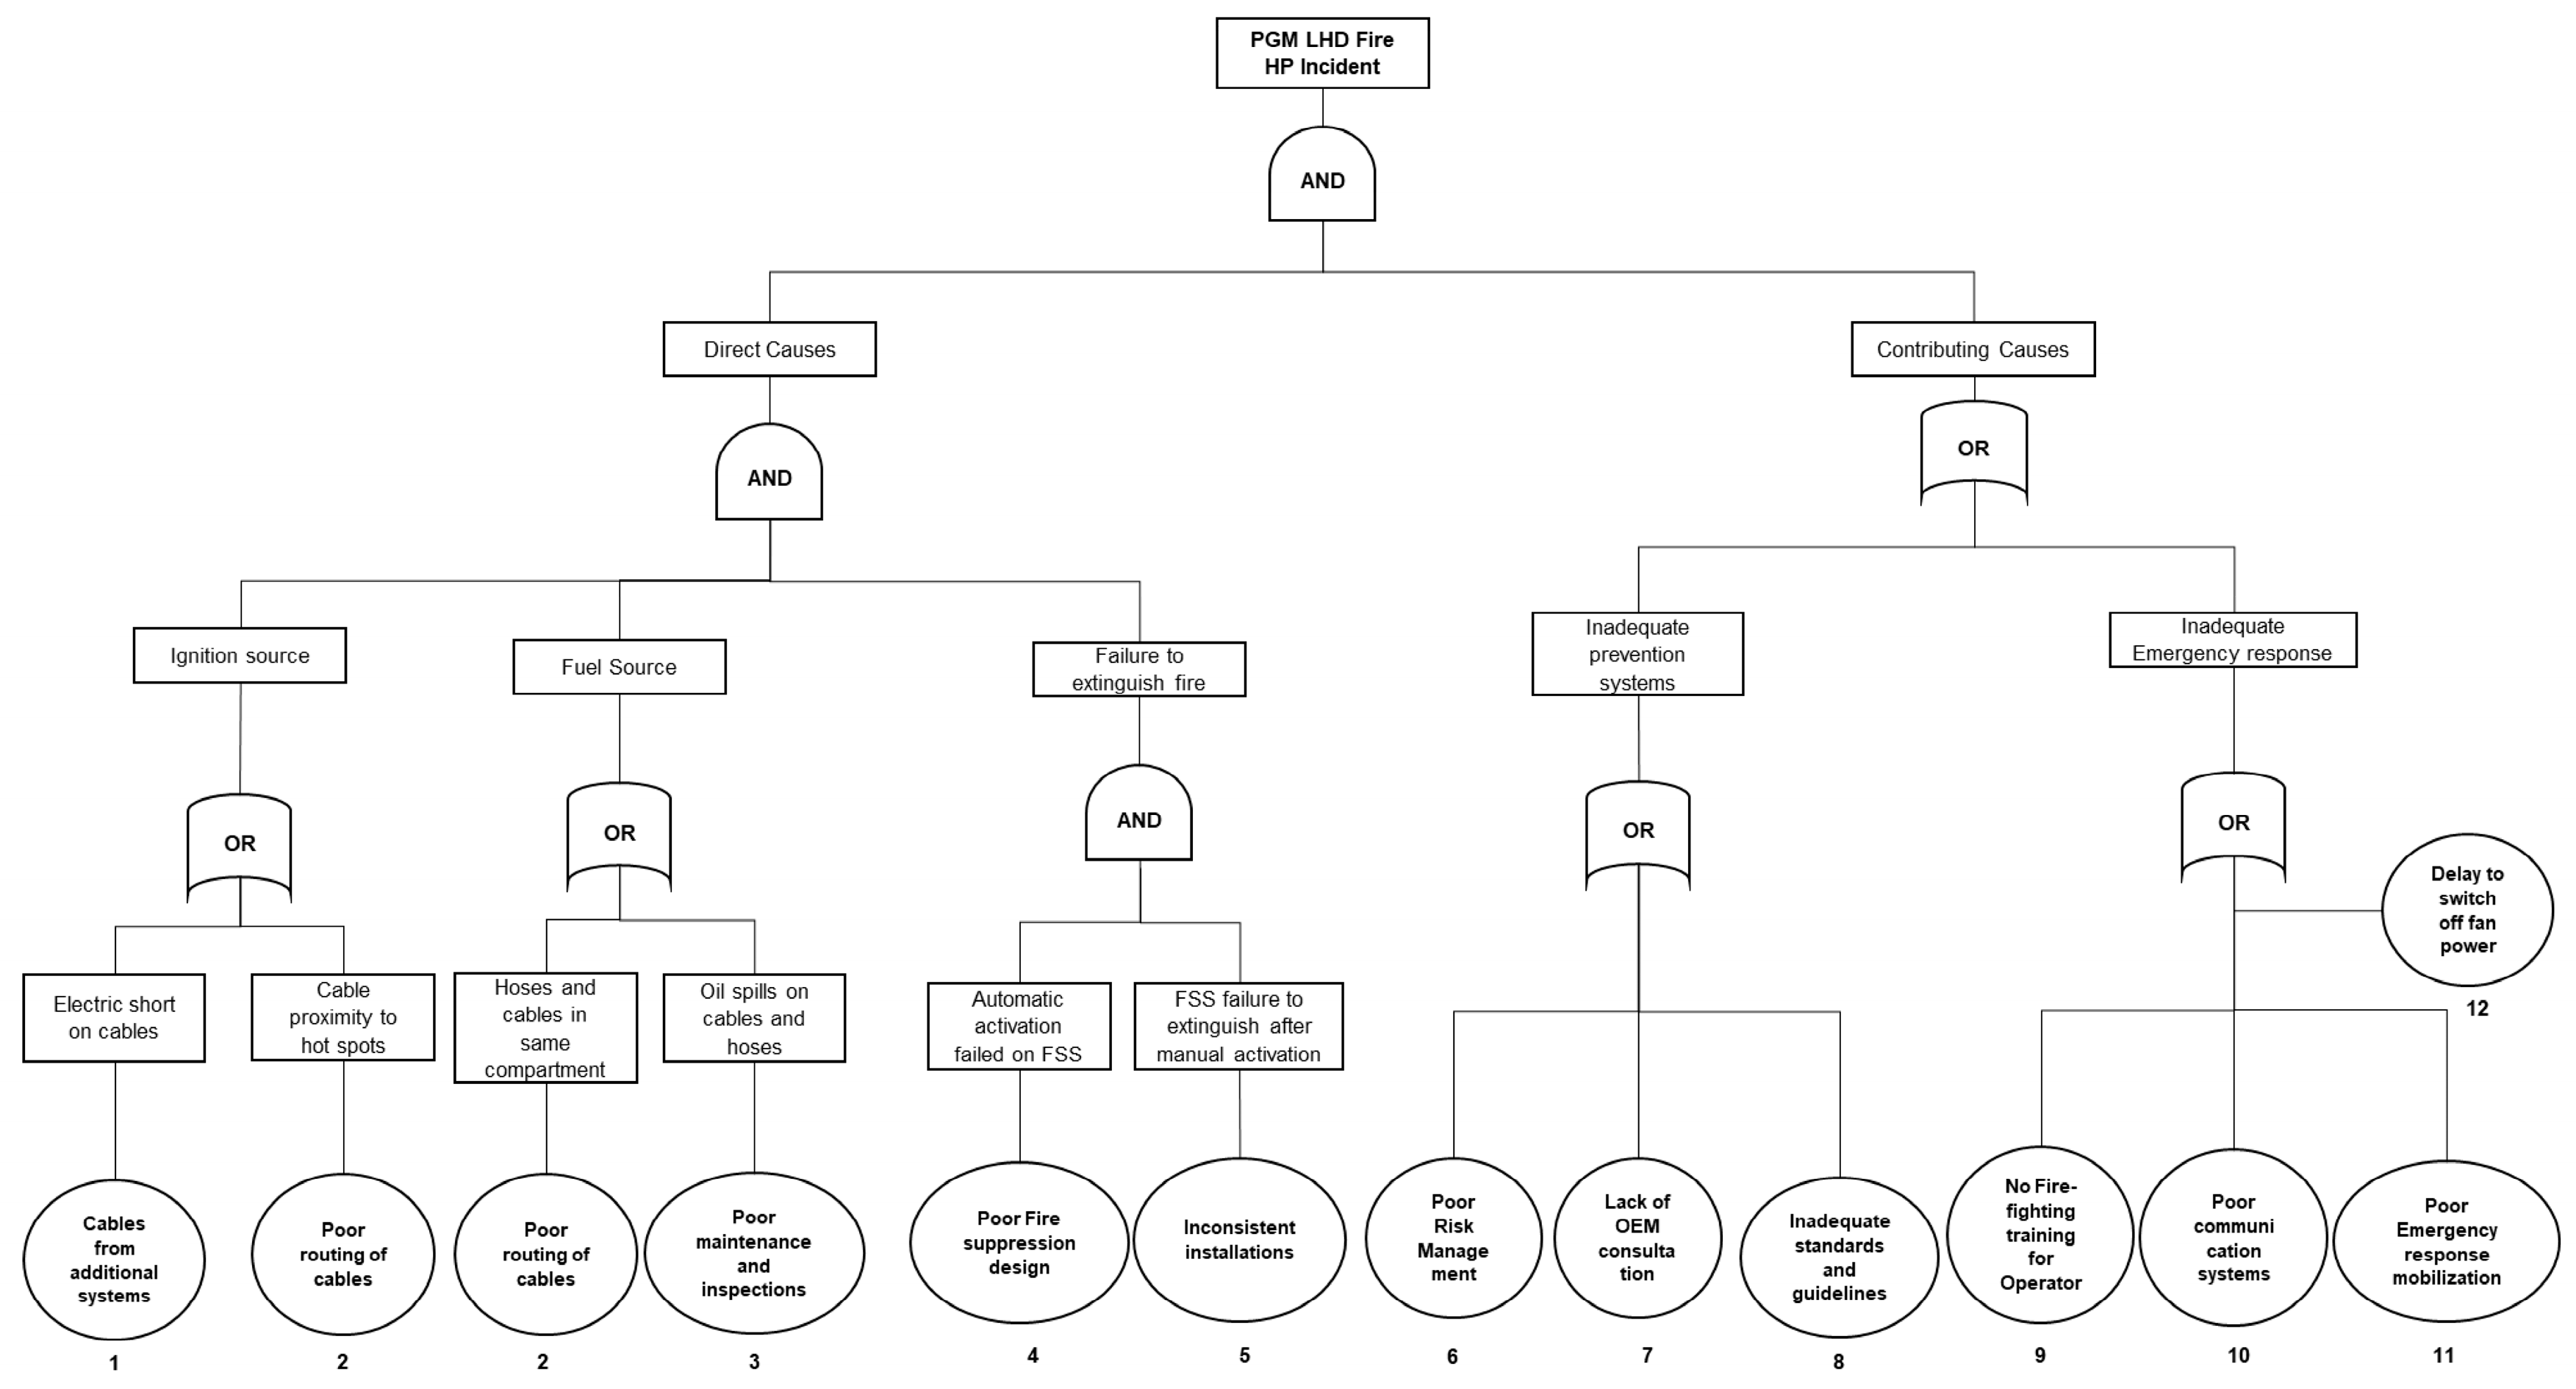
An FTA was carried out based on the findings and causes discussed in the case study. A fault tree is a logical model that shows the relationships between failure events that result in system failure. The tree consists of the ‘TOP’ event and various failures with the basic events. The different causes of the TOP event are related through logic gates [10]. Similar to the study by ref. [10], only AND-gate and OR-gates were only considered.
In the FTA for the case study in Figure 3, the TOP event is the machine fire high potential incident. The various failure events and their relationships are illustrated, and the basic events are at the bottom of the tree. According to this analysis, the direct causes ‘AND’ the contributing causes had to occur to result in the TOP event. For example, if the fire event occurs but there is an ‘adequate emergency response’, then the outcome will be different.

Figure 3.
Fault Tree Analysis (FTA) of the PGM mine LHD fire HP incident.
It is also important to note that failure events resulting in ‘failure to extinguish fire’ are connected by an AND-gate. This is because the fire suppression system was designed with redundancy to allow the operator to manually activate the system to discharge in the event that the system fails to detect the fire and automatically discharge. Both alternatives will have to fail to result in the event ‘failure to extinguish fire’. This was the case in this scenario, where the fire suppression failed to extinguish the fire after manual activation because the spray nozzles were not directed to the source of the fire.
It can be seen from this analysis that the FTA can provide a mental map that can assist in understanding the logic of the failure, as articulated by ref. [10]. This further highlights that the output from the FTA can be used as input for RBD analysis and to structure the AHP model, which is done in the next sections.
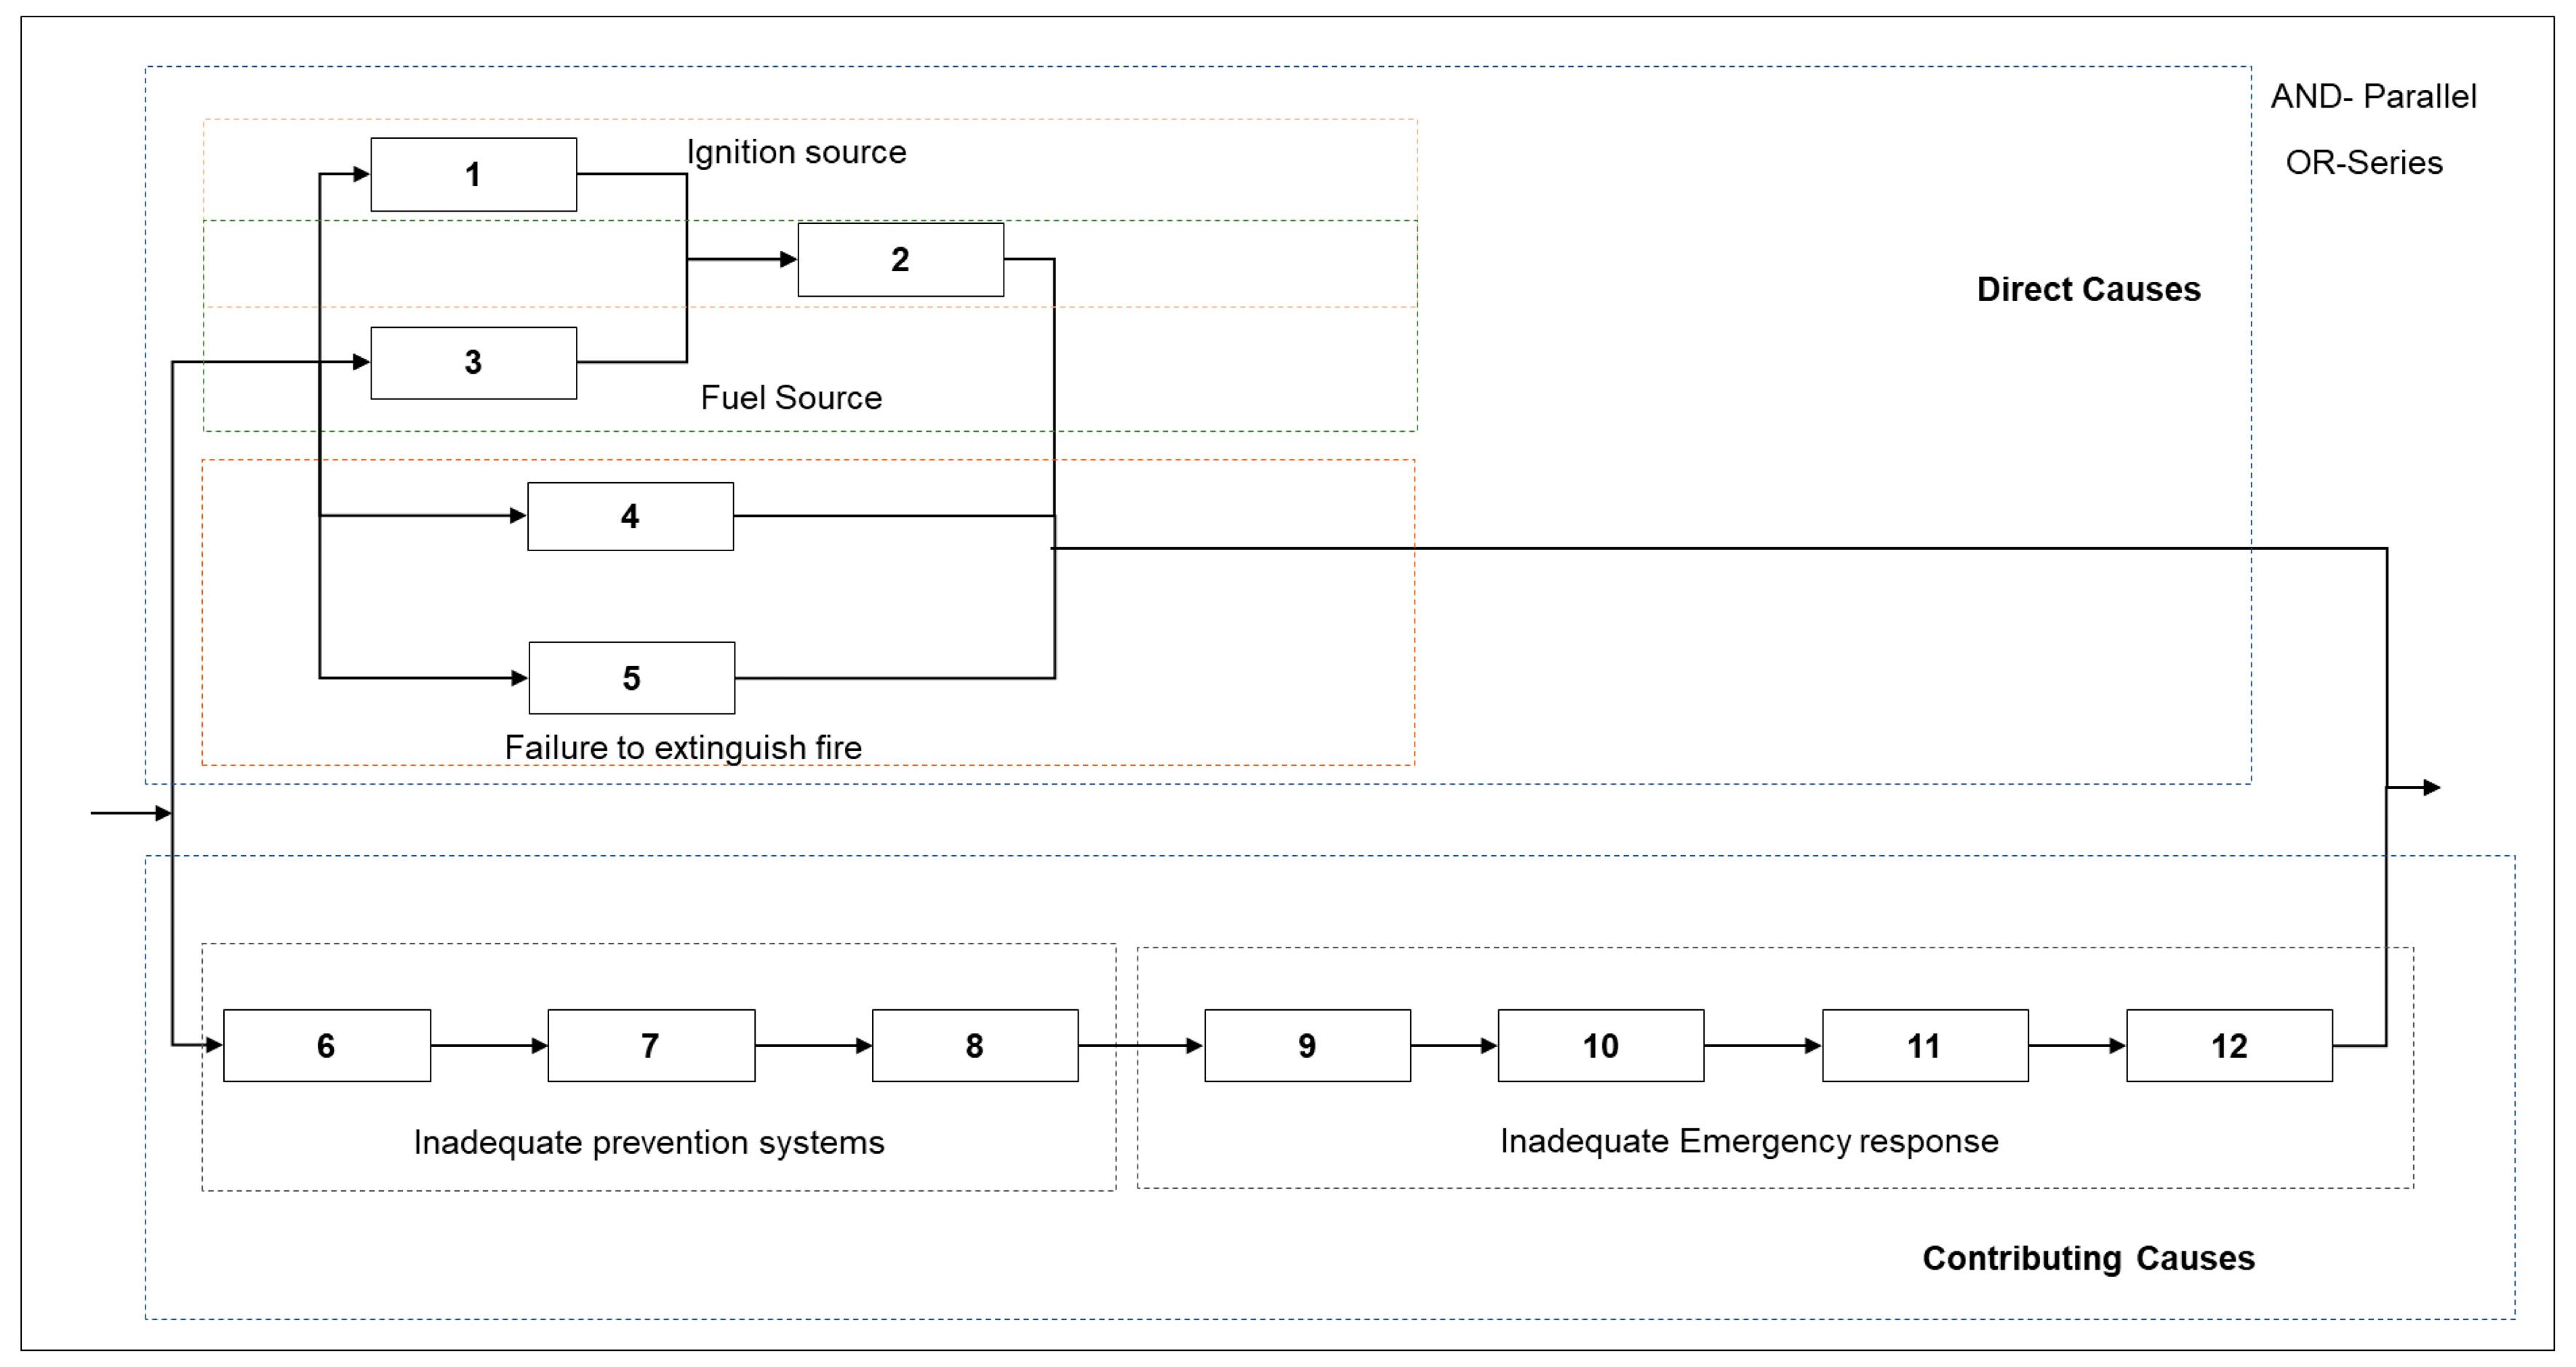
5.2. Reliability Block Diagram
The RBD developed from the relationships from the FTA is shown in Figure 4. The events connected by AND-gates will appear as parallel blocks, while those connected by OR-gates will appear as parallel on the RBD.
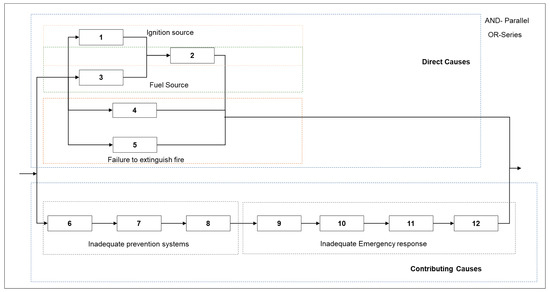
Figure 4.
The Reliability Block Diagram (RBD) of the PGM LHD fire HP incident (N.B. The numbers in this figure represents the numbers of the basic events in Figure 3).
Similar to the model in ref. [2], it can be noted that the contributing causes that are connected by OR-gates form a series system. In this case, failure of either of events 6, 7, 8, 9, 10, 11, or 12 will result in the collapse of the whole branch, with remaining reliance on the direct causes branch. Ref. [2] therefore emphasized on the need to treat indirect causes seriously when carrying out analyses of such failures.
The minimum cut set can be derived via application of the Boolean algebra rules. “The minimum cut set is a group of fault tree initiators which, if all occur, will cause the TOP event to occur” [3].
The logical expression of the TOP event for the LHD fire (HPI) is as follows:
- HPI = (1 + 2). (3 + 2). (4.5). (6 + 7 + 8 + 9 + 10 + 11 + 12)
- HPI = {1.3 + 1.2 + 2.3 + 2.2}. (4.5). (6 + 7 + 8 + 9 + 10 + 11 + 12)
- HPI = {1.3 + 1.2 + 2.3 + 2}. (4.5). (6 + 7 + 8 + 9 + 10 + 11 + 12) [applying a.a = a]
- HPI = {1.3 + 1.2 + 2}. (4.5). (6 + 7 + 8 + 9 + 10 + 11 + 12) [applying a + a.b = a]
- HPI = {1.3 + 2}. (4.5). (6 + 7 + 8 + 9 + 10 + 11 + 12) [applying a + a.b = a]
- HPI = {1.3.4.5 + 2.4.5}.(6 + 7 + 8 + 9 + 10 + 11 + 12)
- HPI = {1.3.4.5.6 + 1.3.4.5.7 + 1.3.4.5.8 + 1.3.4.5.9 + 1.3.4.5.10 + 1.3.4.5.11 + 1.3.4.5.12 + 2.4.5.6 + 2.4.5.7 + 2.4.5.8 + 2.4.5.9 + 2.4.5.10 + 2.4.5.11 + 2.4.5.12)
Therefore, the cut sets are: 1.3.4.5.6; 1.3.4.5.7; 1.3.4.5.8; 1.3.4.5.9; 1.3.4.5.10; 1.3.4.5.11; 1.3.4.5.12; 2.4.5.6; 2.4.5.7; 2.4.5.8; 2.4.5.9; 2.4.5.10; 2.4.5.11; 2.4.5.12.
Any of the cut sets will result in the occurrence of the TOP event.
Based on the minimum cut sets, the importance of the events 2, 4, and 5 can be noted, as their occurrence weakens all the other sets. In other words, the occurrence of poor routing of cables, the inability of the fire suppression system automatically activate and extinguish the fire, and failure to extinguish after manual activation weakens all the other sets.
Also, to show the benefits of RBD analysis, ref. [3] suggested spending resources on basic events represented by blocks in the RBD that control two or more other blocks. In this case, it will also be recommended to spend resources on 2, ‘poor routing of cables’, because it controls two blocks (1 and 3). This ultimately means controlling the initiation of the fire by controlling the ignition and fuel source (by referring to the FTA). However, the weakness of the RBD analysis is that it does not show the physical connections between the basic events and component failures.
5.3. Failure Modes, Effects, and Criticality Analysis
Ref. [10] highlighted that it is possible to carry out a FMECA only on the direct causes, as illustrated in their study of the Hurricane Katrina disaster. The basic FMECA template proposed by ref. [10] was also adopted in this study (Table 1, Table 2, Table 3 and Table 4) to summarize the effects (symptoms), cause of failure, and how the failure could be prevented or mitigated. It also includes the likelihood of occurrence, severity, difficulty of detection scores, and the calculated Risk Priority Numbers (RPNs).

Table 1.
RPN word model for FMECA of direct causes of the PGM LHD fire HPI in terms of probability of occurrence (O).
Table 2.
RPN word model for FMECA of direct causes of the PGM LHD fire HPI in terms of severity (S).
Table 3.
RPN word model for FMECA of direct causes of the PGM LHD fire HPI in terms of difficulty of detection (D).
Table 4.
FMECA of direct causes of the PGM mine LHD fire HP incident.
The RPN is calculated as follows:
RPN = Probability of occurrence of failure (O) × Severity (S) × Difficulty of detection (D)
There is no standard for RPN as this varies from one organisation to another. However, one good source for scoring RPN in FMECA can be found in FMEA Studio (https://www.iqasystem.com/news/risk-priority-number/) (accessed on 5 January 2025).
The word models with the criteria used to rate the scores of the incident are provided in Table 1, Table 2 and Table 3 below.
Based on the FMECA in this study, it is important to note that all failure modes were assigned a severity score of 4, which related to the TOP event.
According to ref. [10], the FMECA can be used to anticipate failures and prevent reoccurrence or mitigate the severity of occurrence. Ref. [10] further highlighted that if properly done, it can be used to prioritise the failure modes according to their calculated RPNs. Based on the FMECA study, it can be suggested to give priority to the failure modes associated with basic events 2, 4, and 5 with RPNs 36, 32, and 32, respectively. This is also consistent with the analysis performed based on the RBDs.
5.4. Analytical Hierarchy Process Modelling
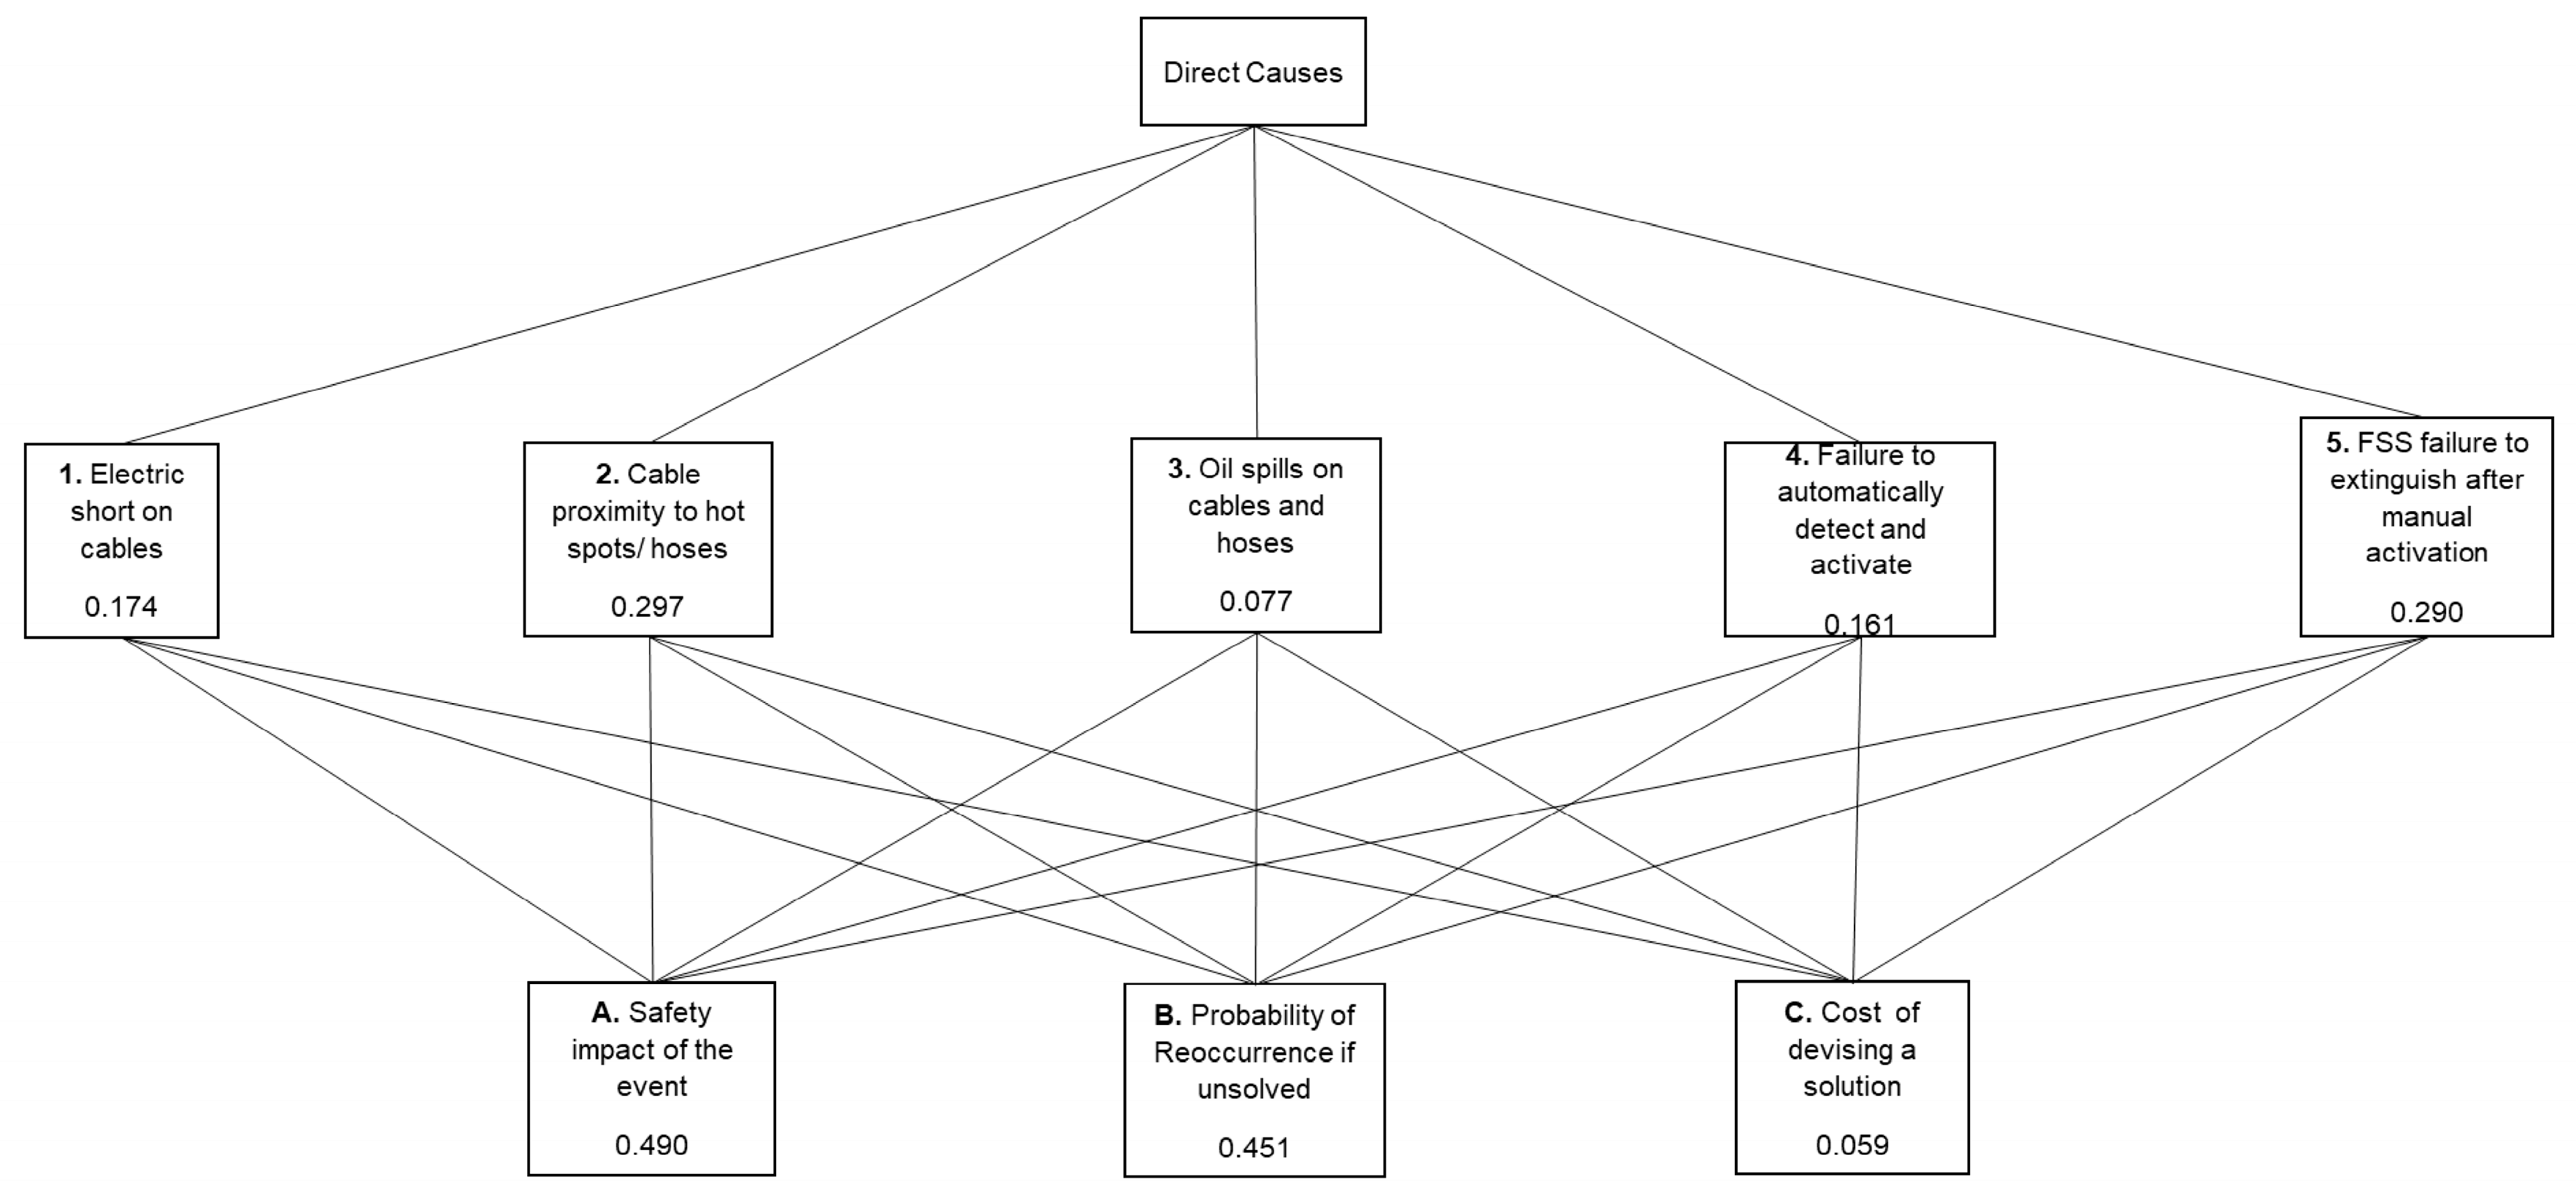
An AHP analysis was carried out on the direct causes an indirect cause separately, as shown in Table 5. The model explained in ref. [14], which was also summarized in ref. [2], was used to carry out the analysis. Appendix B shows how the AHP method works for weight allocation.
Table 5.
Pairwise comparison of event priority with respect to criteria and goal for the direct causes of the PGM mine LHD fire HPI.
According to ref. [2], safety impact (severity), probability of reoccurrence of the event if unsolved, and cost of devising a solution are common factors that can be considered as alternatives for the pairwise comparison. These were used in this study as alternatives for the direct causes in the pairwise comparisons. The hierarchical information was obtained from the FTA; however, the level above the basic events was considered for this study.
Based on the AHP structure (Figure 5) in Table 4, it can be deduced that event 2 has is of the highest priority, followed by 5, 1, 4, and 3. respectively. It can also be noted that based on the criteria used, it was important to consider the safety of the impact followed by the probability of reoccurrence before we consider the cost of devising a solution.

Figure 5.
AHP structure for direct causes of PGM mine fire HP incident.
For the contributing causes, a different approach was considered where the HRO principles were considered as the alternatives for the pairwise comparisons, as shown in Table 6. This is to give a perspective of HRO in the analysis. Ref. [18] proposed and illustrated how the five HRO principles can be employed as alternative solution options for the pairwise comparisons.
Table 6.
Pairwise comparison of event priorities with respect to criteria and goal for the contributing causes of the PGM mine LHD fire HPI.
Based pm the AHP structure (Figure 6), in Table 4, it can be deduced that event 6 was given the highest priority, followed by 7, 8, 10, 9, 12, and 11, respectively. It can also be noted that based on the criteria used, it was important to consider preoccupancy with failure followed by sensitivity to operations and reluctance to simplify before considering commitment to resilience and deference to expertise, respectively. Generally, more importance was given to HRO, which enables anticipation of the failure before methods for containment.
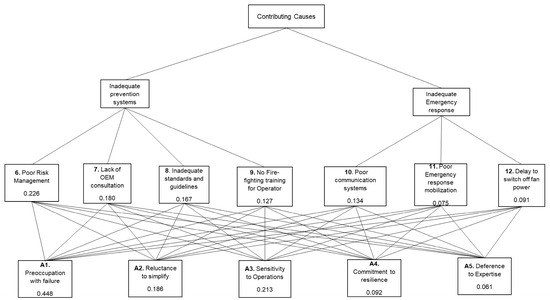
Figure 6.
AHP structure for contributing causes of PGM mine fire HP incident.
However, according to ref. [2], the weakness of this analysis is that it is subject to dependency on the judgement of the person using it. This could be the case in this study, as the analysis was based on the researcher’s familiarity with the incident, although input from the previous analysis such as FTA and FMECA and reference to previous studies [2,10,18] provided guidelines to maintain objectivity. As proposed by ref. [2], using a group of experts for scoring can eliminate this aspect.
Figure 7 provides a summary of the proposed framework and how, for illustration purposes, it was applied to the chosen case study. In practice, our approach can be applied as a stepwise application of the proposed techniques and compiled as a visual aid as part of organisational learning from incident reporting.
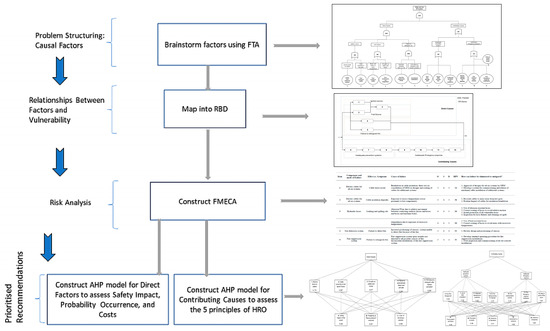
Figure 7.
A Summary of the hybrid framework and how it was applied to the chosen case study.
6. Conclusions and Future Works
The PGM mine LHD fire HP incident was investigated using the proposed hybrid model which integrated the reliability analysis techniques—FTA, RBD, FMECA, and AHP. The FTA identified the direct and contributing causes of the incident, the basic events, and how they relate to each other. The RBD extended the analysis from the FTA to identify weaknesses in the model. The analysis showed the need to seriously consider the contributing causes when analysing failures. It also showed the importance of basic event 2, ‘poor routing of cables’, as it controlled two backs on the RBD (1 and 3). Using the RBD analysis, the cut sets were identified, which showed how basic events 4 and 5 weakened the whole model. The FMECA identified the effects of the failure modes associated with the basic events on the direct causes and assigned the RPNs. The analysis showed that basic events 2, 4, and 5 had the highest priority numbers, suggesting priority in allocating resources should be given to these failure modes. Finally, the AHP showed that on the direct causes, basic event 2 was given the highest priority based on the criteria used, which consider the importance of safety of impact followed by probability of reoccurrence before the cost of devising a solution. Of the contributing causes, based on the AHP analysis using the HRO principles as alternatives, event 6 was given the highest priority based on the criteria used, which consider the importance to consider preoccupancy with failure followed by sensitivity to operations, reluctance to simplify before considering commitment to resilience, and deference to expertise, respectively.
In general, the analysis showed the importance of event 2, ‘poor routing of cables’, to prevent failure by controlling the fuel and ignition sources. If the cables for the additional systems were correctly routed, the risk would have been significantly reduced. To prevent the TOP event after initiation, the importance of basic events 4 and 5, which were related to failure of the fire suppression system, was demonstrated. If the fire suppression system was able to extinguish the fire after initiation, then the risk of the TOP event would also have been significantly reduced. Based on the perspective of HRO principles, the importance of anticipation of the failure, particularly preoccupancy to failure in this incident, is demonstrated. Priority is given to poor risk management, which would significantly contribute to preventing the failure.
The weakness of the model applied is its dependency on personal judgement, which can result in bias and inconsistencies. These can be eliminated by employing a group of experts to perform the analysis, especially when ranking is required. The model only applied the HRO principles on the pairwise comparison for the AHP analysis. To give a more detailed approach, we proposes the use of organisational reliability maturity models in future works.
It is hoped that the proposed framework flowchart of the integrated methodology will be a further contribution to the existing ones on risk assessment, such as those in refs. [19,20,21], with the added benefits of including principles of HRO and multiple criteria decision making using AHP. The hybrid model provides extra information that is not captured using any single model on its own. The hybrid model can also be extended to incorporate human reliability analysis and Bayesian networks [22], software reliability [23], and in various other applications such as oil and gas pipelines [24], construction [25], buildings, and complex systems in general [26].
Author Contributions
Conceptualization, T.G.; Methodology, A.W.L.; Validation, A.W.L.; Formal analysis, T.G.; Investigation, T.G.; Writing—original draft, T.G.; Writing—review & editing, A.W.L.; Project administration, A.W.L.; Funding acquisition, A.W.L. All authors have read and agreed to the published version of the manuscript.
Funding
This work was partially supported by the project “Societal and Economic Resilience within multi-hazards environment in Romania”, funded by The European Union—Next generation EU and Romanian Government, under the National Recovery and Resilience Plan for Romania, contract no. 760050/23.05.2023, code PNRR-C9-I8-CF 267/29.11.2022, through the Romanian Ministry of Research, Innovation and Digitalization, within Component 9, Investment I8.
Institutional Review Board Statement
Not applicable.
Informed Consent Statement
Not applicable.
Data Availability Statement
The original contributions presented in this study are included in the article. Further inquiries can be directed to the corresponding author.
Acknowledgments
Thank for the anonymous academic reviewers and administrative and technical support.
Conflicts of Interest
The authors declare no conflict of interest.
Appendix A. Theoretical Foundation for Mapping FTA to RBD
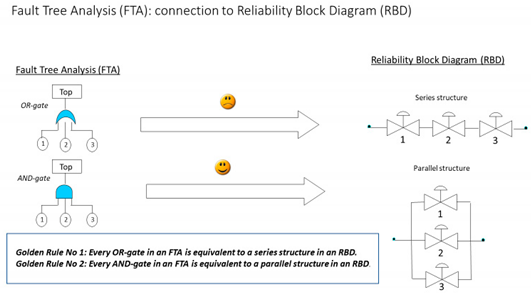
The figure above illustrates a system that has the function of maintaining the flow across the valves. In the first case, the function, which is the flow, will be affected if valves 1, 2, or 3 fail; hence, an OR gate in FTA is represented as a series structure. In the second case, if any two valves fail, then we can bypass through the third valve. Hence, all valves need to fail simultaneously to affect the function, which in this case is the flow.
Appendix B. Review of AHP Method
This review is based on the following paper:
Labib, A.W. A supplier selection model: a comparison of fuzzy logic and the analytic hierarchy process. Int. J. Prod. Res. 2011, 49, 6287–6299 [27].
The first step in the AHP is the decomposition of the problem into a decision hierarchy of criteria, sub-criteria, and alternatives. There may be additional levels to this hierarchy.
Then, pairwise comparisons are carried out for all factors to be considered, and an n × n positive reciprocal matrix A is generated for C1,…,Cn, n ≥ 2 criteria, with elements ij indicating the value of criterion i relative to criterion j. ii = 1 (i.e., on the diagonal), and if ij = k, then ji = 1/k (reciprocity property).
Approximating the weight vector of the above matrix A with n objectives takes the form illustrated below, where wi > 0, i = 1,…, n, denotes the weight of objective i. The next step is the calculation of a list of the relative weights of the criterion under consideration. This requires us to normalise each column j in A such that .
| C1 | C2 | … | Cn | |
| C1 | . | |||
| C2 | . | . | . | |
| . | . | . | . | . |
| . | . | . | . | . |
| . | . | . | . | . |
| Cn | . | |||
| ⇓ normalise columns | ||||
| C1 | C2 | … | Cn | |
| C1 | … | |||
| C2 | . | . | . | |
| . | . | . | . | . |
| . | . | . | . | . |
| . | . | . | . | . |
| Cn | … | . | ||
For each row i in the resulting matrix above, the average value is computed, such that:
where wi is the weight of criterion i in the weight vector w = [w1, w2, …, wn] recovered from matrix A with n criteria by finding a (non-trivial) solution to a set of n equations with n unknowns. This is achieved by solving the eigenvector problem: . The sum of the weights is taken as equal to 1, resulting in a unique non-trivial solution, where max is the principle eigenvalue for the pairwise comparison matrix A.
One of the most practical issues in the AHP methodology is that it allows for slightly non-consistent pairwise comparisons. If all the comparisons are perfectly consistent, then the relation αij = αik αkj should always be true for any combination of comparisons taken from the judgement matrix.
In practice, however, perfect consistency rarely occurs. The pairwise comparisons in a judgement matrix are considered to be adequate if the corresponding consistency ratio (CR) is less than 10%. First, the consistency index (CI) will be estimated by computing Aw and approximating the maximum eigenvalue, λmax, using the following:
Then, the CI value is calculated using the following formula:
Next, the consistency ratio (CR) is obtained by dividing the CI by the Random Index (RI), as given in Table 6. The RI is the average value of CI for randomly chosen entries in A (provided that αii = 1 and αij = 1/αji).
The synthesis step follows, after the alternatives have been compared with each other in terms of each one of the decision criteria and the individual priority vectors have been derived. The priority vectors become the columns of the decision matrix (not to be confused with the judgement matrices of the pairwise comparisons). The weights of importance of the criteria are also determined using pairwise comparisons. Therefore, given that there is one goal, m criteria, and n alternatives, the decision maker will create one m × m matrix for the criteria and n × n matrices for the alternatives. The n × n matrices will contain the results of n (n − 1)/2 pairwise comparisons between the alternatives. Finally, given a decision matrix, the final priorities—denoted by AiAHP—of the alternatives in terms of all the criteria combined are determined according to the following formula:
Clearly, the AHP is most efficiently applied when the total number of criteria and alternatives is not excessive. Several computer software packages are available to perform the AHP calculations, although the user is always obligated to input the pairwise comparison scores. For the purposes of the current work, the AHP has successfully been programmed into a spreadsheet workbook.
References
- Howe, L.; Johnston, S.; Côte, C. Mining-related environmental disasters: A High Reliability Organisation (HRO) perspective. J. Clean. Prod. 2023, 417, 137965. [Google Scholar] [CrossRef]
- Stephen, C.; Labib, A. A hybrid model for learning from failures. Expert Syst. Appl. 2018, 93, 212–222. [Google Scholar] [CrossRef]
- Labib, A. Learning (and unlearning) from failures: 30 years on from Bhopal to Fukushima an analysis through reliability engineering techniques. Process Saf. Environ. Prot. 2015, 97, 80–90. [Google Scholar] [CrossRef]
- Salami, O.B.; Xu, G.; Kumar, A.R.; Pushparaj, R.I. Underground mining fire hazards and the optimization of emergency evacuation strategies (EES): The issues, existing methodology and limitations, and way forward. In Process Safety and Environmental Protection; Institution of Chemical Engineers: Rugby, UK, 2023; Volume 177, pp. 617–634. [Google Scholar] [CrossRef]
- Stewart, C.M. Challenges and solutions in the development of the VentFIRE mine network fire simulator. In Mine Ventilation; CRC Press: Boca Raton, FL, USA, 2021; pp. 300–308. [Google Scholar] [CrossRef]
- Agwu, A.E.; Labib, A.; Hadleigh-Dunn, S. Disaster prevention through a harmonized framework for high reliability organisations. Saf. Sci. 2019, 111, 298–312. [Google Scholar] [CrossRef]
- Serou, N.; Sahota, L.M.; Husband, A.K.; Forrest, S.P.; Slight, R.D.; Slight, S.P. Learning from safety incidents in high-reliability organizations: A systematic review of learning tools that could be adapted and used in healthcare. Int. J. Qual. Health Care 2021, 33, mzab046. [Google Scholar] [CrossRef]
- Weick, K.E.; Sutcliffe, K. Managing the Unexpected: Resilient Performance in an Age of Uncertainty, 2nd ed.; John Wiley & Sons: Hoboken, NJ, USA, 2011; Volume 8. [Google Scholar]
- Sutcliffe, K.M. High reliability organizations (HROs). Best Pract. Res. Clin. Anaesthesiol. 2011, 25, 133–144. [Google Scholar] [CrossRef]
- Labib, A.; Read, M. A hybrid model for learning from failures: The Hurricane Katrina disaster. Expert Syst. Appl. 2015, 42, 7869–7881. [Google Scholar] [CrossRef]
- Faisal, S.M.F.; Chandra Banik, S.; Sen Gupta, P. Development of a readiness model for industry 4.0 using Analytical Hierarchy process and fuzzy inference system: Bangladesh perspective. Heliyon 2023, 10, e23664. [Google Scholar] [CrossRef]
- Ramanathan, R. Multicriteria Analysis of Energy. In Encyclopedia of Energy; Cleveland, C.J., Ed.; Elsevier: Amsterdam, The Netherlands, 2004; pp. 77–88. [Google Scholar] [CrossRef]
- Ramesh, B.; Khedkar, M.; Shahare, K.; Chappa, S.; Mitra, A. Analytic hierarchy process-based optimal load scheduling framework in an islanded distribution network. Energy Rep. 2023, 9, 519–523. [Google Scholar] [CrossRef]
- Saaty, R.W. The analytic hierarchy process—What it is and how it is used. Math. Model. 1987, 9, 161–176. [Google Scholar] [CrossRef]
- Tang, W.; Yuan, L.; Bahrami, D.; Rowland, J. Water spray suppression of leaked oil fires: A numerical study. In Mine Ventilation; CRC Press: Boca Raton, FL, USA, 2021; pp. 309–316. [Google Scholar] [CrossRef]
- McPherson, M.J. (Ed.) Subsurface fires and explosions. In Subsurface Ventilation and Environmental Engineering; Springer: Dordrecht, The Netherlands, 1993; pp. 815–890. [Google Scholar] [CrossRef]
- Muchatuta, N.A.; Sale, S.M. Fires and explosions. Anaesth. Intensive Care Med. 2007, 8, 457–460. [Google Scholar] [CrossRef]
- Rivera, G.; Yunusa-Kaltungo, A.; Labib, A. A hybrid approach for an oil and gas company as a representative of a high reliability organization. Saf. Reliab. 2021, 40, 130–156. [Google Scholar] [CrossRef]
- Misuri, A.; Antonioni, G.; Cozzani, V. Quantitative risk assessment of domino effect in Natech scenarios triggered by lightning. J. Loss Prev. Process Ind. 2020, 64, 104095. [Google Scholar] [CrossRef]
- Taubert, E.; Vairo, T.; Pettinato, M.; Fabiano, B. Integrated Risk Assessment of a Dangerous Goods Container Terminal. A Bow-Tie Approach. Chem. Eng. Trans. 2023, 104, 145–150. [Google Scholar]
- Amici, B.; Farnese, M.L. Learning to manage the unexpected: Applying Weick and Sutcliffe’s HRO principles to oil tanker accidents. Disaster Prev. Manag. Int. J. 2024, 33, 98–113. [Google Scholar] [CrossRef]
- Wang, H.; Li, D.; Sheng, T.; Sheng, J.; Jing, P.; Zhang, D. A Modeling of Human Reliability Analysis on Dam Failure Caused by Extreme Weather. Appl. Sci. 2023, 13, 12968. [Google Scholar] [CrossRef]
- Samal, U.; Kumar, A. Empowering software reliability: Leveraging efficient fault detection and removal efficiency. Qual. Eng. 2025, 37, 118–129. [Google Scholar] [CrossRef]
- Wang, L.; Zhou, H. A Bibliometric Analysis on the Safety of Oil and Gas Pipelines: Research Trends and Perspectives. J. Pipeline Syst. Eng. Pract. 2025, 16, 04024068. [Google Scholar] [CrossRef]
- Zeibak-Shini, R.; Malka, H.; Kima, O.; Shohet, I.M. Analytical Hierarchy Process for Construction Safety Management and Resource Allocation. Appl. Sci. 2024, 14, 9265. [Google Scholar] [CrossRef]
- Yonat, N.; Shohet, I.M. Theory of Faults (ToF): Numerical Quality Management in Complex Systems. Appl. Sci. 2025, 15, 595. [Google Scholar] [CrossRef]
- Labib, A.W. A supplier selection model: A comparison of fuzzy logic and the analytic hierarchy process. Int. J. Prod. Res. 2011, 49, 6287–6299. [Google Scholar] [CrossRef]

Disclaimer/Publisher’s Note: The statements, opinions and data contained in all publications are solely those of the individual author(s) and contributor(s) and not of MDPI and/or the editor(s). MDPI and/or the editor(s) disclaim responsibility for any injury to people or property resulting from any ideas, methods, instructions or products referred to in the content. |
© 2025 by the authors. Licensee MDPI, Basel, Switzerland. This article is an open access article distributed under the terms and conditions of the Creative Commons Attribution (CC BY) license (https://creativecommons.org/licenses/by/4.0/).