Article

Light Distribution in Interior Spaces as a Key Factor of Lighting Quality—Perspectives and Experiments

Laboratory for Adaptive Lighting Systems and Visual Processing, Technical University Darmstadt, 64289 Darmstadt, Germany
*
Authors to whom correspondence should be addressed.
Appl. Sci. 2026, 16(9), 4157; https://doi.org/10.3390/app16094157
Submission received: 2 February 2026 / Revised: 10 April 2026 / Accepted: 12 April 2026 / Published: 23 April 2026

Abstract

Lighting quality in interior spaces is not determined solely by horizontal illuminance at the workplace, but to a large extent by the spatial distribution of light, in particular by the luminance of ceilings and walls. Building on classical principles of lighting technology and visual perception, this article examines the influence of the ratio of indirect to direct lighting on the perception of room brightness, the spatial impression, and overall preference. To this end, two complementary studies were conducted: a visual assessment of realistic room simulations and a user study in a real meeting room with variable illuminance levels and systematically varied proportions of indirect and direct lighting. The results consistently show that perceived room brightness and user preference correlate much more strongly with the illumination of ceilings and walls than with the horizontally measured illuminance on the table, which was kept constant. A balanced ratio of indirect to direct light—typically in the range of approximately 35% to 65% indirect lighting—is preferred by users, whereas predominantly direct or nearly purely indirect lighting is associated with lower acceptance. The study clearly demonstrates that existing standards, which primarily focus on horizontal illuminance, neglect essential aspects of lighting quality. The findings highlight the need to systematically integrate light distribution, vertical illuminance, and spatial–psychological effects into lighting design, evaluation, and standardization in order to achieve visually comfortable, widely accepted, and spatially appropriate lighting solutions.

1. Introduction

In recent decades and continuing to the present day, two parallel innovation processes can be identified in lighting engineering. One process focuses on the development of light source technology, ranging from the invention of the incandescent lamp at the beginning of the 20th century, through the development of discharge lamps from the 1930s onward, to current advances in solid-state light sources (LED (lighting-emitting diode) and OLED (organic lighting-emitting diode)), accompanied by corresponding developments in optical systems, electronics and control gear, as well as intelligent sensor technology. The second process addresses the development of lighting quality and the perception of light and colour by space users under varying lighting-related and spatial conditions (weather, time of day, season, daylight availability, sunlight incidence, work tasks, room architecture, etc.).
Classical lighting research began with the definition of V(λ)-based photometry in 1924 and subsequently focused on answering the question of how much light (illuminance) is required in the main working area to prevent work-related accidents and to increase productivity (work quality and reading accuracy). To address this question, experiments on visual acuity and contrast perception conducted by Weston [1] and Blackwell under varying contrasts and target sizes were investigated, with the results compiled in a CIE publication [2]. In the 1970s, Boyce [3,4] experimentally studied and analyzed the relationship between visual performance, task complexity, user age, and illuminance. Extensive studies by Rea et al. [4,5] in the 1980s, using reaction time as a criterion in relation to object contrast and luminance, led to the development of the Relative Visual Performance (RVP) model. These foundational studies, along with further research (e.g., by Van den Bergem-Janssen [6]), formed the basis of seminal reference works (e.g., Boyce [7] and Khanh et al. [8]) and of today’s international and national lighting standards [9].
With the emergence of the global information society in the mid-1990s, in which displays and monitors became primary work tools and where monitor contrast and luminance, as well as wall and ceiling luminance, gained prominence, lighting research shifted from a focus on horizontal workplace illumination toward the comfortable perception of spatial atmosphere through the balanced illumination of vertically oriented surfaces (walls, shelves, and cabinets). This progress in the research has been addressed in international and national standards for interior lighting describing the glare limitation (UGR), luminance ratio in the viewing field, vertical illuminances and the ratio between cylindrical and horizontal illuminance for comfortable object and face recognition (see EN 12464-1 [9]). In the context of psychological and emotional lighting effects, colour perception and colour quality play a major role. From around 2000 to the present, colour research has gained strong momentum due to LED technology, which enables variable spectra across the entire visible wavelength range. New colour perception models, new colour spaces [10,11], and new colour-difference formulas [12] have been established, forming the basis for models of colour quality such as colour saturation, colour memory, colour naturalness, and colour preference, which can be applied in practice [13,14,15,16,17,18,19]. In 2017, a new colour rendering model based on a new set of 99 object colours and a new colour perception model was adopted by the CIE [10].
Visual performance—and, associated with it, horizontal illuminance in the workplace, the uniformity of workplace lighting, glare, and colour quality attributes (colour saturation and colour rendering)—are, strictly speaking, important individual basic elements of comprehensive lighting quality in the context of integrative or human-centric lighting (HCL). Despite decades of lighting research, there is still no unified and generally accepted definition of lighting quality [20]. The most widely accepted definition is likely the following of Boyce in his well-known lighting book:
“Good-quality lighting is lighting that allows you to see what you need to see quickly and easily and does not cause visual discomfort but raises the human spirit” [7].
Decisive for the interpretation of this definition are three components:
  • “See quickly and easily”: Visual performance such as contrast perception and reaction time.
  • “Visual discomfort”: Glare, flicker, unpleasant light and colour distribution.
  • “Human spirit”: Mental state and cognitive behaviour in response to lighting.
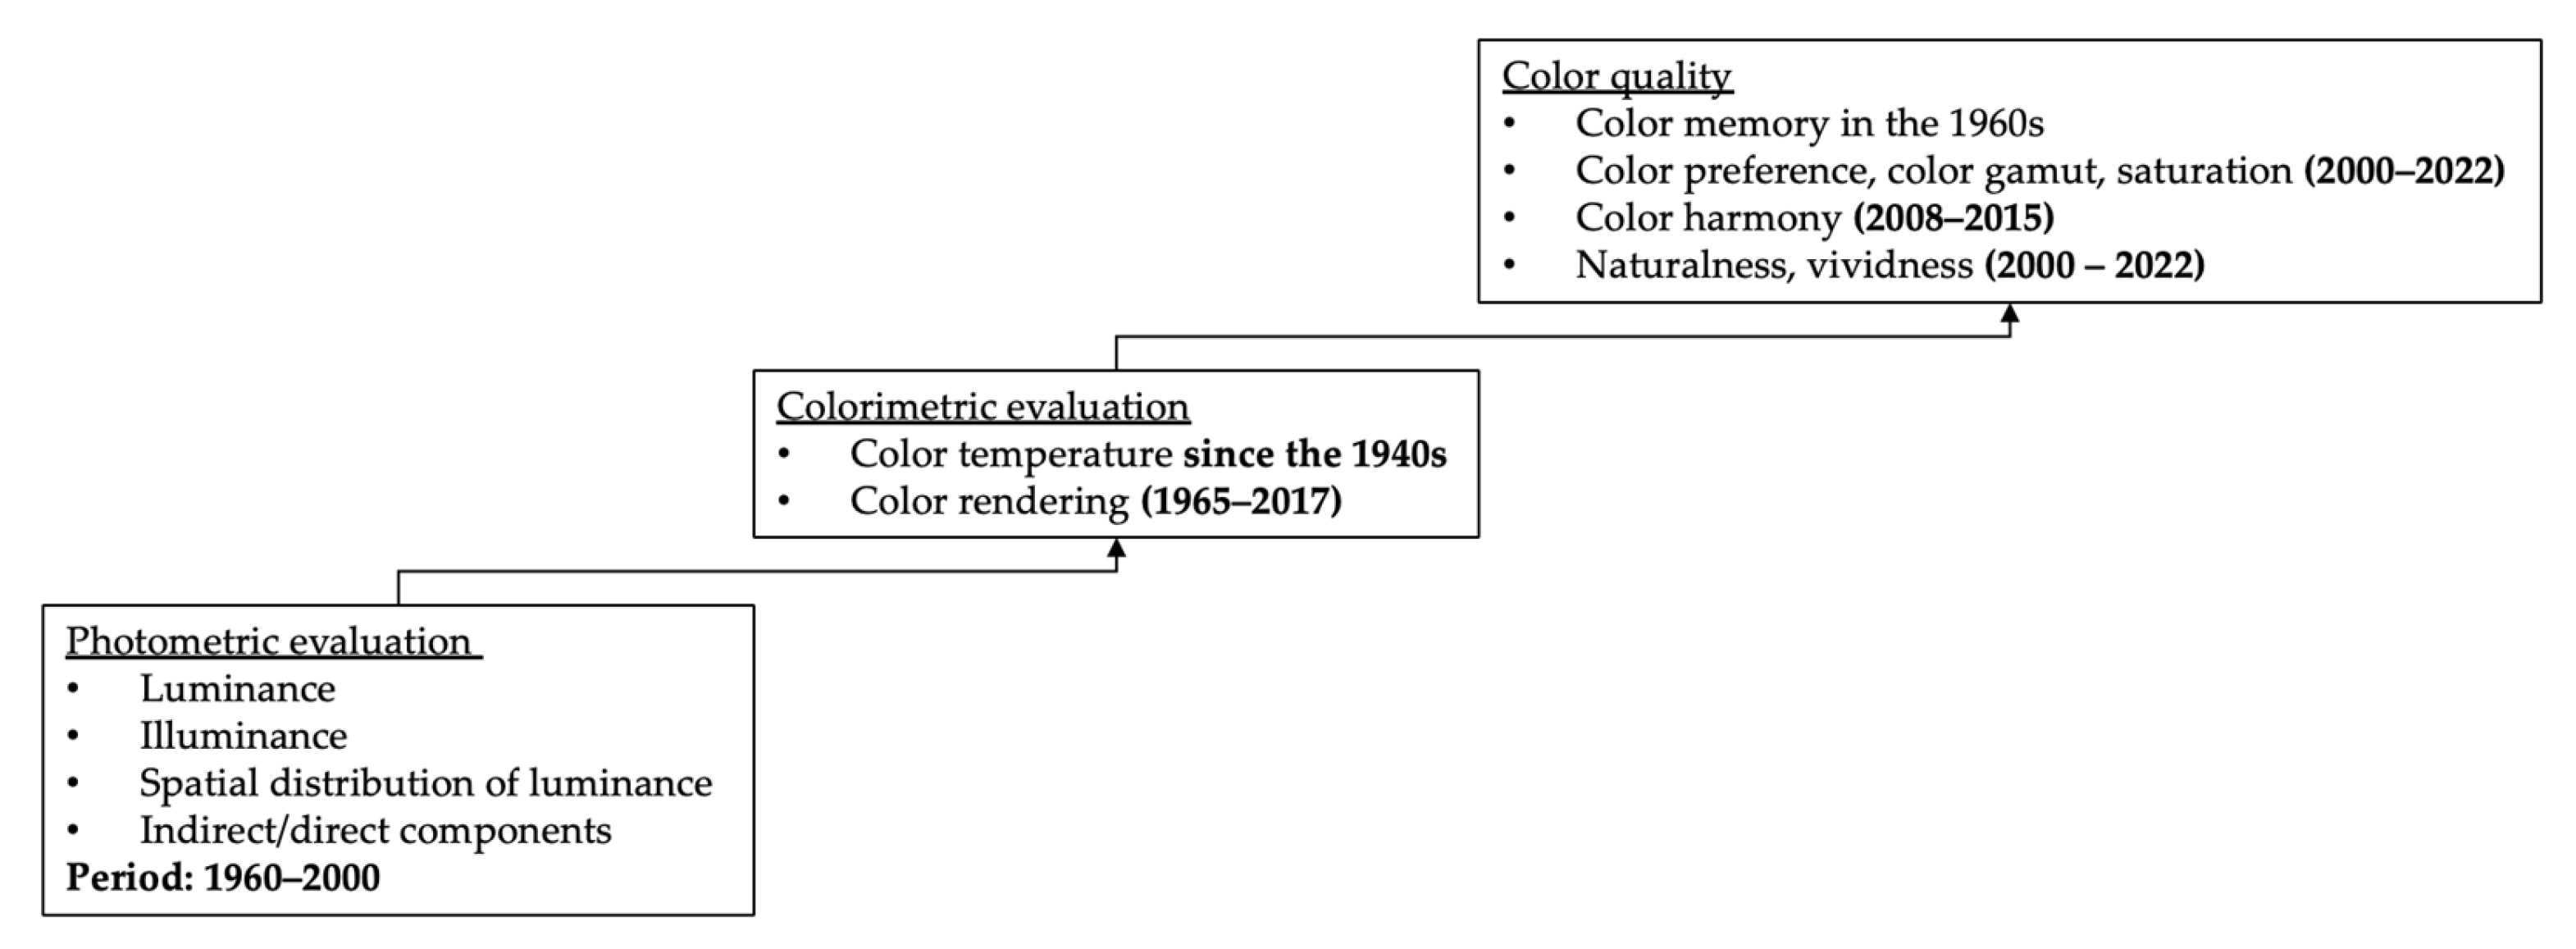
While the first component can be well quantified using physiological measurements of the visual system, the latter two components—“visual discomfort” and “human spirit”—can only be captured using psychophysical methods in order to interpret and model the responses and reactions of users under given lighting conditions. Over the past six decades, lighting and colour research has sought to characterize various key aspects of these components of lighting quality (see Figure 1).
These components shown in Figure 1 originate, to varying degrees, from the emitted light itself (light quantity, spectrum, correlated colour temperature, saturation, hue, and the interaction between light spectra and object colours). In part, individual spatial zones are already taken into account in the considerations illustrated in Figure 1. However, for the overall perception and conscious evaluation of room architecture and spatial atmosphere, additional psychological and emotional aspects must be analyzed. This marks the transition from light quality to lighting quality and to a more complex level of cognitive spatial analysis.
As early as the late 1970s, lighting research—rooted in environmental psychology, occupational psychology, sociology, and lighting architecture—began to move toward a new and promising field focused on investigating the psychological processes underlying lighting quality. A key foundation was laid by Kaplan’s information-processing model of environmental perception [21], which postulates that the amount of information presented in a scene is essential for how an observer perceives and interprets the environment. In this model, the four dimensions of environmental appraisal range from the coherence and legibility of the presented information to the perception of the so-called “mystery” of a scene, as well as its complexity, both of which require a more in-depth interpretation of the environment and the scene.
When viewing and perceiving a lit space within a specific context—characterized by a wide range of possible lighting configurations—a number of adjectives, attributes, and descriptive terms are used to capture different emotional aspects of the observers’ responses. In the early 1970s, lighting research and lighting architecture began to systematically investigate these interpretative dimensions of scenes and spatial impressions. The first study in this field was conducted by Flynn in 1973 [22] in a meeting room with six different lighting configurations. In this study, 96 participants were given a questionnaire comprising 34 different rating scales to evaluate the lighting configurations, using descriptors such as “clear–hazy,” “pleasant–unpleasant,” “bright–dim,” or “stimulating–subduing.” The analysis of these 34 scales led to the identification of the three relevant categories of scene impression according to Flynn [23], which can be structured as follows:
(a)
Perceptual categories: These categories include the impression of visual clarity (details of the objects), of spaciousness and spatial complexity, of the colour hues of objects in the room and of glare from the light sources illuminating the room.
(b)
Behavioural attitudes: These categories take the impression of public vs. private spaces and the impression of relaxation vs. tension into account.
(c)
Overall preference: Evaluation and expression of preference (liking–disliking), friendliness and pleasantness.
Flynn [23] conducted a multidimensional analysis of visual rating scales in order to establish lighting-related characteristics for assessing similarities and differences, and identified the following three fundamental attributes:
  • Homogeneity (uniform/non-uniform).
  • Brightness (bright/dark).
  • “Light from above” versus “peripheral light”.
In the mid-1980s, the research group led by Rowlands and Loe carried out extensive experiments involving 18 lighting scenarios in an office environment [23] and identified two perceptual dimensions of the space: “visual lightness” and “visual interest.” The latter was associated with the presence of inhomogeneous light distributions within the room. These findings can be regarded as part of the three components identified by Flynn [22]. Brightness and light distribution (uniform vs. non-uniform) thus represent the core characteristics emphasized by both renowned research groups of that period. These two attributes are directly related to the spatial distribution of the luminous flux emitted by luminaires, which—depending on the emission direction toward ceilings and walls (indirect paths) or directly toward work planes (tables and machines)—is redistributed through multiple reflections.
In recent years, research into high-quality lighting has gained importance not only in building services engineering—for example, in offices, schools, hospitals, and nursing homes—but also in the interior spaces of transportation systems, such as modern aircraft, long-distance coaches, and, increasingly, passenger vehicles [24]. In both building applications and automotive contexts, it has been recognized that the research question concerning interior light distribution has not yet been sufficiently addressed. This observation motivated the authors of the present study to investigate lighting distribution both in virtual environments and in real-world settings, using simulations as well as experiments in physical spaces.
Accordingly, this paper begins with general considerations and subsequently focuses on a key study by Houser et al. [25], which examined the significance of light distribution within a space, particularly with respect to the balance between indirect and direct lighting. Based on the research gaps and open questions identified in that work, two complementary studies were conducted to partially address the research questions posed here.

2. Results of the Experiments by Houser et al. [25] (2002)

As part of the research conducted in 2002 [25], Houser investigated a room equipped with luminaires fitted with fluorescent lamps (Ra = 75, CCT = 3500 K) and parabolic optics. The luminaires consisted of two components that allowed separate dimming of the light directed toward the ceiling (indirect) and toward the floor (direct). The luminaire layout—including luminaire length, spacing between luminaires, and distances to the four walls—was specific to the room. The room dimensions were length × width × wall height = 12.7 m × 7.2 m × 2.9 m, making it suitable as an open-plan office. The illuminance on the work desk was kept constant at 538 lx. Using 11 different lighting levels, the ratio of the illuminance, which is generated by indirect light path, to the total illuminance of 538 lx was varied between 100% and 0%. Based on the evaluation of results from 34 participants, the following findings are relevant:
(a)
Since the illuminance on the desk was consistently maintained at 538 lx, the perceived brightness of the floor and the work desk remained nearly unchanged across the 11 lighting settings. In contrast, the perceived brightness of the room varied substantially between purely indirect and purely direct lighting and decreased steadily from 100% indirect lighting (100% light directed toward the ceiling) to purely direct lighting (0% directed toward the ceiling). The perceived brightness of the entire room correlated strongly with the perceived brightness of the ceiling (correlation coefficient r = 0.68) and the walls (r = 0.74), and only moderately with the perceived brightness of the work desk (r = 0.49).
(b)
These results underscore the importance of ceiling and wall illumination for the evaluation of perceived room brightness. This insight is of significant relevance for contemporary lighting design practice.
(c)
The room was perceived as more spacious when the proportion of indirect light directed toward the ceiling and walls was increased.
(d)
Overall room preference reached a maximum when the proportion of indirect light contributing to the total illuminance on the work desk ranged between 0.6 and 0.9. This corresponds to a direct lighting component of only 0.1 (10%) to 0.4 (40%).
These findings represent the results of a seminal research study addressing a key topic in lighting engineering, conducted in 1997 and published in 2002 [25]. Since 1997, lighting technology has undergone a fundamental transformation, evolving from fluorescent lamps to LED-based systems with advanced optical components. The wide range of available correlated colour temperatures and the dimming capabilities of LED luminaires now allow for flexible adjustment of both illuminance levels and spectral characteristics. These technological advances provide valuable opportunities for contemporary and future lighting research. Accordingly, two studies were conducted in the lighting laboratory of TU Darmstadt in the second half of 2024 and evaluated in 2025. The experimental procedures and results of these studies are presented in the following sections.

3. Indirect–Direct Light Distribution in Interior Spaces—General Effects

To date, national and international lighting standards [9] specify only minimum illuminance values on horizontal work planes (e.g., 500 lx on a desk for reading tasks). However, they do not define how this illuminance level on the work surface is achieved, that is, from which directions the light originates and how it is distributed from the luminaires to the working areas.
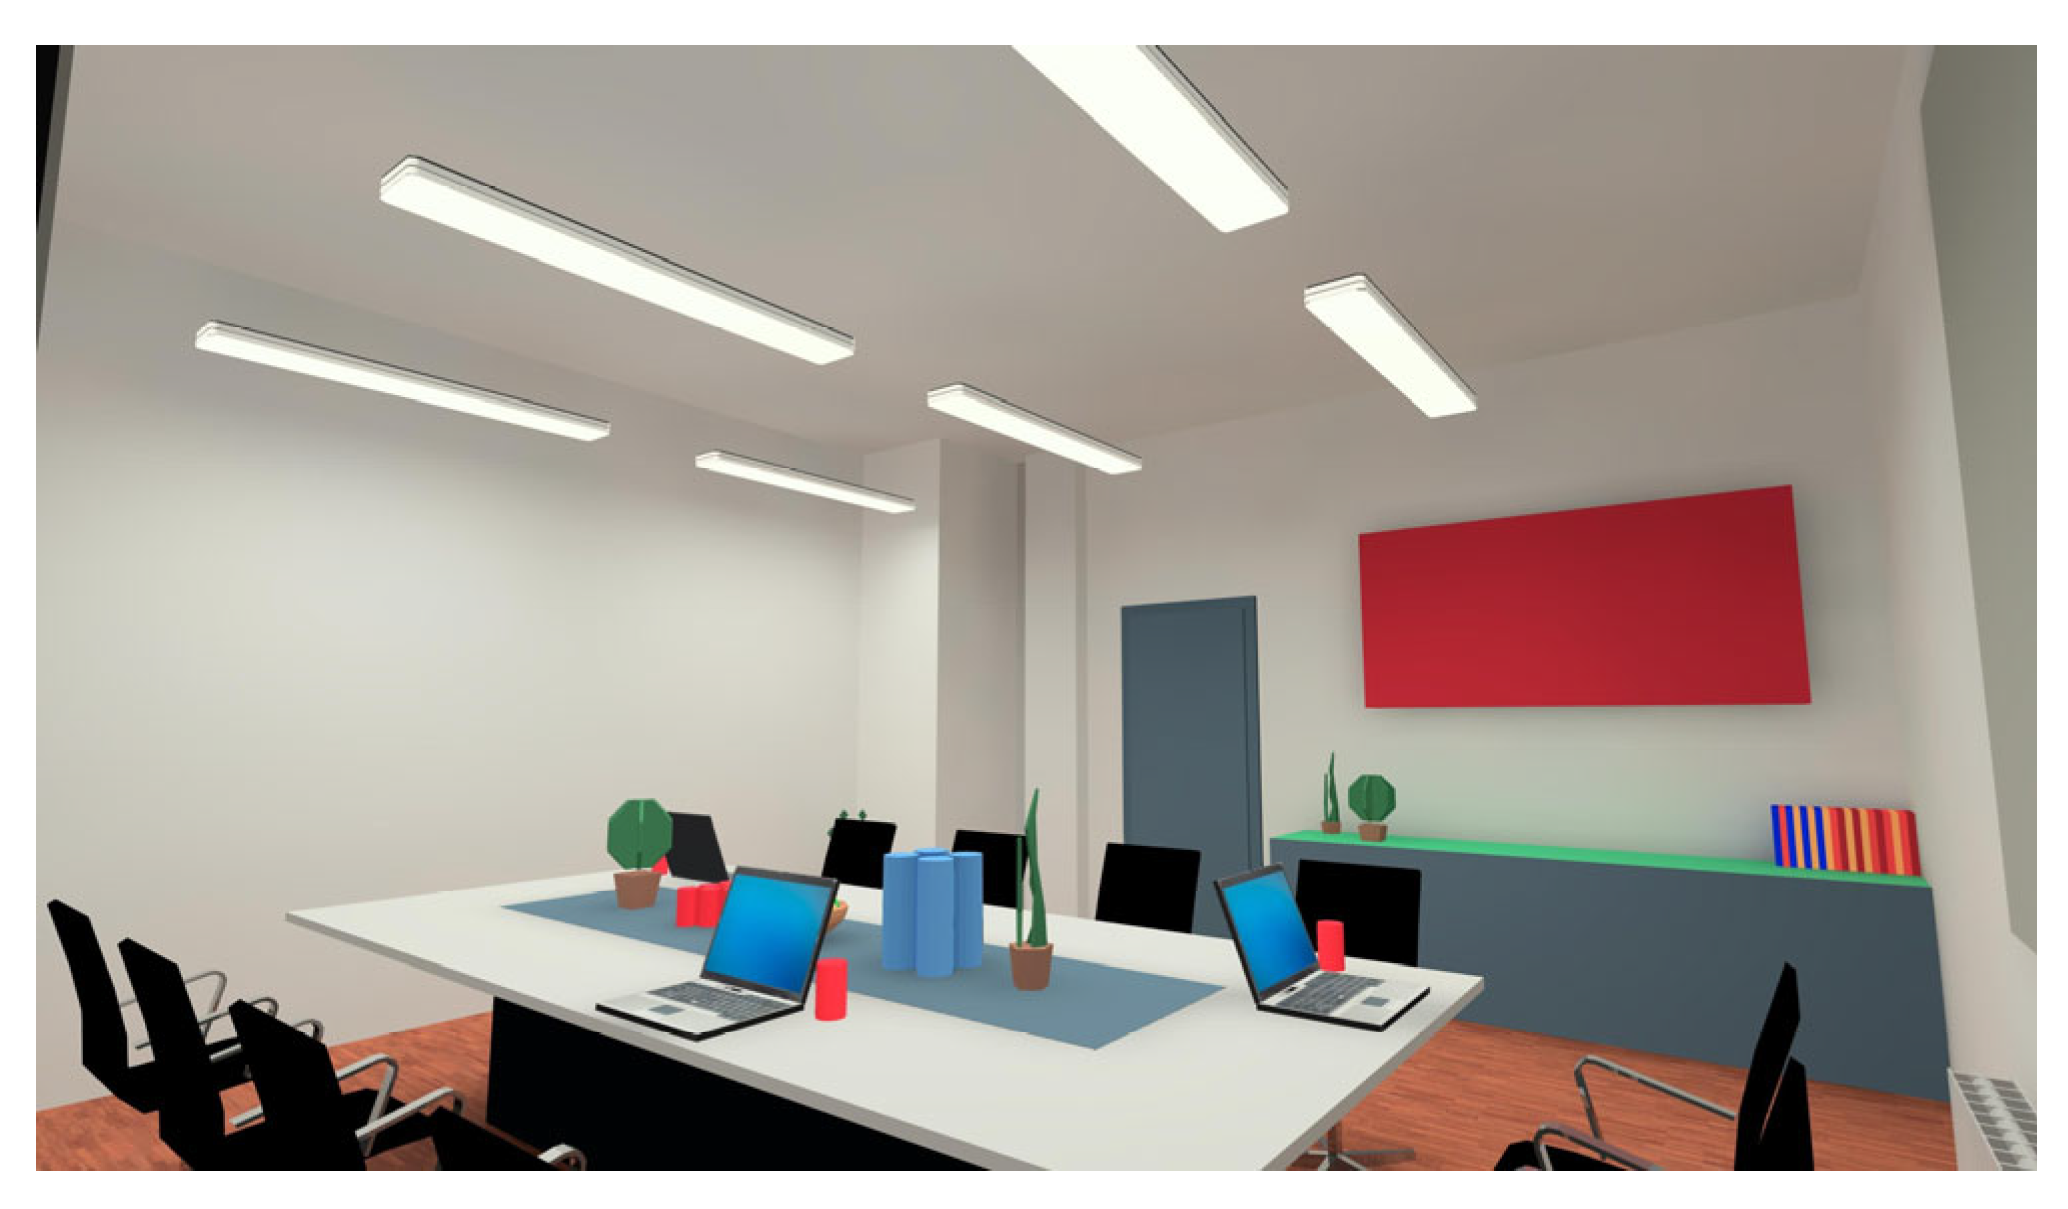
To address this issue, lighting simulations based on real data were conducted at TU Darmstadt in 2024 using professional lighting design software (DIALux evo). In Figure 2 and Figure 3, the illuminance on the work desk in a workspace containing typical work-related objects (a computer, books, and decorative items) is kept constant at 500 lx. The luminaires used are pendant luminaires equipped with diffuse Plexiglas optics. In Figure 2, the indirect light component directed toward the ceiling is switched off, and the entire illuminance of 500 lx on the desk is provided by direct downward lighting from the luminaires. The room is brightened through multiple reflections from the floor, the work desk, and the lower portions of the four vertical walls. As a result, the ceiling and the upper halves of the vertical walls appear relatively darker than in the scenario shown in Figure 3.
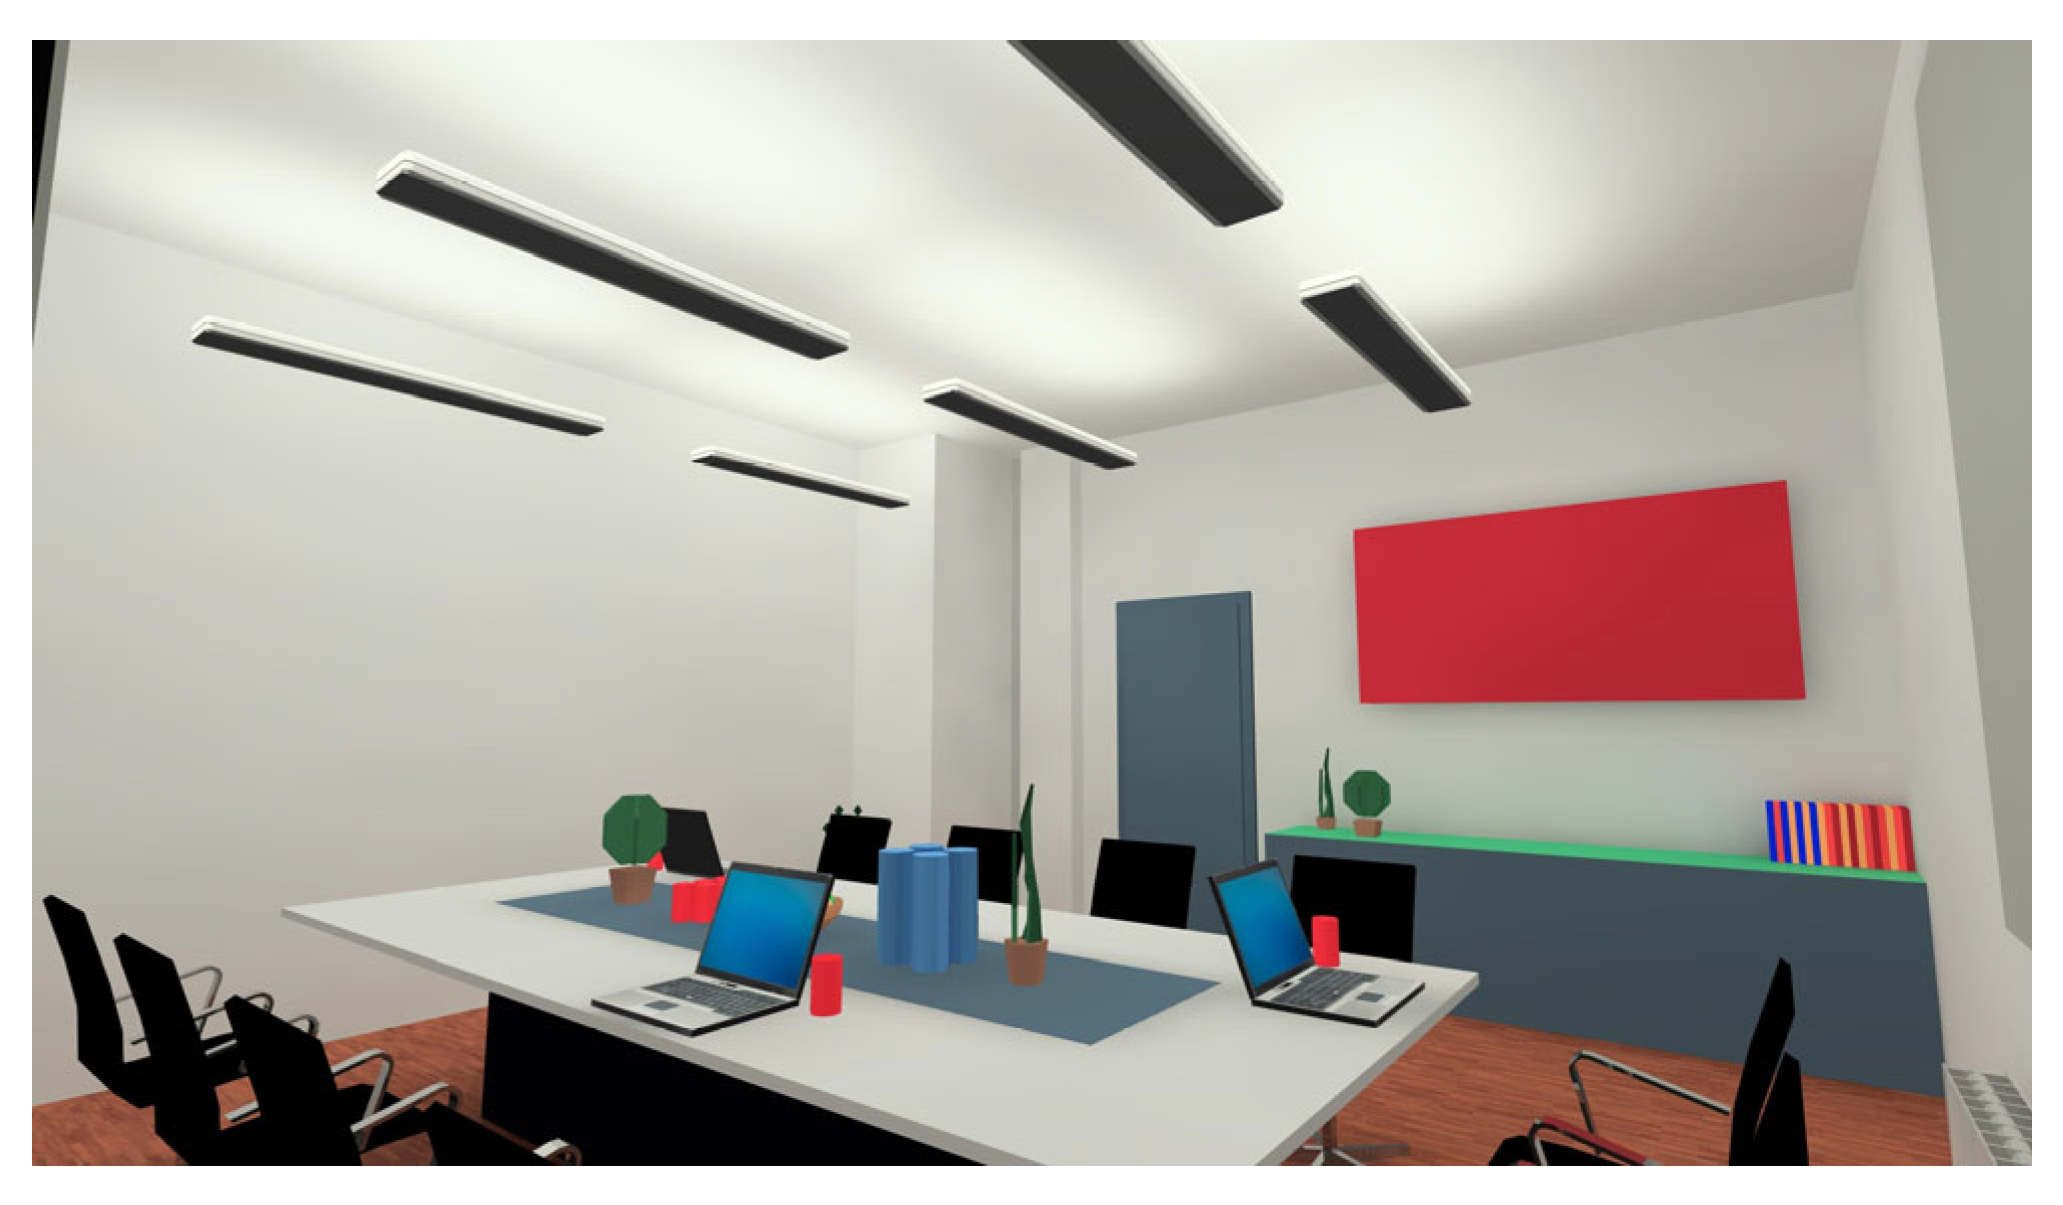
In Figure 3, the indirect light component directed toward the ceiling is set to 100%, while the direct downward component from the luminaires is set to 0% (switched off). Consequently, the luminaire elements appear dark when viewed from below, whereas the ceiling is brightly illuminated. Such dark luminaire components may be detrimental to the perception of the space.
This variation in the proportions of indirect and direct lighting is not merely a lighting engineering operation. As early as the late 1990s, initial research efforts were undertaken to investigate the effects of light distribution on the ceiling, walls, work desk, and floor on the perception and cognitive processing of spatial atmosphere [3,7,25]. Using subjective evaluations based on questionnaires with different perceptual categories—employing semantic differential (SD) rating scales [26]—these studies sought to characterize the following aspects of spatial and lighting perception:
(a)
Perceived brightness (bright–dark) of individual spatial elements such as the ceiling, walls, floor, and work desk, as well as of the room as a whole.
(b)
Perception of objects within the space (faces and room elements such as plants and shelves), including hard versus soft shadowing, sharp versus soft object edges, and perceived attractiveness of objects.
(c)
Visual comfort, including glare, eye comfort, and perceived overall quality.
(d)
Perception of inhomogeneity within the space, referring to the inhomogeneity of the ceiling, floor, walls, work desk, and the room overall.
(e)
Perception of spaciousness (the room perceived as small–large, confined–spacious).
The following two sections describe the most recent experiments conducted at TU Darmstadt in 2024.

4. Visual Experiments Using Room Simulations and a Real Workspace

4.1. Visual Experiments Using Room Simulations

Using the lighting simulation software DIALux evo, developed by DIAL GmbH, a comprehensive lighting simulation was carried out for a meeting room in the lighting institute of the Technical University of Darmstadt. The room, with dimensions of 5.5 m in length, 5.3 m in width, and 3.3 m in height (see Figure 6 below), was reproduced in detail within the software environment. Although certain simplifications were applied, all essential characteristics were taken into account to ensure a realistic and accurate representation of the lighting conditions.
The simulation process began with the fundamental construction of the room geometry. The reflectance values of the walls and ceiling, finished in matte, diffusely reflecting white, were determined experimentally and implemented accordingly. These reflectance values are critical, as they strongly influence the spatial light distribution and, consequently, the visual perception of the occupants. In addition, the floor was approximated in the simulation in order to support the overall visual impression and functional realism of the space.
In the next step, all furnishings—including the table, chairs, and cabinets—were integrated into the model, with due consideration given to the colour properties of the individual furniture elements. These objects not only contribute to the visual identity of the room but also play a significant role in light reflection and perception. To enhance the residential and contemporary character of the meeting room, various coloured decorative elements were added in the final stage of interior modelling. These included plants, fruit, pictures, and other decorative objects, which substantially improve the ambience and create an inviting atmosphere representative of a modern working environment.
Subsequently, pendant luminaires from the manufacturer Trillux (Arnsberg, Germany) were incorporated into the simulation. The luminous intensity distribution of the luminaires was selected to match that of the pendant luminaires installed in the real meeting room at TU Darmstadt. The arrangement consisted of six identical pendant luminaires, mirroring the real-space configuration and ensuring a homogeneous light distribution within the room.
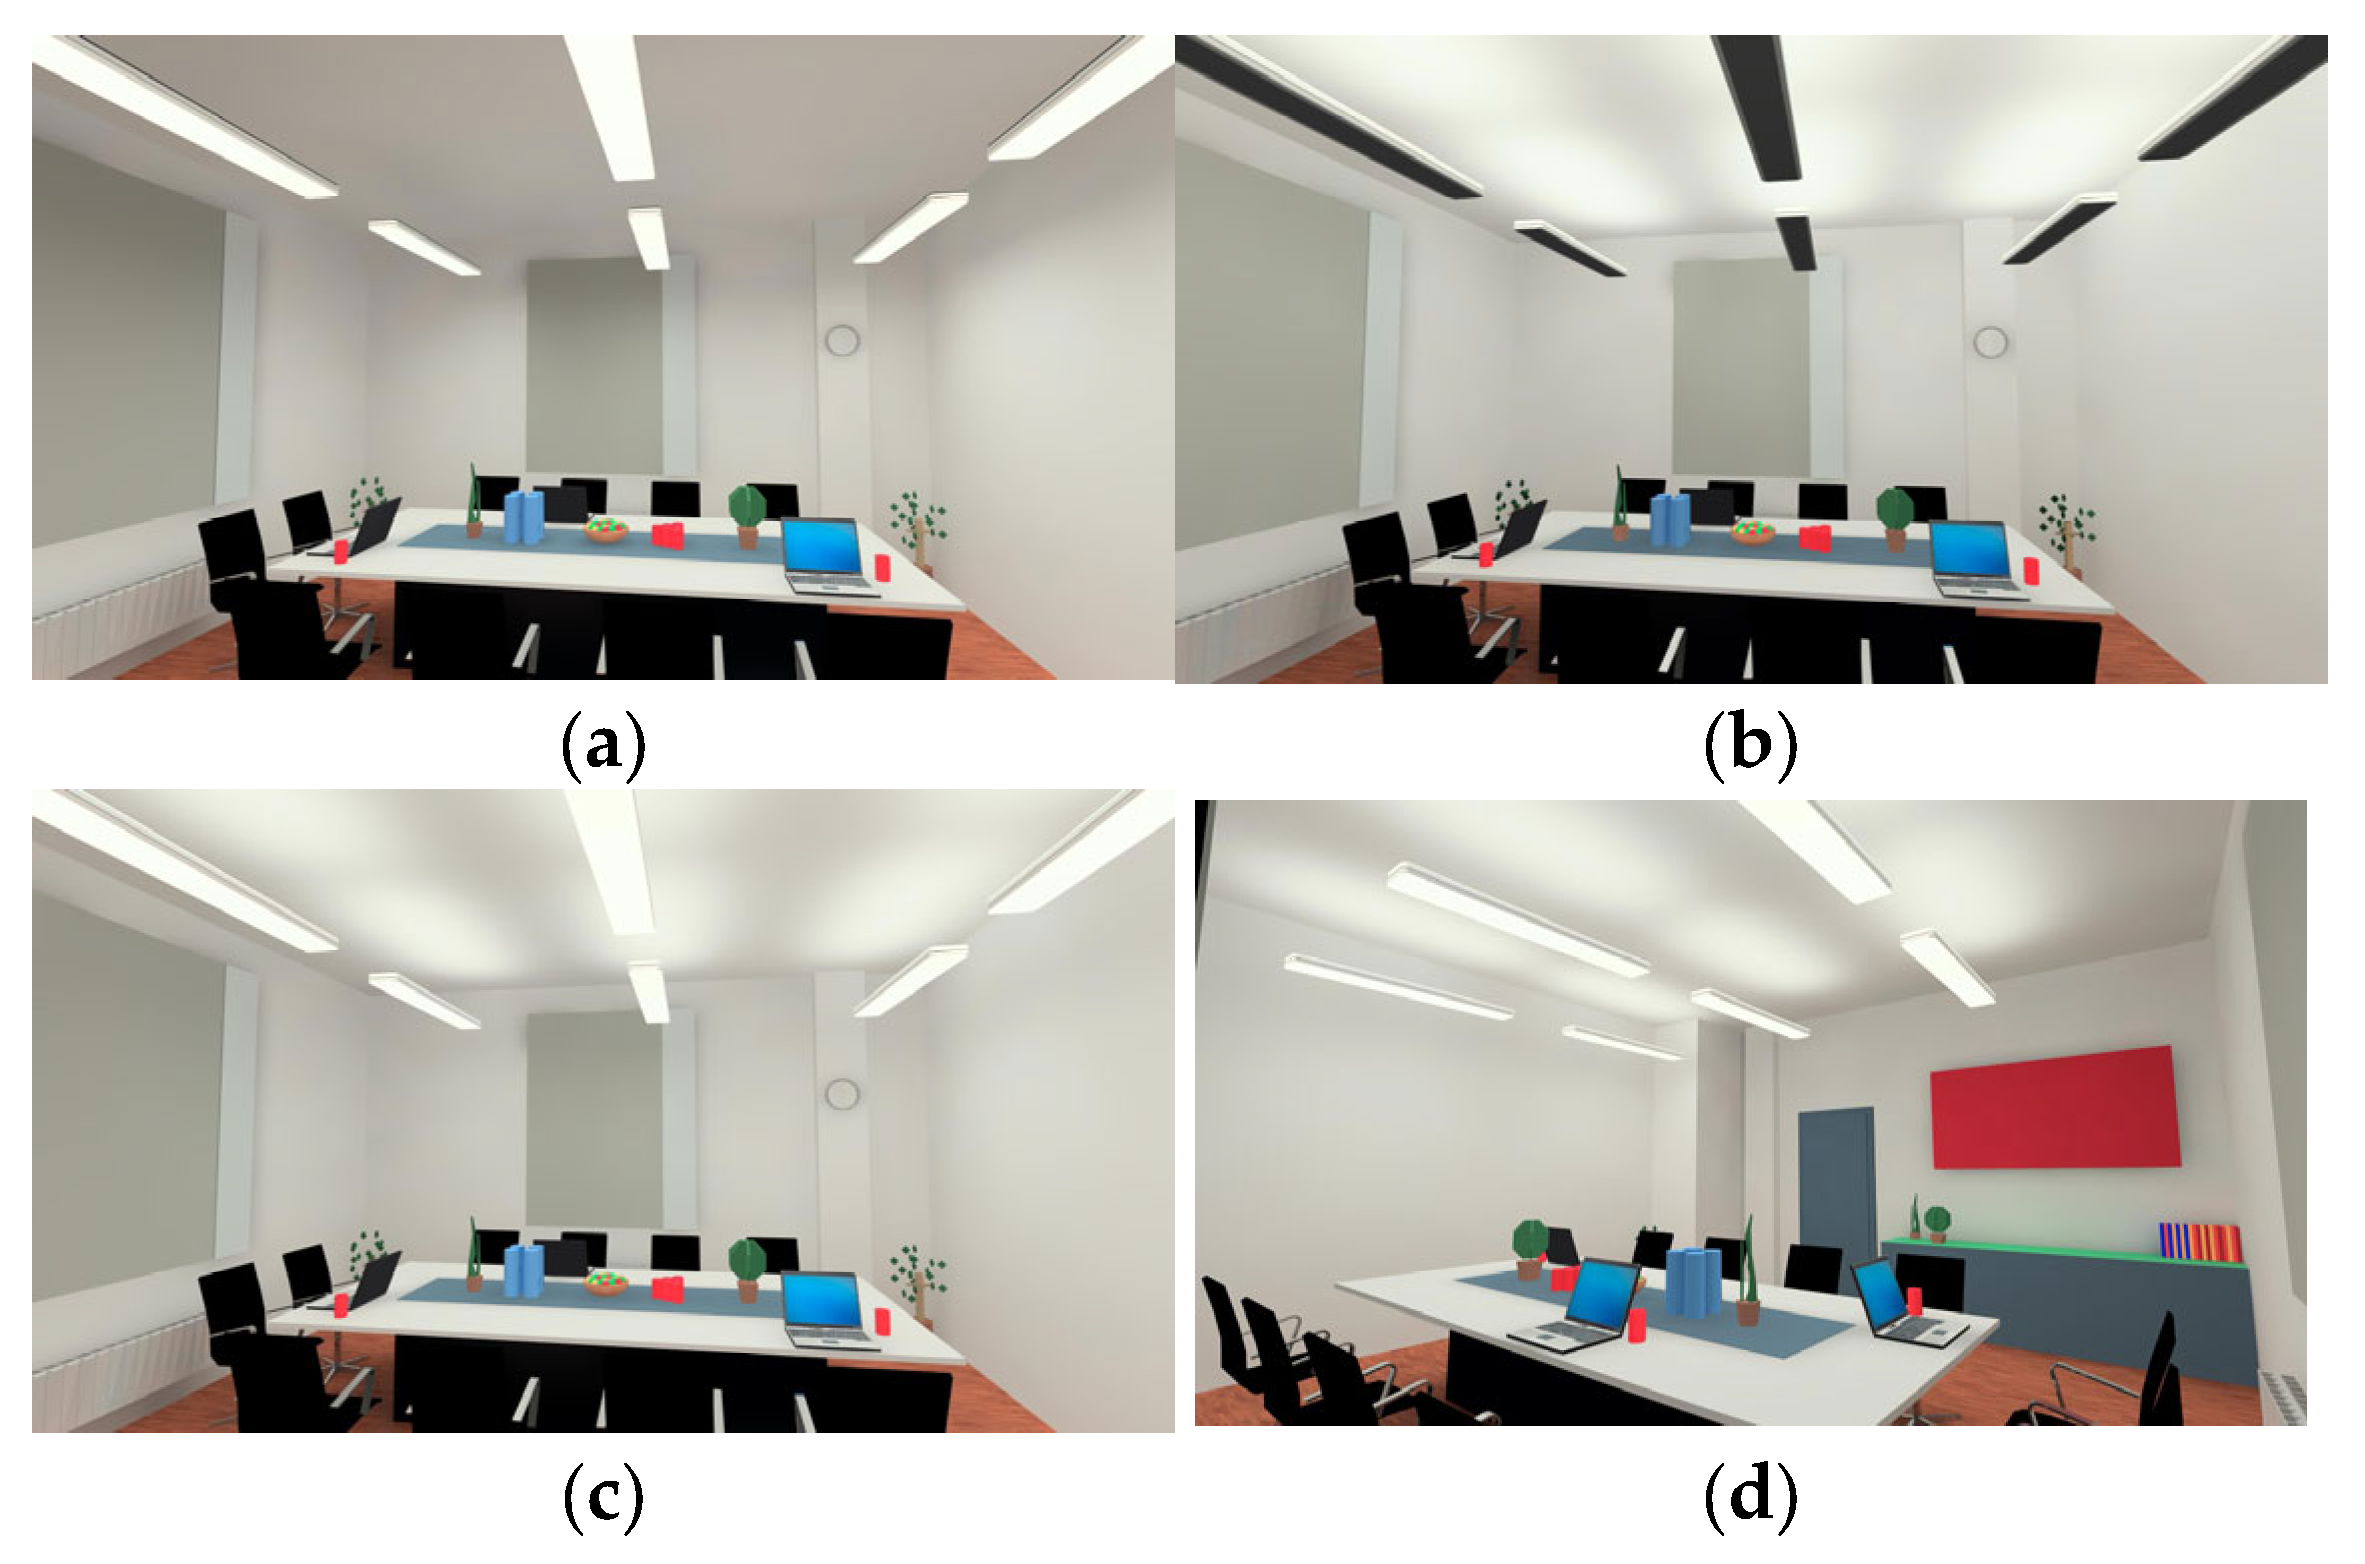
To prevent external influences on the perception of the lighting conditions, the windows were darkened (in the form of a grey surface in the simulation; see Figure 4a,b below). This ensured that daylight or other ambient light sources did not affect the evaluation of the artificial lighting scenarios. The lighting parameters were then precisely defined. Based on the luminaire data available in DIALux, a correlated colour temperature of CCT = 3259 K was selected. This value was predefined within the software and adopted to achieve a realistic visualization of the lighting conditions.
Furthermore, two different illuminance levels were specified: 500 lx and 1500 lx. To systematically investigate the influence of light distribution, seven different ratios of indirect to direct lighting were implemented: 0/100, 20/80, 35/65, 50/50, 65/35, 80/20, and 100/0. The illuminance levels were adjusted within the software such that the mean illuminance on the tabletop, located at a height of 0.7 m from the floor, reached either 500 lx or 1500 lx.
In the following step, two different viewing perspectives within the test room were defined: one from the door looking toward the window (see Figure 4a–c), and one from the window looking toward the door (see Figure 4d). These perspectives are essential for evaluating the lighting conditions from different viewpoints and for enabling a comprehensive assessment of spatial light distribution. Finally, a total of 28 images were rendered using ray-tracing software, producing highly realistic visual representations of the room. These images were used as stimuli for the subsequent visual study and served as the basis for the evaluation of the lighting scenarios.
Figure 4a–d illustrate the different lighting scenarios, showing the respective illuminance levels and varying percentages of indirect and direct lighting components.
In the first step, an evaluation scheme for the study was defined using an ordinal scale. Participants were asked to rate the overall scene preference of the perceived spatial atmosphere shown in each image on the monitor. This scale allows for straightforward implementation and corresponds to the German school grading system (grade 1 = “very good,” grade 2 = “good”, grade 3 = “satisfactory,” and grade 6 = “insufficient”). Participants were instructed to communicate their ratings verbally to the study supervisor to ensure direct and unbiased feedback.
In the next step, the visual study was implemented using appropriate software and a calibrated LED monitor, the LED monitor was calibrated at the highest brightness level, as this setting provided the most suitable image presentation for the study. The process of the characterization of the monitors regarding gamma correction, colour space and gamut, linearity of the colour channels, spectral distribution of the colour channels, calibration and the suitable OLED displays for visual science has been recently published by the scientific members of the author’s laboratory in a peer-reviewed paper [27]. Care was taken to ensure that the same display set-up and settings were used for every participant. At the beginning of the experiment, participants were thoroughly informed about the procedure during a 10 min briefing to ensure a clear understanding of the tasks and expectations. Following a short adaptation phase of 2 min, which was considered sufficient as full dark adaptation was not part of the investigation, allowing participants to acclimate to the display, a brief training session was conducted. During this training, six individual images from the image set were presented in randomized order over a total duration of 6 min. Subsequently, the main experiment commenced, comprising 28 images presented in randomized order, with a total of 1.5 min allocated per image (1 min for viewing and 0.5 min for evaluation). The total test duration per participant was approximately 1 h. This procedure ensured that participants evaluated the images solely based on their visual perception, without any influence from presentation order.
The study was conducted in an office that was sparsely used at the time and whose windows could be fully darkened to eliminate external light sources or stray light. Throughout the entire experiment, the ambient illuminance was continuously monitored to ensure that all participants completed the visual study under identical conditions.
In total, 22 naïve participants (without lighting knowledge) took part in the study, including 20 male and two female participants. The average age was 28.05 years, and 11 participants wore corrective visual aids. The gender distribution of 20 male and two female participants resulted from the recruitment process at the Technical University of Darmstadt. The available participant pool, which consisted predominantly of students and research assistants, was mainly male. The sample size of 22 participants was determined using the software tool G-Power. According to the software tool, this sample size can be regarded as sufficient to allow statistical conclusions to be drawn within the scope of the present study. The results of the study were subjected to statistical analysis. Since an ordinal scale based on the German grading system was used, a lower median value indicates a more positive overall evaluation. In addition, the interquartile range was considered, as a narrow interquartile range indicates low variability in participant ratings and thus reflects a high consistency in perceptual assessment among the participants.
Results
In addition to using the median and interquartile range for statistical evaluation, a more advanced inferential analysis was conducted using the statistical software JASP 0.95.2 [28]. The descriptive measures were primarily employed to obtain a robust overview of central tendencies and variability in the participants’ evaluations, as the median is particularly suitable for ordinal and preference-based data and is less sensitive to outliers. However, descriptive statistics alone do not allow conclusions regarding the statistical relevance of observed differences. Therefore, an inferential statistical approach was applied in order to assess whether the observed variations in subjective evaluation can be attributed to systematic influences of the investigated lighting parameters rather than random variability.
In this analysis, three independent factors were considered: illuminance level, viewing perspective, and the ratio of indirect to direct lighting. The inferential evaluation was based on an analysis of the variance framework, in which the variance in the dependent variable is partitioned into variance explained by the respective factor and unexplained residual variance. The strength of each factor effect is reflected in the corresponding F-statistic, which represents the ratio of explained to unexplained variance. To assess statistical evidence, the p-value was used as the primary criterion. A low p-value indicates that the probability of obtaining an effect of the observed magnitude under the assumption of the null hypothesis (i.e., no effect of the factor) is low and therefore suggests a systematic influence of the respective factor.
As shown by the p-values in Table 1, the indirect-to-direct lighting ratio exhibits the smallest p-value and thus represents the strongest influencing factor in the study. The corresponding sum of squares is substantially larger than that of the other factors, indicating that variations in the distribution of indirect and direct lighting components explain a considerable proportion of the total variance in participants’ evaluations. This result clearly demonstrates that the spatial distribution of light within the room is a key determinant of perceived lighting quality. In contrast, the viewing perspective shows the highest p-value and therefore the weakest influence. The explained variance associated with perspective is small relative to the residual variance, suggesting that differences in observer position within the investigated range do not systematically affect the evaluation outcome.
This finding is of particular relevance for studies conducted in real meeting rooms, as it suggests that the evaluation of lighting scenarios is largely independent of the participants’ position within the space. From a methodological point of view, this increases the robustness of the experimental results, as it reduces the likelihood that the findings are biased by specific viewing positions. From an application-oriented perspective, it implies that well-designed lighting concepts can provide consistent perceptual quality across different seating positions in a meeting room.
The illuminance level shows a statistically significant effect, with a p-value of 0.008. This indicates that participants are sensitive to changes in overall illuminance and that higher illuminance levels can positively influence subjective evaluation. However, compared to the indirect-to-direct lighting ratio, the effect of illuminance is clearly weaker in terms of explained variance. This suggests that while sufficient illuminance is a necessary condition for visual comfort and acceptance, it is not the dominant factor governing perceived lighting quality.
To supplement the statistical analysis, the effect size (ω2) was also calculated for each parameter. The results show that, although the effect sizes are not particularly high, they support the findings derived from the p-values. This underscores the consistency of the present results and strengthens their validity.
In addition to the frequentist evaluation based on p-values, the Bayes factor (BF10) was used to quantify the strength of the evidence in favour of the alternative hypothesis. The BF10 represents the ratio of the probability of the observed data under the alternative hypothesis to that under the null hypothesis. In contrast to p-values, which only indicate whether the data are incompatible with the null hypothesis, Bayes factors allow a direct comparison of the evidential support for competing models. Accordingly, a larger Bayes factor indicates stronger evidential support for an effect.
The results summarized in Table 2 confirm and further substantiate the findings from the p-value analysis. The indirect-to-direct lighting ratio shows a very large Bayes factor (BF10 = 222.855), which corresponds to decisive evidence in favour of a systematic effect according to commonly used interpretative scales. This result leaves little doubt that the distribution of indirect and direct light components plays a central role in shaping user preferences. The posterior model probability P(M/data) is substantially higher for this factor than for the other models, further underlining its dominant explanatory power.
In contrast, the illuminance level exhibits a Bayes factor close to one (BF10 = 1.150), indicating only marginal evidence in favour of an effect. While this does not contradict the significant p-value, it highlights that the strength of evidence for illuminance is comparatively weak when evaluated within a Bayesian framework. This discrepancy illustrates the conceptual difference between frequentist and Bayesian inference: while the p-value indicates statistical detectability, the Bayes factor reflects the relative plausibility of the effect model compared to the null model. The viewing perspective shows a Bayes factor below one (BF10 = 0.266), indicating that the data actually provide evidence in favour of the null hypothesis, thus reinforcing the conclusion that perspective has no meaningful influence in this study.
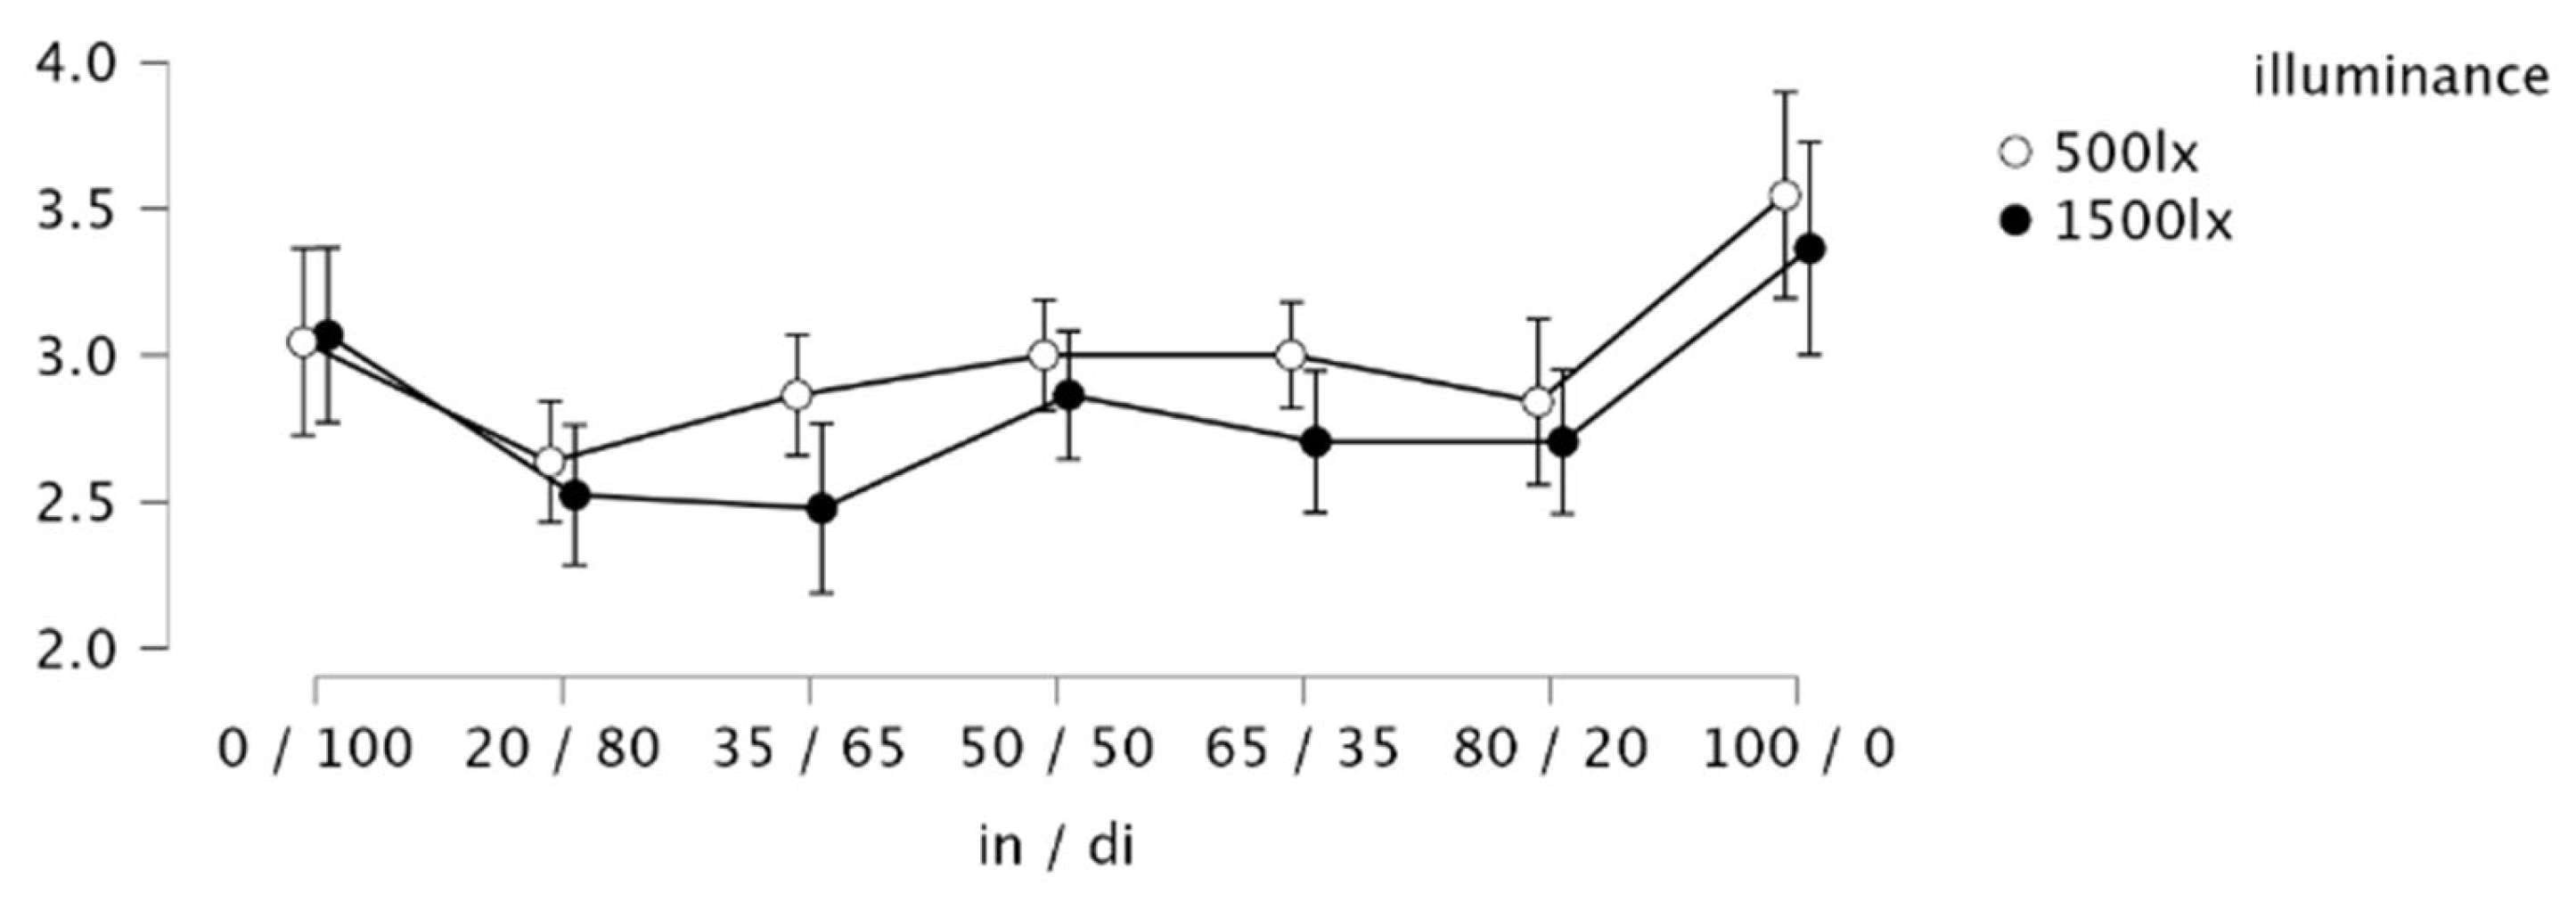
Figure 5 illustrates the results of the study using a virtual room and lighting simulation and provides additional insight into participant preferences. On the horizontal axis, the ratio of indirect-to-direct light is shown, and on the ordinate, the rating scale (German school grade) is described. The majority of participants preferred a higher illuminance level (E = 1500 lx), which is consistent with the existing literature reporting preferred illuminance levels in the range of approximately 1400 lx to 2000 lx for office environments and industrial halls [29,30]. However, the figure also shows that illuminance alone does not determine preference. At a total illuminance of 500 lx on the work desk, the lighting configuration with an indirect-to-direct ratio of 20/80 was most frequently preferred, suggesting that at lower illuminance levels a higher direct component may be advantageous for task visibility. At 1500 lx, two lighting configurations with ratios of 20/80 and 35/65 emerged as the preferred options, indicating that at higher illuminance levels a more balanced light distribution becomes acceptable or even desirable.
These findings suggest that architectural lighting design should generally aim for a balanced ratio between indirect and direct lighting rather than focusing exclusively on increasing illuminance. This conclusion is strongly supported by the statistical analyses, which consistently identify the indirect-to-direct lighting ratio as the most influential factor for the room appraisal. At the same time, the results indicate that no single ratio can be defined as universally optimal. Instead, the preferred ratio appears to depend on the overall illuminance level, implying that flexible or adaptive lighting concepts may be particularly beneficial.
As a next step, it is planned to validate the obtained results through a real-world study conducted in an actual meeting room. This validation will help to further substantiate the findings and assess their applicability in practical lighting design. In particular, it will allow an examination of whether the dominant role of light distribution observed in the virtual simulation remains robust under real spatial, material, and perceptual conditions. Only through such validations can reliable and transferable recommendations for future lighting design be derived.

4.2. Visual Experiments in a Meeting Room

Conducting a real-world study makes it possible to test and analyze lighting conditions under actual three-dimensional spatial conditions. In this context, participants were placed in a real meeting room in which the previously simulated lighting scenarios were reproduced. The results of this study provide valuable insights that are highly relevant both for scientific research and for practical applications in lighting engineering.
Following the simulation of the lighting scenarios in DIALux, the study was subsequently validated in a real meeting room. As a first step, the software-based control system of the luminaires in the meeting room was modified. This required accessing the luminaires’ microcontrollers in order to adjust the control parameters and establish communication with the lighting system. In the next step, the existing Python 3.14.2-based control script responsible for luminaire operation was analyzed and adapted to enable precise control of the desired lighting parameters.
A correlated colour temperature of 5500 K with a general rendering index Ra = 84 was selected for the lighting, as this daylight-like colour temperature is frequently recommended in the literature as being close to optimal for office workplaces [31]. In addition, two different illuminance levels were defined for the tabletop at a height of 0.7 m: 500 lx and 1000 lx. Furthermore, several distributions of indirect and direct lighting components were specified: 0/100, 20/80, 35/65, 50/50, 65/35, 80/20, and 100/0.
In the subsequent step, the respective percentage distributions of the lighting components were determined using an iterative approach. This involved analyzing how the individual components needed to be adjusted to achieve, for example, an indirect lighting proportion of 65% at a total illuminance of 500 lx. The remaining 35% of direct lighting was then added, and it was verified whether the total illuminance of 500 lx was achieved at the measurement device. Using this method, all 13 lighting scenarios were determined and implemented in the Python script, allowing them to be stored and recalled.
In addition, a control routine was integrated into a Python script that enabled the lighting scenarios to be played automatically within a predefined time sequence. The scenarios were presented in a randomized order to prevent learning or habituation effects among the participants. During the automated switching of lighting scenarios, an acoustic signal was included to indicate when participants should evaluate the current lighting condition. The script also generated a text file documenting the randomization sequence, ensuring that each lighting condition could be precisely assigned to the corresponding participant.
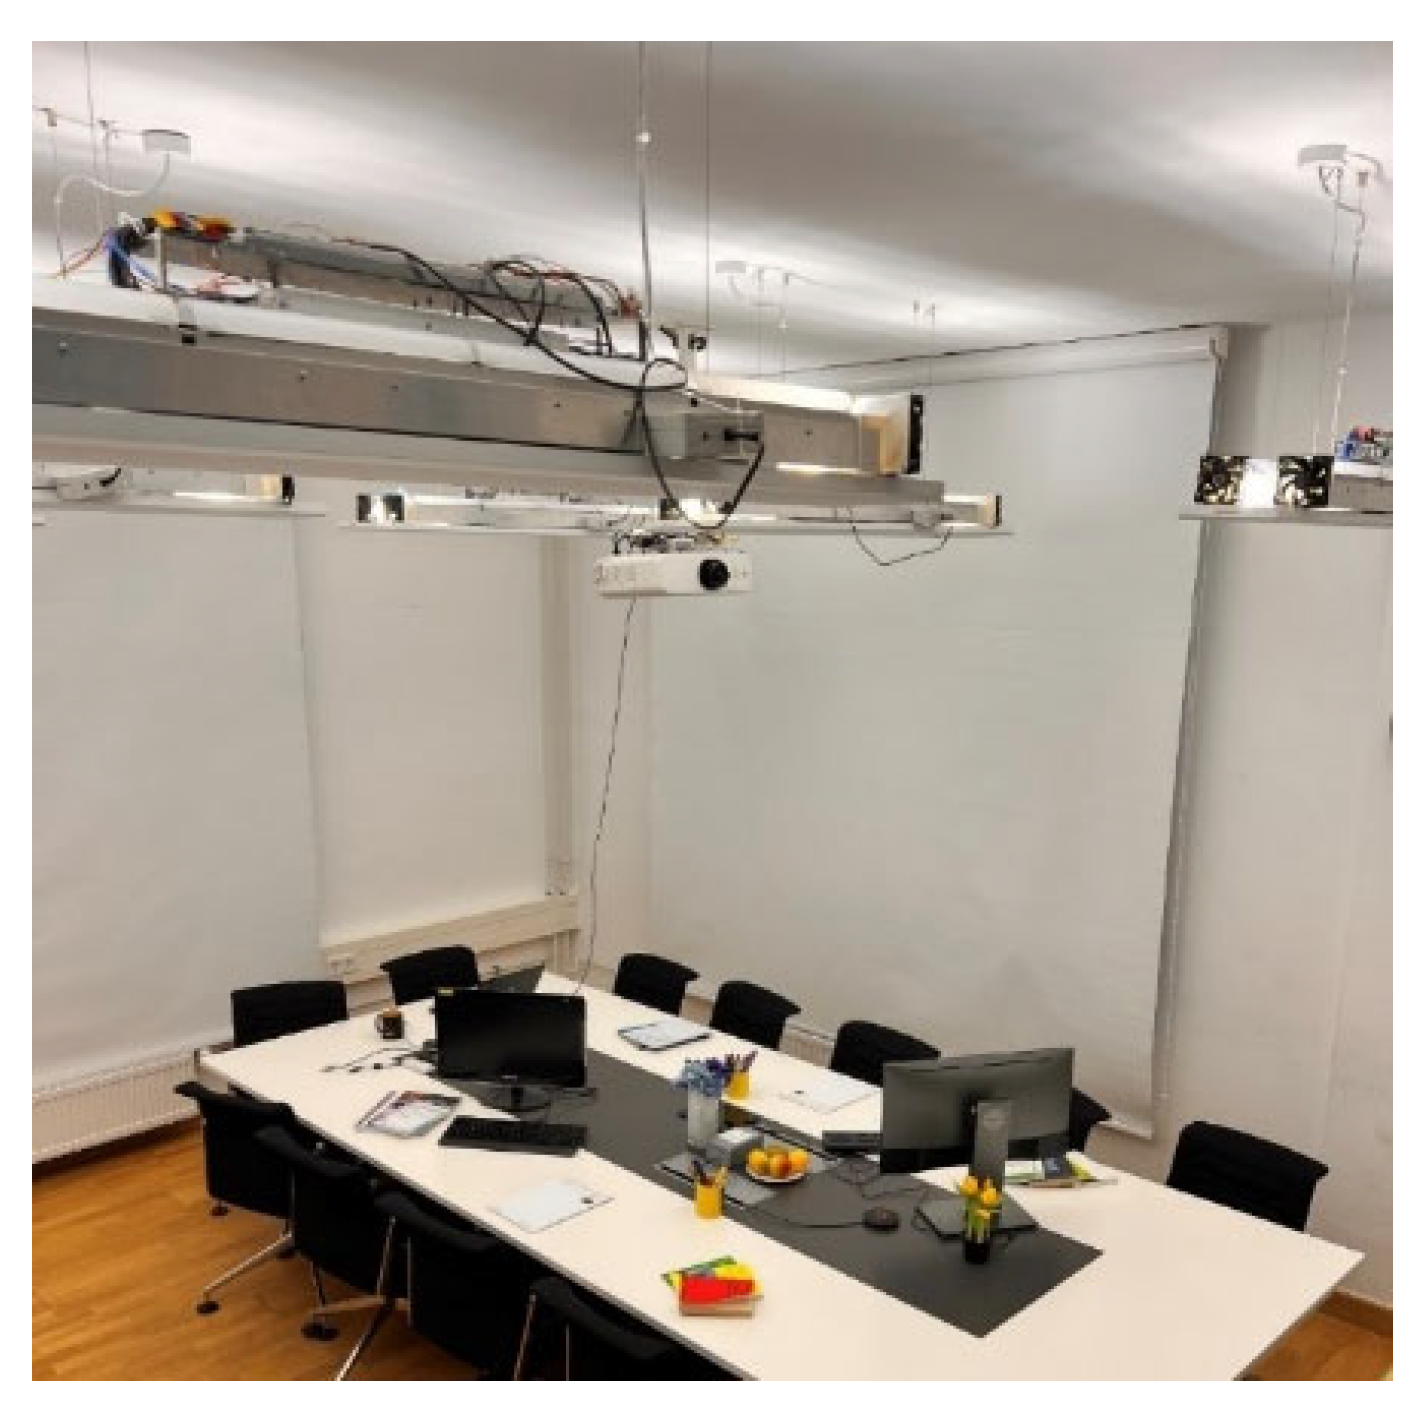
The meeting room was furnished and decorated to create an office-like environment. Two to four workstations were set up, each equipped with a computer workstation, books, and writing materials. In addition, various decorative elements, such as flowers and fruit, were added to the room to create an inviting and comfortable atmosphere, as typically aimed for in modern office buildings, as illustrated in Figure 6.
Figure 6. Real meeting room which is photographically recorded from above to show luminaires with indirect and direct lighting systems and electronics (image source: TU Darmstadt).
Applsci 16 04157 g006
In the next step, the participant study was conducted. The room was completely equipped with light-tight curtains to prevent any daylight from entering. Subsequently, the 13 different lighting scenarios were presented in randomized order, each for a duration of 30 s. Five seconds before each scenario change, an acoustic cue prompted participants to provide their evaluation. At the beginning of the study, participants were asked to adapt to a predefined lighting level in order to establish a uniform perceptual baseline. Prior to the actual experiment, all participants received a detailed explanation of the study procedure. They were instructed to evaluate the overall room with respect to perceived brightness, the presentation of objects within the space, the readability of documents, the visibility of objects such as the flowers and fruit on the table, and the visibility of the faces of people present in the room. Following this introduction, a training phase was conducted in which four exemplary lighting scenarios (500 lx and 1000 lx, each with either 100% indirect or 100% direct lighting) were presented to familiarize participants with the evaluation task.
The participant study involved a systematic assessment of the individual lighting scenarios, with participants quantifying their impressions using the above-mentioned German school grading system (grade 1 = “very good”, grade 2 = “good” grade 3 = “satisfactory,” and grade 6 = “insufficient”). A total of 17 participants took part in the study, including 14 male and three female subjects. The average age of the participants was 29.0 years, and seven participants wore corrective visual aids, a factor of relevance for the subsequent analysis. The 17 participants completed the study in 10 randomized sessions conducted on different days in order to increase the validity of the results and minimize potential biases.
Beyond the descriptive analysis using median values and interquartile ranges, an inferential statistical analysis was performed using the software JASP. Two experimental factors were considered: illuminance level and the ratio of indirect to direct lighting. The inferential evaluation was based on an analysis of variance framework, in which the total variance of the subjective ratings was partitioned into variance explained by the respective factor and unexplained residual variance. The statistical relevance of each factor was assessed using the p-value, which indicates the probability of observing an effect of the given magnitude under the assumption that no true effect exists.
The results presented in Table 3 show that the illuminance (luminance) level exhibits the lowest p-value (p < 0.001) and thus represents the strongest influencing factor within this study. The large F-value indicates that differences between illuminance levels explain a substantial proportion of the total variance compared to the residual variance. This result demonstrates that participants are highly sensitive to changes in overall illuminance under real-room conditions. The ratio of indirect to direct lighting showed a comparatively higher p-value (p = 0.05) and therefore a smaller effect than the other investigated factors. However, since this value still falls within the range of statistical significance (p ≤ 0.05), the three conditions presented in Table 5 were additionally examined in more detail by means of pairwise comparisons.
When analyzing the data from the actual meeting room, the effect size (ω2) was also calculated. The results show that the effect sizes for illuminance are significantly higher than those for the ratio of direct to indirect lighting. This suggests that absolute illuminance has a significantly stronger influence on the parameters under investigation than the ratio of light distribution.
In addition to the frequentist analysis, the Bayes factor (BF10) was used to quantify the strength of the evidence in favour of the alternative hypothesis relative to the null hypothesis. The Bayes factor provides a complementary perspective by directly comparing the plausibility of competing models rather than merely testing the compatibility of the data with the null hypothesis (see Table 4).
This Bayesian analysis confirms the results of the p-value-based evaluation. Illuminance level exhibits a very large Bayes factor (BF10 = 6294.509), corresponding to decisive evidence in favour of a systematic effect. The posterior model probability further indicates that illuminance is the dominant explanatory factor for subjective evaluation in the real meeting room. In contrast, the indirect-to-direct lighting ratio shows a Bayes factor below one (BF10 = 0.686), indicating that the data provide more support for the null hypothesis than for the existence of a systematic effect. This result suggests that under real-room conditions, the influence of light distribution is present but substantially weaker than in the virtual simulation study.
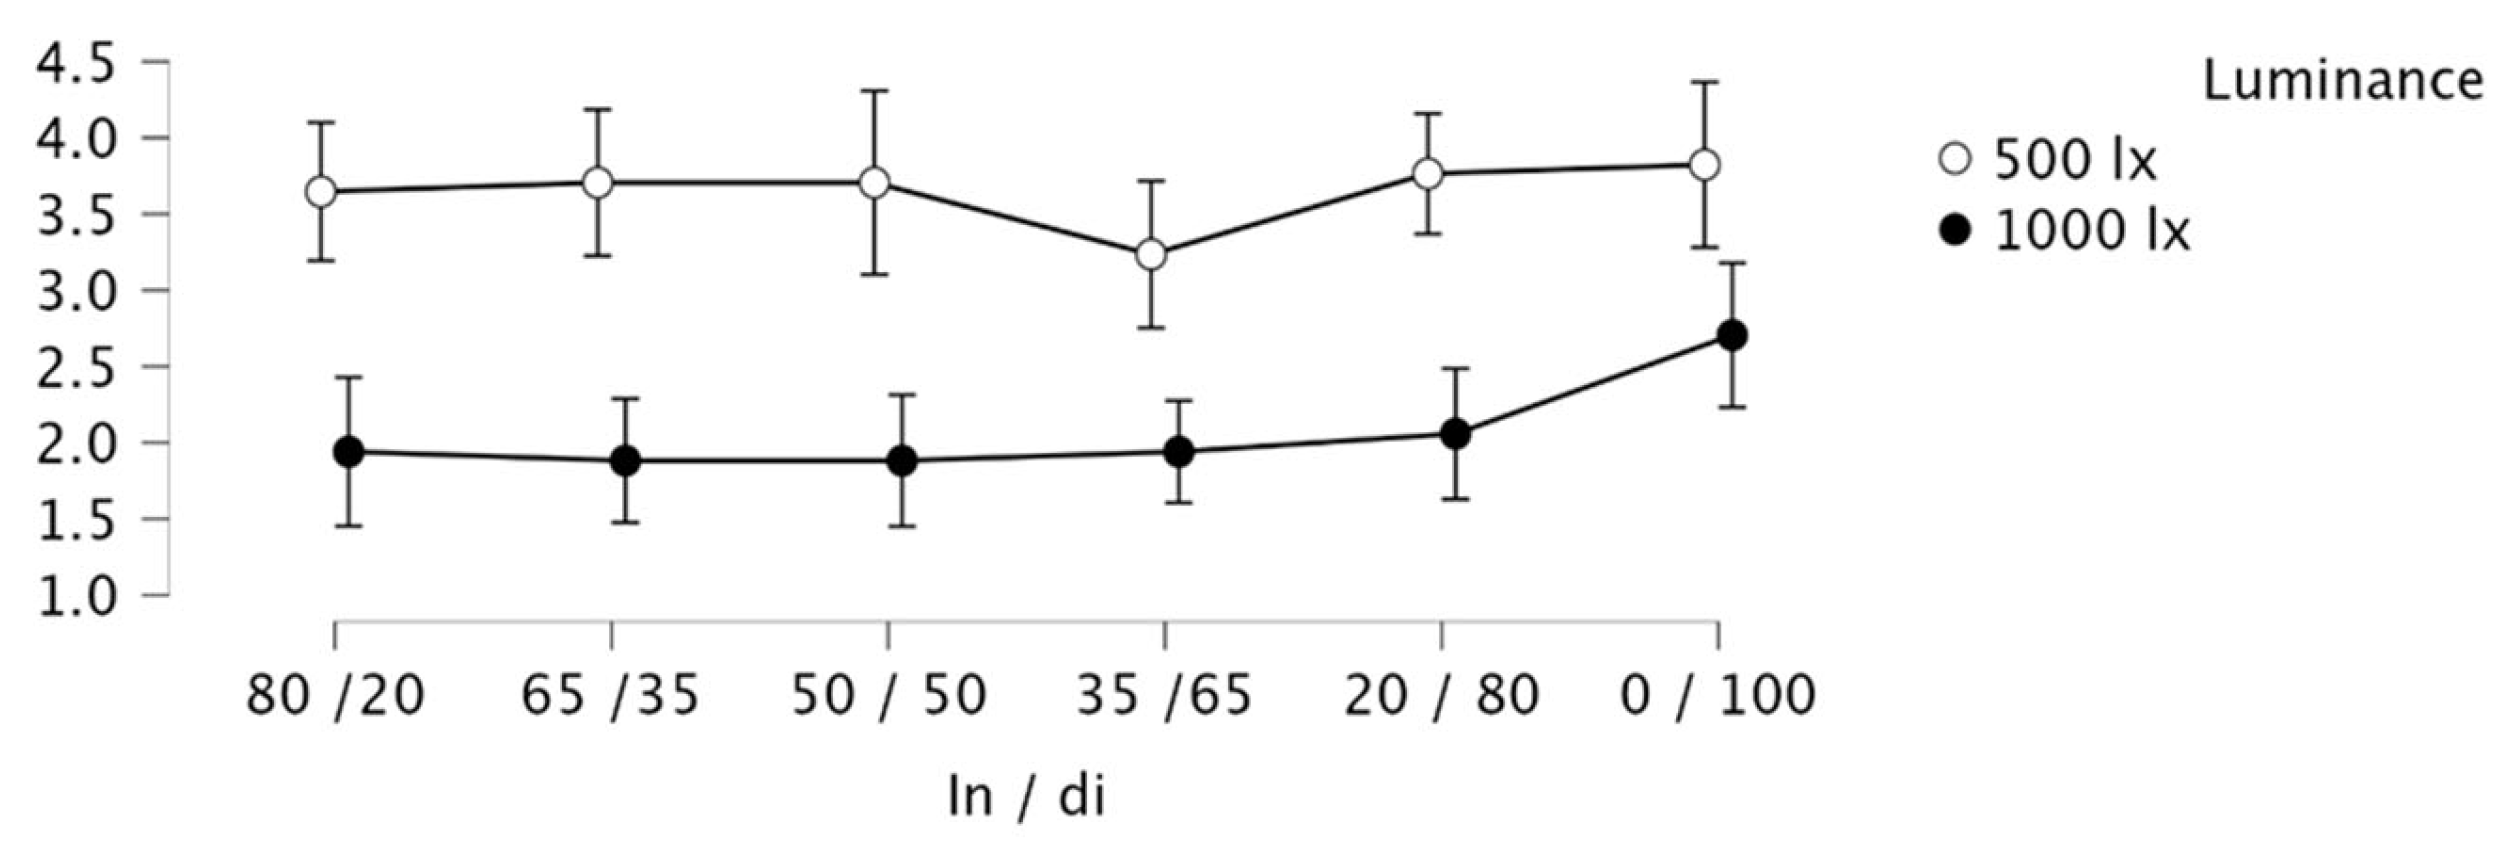
Figure 7 illustrates the results of the study conducted in the real meeting room. On the horizontal axis, the ratio of indirect-to-direct light is described, and on the ordinate axis is the rating scale (German school grade). The evaluation results indicate that all three highest-rated lighting scenarios are associated with an increased illuminance level of 1000 lx. This finding suggests that, in the real environment, a higher illuminance level plays a particularly important role in enhancing subjective well-being and overall room evaluation, potentially outweighing subtler differences in light distribution.
Table 5 summarizes the characteristics of the three highest-rated lighting scenarios. All preferred configurations combine a higher illuminance level with a moderately balanced indirect-to-direct lighting ratio. This indicates that while illuminance is the dominant factor, the distribution of light still contributes to perceived quality within a certain acceptable range.
As already described in connection with Table 3, the three lighting conditions were additionally compared by means of pairwise comparisons.
Table 5. Characteristics of the three highest-rated lighting scenarios.
Median ValueTotal Illuminance/lx Indirect-to-Direct Ratio
1.71
(between good and very good)
1000 lx65/35
1.88
(between good and very good)
1000 lx50/50
2.00 (good) 1000 lx80/20
The results of these post hoc analyses in Table 6 revealed no statistically significant differences between the three groups, as all p-values were above the predefined significance level of = 0.05. This result is presumably due to the fact that the overall group comparison reached only a marginally significant level (p = 0.05), so that no clear significant differences between the individual groups could be identified in the subsequent pairwise post hoc comparisons.


5. Discussions

In recent years, a number of scientific publications (see Cuttle [32,33,34] and Duff [35]) emphasized the importance of the luminance of walls and ceilings for the visual perception of brightness and room spaciousness. Additionally, because the distribution of ipRGC receptors is mainly focused on the lower half of the eye retina, a higher luminance of the ceiling and of the upper half of vertical walls should be helpful for the development of non-visual effects. However, a certain luminance of ceilings and the vertical walls can only be achieved by using luminaries with a well-defined indirect lighting part and with suitable luminous intensity distributions for the direct lighting part.
In contrast to the study by Houser et al. [25] discussed in Section 2 of this paper with fluorescent lamps and parabolic reflector optics, in which an indirect lighting proportion of more than 60% was found to be desirable, the luminaires used in the present study are equipped with white, matte, diffusely transmitting Plexiglas optics. These diffuse optics or the prism optics, which are imprinted into a plastic plate as a cover plate, are typical optical forms of current LED luminaires. As a result, the upper halves of the vertical walls already exhibit relatively high luminance levels even at balanced distributions. An indirect lighting proportion between 50% and 65% is therefore sufficient to achieve a positive spatial evaluation (see Table 5), whereas further increasing the indirect component to 80% leads to a decline in evaluation. The study described in this paper demonstrated the novelty so far because this is one of the first studies experimenting with typical LED luminaires.
Lighting simulations with highly performant software tools as DIAlux, Relux, Radiance or Unreal Engine 5 are often used in planning offices, architecture departments and lighting companies. This was the motivation for the authors of this paper to conduct a perception study of room illumination both by simulation (with monitors) and in a real room with the same luminaire data and room geometry. To our best knowledge, this study is one of the first studies considering both simulations and real experiments using the same parameters. The results are publicly available.
For the purpose of the simulations, the researchers have to use well-calibrated monitors, luminous intensity data (ELUMDAT or IES-Format) of real luminaries and real data of reflectance of the room surfaces (e.g., ceiling, walls and floor) for calculations with a software tool. In this experiment, we applied the right and well-explained adaptation time and use a real room, in which the calibrated monitor was placed and there was no daylight coming in. The presentation of lighting set-ups (scenes) was randomized.
If a real room has an illuminance 500 lx on a horizontal desk, the vertical illuminance on the walls is in the order of half or 250 lx and if the reflectance of the wall is 0.8 (80%), then the wall luminance as a main part of the adaptation field should be 63 cd/m2. In the case of a horizontal illuminance of 1500 lx, the luminance should be about 190 cd/m2. The white point of the most modern LED-OLED monitors is also in the order of 100–240 cd/m2, according to our measurements in the laboratory. Therefore, we did not expect adaptation and brightness problems. All the details of the scenes were clearly displayed on the monitor (see Figure 4a–d). From these explanations mentioned above, the discrepancy between Figure 5 and Figure 7 cannot determined by the test methodology by itself or by the lighting calculations.
The results in Figure 5 also correspond to the visual experience of the authors of this paper. The room perception is somewhat poorer if the indirect lighting part is 100%, which means that the direct part is 0% and the luminaries seem to be dark in this case. Inversely, if the indirect part is 0%, the ceiling is also perceived as dark and the total room atmosphere is worse. Any set-up in the range of 20–80% is perceived to be balanced and harmonized.
Additionally, one reason for the difference between the results in Figure 5 and Figure 7 should be the perception of two-dimensional scenery; the details in the room depth were missed and the difference between the set-ups between 20% and 80% of indirect lighting is not very clearly visible. The perception of the room’s depth is limited. The light-emitting surfaces of all the luminaries were diffusely and homogeneously perceived if the indirect lighting part was between 20% and 80%, so that the test persons were satisfied with the room atmosphere.
In a real room, the test persons are allowed to change their eyesight direction around the room. The viewing field is wider compared to the case of the monitor view. In the simulation tests, the monitor was in the front of the test persons so that their sight direction was limited. These aspects should be taken into account by authors analyzing the test results in the simulation context. Knowing the limitations of lighting scene simulations displayed on a calibrated monitor, we decided to conduct field tests in a real room.
In general, a substantial proportion of indirect light increases ceiling and wall luminance, which enhances spatial brightness, object visibility, and facial recognition. This is particularly relevant in meeting rooms and other environments that rely on interpersonal visual communication. Moreover, higher background luminance reduces perceived glare, as can be derived from the Unified Glare Rating (UGR) formulation [10]. Increasing the luminance of ceilings and upper wall areas therefore contributes to improved visual comfort.
Based on the results of the statistical analysis and the perceptual considerations discussed above, it is reasonable from lighting engineering, architectural, and atmospheric perspectives to aim for an indirect lighting proportion in the range of approximately 50% to 65% (see Table 5). For future studies, it is recommended to further investigate interaction effects between illuminance level, light distribution, and room surface reflectance in order to refine design guidelines for adaptive and human-centred lighting concepts.

6. Outlook

Over the past 20 years—and continuing in the coming years—research and innovation in colourimetry and color quality have advanced intensively [17,18,19,20,21], resulting in extensive knowledge regarding the interactions between illuminance levels on objects at the work desk and the correlated colour temperature in a space [14,19,34,35], as well as colour rendering, colour saturation, and chromaticity of the light spectra emitted by luminaires and incident on neutral and coloured objects [10,15,17,18].
With an understanding of spatial light distribution—particularly the luminance distribution of ceilings and walls—it becomes possible to optimize both the luminous intensity distributions of luminaires and the balance between indirect and direct lighting components. The present work contributes to this topic by providing insights into the role of light distribution in interior spaces.
If, in future research, experimental studies, and product development, these two main components—“colour quality” and “light distribution”—are combined, appropriately weighted for a specific space and context, and modelled accordingly, lighting research will move very close to identifying an optimal point of lighting quality.

Author Contributions

Conceptualization, T.Q.K. and J.B.; methodology, T.Q.K. and J.B.; software, T.Q.K. and J.B.; validation, T.Q.K. and J.B.; formal analysis, T.Q.K. and J.B.; investigation, T.Q.K. and J.B.; re-sources, T.Q.K. and J.B.; data curation, T.Q.K. and J.B.; writing—original draft preparation, T.Q.K. and J.B.; writing—review and editing, T.Q.K. and J.B.; visu-alization, T.Q.K. and J.B.; supervision, T.Q.K. and J.B.; project administration, T.Q.K. and J.B.; funding acquisition, T.Q.K. and J.B. All authors have read and agreed to the published version of the manuscript.

Funding

This research received no external funding.

Data Availability Statement

The data can be requested from the authors.

Conflicts of Interest

The authors declare no conflict of interest.

Abbreviations

The following abbreviations are used in this manuscript:
LEDLight-Emitting Diode
OLEDOrganic Light-Emitting Diode
RVPRelative Visual Performance
HCLHuman-Centric Lighting
CCTCorrelated Colour Temperature
KKelvin
mMetre
lxLux
TUTechnical University
SDSemantic Differential
JASPJeffrey’s Amazing Statistics Program
in/diIndirect/Direct

References

  1. Weston, H.C. The Relation Between Illumination and Visual Efficiency: The Effect of Brighness Contrast; Report No. 87; Industrial Health Research Board, Great Britain Medical Research Council: London, UK, 1945; pp. 1–35. [Google Scholar]
  2. CIE-Publication 19/2.1-1981; An Analytical Model for Describing the Influence of Lighting Parameters Upon Visual Performance. CIE (Commission Internationale de l’Eclairage): Vienna, Austria, 1981.
  3. Boyce, P.R. Age, illuminance, visual performance and preference. Light. Res. Technol. 1973, 5, 125–144. [Google Scholar] [CrossRef]
  4. Boyce, P.R. Illuminance, difficulty, complexity and visual performance. Light. Res. Technol. 1974, 6, 222–226. [Google Scholar] [CrossRef]
  5. Rea, M.S. Toward a model of visual performance: Foundations and data. J. Illum. Eng. Soc. 1986, 15, 41–57. [Google Scholar] [CrossRef]
  6. Van Bergem-Janssen, P.M. Sehleistung oder Sehkomfort als Kriterium für das Lichtniveau am Arbeitsplatz. In Proceedings of the Lichttagung 1990, Rotterdam, The Netherlands, 1990; pp. 94–107. [Google Scholar]
  7. Boyce, P.R. Human Factors in Lighting, 3rd ed.; CRC Press, Taylor& Francis Group: Boca Raton, FL, USA, 2014. [Google Scholar]
  8. Khanh, T.Q.; Bodrogi, P.; Vinh, T.Q. Beleuchtung in Innenräumen—Human Centric Integrative Lighting; Wiley-VCH: Berlin, Germany, 2022. [Google Scholar]
  9. DIN EN 12464-1:2021-11; Licht und Beleuchtung—Beleuchtung von Arbeitsstätten, Teil 1: Arbeitsstätten in Innenräumen. Beuth-Verlag: Berlin, Germany, 2021.
  10. Internationale Beleuchtungskommission (CIE). A Colour Appearance Model for Colour Management Systems: CIECAM02; CIE Publ.: Vienna, Austria, 2004; Volume 159. [Google Scholar]
  11. Luo, M.R.; Cui, G.; Li, C. Uniform color spaces based on CIECAM02 color appearance model. Color Res. Appl. 2006, 31, 320–330. [Google Scholar] [CrossRef]
  12. Wang, H.; Cui, G.; Luo, M.R.; Xu, H. Evaluation of Colour-Difference Formulae for Different Colour-Difference Magnitudes. Color Res. Appl. 2012, 37, 316–325. [Google Scholar] [CrossRef]
  13. Davis, W.; Ohno, Y. Colour quality scale. Opt. Eng. 2010, 49, 033602. [Google Scholar] [CrossRef]
  14. David, A.; Fini, P.T.; Royer, M.P.; Smet, K.A.G.; Wei, M.; Whitehead, L. Development of the IES method for evaluating the color rendition of light sources. Opt. Express 2015, 23, 15888–15906. [Google Scholar] [CrossRef]
  15. Babilon, S.; Khanh, T.Q. Color appearance rating of familiar real objects under immersive viewing conditions. Color Res Appl. 2018, 43, 551–568. [Google Scholar] [CrossRef]
  16. Khanh, T.Q.; Bodrogi, P.; Vinh, Q.T.; Guo, X.; Anh, T.T. Colour preference, naturalness, vividness and colour quality metrics, Part 4: Experiments with still life arrangements at different correlated colour temperatures. Light. Res. Technol. 2018, 50, 862–879. [Google Scholar] [CrossRef]
  17. Khanh, T.Q.; Bodrogi, P.; Guo, X.; Vinh, Q.T.; Fischer, S. Colour preference, naturalness, vividness and colour quality metrics, Part 5: A colour preference experiment at 2000 lx in a real room. Light. Res. Technol. 2019, 51, 262–279. [Google Scholar] [CrossRef]
  18. Royer, M.P.; Wilkerson, A.; Wei, M.; Houser, K.; Davis, R. Human perceptions of colour rendition vary with average fidelity, average gamut, and gamut shape. Light. Res. Technol. 2017, 49, 966–991. [Google Scholar] [CrossRef]
  19. CIE 2017; Color Fidelity Index for Accurate Scientific Use. CIE Publication: Vienna, Austria, 2017; Volume 224.
  20. Veitch, J.A.; Newsham, G. Determinants of Lighting Quality I: State of the Science. J. Illum. Eng. Soc. 1998, 27, 92–106. [Google Scholar] [CrossRef]
  21. Kaplan, S. Aesthetics, Affect and cognition: Environmental preference from an evolutionary perspective. Environ. Behav. 1987, 19, 2–32. [Google Scholar] [CrossRef]
  22. Flynn, J.E.; Spencer, T.J.; Martyniuk, O.; Hendrick, C. Interim study of procedures for investigating the effect of light on impression and behavior. J. Illum. Eng. Soc. 1973, 3, 87–94. [Google Scholar] [CrossRef]
  23. Flynn, J.E.; Hendrick, C.; Spencer, T.; Martyniuk, O. A guide to methodology procedures for measuring subjective impressions in lighting. J. Illum. Eng. Soc. 1979, 8, 95–110. [Google Scholar] [CrossRef]
  24. Weirich, C.; Lin, Y.; Khanh, T.Q. Evidence for human-centric in-vehicle lighting: Part 3—Illumination preferences based on subjective ratings, eye-tracking behavior, and EEG features. Front. Hum. Neurosci. 2023, 17, 1248824. [Google Scholar] [CrossRef]
  25. Houser, K.; Tiller, D.; Bernecker, C.; Mistrick, R. The subjective response to linear fluorescent direct/indirect lighting systems. Light. Res. Technol. 2002, 34, 243–264. [Google Scholar] [CrossRef]
  26. Tiller, D.K.; Rea, M. Semantic differential scaling: Prospects in lighting resarch. Light. Res. Technol. 1992, 24, 43–52. [Google Scholar] [CrossRef]
  27. Tops, M.; Tenner, A.D.; Van den Beld, G.J.; Begemann, S.H.A. The effect of the length of continuous presence on the preferred illuminance in offices. In Proceedings of the CIBSE National Lighting Conference, Lancaster, UK, 5–8 April 1998. [Google Scholar]
  28. Available online: https://jasp-stats.org/download/ (accessed on 25 March 2026).
  29. Kang, S.Y.; Youn, N.; Yoon, H.C. The self-regulatory power of environmental lighting: The effect of illuminance and correlated color temperature. J. Environ. Psychol. 2019, 62, 30–41. [Google Scholar] [CrossRef]
  30. Ishii, H.; Kanagawa, H.; Shimamura, Y.; Uchiyama, K.; Miyagi, K.; Obayashi, F.; Shimoda, H. Intellectual productivity under task ambient lighting. Light. Res. Technol. 2018, 237–252. [Google Scholar] [CrossRef]
  31. Abu Haila, T.; Kunst, K.; Khanh, T.Q.; Wallis, T.S. Recent consumer OLED monitors can be suitable for vision science. arXiv 2025. [Google Scholar] [CrossRef]
  32. Cuttle, C. A new direction for general lighting practice. Light. Res. Technol. 2013, 45, 22–39. [Google Scholar] [CrossRef]
  33. Cuttle, C. A fresh approach to interior lighting design: The design objective—Direct flux procedure. Light. Res. Technol. 2018, 50, 1142–1163. [Google Scholar] [CrossRef]
  34. Cuttle, C. Making the switch from task illumination to ambient illumination standards: Principles and practicalities, including energy implications. Light. Res. Technol. 2020, 52, 455–471. [Google Scholar] [CrossRef]
  35. Duff, J.; Kelly, K.; Cuttle, C. Spatial brightness, horizontal illuminance and mean room surface exitance in a lighting booth. Light. Res. Technol. 2017, 49, 5–15. [Google Scholar] [CrossRef]
Figure 1. Influencing parameters for the description of psychological and emotional lighting effects (image source: TU Darmstadt).
Applsci 16 04157 g001
Figure 2. Light distribution in a room at 500 lx on the desk, indirect light ratio is 0% (image source: TU Darmstadt).
Applsci 16 04157 g002
Figure 3. Light distribution in a room at 500 lx on the desk, indirect light part is 100% (image source: TU Darmstadt).
Applsci 16 04157 g003
Figure 4. This figure shows (a) 500 lx, 0% indirect/100% direct; (b) 500 lx, 100% indirect/0% direct; (c) 1500 lx, 50% indirect/50% direct; (d) 1500 lx, 50% indirect/50% direct.
Applsci 16 04157 g004
Figure 5. Results of the study using virtual room and lighting simulation.
Applsci 16 04157 g005
Figure 7. Results of the study conducted in the real meeting room.
Applsci 16 04157 g007
Table 1. Evaluation based on p-values simulation.
CaseSum of SquaresdfMean SquareFpω2
Illuminance4.73414.7348.5000.0080.022
Residuals11.695210.557
Perspective1.27311.2730.7700.3900.000
Residuals34.727211.654
Indirect/direct44.61067.4355.057<0.0010.088
Residuals185.2471251.470
Table 2. Evaluation based on the BF10 factor.
ModelsP(M)P(M/Data)BFMBF10Error %
Indirect/direct0.0530.3268.687222.8551.193
Illuminance0.0530.0020.0301.1501.547
Perspective0.0533.885 × 10−40.0070.2661.613
Table 3. Evaluation based on p-values meeting room.
CaseSum of SquaredfMean SquareFpω2
Luminance127.0641127.06448.575<0.0010.648
Residuals41.853162.616
in/di 8.61351.7232.2980.050.053
Residuals59.971800.750
Table 4. Statistical evaluation based on the BF10 factor.
ModelsP(M)P(M/Data)BFMBF10Error %
Illuminance0.2000.5194.3116294.5091.824
Indirect/direct0.2005.140 × 10−52.056 × 10−40.6860.650
Table 6. Post hoc analyses.
Measure 1Measure 2p-Value
65/3550/501.000
50/5080/200.805
80/2065/350.817
Disclaimer/Publisher’s Note: The statements, opinions and data contained in all publications are solely those of the individual author(s) and contributor(s) and not of MDPI and/or the editor(s). MDPI and/or the editor(s) disclaim responsibility for any injury to people or property resulting from any ideas, methods, instructions or products referred to in the content.